growmark, inc. consolidated financial … inc. consolidated financial statements years ended august...
TRANSCRIPT

GROWMARK, INC.
CONSOLIDATED FINANCIAL STATEMENTS
YEARS ENDED AUGUST 31, 2016 AND 2015
with
REPORT OF INDEPENDENT AUDITORS

Report of Independent Auditors
The Board of Directors of GROWMARK, Inc.
We have audited the accompanying consolidated financial statements of GROWMARK, Inc., which comprise the consolidated statements of financial position as of August 31, 2016 and 2015, and the related consolidated statements of operations, comprehensive income, shareholders’ equity and cash flows for the years then ended, and the related notes to the consolidated financial statements.
Management’s Responsibility for the Financial Statements
Management is responsible for the preparation and fair presentation of these financial statements in conformity with U.S. generally accepted accounting principles; this includes the design, implementation and maintenance of internal control relevant to the preparation and fair presentation of financial statements that are free of material misstatement, whether due to fraud or error.
Auditor’s Responsibility
Our responsibility is to express an opinion on these financial statements based on our audits. We did not audit the financial statements of Total Grain Marketing, LLC, and Western Grain Marketing, LLC, subsidiaries of the Company, which statements reflect total assets constituting 7% as of August 31, 2016 and 10% as of August 31, 2015 and net sales constituting 8% for the year ended August 31, 2016 and 9% for the year ended August 31, 2015 of the related consolidated totals. We also did not audit the financial statements of FS Grain, LLC, a limited liability company in which the Company has a 44% interest. In the consolidated financial statements, the Company’s investment in FS Grain, LLC, is stated at $34 million and $0 as of December 31, 2016 and 2015, respectively, and the Company’s equity in the net income (loss) of FS Grain, LLC, is stated at $(2) million and $0, for the years then ended. The statements for the previously mentioned subsidiaries and investee company were audited by other auditors whose reports have been furnished to us, and our opinion, insofar as it relates to the amounts included for those subsidiaries, is based solely on the reports of the other auditors. We conducted our audits in accordance with auditing standards generally accepted in the United States. Those standards require that we plan and perform the audit to obtain reasonable assurance about whether the financial statements are free of material misstatement.
A member firm of Ernst & Young Global Limited
Ernst & Young LLP 155 North Wacker Drive Chicago, IL 60606-1787
Tel: +1 312 879 2000 Fax: +1 312 879 4000 ey.com
An audit involves performing procedures to obtain audit evidence about the amounts and disclosures in the financial statements. The procedures selected depend on the auditor’s judgment, including the assessment of the risks of material misstatement of the financial statements, whether due to fraud or error. In making those risk assessments, the auditor considers internal control relevant to the entity’s preparation and fair presentation of the financial statements in order to design audit procedures that are appropriate in the circumstances, but not for the purpose of expressing an opinion on the effectiveness of the entity’s internal control. Accordingly, we express no such opinion. An audit also includes evaluating the appropriateness of accounting policies used and the reasonableness of significant accounting estimates made by management, as well as evaluating the overall presentation of the financial statements.
We believe that the audit evidence we have obtained is sufficient and appropriate to provide a basis for our audit opinion.
Opinion
In our opinion, based on our audits and the reports of the other auditors, the financial statements referred to above present fairly, in all material respects, the consolidated financial position of GROWMARK, Inc. at August 31, 2016 and 2015, and the consolidated results of its operations and its cash flows for the years then ended in conformity with U.S. generally accepted accounting principles.
November 1, 2016
A member firm of Ernst & Young Global Limited
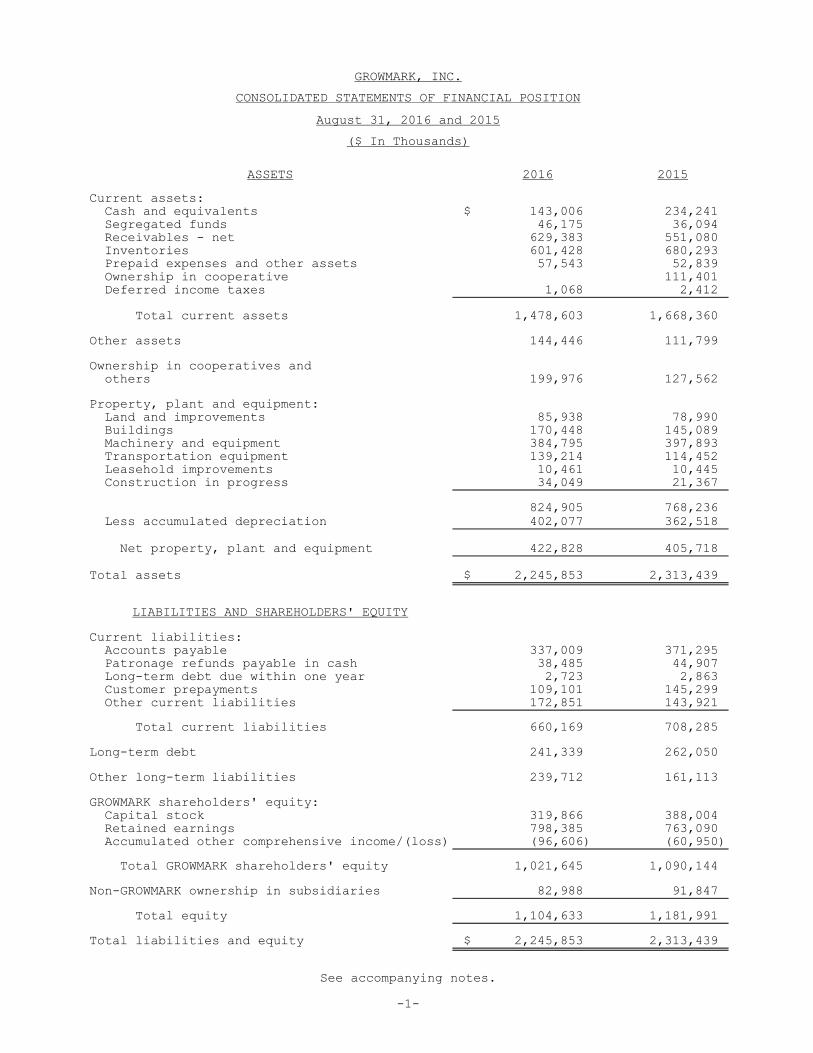
ASSETS 2016 2015
Current assets:
Cash and equivalents $ 143,006 234,241
Segregated funds 46,175 36,094
Receivables - net 629,383 551,080
Inventories 601,428 680,293
Prepaid expenses and other assets 57,543 52,839
Ownership in cooperative 111,401
Deferred income taxes 1,068 2,412
Total current assets 1,478,603 1,668,360
Other assets 144,446 111,799
Ownership in cooperatives and
others 199,976 127,562
Property, plant and equipment:
Land and improvements 85,938 78,990
Buildings 170,448 145,089
Machinery and equipment 384,795 397,893
Transportation equipment 139,214 114,452
Leasehold improvements 10,461 10,445
Construction in progress 34,049 21,367
824,905 768,236
Less accumulated depreciation 402,077 362,518
Net property, plant and equipment 422,828 405,718
Total assets $ 2,245,853 2,313,439
LIABILITIES AND SHAREHOLDERS' EQUITY
Current liabilities:
Accounts payable 337,009 371,295
Patronage refunds payable in cash 38,485 44,907
Long-term debt due within one year 2,723 2,863
Customer prepayments 109,101 145,299
Other current liabilities 172,851 143,921
Total current liabilities 660,169 708,285
Long-term debt 241,339 262,050
Other long-term liabilities 239,712 161,113
GROWMARK shareholders' equity:
Capital stock 319,866 388,004
Retained earnings 798,385 763,090
Accumulated other comprehensive income/(loss) (96,606) (60,950)
Total GROWMARK shareholders' equity 1,021,645 1,090,144
Non-GROWMARK ownership in subsidiaries 82,988 91,847
Total equity 1,104,633 1,181,991
Total liabilities and equity $ 2,245,853 2,313,439
-1-
August 31, 2016 and 2015
See accompanying notes.
GROWMARK, INC.
CONSOLIDATED STATEMENTS OF FINANCIAL POSITION
($ In Thousands)
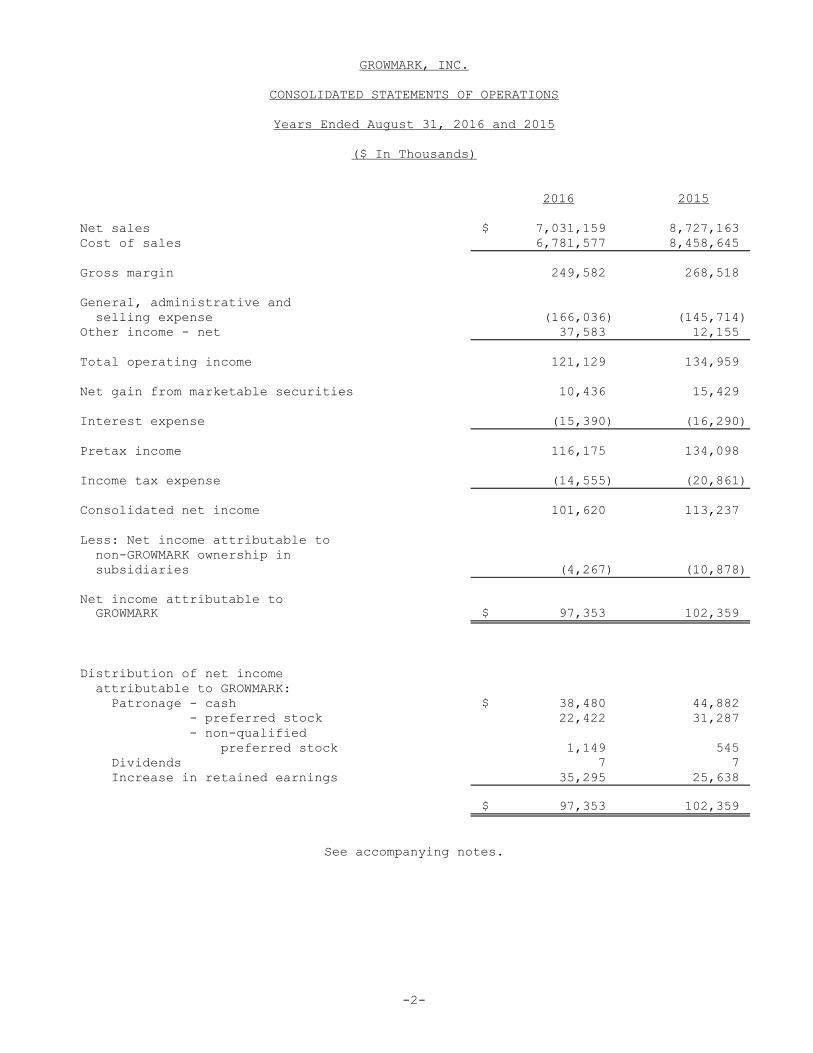
GROWMARK, INC.
CONSOLIDATED STATEMENTS OF OPERATIONS
Years Ended August 31, 2016 and 2015
($ In Thousands)
2016 2015
Net sales $ 7,031,159 8,727,163
Cost of sales 6,781,577 8,458,645
Gross margin 249,582 268,518
General, administrative and
selling expense (166,036) (145,714)
Other income - net 37,583 12,155
Total operating income 121,129 134,959
Net gain from marketable securities 10,436 15,429
Interest expense (15,390) (16,290)
Pretax income 116,175 134,098
Income tax expense (14,555) (20,861)
Consolidated net income 101,620 113,237
Less: Net income attributable to
non-GROWMARK ownership in
subsidiaries (4,267) (10,878)
Net income attributable to
GROWMARK $ 97,353 102,359
Distribution of net income
attributable to GROWMARK:
Patronage - cash $ 38,480 44,882
- preferred stock 22,422 31,287
- non-qualified
preferred stock 1,149 545
Dividends 7 7
Increase in retained earnings 35,295 25,638
$ 97,353 102,359
See accompanying notes.
-2-
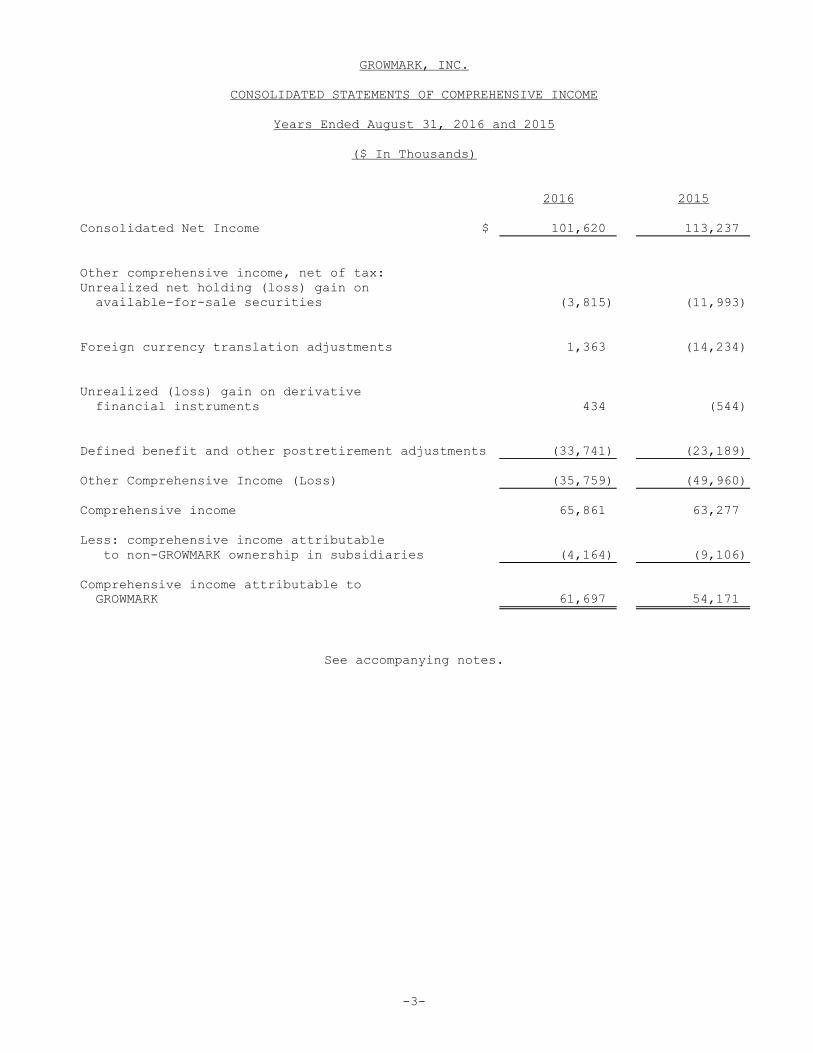
GROWMARK, INC.
CONSOLIDATED STATEMENTS OF COMPREHENSIVE INCOME
Years Ended August 31, 2016 and 2015
($ In Thousands)
2016 2015
Consolidated Net Income $ 101,620 113,237
Other comprehensive income, net of tax:
Unrealized net holding (loss) gain on
available-for-sale securities (3,815) (11,993)
Foreign currency translation adjustments 1,363 (14,234)
Unrealized (loss) gain on derivative
financial instruments 434 (544)
Defined benefit and other postretirement adjustments (33,741) (23,189)
Other Comprehensive Income (Loss) (35,759) (49,960)
Comprehensive income 65,861 63,277
Less: comprehensive income attributable
to non-GROWMARK ownership in subsidiaries (4,164) (9,106)
Comprehensive income attributable to
GROWMARK 61,697 54,171
See accompanying notes.
-3-

GROWMARK, INC.
CONSOLIDATED STATEMENTS OF SHAREHOLDERS' EQUITY
Years Ended August 31, 2016 and 2015
($ In Thousands)
GROWMARK
Accumulated
Other Non-GROWMARK
Capital Retained Comprehensive Ownership in
Stock Earnings Income Subsidiaries
Balance at August 31, 2014 $ 393,025 737,452 (12,762) 87,037
Net earnings before patronage refunds 102,358 10,878
Cash dividends on preferred stock (7)
Preferred stock redemption (36,853)
Patronage dividends to be distributed
in cash (44,882)
Patronage dividends to be distributed
in capital stock 31,287 (31,287)
Patronage dividends to be distributed in
non-qualified capital stock 545 (545)
Contributions by owners
Distributions to owners (4,296)
Unrealized net holding loss on
available-for-sale securities
$1,395, net of tax $541 (11,759) (234)
Foreign currency translation adjustments
$(2,363), net of tax $(831) (12,986) (1,248)
Unrealized gain on derivative
financial instruments $3,667
net of tax $1,367 (544)
Defined benefit and other postretirement
plan adjustments $(35,824),
net of tax $(13,701) (22,899) (290)
Balance at August 31, 2015 $ 388,004 763,089 (60,950) 91,847
Net earnings before patronage refunds 97,353 4,267
Cash dividends on preferred stock (7)
Preferred stock redemption (91,709)
Patronage dividends to be distributed
in cash (38,479)
Patronage dividends to be distributed
in capital stock 22,422 (22,422)
Patronage dividends to be distributed in
non-qualified capital stock 1,149 (1,149)
Deconsolidation of subsidiaries (11,375)
Contributions by owners
Distributions to owners (1,648)
Unrealized net holding loss on
available-for-sale securities
$(5,699), net of tax $(2,199) (3,499) (316)
Foreign currency translation adjustments
$2,003, net of tax $734 1,269 94
Unrealized gain on derivative
financial instruments $518
net of tax $84 434
Defined benefit and other postretirement
plan adjustments $(54,972),
net of tax $(21,112) (33,860) 119
Balance at August 31, 2016 $ 319,866 798,385 (96,606) 82,988
319,866 798,385 96,606 82,988
0 0 0 0
2015 2016
Cumulative unrealized holding gains on
available-for-sale securities, net of tax
$10,602 in 2016, $12,801 in 2015 $ 20,469 $ 16,969
Cumulative foreign currency translation
adjustments, net of tax $(6,118) in 2016,
$(6,853) in 2015 (9,824) (8,554)
Cumulative unrealized gains (losses)
on derivative financial instruments, net
of tax $(131) in 2016, $(139) in 2015 (224) 209
Cumulative defined benefit/
postretirement accounting, net of tax
$(65,368) in 2016, $(44,256) in 2015 (71,371) (105,230)
$ (60,950) $ (96,606)
See accompanying notes.
-4-
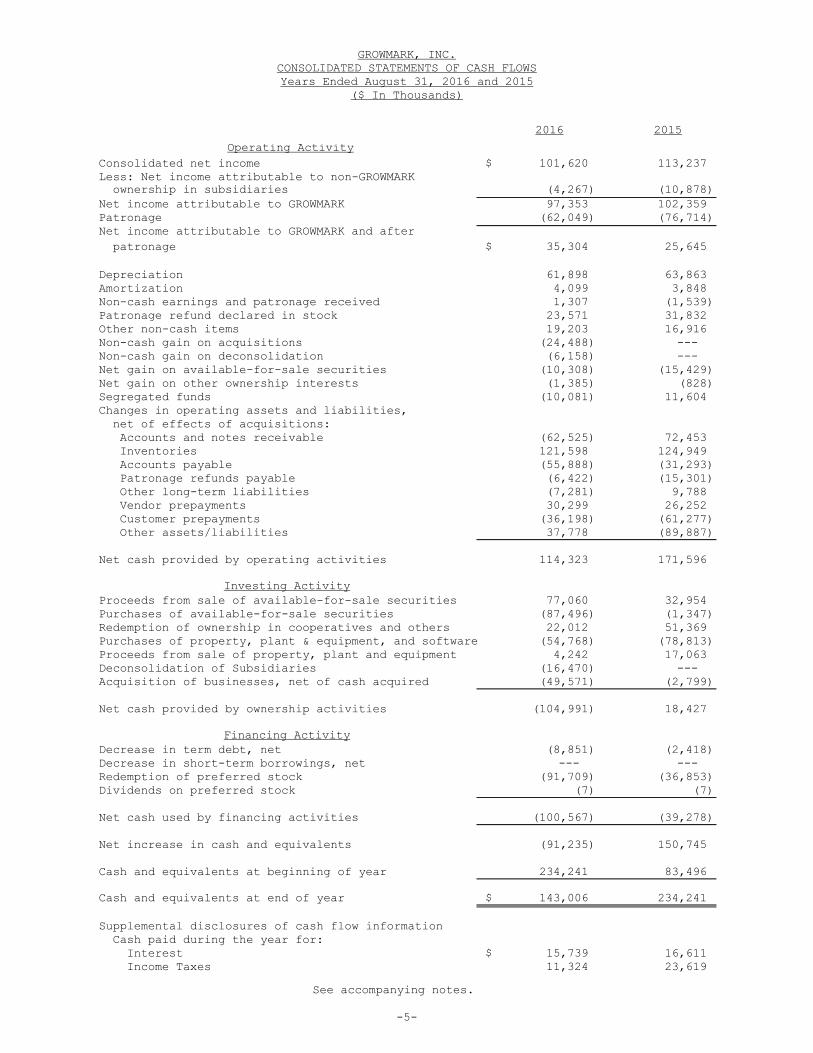
($ In Thousands)
2016 2015
Operating Activity
Consolidated net income $ 101,620 113,237
Less: Net income attributable to non-GROWMARK
ownership in subsidiaries (4,267) (10,878)
Net income attributable to GROWMARK 97,353 102,359
Patronage (62,049) (76,714)
Net income attributable to GROWMARK and after
patronage $ 35,304 25,645
Depreciation 61,898 63,863
Amortization 4,099 3,848
Non-cash earnings and patronage received 1,307 (1,539)
Patronage refund declared in stock 23,571 31,832
Other non-cash items 19,203 16,916
Non-cash gain on acquisitions (24,488) ---
Non-cash gain on deconsolidation (6,158) ---
Net gain on available-for-sale securities (10,308) (15,429)
Net gain on other ownership interests (1,385) (828)
Segregated funds (10,081) 11,604
Changes in operating assets and liabilities,
net of effects of acquisitions:
Accounts and notes receivable (62,525) 72,453
Inventories 121,598 124,949
Accounts payable (55,888) (31,293)
Patronage refunds payable (6,422) (15,301)
Other long-term liabilities (7,281) 9,788
Vendor prepayments 30,299 26,252
Customer prepayments (36,198) (61,277)
Other assets/liabilities 37,778 (89,887)
Net cash provided by operating activities 114,323 171,596
Investing Activity
Proceeds from sale of available-for-sale securities 77,060 32,954
Purchases of available-for-sale securities (87,496) (1,347)
Redemption of ownership in cooperatives and others 22,012 51,369
Purchases of property, plant & equipment, and software (54,768) (78,813)
Proceeds from sale of property, plant and equipment 4,242 17,063
Deconsolidation of Subsidiaries (16,470) ---
Acquisition of businesses, net of cash acquired (49,571) (2,799)
Net cash provided by ownership activities (104,991) 18,427
Financing Activity
Decrease in term debt, net (8,851) (2,418)
Decrease in short-term borrowings, net --- ---
Redemption of preferred stock (91,709) (36,853)
Dividends on preferred stock (7) (7)
Net cash used by financing activities (100,567) (39,278)
Net increase in cash and equivalents (91,235) 150,745
Cash and equivalents at beginning of year 234,241 83,496
Cash and equivalents at end of year $ 143,006 234,241
Supplemental disclosures of cash flow information
Cash paid during the year for:
Interest $ 15,739 16,611
Income Taxes 11,324 23,619
See accompanying notes.
-5-
GROWMARK, INC.
CONSOLIDATED STATEMENTS OF CASH FLOWS
Years Ended August 31, 2016 and 2015
-6-
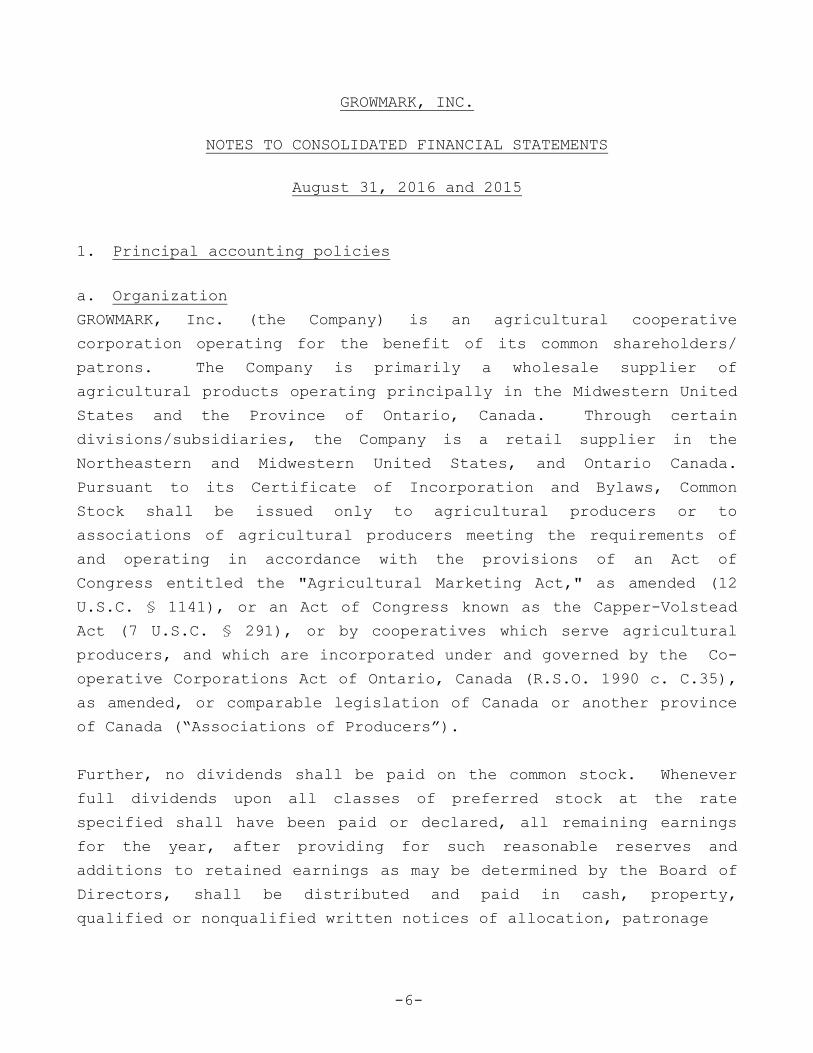
GROWMARK, INC.
NOTES TO CONSOLIDATED FINANCIAL STATEMENTS
August 31, 2016 and 2015
1. Principal accounting policies
a. Organization
GROWMARK, Inc. (the Company) is an agricultural cooperative
corporation operating for the benefit of its common shareholders/
patrons. The Company is primarily a wholesale supplier of
agricultural products operating principally in the Midwestern United
States and the Province of Ontario, Canada. Through certain
divisions/subsidiaries, the Company is a retail supplier in the
Northeastern and Midwestern United States, and Ontario Canada.
Pursuant to its Certificate of Incorporation and Bylaws, Common
Stock shall be issued only to agricultural producers or to
associations of agricultural producers meeting the requirements of
and operating in accordance with the provisions of an Act of
Congress entitled the "Agricultural Marketing Act," as amended (12
U.S.C. § 1141), or an Act of Congress known as the Capper-Volstead
Act (7 U.S.C. § 291), or by cooperatives which serve agricultural
producers, and which are incorporated under and governed by the Co-
operative Corporations Act of Ontario, Canada (R.S.O. 1990 c. C.35),
as amended, or comparable legislation of Canada or another province
of Canada (“Associations of Producers”).
Further, no dividends shall be paid on the common stock. Whenever
full dividends upon all classes of preferred stock at the rate
specified shall have been paid or declared, all remaining earnings
for the year, after providing for such reasonable reserves and
additions to retained earnings as may be determined by the Board of
Directors, shall be distributed and paid in cash, property,
qualified or nonqualified written notices of allocation, patronage

-7-
equity credits, notes, stock or stock credits to the common
shareholders and, at the discretion of the Board of Directors, to
nonmember patrons upon the basis of patronage. In the event of
distribution of retained earnings, such distribution shall be made
to the common shareholders.
b. Consolidation policies
The consolidated financial statements of GROWMARK, Inc. include the
accounts of the parent company and its controlled subsidiaries.
c. Cash and equivalents
Cash and equivalents includes all short-term highly-liquid
negotiable instruments with original maturities of three months or
less.
d. Financial instruments
The Company believes that the carrying value of its financial
instruments, which include cash and equivalents, segregated funds,
accounts receivable, notes receivable and accounts payable,
approximates their fair value based on market rates currently
available for financial instruments with similar terms and remaining
maturities (note 10). The Company has determined it is not
practical to calculate the fair value of debt without incurring
excessive cost to do so. See notes 5 and 6 for disclosure about
fair values of available for sale investments and derivatives,
respectively.
e. Receivables
Receivables are stated net of an allowance for doubtful accounts of
$11.3 million at August 31, 2016 and $11.3 million in 2015. The
Company estimates the allowance based on an aging of the receivables
and an evaluation of the likelihood of success in collecting the
receivables. Aging for delinquency purposes is based on the due
dates and terms of the receivables. Receivables are written off
through a charge to the allowance for doubtful accounts after
reasonable collection efforts have been made and management has
determined collection is doubtful.
-8-
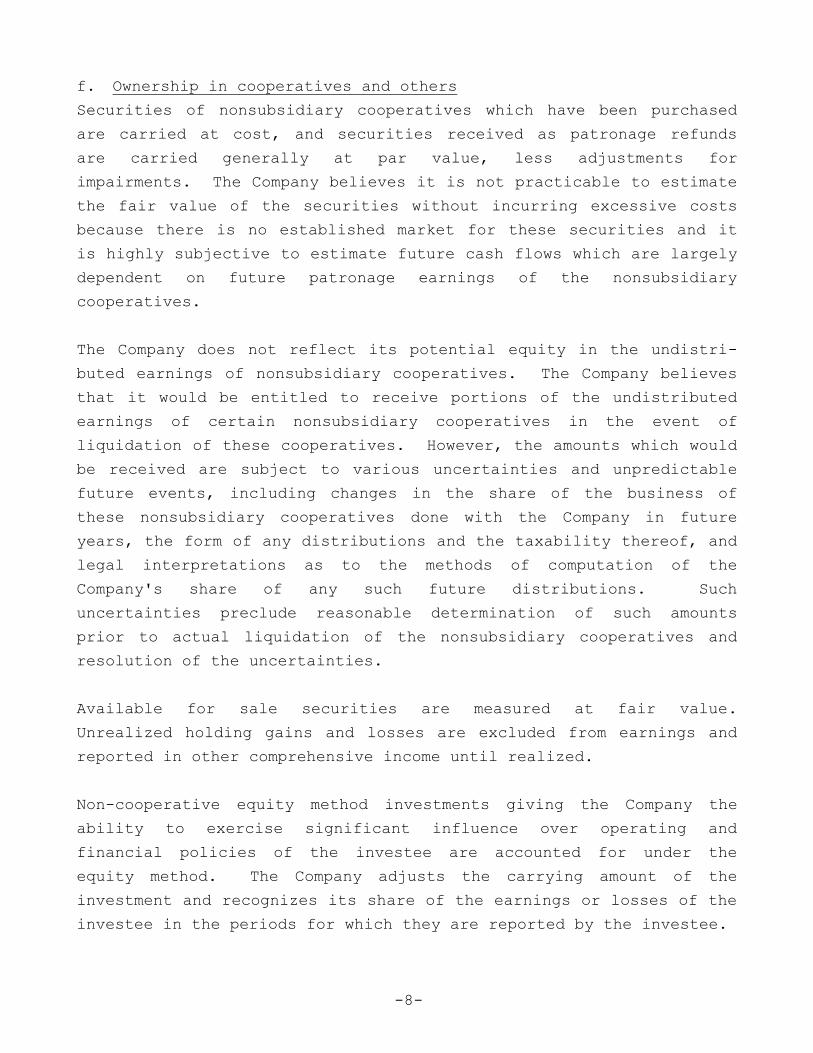
f. Ownership in cooperatives and others
Securities of nonsubsidiary cooperatives which have been purchased
are carried at cost, and securities received as patronage refunds
are carried generally at par value, less adjustments for
impairments. The Company believes it is not practicable to estimate
the fair value of the securities without incurring excessive costs
because there is no established market for these securities and it
is highly subjective to estimate future cash flows which are largely
dependent on future patronage earnings of the nonsubsidiary
cooperatives.
The Company does not reflect its potential equity in the undistri-
buted earnings of nonsubsidiary cooperatives. The Company believes
that it would be entitled to receive portions of the undistributed
earnings of certain nonsubsidiary cooperatives in the event of
liquidation of these cooperatives. However, the amounts which would
be received are subject to various uncertainties and unpredictable
future events, including changes in the share of the business of
these nonsubsidiary cooperatives done with the Company in future
years, the form of any distributions and the taxability thereof, and
legal interpretations as to the methods of computation of the
Company's share of any such future distributions. Such
uncertainties preclude reasonable determination of such amounts
prior to actual liquidation of the nonsubsidiary cooperatives and
resolution of the uncertainties.
Available for sale securities are measured at fair value.
Unrealized holding gains and losses are excluded from earnings and
reported in other comprehensive income until realized.
Non-cooperative equity method investments giving the Company the
ability to exercise significant influence over operating and
financial policies of the investee are accounted for under the
equity method. The Company adjusts the carrying amount of the
investment and recognizes its share of the earnings or losses of the
investee in the periods for which they are reported by the investee.
-9-
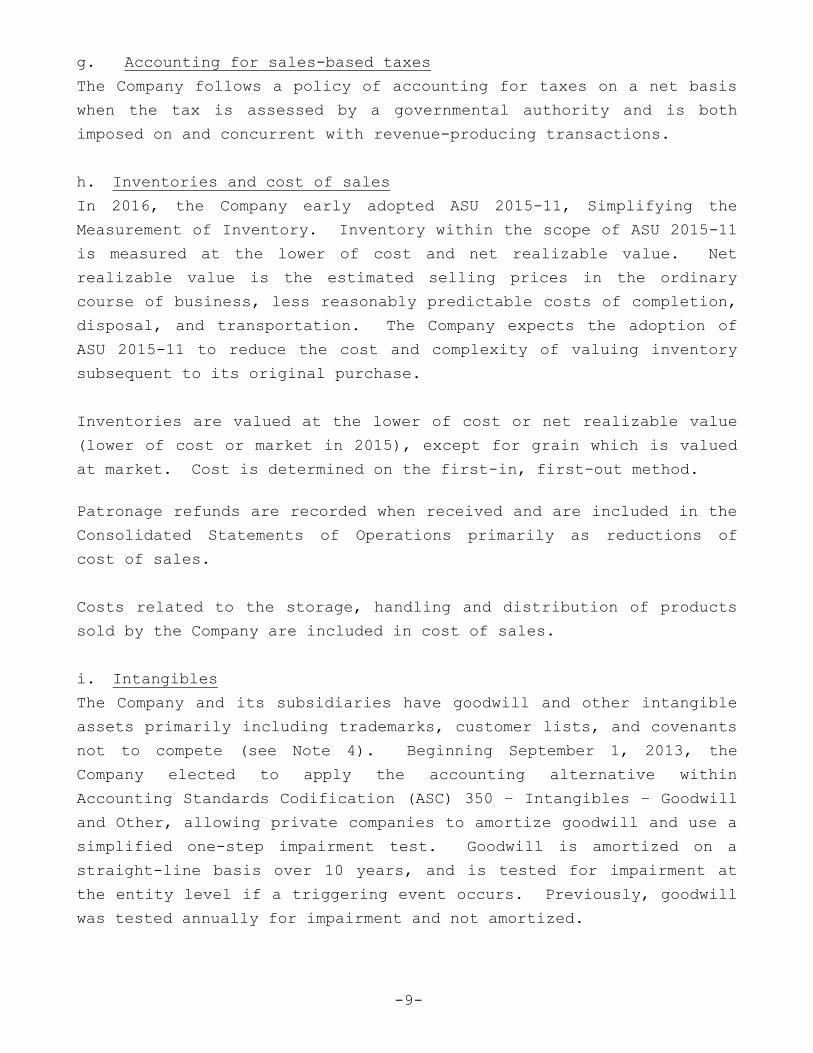
g. Accounting for sales-based taxes
The Company follows a policy of accounting for taxes on a net basis
when the tax is assessed by a governmental authority and is both
imposed on and concurrent with revenue-producing transactions.
h. Inventories and cost of sales
In 2016, the Company early adopted ASU 2015-11, Simplifying the
Measurement of Inventory. Inventory within the scope of ASU 2015-11
is measured at the lower of cost and net realizable value. Net
realizable value is the estimated selling prices in the ordinary
course of business, less reasonably predictable costs of completion,
disposal, and transportation. The Company expects the adoption of
ASU 2015-11 to reduce the cost and complexity of valuing inventory
subsequent to its original purchase.
Inventories are valued at the lower of cost or net realizable value
(lower of cost or market in 2015), except for grain which is valued
at market. Cost is determined on the first-in, first-out method.
Patronage refunds are recorded when received and are included in the
Consolidated Statements of Operations primarily as reductions of
cost of sales.
Costs related to the storage, handling and distribution of products
sold by the Company are included in cost of sales.
i. Intangibles
The Company and its subsidiaries have goodwill and other intangible
assets primarily including trademarks, customer lists, and covenants
not to compete (see Note 4). Beginning September 1, 2013, the
Company elected to apply the accounting alternative within
Accounting Standards Codification (ASC) 350 – Intangibles – Goodwill
and Other, allowing private companies to amortize goodwill and use a
simplified one-step impairment test. Goodwill is amortized on a
straight-line basis over 10 years, and is tested for impairment at
the entity level if a triggering event occurs. Previously, goodwill
was tested annually for impairment and not amortized.
-10-
j. Property, plant and equipment
Property, plant and equipment is carried at cost less accumulated
depreciation. Depreciation is determined on the straight-line
method for all assets.
k. Foreign operations
Included in the Company’s Consolidated Statements of Financial
Position at August 31, 2016 and 2015 are the total assets of its
Ontario, Canada operations which total approximately $264 million
($182 million in 2015.)
l. Use of estimates
The preparation of financial statements in conformity with generally
accepted accounting principles in the United States requires
management to make estimates and assumptions that affect the amounts
reported in the financial statements and accompanying notes. Actual
results could differ from these estimates.
m. Subsequent events
Subsequent events have been evaluated through November 1, 2016 which
is the date that the financial statements were available to be
issued.
2. Acquisitions
During 2016, the Company and its subsidiaries acquired various
wholesale and retail businesses in the energy and agronomy sectors
of the agricultural industry. As a result of these acquisitions,
the Company expects to realize revenue growth and increased
earnings. The aggregate purchase price was $50.6 million ($50.3
million paid in cash). The results of these operations have been
included in the consolidated financial statements since the dates of
acquisition.
The acquisitions are accounted for in accordance with the provisions
of ASC 805 Business Combinations. The Company estimated the fair
value of assets and liabilities at the time of acquisition and used
appraisals to assist in determining the fair market value for
acquired tangible assets. These appraisals represent level 2 fair
-11-
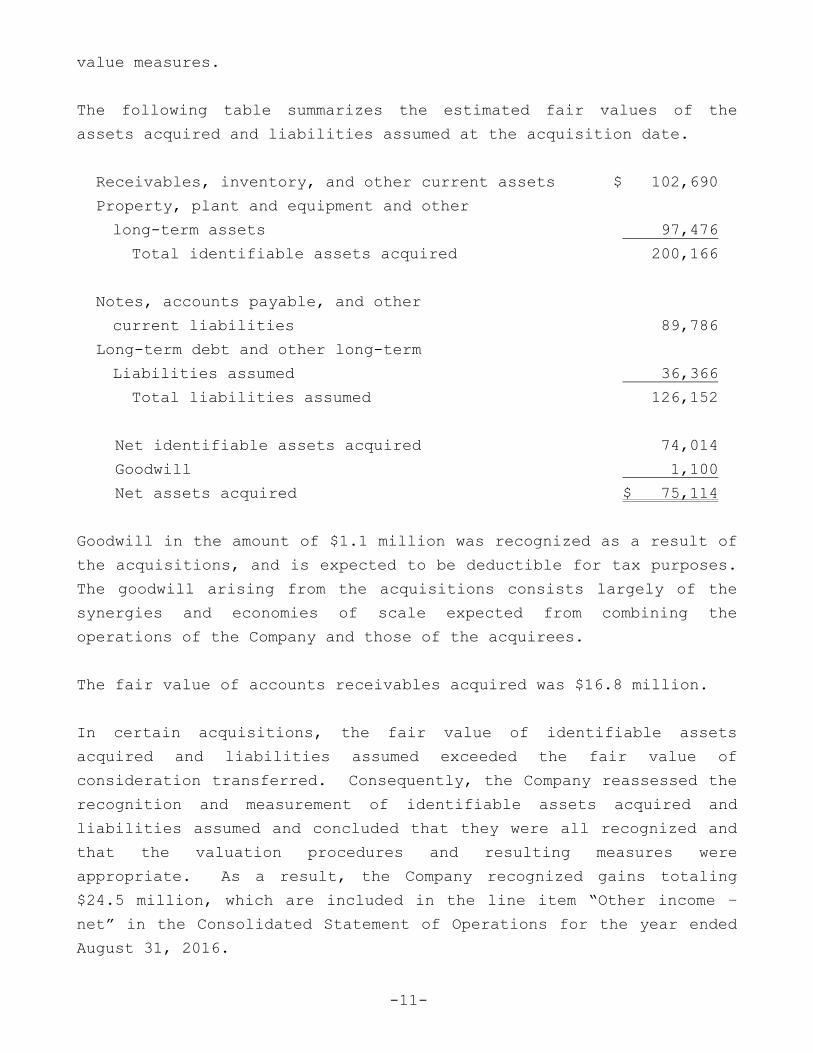
value measures.
The following table summarizes the estimated fair values of the
assets acquired and liabilities assumed at the acquisition date.
Receivables, inventory, and other current assets $ 102,690
Property, plant and equipment and other
long-term assets 97,476
Total identifiable assets acquired 200,166
Notes, accounts payable, and other
current liabilities 89,786
Long-term debt and other long-term
Liabilities assumed 36,366
Total liabilities assumed 126,152
Net identifiable assets acquired 74,014
Goodwill 1,100
Net assets acquired $ 75,114
Goodwill in the amount of $1.1 million was recognized as a result of
the acquisitions, and is expected to be deductible for tax purposes.
The goodwill arising from the acquisitions consists largely of the
synergies and economies of scale expected from combining the
operations of the Company and those of the acquirees.
The fair value of accounts receivables acquired was $16.8 million.
In certain acquisitions, the fair value of identifiable assets
acquired and liabilities assumed exceeded the fair value of
consideration transferred. Consequently, the Company reassessed the
recognition and measurement of identifiable assets acquired and
liabilities assumed and concluded that they were all recognized and
that the valuation procedures and resulting measures were
appropriate. As a result, the Company recognized gains totaling
$24.5 million, which are included in the line item “Other income –
net” in the Consolidated Statement of Operations for the year ended
August 31, 2016.
-12-
The Company adopted ASU 2014-18 in fiscal 2015, and no longer
recognizes separately from goodwill (1) customer-related intangible
assets unless they are capable of being sold or licensed
independently from the other assets of the business and (2)
noncompetition agreements. Entities electing this accounting
alternative must adopt the private company alternative to amortize
goodwill per ASU 2014-02, which the Company previously adopted.
During 2015, the Company and its subsidiaries acquired wholesale
businesses in the energy industry. The aggregate purchase price was
$2.8 million ($2.8 million paid in cash).
3. Segregated funds
A significant portion of the segregated funds of a subsidiary of the
Company is held in interest-bearing accounts by ADM Investor
Services, Inc., the subsidiary’s principal clearing broker.
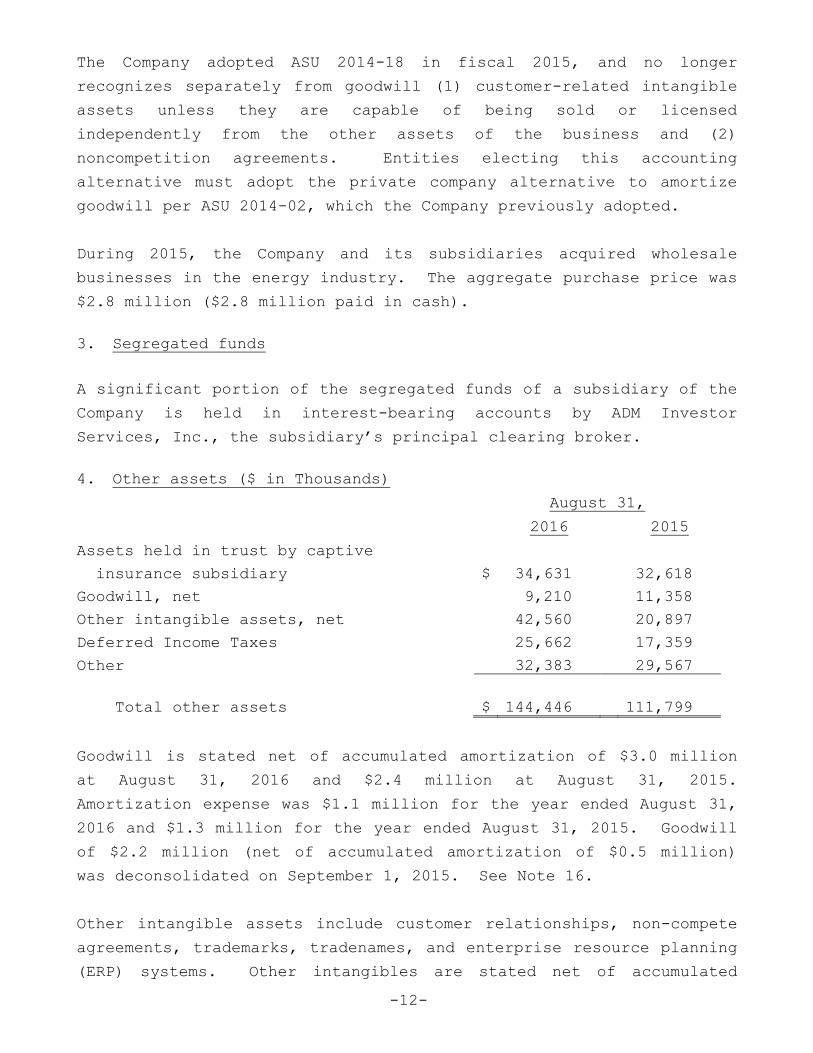
4. Other assets ($ in Thousands)
August 31,
2016 2015
Assets held in trust by captive
insurance subsidiary $ 34,631 32,618
Goodwill, net 9,210 11,358
Other intangible assets, net 42,560 20,897
Deferred Income Taxes
2
0
25,662 17,359
Other 32,383 29,567
Total other assets $ 144,446 111,799
Goodwill is stated net of accumulated amortization of $3.0 million
at August 31, 2016 and $2.4 million at August 31, 2015.
Amortization expense was $1.1 million for the year ended August 31,
2016 and $1.3 million for the year ended August 31, 2015. Goodwill
of $2.2 million (net of accumulated amortization of $0.5 million)
was deconsolidated on September 1, 2015. See Note 16.
Other intangible assets include customer relationships, non-compete
agreements, trademarks, tradenames, and enterprise resource planning
(ERP) systems. Other intangibles are stated net of accumulated

-13-
amortization of $20.5 million at August 31, 2016 and $17.5 million
at August 31, 2015. Amortization expense was $3.0 million for the
year ended August 31, 2016 and $2.5 million for the year ended
August 31, 2015.
The Company began the process of implementing a new enterprise
resource planning (ERP) system during 2015. Capitalized computer
software costs totaled $35.1 million at August 31, 2016 ($11.1
million at August 31, 2015). Amortization of capitalized computer
software costs began in 2016 when the software was ready for use.
Estimated amortization expense for the succeeding five years for
goodwill and other intangibles is ($ in thousands) $7,848 in 2017,
$8,080 in 2018, $7,976 in 2019, $7,957 in 2020, and $7,896 in 2021.
5. Ownership in cooperatives and others
August 31,
($ in Thousands) 2016 2015
Nonsubsidiary cooperatives:
National Cooperative Refinery
Association (NCRA) $ --- 109,492
CHS 24,042 5,034
CoBank, ACB 6,935 6,771
Other cooperatives 9,370 3,390
40,347 124,687
Available-for-sale securities
($53,014 cost at August 31,
2016, $31,795 at August 31,
2015) 79,062 65,329
Non-coop equity method investments:
FS GRAIN, LLC 33,508 ---
UPI, Inc. 12,960 12,925
Other 34,099 34,113
Total ownership in coops and others
199,976 237,054
NCRA reclassified to current assets –
ownership in cooperative
---
(109,492)
( Ownership in coops and others
$ 199,976 127,562

-14-
At August 31, 2016, the gross pre-tax unrealized gains on long-term
available-for-sale securities were $27.6 million (or $17.0 million,
net of $10.6 million of deferred income taxes). The gross pre-tax
unrealized losses on long-term available-for-sale securities were
$1.1 million (or $.7 million, net of $.4 million of deferred income
taxes) at August 31, 2016. At August 31, 2015, the gross pre-tax
unrealized gains on long-term available-for-sale securities were
$33.3 million (or $20.5 million, net of $12.8 million of deferred
income taxes). There were no gross pre-tax unrealized losses on
long-term available-for-sale securities at August 31, 2015.
The gross realized loss on sales of long-term available-for-sale
securities was $1.4 million during 2016 (none in 2015). The gross
realized gain on sales of long-term available-for-sale securities
was $11.8 million as reported in the Statement of Operations for the
year ended August 31, 2016 ($15.4 million in 2015). The cost basis
used to compute the net realized gain on sales was specific
identification for all available-for-sale securities.
During 2012, the Company executed a Stock Transfer Agreement to sell
its National Cooperative Refinery Association (NCRA) shares to CHS,
Inc. (CHS). CHS had the right as majority shareholder to initiate
the process of acquiring full ownership of the refinery operation.
The transition of ownership occurred in four annual installments
beginning September 2012. Each of the first three installments
(September 2012, 2013 and 2014) were for approximately one-fifth of
total holdings and the last installment (in September 2015) was for
the remaining shares held by the Company. The Company did not incur
any loss as a result of the Agreement.
According to terms of the Stock Transfer Agreement, the Company
received par value for the shares sold plus a contingent amount for
each of two years following each sale installment. The contingency
is based on the amount by which average annual refinery margins are
in excess of a specified minimum per barrel, product sales by the
refinery during each fiscal year and on the shares sold. The
proceeds from each installment sale, including the contingent
portion, were recorded at fair value at each closing date. In
subsequent periods, adjustments to amounts recognized for the
-15-
contingent portion will be evaluated pursuant to ASC 450,
Contingencies.
During 2016, the Company recorded a gain on the sale of the fourth
and final installment of $1.9 million ($2.7 million on the third
installment in 2015) which is included in Other income – net in the
Consolidated Statement of Operations. The value of the shares that
were sold in September 2015 ($111.4 million) were classified as
Current assets – Ownership in cooperative.
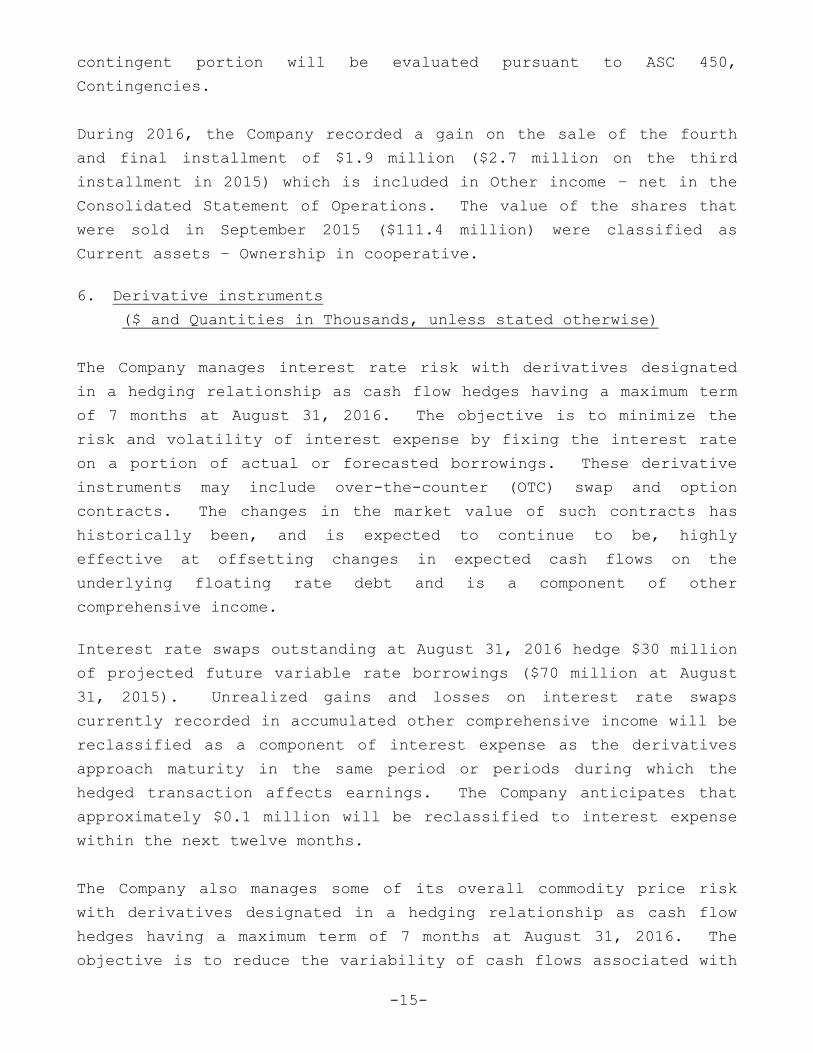
6. Derivative instruments
($ and Quantities in Thousands, unless stated otherwise)
The Company manages interest rate risk with derivatives designated
in a hedging relationship as cash flow hedges having a maximum term
of 7 months at August 31, 2016. The objective is to minimize the
risk and volatility of interest expense by fixing the interest rate
on a portion of actual or forecasted borrowings. These derivative
instruments may include over-the-counter (OTC) swap and option
contracts. The changes in the market value of such contracts has
historically been, and is expected to continue to be, highly
effective at offsetting changes in expected cash flows on the
underlying floating rate debt and is a component of other
comprehensive income.
Interest rate swaps outstanding at August 31, 2016 hedge $30 million
of projected future variable rate borrowings ($70 million at August
31, 2015). Unrealized gains and losses on interest rate swaps
currently recorded in accumulated other comprehensive income will be
reclassified as a component of interest expense as the derivatives
approach maturity in the same period or periods during which the
hedged transaction affects earnings. The Company anticipates that
approximately $0.1 million will be reclassified to interest expense
within the next twelve months.
The Company also manages some of its overall commodity price risk
with derivatives designated in a hedging relationship as cash flow
hedges having a maximum term of 7 months at August 31, 2016. The
objective is to reduce the variability of cash flows associated with
-16-
the Company’s forecasted purchases and sales of soybeans and corn.
These derivative instruments may include exchange-traded futures and
options contracts. The changes in the market value of such
contracts has historically been, and is expected to continue to be,
highly effective at offsetting changes in the expected cash flows
associated with purchasing and selling the underlying commodity and
is a component of other comprehensive income.
The contract quantity of soybean and wheat futures and options at
August 31, 2016 is (0.2) million bushels (0.8 million bushels in
2015). Unrealized gains and losses on futures and options contracts
currently recorded in accumulated other comprehensive income will be
reclassified as a component of cost of sales as the derivatives
approach maturity in the same period or periods during which the
hedged transaction affects earnings. The Company anticipates that
approximately $(0.4) million will be reclassified to cost of sales
within the next twelve months.
Certain operations and subsidiaries of the Company hold derivative
instruments that have not been designated as hedges, such as
futures, options, forward contracts, and over-the-counter (OTC)
swaps that are believed to provide an economic hedge of overall
price risk of grain, fuel, and fertilizer commodities. The purpose
in holding these derivatives is to reduce the variability of cash
flows associated with forecasted purchases and sales of the
underlying commodities.
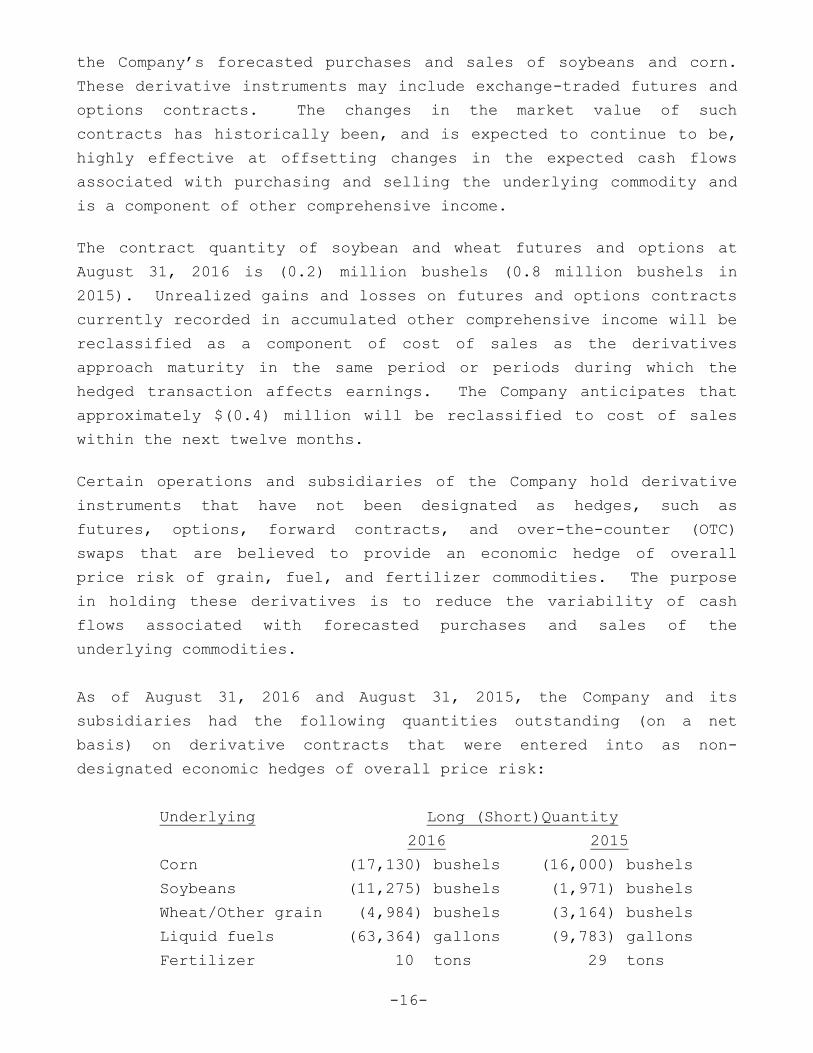
As of August 31, 2016 and August 31, 2015, the Company and its
subsidiaries had the following quantities outstanding (on a net
basis) on derivative contracts that were entered into as non-
designated economic hedges of overall price risk:
Underlying Long (Short)Quantity
2016 2015
Corn (17,130) bushels (16,000) bushels
Soybeans (11,275) bushels (1,971) bushels
Wheat/Other grain (4,984) bushels (3,164) bushels
Liquid fuels (63,364) gallons (9,783) gallons
Fertilizer 10 tons 29 tons
-17-
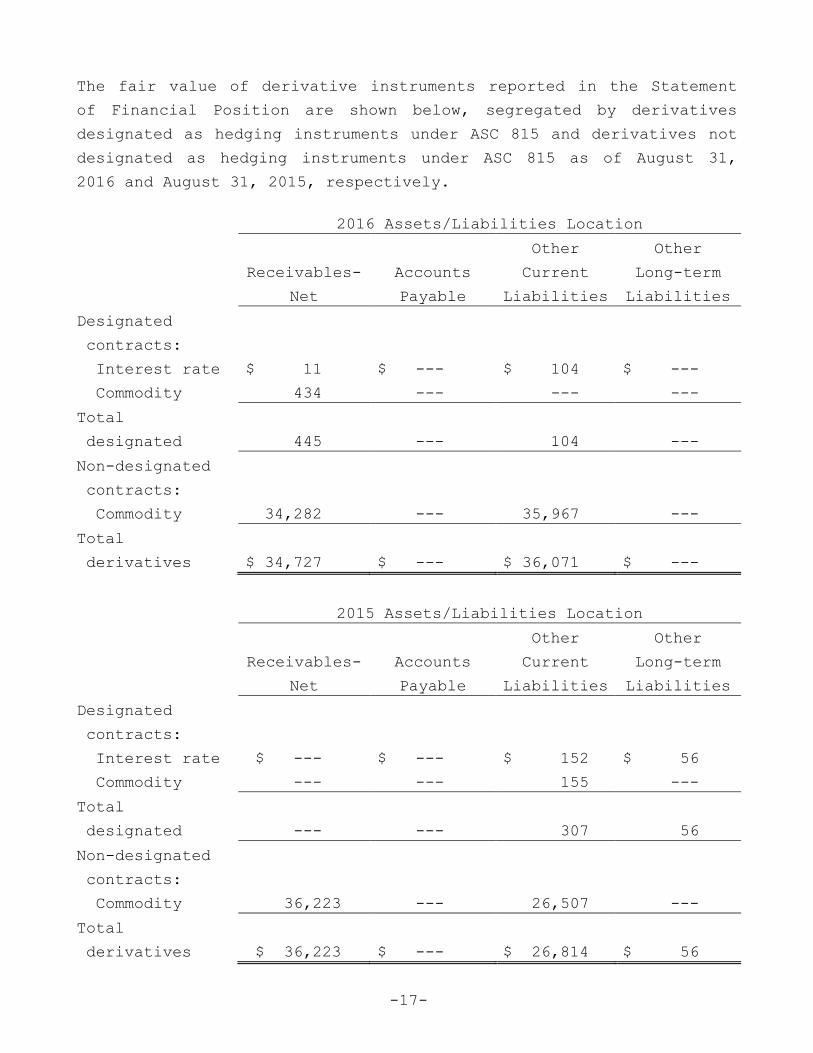
The fair value of derivative instruments reported in the Statement
of Financial Position are shown below, segregated by derivatives
designated as hedging instruments under ASC 815 and derivatives not
designated as hedging instruments under ASC 815 as of August 31,
2016 and August 31, 2015, respectively.
2016 Assets/Liabilities Location
Receivables-
Accounts
Other
Current
Other
Long-term
Net Payable Liabilities Liabilities
Designated
contracts:
Interest rate $ 11 $ --- $ 104 $ ---
Commodity 434 --- --- ---
Total
designated 445 --- 104 ---
Non-designated
contracts:
Commodity 34,282 --- 35,967 ---
Total
derivatives $ 34,727 $ --- $ 36,071 $ ---
2015 Assets/Liabilities Location
Receivables-
Accounts
Other
Current
Other
Long-term
Net Payable Liabilities Liabilities
Designated
contracts:
Interest rate $ --- $ --- $ 152 $ 56
Commodity --- --- 155 ---
Total
designated --- --- 307 56
Non-designated
contracts:
Commodity 36,223 --- 26,507 ---
Total
derivatives $ 36,223 $ --- $ 26,814 $ 56
-18-
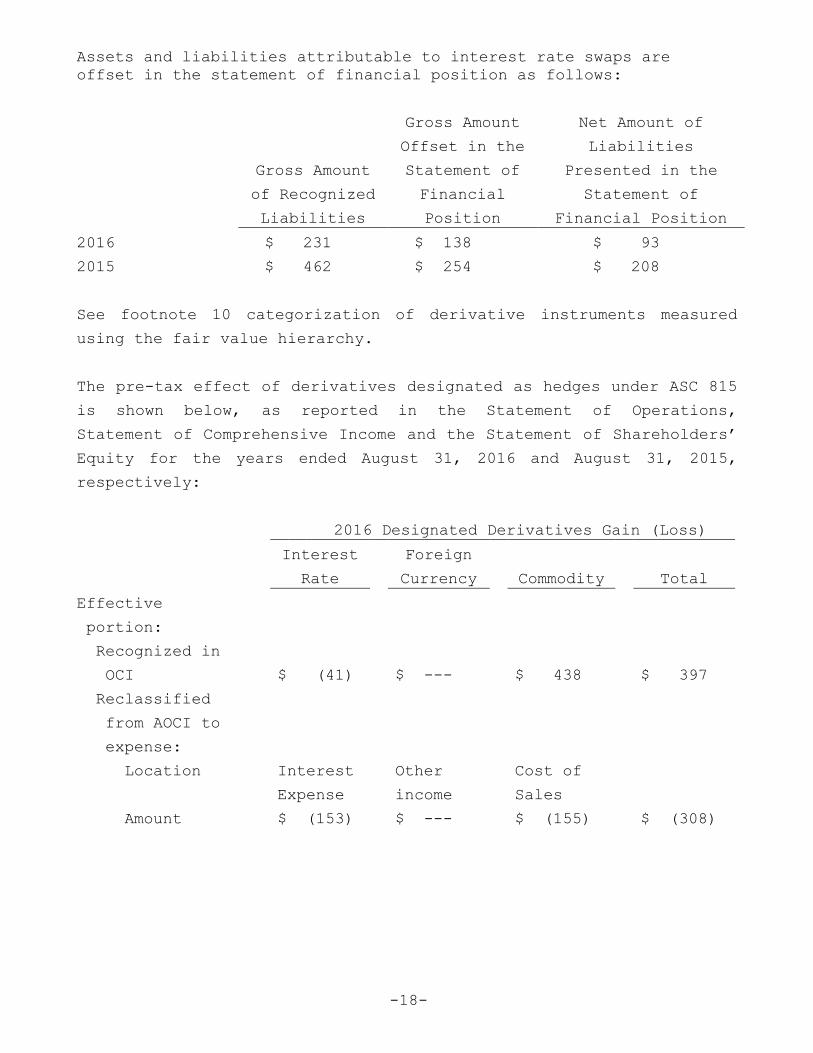
Assets and liabilities attributable to interest rate swaps are
offset in the statement of financial position as follows:
Gross Amount
of Recognized
Liabilities
Gross Amount
Offset in the
Statement of
Financial
Position
Net Amount of
Liabilities
Presented in the
Statement of
Financial Position
2016 $ 231 $ 138 $ 93
2015 $ 462 $ 254 $ 208
See footnote 10 categorization of derivative instruments measured
using the fair value hierarchy.
The pre-tax effect of derivatives designated as hedges under ASC 815
is shown below, as reported in the Statement of Operations,
Statement of Comprehensive Income and the Statement of Shareholders’
Equity for the years ended August 31, 2016 and August 31, 2015,
respectively:
2016 Designated Derivatives Gain (Loss)
Interest Foreign
Rate Currency Commodity Total
Effective
portion:
Recognized in
OCI $ (41) $ --- $ 438 $ 397
Reclassified
from AOCI to
expense:
Location Interest Other Cost of
Expense income Sales
Amount $ (153) $ --- $ (155) $ (308)

-19-
2015 Designated Derivatives Gain (Loss)
Interest Foreign
Rate Currency Commodity Total
Effective
portion:
Recognized in
OCI $ (237) $ --- $ (155) $ (392)
Reclassified
from AOCI to
expense:
Location Interest Other Cost of
expense income Sales
Amount $ (74) $ --- $ 535 $ 461
During 2016 and 2015, immaterial levels of ineffectiveness were
recognized in interest expense.
The effect of derivatives held as economic hedges but not designated
under ASC 815 is shown below, as reported in the Statement of
Operations for the years ended August 31, 2016 and August 31, 2015,
respectively:
Non-Designated Derivatives
Gain (Loss)
Commodity Contracts
2016 2015
Recognized in income:
Location Cost of sales Cost of sales
Amount $ 19,137 $ 99,789
-20-
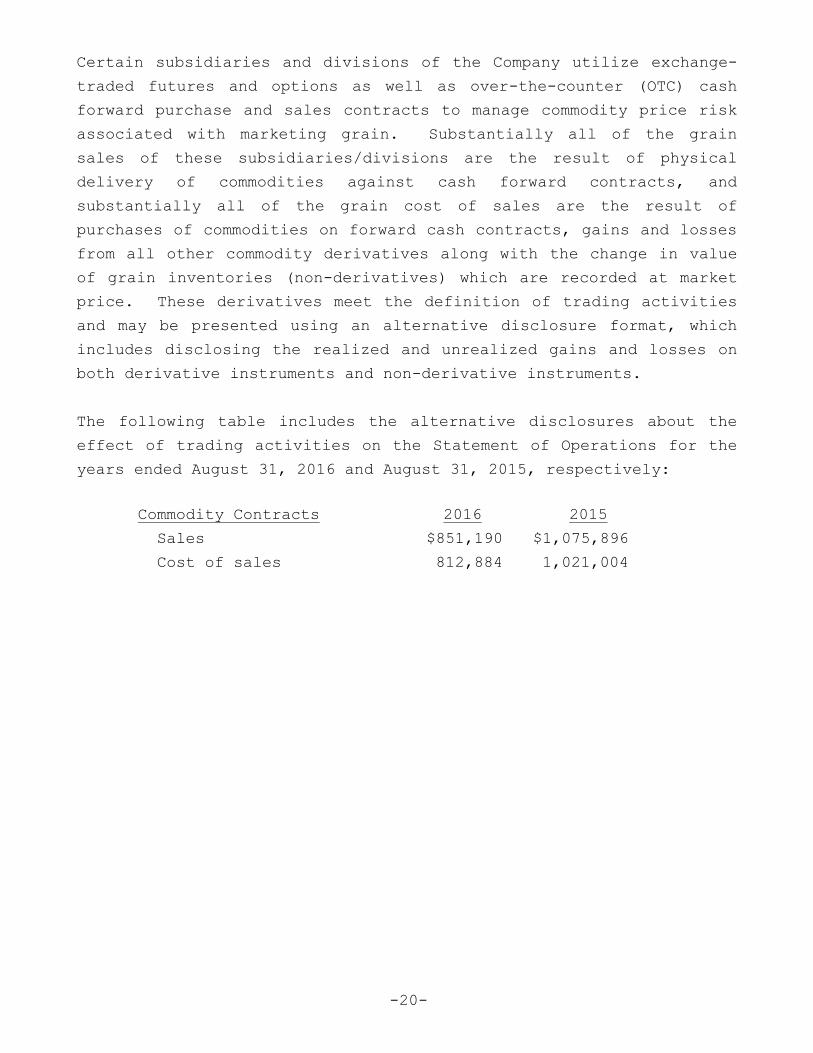
Certain subsidiaries and divisions of the Company utilize exchange-
traded futures and options as well as over-the-counter (OTC) cash
forward purchase and sales contracts to manage commodity price risk
associated with marketing grain. Substantially all of the grain
sales of these subsidiaries/divisions are the result of physical
delivery of commodities against cash forward contracts, and
substantially all of the grain cost of sales are the result of
purchases of commodities on forward cash contracts, gains and losses
from all other commodity derivatives along with the change in value
of grain inventories (non-derivatives) which are recorded at market
price. These derivatives meet the definition of trading activities
and may be presented using an alternative disclosure format, which
includes disclosing the realized and unrealized gains and losses on
both derivative instruments and non-derivative instruments.
The following table includes the alternative disclosures about the
effect of trading activities on the Statement of Operations for the
years ended August 31, 2016 and August 31, 2015, respectively:
Commodity Contracts 2016 2015
Sales $851,190 $1,075,896
Cost of sales 812,884 1,021,004
-21-
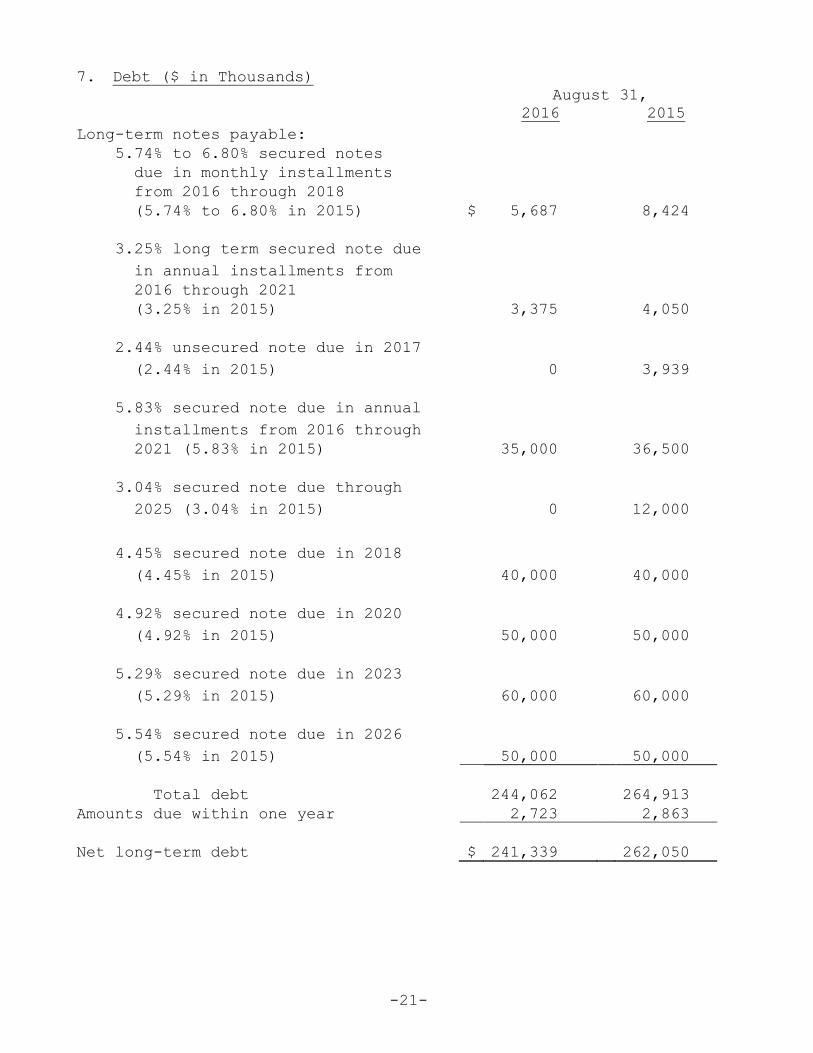
7. Debt ($ in Thousands)
August 31,
2016 2015
Long-term notes payable:
5.74% to 6.80% secured notes
due in monthly installments
from 2016 through 2018
(5.74% to 6.80% in 2015) $ 5,687 8,424
3.25% long term secured note due
in annual installments from
2016 through 2021
(3.25% in 2015)
3,375 4,050
2.44% unsecured note due in 2017
3
3
(2.44% in 2015) 0 3,939
5.83% secured note due in annual
installments from 2016 through
2021 (5.83% in 2015) 35,000 36,500
3.04% secured note due through
2025 (3.04% in 2015) 0 12,000
4.45% secured note due in 2018
(4.45% in 2015) 40,000 40,000
4.92% secured note due in 2020
(4.92% in 2015) 50,000 50,000
5.29% secured note due in 2023
(5.29% in 2015) 60,000 60,000
5.54% secured note due in 2026
(5.54% in 2015) 50,000 50,000
Total debt 244,062 264,913
Amounts due within one year 2,723 2,863
Net long-term debt $ 241,339 262,050
-22-
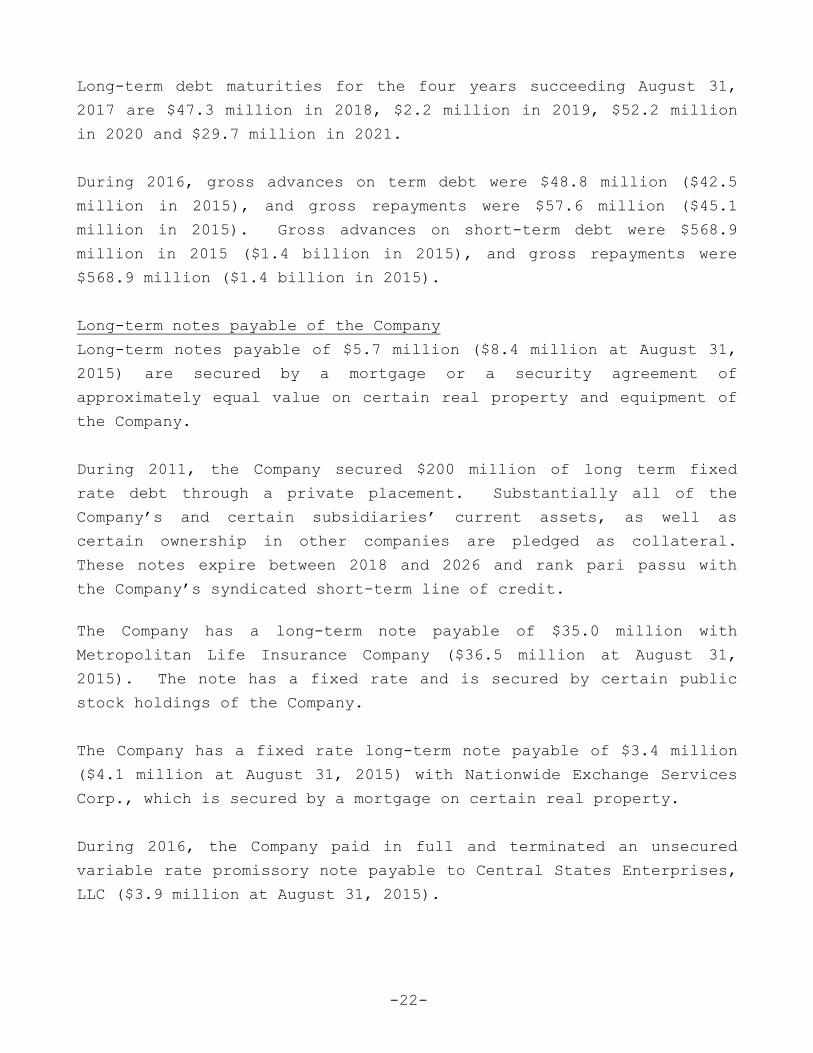
Long-term debt maturities for the four years succeeding August 31,
2017 are $47.3 million in 2018, $2.2 million in 2019, $52.2 million
in 2020 and $29.7 million in 2021.
During 2016, gross advances on term debt were $48.8 million ($42.5
million in 2015), and gross repayments were $57.6 million ($45.1
million in 2015). Gross advances on short-term debt were $568.9
million in 2015 ($1.4 billion in 2015), and gross repayments were
$568.9 million ($1.4 billion in 2015).
Long-term notes payable of the Company
Long-term notes payable of $5.7 million ($8.4 million at August 31,
2015) are secured by a mortgage or a security agreement of
approximately equal value on certain real property and equipment of
the Company.
During 2011, the Company secured $200 million of long term fixed
rate debt through a private placement. Substantially all of the
Company’s and certain subsidiaries’ current assets, as well as
certain ownership in other companies are pledged as collateral.
These notes expire between 2018 and 2026 and rank pari passu with
the Company’s syndicated short-term line of credit.
The Company has a long-term note payable of $35.0 million with
Metropolitan Life Insurance Company ($36.5 million at August 31,
2015). The note has a fixed rate and is secured by certain public
stock holdings of the Company.
The Company has a fixed rate long-term note payable of $3.4 million
($4.1 million at August 31, 2015) with Nationwide Exchange Services
Corp., which is secured by a mortgage on certain real property.
During 2016, the Company paid in full and terminated an unsecured
variable rate promissory note payable to Central States Enterprises,
LLC ($3.9 million at August 31, 2015).

-23-
Certain covenants of these loans require the Company to maintain a
minimum amount of net worth and working capital, and limit the
amount of debt and direct or contingent obligations.
Short-term notes payable of the Company
The Company has secured short-term lines of credit extending to June
2020 totaling $600.0 million at August 31, 2016 ($600.0 million at
August 31, 2015). At August 31, 2016, there were no borrowings
outstanding at variable rates (none at August 31, 2015).
Substantially all of the Company’s and certain subsidiaries’ current
assets and certain ownership in other companies are security under a
syndicated credit facility agreement for this short-term line of
credit. On June 12, 2015, a second amendment to the short-term
credit agreement was executed. The Company reduced the cost of
borrowing, enhanced operational flexibility, and extended the
maturity from August 2017 to June 2020. These lines of credit rank
pari passu with the Company’s long term fixed rate private placement
debt.
During 2016, the Company paid in full and terminated a $25 million
short-term note payable with Wells Fargo. The note had no
borrowings outstanding at August 31, 2015 was secured by certain
public stock holdings of the Company.
Consolidated non-recourse long-term notes payable
At August 31, 2016, a subsidiary (Total Grain Marketing, LLC, or
TGM) of the Company has a long-term revolving note payable with
CoBank (non-recourse to the Company), with a total capacity of $15
million and no borrowings outstanding at August 31, 2016. At August
31, 2015, a subsidiary (Total Grain Marketing, LLC, or TGM) of the
Company had two long-term revolving notes payable defined as
“Reducing Revolving A” and “Reducing Revolving B” (non-recourse to
the Company), each in a syndicated bank agreement with CoBank as
Administrative Agent. The capacity of the notes was $30 million in
Reducing Revolving A and $20 million in Reducing Revolving B. No
borrowings were outstanding at August 31, 2015. The notes are
collateralized by a first mortgage on TGM’s facilities, security
agreement, assignment of leases and rents and fixture filing, and
-24-
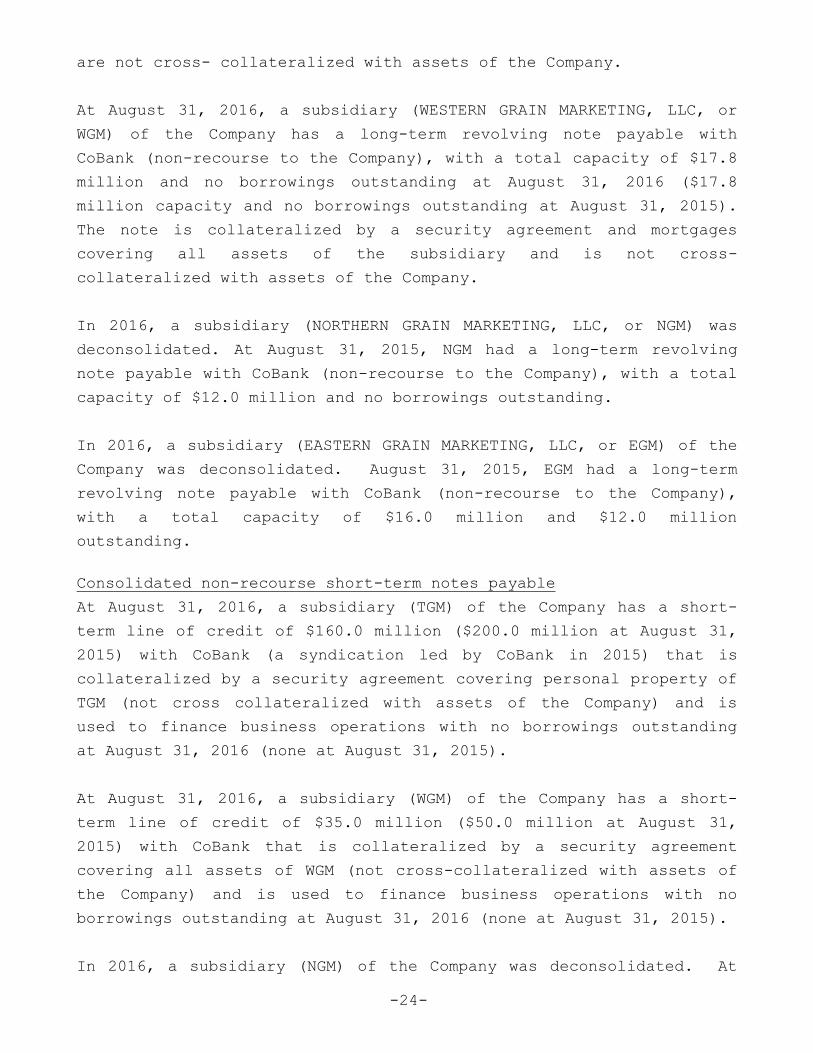
are not cross- collateralized with assets of the Company.
At August 31, 2016, a subsidiary (WESTERN GRAIN MARKETING, LLC, or
WGM) of the Company has a long-term revolving note payable with
CoBank (non-recourse to the Company), with a total capacity of $17.8
million and no borrowings outstanding at August 31, 2016 ($17.8
million capacity and no borrowings outstanding at August 31, 2015).
The note is collateralized by a security agreement and mortgages
covering all assets of the subsidiary and is not cross-
collateralized with assets of the Company.
In 2016, a subsidiary (NORTHERN GRAIN MARKETING, LLC, or NGM) was
deconsolidated. At August 31, 2015, NGM had a long-term revolving
note payable with CoBank (non-recourse to the Company), with a total
capacity of $12.0 million and no borrowings outstanding.
In 2016, a subsidiary (EASTERN GRAIN MARKETING, LLC, or EGM) of the
Company was deconsolidated. August 31, 2015, EGM had a long-term
revolving note payable with CoBank (non-recourse to the Company),
with a total capacity of $16.0 million and $12.0 million
outstanding.
Consolidated non-recourse short-term notes payable
At August 31, 2016, a subsidiary (TGM) of the Company has a short-
term line of credit of $160.0 million ($200.0 million at August 31,
2015) with CoBank (a syndication led by CoBank in 2015) that is
collateralized by a security agreement covering personal property of
TGM (not cross collateralized with assets of the Company) and is
used to finance business operations with no borrowings outstanding
at August 31, 2016 (none at August 31, 2015).
At August 31, 2016, a subsidiary (WGM) of the Company has a short-
term line of credit of $35.0 million ($50.0 million at August 31,
2015) with CoBank that is collateralized by a security agreement
covering all assets of WGM (not cross-collateralized with assets of
the Company) and is used to finance business operations with no
borrowings outstanding at August 31, 2016 (none at August 31, 2015).
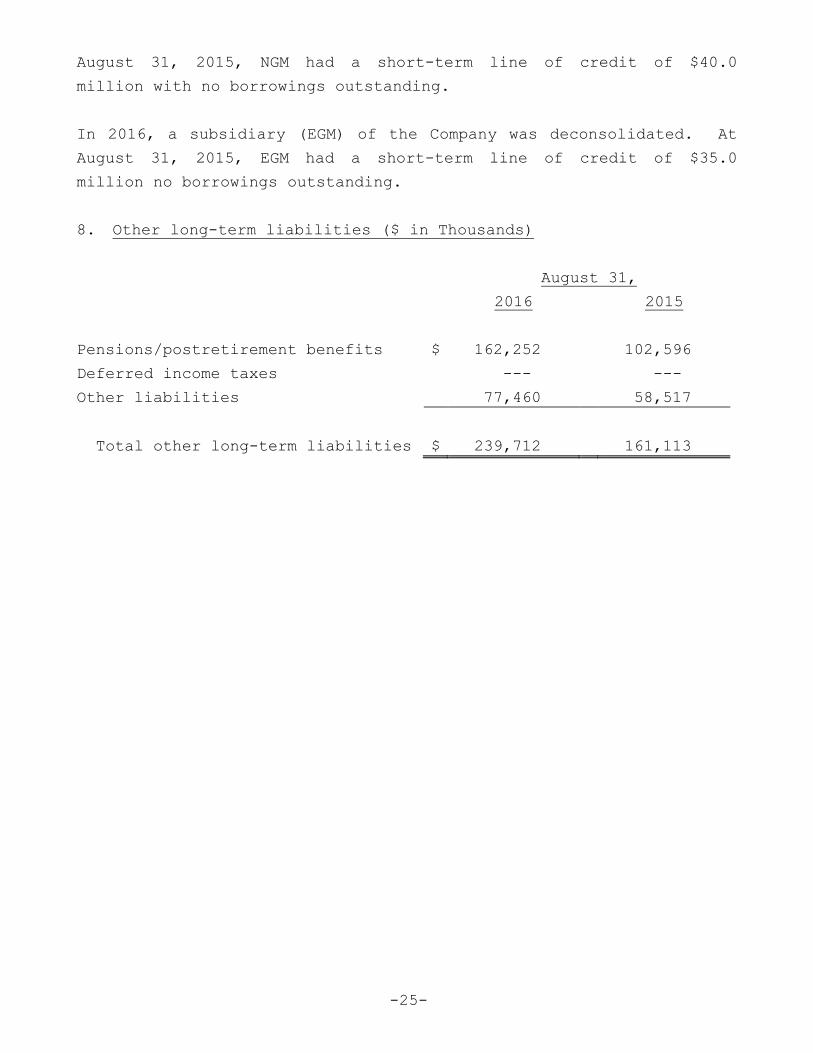
In 2016, a subsidiary (NGM) of the Company was deconsolidated. At
-25-
August 31, 2015, NGM had a short-term line of credit of $40.0
million with no borrowings outstanding.
In 2016, a subsidiary (EGM) of the Company was deconsolidated. At
August 31, 2015, EGM had a short-term line of credit of $35.0
million no borrowings outstanding.
8. Other long-term liabilities ($ in Thousands)
August 31,
2016 2015
Pensions/postretirement benefits $ 162,252 102,596
Deferred income taxes --- ---
Other liabilities 77,460 58,517
Total other long-term liabilities $ 239,712 161,113
-26-
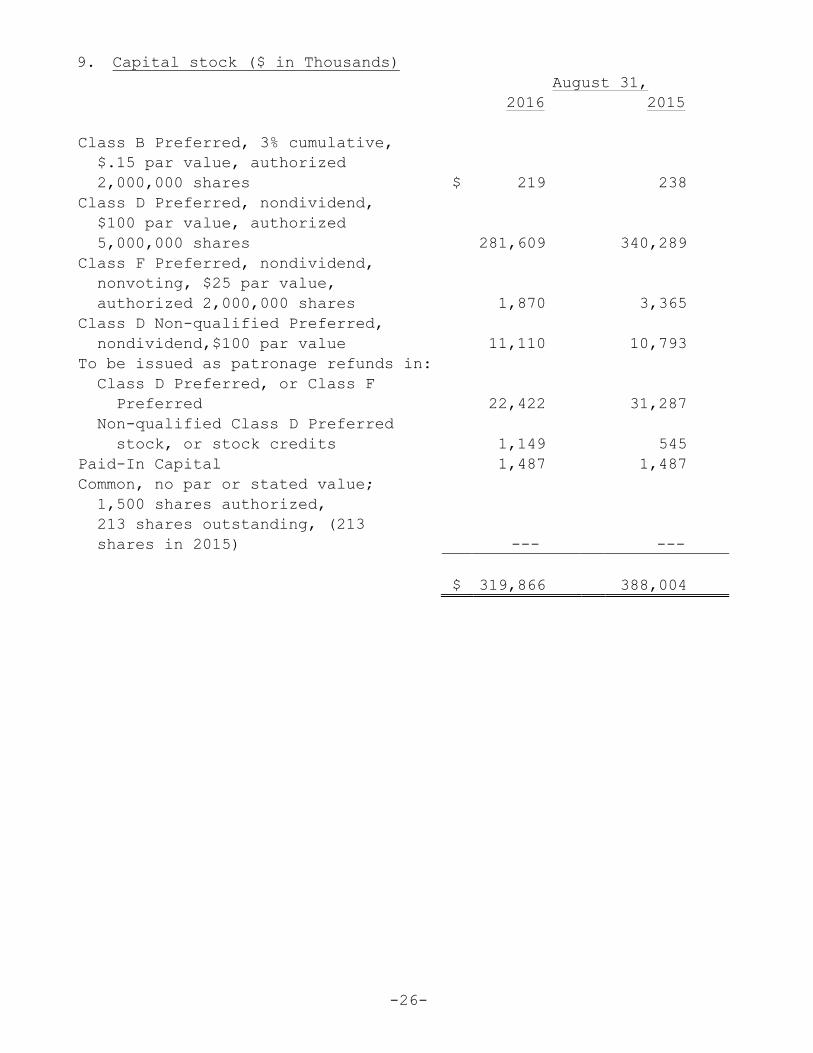
9. Capital stock ($ in Thousands)
August 31,
2016
2015
Class B Preferred, 3% cumulative,
$.15 par value, authorized
2,000,000 shares $ 219
238
Class D Preferred, nondividend,
$100 par value, authorized
5,000,000 shares
281,609
340,289
Class F Preferred, nondividend,
nonvoting, $25 par value,
authorized 2,000,000 shares
1,870
3,365
Class D Non-qualified Preferred,
nondividend,$100 par value
11,110
10,793
To be issued as patronage refunds in:
Class D Preferred, or Class F
Preferred
22,422
31,287
Non-qualified Class D Preferred
stock, or stock credits
1,149
545
Paid-In Capital
1,487
1,487
Common, no par or stated value;
1,500 shares authorized,
213 shares outstanding, (213
shares in 2015)
---
---
$ 319,866 388,004
-27-
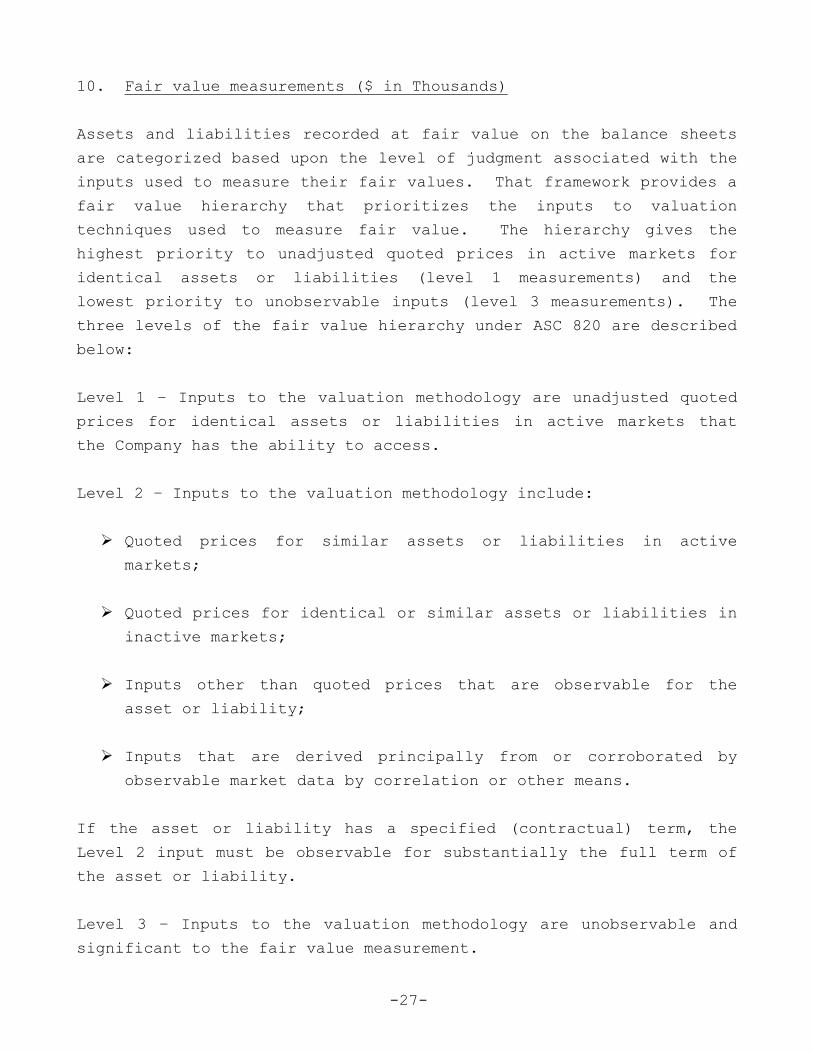
10. Fair value measurements ($ in Thousands)
Assets and liabilities recorded at fair value on the balance sheets
are categorized based upon the level of judgment associated with the
inputs used to measure their fair values. That framework provides a
fair value hierarchy that prioritizes the inputs to valuation
techniques used to measure fair value. The hierarchy gives the
highest priority to unadjusted quoted prices in active markets for
identical assets or liabilities (level 1 measurements) and the
lowest priority to unobservable inputs (level 3 measurements). The
three levels of the fair value hierarchy under ASC 820 are described
below:
Level 1 – Inputs to the valuation methodology are unadjusted quoted
prices for identical assets or liabilities in active markets that
the Company has the ability to access.
Level 2 – Inputs to the valuation methodology include:
Quoted prices for similar assets or liabilities in active
markets;
Quoted prices for identical or similar assets or liabilities in
inactive markets;
Inputs other than quoted prices that are observable for the
asset or liability;
Inputs that are derived principally from or corroborated by
observable market data by correlation or other means.
If the asset or liability has a specified (contractual) term, the
Level 2 input must be observable for substantially the full term of
the asset or liability.
Level 3 – Inputs to the valuation methodology are unobservable and
significant to the fair value measurement.
-28-
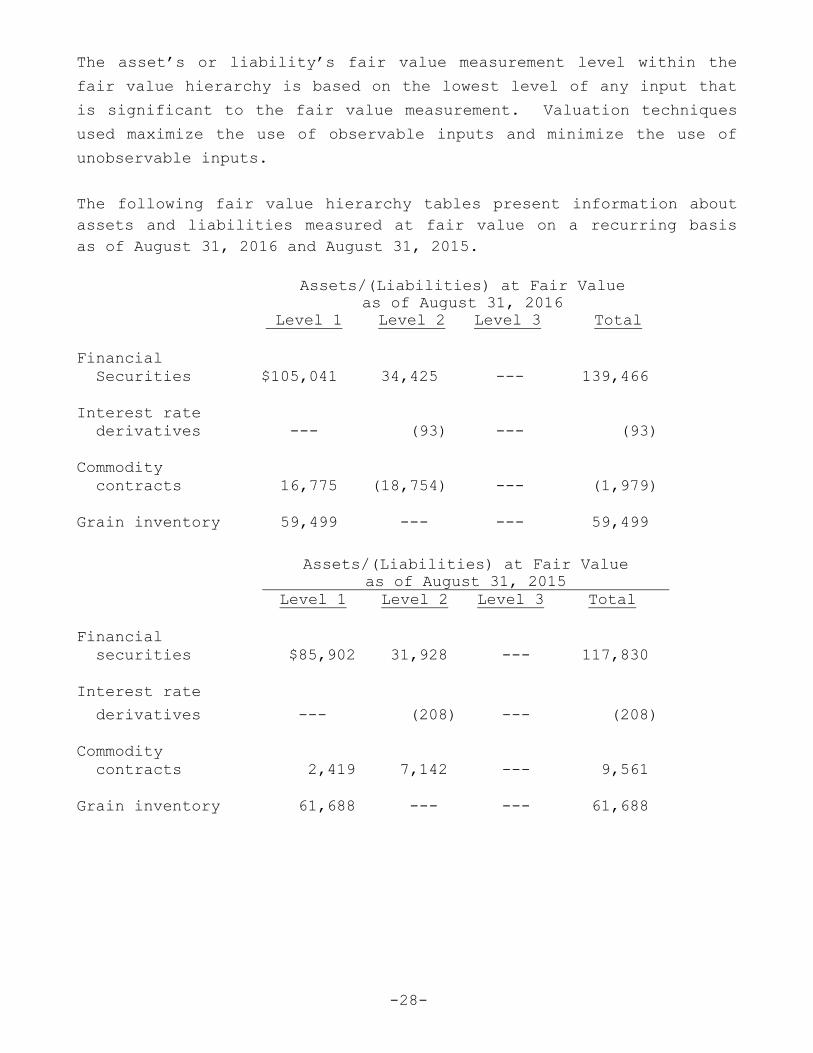
The asset’s or liability’s fair value measurement level within the
fair value hierarchy is based on the lowest level of any input that
is significant to the fair value measurement. Valuation techniques
used maximize the use of observable inputs and minimize the use of
unobservable inputs.
The following fair value hierarchy tables present information about
assets and liabilities measured at fair value on a recurring basis
as of August 31, 2016 and August 31, 2015.
Assets/(Liabilities) at Fair Value
as of August 31, 2016
Level 1 Level 2 Level 3 Total
Financial
Securities $105,041 34,425 --- 139,466
Interest rate
derivatives --- (93) --- (93)
Commodity
contracts 16,775 (18,754)
--
--- (1,979)
Grain inventory 59,499 --- ---
61
59,499
Assets/(Liabilities) at Fair Value
as of August 31, 2015
Level 1 Level 2 Level 3 Total
Financial
securities $85,902
$118,451
118,451
31,928 --- 117,830
Interest rate
derivatives --- (208) --- (208)
Commodity
contracts 2,419 7,142 --- 9,561
Grain inventory 61,688 --- --- 61,688
-29-
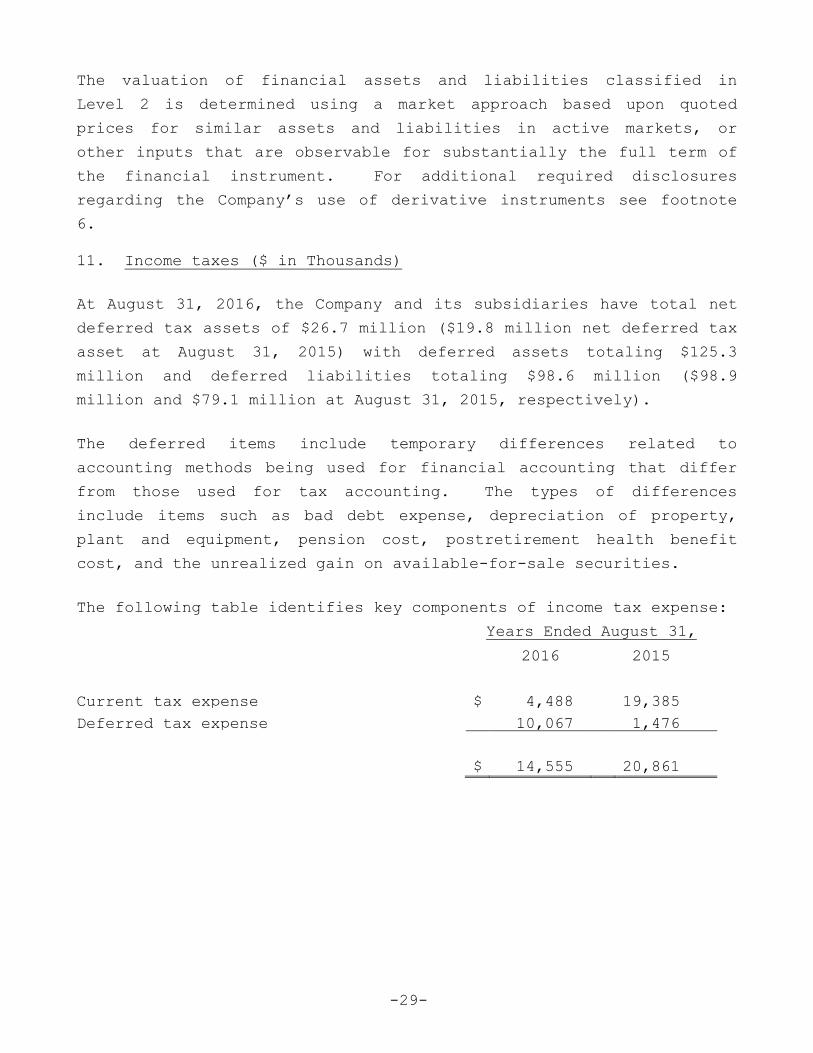
The valuation of financial assets and liabilities classified in
Level 2 is determined using a market approach based upon quoted
prices for similar assets and liabilities in active markets, or
other inputs that are observable for substantially the full term of
the financial instrument. For additional required disclosures
regarding the Company’s use of derivative instruments see footnote
6.
11. Income taxes ($ in Thousands)
At August 31, 2016, the Company and its subsidiaries have total net
deferred tax assets of $26.7 million ($19.8 million net deferred tax
asset at August 31, 2015) with deferred assets totaling $125.3
million and deferred liabilities totaling $98.6 million ($98.9
million and $79.1 million at August 31, 2015, respectively).
The deferred items include temporary differences related to
accounting methods being used for financial accounting that differ
from those used for tax accounting. The types of differences
include items such as bad debt expense, depreciation of property,
plant and equipment, pension cost, postretirement health benefit
cost, and the unrealized gain on available-for-sale securities.
The following table identifies key components of income tax expense:
Years Ended August 31,
2016 2015
Current tax expense $ 4,488 19,385
Deferred tax expense 10,067 1,476
$ 14,555 20,861
-30-
The Company and its subsidiaries are subject to income tax filing
requirements imposed by the federal, state, and provincial taxing
authorities in the United States and Canada. Income tax returns
filed, or to be filed, by the Company and its U.S. subsidiaries are
subject to examination by the U.S. federal, state and local taxing
authorities for tax years ending after August 31, 2008. The income
tax returns filed, or to be filed, by the Company and its foreign
subsidiaries are subject to examination by the Canadian and
provincial taxing authorities for tax years ending after August 31,
2008.
The Company and its subsidiaries recognize interest and penalty
expense, if any, in its provision for income taxes. Interest
expense related to unrecognized tax benefits in the Consolidated
Statement of Operations is immaterial for the years ended August 31,
2016 and August 31, 2015. The Company and its subsidiaries do not
expect that the total amounts of unrecognized tax benefits will
significantly increase or decrease during the next twelve months.
The effective income tax rate for fiscal 2016 and 2015 is less than
the statutory rate, primarily due to the issuance of patronage
refunds, which are deductible for tax purposes but treated as a
distribution for financial reporting purposes.

-31-
12. Pensions and postretirement health benefits ($ in Thousands)
The pension and health benefits measurements below are based on an
August 31 valuation date.
U.S. defined benefit plans:
Pension Health Benefits
August 31, August 31,
2016 2015 2016 2015
Total plan assets $468,526 411,433 --- ---
Total projected
benefit
obligation 606,303 489,070 26,894 27,565
Funded status $(137,777) (77,637) (26,894) (27,565)
Accumulated
benefit
obligation $542,639 441,076 --- ---
Pension Health Benefits
Years Ended August
31,
Years Ended August 31,
2016 2015 2016 2015
Service cost $ 14,733 $ 14,401 105 164
Interest cost 22,889 20,170 1,227 1,126
Expected return
on plan assets (27,631) (30,486)
(26,180)
--- ---
Net amortization 8,683 4,603 (199) (711)
Settlement
loss/(gain)
(410) --- --- 114
Benefit cost $ 18,264 $ 8,689 1,133 693
Benefits paid 17,896 15,095 896 935
Premiums paid by
company --- --- 896 935
Employer
contribution 24,539 13,702 --- ---
-32-
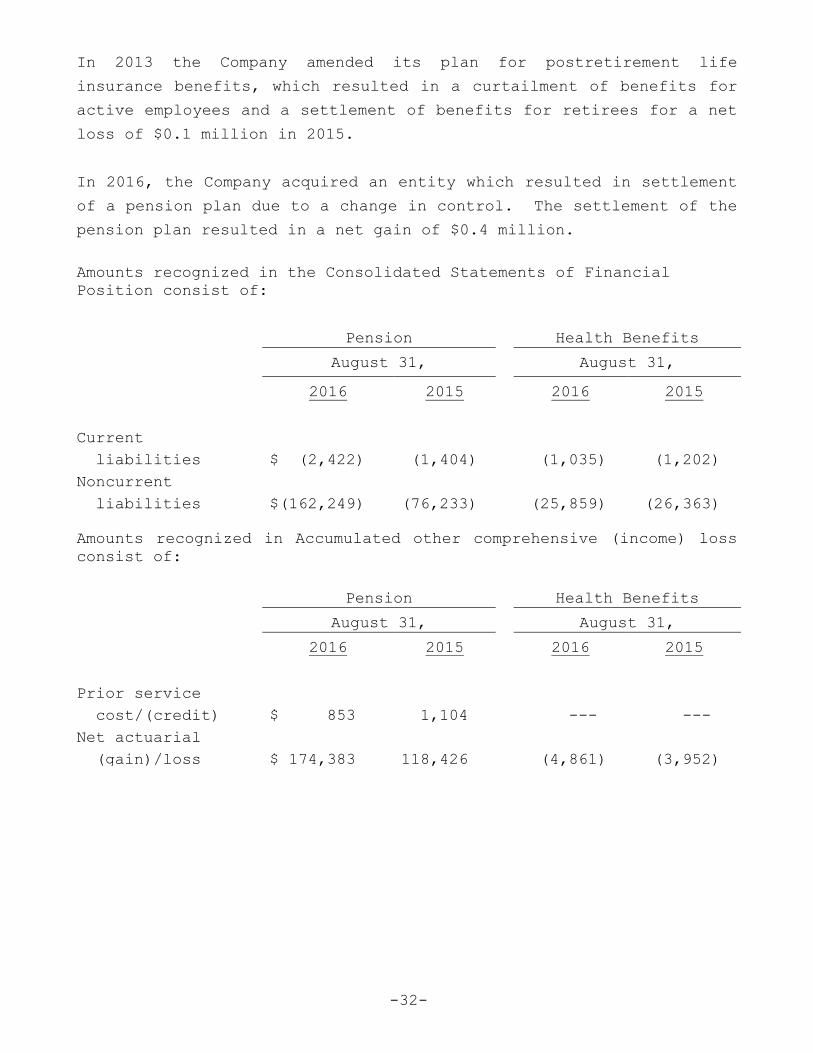
In 2013 the Company amended its plan for postretirement life
insurance benefits, which resulted in a curtailment of benefits for
active employees and a settlement of benefits for retirees for a net
loss of $0.1 million in 2015.
In 2016, the Company acquired an entity which resulted in settlement
of a pension plan due to a change in control. The settlement of the
pension plan resulted in a net gain of $0.4 million.
Amounts recognized in the Consolidated Statements of Financial
Position consist of:
Pension Health Benefits
August 31, August 31,
2016 2015 2016 2015
Current
liabilities $ (2,422) (1,404) (1,035) (1,202)
Noncurrent
liabilities $(162,249) (76,233) (25,859) (26,363)
Amounts recognized in Accumulated other comprehensive (income) loss
consist of:
Pension Health Benefits
August 31, August 31,
2016 2015 2016 2015
Prior service
cost/(credit) $ 853 1,104 --- ---
Net actuarial
(gain)/loss $ 174,383 118,426 (4,861) (3,952)
-33-
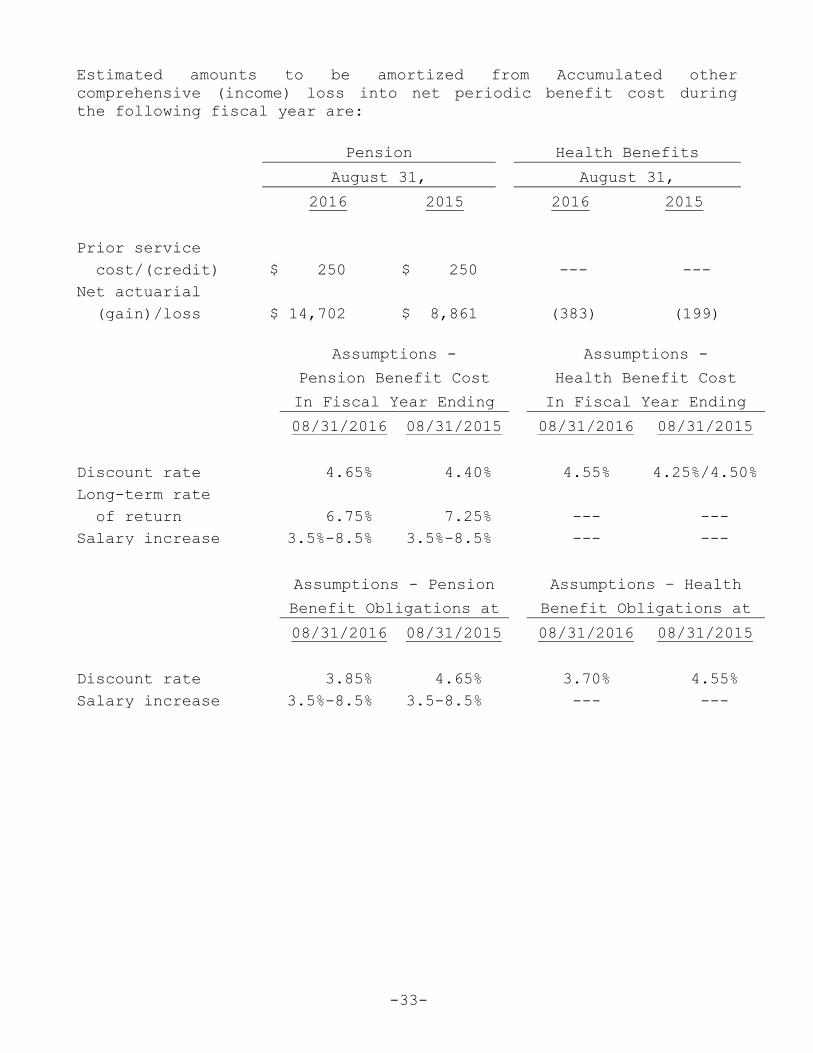
Estimated amounts to be amortized from Accumulated other
comprehensive (income) loss into net periodic benefit cost during
the following fiscal year are:
Pension Health Benefits
August 31, August 31,
2016 2015 2016 2015
Prior service
cost/(credit) $ 250 $ 250 --- ---
Net actuarial
(gain)/loss $ 14,702 $ 8,861 (383) (199)
Assumptions - Assumptions -
Pension Benefit Cost Health Benefit Cost
In Fiscal Year Ending In Fiscal Year Ending
08/31/2016 08/31/2015 08/31/2016 08/31/2015
Discount rate 4.65% 4.40% 4.55% 4.25%/4.50%
Long-term rate
of return 6.75% 7.25% --- ---
Salary increase 3.5%-8.5% 3.5%-8.5% --- ---
Assumptions - Pension Assumptions – Health
Benefit Obligations at Benefit Obligations at
08/31/2016 08/31/2015 08/31/2016 08/31/2015
Discount rate 3.85% 4.65% 3.70% 4.55%
Salary increase 3.5%-8.5% 3.5-8.5% --- ---
-34-
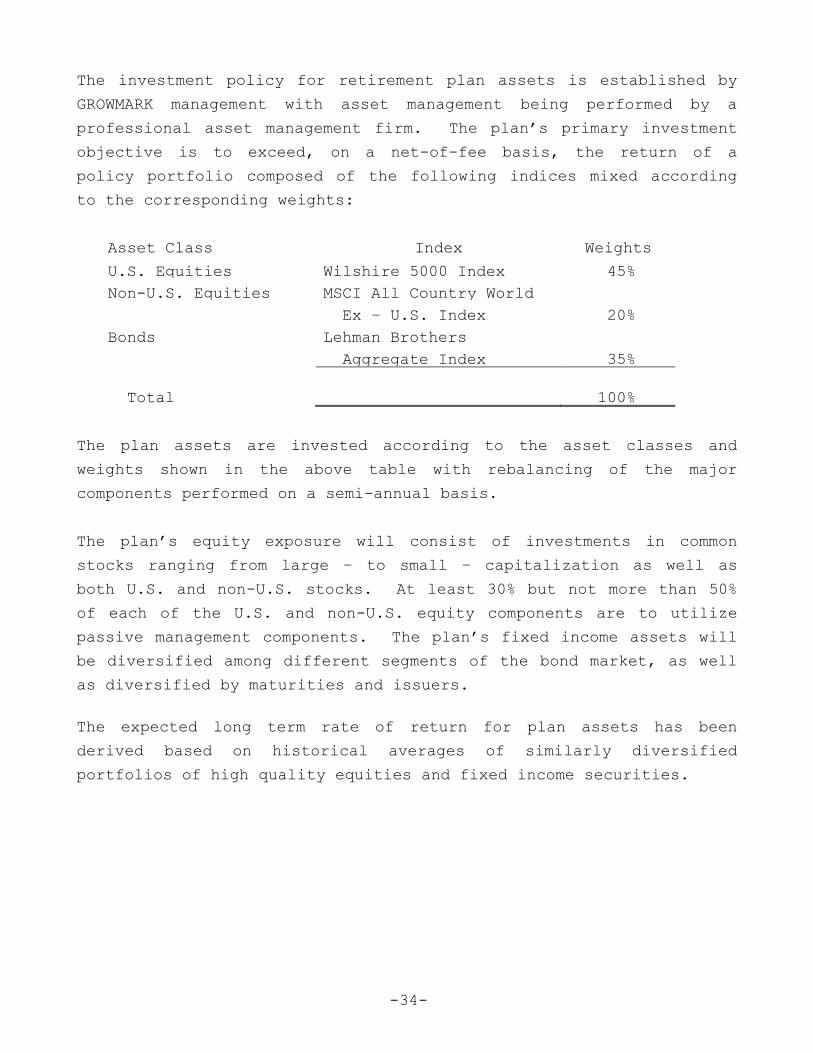
The investment policy for retirement plan assets is established by
GROWMARK management with asset management being performed by a
professional asset management firm. The plan’s primary investment
objective is to exceed, on a net-of-fee basis, the return of a
policy portfolio composed of the following indices mixed according
to the corresponding weights:
Asset Class Index Weights
(%) U.S. Equities Wilshire 5000 Index 45%
Non-U.S. Equities MSCI All Country World
Ex – U.S. Index 20%
Bonds Lehman Brothers
Aggregate Index 35%
Total 100%
The plan assets are invested according to the asset classes and
weights shown in the above table with rebalancing of the major
components performed on a semi-annual basis.
The plan’s equity exposure will consist of investments in common
stocks ranging from large – to small – capitalization as well as
both U.S. and non-U.S. stocks. At least 30% but not more than 50%
of each of the U.S. and non-U.S. equity components are to utilize
passive management components. The plan’s fixed income assets will
be diversified among different segments of the bond market, as well
as diversified by maturities and issuers.
The expected long term rate of return for plan assets has been
derived based on historical averages of similarly diversified
portfolios of high quality equities and fixed income securities.
-35-
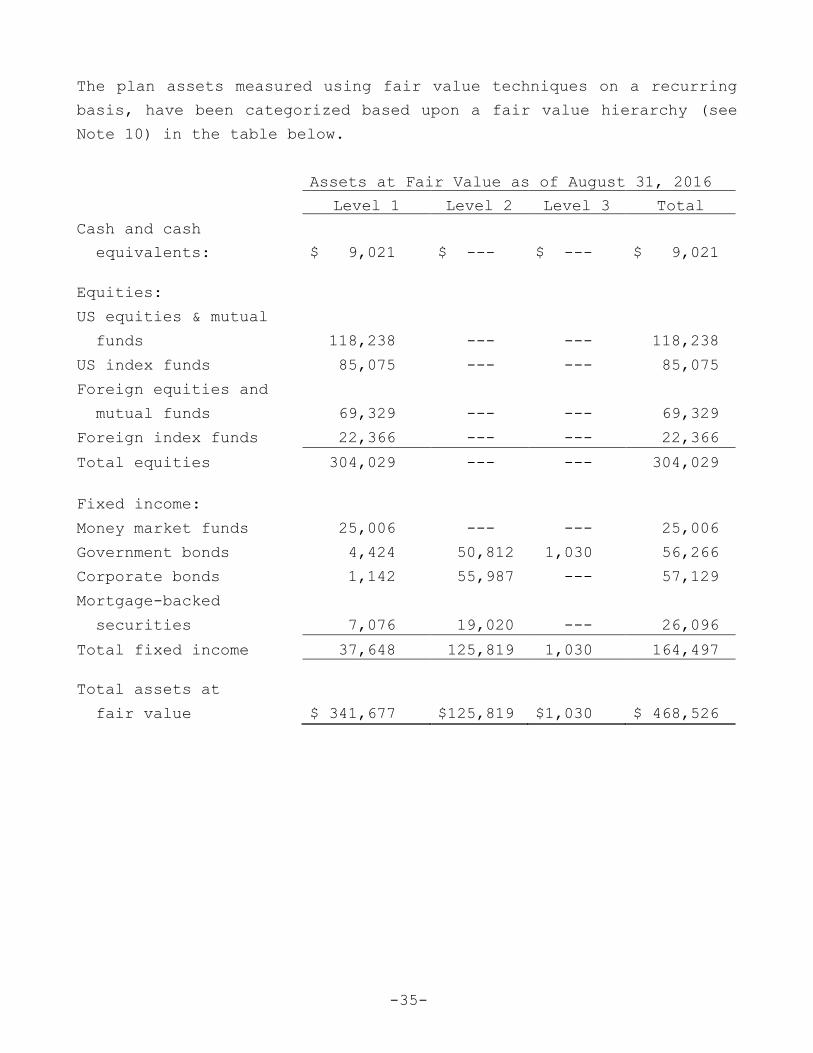
The plan assets measured using fair value techniques on a recurring
basis, have been categorized based upon a fair value hierarchy (see
Note 10) in the table below.
Assets at Fair Value as of August 31, 2016
Level 1 Level 2 Level 3 Total
Cash and cash
equivalents: $ 9,021 $ --- $ --- $ 9,021
Equities:
US equities & mutual
funds 118,238 --- --- 118,238
US index funds 85,075 --- --- 85,075
Foreign equities and
mutual funds 69,329 --- --- 69,329
Foreign index funds 22,366 --- --- 22,366
Total equities 304,029 --- --- 304,029
Fixed income:
Money market funds 25,006 --- --- 25,006
Government bonds 4,424 50,812 1,030 56,266
Corporate bonds 1,142 55,987 --- 57,129
Mortgage-backed
securities 7,076 19,020 --- 26,096
Total fixed income 37,648 125,819 1,030 164,497
Total assets at
fair value $ 341,677 $125,819 $1,030 $ 468,526
-36-
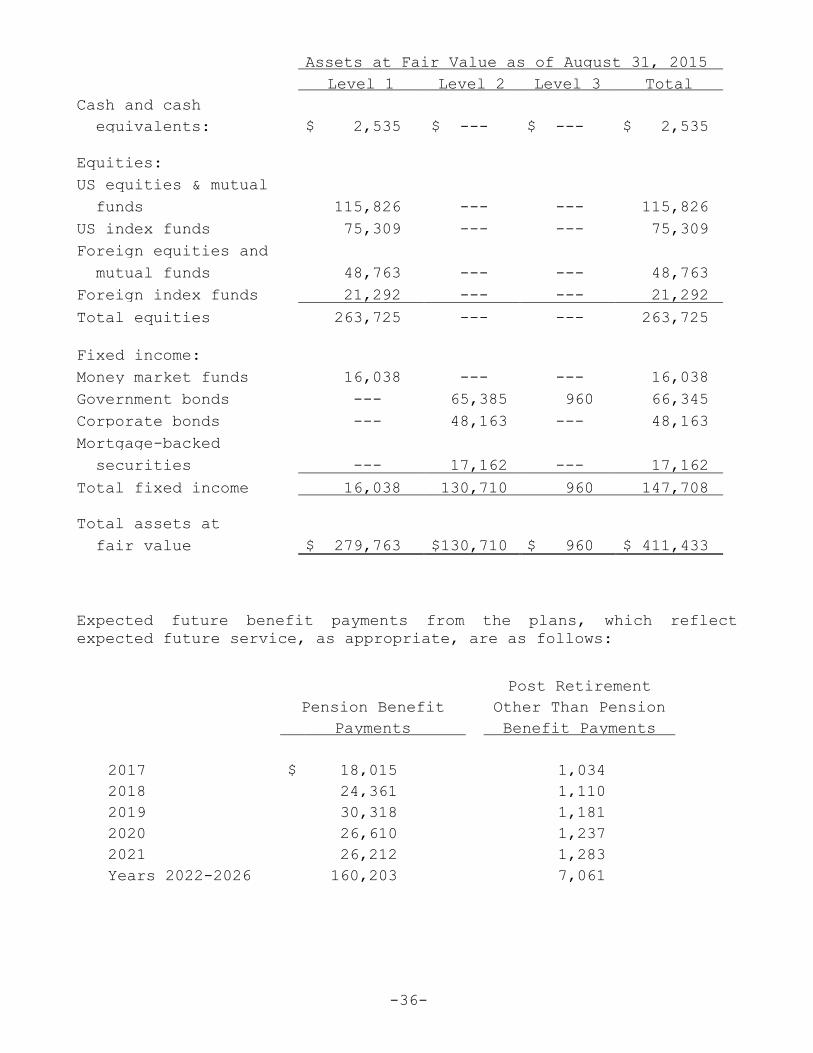
Assets at Fair Value as of August 31, 2015
Level 1 Level 2 Level 3 Total
Cash and cash
equivalents: $ 2,535 $ --- $ --- $ 2,535
Equities:
US equities & mutual
funds 115,826 --- --- 115,826
US index funds 75,309 --- --- 75,309
Foreign equities and
mutual funds 48,763 --- --- 48,763
Foreign index funds 21,292 --- --- 21,292
Total equities 263,725 --- --- 263,725
Fixed income:
Money market funds 16,038 --- --- 16,038
Government bonds --- 65,385 960 66,345
Corporate bonds --- 48,163 --- 48,163
Mortgage-backed
securities --- 17,162 --- 17,162
Total fixed income 16,038 130,710 960 147,708
Total assets at
fair value $ 279,763 $130,710 $ 960 $ 411,433
Expected future benefit payments from the plans, which reflect
expected future service, as appropriate, are as follows:
Post Retirement
Pension Benefit Other Than Pension
Payments
Pension Benefit
Payments
Benefit Payments
Other Than Pension
Benefit Payments
2017 $ 18,015 1,034
2018 24,361 1,110
2019 30,318 1,181
2020 26,610 1,237
2021 26,212 1,283
Years 2022-2026 160,203 7,061
-37-
The assumed annual rates of increase in the per capita cost of
covered medical benefits for retirees is 7.60% in 2016 and 8.20% in
2017. It is assumed by 2025 that rates will have changed to 4.50%.
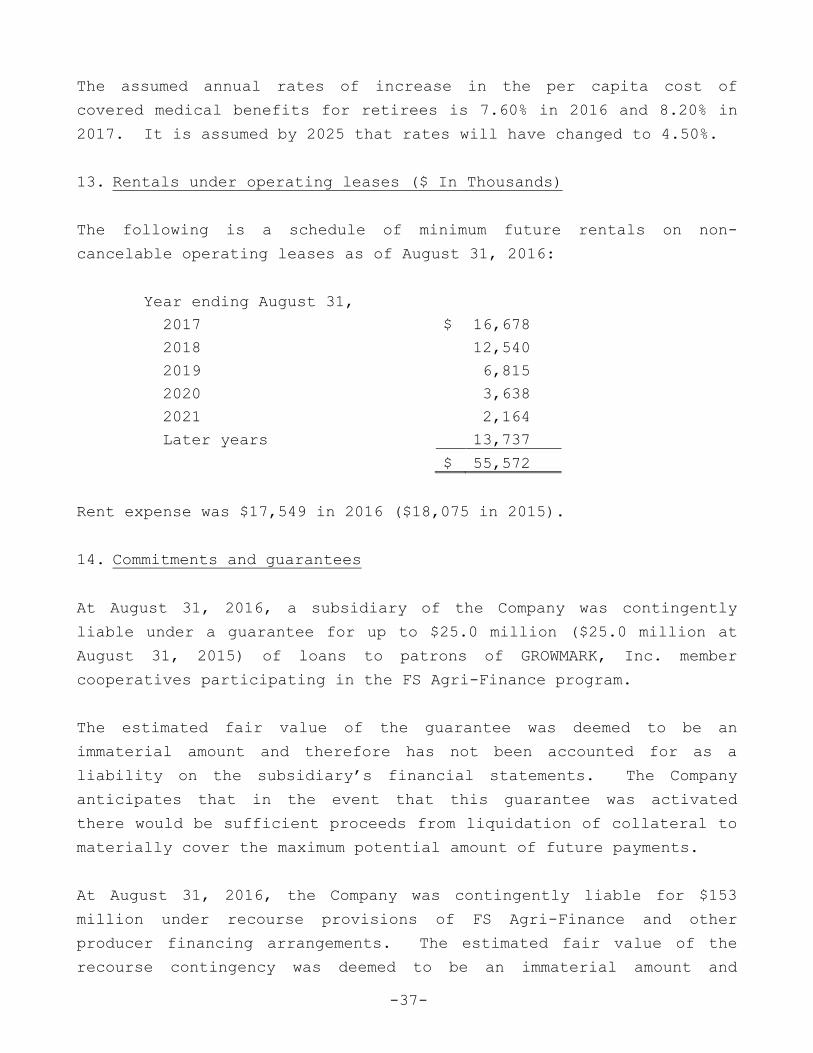
13. Rentals under operating leases ($ In Thousands)
The following is a schedule of minimum future rentals on non-
cancelable operating leases as of August 31, 2016:
Year ending August 31,
2017 $ 16,678
2018 12,540
2019 6,815
2020 3,638
2021 2,164
Later years 13,737
$ 55,572
Rent expense was $17,549 in 2016 ($18,075 in 2015).
14. Commitments and guarantees
At August 31, 2016, a subsidiary of the Company was contingently
liable under a guarantee for up to $25.0 million ($25.0 million at
August 31, 2015) of loans to patrons of GROWMARK, Inc. member
cooperatives participating in the FS Agri-Finance program.
The estimated fair value of the guarantee was deemed to be an
immaterial amount and therefore has not been accounted for as a
liability on the subsidiary’s financial statements. The Company
anticipates that in the event that this guarantee was activated
there would be sufficient proceeds from liquidation of collateral to
materially cover the maximum potential amount of future payments.
At August 31, 2016, the Company was contingently liable for $153
million under recourse provisions of FS Agri-Finance and other
producer financing arrangements. The estimated fair value of the
recourse contingency was deemed to be an immaterial amount and
-38-
therefore has not been accounted for as a liability on the Company’s
financial statements.
As part of the Company's overall risk management program the Company
self-insures for certain risk exposure situations. As part of this
program, a performance bond has been purchased from an insurance
company. As of August 31, 2016, the amount of the performance bond
coverage was $15.5 million ($15.5 million at August 31, 2015).
15. Other litigation and claims
The Company is involved as a defendant in various lawsuits, claims,
and disputes which are in the normal course of business. The
Company intends to vigorously defend itself against these actions
and proceedings. The Company believes the resolution of any such
matters will not have a material adverse impact on the consolidated
financial position of the Company.
16. Deconsolidation of Subsidiaries
On September 1, 2015, two of the Company’s subsidiaries, NORTHERN
GRAIN MARKETING, LLC, AND EASTERN GRAIN MARKETING, LLC, merged with
other grain businesses to form FS GRAIN, LLC. As a result of this
merger, the Company has a non-controlling ownership in FS GRAIN,
LLC. The two subsidiaries had combined assets of $69.9 million as
of August 31, 2015 and combined sales of $170.6 million for the year
ended August 31, 2015. The Company realized a gain of $6.2 million
upon the de-consolidation and related remeasurement at fair value of
the previously consolidated subsidiaries. The gain on
deconsolidation is included in the line item “Other income – net” in
the Consolidated Statement of Operations for the year ended August
31, 2016.
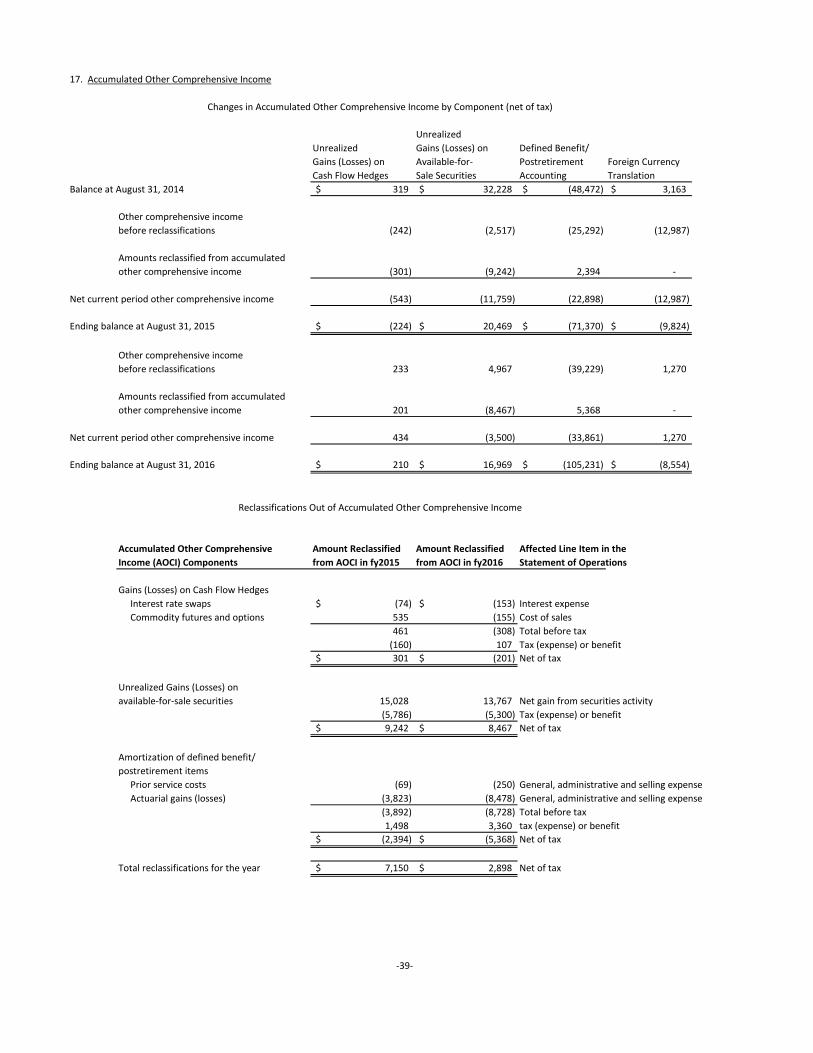
17. Accumulated Other Comprehensive Income
Unrealized
Unrealized Gains (Losses) on Defined Benefit/
Gains (Losses) on Available-for- Postretirement Foreign Currency
Cash Flow Hedges Sale Securities Accounting Translation
Balance at August 31, 2014 319$ 32,228$ (48,472)$ 3,163$
Other comprehensive income
before reclassifications (242) (2,517) (25,292) (12,987)
Amounts reclassified from accumulated
other comprehensive income (301) (9,242) 2,394 -
Net current period other comprehensive income (543) (11,759) (22,898) (12,987)
Ending balance at August 31, 2015 (224)$ 20,469$ (71,370)$ (9,824)$
Other comprehensive income
before reclassifications 233 4,967 (39,229) 1,270
Amounts reclassified from accumulated
other comprehensive income 201 (8,467) 5,368 -
Net current period other comprehensive income 434 (3,500) (33,861) 1,270
Ending balance at August 31, 2016 210$ 16,969$ (105,231)$ (8,554)$
Accumulated Other Comprehensive Amount Reclassified Amount Reclassified Affected Line Item in the
Income (AOCI) Components from AOCI in fy2015 from AOCI in fy2016 Statement of Operations
Gains (Losses) on Cash Flow Hedges
Interest rate swaps (74)$ (153)$ Interest expense
Commodity futures and options 535 (155) Cost of sales
461 (308) Total before tax
(160) 107 Tax (expense) or benefit
301$ (201)$ Net of tax
Unrealized Gains (Losses) on
available-for-sale securities 15,028 13,767 Net gain from securities activity
(5,786) (5,300) Tax (expense) or benefit
9,242$ 8,467$ Net of tax
Amortization of defined benefit/
postretirement items
Prior service costs (69) (250) General, administrative and selling expense
Actuarial gains (losses) (3,823) (8,478) General, administrative and selling expense
(3,892) (8,728) Total before tax
1,498 3,360 tax (expense) or benefit
(2,394)$ (5,368)$ Net of tax
Total reclassifications for the year 7,150$ 2,898$ Net of tax
Changes in Accumulated Other Comprehensive Income by Component (net of tax)
Reclassifications Out of Accumulated Other Comprehensive Income
-39-