growth and development intrauterine growth and nutrient accretion body composition growth assessment...
TRANSCRIPT

Growth and Development
Intrauterine growth and nutrient accretion
Body Composition Growth Assessment
Growth Charts Patterns Alterations in Growth
Development Metabolic Physiologic neurologic

Growth
Growth
A normal, healthy child grows at a genetically predetermined rate that can be compromised by imbalanced nutrient intake

Growth
Growth is a dynamic process defined as an increase in the physical size of the body as a whole or any of its parts associated with increase in cell number and/or cell size
Reflects changes in absolute size, mass, body composition
Undernutrition
⇩⇩ weight ⇒⇒⇩length or height Underweight ⇒⇒ proportionate

Fetal Growth from 25-40 weeks GA
Weight increases 4-fold Length and OFC increase 2-fold

Body Composition Fat accounts for 0.5% of body weight
at the fifth month of fetal growth and 16% at term.
3rd trimester: increase from 1-3% of body weight to 10-16% of body weight at term

Minerals
Two-thirds of mineral content of full-term newborn is accummulated in the last trimester of pregnancy.

Age-related changes in body composition. (Reprinted by permission ofMosby Year Book. Heird WC, Driscoll JM, Schullinger JN, et al.Intravenous alimentation in pediatric patients. J Pediatr 80:351, 1972.)
Energy Reserves
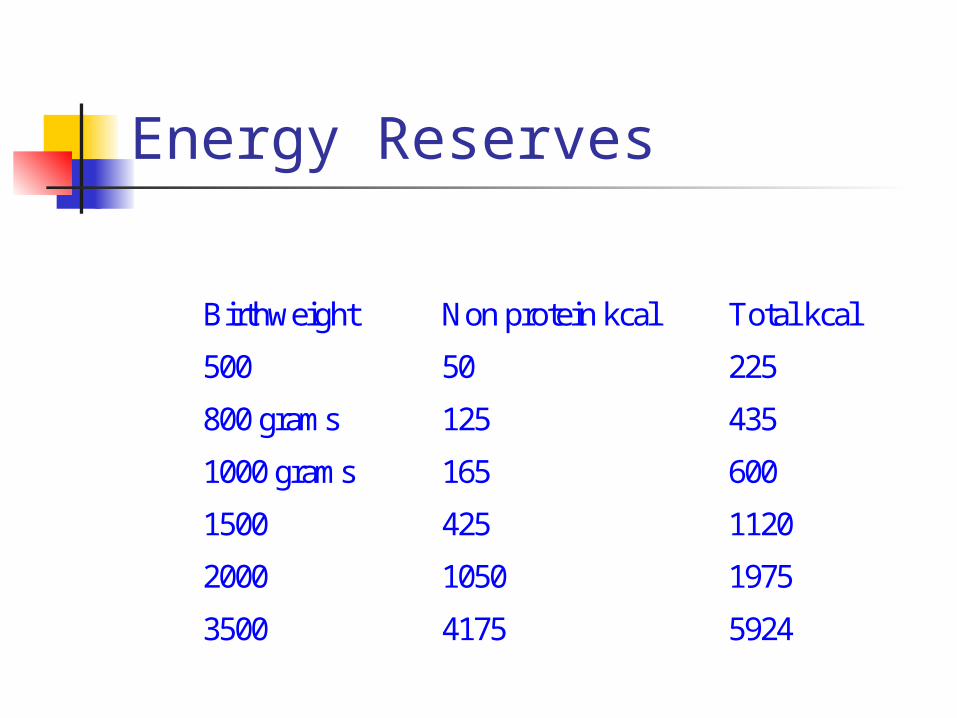
Birthweight Non protein kcal Total kcal
500 50 225
800 grams 125 435
1000 grams 165 600
1500 425 1120
2000 1050 1975
3500 4175 5924

Determinants of fetal growth
Genetics Maternal/paternal genes, race, sex
estimated to account for 20% of variance in birth weight
Environmental factors

Environmental factors Maternal health Nutrition
Glucose, fatty acids, amino acids for tissue deposition and fuel for oxidative purposes
Ability of maternal-placental system to transfer nutrients to fetus
Endocrine environment E.g. LGA infant:
glucose-insulin-growth factors

Individual Growth Patterns
Weight and length at term appear to be primarily determined by nongenetic maternal factors
Birth weigh and birth length weakly correlate with subsequent weight and length values
Individual Growth Patterns, cont.
African American males and females are smaller than whites at birth, but they grow more rapidly during the first 2 years
Patterns of growth in breastfed infants are different from formula fed infants

GROWTH IN FIRST 12 MONTHS From birth to 1 year of age, normal human
infants triple their weight and increase their length by 50%.
Growth in the first 4 months of life is the fastest of the whole lifespan - birthweight usually doubles by 4 months
4-8 months is a time of transition to slower growth
By 8 months growth patterns more like those of 2 year old than those of newborn.

Body Composition BMI and percentage of body weight
made up of fat increase rapidly during the first months of life After birth, fat accumulates rapidly
until approximately 9 months of age

Weight Gain in Grams per Day in One Month Increments - Girls
Age 10th
percentile50th
percentile90th
percentileUp to 1month
16 26 36
1-2months
20 29 39
2-3months
14 23 32
4-5months
13 16 20
5-6months
11 14 18
Guo et al., J Peds. 1991

Weight Gain in Grams per Day in One Month Increments - Boys
Age 10th
percentile50th
percentile90th
percentileUp to 1month
18 30 42
1-2months
25 35 46
2-3months
18 26 36
3-4months
16 20 24
4-5months
14 17 21
5-6months
12 15 19
Guo et al., J Peds. 1991

Weight gain of Breast fed vs bottle fedinfants: 8-112 days of age (g/d)
Breast fed Bottle fed
Male 29.8 + 5.8 32.2 + 5.6
Female 26.2 + 5.6 27.5 + 4.9
Nelson et al Early Human Development 19:223 1989

Rates of gain for breastfed and formula fed infants during early months of life generally have been found to be similar although some reports have demonstrated greater gains by breastfed infants and others have shown greater gains by formula fed infants

Assessment
Screening identifies nutritional risk and/or need for further assessment. Underweight Overweight Failure to grow “over fat”

Reference vs Standard
Reference: a set of data used for normalizing measurements so that they can be manipulated statistically, grouped and compared with other sets of measurements. In principle, implies no value judgement and tells us nothing about optimal or satisfactory growth
Standard: Implies a value judgement. In theory, standards are selected based on representing “optimal”, “normal” or “goal”

Fetal/Neonatal Growth Charts
Intrauterine charts Classification of newborn
AGA LGA SGA
Postnatal Charts

Intrauterine/Fetal Growth Standards
Lubchenco Gairdner Babson Benda Fenton Olsen

Fetal Growth DataFetal Growth Data
Location/date characteristics Number of subjects
Lubchenco Denver 1958-61 High altitude, white/hispanic, Low SEC
5635
Fenton 3 IU data sets * Kramer * Niklasson * BeebyCDC data.
Olsen 33 US states 1998-2006
Racially diverse 257,855

Fenton Chart
Data Sets: Kramer et al: 676,605 infants 22-43 weeks Nicholson et al : 376,000 Swedish infants
28-40 weeks Breeby et al: OFC (N=29090) and Length
(N=26,973) 22-40 weeks CDC Data
Time period 1963-2001

Postnatal Growth Charts
Accounts for initial weight loss Dancis: Data 1948, very small
sample size in lowest weight group Ehrenkranz: Pediatrics 1999:104:280
N=1660 14-16 g/kg/d weight gain 0.9 cm/week increase length 0.35 cm/week increase OFC

Infant Growth References
A variety of growth references were developed and and used
in the U.S. since the early 1900’s

Growth references: timeline Stuart/Meredith Growth
Charts (1946-76) Caucasian, Boston/Iowa
city, small sample size NCHS growth charts (1976-
1978) Cross sectional Data from
NHES, NHANES, and FELs CDC produced normalized
version 1978 WHO recommended
international use
CDC (2000) 5 cross sectional nationally
representative surveys between 1963-1995
Included more breast fed infants
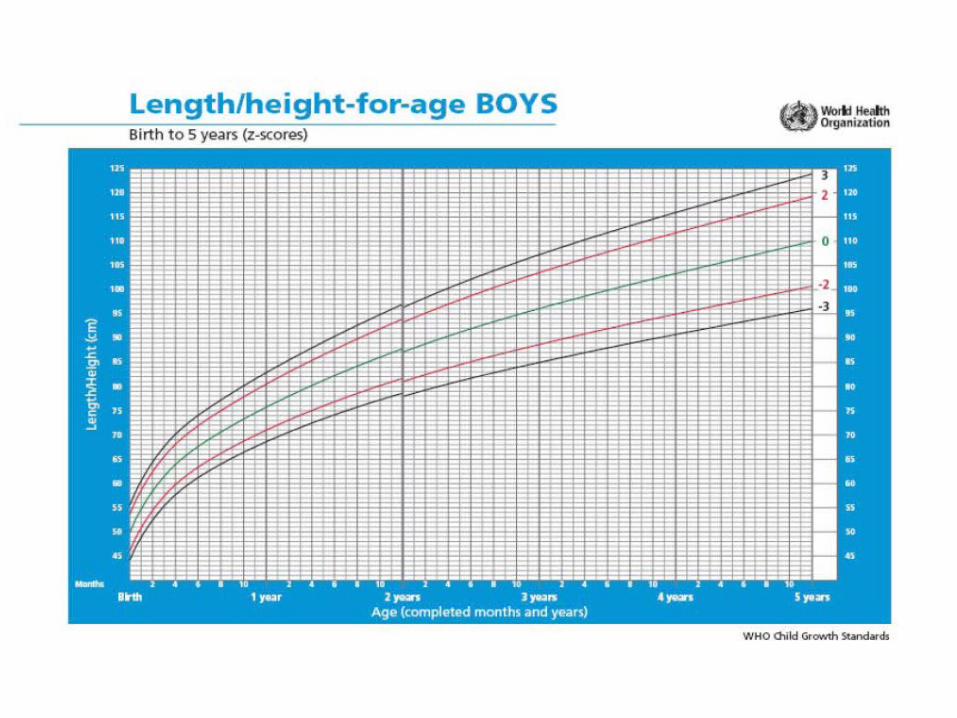
WHO (2006) Data from Brazil, Ghana,
India, Norway, Oman and USA
Multiethnic, affluent Exclusive breastfeeding to 4
months Solids according to
recommendations 6 months Continued breastfeeding to
12 months

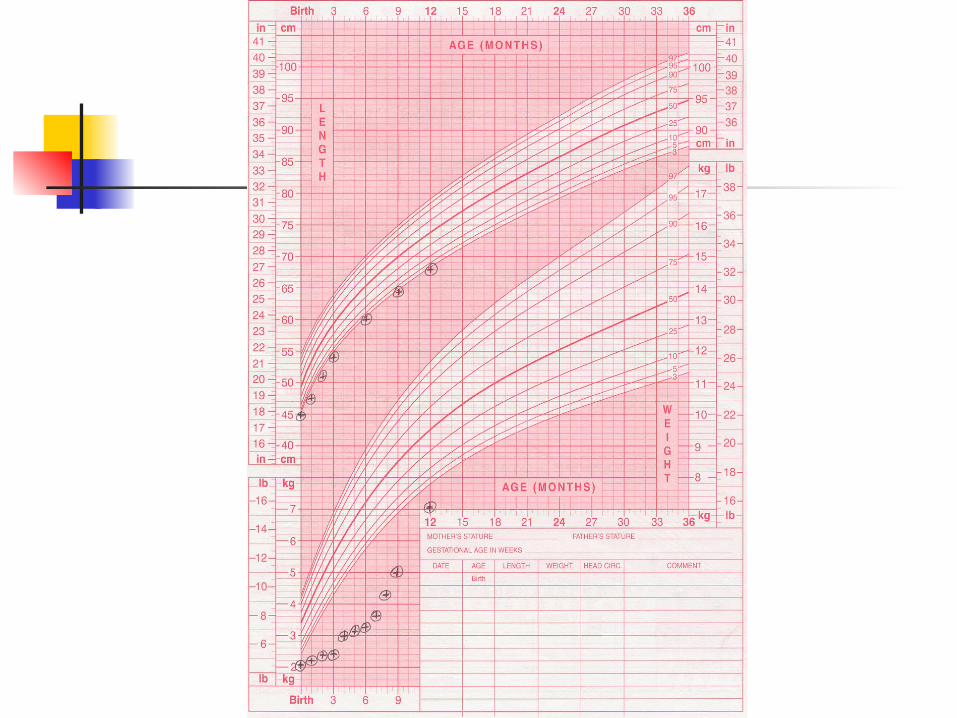
Growth Charts
CDC/NCHS http://www.cdc.gov/growthcharts/
World Health Organization http://www.who.int/childgrowth/en

NCHS growth charts: Concerns Infant data: Fels study
Primarily formula fed Underrepresented groups: largely
caucasian, middle class Intervals of measurements (q3
months from 3-36 months) may not define dynamic patterns during rapid growth phases
Statistical smoothing proceedures

CDC Growth Charts (compared to older NCHS
Standardized data collection methods
Expanded sample More breastfed infants Exclusions
VLBW infants NHANES III weight data for >6 year
olds

CDC/NCHS Growth Charts
Clinical charts for infancy for girls and boys: weight length weight for length OFC
Choice between outer limits at 3rd and 97th or 5th and 95th percentiles

WHO Child Growth Standards
Released new growth standards April 2006 Assumed that infants and children
between birth and 5 years grow similarly when needs are met.
Concerns for CDC charts included: Frequency of growth measures during
dynamic periods of infant growth Statistical methods

Standard vs Reference Released new growth
standards April 2006 Assumed infants and
children grow similarly when needs are met.
Concerns for CDC charts included:
Frequency of growth measures during dynamic periods of infant growth
WHO growth charts
Full term low birthweight infants not excluded
Birth to 2 years N 1743 ----- 882
2-5 years N 6669


WHO v.s. CDC
Infancy WHO mean > CDC mean birth-6
months “healthy breastfed infants track
weight/age along WHO but falter on CDC”
Cross at 6 months and WHO mean < 6months

WHO v.s. CDC CDC
Heavier, shorter WHO
taller WHO
Higher estimates of overweight Lower estimates of underweight,
undernutrition


CDC Recommends use of WHO growth standard
2006 convened expert panel of NIH and AAP to review scientific evidence and use of WHO growth charts in clinical US settting
September 2010 recommended use of WHO charts for infants birth to 2 years

CDC Recommendations for infant growth charts http://www.cdc.gov/growthcharts Use WHO charts from birth-24 months CDC charts for > 24 months As a screen, 3rd and 97th percentile on
WHO corresponds to 5th-95th on CDC Clinicians should be aware that fewer
individuals will be screened as “underweight” and more as “overweight” using WHO
Controversies/Issues Screen vs assessment Standard vs reference Typical vs ideal growth Environmental influence Variety of diets may result in acceptable
growth and nutrition status Normal population divesity Plot individuals on both CDC and WHO.
Does your assement change? Absolute size vs pattern

Alterations in Growth
SGA LGA Preterm birth Failure to grow (FTG)

SGA Infant < 10th percentile
Symmetric vs asymmetric
Not a part of natural diversity or genetically determined
Placental insufficiency limiting nutrient supply to fetus

SGA Infant Etiology Programing Timing Body
Composition Cell number Cell size LBM vs. adiposity BMC
Increased BMR Impaired
gluconeogenesis Risk for
hypoglycemia Risk for iron
deficiency anemia Risk for adult
onset diseases

LGA Infant > 90th percentile Not part of
natural diversity or genetically determined
Macrosomic, increased adiposity vs proportionate

Preterm Birth

Extra uterine Growth Restriction
Extra uterine growth restriction refers to the development of severe nutrient deficits in premature infants during hospitalization
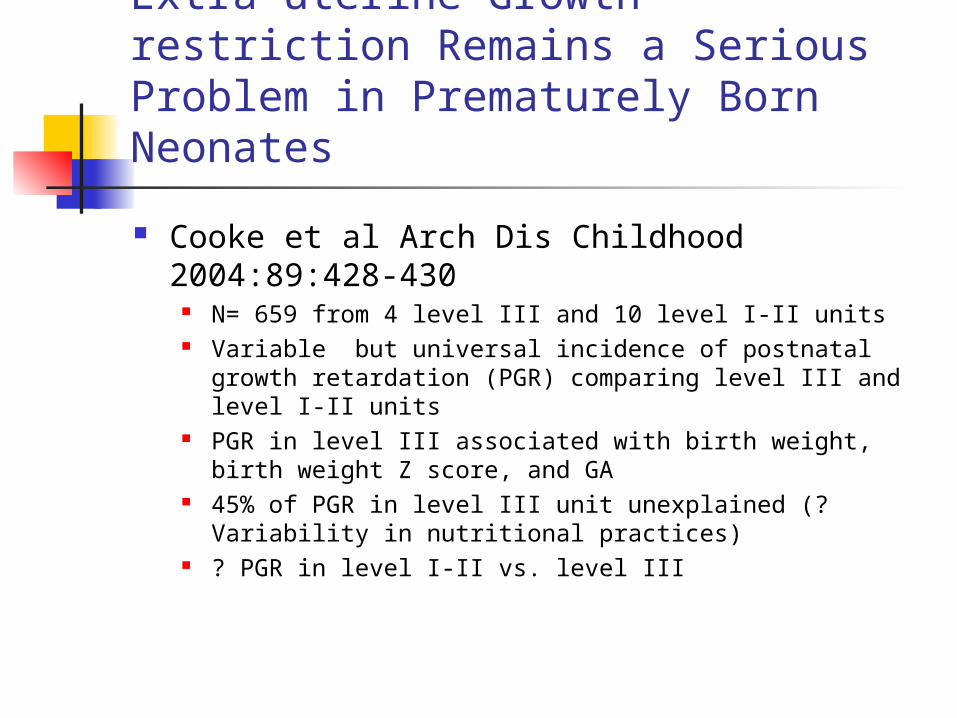
Extra uterine Growth restriction Remains a Serious Problem in Prematurely Born Neonates
Cooke et al Arch Dis Childhood 2004:89:428-430
N= 659 from 4 level III and 10 level I-II units Variable but universal incidence of postnatal growth
retardation (PGR) comparing level III and level I-II units PGR in level III associated with birth weight, birth weight Z
score, and GA 45% of PGR in level III unit unexplained (? Variability in
nutritional practices) ? PGR in level I-II vs. level III

Extra uterine Growth restriction Remains a Serious Problem in Prematurely Born Neonates
Clark: Pediatr 2003 N=24,371 from 124 NICUs 1997-2000 Estimated based on growth <10th percentile at
discharge Estimates:
Wt: 28% Lngth: 34% OFC: 16%

Extra uterine Growth Restriction
NICHD Neonatal morbidity Research network 16% ELBW infants are SGA at birth At 36 weeks CA 89% demonstrate
growth failure Follow up at 18-22 months show 40%
with weight, length, OFC <10%

Development

In utero
Fetal GI tract is exposed to constant passage of fluid that contains a range of physiologically active factors: growth factors hormones enzymes immunoglobulins
These play a role in mucosal differentiation and GI development as well as development of swallowing and intestinal motility

At Birth
Gut of the newborn is faced with the formidable task of passing, digesting, and absorbing large quantities of intermittent boluses of milk
Comparable feeds per body weight for adults would be 15 to 20 L

Gastrointestinal Maturation
Reference Josef Neu, Gastrointestinal Maturation and
implications for infant feeding, Early Human Development 2007 83 (767-775)
Neonatal Gastroenterology, Clinics in Perinatology June 1996 23:2
Weaver and Lucas Development of Gastrointestinal Structure and Function, Chapter 3 in Neonatal Nutrition and Metabolism ed Hay Mosby 1991
Nutrition and Metabolism of the Micropremie in Clinics in Perinatology March 2000n 27:1

Gastrointestinal Maturation
Intestinal length increase 1000X from 5-40 weeks, doubles in the last 15 weeks.
Villi formed at 16 weeks Fetus begins to swallow around 16
weeks by 2nd trimester is swallowing as frequently as every 45 minutes. By term, the fetus ingests approximately 300 ml/d

GI development Weeks GA
Esophagus Superficial glandsSquamous cells
2028
Stomach Gastric glandsPylorus and fundus defined
1414
Small intestine Crypt and villusLymph nodesPeptides and hormonesNeurotransmittersMyenteric plexus
1414141214
Colon Diameter decreasesVilli disappear
2020
Pancreas Differentiation of exocrine and endocrine tissue
14
Liver Lobule formation 11

Maternal-fetal-placenta Interaction Individual metabolism
Glucose, amino acids, and fatty acids primary nutrients for tissue deposition and oxidative fuel
Hormonal regulation Not well understood Main hormones are placentally produced Insulin like growth factors induce cell proliferation and DNA,
increase glucose and amino acid uptake, and inhibit protein breakdown
Placental growth hormone stimulates IGF and is reduced in IUGR ? Leptin. Associated with fetal weight, fetal BMI, and fetal
fat mass

Carbohydrate Metabolism
Fetus Glucose and lactate
Glucose from maternal circulation via facilitated diffusion At birth, plasma glucose concentration about 2/3 maternal Used for oxidative fuel and source of carbon for glycogen
and other organic compounds Understress fetus can produce glucose with gluconeogenic
enzymes present at 10 weeks (but primarily maintained by maternal supply
hi

CHO: Term Infant
Enzyme origin substrate Activity in newborn
amylase Salivary glandsPancreasHuman milk
Starch/glucose polymers
ModerateAbsent<6moshigh
Glucoamylase Intestine Glucose polymers
high
Sucrase-isomaltase
Intestine High
Lactase Intestine Lactose high

CHO: Lactase
Lactase activity is highest in infancy (term) Term Infants
Lactase 30% of adult. Stimulated with first feeds
Preterm infants: Lactase levels remain low <36 weeks 30-40% NB levels Breath hydrogen tests confirm inefficient
digestion of lactose

CHO: Glucoamylase
Primarily responsible for starce digestion in youn infants (<3 months)
Glucoamylase activity increases during 3rd trimester
Adult levels reached by 12 months

CHO: Pancreatic Amylase
Pancreatic Amylase primarily responsible for complex starch digestion
Pancreatic amylase begins to increase after birth but may take up to 3 months before significant rise
Adult levels may not be reached until after 12 months of age
CHO
At birth Catoecholamines, thyroxin, and
glucagon increase and falling glucose levels stimulate glu-6-phosphatase
Glycogenolysis and hepatic glucose output are thus stimulated

Protein
Source of amino acids for protein synthesis
Release of bioactive peptides that contribute to regulation of many physiologic functions including metabolism, immunity, blood pressure, GI function, and food intake (eg CCK, GLP-1, glucagon, insulin)

Protein Metabolism
Fetus requires protein for protein synthesis and the provision of energy
Maternal-fetal amino acid transfer is a complex process involving several sodium dependent transfer proteins. Intracellular and extracellular sodium gradient provides driving force
Fetal amino acid profile differs from neonate

Protein
Elevated levels of amino acids and products of protein metabolism may exceed renal and hepatic capacity to excrete excess nitrogen with resulting acidosis, hyperammonemia, elevated BUN, diarhea.
Potential consequences: neurodevelopmental, stimulation of insulin and IGF-1, which can enhance growth, adipogenic activity and may be linked to later obesity

Protein
Digested in upper intestine via pancreatic proteases. Most of the brush border and cytosolic peptidases are well developed in the preterm infant and peptide transport system is efficient.
Macromolucules can be actively taken up by pinocytosis and preterm infants have demonstrated to capability to absorb lactoferrin. Preterm infants have increased intestinal permeability

Whey proteins induce fast but transient increase in plasma amino acids. Concentrations peak at 1-2 hours and return to baseline after 3-4 hours
Casein proteins are associated with slow gastric emptying, a slower and reduced rise in plasma amino acids and inhibit whole body protein breakdown

Lipid Metabolism
Fetus Fetus requires large amounts of lipids
particularly within developing nervous system (DHA, ARA)
Fetus acquires lipid via maternal placental transfer and capable of synthesizing cholesterol and fatty acids
Transfer impacted by maternal FA profile Dependent on maternal supply for EFA

Lipid:Term
Lipase Cofactors Substrate Contribution to fat digestion
Gastric lipase None TG Moderate to high
Pancreas Colipase and bile salts
TG low
Carboxylesterlipase
Bile salts TG Unknown to high
Pancreatic lipase
Phospholipids and TG
unknown
Milk bile salt dependent lipase
Bile salts TG Moderate to high

Preterm
Bile acids and lipases limited Approx 30% newborn levels 24-36
weeks

Renal
Limited ability to concentrate urine in first year due to immaturities of nephron and pituitary
Potential Renal solute load determined by nitrogenous end products of protein metabolism, sodium, potassium, phosphorus, and chloride.

Urine Concentrations
Most normal adults are able to achieve urine concentrations of 1300 to 1400 mOsm/l
Healthy newborns may be able to concentrate to 900-1100 mOsm/l, but isotonic urine of 280-310 mOsm/l is the goal
In most cases this is not a concern, but may become one if infant has fever, high environmental temperatures, or diarrhea

Postnatal Acquisition of Intestinal Microbiome Following birth the
sterile newborn GI tract colonized by environmental microorganisms
State of mutualism (microbiome) role in health, growth, development.

Postnatal Acquisition of Intestinal Microbiome Systemic and
mucosal immune fx of NB differs from adult
Fetal immune system evolved to avoid maternal rejection vs process pathogens

Microbiome
NB must undergo extensive postnatal development of which the acquisition of GI microbiome is major determinant of early immune system
Role of breastmilk: establishment of symbiotic core microbiome

Development of Infant Feeding Skills Birth
tongue is disproportionately large in comparison with the lower jaw: fills the oral cavity
lower jaw is moved back relative to the upper jaw, which protrudes over the lower by approximately 2 mm.
tongue tip lies between the upper and lower jaws.
"fat pad" in each of the cheeks: serves as prop for the muscles in the cheek, maintaining rigidity of the cheeks during suckling.
feeding pattern described as “suckling”

Developmental Changes Oral cavity enlarges and tongue fills up less Tongue grows differentially at the tip and
attains motility in the larger oral cavity. Elongated tongue can be protruded to receive
and pass solids between the gum pads and erupting teeth for mastication.
Mature feeding is characterized by separate
movements of the lip, tongue, and gum pads or teeth

Development Neurophysiologic
Homeostasis Attachment Separation and
individuation Oral Motor

Stages of Development
Homeostasis Attachment Separation and individuation

Stages
Age Development
1-3 months Homeostasis * State regulation* Neurophysiologic stability
2-6 months Attachment * “falling in love”* Affective engagement and interaction
6-36 months
Separation and individuation
* Differentiation* Behavioral organization and control

Feeding behavior of infants Gessell A, Ilg FL
Age Reflexes Oral, Fine, Gross Motor Development1-3months
Rooting and suckand swallowreflexes arepresent at birth
Head control is poorSecures milk with suckling pattern, the tongue projectingduring a swallowBy the end of the third month, head control is developed
4-6months
Rooting reflexfadesBite reflex fades
Changes from a suckling pattern to a mature suck withliquidsSucking strength increasesMunching pattern beginsGrasps with a palmer graspGrasps, brings objects to mouth and bites them
7-9months
Gag reflex is lessstrong as chewingof solids beginsand normal gag isdevelopingChoking reflexcan be inhibited
Munching movements begin when solid foods are eatenRotary chewing beginsSits aloneHas power of voluntary release and resecuralHolds bottle aloneDevelops an inferior pincer grasp
10-12months
Bites nipples, spoons, and crunchy foodsGrasps bottle and foods and brings them to the mouthCan drink from a cup that is heldTongue is used to lick food morsels off the lower lipFinger feeds with a refined pincer grasp

Infant feeding and Growth
Goals Expectations Considerations