growth and dispersion of accountable care organizations in 2015 · 2015-10-26 · growth and...
TRANSCRIPT

Growth and Dispersion of Accountable Care
Organizations in 2015


Growth and Dispersion of Accountable Care Organizations in 2015
by David Muhlestein
March 31st, 2015
1G r o w t h a n d D i s p e r s i o n o f A c c o u n t a b l e C a r e O r g a n i z a t i o n s i n 2 0 1 5
In January, an additional 89 provider organizations joined the Medicare Shared Savings Program (MSSP) as accountable care organizations (ACOs). While this year’s new entrants are a smaller cohort than those that joined in 2013 and 2014, they represent a continuation of the expansion of the accountable care movement.
The recent Department of Health and Human Services (HHS) announcement of its goal to move 50 percent of Medicare payments to alternative payment models (including ACO-based arrangements) indicates the government’s strong backing of the model and, coupled with continuing endorsement of the approach from state Medicaid programs and commercial insurers, there is strong support for this care delivery approach to continue.
In an ACO, health care providers accept responsibility for the cost and quality of care for a defined population. Each ACO’s laudable goal is to achieve what Don Berwick has called the “triple aim” — to improve quality, increase patient satisfaction, and lower costs. The key to reaching those goals is to change how providers are paid, based on reaching certain cost and quality benchmarks. In effect, the objective is to change incentives so that it is in providers’ best interest to maximize health, rather than focus on increasing the volume of services rendered.
A C O G R O W T H
Leavitt Partners has been actively tracking ACOs since 2010, maintaining a database that is updated regularly from publicly available information and personal and industry interviews. Over the past year, approximately 120 organizations have become ACOs in public and private programs, bringing the total to 744 since 2011 (Figure 1). The historical ACO growth data shown in Figure 1 are slightly different from our past estimates, as they are now based on the start date of the ACO’s contract, not on when the ACO was announced.
For example, the 89 ACOs announced in December 2014 are listed as beginning in January 2015, which is the start of their contract. Regardless of how many contracts an ACO is engaged in, both public and private, an ACO is counted only once. Note that some of the new Medicare Shared Savings Program participants already had commercial contracts, and are thus tracked beginning at the start of their first contract.
In addition to growth in the total number of ACOs, there has been continued growth in the number of people covered by ACO arrangements. Since the start of 2014, an estimated 4.5 million more people have been included in accountable care arrangements, bringing the total to 23.5 million covered ACO lives (Figure 2). Of these, only 7.8 million are part of the Medicare ACO programs (Pioneer and Medicare Shared Savings Program), meaning that the majority of ACO volume is coming from the commercial and Medicaid sectors.

ACO Dispersion
The geographic distribution of ACOs has continued to expand as ACOs have begun to form in more markets and to expand within markets. Accountable care organizations exist in all 50 states, Washington, D.C., and Puerto Rico, with the number of ACOs strongly correlated with the population (rs=.895, p<.001). California has the most ACOs with 81, followed by Florida with 66 and Texas with 48.
When evaluating ACOs at the Hospital Referral Region (HRR) level, there is still a strong correlation between ACO prevalence and population, though the relationship is not as strong (rs=.645, p<.001). ACOs now exist in 272 of the 306 HRRs and Puerto Rico. Figures 3 and 4 show counts of ACOs by state and by Hospital Referral Region, respectively. It is important to note that there are still many regions of the country where there is negligible ACO activity.
2 L e a v i t t P a r t n e r s
G r o w t h a n d D i s p e r s i o n o f A c c o u n t a b l e C a r e O r g a n i z a t i o n s i n 2 0 1 5
Figure 1. Total Public and Private Accountable Care Organizations, 2011 to January 2015
Figure 2. Number of ACO Covered Lives, 2011 to January 2015
Source: Leavitt Partners Center for Accountable Care Intelligence
Source: Leavitt Partners Center for Accountable Care Intelligence

Looking at the market penetration of ACOs is a different story, as high population centers may have high numbers of ACOs, but relatively low total penetration of ACO enrollment as a percentage of state population. Figures 5 and 6 show the estimated percent of the entire population within a state or Hospital Referral Region that is covered by an ACO. Market penetration is highest in markets where there are multiple providers participating in ACOs, such as in Oregon, which has moved its Medicaid population into accountable care programs, or in regions where a dominant provider has become an ACO.
Growth In The Number Of ACO Contracts
The growth in the total number of ACOs and the number of covered lives only tells part of the story. Organizations that
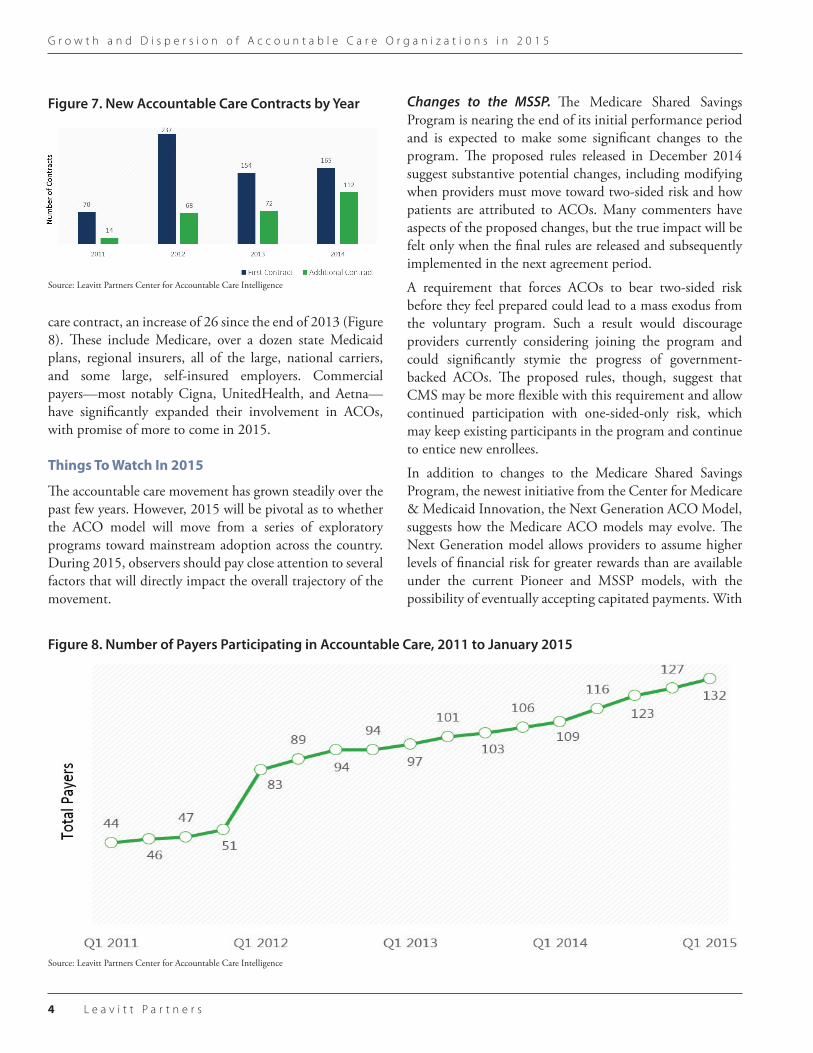
have found success with a pilot program are well-positioned to expand their patient population, and recently, ACOs have increasingly expanded the number of contracts under which they are operating. For example, in 2011, 85 percent of ACO contracts were the organization’s first contract. By 2014, only 59 percent of the contracts were first contracts (Figure 7). As of January 2015, 26 percent (192/744) of ACOs had more than one accountable care contract, and 10 percent (73/744) had three or more contracts. Overall, there are 1,046 known contracts for 744 ACOs.
Payer Involvement
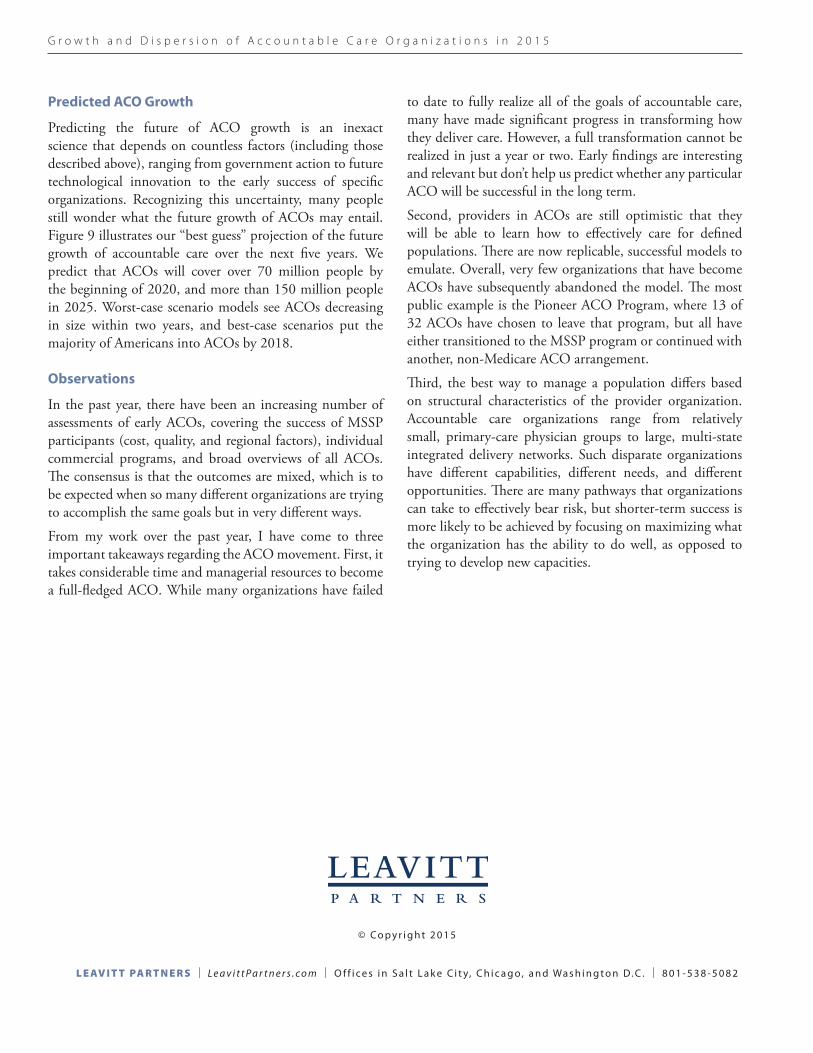
The involvement of different payers has also continued to increase over the past year. Through January 2015, 132 different payers have entered into at least one accountable
3
L e a v i t t P a r t n e r s
G r o w t h a n d D i s p e r s i o n o f A c c o u n t a b l e C a r e O r g a n i z a t i o n s i n 2 0 1 5
Figure 3. Number of ACOs by State, January 2015
Figure 4. Number of ACOs by Hospital Referral Region, January 2015
Figure 5. Estimated Percent of Population Covered by an ACO, by State, January 2015
Figure 6. Estimated Percent of Population Covered by an ACO, by Hospital Referral Region, January 2015
Source: Leavitt Partners Center for Accountable Care Intelligence Source: Leavitt Partners Center for Accountable Care Intelligence
Source: Leavitt Partners Center for Accountable Care Intelligence Source: Leavitt Partners Center for Accountable Care Intelligence
care contract, an increase of 26 since the end of 2013 (Figure 8). These include Medicare, over a dozen state Medicaid plans, regional insurers, all of the large, national carriers, and some large, self-insured employers. Commercial payers—most notably Cigna, UnitedHealth, and Aetna—have significantly expanded their involvement in ACOs, with promise of more to come in 2015.
Things To Watch In 2015
The accountable care movement has grown steadily over the past few years. However, 2015 will be pivotal as to whether the ACO model will move from a series of exploratory programs toward mainstream adoption across the country. During 2015, observers should pay close attention to several factors that will directly impact the overall trajectory of the movement.
Changes to the MSSP. The Medicare Shared Savings Program is nearing the end of its initial performance period and is expected to make some significant changes to the program. The proposed rules released in December 2014 suggest substantive potential changes, including modifying when providers must move toward two-sided risk and how patients are attributed to ACOs. Many commenters have aspects of the proposed changes, but the true impact will be felt only when the final rules are released and subsequently implemented in the next agreement period.
A requirement that forces ACOs to bear two-sided risk before they feel prepared could lead to a mass exodus from the voluntary program. Such a result would discourage providers currently considering joining the program and could significantly stymie the progress of government-backed ACOs. The proposed rules, though, suggest that CMS may be more flexible with this requirement and allow continued participation with one-sided-only risk, which may keep existing participants in the program and continue to entice new enrollees.
In addition to changes to the Medicare Shared Savings Program, the newest initiative from the Center for Medicare & Medicaid Innovation, the Next Generation ACO Model, suggests how the Medicare ACO models may evolve. The Next Generation model allows providers to assume higher levels of financial risk for greater rewards than are available under the current Pioneer and MSSP models, with the possibility of eventually accepting capitated payments. With
4 L e a v i t t P a r t n e r s
G r o w t h a n d D i s p e r s i o n o f A c c o u n t a b l e C a r e O r g a n i z a t i o n s i n 2 0 1 5
Figure 7. New Accountable Care Contracts by Year
Figure 8. Number of Payers Participating in Accountable Care, 2011 to January 2015
Source: Leavitt Partners Center for Accountable Care Intelligence
Source: Leavitt Partners Center for Accountable Care Intelligence

Medicare offering multiple programs, organizations that are prepared to increase financial risk may do so through the Next Generation Model, but those that are still learning can continue participation in the lower-risk MSSP.
The HHS Goal. The Department of Health and Human Services has set a goal of moving 50 percent of payments toward alternative models by 2018, creating the potential to significantly accelerate the movement. Even with government action, though, the transition toward accountable care will not be immediate, as providers continue to experiment with different approaches to managing the health of populations and learn what works in practice within their unique organizations. The 2018 goal is ambitious, but whether it is reached will largely depend on the details of the program. A particular challenge will be to jumpstart growth in regions of the country that have yet to see any interest from providers in participating in accountable care arrangements.
Expansion of Medicaid ACOs. Medicaid ACOs have grown significantly over the past year, and 16 states have now passed ACO legislation or have enacted ACO-like pilot programs. These states, including Alabama, Vermont, Oregon, and New Jersey, represent a variety of different approaches
— ranging from capitated payments to payments closely mimicking the MSSP. Because of the large size of Medicaid programs and states’ ability to mandate payment models, states can accelerate the regional growth of ACOs if and when they decide to move toward accountable care.
Organizational Infrastructure is Key to Success. Much of the policy conversation around accountable care has focused on payment models. While it is certain that payment models do incent behavior, adopting a payment model does not guarantee that a provider will be able to transform the practice of care in a way that improves outcomes and lowers cost. Organizational transformation is always difficult, and health care transformation is no exception.
A myopic policy focus on payment ignores the core objective of accountable care, which is to improve the delivery of care, not simply change how providers are paid. Only if successful care delivery models are identified, shared, and made repli-cable for a broad variety of provider types will ACOs succeed. Public and private payers who are experimenting with ACOs need to identify pathways to success that reflect the variety of providers that are engaging in accountable care and recognize that there is no single approach that will work for all ACOs.
Figure 8. Number of Payers Participating in Accountable Care, 2011 to January 2015
Source: Author’s Analysis
5
L e a v i t t P a r t n e r s
G r o w t h a n d D i s p e r s i o n o f A c c o u n t a b l e C a r e O r g a n i z a t i o n s i n 2 0 1 5
L E AV I T T PA R T N E R S I L e a v i t t P a r t n e r s . c o m I O f f i c e s i n S a l t L a k e C i t y, C h i c a g o, a n d Wa s h i n g t o n D. C . I 8 0 1 - 5 3 8 - 5 0 8 2
© C o p y r i g h t 2 0 1 5
Predicted ACO Growth
Predicting the future of ACO growth is an inexact science that depends on countless factors (including those described above), ranging from government action to future technological innovation to the early success of specific organizations. Recognizing this uncertainty, many people still wonder what the future growth of ACOs may entail. Figure 9 illustrates our “best guess” projection of the future growth of accountable care over the next five years. We predict that ACOs will cover over 70 million people by the beginning of 2020, and more than 150 million people in 2025. Worst-case scenario models see ACOs decreasing in size within two years, and best-case scenarios put the majority of Americans into ACOs by 2018.
Observations
In the past year, there have been an increasing number of assessments of early ACOs, covering the success of MSSP participants (cost, quality, and regional factors), individual commercial programs, and broad overviews of all ACOs. The consensus is that the outcomes are mixed, which is to be expected when so many different organizations are trying to accomplish the same goals but in very different ways.
From my work over the past year, I have come to three important takeaways regarding the ACO movement. First, it takes considerable time and managerial resources to become a full-fledged ACO. While many organizations have failed
to date to fully realize all of the goals of accountable care, many have made significant progress in transforming how they deliver care. However, a full transformation cannot be realized in just a year or two. Early findings are interesting and relevant but don’t help us predict whether any particular ACO will be successful in the long term.
Second, providers in ACOs are still optimistic that they will be able to learn how to effectively care for defined populations. There are now replicable, successful models to emulate. Overall, very few organizations that have become ACOs have subsequently abandoned the model. The most public example is the Pioneer ACO Program, where 13 of 32 ACOs have chosen to leave that program, but all have either transitioned to the MSSP program or continued with another, non-Medicare ACO arrangement.
Third, the best way to manage a population differs based on structural characteristics of the provider organization. Accountable care organizations range from relatively small, primary-care physician groups to large, multi-state integrated delivery networks. Such disparate organizations have different capabilities, different needs, and different opportunities. There are many pathways that organizations can take to effectively bear risk, but shorter-term success is more likely to be achieved by focusing on maximizing what the organization has the ability to do well, as opposed to trying to develop new capacities.
G r o w t h a n d D i s p e r s i o n o f A c c o u n t a b l e C a r e O r g a n i z a t i o n s i n 2 0 1 5