growth and diversification - thorn
TRANSCRIPT

Annual Report 2015
Growth and Diversification

Contents
Growth and Diversification
Results & Highlights
Chair’s Report
Managing Director’s Report
Our Businesses
Consumer Leasing
Consumer Finance
Commercial Finance
Receivables Management
Addressing Financial Exclusion
The Community
Our People
Financial Report
Corporate Directory
01
02
03
04
06
10
12
14
16
18
20
21
IBC
Notice of meeting Notice is hereby given that the Annual General Meeting will be held at KPMG Auditorium, Ground Floor, 10 Shelley Street, Sydney NSW, commencing at 11.00am on Tuesday 18th August 2015.

Annual Report 2015 1
Growth and Diversification
Thorn’s foundation business, Radio Rentals1 remains a leader in consumer leasing with 90 outlets nationally and a unique Rent-Try-$1Buy offering. Over the past few years, Thorn has invested in diversification, establishing broader business capability in consumer finance, commercial finance and receivables management.
Thorn’s business strategy is to extend its range of financial services, targeting a wider demographic and reaching out to small businesses so it can meet the needs of many more Australians. Benefits from this strategy are now becoming apparent as Thorn records improved financial performance, higher revenue, strong receivables growth, increased shareholder value and a growing band of satisfied customers.
From origins in 1937, Thorn has become one of Australia’s leading financial service providers, offering a broad range of financial solutions to meet a growing demand of niche consumer and commercial markets. Underlying this positioning is Thorn’s commitment to giving customers a ‘fair go’.
1 RR – Rentlo Reinvented in South Australia

2 Thorn Group
Results & Highlights
• Record installations and earnings in consumer leasing
• Consumer finance building receivables strongly across all loan products
• Significant organic growth in commercial finance
• Strategic acquisition of cash resources australia
• Diversification strategy producing higher results and strong receivables growth
11.75¢FULL YEAR, FULLY FRANKED DIVIDEND
PER SHARE
FINANCIAL HIGHLIGHTS
OPERATIONAL HIGHLIGHTS
25.1%$293.8MREVENUE UP
13.6%$34.2MUNDERLYING CASH NPAT UP
8.5%$30.6MREPORTED NPAT UP
68.1% $368.7MGROUP RECEIVABLES UP TO
18.9%ROE RETURN ON EQUITY1
REVENUE ($m)
UNDERLYING CASH NPAT EPS & DIVIDENDS
($m) (cents)
’15’11 ’12 ’13 ’14 ’15’11 ’12 ’13 ’14 ’15’11 ’12 ’13 ’14
293.8 34.20
368.7
0
50
100
150
200
250
300
0
5
10
15
20
25
30
35
GROSS RECEIVABLES ($m)
0
5
10
15
20
25
’15’11 ’12 ’13 ’14
0
50
100
150
200
250
300
350
400
Basic Earnings Per ShareDividends Paid Per Share
Commercial LeasingConsumer LeasingConsumer Rentals
1 ROE is calculated as Underlying Cash NPAT divided by the average of opening and closing equity

Annual Report 2015 3
Chair’s Report
These results are the outcome of Thorn adopting a strategic approach to its financial services markets. The group already has a strong position in consumer markets, based on the Radio Rentals business with origins nearly 80 years ago, and over recent years continues to build an increasing share in the commercial sector. This strategy has contributed to improved financial performance, achieved from a combination of organic growth and acquisition.
DividendImproved financial results enabled the board to increase the final dividend to 6.75 cents a share, taking the 2015 full financial year dividend to 11.75 cents a share fully franked compared with 11 cents for financial year 2014. With reported earnings per share at 20.34 cents, this dividend represents a payout ratio of 58 per cent in line with Thorn’s policy of allowing shareholders to participate in the benefits of growth. Our dividend reinvestment plan will remain in place for this dividend at the increased discount of 5 per cent.
BoardIn Thorn’s market place developments in financial services and technology globally, as well as locally, will impact on the company. To ensure Thorn has expertise and appropriate skills mix at board level to help forge a path through emerging trends, two new appointments enhance our capability.
On 1 December 2014 David Foster joined the board after a 25 year career in financial services, the last five years as chief executive officer of Suncorp Bank, Australia’s fifth largest listed bank and the country’s only “A+” rated regional bank. During his 11 year career at Suncorp Bank, Mr Foster had responsibility for developing the bank’s strategy and business model, acquisitions, product development and implementation of a significant technology platform.
On joining the board Mr Foster was appointed chair of Thorn’s audit, risk and compliance committee.
On 1 June of this year Andrew Stevens was appointed a director after 30 years’ experience in business and technology, including regional markets. His 12 year career at IBM included Managing Director of Australia and New Zealand for three years, and Managing Partner, Global Business Services and Growth Markets across the APAC region. As IBM ANZ Managing Director, Mr Stevens was involved in transforming the IBM business and client relationships for the Cloud-based market era.
Corporate Governance Thorn’s board is committed to ongoing creation of shareholder value and meeting the expectations of Thorn’s stakeholders while practising sound corporate governance. The financial section of this annual report outlines all aspects of the corporate governance and remuneration policies.
PeopleOn behalf of the board, I would like to commend Thorn’s Managing Director, James Marshall, on his first full year in the position. He is committed and has recorded significant achievements during a period of transformation for the company and reinforced Thorn’s positioning for future growth and financial success.
Thorn is very fortunate to have a strong group of senior executives and staff who are passionate about the business and dedicated to giving our customers positive experiences. We acknowledge and thank our staff for their effort and commitment which was a major factor in this year’s success.
I would also like to thank our shareholders for their support and trust their investment will continue to be long term and rewarding.
Joycelyn Morton Chair
In this my first year as Chair of Thorn, it is pleasing to report a positive financial performance for financial year 2015. Group revenue increased 25.1 per cent, growing from $234.9 million (2014) to $293.8 million (2015) and underlying cash net profit after tax was up 13.6 per cent from $30.1 million to $34.2 million. The reported net profit after tax (NPAT) increased by 8.5 per cent from $28.2 million to $30.6 million with the principal difference between underlying and reported NPAT being one-off costs of $2.235 million relating to the acquisition of the Cash Resources Australia business.

4 Thorn Group
Since being appointed Managing Director in April 2014, it has been very satisfying to see the level of growth across our businesses and evidence of our business strategy delivering results. Essentially our strategy is to develop our established business of consumer leasing while diversifying within the financial services sector to provide a broader base of earnings. Thorn’s consumer leasing business has an enviable track record, with Radio Rentals established nearly 80 years ago. It is still an important component of our operations but it is noteworthy that our other businesses are fast growing and increasing their earnings contribution to the Group. This trend will be more pronounced in coming years, especially given the strong growth of our Commercial Finance business and contribution from the recently acquired invoice discounting business, Cash Resources Australia.
This performance trend illustrates the initiatives we are implementing to support our diversification program – a combination of organic growth and acquisitions which add value and complement existing businesses.
Financial performanceThe financial outcomes of our business strategy are encouraging, as demonstrated by our key performance numbers - revenue up 25 per cent, profit up 14 per cent, return on equity strong at 19 per cent, receivables up 68 per cent with reasonable gearing of 39 per cent, and fully franked dividends increasing to 11.75 cents for the full year.
Our visionThorn’s vision is to become a leading provider of financial services to niche consumer and commercial markets. The Group is well structured to implement this through its ‘4 Pillar Strategy’, being the four business divisions of its operations. These are Consumer Leasing, Consumer Finance, Commercial Finance and Receivables Management. The performance of these divisions in FY15, their potential for growth and our intent to foster their expansion, are indicators of how we are working towards achieving our vision.
Our operating prioritiesAs Thorn grows and pursues its diversification strategy, we also have a number of operating priorities through which we seek to align our business objectives with the interests of our customers and employees. These are intended to ensure that we perform successfully as an enterprise, are governed responsibly, give emphasis to the needs of people and also leave space to contribute to the world around us through our corporate social responsibility initiatives.
As a business, Thorn competes with many service providers and, while banks dominate large parts of the market, they have left gaps, especially in meeting the needs of consumers and small to medium sized businesses. For these groups, Thorn is well placed to offer a broad range of viable alternatives, as it helps households gain access to the goods and services people need and assists businesses which require equipment and cash flow solutions to grow and keep their own customers satisfied. As Thorn broadens its product range and expands its reach, it also meets its other goal of providing a growing return to its shareholders.
Managing Director’s Report
“ Thorn’s principal purpose is to give consumers and SMEs a ‘fair go’ in accessing goods and financial services.”
“ Thorn is well placed to offer a broad range of viable alternatives, as it helps households gain access to the goods and services people need ”

Annual Report 2015 5
As a service provider, Thorn’s principal purpose is to give consumers and SMEs a ‘fair go’ in accessing goods and financial services. Many of Thorn’s retail and business customers find they are excluded from mainstream finance sources. Some don’t have a credit rating or credit card, banks are not able to meet their needs and some financing alternatives are just too expensive. In these markets, Thorn exists to give people and businesses a ‘fair go’ while also exercising its responsible lending policy. Based on this policy, Thorn has an Australian Credit Licence and was one of the first to be licensed in Australia when the National Consumer Credit Protection Act 2009 was introduced.
Placing its customers as a priority, Thorn tracks retention, satisfaction and feedback and in achieving high ratings in all these categories, Thorn gains reinforcement for the way it is meeting the needs of a large demographic nationally.
As an employer, Thorn recognises the importance of instilling a culture among its people which is focused on treating customers, in consumer and commercial markets, responsibly and fairly. From this there are not only positive outcomes for customers but it is also the basis for making people feel good about the work they do. The culture applies to those on the front line having face-to-face contact with customers and also to those who deal with customers online and help to manage their accounts. Some customers experience hardship, some like innovative and sympathetic solutions when they need guidance about products or business needs and all of them appreciate a personal touch when they are making financial decisions. With responsibility and fairness being Thorn’s core values, we are developing a committed team across all our businesses.
The Way ForwardIn pursuing its vision and strategy, Thorn seeks to combine sound business performance with meeting the needs of customers and employees as well as connecting with its local communities. In the year ahead, Thorn expects to maintain sustainable growth. Of possible assistance to this may be recent federal government incentives being provided to small and medium sized businesses. Thorn expects its growing base of diversified receivables will be the driving factor in continued growth.
James Marshall Managing Director
“ Thorn recognises the importance of instilling a culture among its people which is focused on treating customers, in consumer and commercial markets, responsibly and fairly. ”

6 Thorn Group
Radio Rentals, which also operates as RR - Rentlo Reinvented in South Australia, provides an extensive range of essential household living and home office needs through consumer leasing products, principally under the Rent, Try, $1Buy® banner. Radio Rentals operates over 90 outlets nationally and has been a market leader since 1937.
Rent, Try, $1Buy® has become an industry icon enabling customers to enjoy the benefits and flexibility of rental along with the potential to obtain ownership. In line with the group’s “responsible rental policy”, Radio Rentals ensures all customers are provided with products that suit their needs and budget and are not over committed. This aligns with the group’s ’fair go’ ethic through which credit decisions are based on customers’ capacity to pay, rather than their credit history. The outcome of this enables more Australians to gain access to everyday living essentials.
Thorn’s market research among customers continues to show high levels of satisfaction and repeat business. Again in FY15, nearly half of Radio Rentals customers on completion of a contract signed up to take out a new contract for another product.
CONSUMER LEASING
STRATEGIC INTENT From its market leading position, Thorn is looking to reach a wider and expanding demographic, through trialling of new propositions and an evolution of the brand.
Thorn’s intent for its consumer leasing business is to be a leading provider of essential household goods and financial services to consumers who might find themselves excluded from mainstream finance sources.
In FY15, Radio Rentals2 posted record installations, with furniture and household essentials the most popular categories. The launch of 48-month agreements has had considerable success, with more customers now choosing profitable longer term contracts that provide affordable weekly payments for larger products and whole room packages.
Thorn has empowered its rental teams to embrace innovation. This has included the trial of new products and propositions including interest free, broadband plans and cash loans as well as the planned trial of a savings club.
The Thorn-branded product range is expanding and now includes a range of televisions and fridges, including the recent addition of a French door fridge, as well as a smart phone and tablet. Our experience with Thorn-branded products has been very positive over the years, with them being very popular with our customers and having a positive effect on margins, supporting the business.
Key initiatives in the consumer leasing business include a potential rebranding of Radio Rentals to reach a wider demographic, the development of new propositions and a second rental brand to increase market penetration and improve asset utilisation.
Our Businesses
Develop products and services offered through the rental network to grow customers
Evolve core brand and introduce new propositions to reach a wider demographic
Improve acquisition channels through store model conversions, second brand expansion, and website evolution
2 RR – Rentlo Reinvented in South Australia
STRATEGY
TM

Annual Report 2015 7
Brand Evolution Trial In April 2015, a brand evolution trial to attract a broader demographic and customer base was launched and will be reviewed throughout the year. The pilot includes eight locations which have been rebranded from either Radio Rentals or Rentlo to RR. Transitioning from a 78-year old brand to a new one enables Thorn to maintain heritage and history while launching new propositions, such as broadband plans and interest free.
The “new generation” store fit outs include tech bars, privacy booths and information screens.
Second Rental Brand TrialA pilot second rental brand offering a “no lock-in” contract and flexible rental solutions was launched in Brisbane in December 2014 under the name Rentlo and will be reviewed during the year.
The second brand is designed to take on competitors, gain market share and benefit from asset utilisation.
This proposition is completely differentiated from Radio Rentals, with points of difference including ’no lock-in’ contracts, predominantly re-rent stock on offer, and flexible rent-to-rent contracts.
Initial findings show Rentlo is attracting a broad range of customers with a situational need for rental products. Customers are based in a wider geographic catchment area than first anticipated, covering most of the Brisbane footprint.
Even though the trial was only launched in December, the brand is meeting expectations and the plan is to review at the end of financial year 2016 with a view to further expand.
RADIO RENTALS EVOLUTION As Thorn looks to reach a wider and expanding demographic, trials of new propositions and branding have been implemented and will be reviewed during the year.

8 Thorn Group
Mary is a single mum from Tasmania. She has been a loyal customer of Radio Rentals for over 18 years. Radio Rentals is now helping her children get the products they need for their new families. “Yes, I’ve been using Radio Rentals for 18 years now. The first thing I got was a fridge. I used to only have second hand stuff because that’s all I could afford. Radio Rentals gave me the chance to own new things for the first time and I am very grateful.
I was a single mum, I couldn’t work and I couldn’t save money to afford to buy things upfront. It made it very challenging.
I started out with one thing then I could afford to rent another and so on, I added a dining table and then a cabinet.
The thing that really stands out about Radio Rentals is the staff. They are friendly, never look down on you and are always there to help with anything you need. It’s the only store in Hobart where I know the staff by name. I’ll head in there occasionally just for a chat and a joke. Jodie and Kellie are great. Whenever I call up they do whatever they can to help me.
Radio Rentals is more than just a company they are there to help, they give me advice and never push me to spend too much. My two eldest kids now use Radio Rentals themselves.
Without Radio Rentals I really would have struggled, I probably wouldn’t have all the great things I do now because I just wouldn’t have been able to afford it. They’re just fantastic.”
OUR CUSTOMERS
“ I was a single mum, I couldn’t work and I couldn’t save money to afford to buy things upfront. ”
“ Without Radio Rentals I really would have struggled. ”
MARY, TASMANIA

Annual Report 2015 9
DAVID & FLIC, TASMANIA
David and Flic are a young couple from Devonport. With a young family, they struggled financially. Now, thanks to Radio Rentals they have a successful small business that continues to grow. “We’re photographers, we do weddings, portraits, maternity shoots, and we have five kids now so we are very busy. We have been customers of Radio Rentals for about 14 years, it’s grown with our business, and it’s grown with those guys down in Devonport.
They have been fantastic since we opened the business, organising the equipment we needed, making sure we knew what was available before we made any decisions and when we asked them to track something down, nothing was ever too much trouble.
We have a personal relationship with the staff in-store, Megan and Marty, Leila and Kim, they are all great, some of them are clients of ours now! We love having that relationship, personally buying online is so impersonal, it’s so much better being able to give them a call or go in the store and get an answer straight away. It’s not just with the business either.
Recently, one of our kids was very sick and we needed a new bunk bed. Within the day it was delivered to our house while we were still at the hospital, they are just always fantastic.
When we started out, we were very young with two kids, we had absolutely nothing.
Radio Rentals gave us the chance to prove we could get the things we needed by working within our budget. We really did have nothing and they gave us the chance to get the things we wanted.
We love them.”
“ We really did have nothing and they gave us the chance to get the things we wanted. ”
“ We have a personal relationship with the staff in-store, Megan and Marty, Leila and Kim, they are all great. ”
To preserve privacy we have not used real customer photos

10 Thorn Group
STRATEGY
STRATEGIC INTENT The consumer finance business aims to provide niche credit products to consumer markets overlooked by major lenders.
The consumer lending sector is undergoing significant change, with a number of technology start-ups beginning to populate the local market and offering a new range of finance products.
Thorn believes its consumer finance business is well placed to compete in this market and some of the initiatives carried out in the past year include expansion of product offerings to reach broader customer segments, refinement of the customer proposition, development of the Cashfirst offer in-store, and redesign of the Cashfirst website to improve customer experience.
Thorn is currently developing a comprehensive range of innovative consumer finance products to match customer needs and transform the customer experience, both online and in-store. This includes further expansion of the product offering, technology enhancements, introduction of paperless contracts and same day loan funding.
CONSUMER FINANCE
Thorn’s consumer finance business, provides consumers with access to a broad range of personal loans through Thorn Money, which offers unsecured loans up to $15,000 and secured loans up to $25,000; and Cashfirst, which provides unsecured loans of between $500 and $5,000.
Expansion of the consumer finance business reflects Thorn’s ongoing research which indicates there is increasing demand for these types of loans as they are not being met comprehensively by other, larger finance providers.
Thorn has the capability to offer a broader range of loan products, which revolves around the group’s skills to assess credit worthiness and make decisions quickly. Technology, systems and ongoing staff training enable fast processing and quick decision making within company lending guidelines.
Diversify and expand distribution to grow sales volumes
Develop operational efficiency to deliver simplicity and speed
Improve customer engagement and transactional experience
Our Businesses

Annual Report 2015 11
LINDA, SYDNEY
“I’m a normal mum, I work full-time but my real passion is the kids group I support.
Our goal is to keep disadvantaged kids away from alcohol and drugs, giving them something to do, getting them to help the community, giving them something in their lives, for their future. It’s self-funded because it’s hard to get donations for our cause, we aren’t very big.
The kids come out with smiles on their faces and they love it, contributing to the community feeling needed, it’s great, you get so much joy from looking after and helping these kids, it’s worth it.
Cashfirst has helped us time and time again. Whenever I get behind on payments, I give them a call and they are so helpful, they organise for the payment to be moved or added over a few months or tacked onto the end of my loan, whatever I can manage.
They aren’t just about the money either. They will have a chat with you, ask you how you’re going, they actually care.
They help me keep my dream alive and I am always so appreciative of that.”
“ The kids come out with smiles on their faces and they love it, contributing to the community feeling needed, it’s great.”
Linda is a mother of one who dedicated her time to help keep kids off the street. Cashfirst has helped her keep that dream alive.
To preserve privacy we have not used real customer photos
OUR CUSTOMERS

12 Thorn Group
Thorn’s Commercial Finance division includes, Thorn Equipment Finance (TEF), which provides equipment finance solutions for business and government with small to medium enterprises (SMEs) a key target market for supply of a diversified range of products.
The recently acquired Cash Resources Australia (CRA) is a debtor finance business that provides working and growth capital solutions through invoice discounting and secured commercial loans for SMEs.
The key target market for Commercial Finance is SMEs which require funding for equipment under $100,000, an area Thorn considers underserviced by the major financial institutions.
CRA’s core business activity involves working and growth capital finance solutions for businesses that may have a short term cash requirement to fund growth opportunities or simply prefer the flexibility of dealing with an organisation such as CRA, rather than set-up overdraft or other financing facilities with a bank.
STRATEGYExpand product offering to create cross-sell opportunities and allow for organic growth
Continue to develop acquisition and partnership opportunities, strategic alliances
Develop synergies to create a scalable and efficient business, better service SMEs
COMMERCIAL FINANCE
Our Businesses
STRATEGIC INTENT The commercial finance business is growing at a rapid rate, both organically and through acquisition. The strategic acquisition of CRA this year enhances coverage of the commercial sector and expands the group’s client base.
In FY15, the receivables book grew to just over $100 million compared with $64 million a year ago. Even with this growth, bad debts and arrears declined considerably due to improved risk and receivables management.
The basis of the commercial finance offer is to provide a cost effective way for companies to grow, by giving them a way to protect cash flow while acquiring new assets and providing working capital finance for different parts of the business.
The integration of CRA has allowed Thorn to broaden its product suite and cross-sell between TEF and CRA, offering both equipment finance and debt facilities to SMEs. Often, businesses that need equipment finance also need working capital finance. The ability to offer both has led to development of stronger relationships with partners and customers.
Key initiatives include the expansion of the product offering through these partnerships across the commercial direct channel, franchise finance channel and broker network.

Annual Report 2015 13
Thorn helped a unique client this year, providing equipment finance to its operation in the Northern Territory One of Thorn’s clients is Hyperbaric Health Pty Ltd, which manufactures hyperbaric chambers and provides painless and non-invasive treatment for leg wounds, ulcers and radiotherapy injuries. They provide these services through hospitals, and medical centres throughout Australasia.
Hyperbaric oxygen chambers create air pressure inside that is about two and a half times higher than the normal pressure in the atmosphere. This helps a patient’s blood carry more oxygen to organs and tissues in the body and help wounds, especially infected wounds, heal more quickly.
Hyperbaric Health needs a finance partner which really understands the nature of its business because of its uniqueness. Taking into consideration their business model, the specialist nature of the equipment and the location, Thorn Equipment Finance was able to provide flexible efficient financing over a Hyperbaric Chamber located in Darwin Hospital.
Tim Snowden, CEO, Hyperbaric Health
HYPERBARIC HEALTH PTY LTD
GUARDSPLUS AUSTRALIA
OUR CUSTOMERS
CRA helped a security company which, despite growing considerably, was experiencing cashflow issues due to late invoice payments. “Guardsplus is a security company based in Sydney, with operations in Queensland and Victoria, supplying specialised security services for individuals, small business and multinational corporations.
As the business was growing, we started having issues with clients paying on time, placing the business under extensive cash flow pressure to meet existing overheads.
I contacted CRA about a year ago to explore invoice discounting solutions and John was extremely helpful and found a solution to our problem. As a result, the business has no more finance issues.
Ever since, I can call John in the morning and funds are in my account within 2-3 hours. Everyone at CRA is very personable and our relationship has gone from strength to strength.
I really recommend that business, they provide an exceptional service. It is safe to say, our business would not have been able to survive without CRA. It’s been fantastic to deal with CRA and I will be using them for a very long time.”
David Millward, Owner/Operator of Guardsplus
“ Everyone at CRA is very personable and our relationship has gone from strength to strength. ”
To preserve privacy we have not used real customer photos
“ Hyperbaric Health needs a finance partner which really understands the nature of its business because of its uniqueness.”

14 Thorn Group
RECEIVABLES MANAGEMENT
National Credit Management Limited (NCML) is a provider of credit and receivables management services throughout Australia. This involves an in depth understanding of the credit lifecycle and offering a range of products and services to help clients maximise their cash flow.
Since 1990, NCML has been partnering with Australia’s largest creditors within government, banking and finance, insurance, utilities and telecommunications to provide comprehensive commercial solutions, from pre-collection services to legal recovery and debt purchasing.
STRATEGIC INTENT After a strategic review of the business by independent consultants, the business model was simplified and streamlined to position NCML better in a highly competitive market.
The business has narrowed its execution focus in order to scale Purchased Debt (where debt is purchased from the original credit issuer) and Contingent Debt (where the debt is actioned, for a fee, on behalf of the credit issuer).
The strategic review resulted in the creation of two “Centres of Excellence” and a transformation project to consolidate smaller operations to create scale and efficiencies.
In FY15 the business increased its investment in Purchased Debt Ledgers (PDL) resulting in PDL receivables growth of 62 per cent on prior year. New collections strategies have recently been implemented and the development of new targeted debt seller relationships continues. The increase in Purchased Debt coupled with an improved value proposition to debt sellers has better positioned NCML to manage reputational impact for debt sellers while ensuring customers are dealt with in a highly compliant and ethical manner.
The new framework is attracting further clients in financial services, which is helped by Thorn having the skills and experience in this sector.
In contingent debt collection, NCML continues to demonstrate a commitment to delivering leading recovery rates for its clients. Where NCML is benchmarked on panel arrangements against other providers, NCML now outperforms more consistently across a number of key relationships in banking and government sectors with leadership positions being maintained.
NCML’s ongoing investment in its Quality and Compliance framework and in the refinement and development of hardship programs with recent software implementations, reporting and policy alignments further evolves this element of its operation. This framework not only reinforces a commitment to business transformation, but also builds a level of compliance that offers competitive advantage and is intended to contribute to NCML being a highly compliant and ethical leader in the debt collection industry.
STRATEGYConsolidate operation to create scale, necessary for competitive advantage, market positioning
Seek excellence in execution discipline, by creating greater focus and clarity across business
Diversify earnings and grow PDL revenues, focus on and build targeted relationships primarily across banking and finance products
Our Businesses

Annual Report 2015 15
NCML and CBA have partnered for a number of years in working with the bank’s customers to resolve their outstanding debt obligations.
TRANSURBANNCML was appointed following a rigorous tender process to collect outstanding tolling debt on behalf of Transurban and its tolling asset stakeholders.
“NCML impressed with a deep understanding of our needs and its impressive compliance framework which ensured our brand was in safe hands. They presented strong credentials to deliver leading recovery rates given a number of clients in this sector. I’m delighted to say NCML continue to impress and projects are well advanced to extend the relationship into the more recently acquired Queensland Motorway assets in Queensland.”
Arthur Tchetchenian, National Credit Manager, Transurban
COMMONWEALTH BANK OF AUSTRALIA
To preserve privacy we have not used real customer photos
“The Bank is very mindful of who it works with in this area and we are constantly reassured by NCML’s respect for the values of our brand and the lengths they go to in effecting positive outcomes. We’re aware NCML has invested significantly to drive performance through a range of systems and processes to ensure a highly compliant and ethical operation is delivered on our behalf, while continuing to deliver leading recovery rates.”
Craig Worsely, Senior Manager, Outsourced Relationships, CBA
OUR CUSTOMERS

16 Thorn Group
Thorn received its Australian Credit Licence under the National Consumer Credit Protection legislation in 2010, making it one of the first financial service providers in Australia to be licensed. A key element of Thorn gaining its license was having a Responsible Lending Policy under which Thorn seeks to ensure customers are treated fairly and provided access to goods and services that meet their needs and budget. Within Thorn’s policy are hardship provisions which are intended to help customers cope with unforeseen circumstances.
Addressing Financial Exclusion
of the Australian population do not have a credit card1
56.7%
A large component of Thorn’s consumer customer base comprises Australians who are excluded from the financial mainstream and it has become increasingly apparent that this is a substantial group:
• 16.9 per cent of the Australian population, or just over 3 million people, are either fully or severely financially excluded
• 42.9 per cent of the Australian population, or 7.7 million people, are marginally financially excluded
• 56.7 per cent of the Australian population, or over 10 million people, do not have a credit card1
There are many reasons for financial exclusion but it is because of this situation that Thorn has developed its “fair go” policy, enabling people to have access to household goods when there are few alternatives.

Annual Report 2015 17
1 Connolly C, Measuring Financial Exclusion in Australia, Centre for Social Impact (CSI) – University of New South Wales, 2014, for National Australia Bank.
2 Buduls A, Report of the Independent Review of Centrepay, June 2013, p 6
of the Australian population, or just over 3 million people, are either fully or severely financially excluded
16.9%
Hardship Policy Thorn also has a hardship policy in place enabling customers to extend the balance of their contract at a lower payment without any charges or penalties. This was recently used for one of our long standing customers in Victoria who was not only battling health issues but had also lost her home due to a fire. Under the hardship policy, Radio Rentals cleared her account, replaced the items she had lost and ensured she would no longer have to make any payments.
CentrepaySome of Thorn’s customers, who receive income from government benefits, are eligible to meet their commitments through Centrepay, an automated method of payment managed by the Federal Government to enable people to pay regular living expenses from their Centrelink payments.
Using this system is a choice by customers and because it is free to them, it avoids costs associated with bank direct debit systems.
In relation to Thorn’s consumer rental business, the operation of Centrepay is merely as a payment mechanism nominated by customers and since there are alternative automated payment methods available, the operation of Centrepay is not material to Thorn’s ongoing business model.
However, Thorn is also aware that consumer rental is an important financing alternative for those Australians excluded from the financial mainstream. Thorn’s customer research indicates that consumer rental is a service many people need at a time when they do not have alternatives and Thorn is proud to have this sentiment underlining its work.
The ‘Mum Test’
A feature of how Thorn operates when dealing with customers is to apply what we call the ’Mum test’. This means staff are encouraged to treat customers ’as if they were your mum’ and do whatever is reasonable to assist them. We do this to ensure customers get a ’fair go’, particularly people who may have encountered difficulties in their lives.

18 Thorn Group
The Community
Thorn believes community involvement is a component of good business practice. Consequently, Thorn is committed to developing and maintaining long term strategic partnerships with community organisations, networks, and resources to create mutual benefit.
As part of Thorn’s commitment, staff are encouraged to participate in community activities along with Thorn providing direct financial support, including matching staff donations dollar for dollar for approved activities. Two of the major initiatives supported by Thorn are the Children’s Tumour Foundation of Australia and Project New Dawn.
Children’s Tumour Foundation of Australia (CTF)The Children’s Tumour Foundation is a not-for-profit organisation dedicated to providing information, support services and finding effective treatments for people living with neurofibromatosis (NF), a term for three distinct disorders: NF1, NF2, and schwannomatosis.
NF affects one in every 3,000 people, more than cystic fibrosis, Duchenne muscular dystrophy, and Huntington’s disease combined.
CTF is dedicated to:
• Supporting children and adults diagnosed with neurofibromatosis , their families and carers with information, resources and practical support across their NF journey; and
• Funding world-leading research into effective treatments for NF and ultimately finding a cure
CTF is committed to ensuring those suffering with NF receive adequate, multidisciplinary care throughout their lives.
CTF has strong links internationally to NF organisations and researchers in the USA, Great Britain, Ireland, Canada and Europe. We also work closely and provide funding to world-class local researchers and clinicians at The Children’s Hospital at Westmead, the Murdoch Children’s Research Institute and Royal North Shore Hospital.
“It has been a challenging year for charities and fundraising - together with the support of Thorn Group, its staff and supplier network, I am so proud to report that CTF have made a great deal of progress in our efforts to support children and adults living with NF, in particular we have achieved our major goal of establishing a National Supportive Care Service to provide practical support, information and guidance to families living with NF. Quite simply, without the support of Thorn Group and the ongoing commitment of your staff and suppliers, we would not have achieved what we have over the last year. Your support of CTF continues to be critical to our vision of conquering NF. You have helped us achieve so much to date, and we are so very grateful for everything you do, thank you.”
Lisa Cheng, CEO, Children’s Tumour Foundation

Annual Report 2015 19
5Providing support for the community
1Providing a positive work environment for
our people
4Health, Safety and
Environmental Responsibility
3Contributing
to legislative and regulatory
improvement
2Providing optimal
service for our customersThorn
CSR Focus
Project New Dawn Radio Rentals is also proud to be a founding partner in Project New Dawn which was created as an enterprise that could offer both jobs and accommodation to the homeless.
The core partners are ACSO in Melbourne, The Salvation Army in Brisbane and Perth, Mission Australia in Sydney (accommodation management and personal coaching), Radio Rentals (white goods and furniture), BP and Bunnings (rental guarantee, training and employment opportunities). New Partnerships were established with Indigenous Employment Focus in July 2015, AFL SportsReady and Aboriginal housing Victoria.
Participants selected for the project receive 12-18 months of employment and housing. With a stable source of income, participants pay their own rent and utilities which gives them a suitable rental history acceptable to other landlords when they graduate from the program.
The first house went live in 2008 in Melbourne and there are now six houses across Australia – two in Melbourne and one each in Newcastle, Adelaide, Perth and Brisbane.
Since 2008, 26 people have been recruited nationally and roughly half of those selected have stayed on or graduated from the program.
The project aims to have 30-40 properties Australia wide, giving 60-80 homeless men and women the opportunity to move from the street and into regular employment.
Natural DisasterWhen disaster strikes across Australia, such as the Victorian Bushfires and Queensland Floods or there is a worthwhile cause needing assistance, then there is a good chance that someone from Thorn will be there to assist our customers and the community in general. Over the years, assistance has been provided in various forms, including the loan of bedding and refrigerators for relief centres, substantial goodwill credits on customer accounts and the donation of products for fundraising.
Some of these initiatives include:• Blue Mountains bushfires, household goods donations, special
considerations for any customers affected by the devastation• Queensland floods, give-away of 100 re-rent TVs and
customer account credits• Victoria bushfires, provision of beds etc for emergency shelters• Victoria floods, provided equipment to support local
police operations
EnvironmentAs an importer of product under the Thorn brand, the Company is heavily focused on integrating environmental considerations into our purchasing and supply strategies. Thorn is also a member of the Australia New Zealand Recycling Platform (ANZRP), which has responsibility for recycling end of life televisions.
Health And Safety Thorn recognises its responsibility to provide a safe environment for our people, our customers and others who come into contact with our business. Our Health and Safety program is regularly reviewed and our Regional Safety Teams provide two way feedback on managing potential hazards and best practices.

20 Thorn Group
Our People
At Thorn, we have a culture of innovation, recognition, learning and development. We believe in investing in our team members and actively seek to empower, encourage and support all of our staff to fulfil their potential and express ideas that not only drive the company forward but allow our people to take charge of their careers across our multiple brands and divisions.
We have a number of programs and initiatives in place that recognise the importance of our employees, customers, shareholders and the wider community which are key to driving a positive, fun and friendly culture as well as providing a great place to work for our valued employees.
This year we launched our own employee program called LION.
LION stands for Leadership, Innovation, Ownership and Nurturing, and includes a branded employee program with the central vision being “making it happen” which is at the core of what we do at Thorn, for our customers, partners, investors and employees.
The program is about recognising the different characteristics of our employees but also unifying the brand, across its different divisions.
The LION branding is used across different initiatives such as:
• One brand uniting all Thorn employees • Social events, birthday emails to all employees • Rewards and incentives • Education and motivation
As part of reinforcing our culture among employees, we encourage people to be involved in our fundraising activity and give them a sense of feeling empowered by giving back to the community.
An example of this was a fundraiser for the Children’s Tumour Foundation we organised at last year’s annual conference where teams had to complete a 180 km Kayak challenge at Main Beach. There were 20 teams and each team member took turns paddling to reach the target. The teams raised $20,000 for CTF.
On a more regular basis, we organise lunches and other events throughout the year for fundraising.
This year we also launched the nationwide Employee Assistance Program, which provides up to six free confidential counselling sessions for staff members and their families. Led by not-for-profit organisation, AccessEAP, these sessions can assist with any personal, family or work related issues.

Annual Report 2015 21
Financial Report 30 June 2015
Directors’ Report 22
Corporate Governance Statement 41
Lead Auditor’s Independence Declaration 46
Statement of Comprehensive Income 47
Statement of Financial Position 48
Statement of Changes in Equity 49
Statement of Cash Flows 50
Notes to the Consolidated Financial Statements 52
Directors’ Declaration 76
Independent Auditor’s Report 77
Shareholder Information 79
Corporate Directory IBC

22 Thorn Group
Directors’ Report
The Directors present their report together with the financial report of Thorn Group Limited (the ‘Company’) and its controlled entities (together referred to as the ’consolidated entity’) for the financial year ended 31 March 2015 and the auditor’s report thereon.
Operating and Financial ReviewThe 2015 Operating and Financial Review is presented by the Board to provide shareholders with an overview of the Company’s operations, financial position and potential for future years.
Thorn Group is a diversified financial services group providing alternate financial solutions to consumers and businesses. Activities are predominantly in leasing of household products with increasing diversification into consumer loans, commercial finance, invoice discounting and the provision of receivables management services.
Apart from the acquisition of invoice discounting business Cash Resources Australia, there were no other significant changes in the nature of the activities of the consolidated entity during the year.
Thorn operates through four core segments:• Consumer Leasing of household products through Radio
Rentals and Rentlo;• Consumer Finance provides personal loans through Cash
First and Thorn Money;• Commercial Finance including equipment financing and
invoice discounting for small and medium enterprises through Thorn Equipment Finance and Cash Resources Australia respectively; and
• Receivables Management, debt recovery, credit information services, debt purchasing and other financial services through NCML.
Financial performanceRevenue for the 2015 financial year increased 25.1% on the previous corresponding period (“PCP”), growing from $234.9m to $293.8m.
Underlying Cash NPAT increased by 13.6% from $30.1m to $34.2m. Reported NPAT increased by 8.5% from $28.2m to $30.6m.
There was significant organic growth in both consumer leasing and commercial finance driven by strong originations. Consumer Leasing in particular benefited from the increased mix of finance leases from operating leases. The result also included $0.8m after tax contribution from Cash Resources Australia that was acquired on 1 December 2014.
The investment in people, processes and systems over the previous three years has supported the increase in current year Underlying Cash NPAT.
Segment performanceConsumer Leasing:Revenue for the Consumer Leasing segment grew 25.1%, from $196.8m to $246.2m driven by both record originations during the year and a significant shift in contract mix from operating leases to finance leases. Originations increased 88.7% from $51.5m to $97.2m from PCP. Finance leases represented 88% of leases in 2015 compared to 45% in the PCP.
The growth in finance lease revenue was driven by the continued adoption of the Rent Try $1 Buy® month contract that was introduced in December 2013. Originations of finance lease contracts during the year numbered 112,700 of which 76.3% or 86,000 were 48 month contracts. The introduction of the longer term made larger products and whole room packages more affordable.
Customer retention performance remains consistently strong with 48% of customers completing a Rent Try $1 Buy® agreement taking a subsequent agreement for another item at a discounted rate.
Write-off performance remained consistent with prior year however provisioning increased in-line with receivables growth. Costs increased in the segment in-line with new stores and additional resources required in the store network to support the growth in units on rent.
Other operating expenses for the Consumer Leasing segment also increased in-line with the increased level of originations.
Reported segment earnings before interest, tax, depreciation and amortisation (“EBITDA”) increased by 13.3% from $49.5m to $56.1m.
Consumer Finance:Consumer Finance revenue increased by 48.4% from $9.3m to $13.8m. The revenue increase was driven from interest through a 56.0% growth in receivables, from $28.4m to $44.3m. Originations increase by 69.7% from $18.8m in the PCP to $31.9m.
Net bad debts increased from 10.9% to 12.3% as a percentage of average receivables. This increase in bad debts resulted in a revision to the collections strategy of the segment in March 2015. Overheads were higher than PCP as a result of business development initiatives and increased volumes. Segment EBITDA increased by 16.7% from $1.2m to $1.4m.
Annual Report 2015 23
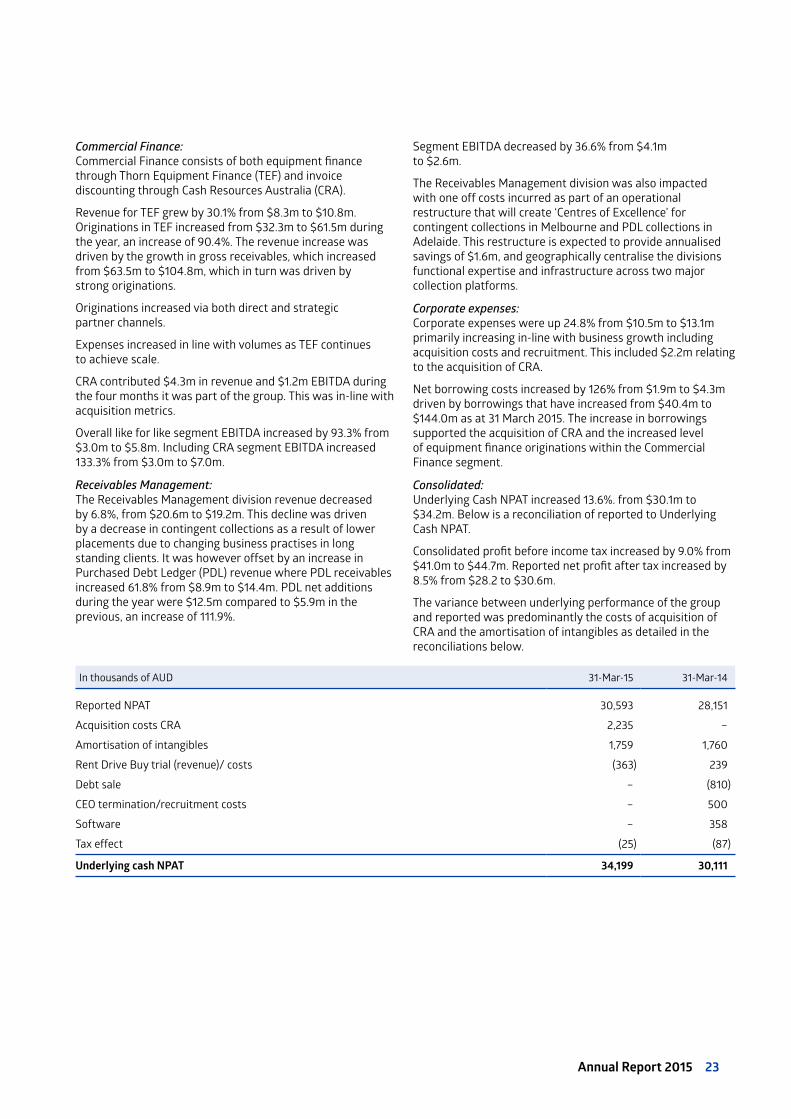
Commercial Finance:Commercial Finance consists of both equipment finance through Thorn Equipment Finance (TEF) and invoice discounting through Cash Resources Australia (CRA).
Revenue for TEF grew by 30.1% from $8.3m to $10.8m. Originations in TEF increased from $32.3m to $61.5m during the year, an increase of 90.4%. The revenue increase was driven by the growth in gross receivables, which increased from $63.5m to $104.8m, which in turn was driven by strong originations.
Originations increased via both direct and strategic partner channels.
Expenses increased in line with volumes as TEF continues to achieve scale.
CRA contributed $4.3m in revenue and $1.2m EBITDA during the four months it was part of the group. This was in-line with acquisition metrics.
Overall like for like segment EBITDA increased by 93.3% from $3.0m to $5.8m. Including CRA segment EBITDA increased 133.3% from $3.0m to $7.0m.
Receivables Management:The Receivables Management division revenue decreased by 6.8%, from $20.6m to $19.2m. This decline was driven by a decrease in contingent collections as a result of lower placements due to changing business practises in long standing clients. It was however offset by an increase in Purchased Debt Ledger (PDL) revenue where PDL receivables increased 61.8% from $8.9m to $14.4m. PDL net additions during the year were $12.5m compared to $5.9m in the previous, an increase of 111.9%.
Segment EBITDA decreased by 36.6% from $4.1m to $2.6m.
The Receivables Management division was also impacted with one off costs incurred as part of an operational restructure that will create ‘Centres of Excellence’ for contingent collections in Melbourne and PDL collections in Adelaide. This restructure is expected to provide annualised savings of $1.6m, and geographically centralise the divisions functional expertise and infrastructure across two major collection platforms.
Corporate expenses:Corporate expenses were up 24.8% from $10.5m to $13.1m primarily increasing in-line with business growth including acquisition costs and recruitment. This included $2.2m relating to the acquisition of CRA.
Net borrowing costs increased by 126% from $1.9m to $4.3m driven by borrowings that have increased from $40.4m to $144.0m as at 31 March 2015. The increase in borrowings supported the acquisition of CRA and the increased level of equipment finance originations within the Commercial Finance segment.
Consolidated:Underlying Cash NPAT increased 13.6%. from $30.1m to $34.2m. Below is a reconciliation of reported to Underlying Cash NPAT.
Consolidated profit before income tax increased by 9.0% from $41.0m to $44.7m. Reported net profit after tax increased by 8.5% from $28.2 to $30.6m.
The variance between underlying performance of the group and reported was predominantly the costs of acquisition of CRA and the amortisation of intangibles as detailed in the reconciliations below.
In thousands of AUD 31-Mar-15 31-Mar-14
Reported NPAT 30,593 28,151
Acquisition costs CRA 2,235 –
Amortisation of intangibles 1,759 1,760
Rent Drive Buy trial (revenue)/ costs (363) 239
Debt sale – (810)
CEO termination/recruitment costs – 500
Software – 358
Tax effect (25) (87)
Underlying cash NPAT 34,199 30,111

24 Thorn Group
Directors’ Report
Operating and Financial Review (continued)Financial position and cash flows
Summarised financial position($m)
Mar-15 Mar-14
excl. Trust (i) incl. Trust excl. Trust (i) incl. Trust
Cash at Bank 13.9 13.9 2.4 2.4
Receivables 215.8 289.6 126.8 158.0
Investment in unrated notes 13.8 – 6.2 –
Other assets 40.1 40.1 60.3 60.3
Intangibles 32.9 32.9 31.7 31.7
Total Assets 316.5 376.5 227.4 252.4
Borrowings 84.0 144.0 15.5 40.5
Other liabilities 43.0 43.0 40.3 40.3
Total Liabilities 127.0 187.0 55.8 80.8
Total Equity 189.5 189.5 171.6 171.6
Net Gearing (ii) 38.6% n/a 8.4% n/a
Cash flows from operating activities 102.9 102.9 104.0 104.0
EPS Basic n/a 20.3 n/a 18.9
EPS Diluted n/a 20.3 n/a 18.9
ROE (iii) 16.9% 16.9% 17.2% 17.2%
Underlying Cash ROE (iv) 18.9% 18.9% 18.4% 18.4%
(i) Excludes the impact of receivables from TEF that are sold down to a warehouse funding facility.(ii) Gearing is calculated as net debt (senior borrowings less free cash) divided by closing equity.(iii) ROE is calculated as NPAT divided by the average of opening and closing equity.(iv) Underlying Cash ROE is calculated as Underlying Cash NPAT divided by the average of opening and closing equity.
Receivables:Net receivables increased by 83.3% to $289.6m during the year. Gross consumer lease receivables grew by 75.2% to $219.6m driven by both the movement to finance leases from operating leases and increased originations since the introduction of RTB 48 month contract. Gross consumer finance receivables increased by 56.0% to $44.3m. Gross equipment finance lease receivables within the commercial finance segment increased by 65.0% to $104.8m.
Other assets:The decrease in other assets is predominantly from the decrease in rental assets by 36.9% from $52.6m to $33.2m. This decrease has been driven by the move from operating lease to finance lease.
Borrowings and gearing:Total borrowings have increased from $40.5m in the PCP to $144.0m. This increase has been driven predominantly by the acquisition of CRA and the increase of TEF lease receivables.
Net gearing has increased from 8.4% PCP to 38.6%. This increase is predominantly due to the funding of the CRA acquisition and increase in consumer finance receivables from senior debt. Senior debt increased from $15.5m PCP to $84.0m.
The consolidated entity continues to meet all debt covenants.
ROE:The group has continued to achieve high returns underpinned by growth in earnings and close management of capital. Underlying Cash ROE increased from 18.4% to 18.9% whilst ROE decreased from 17.2% to 16.9% predominantly due to the acquisition costs of CRA.
EPS:Earnings per share increased from 18.9 cents to 20.3 cents during the year in line with increased NPAT supported by an increase in lower cost debt funding.
Cash flows:Net cash from operating activities decreased from $104.0m to $102.9m. This was primarily attributable to the overall lower average lease payment received due to the expansion of the RTB 48 month contract, increased PDL acquisition and increased Consumer Finance originations.
Cash flows from investing activities were an outflow of $182.0m compared to the previous year’s outflow of $106.1m. This was predominantly driven by the net cash outflows for the acquisition of CRA ($43.3m) and the increased net cash originations in Commercial Finance, up from $32.3m to $61.5m.
Cash flows from financing activities increased to a $90.6m inflow from a $390k outflow in the PCP. This was predominantly due to the increase in debt funding.

Annual Report 2015 25
Funding:The group has the following debt facilities:
Facility
2015 2014
Limit Drawn Limit Drawn
Senior $110.0m $84.0m $50.0m $15.5m
Warehouse $100.0m $60.0m $50.0m $25.0m
Total $210.0m $144.0m $100.0m $40.5m
The $110.0m senior facility is secured by a fixed and floating charge over the assets of the consolidated entity. Both the increase in the facility and the drawings was driven predominantly by the acquisition of CRA during the period.
The warehouse facility was increased from $50.0m to $100.0m during the year to accommodate the strong growth in receivables within the Commercial Finance segment. This facility is secured by rentals and payments receivable from the underlying lease receivable contracts.
Dividends paid or recommendedDividends paid by the Company to members during the financial year were:
Cents per share
Amount $'000
Franked / unfranked
Date of payment
2015
Final 2014 6.5 9,717 Franked 17-Jul-14
Interim 2015 5.0 7,532 Franked 22-Jan-15
Total amount 17,249
After balance date the following dividend was proposed by the directors:
Final 2015 6.75 10,215 Franked
Strategic initiatives and prospectsThorn Group will continue with its organic and acquisitive growth strategy aimed at delivering sustained growth and long term shareholder value. The group will continue to focus on the growth of its Consumer Leasing business as well as growing its other business segments to drive greater diversification of returns and risk.
The following initiatives, which include the introduction of new products and further expansion of each operating segment, continues the consolidated entity’s strategy of providing alternative financial solutions.
Consumer Leasing:• A brand evolution pilot in order to attract a broader
demographic and expanded customer base leading to increased volume and revenues;
• New propositions including mobile voice and data plans and interest free purchases; and
• A pilot second consumer rental brand, utilising re-rent stock and offering a “No lock-in contract” to meet market demand for flexible rental solutions was launched in Brisbane in December under the brand name Rentlo.
Consumer Finance:• Consolidation of current multi branded consumer
loan offerings to a simpler and more comprehensive consolidated proposition.
• Refinement of origination technology to support optimised customer experience and process efficiency.
• Continued expansion of distribution footprint to grow sales volumes.
Commercial Finance:• Expanded product offerings to include residual value for
selected assets, vendor finance, trade finance and premium funding;
• A ‘Commercial Direct’ pilot was launched in February to improve access to suppliers and SME users of commercial rental;
• A specialised ‘Franchise Finance’ strategic alliance has been established to improve access to the franchise sector; and
• Continue the integration of CRA into the segment and incentivise and promote cross selling opportunities.
Receivables Management:• Continue the momentum in high quality PDL purchases; and• Restructure into centres of excellence including contingent
collections in Melbourne and PDL collections in Adelaide.

26 Thorn Group
Directors’ Report
Operating and Financial Review (continued)RisksCredit risk is the most significant risk to the consolidated entity. Credit risk grew in-line with the growth of the loan and lease receivables in all segments, except TFS where bad debts increased slightly as a percentage of the loan receivables.
Regulatory risk in relation to changes of law or regulations that impact the operations or results of the groups activities remains a key focus for the consumer segments.
Liquidity risk is managed through the adequate provision of funding and effective capital management policies. Thorn will continue to diversify its funding sources to further mitigate this risk into the future.
The group is also subject to currency risk related to the direct acquisition of rental assets from overseas suppliers. To mitigate this risk the group operates a foreign exchange hedging policy.
OutlookThe strategic initiatives implemented in the current financial year and into the future will ensure Thorn Group continues to maximise shareholder value into the future while diversifying returns and risk.
The Group will continue to review acquisition opportunities in all its operating segments that are consistent with our strategy and where we can extract value and add scale to our existing platforms.
Thorn expects continued growth in receivables will be the basis for growth of all parts of the business.
Directors InformationJoycelyn Morton(Age 56)Independent, Non-ExecutiveAppointed 1 October 2011
QualificationsBachelor of Economics
ExperienceJoycelyn has more than 35 years experience in finance and taxation having begun her career with Coopers & Lybrand (now PwC), followed by senior management roles with Woolworths Limited and global leadership roles in Australia and internationally within the Shell Group of companies.
She is a Fellow of CPA Australia, Chartered Accountants Australia and New Zealand, the National Institute of Accountants, the Australian Institute of Company Directors and the Governance Institute of Australia.
Other current directorshipsArgo Investments Limited,Snowy Hydro LimitedFormer directorshipsCrane Group LimitedCount Financial LimitedNoni B Limited
Interests in shares and options62,018 ordinary shares
James Marshall(Age 43)Managing DirectorAppointed: 5 May 2014
QualificationsDip. Financial Services
ExperienceJames joined the company in 1993 and held several frontline and senior management positions prior to joining the Executive Team which took the company to public listing in 2006.
James has extensive knowledge of the consumer leasing and receivables management industries and has been instrumental in driving the development and growth of Thorn’s core business divisions and diversification strategy since the IPO.
Other current directorships
Former directorships
Interests in shares and options131,085 ordinary shares
Stephen Kulmar(Age 62)Independent, Non-ExecutiveAppointed: 15 April 2014
Qualifications
ExperienceStephen is the former Managing Director and Chairman of IdeaWorks and is currently the Managing Director of Retail Oasis, a boutique retail marketing services company.
Steve has over 30 years experience in advertising and has extensive experience in retail strategy, brand strategy, channel to market strategy, business re-engineering and new retail business development.
Other current directorshipsRCG Corporation LimitedRetail Oasis Pty LtdFormer directorshipCharles Parsons Pty Ltd
Interests in shares and options60,000 ordinary shares

Annual Report 2015 27
Peter Henley(Age 68)Independent, Non-ExecutiveAppointed: 21 May 2007
Qualifications
ExperiencePeter has had a long and distinguished career in financial services generally and in consumer and commercial finance in particular, having held Managing Director roles with AGC, Nissan Finance and more recently GE Money.
Peter is a Fellow of the Australian Institute of Management and a member of the Australian Institute of Company Directors.
Other current directorshipsAP Eagers LimitedMTA Insurances Limited until sold to Suncorp Insurances August 2014.
Former directorshipGE Motor Solutions Australia GE MoneySingapore and MalaysiaUnited Financial Services Limited
Interests in shares and options71,499 ordinary shares
David Foster(Age 46)Independent, Non-ExecutiveAppointed: 1 December 2014
QualificationsBachelor of Applied ScienceMaster of Business Administration
ExperienceDavid Foster has had an extensive career in Financial Services spanning over 25 years.
His most recent executive role until December 2013 was CEO of Suncorp Bank, a role he commenced in September 2008. Prior to his role as CEO of Suncorp Bank, David lead Suncorp’s strategy function which included numerous merger and acquisition activities including one of Australia’s largest Financial Services transactions – Promina Limited.
Other current directorships
Former directorships
Interests in shares and options21,490 ordinary shares
David Carter(Age 61)Independent, Non-ExecutiveAppointed 3 November 2006Retired 17 November 2014
QualificationsBachelor of Economics, Bachelor of Law (Hons), Masters of Law, and a Bachelor of Civil Law
ExperienceDavid passed away January 2015.
David was a lawyer and corporate advisor who was previously a partner of a major international law firm. David ran his own legal and corporate advisory practice. David had significant experience in corporate governance, M&A, commercial and international law. David was a Member of the Australian Institute of Company Directors.
Other current directorships
Former directorshipsAzure Healthcare LimitedVictorian Energy Network Corporation
Interests in shares and options
John Hughes(Age 63)ExecutiveAppointed 3 November 2006Retired 30 June 2014
QualificationsBachelor of Commerce
ExperienceJohn has over 35 years experience as a senior executive in a number of leading Australian and international companies including Rural Holding Limited, Thorn EMI Rentals Australasia, Sharp Corporation, Competitive Foods, and Grace Bros.
John is a Fellow of the Australian Institute of Company Directors.
Other current directorships
Former directorships
Interests in shares and options

28 Thorn Group
Directors’ Report
Company SecretaryPeter Eaton joined the Company in 1999 and has held the positions of Chief Financial Officer and Company Secretary since August 2006. Peter holds a Bachelor of Commerce degree from the University of Western Sydney, is a member of CPA Australia and has undertaken the Senior Executive programme at London Business School.
Directors’ MeetingsThe number of directors’ meetings (including meetings of committees of directors) and number of meetings attended by each of the directors of the Company during the financial year are detailed below.
DirectorBoard Meetings Audit, Risk and Compliance
Committee MeetingsRemuneration and Nomination
Committee Meetings
A B A B A B
Joycelyn Morton 13 13 7 7 4 4
James Marshall 12 12 7 7 3 3
Stephen Kulmar 11 12 6 7 3 3
Peter Henley 12 13 7 7 4 4
David Foster 5 5 4 4 1 1
David Carter 7 9 3 4 2 3
John Hughes 4 4 2 2 2 2
A – Number of meetings attendedB – Number of meetings held during the time the director held office during the year
(a) Mr James Marshall was appointed to the Board on 5 May 2014. He was not a member of the Audit Risk and Compliance Committee or the Remuneration and Nomination Committee but attended the meetings by invitation.
(b) Mr John Hughes retired from the Board effective 30 June 2014. During his term as Chief Executive and Managing Director, he was not a member of the Audit Risk and Compliance Committee or the Remuneration and Nomination Committee but attended the meetings by invitation.
(c) Mr Stephen Kulmar was appointed as a non-executive director on 15 April 2014.(d) Mr David Foster was appointed as a non-executive director on 1 December 2014.(e) Mr David Carter retired from the Board effective 17 November 2014.
Remuneration Report – AuditedThe directors are pleased to present the remuneration report setting out the remuneration information for key management personnel (KMP), for the year ended 31 March 2015 and is prepared in accordance with section 300A of the Corporations Act 2001.
The KMP of the Company and the consolidated entity for the year ended 31 March 2015 were:
DirectorsJoycelyn MortonStephen Kulmar (appointed 15 April 2014)Peter HenleyDavid Foster (appointed 1 December 2014)David Carter (retired 17 November 2014)
Senior ExecutivesJames Marshall Chief Executive Officer (CEO)John Hughes Former Chief Executive Officer (retired 30 June 2014)Peter Eaton Chief Financial Officer (CFO)Derrick Hubble General Manager Consumer LeasingMatt Ingram General Manager Commercial FinanceRob Price General Manager Consumer FinanceSean Jones General Manager Receivables ManagementRichard Shepherd Former General Manager Consumer Finance (resigned 30 January 2015)

Annual Report 2015 29
2015 Remuneration highlights
Appointment of new CEO • James Marshall, previously Chief Operating Officer was appointed to replace John Hughes as Chief Executive Officer and Managing Director effective 1 June 2014.
• Mr Marshall’s annual remuneration was set at the time of his appointment and his current remuneration is detailed on page 34.
Short term incentives (STI) reflect on target performance for 2015
• 2015 financial performance was ahead of both the prior comparative period and budget.• Performance in the Receivables Management division was below budget and impacted the
Group’s performance.• Consequently the average short term incentive is at the bottom of the range.
Long term incentives (LTI) • There were no performance rights due to vest during the 2015 year.• LTI were granted to KMP and other Leadership team members during the 2015 year
(‘2014 LTI’).• The details of the LTI is on pages 31 to 32.
Senior Executive retention payments • A retention payment of $100,000 was paid to James Marshall, CEO and Peter Eaton, CFO.• This is explained on page 33.
2014 AGM remuneration vote • The remuneration report was voted on via a poll.• 91.58% of the votes cast were for the remuneration report.
Principles of remunerationThe remuneration framework is set out to ensure rewards are appropriate for results achieved and are aligned to corporate strategic goals and shareholder wealth creation. The Board and Remuneration and Nomination Committee ensure sound remuneration governance practice, that KMP remuneration is competitive and transparent, whilst aligning shareholder interests through creation of sustainable growth and ensuring rewards reflect actual performance.
Remuneration levels for KMP are competitively set to attract and retain appropriately qualified and experienced directors and executives. Independent advice is obtained on the appropriateness of remuneration packages, given trends in comparable companies and the objectives of the Company’s remuneration strategy.
The remuneration structures explained below are designed to attract suitably qualified candidates, reward the achievement of strategic objectives and achieve the creation of value for shareholders. The remuneration structures take into account:• the capability and experience of the executive;• the executive’s ability to influence the relevant performance; and• the consolidated entity’s performance including:
– the consolidated entity’s earnings; – the growth in share price and delivering constant returns on shareholder wealth; and – the amount of incentives within each executive’s compensation.
Fixed remuneration STI LTI
• Includes base salary, superannuation and fringe benefits
• Set with reference to the market, internal relativities, qualifications, skills, performance and experience
• Reviewed annually1
• Annual cash payment• Eligibility for payment depends on
the Company achieving its budgeted NPAT as well as achievement against individual KPIs
• KPIs are set at the start of each financial year
• The LTI is a performance rights scheme with a 3 to 5 year vesting period
• For the 2012 plan no LTI vests if a ROCE gateway hurdle is not met
• For the 2014 plan no LTI vests if a ROE gateway hurdle is not met
• If the gateway hurdle is met, vesting of the performance rights depends on the Company’s TSR performance relative to a peer group1.
1 Remuneration is reviewed annually against comparable ASX listed entities. A list of these entities is available on the Thorn website (www.thorn.com.au)
The performance based STI and LTI components are described in more detail on pages 30 to 32.

30 Thorn Group
Directors’ Report
Principles of remuneration (continued)i) Short Term IncentivesThe STI is an annual cash incentive reviewed by the Board against operational and financial Key Performance Indicators (KPIs) for the financial year. The following table outlines the major features of the 2015 STI:
Features Description
Funding of the STI • The STI pool is funded when the Company achieves 95% of its budgeted NPAT• No STI is payable if the Company does not meet 95% of its budgeted NPAT
Minimum requirements
• No amount of STI is paid if budgeted NPAT is not met
STI that can be earned • Below 95% of target performance – nil• On 95% of target performance – 12.5 to 15 per cent of fixed base• On target performance – 25 to 30 per cent of fixed base• Maximum STI for stretch performance – 60 to 100 percent of fixed base• A sliding scale is applied when performance is between 95% of “target” and “target” and again between
“target” and “stretch”
What is target performance?
• Target performance is budgeted NPAT
What is stretch performance?
• Stretch performance is when actual NPAT is equal to or greater than 110% of budgeted NPAT
KPIs • Individual KPIs are set at the beginning of each financial year comprising financial and non-financial measures
Weighting of KPIs For C-level:• 70 per cent relates to Group financial KPIs• 30 per cent relates to non-financial KPIsFor GMs:• 30 per cent relates to Group financial KPIs• 30 per cent relates to Divisional financial KPIs• 40 per cent relates to non-financial KPIs
What is the financial KPI?
• Budgeted NPAT for the Group and budgeted EBIT for the divisions
What are the non-financial KPIs?
• The non-financial KPIs are agreed with the Board at the start of the financial year• Vary with position and responsibility• The KPIs relate to people, customer satisfaction, strategy, systems, risk and staff development
Performance period • 1 April 2014 to 31 March 2015
Assessment & Approval
• At the end of the financial year, the Remuneration and Nomination Committee assesses the actual performance of the consolidated entity, and each individual’s performance against the KPIs to determine how much of the bonus pool is payable
• The Board has the discretion to take into account unbudgeted extraordinary items approved by the Board• The performance evaluation in respect of the year ended 31 March 2015 has taken place in accordance with
this process. The Remuneration and Nomination Committee recommends the cash incentive to be paid to the individuals for approval by the Board
2015 performance • The financial hurdle was met• The amounts payable to KMP are detailed on page 37
Deferred component • The Board has determined that it is not appropriate to introduce a deferral due to: – The nature of the business is such that it is very difficult to shift profit between years; – The profit budget is increased annually so that management is highly motivated to achieve those budgets out of annual revenues; and
– The quality of earnings is high and the risk of deferral is low• While the Board did not move to include a deferral of STI in 2015 and does not expect it will do so in 2016,
it has determined to keep the matter under review as it moves forward with an overall review of the remuneration framework
Clawback provisions • The Board has not yet adopted a clawback policy as the Long Term Incentive, which vests over 3, 4 and 5 years provides the capacity to clawback a component of remuneration in the event of a matter of significant concern

Annual Report 2015 31
ii) Long Term Incentive (LTI)The Company currently has two LTI schemes in operation. The 2012 plan was granted in December 2012 in the form of performance rights. The 2014 plan was granted in July 2014 in the form of performance rights.
The grants are directly linked to the performance of the Company, the returns generated and relative increases in shareholder wealth. This structure is used to ensure appropriate alignment to shareholder value over a specified timeframe.
Performance rights provide the right to receive shares only if and when a particular performance based hurdle and vesting condition are met. The holders of the performance rights are entitled to receive one ordinary share per performance right.
The following table sets out the key features of the 2012 LTI plan:
Features Description
Instrument • Performance rights – zero exercise price options
Maximum LTI award level
• LTI awards are capped at 50% of fixed remuneration at grant date using the face value of the shares at grant date to calculate the number to be granted
Dividend treatment • No dividends are paid on unvested awards
Share dilution limits • No share dilution limits are in place given the quantum of the LTI
Gateway Hurdle • The average Return on Capital Employed (ROCE) for the measurement period must be equal to or greater than 20%• If ROCE < 20%: no performance rights vest• If ROCE > 20%: performance rights are able to vest subject to the performance hurdles (see below) being met
Why ROCE was chosen
• It is a key indicator of the quality and efficiency of the returns the consolidated entity is achieving and is aligned to shareholder wealth
Why was ROCE set at 20%
• While the 20% ROCE hurdle is lower than the ROCE performance in the previous years, it appropriately reflects the change in business model
• The Company’s strategy to be a diversified financial services organisation has seen lease and loan receivables grow substantially but ahead of earnings performance
• The Company has expanded its services to grow but margins will be lower than when the business was primarily Radio Rentals
• The Remuneration and Nomination Committee and the Board therefore consider that the 20% ROCE hurdle is appropriate
• It is important to recognise that 20% ROCE has been set as a gateway. It opens the gate for testing against TSR• The ROCE calculation will be audited
Performance Hurdles
• The company’s TSR performance is measured against 30 comparable ASX listed securities (available at www.thorn.com.au)
• Where the Company’s TSR performance is rated below the 50th percentile, no performance rights vest• Proportionate vesting occurs if the Company is ranked at or above the 50th percentile until the 90th
percentile, when 100% of the rights vest
Why TSR was chosen
• It is widely accepted as an objective indicator of shareholder wealth criterion as it includes share price growth, dividends and other capital adjustments
• TSR will be calculated by an independent expert
Performance period • The performance period for the LTI is 5 years
Vesting Dates • 1/3 of the grant vests at 3 years• 1/3 of the grant vests at 4 years• 1/3 of the grant vests at 5 years
Testing • The LTI is currently structured to vest over 5 years to align with a shareholder’s long term perspective• The Board believes it is appropriate to vest the LTI if the gateway hurdle and performance hurdle has been
met over the 5 year period notwithstanding that it may not have been met at 3 or 4 year test dates• The current structure ensures the executive team remains focussed on improving shareholder returns over
a 5 year period
Termination • In the event that a participant’s employment is terminated, any unvested performance rights will lapse
Clawback provisions • There are no clawback provisions• The LTI has an extended vesting period, vesting in 3, 4 and 5 years• The extended vesting period provides the capacity to clawback a component of remuneration in the event
of a matter of significant concern

32 Thorn Group
Directors’ Report
Principles of remuneration (continued)ii) Long Term Incentive (LTI) (continued)The following table sets out the key features of the 2014 LTI plan:
Features Description
Instrument • Performance rights – zero exercise price options
Maximum LTI award level
• LTI awards are capped at a maximum of 50% of fixed remuneration at grant date using the face value of the shares at grant date to calculate the number to be granted
Dividend treatment • No dividends are paid on unvested awards
Share dilution limits • No share dilution limits are in place given the quantum of the LTI
Gateway Hurdle • The average Return on Equity (ROE) for the measurement period must be equal to or greater than 18.5%• If ROE < 18.5%: no performance rights vest• If ROE > 18.5%: performance rights are able to vest subject to the performance hurdles (see below) being met
Why ROE was chosen
• It is a key indicator of the quality and efficiency of the returns the consolidated entity is achieving and is aligned to shareholder wealth
• Alignment with financial services industry key benchmarks
Why was ROE set at 18.5%
• The change from ROCE to ROE for the 2014 plan was due to the evolution of the Group towards financial services and to better align with organisations within that sector
• While the 18.5% ROE hurdle is lower than the ROE performance in the previous years, it appropriately reflects the change in business model
• The Company’s strategy to be a diversified financial services organisation has seen lease and loan receivables grow substantially but ahead of earnings performance
• The Company has expanded its services to grow but margins will be lower than when the business was primarily Radio Rentals
• The Remuneration and Nomination Committee and the Board therefore consider that the 18.5% ROE hurdle is appropriate
• It is important to recognise that 18.5% ROE has been set as a gateway. It opens the gate for testing against TSR
• The ROE calculation will be audited
Performance Hurdles
• The company’s TSR performance is measured against 28 comparable ASX listed securities (available at www.thorn.com.au)
• Where the Company’s TSR performance is rated below the 50th percentile, no performance rights vest• Proportionate vesting occurs if the Company is ranked at or above the 50th percentile until the 90th
percentile, when 100% of the rights vest
Why TSR was chosen
• It is widely accepted as an objective indicator of shareholder wealth criterion as it includes share price growth, dividends and other capital adjustments
• TSR will be calculated by an independent expert
Performance period • The performance period for the LTI is 3 years (1 April 2014 to 31 March 2017)
Vesting Date • 1 June 2017• 100% of the grant vests at 3 years
Testing • The LTI is structured to vest over 3 years to align with a shareholder’s long term perspective• The LTI is not subject to re-testing
Termination • In the event that a participant’s employment is terminated, any unvested performance rights will lapse
Clawback provisions • There are no clawback provisions

Annual Report 2015 33
CEO and CFO retention paymentsThe Board recognised that the continuing arrangement with the former CEO John Hughes may be perceived to impact the career paths of the current CEO James Marshall and CFO, both of whom the Board considered key to the ongoing success of the Company.
The Board recognised that the LTI grant in December 2012 did not have a strong retention effect as there were no other LTI amounts vesting before May 2015. In order to address this, the current CEO and CFO would receive retention payments.
In the 2015 financial year, the current CEO and CFO were paid an additional $100,000 each (2014 $50,000).
In the 2016 financial year, the CFO will be paid a further $100,000 should he remain with the Company until 31 May 2015. This payment will be made in the form of equity.
Services from Remuneration ConsultantsThe Remuneration and Nomination Committee engaged Executive Research Services (ERS) as remuneration consultant to the Board to review the amounts and elements of the KMP remuneration and provide recommendations in relation thereto. ERS provided valuable market analysis in relation to the remuneration of the KMP, non-executive directors and other general managers of the consolidated entity.
Consultant fees incurred for the financial year were $21,500. The Board is satisfied that the remuneration recommendations made by ERS are free from undue influence by members of the KMP about whom the recommendations may relate as the consultants were directly engaged by and reported to the Board.
Consequences of Performance on Shareholders’ WealthIn considering the consolidated entity’s performance and benefits for shareholders’ wealth, the Board have regard to the following indices in respect of the current financial year and the four previous financial years.
2015 2014 2013 2012 2011
Profit attributable to owners of the company $30,593,000 $28,151,000 $28,021,000 $27,849,000 $22,038,000
Basic EPS 20.34¢ 18.94¢ 19.11¢ 19.24¢ 16.84¢
Dividends paid $17,249,000 $15,563,000 $14,656,000 $12,272,000 $9,464,000
Dividends per share 11.50¢ 10.50¢ 10.00¢ 8.95¢ 7.30¢
Change in share price 0.52 0.09 0.49 (0.62) 1.07
Return on capital employed (i) 18.48% 21.83% 24.78% 30.34% 35.02%
Return on equity (ii) 16.94% 17.22% 18.96% 23.68% 24.93%
Return on equity (iii) 18.90% 18.40% 18.96% 23.68% 24.93%
(i) Calculated as EBIT divided by average capital employed (net debt plus equity).(ii) Calculated as NPAT divided by the average equity.(iii) Calculated as Underlying Cash NPAT divided by the average equity.

34 Thorn Group
Directors’ Report
Principles of remuneration (continued)Senior Executive Contract detailsThe remuneration details of the key management personnel from 1 April 2015 are:
Name Title Term / Notice Details
James Marshall Chief Executive Officer and Managing Director
Ongoing6 month notice period
• Annual base salary of $550,000 inclusive of superannuation.
• No termination benefit is payable.
Peter Eaton Chief Financial Officer Ongoing3 month notice period
• Annual base salary of $367,500 inclusive of superannuation.
• A retention payment of $100,000 is payable at 31 May 2015 in the form of equity.
• No termination benefit is payable.
Derrick Hubble GM – Consumer Leasing Ongoing3 month notice period
• Annual base salary of $290,286 inclusive of superannuation.
• No termination benefit is payable.
Matt Ingram GM – Business Finance Ongoing3 month notice period
• Annual base salary of $267,597 inclusive of superannuation.
• No termination benefit is payable.
Rob Price GM – Consumer Finance Ongoing3 month notice period
• Annual base salary of $256,247 inclusive of superannuation.
• No termination benefit is payable.
Sean Jones GM – Credit Management
Ongoing3 month notice period
• Annual base salary of $230,000 inclusive of superannuation.
• No termination benefit is payable.
Non-Executive DirectorsTotal remuneration for all non-executive directors, last voted upon by shareholders at the 2013 AGM, is not to exceed $650,000 per annum and is set based on advice from external advisors with reference to fees paid to other non-executive directors of comparable companies.
The following fee structure was applicable for the financial years:
Base fees per annum 2015 2014
Chair of the Board $170,980 $166,000
Directors $85,490 $83,000
Additional fees per annum
Chair of Audit, Risk and Compliance Committee $15,000 $15,000
Chair of Remuneration and Nomination Committee $10,000 $10,000
Notes to the Non-Executive Directors fees• Non-executive directors do not receive performance-related remuneration and do not participate in employee share based
payment schemes.• No Committee fees were paid in 2015 as they were incorporated into the base fees.• The above fees do not include superannuation.

Annual Report 2015 35
Directors’ and Executive Officers’ Remuneration (Company and Consolidated – Audited)Details of the nature and amount of each major element of remuneration of each director of the Company and other KMP of the consolidated entity are:
2015 Short-term
Post-employ-
mentLong-term
benefits
Share-based
payments
Name
Salary & fees
$
STI cashbonus
$(A)
Other benefits
$(B)
Super-annuation
benefits$
LongService
Leave$
Retentionpayment
$
Options and
rights$(C)
Total$
Non-Executive Directors
Joycelyn Morton 140,729 – – 13,313 – – – 154,042
Stephen Kulmar1 89,933 – – 8,501 – – – 98,434
Peter Henley 84,226 – – 7,954 – – – 92,180
David Foster2 32,852 – – 3,121 – – – 35,973
David Carter3 86,831 – – 8,153 – – – 94,984
Subtotal non-executive directors 434,571 – – 41,042 – – – 475,613
Executive Directors
James Marshall 435,796 152,505 1,439 18,551 93,946 50,000 103,369 855,606
John Hughes4 180,830 – 300,000 4,824 1,261 37,500 – 524,415
Subtotal Executive directors 616,626 152,505 301,439 23,375 95,207 87,500 103,369 1,380,021
Total directors remuneration 1,051,197 152,505 301,439 64,417 95,207 87,500 103,369 1,855,634
Other Key Management Personnel
Peter Eaton 331,217 104,030 – 18,551 17,937 133,333 92,165 697,233
Derrick Hubble 230,000 65,957 7,213 20,648 – – 10,744 334,562
Matt Ingram 229,224 63,336 50,000 18,551 – – 10,658 371,769
Rob Price5 38,923 8,903 12,500 3,179 – – – 63,505
Sean Jones 182,745 27,607 – 16,930 – – 8,595 235,877
Richard Shepherd6 213,666 – – 15,661 – – – 229,327
Subtotal other Key Management Personnel 1,225,775 269,833 69,713 93,520 17,937 133,333 122,161 1,932,272
Total Key Management Personnel compensation (group) 2,276,972 422,338 371,152 157,937 113,144 220,833 225,530 3,787,906
1 The remuneration for Stephen Kulmar for 2015 reflects remuneration during the period from 15 April 2014, the date of his appointment2 The remuneration for David Foster for 2015 reflects remuneration during the period from 1 December 2014, the date of his appointment3 The remuneration of David Carter for 2015 reflects remuneration during the period to 17 November 2014, the date of his resignation4 The remuneration of John Hughes for 2015 reflects remuneration during the period to 30 June 2014, the date of his retirement and
included in other benefits is his termination payment5 The remuneration of Rob Price for 2015 reflects remuneration during the period from 27 January 2015, the date of his appointment6 The remuneration of Richard Shepherd for 2015 reflects remuneration during the period to 30 January 2015, the date of his resignation.

36 Thorn Group
Directors’ and Executive Officers’ Remuneration (Company and Consolidated – Audited) (continued)
2014 Short-term
Post-employ-
mentLong-term
benefits
Share-based
payments
Name
Salary & fees
$
STI cashbonus
$(A)
Non-monetary
benefits$(B)
Super-annuation
benefits$
LongService
Leave$
Retentionpayment
$
Options and
rights$(C)
Total$
Non-Executive Directors
David Carter 166,000 – – 15,259 – – – 181,259
Peter Henley 83,000 – – 7,630 – – – 90,630
Joycelyn Morton 98,000 – – 9,008 – – – 107,008
Paul Lahiff 1 33,200 – – 3,023 – – – 36,223
Subtotal non-executive directors 380,200 – – 34,920 – – – 415,120
Executive Directors
John Hughes 590,526 208,916 3,379 17,474 8,510 150,000 – 978,805
Subtotal Executive directors 590,526 208,916 3,379 17,474 8,510 150,000 – 978,805
Total directors remuneration 970,726 208,916 3,379 52,394 8,510 150,000 – 1,393,925
Other Key Management Personnel
James Marshall 261,178 104,627 11,414 17,474 16,904 100,000 63,700 575,297
Peter Eaton 275,853 104,627 8,289 17,474 4,846 100,000 63,700 574,789
Subtotal other Key Management Personnel 537,031 209,254 19,703 34,948 21,749 200,000 127,400 1,150,085
Total Key Management Personnel compensation (group) 1,507,757 418,170 23,082 87,342 30,259 350,000 127,400 2,544,010
1 The remuneration for Paul Lahiff for 2014 reflects remuneration during the period to 22 August 2013, the date of his retirement.
Notes in relation to the Table of Directors’ and Executive RemunerationA. The short term incentive bonus for 2015 is for performance during the financial year.B. Other benefits as disclosed in both tables includes cost of providing a motor vehicle, any fringe benefits tax attributable
thereto, sign on bonuses and termination payments.C. The fair value of the performance rights is calculated at the date of grant using a Monte Carlo simulation model and
allocated to each reporting period evenly over the period from grant date to the expected vesting date. The value disclosed is the portion of the fair value of the performance rights allocated to this reporting period. In valuing the performance rights, market conditions have been taken into account.
The table below outlines the factors and assumptions were used in determining the fair value of performance rights at grant date.
Grant date Initial Test date Expiry Date
Fair Value Per Performance
RightExercise
Price
Price of Shares on
Grant DateExpected Volatility
Risk Free Interest Rate
Dividend Yield
7 Dec 2012 1 Jun 2015 31 Dec 2017 $1.40 Nil $1.91 32.0% 2.7% 6.0%
7 Dec 2012 1 Jun 2016 31 Dec 2017 $1.28 Nil $1.91 32.0% 2.7% 6.0%
7 Dec 2012 1 Jun 2017 31 Dec 2017 $1.15 Nil $1.91 32.0% 2.7% 6.0%
1 July 2014 1 Jun 2017 31 Jul 2017 $1.24 Nil $2.17 28.0% 2.7% 5.0%
Directors’ Report

Annual Report 2015 37
The below table summarises KMP remuneration split by Fixed, Short Term and Long Term.
Name Fixed % At Risk – STI % At Risk – LTI % Total %
James Marshall 2015 64 24 12 100
2014 51 38 11 100
Peter Eaton 2015 53 34 13 100
2014 52 37 11 100
Derrick Hubble 2015 77 20 3 100
Matt Ingram 2015 67 30 3 100
Rob Price 2015 66 34 – 100
Sean Jones 2015 85 11 4 100
Richard Shepherd 2015 100 – – 100
2015 STI outcomes – auditedThe STI pool was funded as the Company achieved its NPAT target. KMP achieved their personal KPIs which related to new systems, development of new offerings and further development of Company strategic objectives. No bonus payments were forfeited in the period.
Short Term Incentive
Salary ($) % Paid
Included in Remuneration
($)
Directors
James Marshall 490,000 31.12 152,505
Executives
Peter Eaton 350,000 29.72 104,030
Derrick Hubble 268,783 24.54 65,957
Matt Ingram 247,775 25.56 63,336
Rob Price1 248,783 3.58 8,903
Sean Jones 200,000 13.80 27,607
1 The Short Term Incentive for Rob Price is a pro-rata calculation as he commenced with the Company during the measurement period.

38 Thorn Group
Equity InstrumentsPerformance rights granted as compensation in the year
Number Date Min (a) Max (b)
Director
James Marshall 66,556 1 July 2014 2018 Nil N/A
Executive
Peter Eaton 34,425 1 July 2014 2018 Nil N/A
Derrick Hubble 34,425 1 July 2014 2018 Nil N/A
Matt Ingram 34,150 1 July 2014 2018 Nil N/A
Sean Jones 27,540 1 July 2014 2018 Nil N/A
Analysis of performance rights available for vestingDetails of the performance rights available for vesting to each director of the Company and other KMP are detailed below:
Number Date Min (a) Max (b)
Director
James Marshall 63,291 7 Dec 2012 2015 – 2018 Nil N/A
63,291 7 Dec 2012 2016 – 2018 Nil N/A
63,291 7 Dec 2012 2017 – 2018 Nil N/A
66,556 1 July 2014 2018 Nil N/A
Executive
Peter Eaton 63,291 7 Dec 2012 2015 – 2018 Nil N/A
63,291 7 Dec 2012 2016 – 2018 Nil N/A
63,291 7 Dec 2012 2017 – 2018 Nil N/A
34,425 1 July 2014 2018 Nil N/A
Derrick Hubble 34,425 1 July 2014 2018 Nil N/A
Matt Ingram 34,150 1 July 2014 2018 Nil N/A
Sean Jones 27,540 1 July 2014 2018 Nil N/A
(a) The minimum value of the performance rights to vest is nil as the performance rights criteria may not be met and consequently the performance rights may not vest.
(b) The maximum value of the performance rights yet to vest is not determinable as it depends on the market price of shares of the Company on the Australian Securities Exchange at the date the performance rights are exercised.
(c) The performance rights that did not vest will be retested at the next vesting date.
Directors’ Report
Performance Rights GrantedFinancial Year in
Which Grants Vests Values Yet to Vest $
Performance Rights GrantedFinancial Year in
Which Grants Vests Values Yet to Vest $
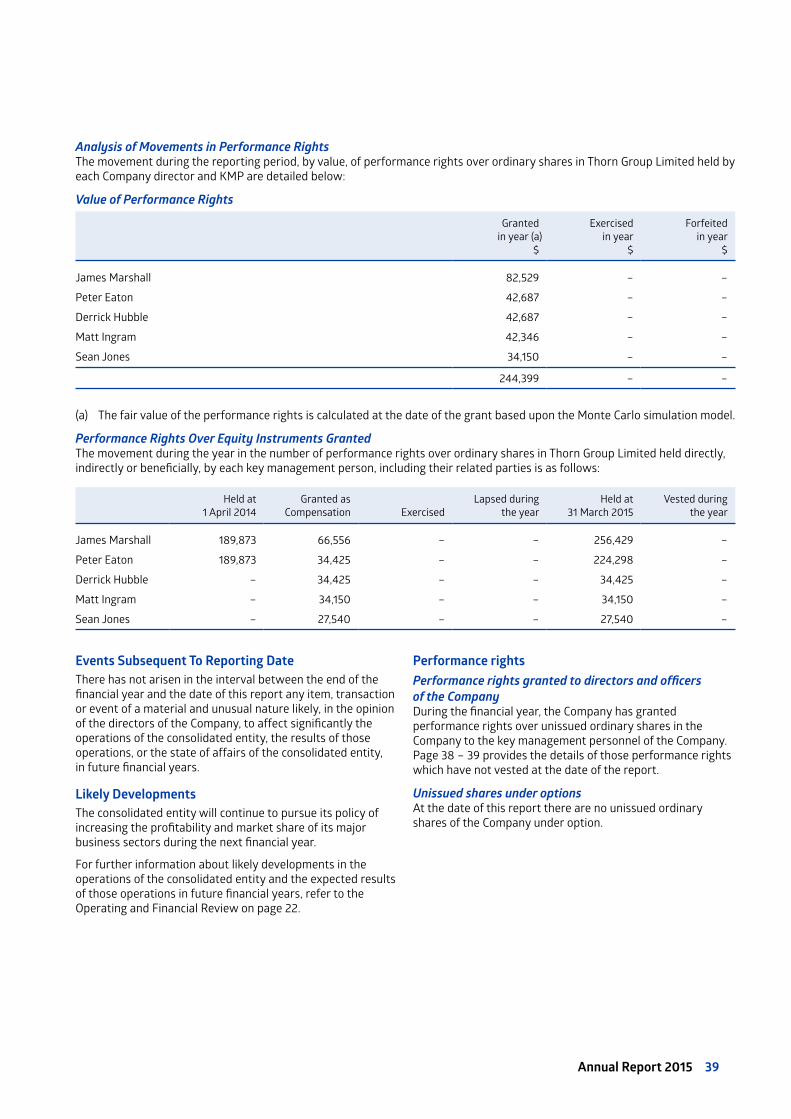
Annual Report 2015 39
Analysis of Movements in Performance RightsThe movement during the reporting period, by value, of performance rights over ordinary shares in Thorn Group Limited held by each Company director and KMP are detailed below:
Value of Performance Rights
Granted in year (a)
$
Exercised in year
$
Forfeited in year
$
James Marshall 82,529 – –
Peter Eaton 42,687 – –
Derrick Hubble 42,687 – –
Matt Ingram 42,346 – –
Sean Jones 34,150 – –
244,399 – –
(a) The fair value of the performance rights is calculated at the date of the grant based upon the Monte Carlo simulation model.
Performance Rights Over Equity Instruments GrantedThe movement during the year in the number of performance rights over ordinary shares in Thorn Group Limited held directly, indirectly or beneficially, by each key management person, including their related parties is as follows:
Held at 1 April 2014
Granted as Compensation Exercised
Lapsed during the year
Held at 31 March 2015
Vested during the year
James Marshall 189,873 66,556 – – 256,429 –
Peter Eaton 189,873 34,425 – – 224,298 –
Derrick Hubble – 34,425 – – 34,425 –
Matt Ingram – 34,150 – – 34,150 –
Sean Jones – 27,540 – – 27,540 –
Events Subsequent To Reporting DateThere has not arisen in the interval between the end of the financial year and the date of this report any item, transaction or event of a material and unusual nature likely, in the opinion of the directors of the Company, to affect significantly the operations of the consolidated entity, the results of those operations, or the state of affairs of the consolidated entity, in future financial years.
Likely DevelopmentsThe consolidated entity will continue to pursue its policy of increasing the profitability and market share of its major business sectors during the next financial year.
For further information about likely developments in the operations of the consolidated entity and the expected results of those operations in future financial years, refer to the Operating and Financial Review on page 22.
Performance rightsPerformance rights granted to directors and officers of the CompanyDuring the financial year, the Company has granted performance rights over unissued ordinary shares in the Company to the key management personnel of the Company. Page 38 – 39 provides the details of those performance rights which have not vested at the date of the report.
Unissued shares under optionsAt the date of this report there are no unissued ordinary shares of the Company under option.

40 Thorn Group
Indemnification and Insurance of Officers and AuditorsIndemnificationThe Company has agreed to indemnify the current, former and subsequent directors and officers of the Company, against all liabilities to another person (other than the Company or a related body corporate) that may arise from their position as directors or officers of the Company and its controlled entities, except where the liability arises out of conduct involving a lack of good faith. The agreement stipulates that the Company will meet the full amount of any such liabilities, including costs and expenses.
Insurance PremiumsDuring the financial year the Company has paid insurance premiums of $44,187 in respect of directors’ and officers’ liability and legal expenses’ insurance contracts, for current and former directors and officers, including senior executives of the Company and directors, senior executives and secretaries of its controlled entities. The insurance premiums relate to:• costs and expenses incurred by the relevant officers in
defending proceedings, whether civil or criminal and whatever their outcome; and
• other liabilities that may arise from their position, with the exception of conduct involving misconduct.
The insurance policies outlined above do not contain details of the premiums paid in respect of individual officers of the Company.
Non-Audit ServicesDuring the year KPMG, the Company’s auditor, has performed certain other services in addition to their statutory duties.
The Board has considered the non-audit services provided during the year by the auditor and is satisfied that the provision of those non-audit services during the year by the auditor is compatible with, and did not compromise, the auditor independence requirements of the Corporations Act 2001 for the following reasons:• all non-audit services were subject to the corporate
governance procedures adopted by the Company and have been reviewed by the Audit Risk and Compliance Committee to ensure they do not impact the integrity and objectivity of the auditor;
• the non-audit services provided do not undermine the general principles relating to auditor independence; and
• as set out in APES110 Code of Ethics for Professional Accountants, as they did not involve reviewing or auditing the auditor’s own work, acting in a management or decision making capacity for the Company, acting as an advocate for the Company or jointly sharing risks and rewards.
Details of the amounts paid to the auditor of the consolidated entity, KPMG, and its related practices for audit and non-audit services provided during the year are set out in note 21.
Rounding OffThe Company is of a kind referred to in ASIC Class Order 98/100 dated 10 July 1998 and in accordance with that Class Order, amounts in the financial report and directors’ report have been rounded off to the nearest thousand dollars, unless otherwise stated.
Lead Auditor’s Independence DeclarationThe Lead Auditor’s independence declaration is set out on page 46 and forms part of the directors’ report for financial year ended 31 March 2015.
This report is made in accordance with a resolution of the directors:
Joycelyn Morton Chair
Dated at Sydney 27 May 2015
Directors’ Report

Annual Report 2015 41
Corporate Governance Statement
This statement outlines the main corporate governance practices in place throughout the financial year, which comply with the ASX Corporate Governance Council recommendations, unless otherwise stated.
Board of DirectorsRole of the BoardThe Board’s primary role is the protection and enhancement of long-term shareholder value.
To fulfil this role, the Board is responsible for the overall corporate governance of the Company including formulating its strategic direction, approving and monitoring capital expenditure, setting remuneration, appointing, removing and creating succession policies for directors and senior executives, establishing and monitoring the achievement of management’s goals and ensuring the integrity of risk management, internal control, legal compliance and management information systems. It is also responsible for approving and monitoring financial and other reporting.
In order to ensure that the Board functions and responsibilities are clearly identified, the Company has adopted a formal Board Charter.
A copy of the Board Charter is located on the Company’s website (www.thorn.com.au).
The Board has delegated responsibility for operation and administration of the Company to the Managing Director and executive management. Responsibilities are delineated by formal authority delegations.
Board ProcessesTo assist in the execution of its responsibilities, the Board has established an Audit, Risk and Compliance Committee and a Remuneration and Nomination Committee. These committees have written mandates and operating procedures, which are reviewed on a regular basis. The Board has also established a framework for the management of the Company including a system of internal control, a business risk management process and the establishment of appropriate ethical standards.
The full Board currently holds scheduled meetings each year, 10-14 per annum, plus strategy meetings and any extraordinary meetings at such other times as may be necessary to address any specific significant matters that may arise. The Board Charter requires the full Board to meet at least once per year to review the performance of the directors, committees, and senior executives, as well as, the relationship between the Board and management and matters of general corporate governance.
The agenda for Board meetings is prepared in conjunction with the Chairperson, Managing Director and Company Secretary. Standing items include the divisional report, finance report, strategic matters, governance, compliance and continuous disclosure. Submissions are circulated in advance. Executives are regularly involved in Board discussions and directors have other opportunities, including visits to business operations, for contact with a wider group of employees.
Director and Executive EducationThe Company has a formal process to educate new directors about the nature of the business, current issues, the corporate strategy, the culture and values of the Company, and the expectations of the Company concerning performance of directors. In addition, Directors are also educated regarding meeting arrangements and director interaction with each other, senior executives and other stakeholders. Directors also have the opportunity to visit the Company’s facilities and meet with management to gain a better understanding of business operations. Directors are given access to continuing education opportunities to update and enhance their skills and knowledge.
The Company also has a formal process to educate new senior executives upon taking such positions. The induction program includes reviewing the Company structure, strategy, operations, financial position and risk management policies. It also familiarises the individual with the respective rights, duties, responsibilities and roles of the individual and the Board.
Independent Professional Advice and Access to Company InformationEach director has the right of access to all relevant Company information and to the Company’s executives and, subject to prior consultation with the Chairperson, may seek independent professional advice from a suitably qualified adviser at the Company’s expense. The director must consult with an advisor suitably qualified in the relevant field, and obtain the Chairperson’s approval of the fee payable for the advice before proceeding with consultation. A copy of the advice received by the director is made available to all other members of the Board.
Composition of the BoardThe names of the directors of the Company in office at the date of this report, specifying which are independent, are set out on pages 26 to 27 of this report. The composition of the Board is determined using the following principles:• a minimum of three directors, with a broad range
of expertise both nationally and internationally;• a majority of independent non-executive directors;• a majority of directors having extensive knowledge of
the Company’s industries, and/or extensive expertise in significant aspects of auditing and financial reporting, or risk management of large companies;
• a non-executive independent director as Chairperson; and• directors are subject to re-election every three years
(except for the Managing Director).
The Board considers the mix of skills and diversity of Board members when assessing the composition of the Board. The Board assesses existing and potential directors’ skills to ensure they have appropriate industry expertise in the Company’s operating segments.

42 Thorn Group
Corporate Governance Statement
The Board considers the diversity of existing and potential directors to ensure they are in line with the geographical and operational segments of the Company. The Board’s policy is to seek a diverse range of directors who have a range of ages, genders and ethnicity which mirrors the environment in which the Company operates.
An independent director is a director who is not a member of management (a non-executive director) and who:1. holds less than five per cent of the voting shares of the
Company and is not an officer of, or otherwise associated, directly or indirectly, with a shareholder of more than five per cent of the voting shares of the Company;
2. has not within the last three years been employed in an executive capacity by the Company or a related body corporate or has become a director within three years of ceasing to hold any such employment;
3. within the last three years has not been a principal of a material professional adviser or a material consultant to the Company or another Company member or an employee materially associated with the service provided;
4. is not a material supplier or customer of the Company or another member of the consolidated entity, or an officer of or otherwise associated, directly or indirectly, with a material supplier or customer;
5. has no material contractual relationship with the Company or a related body corporate other than as a director of the Company; and
6. is free from any interest and any business or other relationship which could, or could reasonably be perceived to, materially interfere with the director’s ability to act in the best interests of the Company.
The Board considers, ‘material’, in this context, to be where any director-related business relationship has represented, or is likely in future to represent the lesser of at least ten per cent of the relevant segment’s or the director-related business’ revenue. The board considered the nature of the relevant industries’ competition and the size and nature of each director-related business relationship, in arriving at this threshold (refer Note 20).
Applying these criteria, the Board is satisfied that Joycelyn Morton, Stephen Kulmar, Peter Henley, and David Foster are independent. In accordance with the ASX Corporate Governance Guidelines, the Chairperson is an independent director, and the positions of Managing Director and Chairperson are held by different directors.
Remuneration and Nomination CommitteeThe Remuneration and Nomination Committee has a documented charter, approved by the Board. All members are non-executive directors with a majority being independent. The Remuneration and Nomination Committee assists the Board in its oversight responsibilities by monitoring and advising on:• remuneration packages of senior executives, non-executive
directors and executive directors;• share option schemes and incentive performance packages;
• executive contracts;• recruitment, retention and termination policies relating
to the Board and senior executives; and• monitoring the size and composition of the Board.
The members of the Remuneration and Nomination Committee during the year were:• Stephen Kulmar (Chairperson) – Independent, Non-
Executive (appointed 15 April 2014)• Joycelyn Morton – Independent, Non-Executive• Peter Henley – Independent, Non-Executive• David Foster – Independent, Non-Executive
(appointed 1 December 2014)• David Carter – Independent, Non-Executive
(retired 17 November 2014)
The Managing Director, James Marshall, is also invited to Remuneration and Nomination Committee meetings, as required, to discuss senior executives’ performance and remuneration packages but does not attend meetings involving matters pertaining to himself.
From time to time, the Committee takes advice from external consultants to identify potential candidates for the Board. The Committee makes recommendations to the Board on the candidates, which votes on them. The Board then appoints the most suitable candidates. Board candidates must stand for election at the general meeting of shareholders immediately following their appointment.
Korn Ferry was engaged during the financial year by the Board to assist in the recruitment of a Non-Executive Director. Fees of $80,000 were incurred.
The terms and conditions of the appointment and retirement of non-executive directors are set out in a letter of appointment, including expectations of attendance and preparation for all Board meetings, minimum hourly commitment, appointments to other boards, the procedures for dealing with conflicts of interest and the availability of independent professional advice.
The Remuneration and Nomination Committee meets at least three times a year and as required. The Committee met four times during the year and Committee members’ attendance record is disclosed in the table of directors’ meetings on page 28.
Audit, Risk and Compliance CommitteeThe Audit, Risk and Compliance Committee has a documented charter, approved by the Board. The charter is available on the Company’s website. All members are non-executive directors with a majority being independent. The Chairperson may not be the Chairperson of the Board. The Audit, Risk and Compliance Committee advises the Board on the establishment and maintenance of a framework of internal control and appropriate ethical standards for the management of the Company.

Annual Report 2015 43
The members of the Audit, Risk and Compliance Committee during the year were:• David Foster (Chairperson) – Independent, Non-Executive
(appointed 1 December 2014)• Joycelyn Morton (Chairperson) – Independent, Non-
Executive• Peter Henley – Independent, Non-Executive• Stephen Kulmar – Independent, Non-Executive
(appointed 15 April 2014)• David Carter – Independent, Non-Executive
(retired 17 November 2014)
The Company Secretary, Peter Eaton, acts as Secretary to the Committee.
The internal and external auditors, the Managing Director and the Chief Financial Officer are invited to Audit, Risk and Compliance Committee meetings at the discretion of the Committee. The Committee is required to meet at least twice during the year and committee members’ attendance record is disclosed in the table of directors’ meetings on page 28.
The external auditor met with the Audit, Risk and Compliance Committee six times during the year without management being present.
The Managing Director and the Chief Financial Officer have declared in writing to the Board that the financial records of the Company and the consolidated entity for the financial year have been properly maintained, the Company’s financial reports for the financial year ended 31 March 2015 comply with accounting standards and present a true and fair view of the Company’s financial condition and operational results. This statement is required annually.
The responsibilities of the Audit, Risk and Compliance Committee include:• reviewing the annual and half year financial reports and
other financial information distributed externally;• assessing management processes supporting external
reporting;• assessing corporate risk assessment processes;• assessing the performance and objectivity of the internal
audit function;• establishing procedures for selecting, appointing and if
necessary, removing the external auditor;• assessing whether non-audit services provided by the
external auditor are consistent with maintaining the external auditor’s independence. Each reporting period the external auditor provides an independence declaration in relation to the audit or review;
• providing advice to the Board in respect of whether the provision of the non-audit services by the external auditor is compatible with the general standard of independence of auditors imposed by the Corporation Act 2001;
• assessing the adequacy of the internal control framework and the Company’s code of ethical standards; and
• organising, reviewing and reporting on any special reviews or investigations deemed necessary by the Board.
The Audit, Risk and Compliance Committee reviews the performance of the external auditors on an annual basis and meets with them during the year to:• discuss the external audit, identifying any significant
changes in structure, operations, internal controls or accounting policies likely to impact the financial statements and to review the fees proposed for the audit work to be performed;
• review the half-year and preliminary final report prior to lodgement with the ASX, and any significant adjustments required as a result of the auditor’s findings, and to recommend Board approval of these documents, prior to announcement of results;
• review the draft annual and half-year financial report, and recommend Board approval of the financial report; and
• review the results and findings of the external audit, the adequacy of accounting and financial controls, and to monitor the implementation of any recommendations made.
Risk ManagementOversight of the Risk Management SystemThe Board oversees the establishment, implementation and review of the Company’s Risk Management System. Management has established and implemented the Risk Management System for assessing, monitoring and managing all risks, including material business risks, for the consolidated entity (including sustainability risk). The Managing Director and the Chief Financial Officer have provided assurance, in writing to the Board, that the financial reporting, risk management and associated compliance and controls have been assessed and found to be operating effectively. The operational and other risk management compliance and controls have also been assessed and found to be operating effectively.
Risk ProfileManagement provide the risk profile on a six monthly basis to the Audit, Risk and Compliance Committee that outlines the material business risks to the Company. Risk reporting includes the status of risks through integrated risk management programs aimed at ensuring risks are identified, assessed and appropriately managed. The Audit, Risk and Compliance Committee reports the status of material business risks to the Board on a regular basis.
Material business risks for the Company may arise from such matters as actions by competitors, government policy changes, the impact of exchange rate movements on the price of products and sales, difficulties in sourcing supply of products, environment, workplace health and safety, property, financial reporting and the purchase, development and use of information systems.
Risk Management, Compliance and ControlThe Company strives to ensure that its products and services are of the highest standard. The Board is responsible for the overall internal control framework, but recognises that no cost-effective internal control system will preclude errors and irregularities. The Board’s policy on internal control is comprehensive.

44 Thorn Group
Corporate Governance Statement
Comprehensive practices have been established to ensure:• capital expenditure and revenue commitments above a
certain size obtain prior Board approval;• financial exposures are controlled;• workplace health and safety standards and management
systems are monitored and reviewed to achieve high standards of performance and compliance with regulations;
• business transactions are properly authorised and executed;• the quality and integrity of personnel;• financial reporting accuracy and compliance with the
financial reporting regulatory framework; and• environmental regulation compliance.
Quality and Integrity of PersonnelFormal appraisals are conducted at least annually for all employees. Training and development and appropriate remuneration and incentives with regular performance reviews create an environment of cooperation and constructive dialogue with employees and senior management. A formal succession plan is in place to ensure competent and knowledgeable employees fill senior positions when retirements or resignations occur.
Financial ReportingThe Managing Director and the Chief Financial Officer have provided assurance in writing to the Board that the Company’s financial reports are founded on a sound system of risk management and internal compliance and control which implements the policies adopted by the Board.
Monthly actual results are reported against budgets approved by the directors and revised forecasts for the year are prepared regularly.
Environmental LegislationThe consolidated entity’s operations are not subject to significant environmental regulations under either Commonwealth or State legislation. The Directors are of the belief that the consolidated entity has adequate systems in place for the management of its environmental requirements and is not aware of any of those environmental requirements as they apply to the consolidated entity.
Internal AuditThe internal auditors assist the Board in ensuring compliance with internal controls and risk management programs by regularly reviewing the effectiveness of the above mentioned compliance and control systems. The results of internal audits are reported on a monthly basis to the Board.
Ethical StandardsAll directors, managers and employees are expected to act with the utmost integrity and objectivity, striving at all times to enhance the reputation and performance of the Company and consolidated entity. In order to promote ethical and responsible decision making, the Company has implemented a Code of Conduct to guide the directors and senior executives. Further, the Company has implemented a formal Securities Trading policy in order to formalise the Company’s position on employees trading in the Company’s securities. Every employee has a nominated supervisor to whom they may refer any issues arising from their employment. The Board reviews the Code of Conduct and processes are in place to promote and communicate these policies. Both of these policies are available on the Company’s website.
Conflict of InterestDirectors must keep the Board advised, on an ongoing basis, of any interest that could potentially conflict with those of the Company. The Board has developed procedures to assist directors to disclose potential conflicts of interest.
Where the Board believes that a significant conflict exists for a director on a Board matter, the director concerned does not receive the relevant Board papers and is not present at the meeting whilst the item is considered. Details of director-related entity transactions with the Company and the consolidated entity are set out in note 20 to the financial statements.
Code of ConductThe Company’s Code of Conduct aims to maintain appropriate core Company values and objectives. The Company has advised each director, manager and employee that they must comply with the Code of Conduct.
The Company’s Code of Conduct covers issues such as delivering shareholder value, managing conflicts of interest, confidentiality, fair and honest dealings, workplace health and safety, equal opportunity and compliance with laws. The Code encourages reporting of unethical behaviour. The Company has a Whistleblower Policy and a confidential whistleblowing service which provides its staff with an avenue to report suspected unethical, illegal or improper behaviour.
Securities Trading PolicyThe Company and the consolidated entity has a Securities Trading policy, which sets out the circumstances under which directors, senior executives, and employees of the Company and the consolidated entity may deal in securities with the objective that no director, senior executive or other employee will contravene the requirements of the Corporations Act 2001 or the ASX Listing Rules.
The policy outlines the restricted trading periods for the Company as the month immediately before the release of the Company’s half yearly and yearly results.
The policy is reproduced in full on the Company’s website.

Annual Report 2015 45
Diversity PolicyThe Board is committed to having an appropriate blend of diversity on the Board and senior executive positions. The Board has established a policy regarding gender, age, ethnic and cultural diversity.
The policy is reproduced in full on the Company’s website.
The consolidated entity’s diversity performance is as follows:
Gender Representation 2015 Male 2015 Female 2014 Male 2014 Female
Board Representation 83% 17% 83% 17%
Key Management Personnel Representation 100% – 100% –
Group Representation 53% 47% 53% 47%
Communication with ShareholdersThe Board provides shareholders with information using a comprehensive Continuous Disclosure Policy which includes identifying matters that may have a material effect on the price of the Company’s securities, notifying them to the ASX, posting them on the Company’s website and issuing media releases. The Continuous Disclosure Policy is available on the Company’s website.
In summary, the Continuous Disclosure policy operates as follows:• the policy identifies information that needs to be disclosed;• the Managing Director, the Chief Financial Officer and
the Company Secretary are responsible for interpreting the Company’s policy and where necessary informing the Board. The Company Secretary is responsible for all communications with the ASX;
• the full annual report provided via the Company’s website to all shareholders (unless a shareholder has specifically requested to receive a physical copy or not to receive the document), including relevant information about the operations of the consolidated entity during the year, changes in the state of affairs and details of future developments;
• the half-yearly report contains summarised financial information and a review of the operations of the consolidated entity during the period. The half-year reviewed financial report is lodged with the Australian Securities and Investments Commission and the ASX;
• proposed major changes in the consolidated entity which may impact the share ownership rights are submitted to a vote of shareholders;
• all announcements made to the market, and related information (including information provided to analysts or the media during briefings), are placed on the Company’s website after they are released to the ASX;
• the full texts of notices of meetings and associated explanatory material are placed on the Company’s website; and
• the external auditor attends the Annual General Meetings to answer questions concerning the conduct of the audit, the preparation and content of the auditor’s report, accounting policies adopted by the Company and the independence of the auditor in relation to the conduct of the audit.
The Company does not have a formal shareholder communication policy, however it provides information to shareholders via the Company’s website, which has links to recent Company announcements and past annual reports, results presentations and various ASX pages, including the current share price.
The Board supports full participation of shareholders at the Annual General Meeting, to ensure a high level of accountability and identification with the Company’s strategy and goals. Important issues are presented to the shareholders as single resolutions.
The shareholders are requested to vote on the appointment and aggregate remuneration of directors, the granting of options and shares to directors, the Remuneration Report and changes to the Constitution. Copies of the Constitution are available to any shareholder who requests it.

46 Thorn Group
Lead Auditors’s Independence Declaration under Section 307C of the Corporations Act 2001To: the directors of Thorn Group Limited
I declare that, to the best of my knowledge and belief, in relation to the audit for the financial year ended 31 March 2015 there have been:
(i) no contraventions of the auditor independence requirements as set out in the Corporations Act 2001 in realtion to the audit; and
(ii) no contraventions of any applicable code of professional conduct in relation to the audit.
KPMG
Anthony Travers Partner
Sydney 27 May 2015
Lead Auditor’s Independence Declaration
ABCD
KPMG, an Australian partnership and a member firm of the KPMG network of independent member firms affiliated with KPMG International Cooperative (“KPMG International”), a Swiss entity.
Liability limited by a scheme approved under Professional Standards Legislation.
Independent auditor’s report to the members of SG Fleet Group Limited
Report on the financial report
We have audited the accompanying financial report of SG Fleet Group Limited (the Company), which comprises the consolidated statement of financial position as at 30 June 2014, and consolidated statement of profit and loss and comprehensive income, consolidated statement of changes in equity and consolidated statement of cash flows for the period ended on that date, notes 1 to 39 comprising a summary of significant accounting policies and other explanatory information and the directors’ declaration of the Group comprising the company and the entities it controlled at the period’s end or from time to time during the financial period.
Directors’ responsibility for the financial report
The directors of the Company are responsible for the preparation of the financial report that gives a true and fair view in accordance with Australian Accounting Standards and the Corporations Act 2001 and for such internal control as the directors determine is necessary to enable the preparation of the financial report that is free from material misstatement whether due to fraud or error. In note 2, the directors also state, in accordance with Australian Accounting Standard AASB 101 Presentation of Financial Statements, that the financial statements of the Group comply with International Financial Reporting Standards.
Auditor’s responsibility
Our responsibility is to express an opinion on the financial report based on our audit. We conducted our audit in accordance with Australian Auditing Standards. These Auditing Standards require that we comply with relevant ethical requirements relating to audit engagements and plan and perform the audit to obtain reasonable assurance whether the financial report is free from material misstatement.
An audit involves performing procedures to obtain audit evidence about the amounts and disclosures in the financial report. The procedures selected depend on the auditor’s judgement, including the assessment of the risks of material misstatement of the financial report, whether due to fraud or error. In making those risk assessments, the auditor considers internal control relevant to the entity’s preparation of the financial report that gives a true and fair view in order to design audit procedures that are appropriate in the circumstances, but not for the purpose of expressing an opinion on the effectiveness of the entity’s internal control. An audit also includes evaluating the appropriateness of accounting policies used and the reasonableness of accounting estimates made by the directors, as well as evaluating the overall presentation of the financial report.
We performed the procedures to assess whether in all material respects the financial report presents fairly, in accordance with the Corporations Act 2001 and Australian Accounting Standards, a true and fair view which is consistent with our understanding of the Group’s financial position and of its performance.
We believe that the audit evidence we have obtained is sufficient and appropriate to provide a basis for our audit opinion.

Annual Report 2015 47
In thousands of AUD Note 2015 2014
Revenue 3 293,846 234,855
Finance lease cost of sales (71,703) (38,583)
Employee benefit expense 19 (53,853) (48,859)
Depreciation & amortisation expense (32,481) (36,213)
Impairment losses on loans and receivables (27,598) (17,029)
Marketing expenses (12,993) (11,358)
Property expenses (9,923) (9,345)
Transport expenses (6,905) (6,737)
Communication & IT expenses (5,372) (4,684)
Finance expenses (4,318) (2,073)
Travel expenses (1,586) (1,323)
Acquisition Costs (2,246) –
Other expenses (20,205) (17,619)
Profit before income tax 44,663 41,032
Income tax expense 9 (14,070) (12,881)
Profit for the period 30,593 28,151
Other comprehensive income – items that may be reclassified subsequently to profit or loss
Movement in fair value of cash flow hedge (134) –
Total comprehensive income 30,459 28,151
Basic earnings per share (cents) 14 20.34 18.94
Diluted earnings per share(cents) 14 20.34 18.94
Statement of Comprehensive IncomeFor The Year Ended 31 March 2015
The statement of comprehensive income is to be read in conjunction with the notes of the financial statements set out on pages 52 to 75.

48 Thorn Group
In thousands of AUD Note 2015 2014
Assets
Cash and cash equivalents 13,856 2,393
Trade and other receivables 4 129,113 68,981
Income tax receivable 1,379 –
Total current assets 144,348 71,374
Trade and other receivables 4 160,518 89,015
Deferred tax assets 10 1,503 3,260
Property, plant and equipment 3,957 4,423
Rental Assets 6 33,215 52,644
Intangible assets 8 32,926 31,734
Total non-current assets 232,119 181,076
Total assets 376,467 252,450
Liabilities
Trade payables 19,291 16,003
Other payables 14,582 9,900
Loans and borrowings 12 19,778 9,099
Employee benefits 7,058 5,621
Income tax payable – 7,039
Provisions 719 498
Total current liabilities 61,428 48,160
Loans and borrowings 12 124,195 31,397
Employee benefits 395 248
Provisions 961 1,025
Total non-current liabilities 125,551 32,670
Total liabilities 186,979 80,830
Net assets 189,488 171,620
Equity
Issued capital 103,446 99,060
Reserves 2,989 2,851
Retained earnings 83,053 69,709
Total equity 189,488 171,620
Statement of Financial PositionAs at 31 March 2015
The statement of financial position is to be read in conjunction with the notes of the financial statements set out on pages 52 to 75.

Annual Report 2015 49
Statement of Changes in EquityFor The Year Ended 31 March 2015
In thousands of AUD Share capital Reserves Retained earnings Total equity
Balance at 1 April 2013 95,483 2,769 57,121 155,373
Net profit for the period – – 28,151 28,151
Other comprehensive income – – – –
Issue of shares under dividend reinvestment plan 3,577 – – 3,577
Share based payments transactions – 82 – 82
Dividends to shareholders – – (15,563) (15,563)
Balance at 31 March 2014 99,060 2,851 69,709 171,620
Balance at 1 April 2014 99,060 2,851 69,709 171,620
Net profit for the period – – 30,593 30,593
Total comprehensive income – (134) – (134)
Issue of shares under dividend reinvestment plan 4,386 – – 4,386
Share based payments transactions – 272 – 272
Dividends to shareholders – – (17,249) (17,249)
Balance at 31 March 2015 103,446 2,989 83,053 189,488
The statement of financial position is to be read in conjunction with the notes of the financial statements set out on pages 52 to 75.

50 Thorn Group
Statement of Cash FlowsFor The Year Ended 31 March 2015
In thousands of AUD Note 2015 2014
Cash flows from operating activities
Cash receipts from customers 395,411 255,109
Cash paid to suppliers and employees (267,538) (138,438)
Cash generated from operations 127,873 116,671
Net borrowing costs (4,250) (1,922)
Income tax paid (20,730) (10,724)
Net cash from operating activities 102,893 104,025
Cash flows from investing activities
Proceeds from sale of assets 3,437 1,655
Acquisition of rental assets (78,550) (70,178)
Commercial finance originations (61,527) (32,325)
Acquisition of property, plant and equipment and software (2,132) (5,262)
Acquisition of subsidiary 18 (43,272) –
Net cash used in investing activities (182,044) (106,113)
Cash flows from financing activities
Proceeds from borrowings 128,239 24,996
Repayment of borrowings (24,763) (13,400)
Dividends paid (12,862) (11,986)
Net cash used in financing activities 90,614 (390)
Net increase (decrease) in cash and cash equivalents 11,463 (2,478)
Cash and cash equivalents at April 1 2,393 4,871
Cash and cash equivalents at 31 March 13,856 2,393
The statement of financial position is to be read in conjunction with the notes of the financial statements set out on pages 52 to 75.
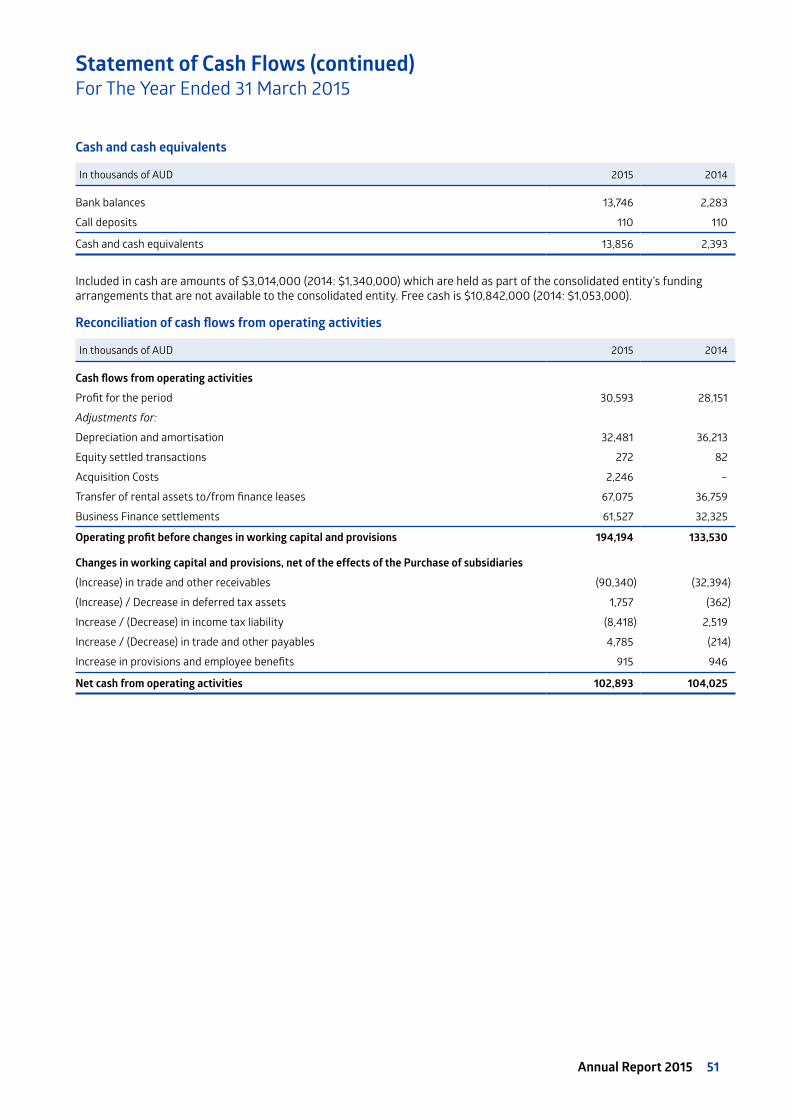
Annual Report 2015 51
Cash and cash equivalents
In thousands of AUD 2015 2014
Bank balances 13,746 2,283
Call deposits 110 110
Cash and cash equivalents 13,856 2,393
Included in cash are amounts of $3,014,000 (2014: $1,340,000) which are held as part of the consolidated entity’s funding arrangements that are not available to the consolidated entity. Free cash is $10,842,000 (2014: $1,053,000).
Reconciliation of cash flows from operating activities
In thousands of AUD 2015 2014
Cash flows from operating activities
Profit for the period 30,593 28,151
Adjustments for:
Depreciation and amortisation 32,481 36,213
Equity settled transactions 272 82
Acquisition Costs 2,246 –
Transfer of rental assets to/from finance leases 67,075 36,759
Business Finance settlements 61,527 32,325
Operating profit before changes in working capital and provisions 194,194 133,530
Changes in working capital and provisions, net of the effects of the Purchase of subsidiaries
(Increase) in trade and other receivables (90,340) (32,394)
(Increase) / Decrease in deferred tax assets 1,757 (362)
Increase / (Decrease) in income tax liability (8,418) 2,519
Increase / (Decrease) in trade and other payables 4,785 (214)
Increase in provisions and employee benefits 915 946
Net cash from operating activities 102,893 104,025
Statement of Cash Flows (continued)For The Year Ended 31 March 2015
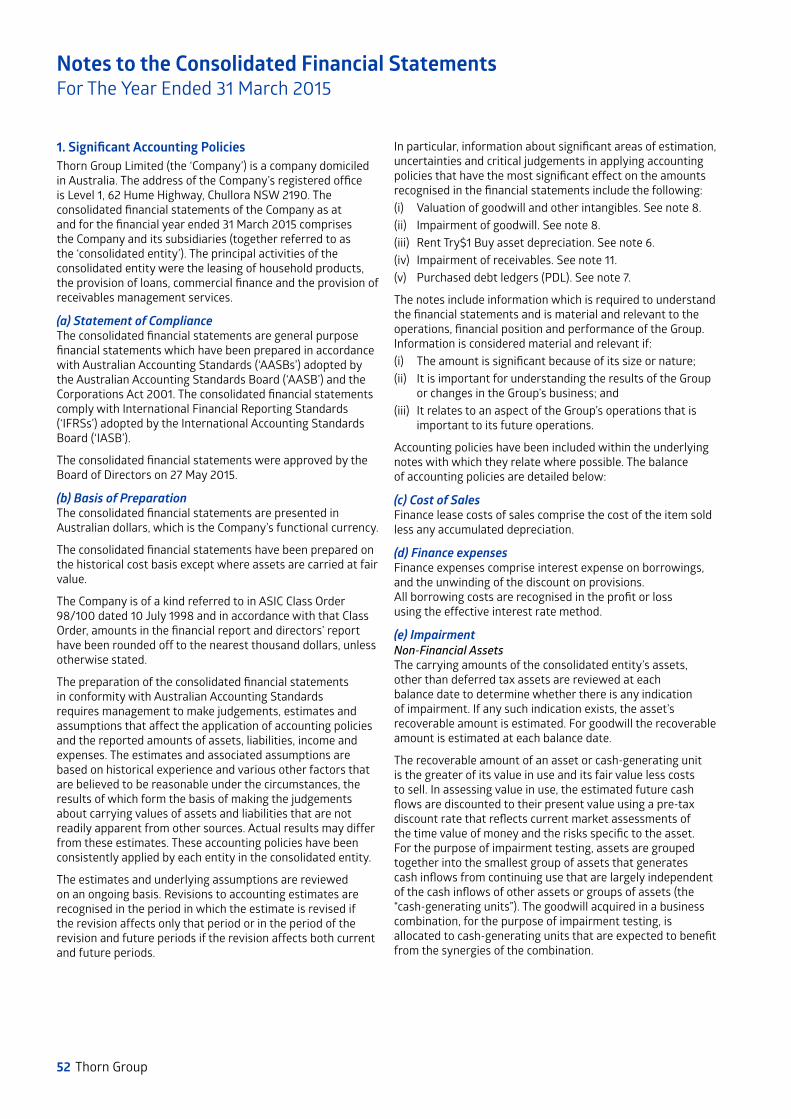
52 Thorn Group
Notes to the Consolidated Financial StatementsFor The Year Ended 31 March 2015
1. Significant Accounting PoliciesThorn Group Limited (the ‘Company’) is a company domiciled in Australia. The address of the Company’s registered office is Level 1, 62 Hume Highway, Chullora NSW 2190. The consolidated financial statements of the Company as at and for the financial year ended 31 March 2015 comprises the Company and its subsidiaries (together referred to as the ‘consolidated entity’). The principal activities of the consolidated entity were the leasing of household products, the provision of loans, commercial finance and the provision of receivables management services.
(a) Statement of ComplianceThe consolidated financial statements are general purpose financial statements which have been prepared in accordance with Australian Accounting Standards (‘AASBs’) adopted by the Australian Accounting Standards Board (‘AASB’) and the Corporations Act 2001. The consolidated financial statements comply with International Financial Reporting Standards (‘IFRSs’) adopted by the International Accounting Standards Board (‘IASB’).
The consolidated financial statements were approved by the Board of Directors on 27 May 2015.
(b) Basis of PreparationThe consolidated financial statements are presented in Australian dollars, which is the Company’s functional currency.
The consolidated financial statements have been prepared on the historical cost basis except where assets are carried at fair value.
The Company is of a kind referred to in ASIC Class Order 98/100 dated 10 July 1998 and in accordance with that Class Order, amounts in the financial report and directors’ report have been rounded off to the nearest thousand dollars, unless otherwise stated.
The preparation of the consolidated financial statements in conformity with Australian Accounting Standards requires management to make judgements, estimates and assumptions that affect the application of accounting policies and the reported amounts of assets, liabilities, income and expenses. The estimates and associated assumptions are based on historical experience and various other factors that are believed to be reasonable under the circumstances, the results of which form the basis of making the judgements about carrying values of assets and liabilities that are not readily apparent from other sources. Actual results may differ from these estimates. These accounting policies have been consistently applied by each entity in the consolidated entity.
The estimates and underlying assumptions are reviewed on an ongoing basis. Revisions to accounting estimates are recognised in the period in which the estimate is revised if the revision affects only that period or in the period of the revision and future periods if the revision affects both current and future periods.
In particular, information about significant areas of estimation, uncertainties and critical judgements in applying accounting policies that have the most significant effect on the amounts recognised in the financial statements include the following:(i) Valuation of goodwill and other intangibles. See note 8.(ii) Impairment of goodwill. See note 8.(iii) Rent Try$1 Buy asset depreciation. See note 6.(iv) Impairment of receivables. See note 11.(v) Purchased debt ledgers (PDL). See note 7.
The notes include information which is required to understand the financial statements and is material and relevant to the operations, financial position and performance of the Group. Information is considered material and relevant if:(i) The amount is significant because of its size or nature;(ii) It is important for understanding the results of the Group
or changes in the Group’s business; and(iii) It relates to an aspect of the Group’s operations that is
important to its future operations.
Accounting policies have been included within the underlying notes with which they relate where possible. The balance of accounting policies are detailed below:
(c) Cost of SalesFinance lease costs of sales comprise the cost of the item sold less any accumulated depreciation.
(d) Finance expensesFinance expenses comprise interest expense on borrowings, and the unwinding of the discount on provisions. All borrowing costs are recognised in the profit or loss using the effective interest rate method.
(e) ImpairmentNon-Financial AssetsThe carrying amounts of the consolidated entity’s assets, other than deferred tax assets are reviewed at each balance date to determine whether there is any indication of impairment. If any such indication exists, the asset’s recoverable amount is estimated. For goodwill the recoverable amount is estimated at each balance date.
The recoverable amount of an asset or cash-generating unit is the greater of its value in use and its fair value less costs to sell. In assessing value in use, the estimated future cash flows are discounted to their present value using a pre-tax discount rate that reflects current market assessments of the time value of money and the risks specific to the asset. For the purpose of impairment testing, assets are grouped together into the smallest group of assets that generates cash inflows from continuing use that are largely independent of the cash inflows of other assets or groups of assets (the “cash-generating units”). The goodwill acquired in a business combination, for the purpose of impairment testing, is allocated to cash-generating units that are expected to benefit from the synergies of the combination.

Annual Report 2015 53
An impairment loss is recognised whenever the carrying amount of an asset or its cash-generating unit exceeds its recoverable amount. Impairment losses are recognised in the profit or loss, unless an asset has previously been re-valued, in which case the impairment loss is recognised as a reversal to the extent of that previous revaluation with any excess recognised through profit or loss.
Impairment losses recognised in respect of cash-generating units are allocated first to reduce the carrying amount of any goodwill allocated to cash-generating units (group of units) and then, to reduce the carrying amount of the other assets in the unit (group of units) on a pro rata basis.
Financial AssetsThe recoverable amount of the consolidated entity’s receivables carried at amortised cost is calculated as the present value of estimated future cash flows, discounted at the original effective interest rate (i.e. the effective interest rate computed at initial recognition of these financial assets).
Impairment of receivables is not recognised until objective evidence is available that a loss event has occurred. Significant receivables are individually assessed for impairment. Impairment testing of receivables that are not assessed as impaired individually is performed by placing them into portfolios with similar risk profiles and undertaking a collective assessment of impairment, based on objective evidence from historical experience adjusted for any effects of conditions existing at each balance date.
Reversals of ImpairmentImpairment losses, other than in respect of goodwill, are reversed when there is an indication that the impairment loss may no longer exist and there has been a change in the estimate used to determine the recoverable amount.
An impairment loss in respect of goodwill is not reversed.
An impairment loss is reversed only to the extent that the asset’s carrying amount does not exceed the carrying amount that would have been determined, net of depreciation or amortisation, if no impairment loss had been recognised.
(f) Goods and Services TaxRevenue, expenses and assets are recognised net of the amount of goods and services tax (GST), except where the amount of GST incurred is not recoverable from the taxation authority. In these circumstances, the GST is recognised as part of the cost of acquisition of the asset or as part of the expense.
Receivables and payables are stated with the amount of GST included. The net amount of GST recoverable from, or payable to, the ATO is included as a current asset or liability in the statement of financial position.
Cash flows are included in the statement of cash flows on a gross basis. The GST components of cash flows arising from investing and financing activities which are recoverable from, or payable to, the ATO are classified as operating cash flows.
(g) Changes in Accounting PolicyAll new Accounting Standards and Interpretations applicable to annual reporting periods commencing on or before 1 April 2014 have been applied to the consolidated entity effective from their required date of application. The initial application of these Standards and Interpretations has not had a material impact on the financial position or the financial results of the consolidated entity.
There has been no other change in accounting policy during the year.
(h) New Standards and Interpretations Not Yet AdoptedThe following standards, amendments to standards and interpretations have been identified as those which may impact the consolidated entity in the period of initial application. The consolidated entity will apply the standard and amendments for the reporting periods beginning on the operative dates set out below. An initial assessment of the financial impact of the standards and amendments has been undertaken and they are not expected to have a material impact on the consolidated entity’s financial statements or accounting policies. The consolidated entity does not plan to adopt these standards early.• AASB 2010-7 and AASB 2009-11 Amendments to AASB 9
introduce new requirements for the classification and measurement of financial assets. The basis of classification depends on the entity’s business model and the contractual cash flow characteristics of the financial asset. AASB 9 introduces additions relating to financial liabilities. The IASB currently has an active project that may result in limited amendments to the classification and measurement requirements of AASB 9 and add new requirements to address the impairment of financial assets and hedge accounting. The amendments, which become mandatory for the consolidated entity’s 31 March 2016 financial statements, are not expected to have a significant impact on the financial statements.
• IFRS 15 Revenue from Contracts with Customers establishes a comprehensive framework for determining whether, how much and when revenue is recognised. It replaces existing revenue recognition guidance, including IAS 18 Revenue, and IFRIC 13 Customer Loyalty Programmes. IFRS 15 is effective for annual reporting periods beginning on or after 1 January 2017, with early adoption permitted. The Group is assessing the potential financial impact resulting from the application of IFRS 15.

54 Thorn Group
Notes to the Consolidated Financial StatementsFor The Year Ended 31 March 2015
2. Segment ReportingThe Board and CEO (the chief operating decision maker) monitor the operating results of four reportable segments, which are the Consumer Leasing division, the Receivable Management division, the Commercial Finance division and the Consumer Finance division for the purpose of making decisions about resource allocation and performance assessment.
The Consumer Leasing division conducts the business of leasing of household products.
The Receivable Management division is comprised of the NCML business. NCML provides receivables management, debt recovery, credit information services, debt purchasing and other financial services.
Commercial Finance division provides financial products to small and medium enterprises including equipment leasing and invoice discounting.
The Consumer Finance division provides personal loans.
Segment performance is evaluated based on operating profit or loss. Interest and income tax expense are not allocated to operating segments, as this type of activity is managed on a group basis.
For the twelve months ended 31 March 2015 (i)
2015
In thousands of AUDConsumer
LeasingReceivables
ManagementCommercial
FinanceConsumer
Finance Consolidated
External revenues 246,169 18,803 15,046 13,760 293,778
Inter-segment revenue – 425 – – 425
Segment revenue 246,169 19,228 15,046 13,760 294,203
Operating expenses (190,091) (16,633) (8,056) (12,388) (227,168)
Profit Before interest, tax, depreciation and amortisation 56,078 2,595 6,990 1,372 67,035
Depreciation (1,204) (336) (184) (125) (1,849)
Profit Before interest, tax and amortisation 54,874 2,259 6,806 1,247 65,186
Capital Expenditure 80,635 47 61,527 – 142,209
Segment Assets 190,954 26,824 119,122 39,567 376,467
Segment Liabilities (88,523) (1,951) (96,505) – (186,979)
(i) Segment classification has been adjusted from the previous year. Receivables Management was previously classified as Credit Management. Commercial Finance was previously classified as Thorn Equipment Finance. Consumer Finance was previously classified as Thorn Financial Services.
Commercial finance also includes the results of CRA since acquisition.

Annual Report 2015 55
2014
In thousands of AUDConsumer
LeasingReceivables
ManagementCommercial
FinanceConsumer
Finance Consolidated
External revenues 196,800 20,241 8,317 9,346 234,704
Inter-segment revenue – 370 – – 370
Segment revenue 196,800 20,611 8,317 9,346 235,074
Operating expenses (147,350) (16,560) (5,353) (8,161) (177,424)
Profit Before interest, tax, depreciation and amortisation 49,450 4,051 2,964 1,185 57,650
Depreciation (1,363) (247) (50) (71) (1,731)
Profit Before interest, tax and amortisation 48,087 3,804 2,914 1,114 55,919
Capital Expenditure 75,105 308 32,325 30 107,768
Segment Assets 151,041 26,427 49,977 25,005 252,450
Segment Liabilities (53,696) (2,138) (24,996) – (80,830)
Reconciliation of reportable segment profit or loss
In thousands of AUD 2015 2014
Profit before interest, tax and amortisation for reportable segments 65,186 55,919
Unallocated amounts:
Other corporate expenses (13,110) (10,532)
Amortisation (3,163) (2,433)
Net financing costs (4,250) (1,922)
Profit before tax 44,663 41,032
Income tax expense (14,070) (12,881)
Profit after tax 30,593 28,151
Reconciliation of reportable revenue
In thousands of AUD 2015 2014
Revenue for reportable segments 294,203 235,074
Other revenue 68 151
Elimination of inter-segment revenue (425) (370)
Revenue 293,846 234,855

56 Thorn Group
Notes to the Consolidated Financial StatementsFor The Year Ended 31 March 2015
3. Revenue
In thousands of AUD 2015 2014
Operating leases 95,012 108,041
Finance lease sales 97,173 51,507
Interest 77,159 54,343
Collection revenue 14,737 17,474
PDL revenue 4,492 3,136
Other commercial revenue 4,289 –
Other income 984 354
293,846 234,855
Revenues are measured at the fair value of the consideration received or receivable net of the amount of goods and services tax (GST) payable to the taxation authority. The major components of revenue are recognised as follows:
Operating lease rental revenue is recognised on a straight line basis over the lease term, net of discounts. Revenue also arises from charges such as late fees, termination fees and damage liability reduction fees. These revenues are recognised when due and payable.
Finance lease sales revenue is recognised at the time the rental contract is entered into based on the fair value of the leased item, with interest income recognised over the life of the lease.
Interest revenue is calculated and charged on the average outstanding loan and lease balance and recognised on an accrual basis using the effective interest method.
Revenue from collection services rendered is recognised upon delivery of the services to the customers.
Revenue from PDL’s represents income derived from the application of the effective interest method net of any changes in fair value. The effective interest rate is the implicit interest rate based on forecast collections derived at the time of acquisition of an individual PDL. Change in fair value is determined based on the present value of expected future cashflows.
Adjustments to the carrying amount of PDLs as a result of changes in estimated cash flows were immaterial during the year. These have been included in PDL revenue above.
Other commercial revenue represents fees derived from invoice discounting transactions performed by the CRA business and is recognised on an accrual basis.

Annual Report 2015 57
4. Trade and Other Receivables
In thousands of AUD 2015 2014
Current
Trade receivables 2,985 4,062
Finance lease receivables 45,111 37,316
Other commercial receivables 36,532 –
Loan receivables 24,020 15,583
Purchased debt ledgers 8,557 3,581
Lease deposits 554 564
Other receivables and prepayments 11,354 7,875
129,113 68,981
Non-current
Finance lease receivables 137,630 74,033
Loan receivables 17,036 9,689
Purchased debt ledgers 5,852 5,293
160,518 89,015
Finance lease receivables are recognised at the present value of the minimum lease payments less impairment losses. The present value is calculated by discounting the minimum lease payments due, at the interest rate implicit in the lease.
Trade receivables, other commercial receivables, loan receivables and other receivables and prepayments are stated at their amortised cost less impairment losses, with the exception of PDL’s which are designated at fair value. Detailed information on PDL’s is disclosed in Note 7.
The consolidated entity’s exposure to credit risk and impairment losses related to trade and other receivables are disclosed in Note 11.

58 Thorn Group
Notes to the Consolidated Financial StatementsFor The Year Ended 31 March 2015
5. LeasesFinance leases as lessorThe consolidated entity leases out its rental assets under finance lease, hire purchase and chattel mortgage contracts. The consolidated entity classifies Rent Try $1 Buy® contracts as finance leases where the term of the contract is 24 months, 36 months or 48 months. The asset rented has an estimated useful life equal to the contract length. The future minimum lease receipts under non-cancellable finance leases are as follows:
In thousands of AUD 2015 2014
Less than one year 128,015 87,489
Between one and five years 197,492 101,551
325,507 189,040
Unearned finance income in relation to finance leases as at 31 March 2015 was $123,032,000 (2014: $67,162,000).
Operating leases as lessorThe consolidated entity leases out its rental assets under operating leases. The future minimum lease receipts under non-cancellable operating leases are as follows:
In thousands of AUD 2015 2014
Less than one year 10,789 29,499
Between one and five years 2,741 5,773
13,530 35,272
Operating leases as lesseeNon-cancellable operating lease rentals are payable as follows:
In thousands of AUD 2015 2014
Less than one year 7,658 8,068
Between one and five years 8,296 10,686
15,954 18,754
The consolidated entity leases all store and office premises under operating leases. The leases typically run for a period of 3 years, with an option to renew the lease after that date. The majority of the lease payments are increased every year to reflect market rentals.
The consolidated entity also leases vehicles under operating leases. The lease term for these vehicles normally runs for a period of 4 years. The lease payments are set at the commencement of the lease for the term of the lease. The lease agreements for vehicles do not include contingent rentals.
Payments made under operating leases are recognised in the profit or loss on a straight-line basis over the term of the lease. Lease incentives received are recognised in the profit or loss as an integral part of the total lease expense and spread over the lease term.

Annual Report 2015 59
6. Rental Assets
In thousands of AUD 2015 2014
Opening balance 52,644 52,929
Acquisitions 78,550 70,178
Disposals (4,380) (3,184)
Depreciation (27,469) (32,049)
Transfers to finance leases (72,330) (36,759)
Transfers from finance leases 6,200 1,529
Balance at 31 March 33,215 52,644
Recognition and MeasurementRental assets are stated at cost less accumulated depreciation and accumulated impairment losses.
Cost includes expenditure that is directly attributable to the acquisition of the asset.
Depreciation is provided on rental assets and is calculated on a straight line basis so as to write-off the net cost of each asset over its estimated useful life. Where assets are installed on Rent Try $1 Buy® operating leases and their estimated useful life is greater than the period at which a similar item can be purchased for $1, an estimate of the number of assets expected to be purchased for $1 is made and additional depreciation expensed based on the average cost of assets installed.
The estimated useful lives in the current and comparative periods are 2 to 6 years.
The residual value, the useful life and the depreciation method applied to an asset are reassessed at least annually.
Gains and losses on disposal of an item of rental assets are determined by comparing the proceeds from disposal with the carrying amount of the asset and recognised net within revenue in the profit or loss.
7. Purchased Debt LedgersPurchased Debt Ledgers (PDL) are measured at fair value and are classified as level 3 under the hierarchy set out in AASB 7 Financial Instruments: Disclosure. The following table shows a reconciliation of the PDL balances:
In thousands of AUD 2015 2014
At the beginning of the year 8,874 8,295
Net additions 12,471 5,879
Collections (11,428) (8,436)
Revenue 4,492 3,136
Total 14,409 8,874
PDLs are classified as follows:
In thousands of AUD 2015 2014
Current 8,557 3,581
Non-current 5,852 5,293
Total 14,409 8,874

60 Thorn Group
Notes to the Consolidated Financial StatementsFor The Year Ended 31 March 2015
7. Purchased Debt Ledgers (continued)Fair values of PDLs are determined using a discounted cash flow valuation technique. Cash flow forecasts are based on the estimated future cash flows of the portfolio based on experience on similar portfolios, observed collections to date, payment arrangements and other known factors.
The following summarises the assumptions used in these calculations:
Input Assumption and/or basis for assumption
Term which collections will be yielded Maximum 72 months from start date of PDL acquisition
Effective interest rate Based on the effective interest rate for each PDL recognised at the time of acquisition
Forecast collections Forecasts are based on each PDL collections to date, the performance of equivalent PDL and allowances for other known factors
A change of five percent in forecast collections at the reporting date would have increased or decreased the consolidated entity’s equity and profit or loss by $383,000 (2014: $271,000).
8. Intangible Assets
In thousands of AUD GoodwillCustomer
Relationships Software Total
Year ended 31 March 2014
Opening net carrying amount 22,276 5,277 3,848 31,401
Additions – – 2,727 2,727
Amortisation charge for the year – (1,760) (634) (2,394)
Closing net book amount 22,276 3,517 5,941 31,734
At 31 March 2014
Cost 29,350 8,797 9,302 47,449
Amortisation and Impairment Losses (7,074) (5,280) (3,361) (15,715)
Net book amount 22,276 3,517 5,941 31,734
Year ended 31 March 2015
Opening net book amount 22,276 3,517 5,941 31,734
Additions 3,247 – 1,108 4,355
Amortisation charge for the year – (1,759) (1,404) (3,163)
Closing net book amount 25,523 1,758 5,645 32,926
At 31 March 2015
Cost 32,597 8,797 10,410 51,804
Amortisation and Impairment Losses (7,074) (7,039) (4,765) (18,878)
Net book amount 25,523 1,758 5,645 32,926

Annual Report 2015 61
GoodwillAll business combinations are accounted for by applying the purchase method. Goodwill represents the difference between the cost of the acquisition and the fair value of the identifiable assets, liabilities and contingent liabilities of the acquiree.
Subsequent measurementGoodwill is measured at cost less any accumulated impairment losses. Goodwill is allocated to cash-generating units and is tested annually for impairment.
Other IntangiblesOther intangibles acquired as part of a business combination are recognised separately from goodwill. The assets are measured at fair value at the date of acquisition.
AmortisationAmortisation is provided on all intangible assets excluding goodwill. Amortisation is calculated on a straight line basis so as to write-off the cost of each intangible asset over its estimated useful life. The estimated useful lives in the current and comparative periods are as follows:• Customer relationships 5 years • Software 3 – 10 years
The residual value, the useful life and the amortisation method applied to an intangible asset are reassessed at least annually.
Impairment tests for Cash Generating Units (CGU) containing goodwillValuation of goodwill and other intangiblesJudgements are made with respect to identifying and valuing intangible assets on acquisition of new businesses.
Impairment of goodwillInformation about the assumptions and their risk factors relating to goodwill impairment is contained below. The consolidated entity assesses whether goodwill is impaired at least annually. The calculations include an estimation of the recoverable amount of the cash generating unit to which the goodwill is allocated.
The following units have significant carrying amounts of goodwill:
In thousands of AUD 2015 2014
Consumer Leasing 15,604 15,604
Commercial Finance 3,247 –
Receivables Management 6,672 6,672
25,523 22,276
The recoverable amount of the above CGU’s are determined based on a value-in-use calculation. Value-in-use is calculated based on the present value of cash flow projections over a 5 year period and terminal value. The cash flow projections have been approved by the Board.
Key assumptions used for value-in-use calculationsConsumer LeasingDuring the forecast period, revenue is assumed to grow at an average of 7% p.a. and the pre-tax discount rate is assumed at 10.54% (2014: 10.54%). A terminal value is calculated using the cash flows for year 5 of the forecast period and a long-term growth rate of 2%. The value in use calculation in 2015 was determined on a similar basis to the 2014 calculation.
Receivables ManagementDuring the forecast period, revenue is assumed to grow at an average of 8.10% p.a. and the pre-tax discount rate is assumed at 11.66% (2014: 11.66%). A terminal value is calculated using the cash flows for year 5 of the forecast period and a long-term growth rate of 2%. The value in use calculation in 2015 was determined on a similar basis to the 2014 calculation.
The recoverable amount of the CGU’s exceeds their carrying value at 31 March 2015.
Management believes that any reasonable change in the key assumptions on which the estimates and/or the discount rate are based would not cause the carrying amount of the CGU to exceed its recoverable amount.
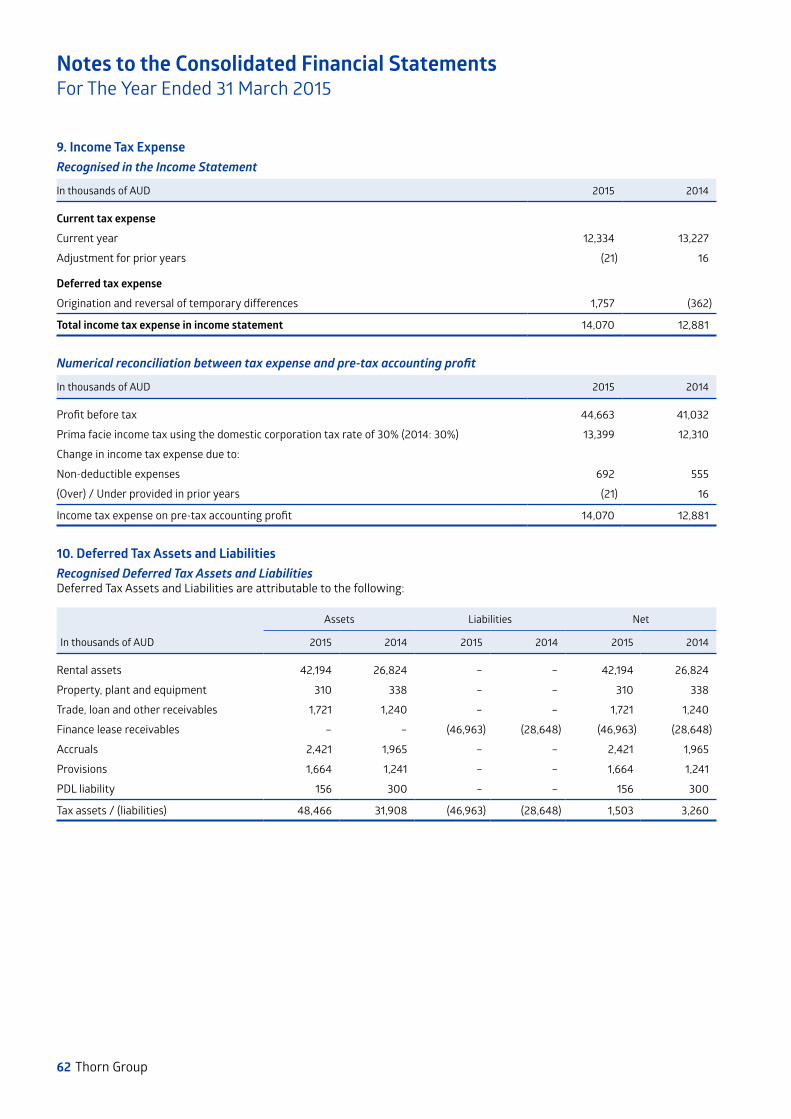
62 Thorn Group
Notes to the Consolidated Financial StatementsFor The Year Ended 31 March 2015
9. Income Tax ExpenseRecognised in the Income Statement
In thousands of AUD 2015 2014
Current tax expense
Current year 12,334 13,227
Adjustment for prior years (21) 16
Deferred tax expense
Origination and reversal of temporary differences 1,757 (362)
Total income tax expense in income statement 14,070 12,881
Numerical reconciliation between tax expense and pre-tax accounting profit
In thousands of AUD 2015 2014
Profit before tax 44,663 41,032
Prima facie income tax using the domestic corporation tax rate of 30% (2014: 30%) 13,399 12,310
Change in income tax expense due to:
Non-deductible expenses 692 555
(Over) / Under provided in prior years (21) 16
Income tax expense on pre-tax accounting profit 14,070 12,881
10. Deferred Tax Assets and LiabilitiesRecognised Deferred Tax Assets and LiabilitiesDeferred Tax Assets and Liabilities are attributable to the following:
In thousands of AUD
Assets Liabilities Net
2015 2014 2015 2014 2015 2014
Rental assets 42,194 26,824 – – 42,194 26,824
Property, plant and equipment 310 338 – – 310 338
Trade, loan and other receivables 1,721 1,240 – – 1,721 1,240
Finance lease receivables – – (46,963) (28,648) (46,963) (28,648)
Accruals 2,421 1,965 – – 2,421 1,965
Provisions 1,664 1,241 – – 1,664 1,241
PDL liability 156 300 – – 156 300
Tax assets / (liabilities) 48,466 31,908 (46,963) (28,648) 1,503 3,260

Annual Report 2015 63
Income TaxIncome tax expense comprises current and deferred tax. Income tax expense is recognised in the profit or loss except to the extent that it relates to items recognised directly in equity, in which case it is recognised in equity.
Current tax is the expected tax payable on the taxable income for the year, using tax rates enacted or substantively enacted at the reporting date, and any adjustment to tax payable in respect of previous years.
Deferred tax is recognised in respect of temporary differences between the carrying amounts of assets and liabilities for financial reporting purposes and the amounts used for taxation purposes. Deferred tax is not recognised for the following temporary differences: initial recognition of goodwill, the initial recognition of assets or liabilities in a transaction that is not a business combination and that affects neither accounting nor taxable profit, and differences relating to investments in subsidiaries to the extent that it is probable that they will not reverse in the foreseeable future. Deferred tax is measured at the tax rates that are expected to be applied to the temporary differences when they reverse, based on the laws that have been enacted or substantively enacted by the reporting date.
A deferred tax asset is recognised to the extent that it is probable that future taxable profits will be available against which the temporary difference can be utilised. Deferred tax assets are reviewed at each reporting date and are reduced to the extent that it is no longer probable that the related tax benefit will be realised.
Tax consolidationThorn Group Limited and its wholly-owned Australian resident entities have formed a tax-consolidated group with effect from 1 April 2003 and are therefore taxed as a single entity from that date. The head entity within the tax-consolidated group is Thorn Group Limited.
Current tax expense/income, deferred tax liabilities and deferred tax assets arising from temporary differences of the members of the tax consolidated group are recognised in the separate financial statements of the members of the tax consolidated group using the group allocation approach by reference to the carrying amounts of assets and liabilities in the separate financial statements of each entity and the tax values applying under tax consolidation.
Any current tax liabilities (or assets) and deferred tax assets arising from unused tax losses of the subsidiaries are assumed by the head entity in the tax-consolidated group and are recognised as amounts payable / (receivable) to / (from) other entities in the tax-consolidated group in conjunction with any tax funding arrangement amounts (refer below). Any difference between these amounts is recognised by the Company as an equity contribution or distribution.
Thorn Group Limited recognises deferred tax assets arising from unused tax losses of the tax-consolidated group to the extent that it is probable that future taxable profits of the tax-consolidated group will be available against which the asset can be utilised.
Any subsequent period adjustments to deferred tax assets arising from unused tax losses as a result of revised assessments of the probability of recoverability is recognised by the head entity only.
Nature of Tax Funding Arrangements and Tax Sharing ArrangementsThe head entity, in conjunction with other members of the tax-consolidated group, has entered into a tax funding arrangement which sets out the funding obligations of members of the tax-consolidated group in respect of tax amounts. The tax funding arrangements require payments to/from the head entity equal to the current tax liability (asset) assumed by the head entity and any tax-loss deferred tax asset assumed by the head entity, resulting in the head entity recognising an inter-entity receivable (payable) equal in amount to the tax liability (asset) assumed. The inter-entity receivable (payable) are at call. Contributions to fund the current tax liabilities are payable as per the tax funding arrangement and reflect the timing of the head entity’s obligation to make payments for tax liabilities to the relevant tax authorities. The head entity in conjunction with other members of the tax-consolidated group has also entered into a tax sharing agreement. The tax sharing agreement provides for the determination of the allocation of income tax liabilities between the entities should the head entity default on its tax payment obligations.
During the year the group acquired 100% of both Cash Resources Australia Pty Limited and Cash Resources Trust. These entities have been included within these arrrangements.
11. Financial Risk Management(a) Financial Risk Management Objectives and PoliciesThe consolidated entity is exposed to financial risks through the normal course of its business operations. The key risks arising are credit risk, liquidity risk and market risk.
The Board of Directors has overall responsibility for the establishment and oversight of the risk management framework. The Board has established the Audit, Risk and Compliance Committee, which is responsible for developing and monitoring risk management policies. The Committee reports regularly to the Board of Directors on its activities.
Risk management policies are established to identify and analyse the risks faced by the consolidated entity, to set appropriate risk limits and controls, and to monitor risks and adherence to limits. Risk management policies and systems are reviewed regularly to reflect changes in market conditions and the consolidated entity’s activities. The consolidated entity, through training and management standards and procedures, aims to develop a disciplined and constructive control environment in which all employees understand their roles and obligations.
The Audit, Risk and Compliance Committee oversees how management monitors compliance with the consolidated entity’s risk management policies and procedures and reviews the adequacy of the risk management framework in relation to the risks faced by the consolidated entity.

64 Thorn Group
Notes to the Consolidated Financial StatementsFor The Year Ended 31 March 2015
11. Financial Risk Management (continued)(a) Financial Risk Management Objectives and Policies (continued)Credit riskCredit risk is the risk of financial loss to the consolidated entity if a customer fails to meet its contractual obligation, and arises principally from the consolidated entity’s trade, loan and finance lease receivables from customers and purchased debt ledgers.
To manage credit risk, the consolidated entity has formulated comprehensive credit policies covering credit assessments and compliance with regulatory and statutory requirements. Credit underwriting includes the use of a scorecard system or credit bureau report or a detailed internal risk profile for each application. The scorecard system is revised periodically and adjusted for a number of factors including geographic location and market changes.
Credit risk for purchased debt ledgers is managed through a stringent process involving analysis of the target entity and its customer history and with reference to the industry.
The carrying amount of the consolidated entity’s financial assets represents the maximum credit exposure. The consolidated entity’s net exposure to credit risk at the reporting date was:
In thousands of AUD 2015 2014
Trade receivables 2,985 4,062
Consumer finance lease receivables 100,151 61,372
Commercial finance lease receivables 82,590 49,977
Other commercial receivables 36,532 –
Loan receivables 41,056 25,272
Purchased debt ledgers 14,409 8,874
277,723 149,557
Impairment lossesTrade receivables
The consolidated entity assesses the impairment of receivables monthly. The calculations include an assessment of the expected rates of loss and for consumer lease receivables, an estimate of collateral.
The aging of the consolidated entity’s trade receivables at the reporting date was:
In thousands of AUDGross 2015
Impairment 2015
Gross 2014
Impairment 2014
Not past due 965 – 1,488 –
Past due 0 – 30 Days 1,761 134 1,925 133
Past due 31 – 180 Days 1,457 1,064 1,621 839
4,183 1,198 5,034 972
The net value of trade receivables as at 31 March 2015 was $2,985,000 (2014: $4,062,000)
The consolidated entity invoices its consumer rental customers in advance of the rental period. The revenue is not recognised in the financial statements until the due date of the invoice.

Annual Report 2015 65
Consumer finance lease receivables
Finance lease receivables that are past due are disclosed in the trade receivables above.
The provision for impairment losses as at 31 March 2015 is $17,325,000 (2014: $8,961,000). The provision reflects the risk to the consolidated entity of the expected early return or loss of products throughout the life of the contract.
Collateral is held against the finance lease receivables in the form of the assets attached to the contract. In the event that the asset is returned due to early termination of the contract, the asset is available for rental on other contracts or disposal via cash sale. The value of this collateral as at 31 March 2015 is $70,359,000 (2014: $39,696,000).
Commercial finance lease receivables
The ageing of the consolidated entity’s commercial finance lease receivables at the reporting date was:
In thousands of AUDGross 2015
Impairment 2015
Gross 2014
Impairment 2014
Not past due 84,363 1,773 49,832 –
Past due 0 – 30 Days 124 124 1,113 968
Past due 31 – 180 Days 511 511 597 597
84,998 2,408 51,542 1,565
The net value of commercial finance lease receivables as at 31 March 2015 was $82,590,000 (2014: $49,977,000)
Other commercial receivables
The ageing of the consolidated entity’s other commercial receivables at the reporting date was:
In thousands of AUDGross 2015
Impairment 2015
Gross 2014
Impairment 2014
Not past due 33,856 – – –
Past due 0 – 30 Days 782 – – –
Past due 31 – 180 Days 2,394 (500) – –
37,032 (500) – –
Loan receivables
The ageing of the consolidated entity’s loan receivables at the reporting date was:
In thousands of AUDGross 2015
Impairment 2015
Gross 2014
Impairment 2014
Not past due 40,785 1,881 24,924 1,066
Past due 0 – 30 Days 2,391 239 1,571 157
Past due 31 – 180 Days 2,607 2,607 1,936 1,936
45,783 4,727 28,431 3,159
The net value of loan receivables as at 31 March 2015 was $41,056,000 (2014: $25,272,000)

66 Thorn Group
Notes to the Consolidated Financial StatementsFor The Year Ended 31 March 2015
11. Financial Risk Management (continued)(a) Financial Risk Management Objectives and Policies (continued)Liquidity riskLiquidity risk is the risk that the consolidated entity will not be able to meet its financial obligations as they fall due. The consolidated entity’s approach to managing liquidity is to ensure, as far as possible, that it will always have sufficient liquidity to meet is liabilities when due, under both normal and stressed conditions, without incurring unacceptable losses or risking damage to the consolidated entity’s reputation.
The following are the contractual maturities of the consolidated entity’s financial liabilities including, where applicable, future interest payments as at 31 March 2015.
31 March 2015
In thousands of AUDCarrying Amount
Contractual Cash Flows
1 year or less 2-5 years
5 years or more
Secured loan facilities 143,973 158,612 25,360 133,252 –
Trade and other payables 32,005 32,005 32,005 – –
175,978 190,617 57,365 133,252 –
31 March 2014
In thousands of AUDCarrying Amount
Contractual Cash Flows
1 year or less 2-5 years
5 years or more
Secured loan facilities 40,496 46,966 11,468 35,498 –
Trade and other payables 23,390 23,390 23,390 – –
63,886 70,356 34,858 35,498 –
The consolidated entity’s access to financing arrangements is disclosed in Note 12.
Market riskMarket risk is the risk that changes in market prices, such as interest rates and foreign currency that will affect the consolidated entity’s income. The objective of market risk management is to manage and control market risk exposures within acceptable parameters, while optimising returns. The consolidated entity has foreign currency risk on the purchase of rental assets directly imported that are denominated in USD. The consolidated entity manages its exposure to foreign currency risk by utilising forward exchange contracts where appropriate.
Interest Rate RiskAt the reporting date the interest rate profile of the consolidated entity’s interest bearing financial instruments was:
In thousands of AUD 2015 2014
Financial assets 10,842 1,136
Financial liabilities (143,973) (40,496)
A change of one percent in interest rates at the reporting date would have increased or decreased the consolidated entity’s equity and profit or loss by $932,000 (2014: $276,000).

Annual Report 2015 67
Capital managementThe Board’s policy is to maintain a strong capital base so as to maintain investor, creditor and market confidence and to sustain future development of the business. The Board of Directors monitors the return on equity, which the consolidated entity defines as net profit after tax divided by the average of opening and closing equity. The Board of Directors also monitors the level of dividends to ordinary shareholders. Refer to Note 14 for quantitative data.
Financial InstrumentsNon-derivative financial instruments
Non-derivative financial instruments comprise trade and other receivables, cash and cash equivalents, loans and borrowings, and trade and other payables.
Non-derivative financial instruments excluding financial assets at fair value through profit and loss are recognised initially at fair value plus transaction costs. Subsequent to initial recognition non-derivative financial instruments are measured at amortised cost less impairment losses.
A financial instrument is recognised if the consolidated entity becomes a party to the contractual provisions of the instrument. Financial assets are derecognised if the consolidated entity’s contractual rights to the cash flows from the financial assets expire or if the consolidated entity transfers the financial asset to another party without retaining control or substantially all risks and rewards of the asset. Financial liabilities are derecognised if the consolidated entity’s obligation specified in the contract expire or are discharged or cancelled.
Financial assets and liabilities are offset and the net amount presented in the statement of financial position when, and only when, the consolidated entity has a legal right to offset the amounts and intends either to settle on a net basis or realise the asset and settle the liability simultaneously.
The consolidated entity recognises its financial assets at either amortised cost or fair value, depending on its business model for managing the financial assets and the contractual cash flow characteristics of the financial assets. The classification of financial assets that the consolidated entity held at the date of initial application was based on the facts and circumstances of the business model in which the financial assets were held at that date.
Financial assets recognised at amortised cost are measured using the effective interest method, net of any impairment loss.
Financial assets other than those classified as financial assets recognised at amortised cost are measured at fair value with any changes in fair value recognised in profit or loss. Financial assets designated at fair value comprise purchased debt ledgers.
(b) Fair ValuesThe fair values of the Company’s and consolidated entity’s financial assets and liabilities as at the reporting date are considered to approximate their carrying amounts.
(c) The Fair Value HierarchyFinancial instruments carried at fair value require disclosure of the valuation method according to the following hierarchy:
Level 1 – Quoted prices (unadjusted) in active markets for identical assets or liabilities.
Level 2 – Inputs other than quoted prices included within Level 1 that are observable for the asset or liability, either directly (i.e. as prices) or indirectly (i.e. derived from prices)
Level 3 – Inputs for the asset or liability that are not based on observable market data.
The consolidated entity’s financial instruments are measured at fair value. The Group’s only Level 2 instruments are forward foreign exchange contracts and an interest rate derivative. Other financial instruments including purchase debt ledgers are classified as Level 3.

68 Thorn Group
Notes to the Consolidated Financial StatementsFor The Year Ended 31 March 2015
12. Loans and Borrowings
In thousands of AUD 2015 2014
Current liabilities
Secured loans 19,778 9,099
Non-current liabilities
Secured loans 124,195 31,397
143,973 40,496
Loans and borrowings are recognised initially at fair value less attributable transaction costs. Subsequent to initial recognition, loans and borrowings are stated at amortised cost with any difference between cost and redemption value being recognised in the profit or loss over the period of the borrowings on an effective interest basis.
Financing Loan Facilities
In thousands of AUD 2015 2014
Secured loan facilities available 210,000 100,000
210,000 100,000
Secured loan facilities utilised at balance date 143,973 40,496
143,973 40,496
Secured loan facilities not utilised at reporting date 66,027 59,504
66,027 59,504
Thorn Australia Pty Limited has a loan facility of $110,000,000 secured by a fixed and floating charge over the assets of the consolidated entity.
As at 31st March 2015 $84,000,000 was drawn.
The consolidated entity entered into a warehouse loan facility of $100,000,000 secured by rentals and payments receivable in respect of the underlying lease receivable contracts during the financial year. The amounts due and payable on the warehouse loan facility in the next 12 months are disclosed as current.
As at 31st March 2015 $59,973,000 was drawn.
For more information about the consolidated entity’s exposure to interest rate risk and liquidity risk see note 11.
13. Capital and Reserves
2015 2014
On issue at the beginning of year 149,494,813 147,584,880
Issue of new shares on vesting of performance rights – 127,919
Issue of shares under dividend investment plan 1,843,026 1,782,014
On issue at the end of year 151,337,839 149,494,813

Annual Report 2015 69
Ordinary shares are classified as equity. Incremental costs directly attributable to issue of ordinary shares and performance rights are recognised as a deduction from equity net of any tax effects.• Holders of ordinary shares are entitled to receive dividends as declared from time to time and are entitled to one vote per
share at shareholder’s meetings.• In the event of the winding up of the Company ordinary shareholders rank after all other shareholders and creditors and are
fully entitled to any proceeds of liquidation.• The Company does not have authorised capital or par value in respect of its issued shares.
ReservesEquity Remuneration ReserveThe equity remuneration reserve represents the value of performance rights issued under the Company’s long-term incentive plan.
DividendsDividends are recognised as a liability in the period in which they are declared.
Dividends recognised in the current year by the Company are:
Cents per share
Amount$’000s
Franked / unfranked
Date of payment
2015
Final 2014 6.5 9,717 Franked 17-Jul-14
Interim 2015 5.0 7,532 Franked 22-Jan-15
Total amount 17,249
2014
Final 2013 6.0 8,863 Franked 18-Jul-13
Interim 2014 4.5 6,700 Franked 17-Jan-14
Total amount 15,563
Franked dividends declared or paid during the year were franked at the tax rate of 30%.
After the balance sheet date, the following dividend was proposed by the directors.
Cents per share
Total amount
Franked/unfranked
Expected date of payment
Final ordinary 6.75 10,215,304 Franked 16 July 2015
The financial effect of this dividend has not yet been brought to account in the financial statements for the year ended 31 March 2015 and will be recognised in subsequent financial reports. The impact on the dividend franking account of dividends proposed after the balance date but not recognised as a liability is to reduce franking credits by $4,377,987 (2014: $4,164,498).
Dividend franking account
In thousands of AUD 2015 2014
30% franking credits available to shareholders of Thorn Group Limited for subsequent financial years 35,733 30,813
The above available amounts are based on the balance of the dividend franking account at year end adjusted for:• franking credits that will arise from the payment of the current tax liabilities;• franking debits that will arise from the payment of dividends recognised as a liability at the year end; and• franking credits that the entity may be prevented from distributing in subsequent years.
The ability to utilise the franking credits is dependent upon there being sufficient available profits to declare dividends.

70 Thorn Group
Notes to the Consolidated Financial StatementsFor The Year Ended 31 March 2015
13. Capital and Reserves (continued)Dividend Reinvestment Plan (DRP)The consolidated entity has operated a DRP during the financial year. An issue of shares under the dividend investment plan results in an increase in issued capital. The DRP allows eligible shareholders to elect to invest dividends in ordinary shares which rank equally with the Company’s ordinary shares. All holders of the Company ordinary shares are eligible to participate in the plan.
The issue price for the shares acquired under the DRP will be a price derived from the arithmetic average of the daily volume weighted average market price per Company shares during the five trading days commencing on the second trading day following the Record Date for the relevant dividend, less any discount the directors may determine from time to time and announce to the Australian Stock Exchange.
In accordance with the Company’s DRP, 1,843,026 new ordinary shares totalling $4,386,000 were issued.
14. Earnings Per ShareThe consolidated entity presents basic and diluted earnings per share (EPS) data for its ordinary shares.
Basic earnings per shareBasic EPS is calculated by dividing the profit or loss attributable to ordinary shareholders of the Company by the weighted average number of ordinary shares outstanding during the period.
The calculation of basic earnings per share at 31 March 2015 was based on profit attributable to ordinary shareholders of $30,593,000 (2014: $28,151,000) and a weighted average number of ordinary shares during the year ended 31 March 2015 of 150,430,487 (2014: 148,640,899).
Diluted earnings per shareDiluted EPS is determined by adjusting the profit or loss attributable to ordinary shareholders and the weighted average number of ordinary shares outstanding for the effects of all dilutive potential ordinary shares, which comprise performance rights granted to employees.
The calculation of diluted earnings per share at 31 March 2015 was based on profit attributable to ordinary shareholders of $30,593,000 (2014: $28,151,000) and a weighted average number of ordinary shares during the year ended 31 March 2015 of 150,430,487 (2014: 148,640,899), which includes performance rights granted.
2015 2014
Profit attributable to ordinary shareholders (basic)
In thousands of AUD
Profit attributable to ordinary shareholders (basic and diluted) 30,593 28,151
Weighted average number of ordinary shares (basic)
In thousands of shares
Issued ordinary shares at 1 April 149,495 147,584
Effect of shares issued 936 1,057
Weighted average number of ordinary shares at 31 March 150,430 148,641
Weighted average number of ordinary shares (diluted)
In thousands of shares
Issued ordinary shares at 1 April 149,495 147,584
Effect of shares issued 936 1,057
Weighted average number of ordinary shares (diluted) at 31 March 150,430 148,641
Earnings per share
Basic earnings per share (cents) 20.34 18.94
Diluted earnings per share (cents) 20.34 18.94
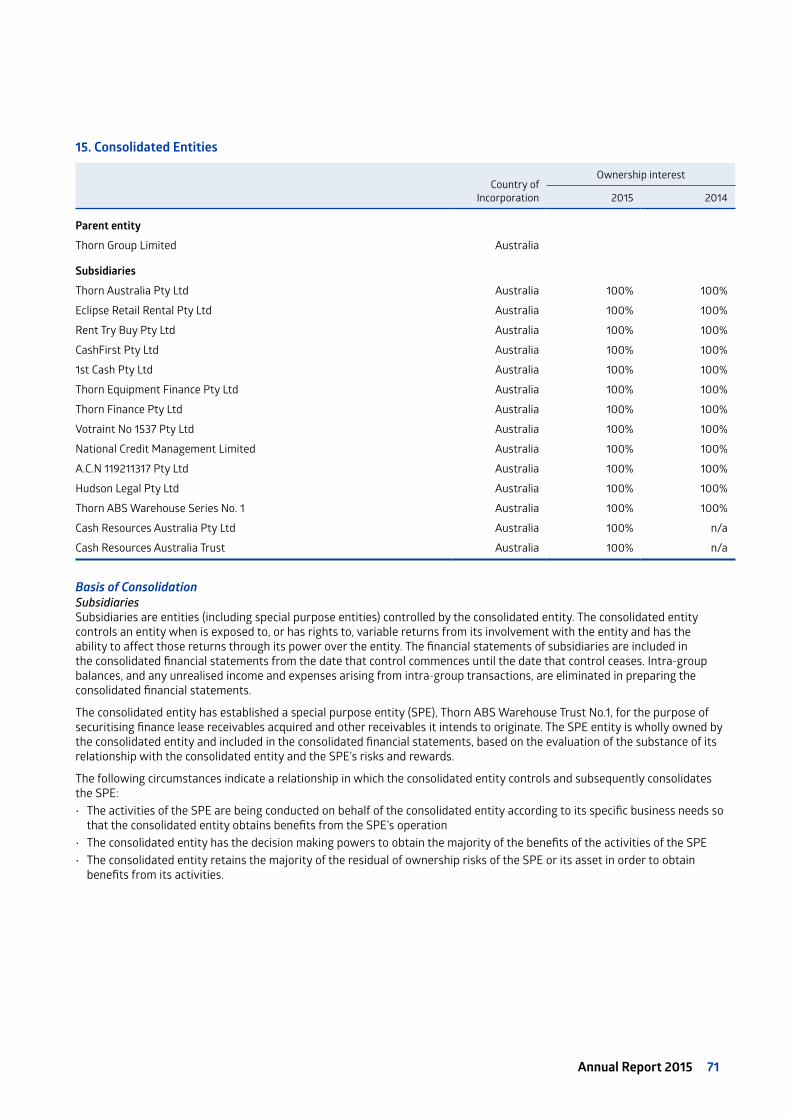
Annual Report 2015 71
15. Consolidated Entities
Country ofIncorporation
Ownership interest
2015 2014
Parent entity
Thorn Group Limited Australia
Subsidiaries
Thorn Australia Pty Ltd Australia 100% 100%
Eclipse Retail Rental Pty Ltd Australia 100% 100%
Rent Try Buy Pty Ltd Australia 100% 100%
CashFirst Pty Ltd Australia 100% 100%
1st Cash Pty Ltd Australia 100% 100%
Thorn Equipment Finance Pty Ltd Australia 100% 100%
Thorn Finance Pty Ltd Australia 100% 100%
Votraint No 1537 Pty Ltd Australia 100% 100%
National Credit Management Limited Australia 100% 100%
A.C.N 119211317 Pty Ltd Australia 100% 100%
Hudson Legal Pty Ltd Australia 100% 100%
Thorn ABS Warehouse Series No. 1 Australia 100% 100%
Cash Resources Australia Pty Ltd Australia 100% n/a
Cash Resources Australia Trust Australia 100% n/a
Basis of ConsolidationSubsidiariesSubsidiaries are entities (including special purpose entities) controlled by the consolidated entity. The consolidated entity controls an entity when is exposed to, or has rights to, variable returns from its involvement with the entity and has the ability to affect those returns through its power over the entity. The financial statements of subsidiaries are included in the consolidated financial statements from the date that control commences until the date that control ceases. Intra-group balances, and any unrealised income and expenses arising from intra-group transactions, are eliminated in preparing the consolidated financial statements.
The consolidated entity has established a special purpose entity (SPE), Thorn ABS Warehouse Trust No.1, for the purpose of securitising finance lease receivables acquired and other receivables it intends to originate. The SPE entity is wholly owned by the consolidated entity and included in the consolidated financial statements, based on the evaluation of the substance of its relationship with the consolidated entity and the SPE’s risks and rewards.
The following circumstances indicate a relationship in which the consolidated entity controls and subsequently consolidates the SPE:• The activities of the SPE are being conducted on behalf of the consolidated entity according to its specific business needs so
that the consolidated entity obtains benefits from the SPE’s operation• The consolidated entity has the decision making powers to obtain the majority of the benefits of the activities of the SPE• The consolidated entity retains the majority of the residual of ownership risks of the SPE or its asset in order to obtain
benefits from its activities.

72 Thorn Group
Notes to the Consolidated Financial StatementsFor The Year Ended 31 March 2015
16. Deed of Cross GuaranteePursuant to ASIC Class Order 98/1418 (as amended) dated 13 August 1998 certain wholly owned subsidiaries are relieved from the Corporations Act 2001 requirements for preparation, audit and lodgement of financial reports, and directors’ reports.
It is a condition of the Class Order that the Company and each of the subsidiaries enter into a Deed of Cross Guarantee. The effect of this is that the Company guarantees to each creditor payment in full of any debt in the event of winding up of any of the subsidiaries under certain provisions of the Corporations Act 2001. If a winding up occurs under other provisions of the Act, the Company will only be liable in the event that after six months any creditor has not been paid in full. The subsidiaries have also given similar guarantees in the event that the Company is wound up. The subsidiaries subject to the Deed are listed in Note 15 (excluding Thorn ABS Warehouse Series No. 1).
The consolidated Statement of Comprehensive Income comprising of entities which are parties to the Deed, after eliminating all transactions between parties to the Deed of Cross Guarantee, at 31 March 2015, is the same as the consolidated Statement of Comprehensive Income in this financial report. The consolidated Statement of Financial Position in this financial report includes the assets and liabilities of Thorn ABS Warehouse Series No. 1. Excluding the Thorn ABS Warehouse Series No. 1, cash and cash equivalents would decrease by $3,014,000 and trade and other payables would decrease by $3,014,000.
During the year the group acquired 100% of both Cash Resources Australia Pty Limited and Cash Resources Trust. These entities have been included within the Deed of Cross Guarantee.
17. Parent Entity DisclosuresAs at, and throughout, the financial year ending 31 March 2015 the parent entity of the consolidated entity was Thorn Group Limited.
In thousands of AUD 2015 2014
Result of Parent Entity
Profit for the period 17,249 15,563
Other comprehensive income – –
Total comprehensive income for the period 17,249 15,563
Financial position of the parent entity at year end
Current assets 1,379 7,039
Total assets 107,814 108,950
Current liabilities 1,379 7,039
Total liabilities 1,379 7,039
Total equity of the parent comprising of:
Share capital 103,446 99,060
Equity remuneration reserve 2,989 2,851
Total Equity 106,435 101,911
The parent entity has entered into a Deed of Cross Guarantee with the subsidiaries.
Further details of the Deed of Cross Guarantee and the subsidiaries subject to the deed are disclosed in Note 16.

Annual Report 2015 73
18. Acquisition of subsidiaryThe Group acquired the trade and assets of the following entities:
Date of acquisition Entity Purchased % Acquired
1 December 2014 Cash Resources Australia Pty Ltd 100% (i)
1 December 2014 Cash Resources Australia Trust 100% (i)
(i) Acquisition of business assets
Details of the fair value of the assets and liabilities acquired are as follows:
$000’s
(a) Purchase consideration
Cash paid to date 45,609
Less cash acquired (2,337)
Net cash payment 43,272
Less acquisition costs (2,246)
Net purchase consideration 41,026
Fair value of net identifiable assets acquired (b) (37,779)
Goodwill 3,247
(b) Assets and liabilities acquired
The assets and liabilities arising from the acquisition are as follows:
Trade and other receivables 41,295
Property, plant and equipment 355
Creditors and employee benefits provision (3,871)
Fair value of net identifiable assets and liabilities acquired 37,779
The fair value of identifiable assets and liabilities of CRA approximated their carrying values at the date of acquisition.
The accounting for the above acquisition is provisional as at 31 March 2015. The Group is working through valuations of potential separately identifiable intangibles.
The acquired entity contributed $800,000 profit after tax and $4,300,000 revenue for the Group from the date of acquisition.
It is impractical to report the profit that would have been included within the results if the acquisition had occurred at the beginning of the year due to cost and revenue synergies, funding and changes in management structures and operations.
19. Employment Benefits Expense
In thousands of AUD 2015 2014
Wages and salaries 49,679 44,966
Contributions to defined contribution superannuation funds 3,561 3,173
Termination benefits 341 638
Equity settled share-based payment transactions 272 82
53,853 48,859

74 Thorn Group
Notes to the Consolidated Financial StatementsFor The Year Ended 31 March 2015
20. Related PartiesKey management personnel remuneration
In AUD 2015 2014
Short-term employee benefits 3,070,462 1,949,009
Post-employment benefits 157,937 87,342
Long-term employee benefits 333,977 380,259
Share based payments 225,530 127,400
3,787,906 2,544,010
Individual directors and executives compensation disclosuresInformation regarding individual director’s and executive’s compensation and some equity instruments disclosures as required by Corporations Regulation 2M.3.03 is provided in the remuneration report section of the directors’ report on pages 28 to 39.
Stephen Kulmar is a Director of Retail Oasis and Creative Oasis. During the financial year the group retained these entities in relation to brand and advertising work. The total benefit excluding GST was $401,258.
This work was undertaken and invoiced on an arms length basis and there were no balances outstanding as at year end. This was reviewed by the Board and determined to be in accordance with the Company’s independence policy.
No other director has entered into a material contract with the company or the consolidated entity since the end of the previous financial year and there were no material contracts involving directors’ interests existing at year end.
Movements in sharesThe movement during the reporting period in the number of ordinary shares in Thorn Group Limited held, directly, indirectly, or beneficially, by each key management person, including their related parties, is as follows:
Held at 1 April 2014 Purchases Sales
Received upon exercise of
performance rightsHeld at
31 March 2015
Directors
Joycelyn Morton 39,000 23,018 – – 62,018
Stephen Kulmar – 60,000 – – 60,000
Peter Henley 60,278 11,221 – – 71,499
David Foster – 21,490 – – 21,490
Executives
James Marshall 126,887 4,198 – – 131,085
Peter Eaton 367,435 – – – 367,435
Held at 1 April 2013 Purchases Sales
Received upon exercise of
performance rightsHeld at
31 March 2014
Directors
David Carter 241,300 11,429 60,000 – 192,729
John Hughes 3,347,463 – – 81,650 3,429,113
Peter Henley 60,278 – – – 60,278
Joycelyn Morton 34,000 5,000 – – 39,000
Executives
James Marshall 107,835 – – 19,052 126,887
Peter Eaton 340,218 – – 27,217 367,435

Annual Report 2015 75
21. Auditors’ Remuneration
In whole AUD 2015 2014
Audit services
KPMG Australia:
Audit and review of financial reports 368,000 336,000
Compliance assurance services 31,500 8,500
Acquisition related audit services 45,000 –
444,500 344,500
Other services
KPMG Australia:
Taxation services – compliance 100,316 60,000
Taxation services – advice 98,035 30,000
Transaction services 60,000 –
Other services 79,250 45,000
337,601 135,000
22. ContingenciesThe industry in which the consolidated entity operates is highly regulated. Documentation, marketing and sales activities (both written and verbal) must comply with strict rules provided in the National Consumer Credit Protection Act and other legislation such as the Fair Trading and door to door sales legislation. Breach of these rules can result in fines or civil penalties or damages or compensation or some combination of these.
The consolidated entity has no reason to believe that a breach of these rules will occur or is likely to result in a material effect on the profitability of the consolidated entity. No provision exists for any potential exposure in connection with such a breach.
The consolidated entity is aware (via the “mystery shop” process, where a person presents as a customer but is not a real customer) that some verbal statements may have been made to some customers inaccurately describing the customer’s rights in relation to the acquisition of similar products to those rented under its Rent Try $1 Buy® contracts. Under the National Consumer Credit Protection Act, the amount at risk in relation to any affected contract is part of any deemed “interest” payable under that contract and/or any penalties which could be imposed. No customer complaints have been received in this regard.
The consolidated entity has no reason to believe that this matter is likely to result in a material effect on the profitability of the consolidated entity and no provision exists for any potential exposure in connection with this matter.

76 Thorn Group
Directors’ Declaration
1 In the opinion of the directors of Thorn Group Limited (the ‘Company’):
(a) the financial statements and notes that are set out on pages 47 to 75 and the remuneration disclosures that are contained in the Remuneration Report in the Directors’ report are in accordance with the Corporations Act 2001, including:
(i) giving a true and fair view of the consolidated entity’s financial position as at 31 March 2015 and of their performance, for the financial year ended on that date; and
(ii) complying with Australian Accounting Standards and the Corporations Regulations 2001;
(b) the financial report also complies with International Financial Reporting Standards as disclosed in Note 1(a); and
(c) there are reasonable grounds to believe that the Company will be able to pay its debts as and when they become due and payable.
2 There are reasonable grounds to believe that the Company and the consolidated entities identified in Note 15 will be able to meet any obligations or liabilities to which they are or may become subject to by virtue of the Deed of Cross Guarantee between the Company and the consolidated entities pursuant to ASIC Class Order 98/1418.
3 The directors have been given the declarations required by Section 295A of the Corporations Act 2001 from the Managing Director and Chief Financial Officer for the financial year ended 31 March 2015.
Signed in accordance with a resolution of the directors:
Joycelyn Morton James Marshall Chairperson Managing Director
Dated at Sydney 27 May 2015

Annual Report 2015 77
Independent Auditor’s Report
Independent Auditor’s Report to the members of Thorn Group LimitedReport on the financial reportWe have audited the accompanying financial report of Thorn Group Limited (the ‘Company’), which comprises the consolidated statement of financial position as at 31 March 2015, and the consolidated statement of comprehensive income, consolidated statement of changes in equity and consolidated statement of cash flows for the year ended on that date, notes 1 to 22 comprising a summary of significant accounting policies and other explanatory information and the directors’ declaration of the Group comprising the Company and the entities it controlled at the year’s end or from time to time during the financial year.
Directors’ responsibility for the financial reportThe directors of the Company are responsible for the preparation of the financial report that gives a true and fair view in accordance with Australian Accounting Standards and the Corporations Act 2001 and for such internal control as the directors determine is necessary to enable the preparation of the financial report that is free from material misstatement whether due to fraud or error. In Note 1, the directors also state, in accordance with Australian Accounting Standard AASB 101 Presentation of Financial Statements, that the financial statements of the consolidated entity comply with International Financial Reporting Standards.
Auditor’s responsibilityOur responsibility is to express an opinion on the financial report based on our audit. We conducted our audit in accordance with Australian Auditing Standards. These Auditing Standards require that we comply with relevant ethical requirements relating to audit engagements and plan and perform the audit to obtain reasonable assurance whether the financial report is free from material misstatement.
An audit involves performing procedures to obtain audit evidence about the amounts and disclosures in the financial report. The procedures selected depend on the auditor’s judgement, including the assessment of the risks of material misstatement of the financial report, whether due to fraud or error. In making those risk assessments, the auditor considers internal control relevant to the entity’s preparation of the financial report that gives a true and fair view in order to design audit procedures that are appropriate in the circumstances, but not for the purpose of expressing an opinion on the effectiveness of the entity’s internal control. An audit also includes evaluating the appropriateness of accounting policies used and the reasonableness of accounting estimates made by the directors, as well as evaluating the overall presentation of the financial report.
We performed the procedures to assess whether in all material respects the financial report presents fairly, in accordance with the Corporations Act 2001 and Australian Accounting Standards, a true and fair view which is consistent with our understanding of the Group’s financial position and of its performance.
We believe that the audit evidence we have obtained is sufficient and appropriate to provide a basis for our audit opinion.
IndependenceIn conducting our audit, we have complied with the independence requirements of the Corporations Act 2001.
Auditor’s opinionIn our opinion:(a) the financial report of the Group is in accordance with the Corporations Act 2001, including: (i) giving a true and fair view of the Group’s financial position as at 31 March 2015 and of its performance for the year
ended on that date; and (ii) complying with Australian Accounting Standards and the Corporations Regulations 2001.(b) the financial report also complies with International Financial Reporting Standards as disclosed in Note 1.
ABCD
KPMG, an Australian partnership and a member firm of the KPMG network of independent member firms affiliated with KPMG International Cooperative (“KPMG International”), a Swiss entity.
Liability limited by a scheme approved under Professional Standards Legislation.
Independent auditor’s report to the members of SG Fleet Group Limited
Report on the financial report
We have audited the accompanying financial report of SG Fleet Group Limited (the Company), which comprises the consolidated statement of financial position as at 30 June 2014, and consolidated statement of profit and loss and comprehensive income, consolidated statement of changes in equity and consolidated statement of cash flows for the period ended on that date, notes 1 to 39 comprising a summary of significant accounting policies and other explanatory information and the directors’ declaration of the Group comprising the company and the entities it controlled at the period’s end or from time to time during the financial period.
Directors’ responsibility for the financial report
The directors of the Company are responsible for the preparation of the financial report that gives a true and fair view in accordance with Australian Accounting Standards and the Corporations Act 2001 and for such internal control as the directors determine is necessary to enable the preparation of the financial report that is free from material misstatement whether due to fraud or error. In note 2, the directors also state, in accordance with Australian Accounting Standard AASB 101 Presentation of Financial Statements, that the financial statements of the Group comply with International Financial Reporting Standards.
Auditor’s responsibility
Our responsibility is to express an opinion on the financial report based on our audit. We conducted our audit in accordance with Australian Auditing Standards. These Auditing Standards require that we comply with relevant ethical requirements relating to audit engagements and plan and perform the audit to obtain reasonable assurance whether the financial report is free from material misstatement.
An audit involves performing procedures to obtain audit evidence about the amounts and disclosures in the financial report. The procedures selected depend on the auditor’s judgement, including the assessment of the risks of material misstatement of the financial report, whether due to fraud or error. In making those risk assessments, the auditor considers internal control relevant to the entity’s preparation of the financial report that gives a true and fair view in order to design audit procedures that are appropriate in the circumstances, but not for the purpose of expressing an opinion on the effectiveness of the entity’s internal control. An audit also includes evaluating the appropriateness of accounting policies used and the reasonableness of accounting estimates made by the directors, as well as evaluating the overall presentation of the financial report.
We performed the procedures to assess whether in all material respects the financial report presents fairly, in accordance with the Corporations Act 2001 and Australian Accounting Standards, a true and fair view which is consistent with our understanding of the Group’s financial position and of its performance.
We believe that the audit evidence we have obtained is sufficient and appropriate to provide a basis for our audit opinion.

78 Thorn Group
Independent Auditor’s Report (continued)
Report on the remuneration reportWe have audited the Remuneration Report included in pages 28 to 39 of the directors’ report for the year ended 31 March 2015. The directors of the Company are responsible for the preparation and presentation of the remuneration report in accordance with Section 300A of the Corporations Act 2001. Our responsibility is to express an opinion on the remuneration report, based on our audit conducted in accordance with auditing standards.
Auditor’s opinionIn our opinion, the remuneration report of Thorn Group Limited for the year ended 31 March 2015, complies with Section 300A of the Corporations Act 2001.
KPMG
Anthony Travers Partner
Sydney 27 May 2015

Annual Report 2015 79
Shareholder Information
Distribution of shareholders
Fully Paid Ordinary Shares (Total) as of 31 Mar 2015
Total holders Units % of Issued Capital
1 to 1,000 1,655 847,238 0.56
1,001 to 5,000 3,256 9,387,903 6.20
5,001 to 10,000 1,392 10,530,787 6.96
10,001 to 100,000 1,408 32,137,565 21.24
100,001 - 9,999,999,999 69 98,434,346 65.04
Rounding 0
Total 7,780 151,337,839 100.00
Unmarketable parcels
Minimum Parcel Size Holders Units
Minimum $ 500.00 parcel at $ 2.67 per unit 188 282 7,258
The names of the substantial shareholders listed in the Company’s register as at 31 March 2015 are:
Rank Name % S/O Mar-15
1 Kinetic Investment Partners Limited 10,037,184
2 Vinva Investment Management Limited 9,466,618
Voting Rights The Company only has ordinary shares on issue.
Each ordinary share is entitled to one vote when a poll is called, otherwise each member present at a meeting or by proxy has one vote on a show of hands.

80 Thorn Group
20 largest shareholders – ordinary shares
Rank NameNumber of ordinary
fully paid shares held% held of issued ordinary capital
1 J P Morgan Nominees Australia Limited 24,709,614 16.332 HSBC Custody Nominees (Australia) Limited 15,156,362 10.013 National Nominees Limited 14,278,080 9.434 RBC Investor Services Australia Nominees Pty Limited <Bkcust A/C> 9,367,245 6.195 Citicorp Nominees Pty Limited 9,174,986 6.066 BNP Paribas Noms Pty Ltd <Drp> 7,871,740 5.207 Dove Nest Pty Ltd <Golden Heath Person Sf A/C> 2,000,000 1.328 Citicorp Nominees Pty Limited <Colonial First State Inv A/C> 1,844,761 1.229 Warbont Nominees Pty Ltd <Accumulation Entrepot A/C> 1,305,675 0.8610 Australian Executor Trustees Limited <No 1 Account> 701,928 0.4611 HSBC Custody Nominees (Australia) Limited - A/C 2 642,488 0.4212 Mr Jeffrey Douglas Pappin 605,000 0.4013 Farjoy Pty Ltd 437,500 0.2914 UBS Nominees Pty Ltd 401,306 0.2715 Mr Peter Eaton 367,435 0.2416 NCH Pty Ltd 356,429 0.2417 UBS Nominees Pty Ltd 341,881 0.2318 Romadak Pty Ltd <Romadak Super Fund A/C> 338,696 0.2219 Mr Michael John Horn 301,775 0.2020 Associated World Investments Pty Ltd 290,000 0.19
Shareholder Information (continued)

Corporate Directory
Directors
Joycelyn MortonChair
James MarshallManaging Director
Peter HenleyNon-Executive Director
Stephen KulmarNon-Executive Director
David FosterNon-Executive Director
Company secretary
Peter Eaton
Registered office
Thorn Group LimitedLevel 162 Hume HighwayChullora NSW 2200www.thorn.com.auTelephone: +61 2 9101 5000Facsimile: +61 2 9101 5033
Auditor to Thorn Group Limited
KPMG10 Shelley StreetSydney NSW 2000
Registry
Computershare Investor Services Pty LimitedLevel 360 Carrington StreetSydney NSW 2000