growth, biomass, and allometry of resprouting shrubs after fire in
TRANSCRIPT
Growth, Biomass, and Allometry of Resprouting Shrubs afterFire in Scrubby Flatwoods
JENNIFER L. SCHAFER1AND MICHELLE C. MACK
Department of Biology, 220 Bartram Hall, University of Florida, P.O. Box 118525, Gainesville, 32611
ABSTRACT.—Resprouting is advantageous for plants in pyrogenic ecosystems because itallows for quick re-acquisition of space after fire. Resprouting species build multiple stemsduring their lifetime and have an established root system, which may affect growth andbiomass allocation and whether resprouts conform to predicted scaling relationships. Wemeasured height, basal diameter, and biomass of stems of five resprouting shrub species inscrubby flatwoods sites in Florida, varying in time after fire (6 w, 1 y, 8–9 y, 20–21 y).Differences among species in size and allocation ratios tended to be greater in recentlyburned sites. Six weeks after fire, the dominant species, Quercus inopina, had the highestheight:diameter and leaf:stem biomass ratios, which may contribute to the ability of thisspecies to persist over fire cycles. The slope of the relationship between stem height anddiameter was higher in recently burned sites than 8 to 21 y after fire, whereas the slope of therelationship between stem height and biomass was higher 8 to 21 y after fire than in recentlyburned sites. Height and biomass of resprouts generally scaled differently with respect todiameter and height than predicted by allometric theory, but biomass of resprouts, onaverage, scaled with diameter as predicted. Therefore, resprouted stems were taller for agiven diameter and accumulated less biomass with height growth. In pyrogenic ecosystems, itmay be more advantageous to grow tall, to maximize light capture, than to invest in strengthto avoid damage because fire will eventually remove stems. Our results indicated that currentallometric theory does not adequately represent scaling of growth and biomass of resproutingshrubs.
INTRODUCTION
Disturbances such as fire often result in the nearly complete removal of abovegroundbiomass. Woody species in many ecosystems persist after fire by resprouting from survivingbelowground organs (Menges and Kohfeldt, 1995; Higgins et al., 2000; Bond and Midgley,2001; Keeley et al., 2006; Paula and Pausas, 2006). Differences among resprouting species intheir ability to occupy space aboveground after fire may be indicative of differences incompetitive ability (Kozovits et al., 2005) and contribute to maintenance of speciesabundances and dominance. Furthermore, changes in fire frequency and severity have thepotential to alter allocation to resprouting as a response to disturbance (Bellingham andSparrow, 2000; Lawes and Clarke, 2011). Thus, variation in growth, biomass allocation, andallometry of resprouts with time after fire, and among species, has important consequencesfor recovery of ecosystem structure and biomass after fire.
Plant allometry theory predicts how stem height and diameter scale in relation to eachother and in relation to stem biomass (Niklas, 1994; West et al., 1999; Niklas and Enquist,2001). For example the elastic self-similarity model predicts that stem length scales as the 2/3 power of diameter and the geometric self-similarity model, which assumes stems areconstructed to resist wind forces with minimal investment in biomass, predicts that stemlength is proportional to diameter (Niklas, 1994; Niklas, 1995). Large trees exhibit elastic or
1 Corresponding author present address: Department of Biology, 500 College Hill, William JewellCollege, Liberty, MO 64068; phone: 816-415-7616; e-mail: [email protected]
Am. Midl. Nat. (2014) 172:266–284
266
stress self-similarity (McMahon and Kronauer, 1976; Niklas, 1994; Niklas, 1995), whilegeometric self-similarity has been documented in young trees (King, 1990; Alvarez-Buyllaand Martinez-Ramos, 1992; Niklas, 1995) and shrubs (Whittaker and Woodwell, 1968).Scaling relationships, however, can vary across species and with plant size (Niklas and Spatz,2004). Allometry research has focused on seed plants (e.g., West et al., 1999; Niklas andEnquist, 2002b), with the implied assumption that stems have grown from a seed. It is notknown whether stems of fire-adapted resprouters conform to predicted scaling relationshipsor if there are different constraints on the growth of resprouted stems that allow for rapidgrowth after fire.
Many plants build one main stem during their lifetime, but shrub stems consumed by fireare rebuilt multiple times in part from belowground resources. Root biomass comprisesapproximately 25% of total plant biomass in angiosperm species in general (Niklas andEnquist, 2002a), while belowground biomass may comprise over 80% of total biomass ofresprouting shrubs (Saha et al., 2010). Belowground reserves (McPherson and Williams,1998; Paula and Ojeda, 2009) affect resprouting ability (Moreno and Oechel, 1991) andbiomass of resprouts (Lloret and Lopez-Soria, 1993; Cruz et al., 2002), and new stems areusually recruited in clumps (e.g., Silva et al., 2009) around dead stems. Initial stem growth islikely dominated by primary growth because vigorous resprouting after fire is important forre-acquisition of space and continued survival. Higher rates of photosynthesis in resproutsthan unburned stems (Fleck et al., 1998; Clemente et al., 2005) may be related to higherallocation to leaf biomass or young green stems. Allometric relationships of recentlyresprouted shrub stems may depend on resprouting ability and the capacity to reach anaboveground equilibrium that existed prefire, more so than on scaling rules applicable toother woody species.
As stems grow taller, they must increase their mechanical strength by increasing trunkdiameter by means of secondary growth (King, 1986) and therefore should have a greaterproportion of biomass in stems versus leaves (Givnish, 1982). The fraction of whole plantbiomass allocated to leaves is negatively correlated with light availability (Poorter et al.,2012), which should also contribute to a greater proportion of biomass of taller shoots beingallocated to stems. Furthermore, the number of resprouted stems per clump is higher inmore recently burned sites (Davies and Myerscough, 1991) and differential growth of andresource allocation to aboveground plant parts is affected by competition (Weiner andThomas, 1992; Kozovits et al., 2005). Because scaling of stem diameter and height is sizedependent (Niklas, 1995), increasing stem size and a changing environment with time afterfire may lead to changes in allometric relationships and biomass allocation. Variation inbiomass scaling in relation to height and diameter with time after fire has implications forthe effectiveness of allometric equations in estimating recovery of biomass (Toma et al.,2005) and carbon storage (Williams et al., 2008) after fire.
We examined growth, biomass allocation, and allometric relationships of shrub speciesafter fire in scrubby flatwoods ecosystems of central peninsular Florida. Scrubby flatwoodsare a type of Florida scrub where the dominant species are shrubs that resprout after fire(Abrahamson et al., 1984; Menges and Kohfeldt, 1995). Resprouts of dominant scrubbyflatwoods species recruit in clumps, and we predicted that the growth ratios and the biomassallocation of these species would change with time after fire, as the stems grow taller andthe strength of intra-individual and inter-specific competition decreases. Specifically, wehypothesized that height growth per unit diameter growth would decrease with time afterfire as stem crowding decreases and stem age increases (Henry and Aarssen, 1999). Inaddition we assessed whether height, diameter, and biomass of shrub resprouts scale in
2014 SCHAFER & MACK: RESPROUT GROWTH, BIOMASS, AND ALLOMETRY 267
relation to each other as predicted by allometric theory. Understanding the scaling ofgrowth and biomass allocation of resprouts is important considering the dominance ofresprouting species in pyrogenic ecosystems and, therefore, their contribution to themaintenance of biomass and ecosystem structure after fire.
METHODS
We conducted our study at the Archbold Biological Station (ABS), located near thesouthern tip of the Lake Wales Ridge in Highlands County, Florida, U.S.A. (27u109500N,81u21900W). Mean annual precipitation is 136.5 cm (ABS weather records, 1932–2004), andmean annual temperature is 22.3 C (ABS weather records, 1952–2004), typically with warmwet summers and cool dry winters (Abrahamson et al., 1984). The Station’s 2101 ha preservecomprises a mosaic of plant communities and is divided into burn units that have beenmanaged with prescribed fires for . 35 y.
Our research focused on scrub oak (Quercus inopina Ashe) dominated scrubby flatwoods,a type of Florida scrub (Abrahamson et al., 1984), which occurs on sandy soils that have nohorizon development, little organic matter, and low ion exchange capacity (Brown et al.,1990). Scrubby flatwoods experience fire return intervals of 8 to 16 y (Menges, 2007), andthe dominant species resprout after fire. Shrub height varies with resource availability andtime after fire but averages 1 to 2 m (Abrahamson et al., 1984). In other types of Floridascrub, shrub heights can reach 4 to 6 m where fire has been suppressed (Schmalzer et al.,2003).
We selected the most abundant scrubby flatwoods shrub species (Abrahamson et al.,1984): the ericaceous shrubs Lyonia fruticosa (Michx.) G.S. Torr. and Lyonia lucida (Lam.) K.Koch and the oaks Quercus chapmanii Sarg., Quercus geminata Small, and Quercus inopina Ashe(nomenclature follows that of Wunderlin and Hansen, 2003). All species are clonal, multi-stemmed, and resprout after fire (Menges and Kohfeldt, 1995). In our study sites, L.fruticosa, L. lucida, Q. chapmanii, and Q. geminata each make up approximately 5% of the totalshrub cover, while Q. inopina makes up approximately 50% of the total shrub cover; thepalmettos Serenoa repens and Sabal etonia make up approximately 25% and 5% of the totalshrub cover, respectively (Schafer, 2010). During the summer of 2007, we measured andharvested aboveground stems of L. fruticosa, L. lucida, Q. chapmanii, Q. geminata, and Q.inopina from three sites of each of three times after fire: 6 w, 8 y, and 20 y. During thesummer of 2008, we measured and harvested aboveground stems of each species from thesame nine sites, which were then 1, 9, and 21 y after fire. We randomly selected clumps ofstems of each species (n 5 6 to 25 clumps per species per time after fire) and measured thebasal diameter (to the nearest 0.01 mm) within 1 cm of ground level using digital calipersand height (to the nearest cm) of each stem, harvested each stem, and separated stems intoleaves and stems. Stems within a clump were likely part of the same clone. All samples weredried at 60 C for a minimum of 48 h and then weighed (to the nearest 0.01 g if . 0.01 g andto the nearest 0.0001 if , 0.01 g). The number of stems harvested varied among years andtime after fire, but overall totals were 119, 164, 144, 146, and 327 stems for L. fruticosa, L.lucida, Q. chapmanii, Q. geminata, and Q. inopina, respectively.
Stems from sites 8 and 9 y after fire were combined for data analysis (hereafter referred toas 8 y after fire), as were stems from sites 20 and 21 y after fire (hereafter referred to as 20 yafter fire). To determine if the relationships between stem height and diameter and biomassvaried with time after fire, and by species, we used standardized major axis (SMA) regressionto fit slopes as is recommended for assessing allometric scaling (Warton et al., 2006). Wetested for homogeneity of slopes of diameter vs. height, height vs. shoot biomass, diameter
268 THE AMERICAN MIDLAND NATURALIST 172(2)
vs. shoot biomass, and stem biomass vs. leaf biomass with time after fire for each species usingthe SMATR stats package (http://bio.mq.edu.au/ecology/SMATR/). All variables were log10
transformed. The significance of the test for homogeneity of SMA slopes was determined bycomparison to a chi-squared distribution. We also tested for homogeneity of slopes ofdiameter vs. height and stem biomass vs. leaf biomass among species for each time after fire.
We tested SMA slopes to determine if they were equal to the scaling exponents (i.e.,slopes) most commonly documented and predicted by allometric theory. Stem length (i.e.,height) is predicted to scale as the 2/3 power of diameter or in proportion to diameteraccording to the elastic and geometric self-similarity models, respectively (Niklas, 1994,1995). Shoot biomass is predicted to scale as the 4th power of height and the 8/3 power ofdiameter (Niklas, 1994; West et al., 1999; Niklas and Enquist, 2001), consistent with theelastic self-similarity model. Leaf biomass is predicted to scale as the 3/4 power of stembiomass (Niklas and Enquist, 2001; Niklas and Enquist, 2002a). However, Niklas and Spatz(2004) showed that the slopes predicted by allometric theory do not hold for small stems(e.g., basal diameter , 0.03 m, height , 0.3 m); height and shoot biomass increase withdiameter more rapidly in small stems than in large stems.
Testing for differences in elevation (i.e., y-intercepts) among SMA regression lines is onlypossible when there is a common slope (Warton et al., 2006). Slopes differed significantly inthe majority of cases (see Results). Therefore, we assessed differences in the ratios of heightto diameter and leaf biomass to stem biomass, among time periods after fire for each speciesand among species for each time after fire, because these ratios are indicative of allocationto sequestration of space and photosynthetic tissue, respectively. Kruskal-Wallis tests wereused to analyze differences in height:diameter and leaf:stem biomass ratios of shrub speciesbecause these variables could not be transformed to fit normality (SPSS 11.5 for Windows,SPSS, Inc. Chicago, Illinois, U.S.A.).
We also counted the number of stems per individual (i.e., stem density) – defined as allstems growing in a clump within 12 cm of the central stem; we sampled 119, 174, 139, 272,and 355 individuals of L. fruticosa, L. lucida, Q. chapmanii, Q. geminata, and Q. inopina,respectively. Stem density was assessed at nine sites (three of each time after fire), and thenumber of individuals of each species varied among times after fire. Kruskal-Wallis tests wereused to analyze differences in the number of stems per individual of shrub species (SPSS11.5 for Windows, SPSS, Inc. Chicago, Illinois, U.S.A.).
RESULTS
Height, basal diameter, and biomass per stem of each species increased from 6 w to 1 yafter fire and from 1 y to 8 y after fire but remained similar from 8 to 20 y after fire(Table 1). The slope of the relationship between stem height and basal diameter changedwith time after fire for all species (Fig. 1). Slopes tended to be steepest at 6 w and 1 y afterfire. The slope of the relationship between stem height and basal diameter differed amongspecies 6 w (P 5 0.007) and 1 y (P 5 0.021) after fire but not 8 y (P 5 0.172) or 20 y (P 50.061) after fire. Across all species and times after fire, height scaled as the 0.8 to 2.7 powerof diameter (see slopes in Table 2). This is significantly higher than the predicted 2/3 power,but height tended to scale proportionally to diameter in older sites. Only Q. inopina hadsignificantly steeper slopes at all times after fire than predicted by self-similarity models.
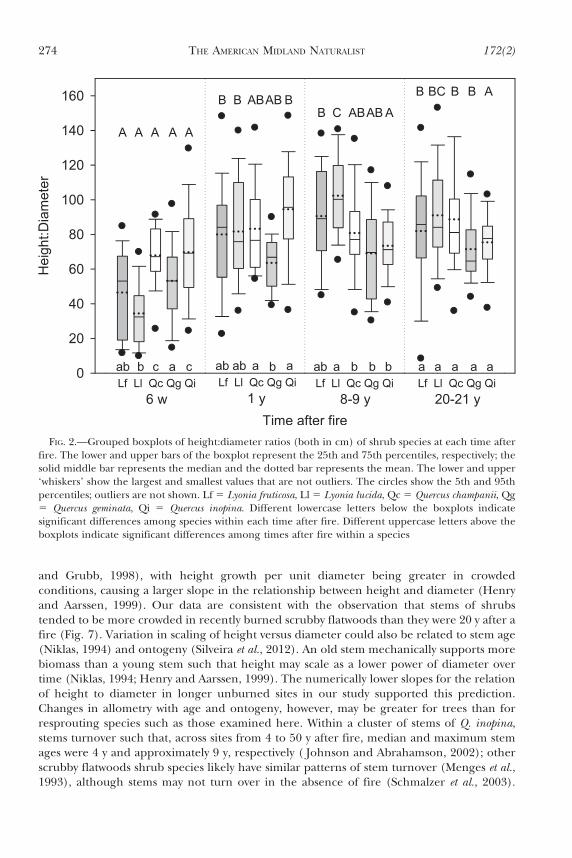
Height:diameter ratios were affected significantly by species and time after fire (Table 3).For all species, height:diameter ratios were lowest 6 w after fire (Fig. 2). Quercus chapmaniiand Q. inopina had the highest height:diameter ratios 6 w after fire, whereas L. lucida hadgreater height:diameter ratios than Quercus species 8 y after fire.
2014 SCHAFER & MACK: RESPROUT GROWTH, BIOMASS, AND ALLOMETRY 269
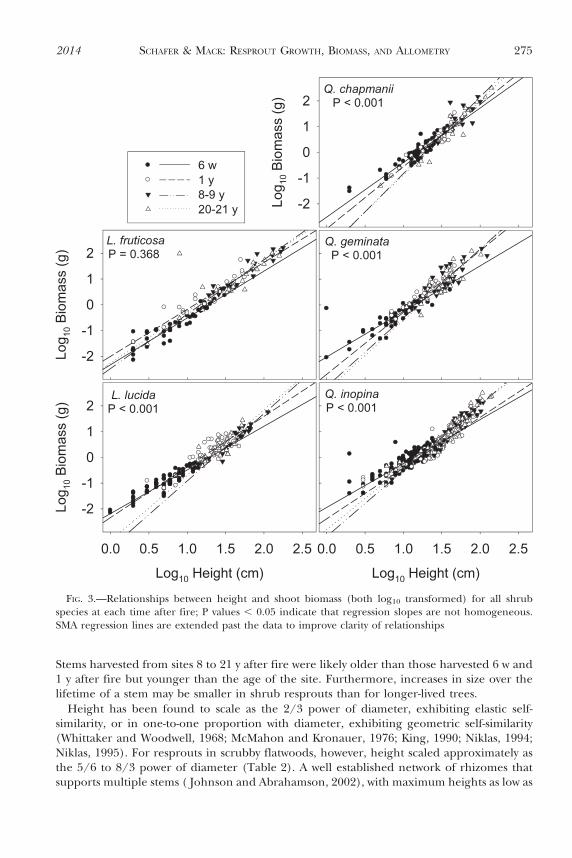
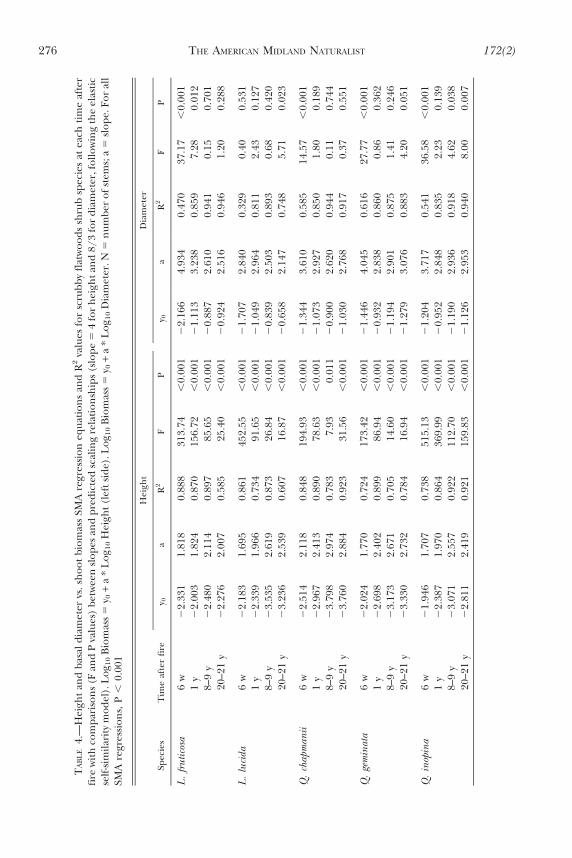
The slope of the relationship between height and shoot biomass differed with time afterfire for all species with the exception of L. fruticosa (Fig. 3). Slopes tended to be steeper insites 8 and 20 y after fire than in more recently burned sites (Table 4). For L. fruticosa,biomass per unit height was lower at 6 w than for other times after fire (Wald statistic 5130.81, P , 0.001). Across all species and times after fire, shoot biomass scaled to the 1.7 to3.0 power of height, significantly lower than the 4th power predicted by allometric theory(Table 4).
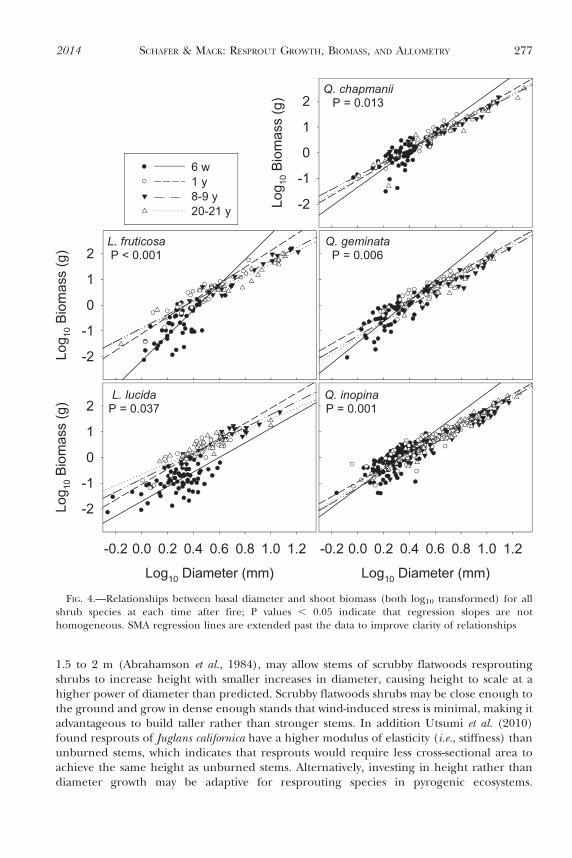
The slope of the relationship between basal diameter and shoot biomass changed withtime after fire for all species (Fig. 4). Slopes were steepest 6 w after fire. Across all speciesand times after fire, shoot biomass scaled as the 2.1 to 4.9 power of diameter; approximatelyhalf of the slopes were similar to the 8/3 power predicted by allometric theory (Table 4).
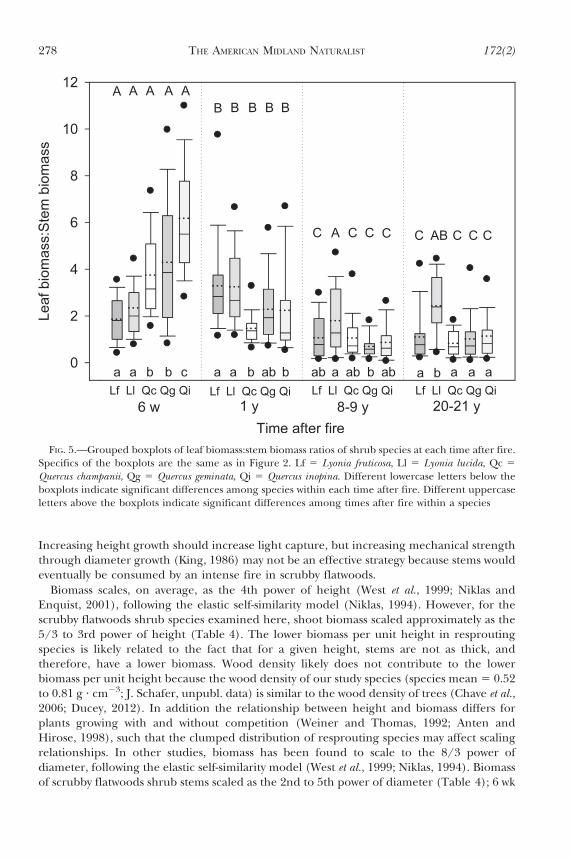
Leaf:stem biomass ratios of Quercus species decreased with time after fire, while leaf:stembiomass ratios of Lyonia species were more variable (Fig. 5). For each time after fire, therewere significant differences among species in leaf:stem biomass ratios (Table 3). Quercusinopina had a higher leaf:stem biomass ratio than all other species 6 w after fire, Lyoniaspecies tended to have greater leaf:stem biomass ratios than Quercus species 1 y after fire,and L. lucida had the highest leaf:stem biomass ratios 20 y after fire (Fig. 5).
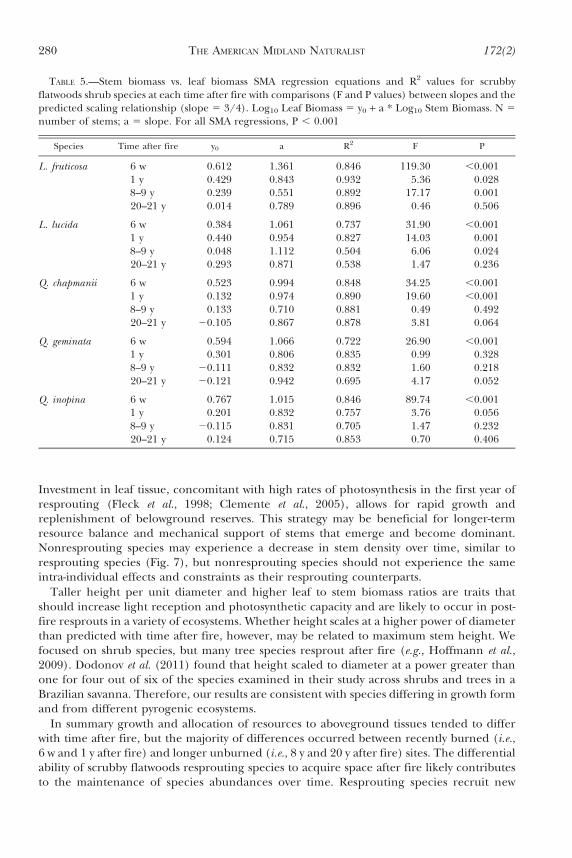
The slope of the relationship between stem biomass and leaf biomass differed with timeafter fire for all species with the exception of L. lucida (Fig. 6). Slopes were steepest 6 w afterfire (Table 5). The slope of the relationship between stem and leaf biomass differed amongspecies 6 w (P , 0.001) and 8 y (P , 0.001) after fire but not 1 y (P 5 0.116) or 20 y (P 5
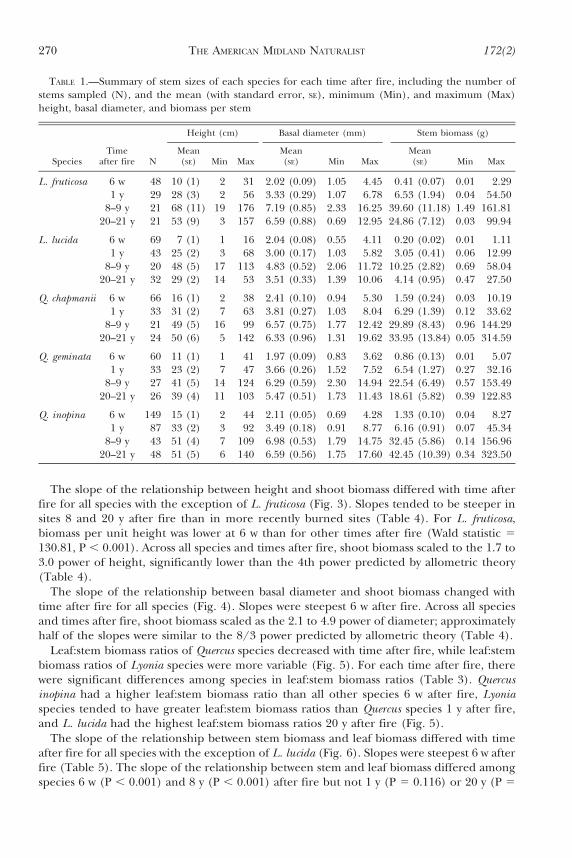
TABLE 1.—Summary of stem sizes of each species for each time after fire, including the number ofstems sampled (N), and the mean (with standard error, SE), minimum (Min), and maximum (Max)height, basal diameter, and biomass per stem
Height (cm) Basal diameter (mm) Stem biomass (g)
SpeciesTime
after fire NMean(SE) Min Max
Mean(SE) Min Max
Mean(SE) Min Max
L. fruticosa 6 w 48 10 (1) 2 31 2.02 (0.09) 1.05 4.45 0.41 (0.07) 0.01 2.291 y 29 28 (3) 2 56 3.33 (0.29) 1.07 6.78 6.53 (1.94) 0.04 54.50
8–9 y 21 68 (11) 19 176 7.19 (0.85) 2.33 16.25 39.60 (11.18) 1.49 161.8120–21 y 21 53 (9) 3 157 6.59 (0.88) 0.69 12.95 24.86 (7.12) 0.03 99.94
L. lucida 6 w 69 7 (1) 1 16 2.04 (0.08) 0.55 4.11 0.20 (0.02) 0.01 1.111 y 43 25 (2) 3 68 3.00 (0.17) 1.03 5.82 3.05 (0.41) 0.06 12.99
8–9 y 20 48 (5) 17 113 4.83 (0.52) 2.06 11.72 10.25 (2.82) 0.69 58.0420–21 y 32 29 (2) 14 53 3.51 (0.33) 1.39 10.06 4.14 (0.95) 0.47 27.50
Q. chapmanii 6 w 66 16 (1) 2 38 2.41 (0.10) 0.94 5.30 1.59 (0.24) 0.03 10.191 y 33 31 (2) 7 63 3.81 (0.27) 1.03 8.04 6.29 (1.39) 0.12 33.62
8–9 y 21 49 (5) 16 99 6.57 (0.75) 1.77 12.42 29.89 (8.43) 0.96 144.2920–21 y 24 50 (6) 5 142 6.33 (0.96) 1.31 19.62 33.95 (13.84) 0.05 314.59
Q. geminata 6 w 60 11 (1) 1 41 1.97 (0.09) 0.83 3.62 0.86 (0.13) 0.01 5.071 y 33 23 (2) 7 47 3.66 (0.26) 1.52 7.52 6.54 (1.27) 0.27 32.16
8–9 y 27 41 (5) 14 124 6.29 (0.59) 2.30 14.94 22.54 (6.49) 0.57 153.4920–21 y 26 39 (4) 11 103 5.47 (0.51) 1.73 11.43 18.61 (5.82) 0.39 122.83
Q. inopina 6 w 149 15 (1) 2 44 2.11 (0.05) 0.69 4.28 1.33 (0.10) 0.04 8.271 y 87 33 (2) 3 92 3.49 (0.18) 0.91 8.77 6.16 (0.91) 0.07 45.34
8–9 y 43 51 (4) 7 109 6.98 (0.53) 1.79 14.75 32.45 (5.86) 0.14 156.9620–21 y 48 51 (5) 6 140 6.59 (0.56) 1.75 17.60 42.45 (10.39) 0.34 323.50
270 THE AMERICAN MIDLAND NATURALIST 172(2)

0.120) after fire. Across all species and times after fire, leaf biomass scaled to the 0.5 to 1.3power of stem biomass. Six weeks after fire, slopes were significantly higher than the 3/4power predicted by allometric theory (Table 5).
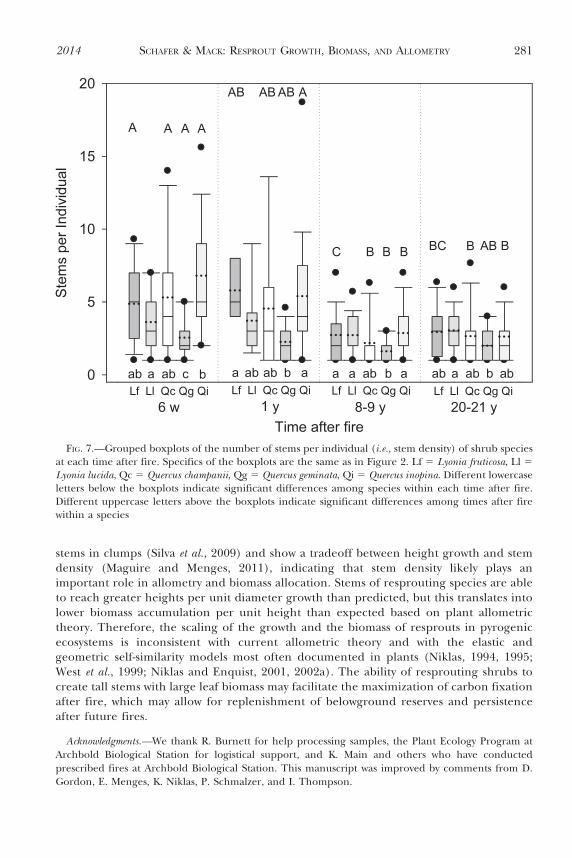
The stem density of Quercus species declined with time after fire (Fig. 7). Stem density ofL. fruticosa individuals was generally higher 6 w and 1 y after fire, but L. lucida stem densitydid not change with time after fire (Table 3). Quercus inopina had the highest number ofresprouts per individual (median 5 5 stems), whereas Q. geminata had the lowest number ofresprouts per individual (median 5 2 stems; Fig. 7). Eight and 20 y after fire, there wereminimal differences in stem densities among species.
FIG. 1.—Relationship between height and diameter (both log10 transformed) for all shrub species ateach time after fire; P values , 0.05 indicate that regression slopes are not homogeneous. SMAregression lines are extended past the data to improve clarity of relationships
2014 SCHAFER & MACK: RESPROUT GROWTH, BIOMASS, AND ALLOMETRY 271
DISCUSSION
Stem size and biomass and height:diameter ratios increased from 6 w to 8 y after fire forall scrubby flatwoods shrub species, whereas the effects of time after fire on leaf:stembiomass ratios depended on the individual species. The relationships between height andbasal diameter, height and shoot biomass, and basal diameter and shoot biomass wereaffected by time after fire, indicating that constraints on resprout growth and biomasschange over time. Differences among species in height:diameter and leaf:stem biomassratios were most pronounced 6 w after fire, when Q. inopina had the highest height:diameterand leaf:stem biomass ratios; by 20 y after fire, there was little difference among species insize and biomass ratios.
Six weeks after fire, oak (Quercus species) resprouts tended to be taller, larger in diameter,and have greater biomass than resprouts of the ericaceous shrub Lyonia spp. (Table 1). Ingeneral below ground starch and nonstructural carbohydrate reserves (McPherson andWilliams, 1998; Olano et al., 2006; Paula and Ojeda, 2009), prefire plant size (Bonfil et al.,2004; Konstantinidis et al., 2006), and the number of active meristems (Bret-Harte et al.,2001) are likely to be the more important factors in contributing to differences in the sizeand biomass of resprouts among species. Rhizome resprouting potential may be similar forQ. chapmanii and Q. geminata (Cavender-Bares et al., 2004), but oak species have greater
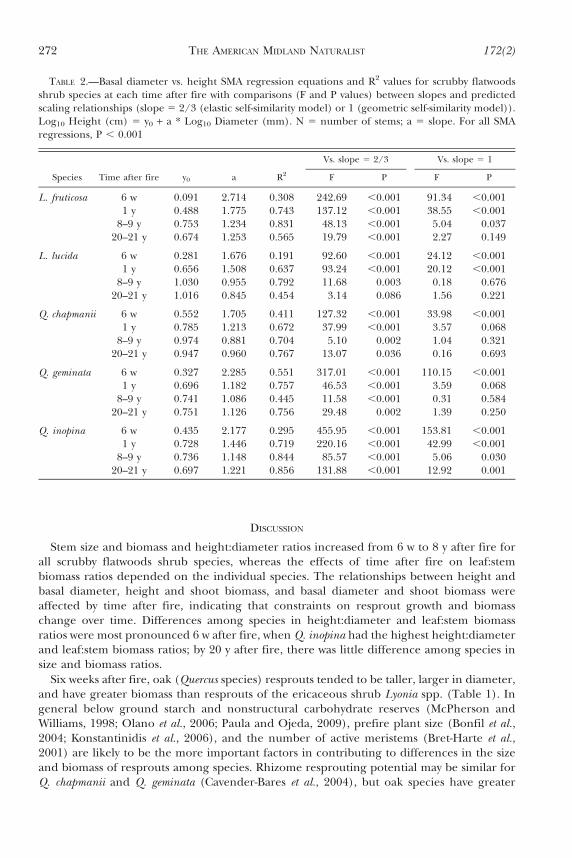
TABLE 2.—Basal diameter vs. height SMA regression equations and R2 values for scrubby flatwoodsshrub species at each time after fire with comparisons (F and P values) between slopes and predictedscaling relationships (slope 5 2/3 (elastic self-similarity model) or 1 (geometric self-similarity model)).Log10 Height (cm) 5 y0 + a * Log10 Diameter (mm). N 5 number of stems; a 5 slope. For all SMAregressions, P , 0.001
Vs. slope 5 2/3 Vs. slope 5 1
Species Time after fire y0 a R2 F P F P
L. fruticosa 6 w 0.091 2.714 0.308 242.69 ,0.001 91.34 ,0.0011 y 0.488 1.775 0.743 137.12 ,0.001 38.55 ,0.001
8–9 y 0.753 1.234 0.831 48.13 ,0.001 5.04 0.03720–21 y 0.674 1.253 0.565 19.79 ,0.001 2.27 0.149
L. lucida 6 w 0.281 1.676 0.191 92.60 ,0.001 24.12 ,0.0011 y 0.656 1.508 0.637 93.24 ,0.001 20.12 ,0.001
8–9 y 1.030 0.955 0.792 11.68 0.003 0.18 0.67620–21 y 1.016 0.845 0.454 3.14 0.086 1.56 0.221
Q. chapmanii 6 w 0.552 1.705 0.411 127.32 ,0.001 33.98 ,0.0011 y 0.785 1.213 0.672 37.99 ,0.001 3.57 0.068
8–9 y 0.974 0.881 0.704 5.10 0.002 1.04 0.32120–21 y 0.947 0.960 0.767 13.07 0.036 0.16 0.693
Q. geminata 6 w 0.327 2.285 0.551 317.01 ,0.001 110.15 ,0.0011 y 0.696 1.182 0.757 46.53 ,0.001 3.59 0.068
8–9 y 0.741 1.086 0.445 11.58 ,0.001 0.31 0.58420–21 y 0.751 1.126 0.756 29.48 0.002 1.39 0.250
Q. inopina 6 w 0.435 2.177 0.295 455.95 ,0.001 153.81 ,0.0011 y 0.728 1.446 0.719 220.16 ,0.001 42.99 ,0.001
8–9 y 0.736 1.148 0.844 85.57 ,0.001 5.06 0.03020–21 y 0.697 1.221 0.856 131.88 ,0.001 12.92 0.001
272 THE AMERICAN MIDLAND NATURALIST 172(2)
belowground biomass than other Florida scrub species, including Lyonia spp. (Saha et al.,2010).
For all of our study species, height growth rate after fire was negatively correlated withconspecific stem density (Maguire and Menges, 2011), indicating each species experiencessome degree of intra-specific or intra-individual competition among stems within a clump.Resprouts of Q. inopina and Q. chapmanii had the largest height:diameter ratios and thehighest stem densities, which is consistent with crowded individuals having largerheight:diameter ratios than individuals growing in the open (Holbrook and Putz, 1989).Height:diameter ratios of L. fruticosa, L. lucida, and Q. inopina increased from 6 w to 1 y afterfire, but the stem density of these species did not change. Shading (Vila, 1997) andaboveground competition (den Dubbelden and Knops, 1993; Kozovits et al., 2005) can causea decrease in leaf:stem biomass ratios, and in our study leaf:stem biomass ratios of oaksdecreased from 6 w to 1 y after fire. These results indicated that Q. inopina experienced thegreatest intra-individual competition. The concomitant increase in stem height and basaldiameter and decrease in leaf:stem biomass ratios of each species from 1 to 8 y after fire isconsistent with results from Givnish (1982), who showed that greater investment in supporttissue (i.e., stems) elevates leaves to a greater height, which can reduce leaf biomassinvestments.
Variation in aboveground allocation patterns among species may be important indetermining relative species abundance, as the use of resources to sequester spaceaboveground may be a quantitative parameter of competitiveness (Kozovits et al., 2005). Sixweeks after fire, Q. inopina, the most abundant species in the scrubby flatwoods communitiesstudied (Abrahamson et al., 1984; Schafer, 2010), had one of the highest height:diameterratios and the highest leaf:stem biomass ratio, and by 20 y after fire, Q. inopina had the highest(although not significantly higher) mean biomass per stem. The ability of Q. inopina tosequester space aboveground after fire by investing in height and leaf biomass, even thoughthis appears to cause greater intra-individual competition, may contribute to the ability of Q.inopina to maintain dominance in scrubby flatwoods communities over many fire cycles.
The slopes of the relationship between stem height and diameter tended to decrease withtime after fire (Table 2). This relationship may be dependent on light conditions (Coomes
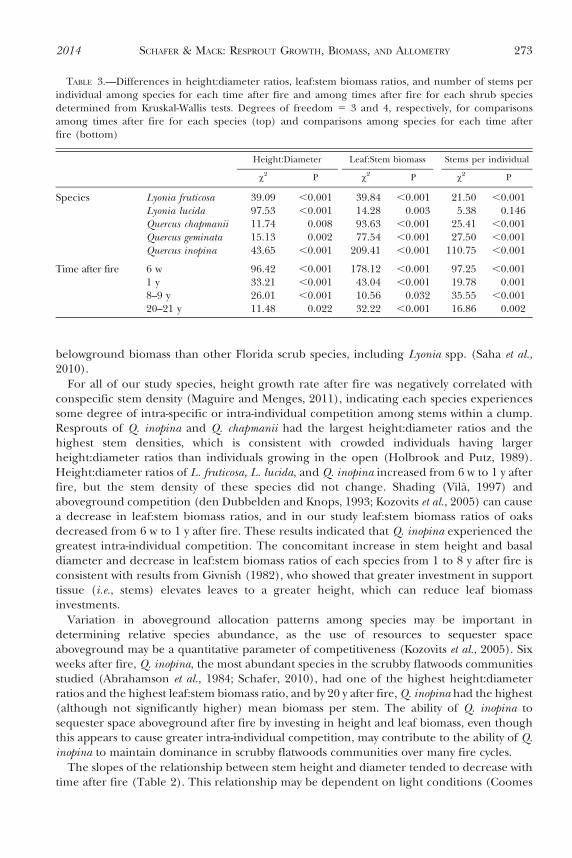
TABLE 3.—Differences in height:diameter ratios, leaf:stem biomass ratios, and number of stems perindividual among species for each time after fire and among times after fire for each shrub speciesdetermined from Kruskal-Wallis tests. Degrees of freedom 5 3 and 4, respectively, for comparisonsamong times after fire for each species (top) and comparisons among species for each time afterfire (bottom)
Height:Diameter Leaf:Stem biomass Stems per individual
x2 P x2 P x2 P
Species Lyonia fruticosa 39.09 ,0.001 39.84 ,0.001 21.50 ,0.001Lyonia lucida 97.53 ,0.001 14.28 0.003 5.38 0.146Quercus chapmanii 11.74 0.008 93.63 ,0.001 25.41 ,0.001Quercus geminata 15.13 0.002 77.54 ,0.001 27.50 ,0.001Quercus inopina 43.65 ,0.001 209.41 ,0.001 110.75 ,0.001
Time after fire 6 w 96.42 ,0.001 178.12 ,0.001 97.25 ,0.0011 y 33.21 ,0.001 43.04 ,0.001 19.78 0.0018–9 y 26.01 ,0.001 10.56 0.032 35.55 ,0.00120–21 y 11.48 0.022 32.22 ,0.001 16.86 0.002
2014 SCHAFER & MACK: RESPROUT GROWTH, BIOMASS, AND ALLOMETRY 273
and Grubb, 1998), with height growth per unit diameter being greater in crowdedconditions, causing a larger slope in the relationship between height and diameter (Henryand Aarssen, 1999). Our data are consistent with the observation that stems of shrubstended to be more crowded in recently burned scrubby flatwoods than they were 20 y after afire (Fig. 7). Variation in scaling of height versus diameter could also be related to stem age(Niklas, 1994) and ontogeny (Silveira et al., 2012). An old stem mechanically supports morebiomass than a young stem such that height may scale as a lower power of diameter overtime (Niklas, 1994; Henry and Aarssen, 1999). The numerically lower slopes for the relationof height to diameter in longer unburned sites in our study supported this prediction.Changes in allometry with age and ontogeny, however, may be greater for trees than forresprouting species such as those examined here. Within a cluster of stems of Q. inopina,stems turnover such that, across sites from 4 to 50 y after fire, median and maximum stemages were 4 y and approximately 9 y, respectively ( Johnson and Abrahamson, 2002); otherscrubby flatwoods shrub species likely have similar patterns of stem turnover (Menges et al.,1993), although stems may not turn over in the absence of fire (Schmalzer et al., 2003).
FIG. 2.—Grouped boxplots of height:diameter ratios (both in cm) of shrub species at each time afterfire. The lower and upper bars of the boxplot represent the 25th and 75th percentiles, respectively; thesolid middle bar represents the median and the dotted bar represents the mean. The lower and upper‘whiskers’ show the largest and smallest values that are not outliers. The circles show the 5th and 95thpercentiles; outliers are not shown. Lf 5 Lyonia fruticosa, Ll 5 Lyonia lucida, Qc 5 Quercus champanii, Qg5 Quercus geminata, Qi 5 Quercus inopina. Different lowercase letters below the boxplots indicatesignificant differences among species within each time after fire. Different uppercase letters above theboxplots indicate significant differences among times after fire within a species
274 THE AMERICAN MIDLAND NATURALIST 172(2)
Stems harvested from sites 8 to 21 y after fire were likely older than those harvested 6 w and1 y after fire but younger than the age of the site. Furthermore, increases in size over thelifetime of a stem may be smaller in shrub resprouts than for longer-lived trees.
Height has been found to scale as the 2/3 power of diameter, exhibiting elastic self-similarity, or in one-to-one proportion with diameter, exhibiting geometric self-similarity(Whittaker and Woodwell, 1968; McMahon and Kronauer, 1976; King, 1990; Niklas, 1994;Niklas, 1995). For resprouts in scrubby flatwoods, however, height scaled approximately asthe 5/6 to 8/3 power of diameter (Table 2). A well established network of rhizomes thatsupports multiple stems ( Johnson and Abrahamson, 2002), with maximum heights as low as
FIG. 3.—Relationships between height and shoot biomass (both log10 transformed) for all shrubspecies at each time after fire; P values , 0.05 indicate that regression slopes are not homogeneous.SMA regression lines are extended past the data to improve clarity of relationships
2014 SCHAFER & MACK: RESPROUT GROWTH, BIOMASS, AND ALLOMETRY 275
TA
BL
E4.
—H
eigh
tan
db
asal
dia
met
ervs
.sh
oo
tbi
om
ass
SMA
regr
essi
on
equ
atio
ns
and
R2
valu
esfo
rsc
rub
by
flat
wo
od
ssh
rub
spec
ies
atea
chti
me
afte
rfi
rew
ith
com
par
iso
ns
(Fan
dP
valu
es)
bet
wee
nsl
op
esan
dp
red
icte
dsc
alin
gre
lati
on
ship
s(s
lop
e5
4fo
rh
eigh
tan
d8/
3fo
rd
iam
eter
,fo
llo
win
gth
eel
asti
cse
lf-s
imil
arit
ym
od
el).
Lo
g 10
Bio
mas
s5
y 0+
a*
Lo
g 10
Hei
ght
(lef
tsi
de)
.Lo
g 10
Bio
mas
s5
y 0+
a*
Lo
g 10
Dia
met
er.N
5n
um
ber
of
stem
s;a
5sl
op
e.Fo
ral
lSM
Are
gres
sio
ns,
P,
0.00
1
Hei
ght
Dia
met
er
Spec
ies
Tim
eaf
ter
fire
y 0a
R2
FP
y 0a
R2
FP
L.
fru
tico
sa6
w2
2.33
11.
818
0.88
831
3.74
,0.
001
22.
166
4.93
40.
470
37.1
7,
0.00
11
y2
2.00
31.
824
0.87
015
6.72
,0.
001
21.
113
3.23
80.
859
7.28
0.01
28–
9y
22.
480
2.11
40.
897
85.6
5,
0.00
12
0.88
72.
610
0.94
10.
150.
701
20–2
1y
22.
276
2.00
70.
585
25.4
0,
0.00
12
0.92
42.
516
0.94
61.
200.
288
L.
luci
da6
w2
2.18
31.
695
0.86
145
2.55
,0.
001
21.
707
2.84
00.
329
0.40
0.53
11
y2
2.33
91.
966
0.73
491
.65
,0.
001
21.
049
2.96
40.
811
2.43
0.12
78–
9y
23.
535
2.61
90.
873
26.8
4,
0.00
12
0.83
92.
503
0.89
30.
680.
420
20–2
1y
23.
236
2.53
90.
607
16.8
7,
0.00
12
0.65
82.
147
0.74
85.
710.
023
Q.
chap
man
ii6
w2
2.51
42.
118
0.84
819
4.93
,0.
001
21.
344
3.61
00.
585
14.5
7,
0.00
11
y2
2.96
72.
413
0.89
078
.63
,0.
001
21.
073
2.92
70.
850
1.80
0.18
98–
9y
23.
798
2.97
40.
783
7.93
0.01
12
0.90
02.
620
0.94
40.
110.
744
20–2
1y
23.
760
2.88
40.
923
31.5
6,
0.00
12
1.03
02.
768
0.91
70.
370.
551
Q.
gem
inat
a6
w2
2.02
41.
770
0.72
417
3.42
,0.
001
21.
446
4.04
50.
616
27.7
7,
0.00
11
y2
2.69
82.
402
0.89
986
.94
,0.
001
20.
932
2.83
80.
860
0.86
0.36
28–
9y
23.
173
2.67
10.
705
14.6
0,
0.00
12
1.19
42.
901
0.87
51.
410.
246
20–2
1y
23.
330
2.73
20.
784
16.9
4,
0.00
12
1.27
93.
076
0.88
34.
200.
051
Q.
inop
ina
6w
21.
946
1.70
70.
738
515.
13,
0.00
12
1.20
43.
717
0.54
136
.58
,0.
001
1y
22.
387
1.97
00.
864
369.
99,
0.00
12
0.95
22.
848
0.83
52.
230.
139
8–9
y2
3.07
12.
557
0.92
211
2.70
,0.
001
21.
190
2.93
60.
918
4.62
0.03
820
–21
y2
2.81
12.
419
0.92
115
9.83
,0.
001
21.
126
2.95
30.
940
8.00
0.00
7
276 THE AMERICAN MIDLAND NATURALIST 172(2)
1.5 to 2 m (Abrahamson et al., 1984), may allow stems of scrubby flatwoods resproutingshrubs to increase height with smaller increases in diameter, causing height to scale at ahigher power of diameter than predicted. Scrubby flatwoods shrubs may be close enough tothe ground and grow in dense enough stands that wind-induced stress is minimal, making itadvantageous to build taller rather than stronger stems. In addition Utsumi et al. (2010)found resprouts of Juglans californica have a higher modulus of elasticity (i.e., stiffness) thanunburned stems, which indicates that resprouts would require less cross-sectional area toachieve the same height as unburned stems. Alternatively, investing in height rather thandiameter growth may be adaptive for resprouting species in pyrogenic ecosystems.
FIG. 4.—Relationships between basal diameter and shoot biomass (both log10 transformed) for allshrub species at each time after fire; P values , 0.05 indicate that regression slopes are nothomogeneous. SMA regression lines are extended past the data to improve clarity of relationships
2014 SCHAFER & MACK: RESPROUT GROWTH, BIOMASS, AND ALLOMETRY 277
Increasing height growth should increase light capture, but increasing mechanical strengththrough diameter growth (King, 1986) may not be an effective strategy because stems wouldeventually be consumed by an intense fire in scrubby flatwoods.
Biomass scales, on average, as the 4th power of height (West et al., 1999; Niklas andEnquist, 2001), following the elastic self-similarity model (Niklas, 1994). However, for thescrubby flatwoods shrub species examined here, shoot biomass scaled approximately as the5/3 to 3rd power of height (Table 4). The lower biomass per unit height in resproutingspecies is likely related to the fact that for a given height, stems are not as thick, andtherefore, have a lower biomass. Wood density likely does not contribute to the lowerbiomass per unit height because the wood density of our study species (species mean 5 0.52to 0.81 g ? cm23; J. Schafer, unpubl. data) is similar to the wood density of trees (Chave et al.,2006; Ducey, 2012). In addition the relationship between height and biomass differs forplants growing with and without competition (Weiner and Thomas, 1992; Anten andHirose, 1998), such that the clumped distribution of resprouting species may affect scalingrelationships. In other studies, biomass has been found to scale to the 8/3 power ofdiameter, following the elastic self-similarity model (West et al., 1999; Niklas, 1994). Biomassof scrubby flatwoods shrub stems scaled as the 2nd to 5th power of diameter (Table 4); 6 wk
FIG. 5.—Grouped boxplots of leaf biomass:stem biomass ratios of shrub species at each time after fire.Specifics of the boxplots are the same as in Figure 2. Lf 5 Lyonia fruticosa, Ll 5 Lyonia lucida, Qc 5Quercus champanii, Qg 5 Quercus geminata, Qi 5 Quercus inopina. Different lowercase letters below theboxplots indicate significant differences among species within each time after fire. Different uppercaseletters above the boxplots indicate significant differences among times after fire within a species
278 THE AMERICAN MIDLAND NATURALIST 172(2)
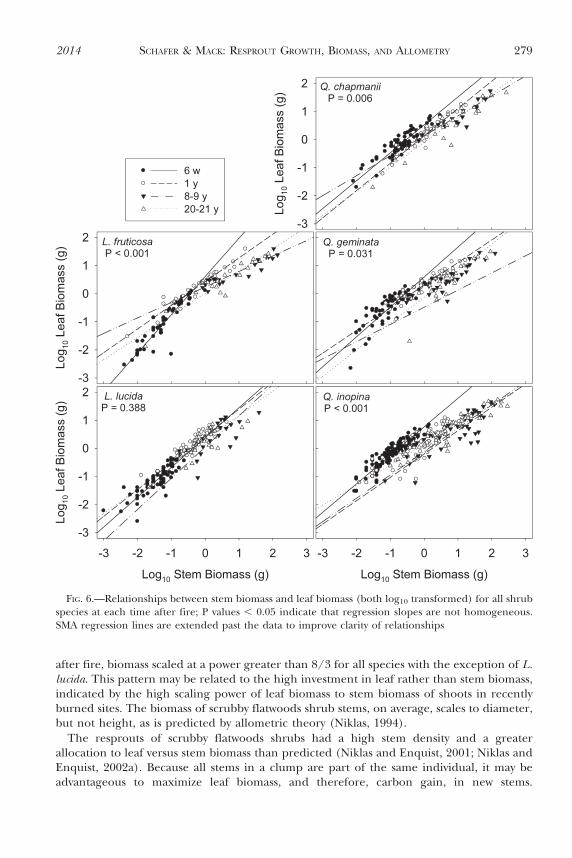
after fire, biomass scaled at a power greater than 8/3 for all species with the exception of L.lucida. This pattern may be related to the high investment in leaf rather than stem biomass,indicated by the high scaling power of leaf biomass to stem biomass of shoots in recentlyburned sites. The biomass of scrubby flatwoods shrub stems, on average, scales to diameter,but not height, as is predicted by allometric theory (Niklas, 1994).
The resprouts of scrubby flatwoods shrubs had a high stem density and a greaterallocation to leaf versus stem biomass than predicted (Niklas and Enquist, 2001; Niklas andEnquist, 2002a). Because all stems in a clump are part of the same individual, it may beadvantageous to maximize leaf biomass, and therefore, carbon gain, in new stems.
FIG. 6.—Relationships between stem biomass and leaf biomass (both log10 transformed) for all shrubspecies at each time after fire; P values , 0.05 indicate that regression slopes are not homogeneous.SMA regression lines are extended past the data to improve clarity of relationships
2014 SCHAFER & MACK: RESPROUT GROWTH, BIOMASS, AND ALLOMETRY 279
Investment in leaf tissue, concomitant with high rates of photosynthesis in the first year ofresprouting (Fleck et al., 1998; Clemente et al., 2005), allows for rapid growth andreplenishment of belowground reserves. This strategy may be beneficial for longer-termresource balance and mechanical support of stems that emerge and become dominant.Nonresprouting species may experience a decrease in stem density over time, similar toresprouting species (Fig. 7), but nonresprouting species should not experience the sameintra-individual effects and constraints as their resprouting counterparts.
Taller height per unit diameter and higher leaf to stem biomass ratios are traits thatshould increase light reception and photosynthetic capacity and are likely to occur in post-fire resprouts in a variety of ecosystems. Whether height scales at a higher power of diameterthan predicted with time after fire, however, may be related to maximum stem height. Wefocused on shrub species, but many tree species resprout after fire (e.g., Hoffmann et al.,2009). Dodonov et al. (2011) found that height scaled to diameter at a power greater thanone for four out of six of the species examined in their study across shrubs and trees in aBrazilian savanna. Therefore, our results are consistent with species differing in growth formand from different pyrogenic ecosystems.
In summary growth and allocation of resources to aboveground tissues tended to differwith time after fire, but the majority of differences occurred between recently burned (i.e.,6 w and 1 y after fire) and longer unburned (i.e., 8 y and 20 y after fire) sites. The differentialability of scrubby flatwoods resprouting species to acquire space after fire likely contributesto the maintenance of species abundances over time. Resprouting species recruit new
TABLE 5.—Stem biomass vs. leaf biomass SMA regression equations and R2 values for scrubbyflatwoods shrub species at each time after fire with comparisons (F and P values) between slopes and thepredicted scaling relationship (slope 5 3/4). Log10 Leaf Biomass 5 y0 + a * Log10 Stem Biomass. N 5number of stems; a 5 slope. For all SMA regressions, P , 0.001
Species Time after fire y0 a R2 F P
L. fruticosa 6 w 0.612 1.361 0.846 119.30 ,0.0011 y 0.429 0.843 0.932 5.36 0.0288–9 y 0.239 0.551 0.892 17.17 0.00120–21 y 0.014 0.789 0.896 0.46 0.506
L. lucida 6 w 0.384 1.061 0.737 31.90 ,0.0011 y 0.440 0.954 0.827 14.03 0.0018–9 y 0.048 1.112 0.504 6.06 0.02420–21 y 0.293 0.871 0.538 1.47 0.236
Q. chapmanii 6 w 0.523 0.994 0.848 34.25 ,0.0011 y 0.132 0.974 0.890 19.60 ,0.0018–9 y 0.133 0.710 0.881 0.49 0.49220–21 y 20.105 0.867 0.878 3.81 0.064
Q. geminata 6 w 0.594 1.066 0.722 26.90 ,0.0011 y 0.301 0.806 0.835 0.99 0.3288–9 y 20.111 0.832 0.832 1.60 0.21820–21 y 20.121 0.942 0.695 4.17 0.052
Q. inopina 6 w 0.767 1.015 0.846 89.74 ,0.0011 y 0.201 0.832 0.757 3.76 0.0568–9 y 20.115 0.831 0.705 1.47 0.23220–21 y 0.124 0.715 0.853 0.70 0.406
280 THE AMERICAN MIDLAND NATURALIST 172(2)
stems in clumps (Silva et al., 2009) and show a tradeoff between height growth and stemdensity (Maguire and Menges, 2011), indicating that stem density likely plays animportant role in allometry and biomass allocation. Stems of resprouting species are ableto reach greater heights per unit diameter growth than predicted, but this translates intolower biomass accumulation per unit height than expected based on plant allometrictheory. Therefore, the scaling of the growth and the biomass of resprouts in pyrogenicecosystems is inconsistent with current allometric theory and with the elastic andgeometric self-similarity models most often documented in plants (Niklas, 1994, 1995;West et al., 1999; Niklas and Enquist, 2001, 2002a). The ability of resprouting shrubs tocreate tall stems with large leaf biomass may facilitate the maximization of carbon fixationafter fire, which may allow for replenishment of belowground reserves and persistenceafter future fires.
Acknowledgments.—We thank R. Burnett for help processing samples, the Plant Ecology Program atArchbold Biological Station for logistical support, and K. Main and others who have conductedprescribed fires at Archbold Biological Station. This manuscript was improved by comments from D.Gordon, E. Menges, K. Niklas, P. Schmalzer, and I. Thompson.
FIG. 7.—Grouped boxplots of the number of stems per individual (i.e., stem density) of shrub speciesat each time after fire. Specifics of the boxplots are the same as in Figure 2. Lf 5 Lyonia fruticosa, Ll 5Lyonia lucida, Qc 5 Quercus champanii, Qg 5 Quercus geminata, Qi 5 Quercus inopina. Different lowercaseletters below the boxplots indicate significant differences among species within each time after fire.Different uppercase letters above the boxplots indicate significant differences among times after firewithin a species
2014 SCHAFER & MACK: RESPROUT GROWTH, BIOMASS, AND ALLOMETRY 281
LITERATURE CITED
ABRAHAMSON, W. G., A. F. JOHNSON, J. N. LAYNE, AND P. A. PERONI. 1984. Vegetation of the ArchboldBiological Station, Florida: an example of the southern Lake Wales Ridge. Fla. Sci., 47:209–250.
ALVAREZ-BUYLLA, E. R. AND M. MARTINEZ-RAMOS. 1992. Demography and allometry of Cecropia obtusifolia, aneotropical pioneer tree – an evaluation of the climax-pioneer paradigm for tropical rainforests. J. Ecol., 80:275–290.
ANTEN, N. P. R. AND T. HIROSE. 1998. Biomass allocation and light partitioning among dominant andsubordinate individuals in Xanthium canadense stands. Ann. Bot-London, 82:665–673.
BELLINGHAM, P. J. AND A. D. SPARROW. 2000. Resprouting as a life history strategy in woody plantcommunities. Oikos, 89:409–416.
BOND, W. J. AND J. J. MIDGLEY. 2001. Ecology of sprouting in woody plants: the persistence niche. TrendsEcol. Evol., 16:45–51.
BONFIL, C., P. CORTES, J. P. ESPELTA, AND J. RETANA. 2004. The role of disturbance in the co-existence of theevergreen Quercus ilex and the deciduous Quercus cerrioides. J. Veg. Sci., 15:423–430.
BRET-HARTE, M. S., G. S. SHAVER, J. P. ZOERNER, J. F. JOHNSTONE, J. L. WAGNER, A. S. CHAVEZ, R. F. GUNKELMAN
IV, S. C. LIPPERT, AND J. A. LAUNDRE. 2001. Developmental plasticity allows Betula nana todominate tundra subjected to an altered environment. Ecology, 82:18–32.
BROWN, R. B., E. L. STONE, AND V. W. CARLISLE. 1990. Soils, p. 35–69, R. L. Myers and J. J. Ewel (eds.).Ecosystems of Florida. University of Central Florida Press, Orlando, FL.
CAVENDER-BARES, J., K. KITAJIMA, AND F. A. BAZZAZ. 2004. Multiple trait associations in relation to habitatdifferentiation among 17 Floridian oak species. Ecol. Monogr., 74:635–662.
CHAVE, J., H. C. MULLER-LANDAU, T. R. BAKER, T. A. EASDALE, H. TER STEEGE, AND C. O. WEBB. 2006. Regionaland phylogenetic variation of wood density across 2456 neotropical tree species. Ecol. Appl.,16:2356–2367.
CLEMENTE, A. S., F. C. REGO, AND O. A. CORREIA. 2005. Growth, water relations and photosynthesis ofseedlings and resprouts after fire. Acta Oecol., 27:233–243.
COOMES, D. A. AND P. J. GRUBB. 1998. A comparison of 12 tree species of Amazonian caatinga usinggrowth rates in gaps and understorey, and allometric relationships. Funct. Ecol., 12:426–435.
CRUZ, A., B. PEREZ, J. QUINTANA, AND J. MORENO. 2002. Resprouting in the Mediterranean-type shrub Ericaaustralis affected by soil resource availability. J. Veg. Sci., 13:641–650.
DAVIES, S. J. AND P. J. MYERSCOUGH. 1991. Post-fire demography of the wet-mallee Eucalyptus luehmannianaF. Muell. (Myrtaceae). Aust. J. Bot., 39:459–466.
DEN DUBBELDEN, K. C. AND J. M. H. KNOPS. 1993. The effect of competition and slope inclination onaboveground biomass allocation of understorey ferns in subtropical forest. Oikos, 67:285–290.
DODONOV, P., I. C. LUCENA, M. B. LEITE, AND D. M. SILVA-MATOS. 2011. Allometry of some woody plantspecies in a Brazilian savanna after two years of a dry season fire. Braz. J. Biol., 71:572–535.
DUCEY, M. J. 2012. Evergreenness and wood density predict height-diameter scaling in trees of thenortheastern United States. For. Ecol. Manag., 279:21–26.
FLECK, I., K. P. HOGAN, L. LLORENS, A. ABADIA, AND X. ARANDA. 1998. Photosynthesis and photoprotectionin Quercus ilex resprouts after fire. Tree Physiol., 18:607–614.
GIVNISH, T. J. 1982. On the adaptive significance of leaf height in forest herbs. Am. Nat., 120:353–381.HENRY, H. A. L. AND L. W. AARSSEN. 1999. The interpretation of stem diameter-height allometry in trees:
biomechanical constraints, neighbor effects, or biased regressions? Ecol. Letters, 2:89–97.HIGGINS, S. I., W. J. BOND, AND W. S. W. TROLLOPE. 2000. Fire, resprouting and variability: a recipe for
grass-tree coexistence in savanna. J. Ecol., 88:213–229.HOFFMANN, W. A., R. ADASME, M. HARIDASAN, M. T. DE CARVALHO, E. L. GEIGER, M. A. B. PEREIRA, S. G.
GOTSCH, AND A. G. FRANCO. 2009. Tree topkill, not mortality, governs the dynamics of savanna-forest boundaries under frequent fire in central Brazil. Ecology, 90:1326–1337.
HOLBROOK, N. M. AND F. E. PUTZ. 1989. Influence of neighbors on tree form: effects of lateral shade andprevention of sway on the allometry of Liquidambar styraciflua (Sweet gum). Am. J. Bot., 76:1740–1749.
JOHNSON, A. F. AND W. G. ABRAHAMSON. 2002. Stem turnover in the rhizomatous scrub oak, Quercusinopina, from South-central Florida. Am. Midl. Nat., 147:237–246.
282 THE AMERICAN MIDLAND NATURALIST 172(2)
KEELEY, J. E., C. J. FOTHERINGHAM, AND M. BAER-KEELEY. 2006. Demographic patterns of postfireregeneration in Mediterranean-climate shrublands of California. Ecol. Monogr., 76:235–255.
KING, D. A. 1986. Tree form, height growth, and susceptibility to wind damage in Acer saccharum. Ecology,67:980–990.
———. 1990. Allometry of saplings and understorey trees of a Panamanian forest. Funct. Ecol., 4:27–32.
KONSTANTINIDIS, P., G. TSIOURLIS, AND P. XOFIS. 2006. Effect of fire season, aspect and PREFIRE plant size onthe growth of Arbutus unedo L. (strawberry tree) resprouts. For. Ecol. Manag., 225:359–367.
KOZOVITS, A. R., R. MATYSSEK, J. B. WINKLER, A. GOTTLEIN, H. BLASCHKE, AND T. E. E. GRAMS. 2005. Above-ground space sequestration determines competitive success in juvenile beech and spruce trees.New Phytol., 167:181–196.
LAWES, M. J. AND P. J. CLARKE. 2011. Ecology of plant resprouting: populations to community responses infire-prone ecosystems. Plant Ecol., 212:1937–1943.
LLORET, F. AND L. LOPEZ-SORIA. 1993. Resprouting of Erica multiflora after experimental fire treatments. J.Veg. Sci., 4:367–374.
MAGUIRE, A. J. AND E. S. MENGES. 2011. Post-fire growth strategies of resprouting Florida scrub vegetation.Fire Ecol., 7:12–25.
MCMAHON, T. A. AND R. E. KRONAUER. 1976. Tree structures: deducing the principle of mechanicaldesign. J. Theor. Biol., 59:443–466.
MCPHERSON, K. AND K. WILLIAMS. 1998. The role of carbohydrate reserves in the growth, resilience, andpersistence of cabbage palm seedlings (Sabal palmetto). Oecologia, 117:460–468.
MENGES, E. S., W. G. ABRAHAMSON, K. T. GIVENS, N. P. GALLO, AND J. N. LAYNE. 1993. Twenty years ofvegetation change in five long-unburned Florida plant communities. J. Veg. Sci., 4:375–386.
——— AND N. KOHFELDT. 1995. Life history strategies of Florida scrub plants in relation to fire. Bull.Torrey Bot. Club, 122:282–297.
———. 2007. Integrating demography and fire management: an example from Florida scrub. Aust. J.Bot., 55:261–272.
MORENO, J. M. AND W. C. OECHEL. 1991. Fire intensity and herbivory effects on postfire resprouting ofAdenostoma fasciculatum in southern California chaparral. Oecologia, 85:429–433.
NIKLAS, K. J. 1994. Plant allometry: the scaling of form and process. University of Chicago Press, Chicago.———. 1995. Size-dependent allometry of tree height, diameter, and trunk-taper. Ann. Bot-London,
75:217–227.——— AND B. J. ENQUIST. 2001. Invariant scaling relationships for interspecific plant biomass production
rates and body size. P. Natl. Acad. Sci. USA, 98:2922–2927.——— AND ———. 2002a. Canonical rules for plant organ biomass partitioning and annual allocation.
Am. J. Bot., 89:812–819.——— AND ———. 2002b. On the vegetative biomass partitioning of seed plant leaves, stems, and roots.
Am. Nat., 159:482–497.——— AND H.-C. SPATZ. 2004. Growth and hydraulic (not mechanical) constraints govern the scaling of
tree height and mass. P. Natl. Acad. Sci. USA, 101:15661–15663.OLANO, J. M., E. S. MENGES, AND E. MARTINEZ. 2006. Carbohydrate storage in five resprouting Florida scrub
plants across a fire chronosequence. New Phytol., 170:99–106.PAULA, S. AND J. G. PAUSAS. 2006. Leaf traits and resprouting ability in the Mediterranean basin. Funct.
Ecol., 20:941–947.——— AND F. OJEDA. 2009. Belowground starch consumption after recurrent severe disturbance in three
resprouter species of the genus Erica. Botany, 87:253–259.POORTER, H., K. J. NIKLAS, P. B. REICH, J. OLEKSYN, P. POOT, AND L. MOMMER. 2012. Biomass allocation to
leaves, stems and roots: meta-analyses of interspecific variation and environmental control. NewPhytol., 193:30–50.
SAHA, S., A. CATENAZZI, AND E. S. MENGES. 2010. Does time since fire explain plant biomass allocation inthe Florida, USA, scrub ecosystem? Fire Ecol., 6:13–25.
SCHAFER, J. L. 2010. Effects of fire on nutrient availability and limitation in Florida scrub ecosystems.Ph.D. Dissertation, Department of Biology, University of Florida, Gainesville, FL.
2014 SCHAFER & MACK: RESPROUT GROWTH, BIOMASS, AND ALLOMETRY 283
SCHMALZER, P. A., T. E. FOSTER, AND F. W. ADRIAN. 2003. Responses of long-unburned scrub on the MerrittIsland/Cape Canaveral barrier island complex to cutting and burning. In: Proceedings of theSecond International Wildland Fire Ecology and Fire Management Congress, AmericanMeteorological Society. Published on CD-ROM and at http://www.ametsoc.org.
SILVA, I. A., M. W. VALENTI, AND D. M. SILVA-MATOS. 2009. Fire effects on the population structure ofZanthoxylum rhoifolium Lam (Rutaceae) in a Brazilian savanna. Braz. J. Biol., 69:815–820.
SILVEIRA, A. P., F. R. MARTINS, AND F. S. ARAUJO. 2012. Are tree ontogenetic structure and allometricrelationship independent of vegetation formation type? A case study with Cordia oncocalyx in theBrazilian caatinga. Acta Oecol., 43:126–133.
TOMA, T., A. ISHIDA, AND P. MATIUS. 2005. Long-term monitoring of post-fire aboveground biomassrecovery in a lowland dipterocarp forest in East Kalimantan, Indonesia. Nutr. Cycl. Agroecosys.,71:63–72.
UTSUMI, Y., E. G. BOBICH, AND F. W. EWERS. Photosynthetic, hydraulic and biomechanical responses ofJuglans californica shoots to wildfire. Oecologica, 164:331–338.
VILA, M. 1997. Effect of root competition and shading on resprouting dynamics of Erica multiflora L. J.Veg. Sci., 8:71–80.
WARTON, D. I., I. J. WRIGHT, D. S. FALSTER, AND M. WESTOBY. 2006. Bivariate line-fitting methods forallometry. Biol. Rev., 81:259–291.
WEINER, J. AND S. C. THOMAS. 1992. Competition and allometry in three species of annual plants. Ecology,73:648–656.
WEST, G. B., J. H. BROWN, AND B. J. ENQUIST. 1999. A general model for the structure and allometry ofplant vascular systems. Nature, 400:664–667.
WHITTAKER, R. H. AND G. M. WOODWELL. 1968. Dimension and production relations of trees and shrubs inthe Brookhaven forest, New York. J. Ecol., 56:1–25.
WILLIAMS, M., C. M. RYAN, R. M. REES, E. SAMBANE, J. FERNANDO, AND J. GRACE. 2008. Carbon sequestrationand biodiversity of re-growing miombo woodlands in Mozambique. For. Ecol. Manag.,254:145–155.
WUNDERLIN, R. P. AND B. F. HANSON. 2003. Guide to the vascular plants of Florida, 2nd ed. University Pressof Florida, Gainesville.
SUBMITTED 16 DECEMBER 2013 ACCEPTED 18 JUNE 2014
284 THE AMERICAN MIDLAND NATURALIST 172(2)

Copyright of American Midland Naturalist is the property of University of Notre Dame /American Midland Naturalist and its content may not be copied or emailed to multiple sites orposted to a listserv without the copyright holder's express written permission. However, usersmay print, download, or email articles for individual use.