growth, development, and appropriate versus … · the analysis of economic growth and economic...
TRANSCRIPT

Growth, Development, and Appropriate VersusInappropriate Institutions∗
Daron AcemogluMIT
Philippe AghionHarvard University
Fabrizio ZilibottiIIES Stockholm University.
March 27, 2006
AbstractIn this paper, we present a simple model that offers a unified framework for
the analysis of economic growth and economic development. In our model, thetransformation of production relationships, a key feature of the process of eco-nomic development, goes hand-in-hand with economic growth. The main drivingforce of this pattern is that economic growth in relatively backward economies isassociated with adoption and imitation of existing technologies and investment inexisting lines of business, while growth in advanced (frontier) economies is drivenby innovation. Consequently, the process of economic development takes the formof a transformation of economic relationships in many spheres. The frameworkwe present, though simple, enables us to offer a number of new ideas about therelationship between institutions/organizations, economic growth and economicdevelopment. Most important is that there will be a process of organizationaland institutional change associated with the process of economic development.This process of change is also associated with the notion of “appropriate insti-tutions/organizations”. Equilibrium organization of production and the broaderinstitutions of the society may differ with the stage of development (and withthe distance of an economy’s technology to the frontier technology in the world).Nevertheless, the model also shows how attempts to impose such “appropriate in-stitutions” from the outside can turn them into “inappropriate institutions,” i.e.,into barriers to further convergence of a developing economy.
JEL Numbers: O31, O33, O38, O40, L16.Keywords: appropriate institutions, convergence, economic development,
economic growth, inappropriate institutions, innovation, imitation, selection, tech-nology adoption, traps.
∗PRELIMINARY AND INCOMPLETE. The authors thank the Japan-Europe Cooperation Fundfor financial support.
1

1 Introduction
The literatures on economic growth and economic development have exactly the same
focus: how does an economy grow and develop from relative poverty to prosperity?
Despite their obvious unity of purpose, the two literatures have often diverged in their
interpretations and approaches. Growth theory, building on the growth experience of
more advanced nations, strives to capture the orderly process of economic growth, most
famously captured by the Kaldor facts,1 and models a relatively constant and sustained
process of economic growth. Development economics, on the other hand, in many ways
starts from the important observations of Kuznets (1957, 1966, 1973), which highlighted
the process of structural transformation taking place simultaneously with economic de-
velopment. Kuznets emphasized how development went hand in hand with changes
in the sectoral composition of output, transformation of production relationships, ur-
banization, growing importance of skills and perhaps even changes in social relation-
ships. These powerful, and largely accurate, observations have led many development
economists to focus on what is different–and thus what needs to be changed–in less-
developed economies. It is in fact possible to see this Kuznetsian unified theme as the
foundation of both the development economics of the 1950s and 1960s and the new
empirical development economics of the last decade or so.
In this paper, we offer a simple framework that unifies these two disparate approaches
to the process of development. The basic idea of our approach, which builds on our ear-
lier work (Acemoglu, Aghion and Zilibotti, 2006, from now on AAZ), is that economic
growth in relatively backward economies takes the form of adoption and imitation of
existing technologies and capital accumulation in already existing lines of business. In
contrast, in more advanced economies, there is limited potential for growth by simply
adopting existing technologies, so much of growth is driven by innovation. Imitation
and innovation require different organizational forms, different relations between en-
trepreneurs and credit markets, different processes of selection of entrepreneurs and
firms. In our model, we capture the stage of development by the distance of an econ-
1Kaldor facts refer to the relative constancy of the growth rate, the capital-output ratio, the shareof capital income in GDP and the real interest rate in the process of economic growth of many nationsover the past hundred years (see Kaldor, 1963, Denison, 1974, Barro and Sala-i-Martin, 2004).
2
omy to the world technological frontier. Consequently, the model predicts a close link
between distance to frontier and equilibrium organizational forms, equilibrium market
relations and consequently, equilibrium institutions.2
For example, in our baseline model, which builds on AAZ, the equilibrium could
take an investment-based or innovation-based form. Farther from the world technology
frontier, economies choose the investment-based regime, which enables them to grow
faster. The investment-based regime is associated with less selection, longer-term re-
lationships and in many ways less competition. As they approach the frontier, many
economies will change their organizational forms and market relations to transition to
an innovation-based regime, with more competitive relationships, ensuring better selec-
tion of entrepreneurs and firms. Interestingly, however, the Kuznetsian transformation
is not inevitable. Economies may get stuck in an investment-based regime, thus stop
converging to the world frontier, even though a switch to the innovation-based regime
would have generated convergence.
The ideas captured by this framework build not only on Kuznets, but also on Ger-
schenkron’s famous essay Economic Backwardness in Historical Perspective (1962). Ger-
schenkron (1962, p. 7) argued:
“... in a number of important historical instances industrialization pro-
cesses, when launched at length in a backward country, showed considerable
differences with more advanced countries, not only with regard to the speed
of development (the rate of industrial growth) but also with regards to the
productive and organizational structures of industry... these differences in
the speed and character of industrial development were to a considerable
extent the result of application of institutional instruments for which there
was little or no counterpart in an established industrial country.”
Examples of rapid growth with a different set of economic and contractual arrange-
ments (and perhaps “institutions”), than the frontier economies include the late indus-
2Here “institutions” are used to cover a variety of different economic, social and legal arrangementsand modes of organizations, partly emerging from the interaction of agents and party resulting fromthe political process. Thus the notion of institutions is similar to that of North (1990), and broaderthan that used in Acemoglu, Johnson and Robinson (2005).
3

trialization experiences of Germany, Italy and Russia. They also include the import-
substitution growth strategies of many Latin American countries during the 1950s and
60s, and the growth strategies of many Asian economies, such as Korea and Japan, during
the postwar period, which relied on large firms, and long-term bank-firm and employee-
firm relationships. These organizations contrast in many ways with the equilibrium
organizations observed in the United States or other advanced economies. The frame-
work highlights that there are natural reasons for these types of different organizations
to emerge and then to become transformed in the process of economic development. It
also suggests how these different organizations may become a barrier to growth if they
persist, rather than change in the process of economic development as envisioned by
Kuznets’ structural transformation.
There are two important points to note in this context:
1. The alternative economic arrangements, organizations and perhaps institutions,
were not necessarily imposed from the outside, but emerged as equilibria in these
late-industrializing countries. In the same way, the differences in sectoral compo-
sition, urbanization, credit relations that we observe in less-developed countries
today are equilibrium phenomena. They may or may not be efficient. What is im-
portant is that the logic of the process of economic growth leads to the emergence
of different equilibrium organizations at different stages of development.
2. As economies grow, these arrangements have a tendency to change, thus echoing
Kuznets’ insights that the process of economic development corresponds to a pro-
cess of structural transformation of the economy. However, if they fail to change,
they would condemn the economy toa non-convergence trap.3
These two points also suggest a new perspective on the issue of appropriate insti-
tutions. Countries far from the frontier may develop organizational forms (or more
broadly, “institutions”) that are appropriate for their own conditions, and the fact that
these arrangements are different from those in frontier counties does not necessarily
3We refer to “non-convergence traps” because an economy in such a trap does not stop growing, butstops converging to the world technology frontier at an income level below those of advanced/frontiereconomies.
4

mean that they are inefficient or a barrier to economic growth. In fact, in some situa-
tions, as emphasized by Gerschenkron, such appropriate and non-standard institutions
might encourage growth at the early stages of development. However, these appropriate
institutions always come with the risk of quickly turning into inappropriate institutions,
and preventing further economic progress and convergence in relatively less-developed
economies. It is therefore dangerous to encourage non-standard, non-competitive prac-
tices in the name of appropriate institutions, since these do contain the seeds of their
own destruction and the capacity to become the inappropriate institutions of the future,
blocking economic development.
The current paper illustrates these issues using a minimalist model, which can be
used for a variety of different applications. Before doing so, in Section 2, we provide some
cross-country evidence consistent with the notion that various economic arrangements
have different impacts on economic growth at different stages of economic development.
Finally, it is useful to note that ours is not the only approach that attempts to unify
the processes of economic growth and economic development. Two alternatives are par-
ticularly noteworthy. The first approach comes from models that reconcile aggregate
balanced growth with sectoral non-balanced growth (i.e., changes in the sectoral compo-
sition of output). This approach is taken by, among others, Laitner (2000), Kongsamut,
Rebelo and Xie (2001), Acemoglu and Guerrieri (2005) and Ngai and Pissarides (2005)–
see also Baumol (1967). The second approach comes from models of transition from a
Malthusian growth regime with high population growth and low or no growth in income
per capita to a high productivity growth regime associated with a demographic tran-
sition (see, for example, Galor and Weil, 2000, Hansen and Prescott, 2002, or Galor,
2005). Both of these differ from the approach in this paper because they either focus on
the sectoral composition of output and the reconciliation of balanced and non-balanced
growth at different levels of aggregation, or on the changes in the population dynamics
and the associated changes in growth. In contrast, our purpose is to build a simple
model that can be used to understand changes in various different facets of economic re-
lationships in the process of economic development in line with Kuznets’ insights about
structural transformation associated with economic development. In doing this, we also
want to emphasize how equilibrium appropriate institutions emerge at different stages of
5

development and then become transformed, and how their failure to become transformed
may lead to non-convergence traps.
The rest of the paper is organized as follows. Section 2 provides some motivating
cross-country evidence. Section 3 provides a simple framework for modeling the process
of growth based on imitation and innovation. In Section 4, we use this basic model
to show how the process of selection of entrepreneurs and the relationship between
entrepreneurs and society change in the process of economic development, and how
the failure of some of these arrangements to change may lead to a non-convergence
trap for the economy (where “inappropriate institutions” act as a barrier for further
convergence). Section 5 shows how similar ideas can be applied to show the process of
economic development affects the internal organization of the firm. Section 6 applies the
same ideas to the role of skills and education in the process of economic development.
Section 7 concludes.
2 Motivating Empirical Evidence
We now present some cross-country empirical evidence to motivate our analysis. The
purpose of this empirical evidence is not to establish causal effects, but to give a sense
that various important economic arrangements appear to have differential relationships
with growth at different stages of development. In particular we focus on (i) barriers to
entry, (ii) trade openness and (iii) education.
Figures 1a and 1b plot the relationship between growth and initial distance to frontier
(GDP per capita relative to the U.S.) in a sample of non-OECD, non-socialist countries
separately for those with high and low degree of “non-competitive” policies/barriers
to entry. Barriers are measured by the number of procedures necessary for opening a
new business (Djankov, La Porta, Lopez-de-Silanes, and Shleifer, 2002). The sample of
countries includes all non-OECD (including those that joined the OECD in the 1990s,
such as Korea and Mexico) and all non-socialist countries for which we have data. We
split the sample into low-barrier and high-barrier countries according to the “number of
procedures to open a new business” variable from Djankov, La Porta, Lopez-de-Silanes,
and Shleifer (2002). Countries are classified into the “low-barrier” group if the number of
procedures is smaller or equal to 10 and into the “high-barriers” group otherwise. This
6

implies that 20 countries are classified as high barrier and 23 countries as low barrier.4
The figures show growth in per capita income between 1965 and 1995 plotted against
distance to frontier in 1965, where we also control for a dummy for sub-Saharan African
countries which have much lower growth rates. While there is a strong negative rela-
tionship between growth and distance to frontier for countries with high barriers, the
relationship is much weaker for countries with low barriers. In other words, high-barrier
countries do relatively well when they are far from the frontier, but much worse near the
frontier, while low-barrier countries grow almost equally successfully near or far from
the frontier.
To see this more clearly, consider two separate regressions of country growth rates
between 1965 and 1995 on the sub-Saharan Africa dummy and distance to frontier in
1965 in the samples of low-barrier and high-barrier countries. For low-barrier countries,
the coefficient on distance to frontier is -0.028 (s.e.=0.029), thus highly insignificant
(shown in Figure 1b). The same coefficient is -0.078 (s.e.=0.028) in the sample of high-
barrier countries, which is significant at the 5 percent (shown in Figure 1a). The vertical
axes in the figures show country growth rates after the constant and the effect of the
sub-Saharan Africa dummy, estimated in the corresponding multivariate regression, are
taken out.
This pattern is highly suggestive that the impact of non-competitive practices asso-
ciated with entry barriers is very different depending on the stage of development. The
evidence does not necessarily imply that entry barriers are conducive to fast growth,
but suggests that they may have less harmful effects on economic growth for countries
farther from the frontier.
FIGURE 1
Figures 1d and 1e show the same pattern when we look at growth in 5-year intervals
and control for time effects and country fixed effects. These figures show that near the
frontier a country with high barriers grows less than its “usual” growth rate. Therefore,
as implied by our model, countries with high barriers slow down more significantly as
they approach the frontier. With country fixed effects and time effects, the coefficient
4Further details are provided in AAZ.
7

on the distance to frontier in the low-barrier sample is -0.039 (s.e.= 0.037), while in the
high-barrier sample it is -0.109 (s.e.= 0.047). We also obtain similar results in fixed
effect regressions when distance to frontier is instrumented by its past values in order
to avoid biases resulting from the fact that distance to frontier is correlated with lags of
the dependent variable.
A potential problem with the results in Figures 1a-1d is that entry barriers are both
endogenous and measured towards the end of our sample. As an alternative, Figures 2a-
2d show similar results exploiting “exogenous” differences in openness to international
trade (another measure of competition policy). Here we split the sample according to the
openness measure constructed by Frankel and Romer (1999), which predicts openness
from a standard “gravity equation,” as a function of differences in population, land
area, proximity and common borders to other countries, and whether or not a country is
landlocked. In the cross-sectional regressions, the coefficient on the distance to frontier
for the “closed” economies is -0.049 (s.e.= 0.021), while for the “open” economies, it is
-0.041 (s.e.= 0.029). In the fixed effect regressions, the coefficient for closed economies
is -0.197 (s.e.= 0.051), while for open economies, it is -0.087 (s.e.= 0.032).
FIGURE 2
The contrast between “open” and “closed” economies is somewhat weaker in the
cross-section than was the case in Figures 1a and 1b, but the fixed effect specifications
show a significantly stronger relationship between distance to frontier and growth for
closed economies than for open economies. In conclusion, there is some evidence that
openness (or at least its exogenous component) has a positive effect on growth, but
this effect becomes particularly important for economies that are relatively close to the
technology frontier.
Another dimension that will be explored in our analysis is the relationship between
human capital accumulation and distance to frontier. For this reason, Figures 3a-d per-
form the same exercise, splitting the sample by human capital (total years of schooling
in 1965). Here, the analysis intends to detect non-linear effects of education and educa-
tional policies. The results show that skills and human capital matter more nearer the
frontier: there is a more negative relationship between growth and distance to frontier
8

for low-human capital than for high-human capital countries. In the cross-sectional re-
gressions, the coefficient on the distance to frontier for low-education countries is -0.122
(s.e.= 0.049), while for high-education countries, it is -0.063 (s.e.= 0.025). In the fixed
effect regressions, the coefficient for the low-education countries is -0.228 (s.e.= 0.066)
and for the high-education countries, it is -0.051 (s.e.= 0.031).
FIGURE 3
3 Baseline Model of Imitation and Innovation
Throughout, our purpose is to provide a simple framework that can be used in a variety
of applications. This basic model is a simplified version of the model used in AAZ,
but we make a number of stronger assumptions to simplify the exposition and refer the
reader to that paper for some of the details that are not essential for the exposition.
Here we describe the production side of the economy, which consists of a unique
final good, always taken as the numéraire. This good is produced competitively using a
continuum of intermediate inputs according to:
yt =
Z 1
0
(At (i))1−αxt (i)
α di, (1)
where At (i) is the productivity of the intermediate good in intermediate sector i at time
t, xt(i) is the amount of intermediate good i used in the production of the final good at
time t, and α ∈ (0, 1).Each intermediate good is produced by a monopolist i ∈ [0, 1] at a unit marginal
cost in terms of the unique final good. The monopolist faces a competitive fringe of
imitators that can copy its technology and also produce an identical intermediate good
with productivity At (i), but will do so more expensively. In particular, the competitive
fringe can produce each intermediate good at the cost of χ > 1 units of final good. The
existence of this competitive fringe forces the monopolist to charge a limit price:
pt (i) = χ > 1. (2)
Naturally, this limit price configuration will be an equilibrium when χ is not so high
that the monopolist prefers to set a lower unconstrained monopoly price. The condition
9

for this is simply
χ ≤ 1/α,
which we assume throughout.
We think of the parameter χ as capturing both technological factors and government
regulation regarding competitive policy. A higher χ corresponds to a less competitive
market.
Given the demand implied by the final goods technology in (1) and the equilibrium
limit price in (2), equilibrium monopoly profits are simply:
πt (i) = δAt (i) , where δ ≡ (χ− 1)χ−1
1−α . (3)
In this expression, δ is a measure of the extent of monopoly power. In particular it can
be verified that δ is increasing in χ for all χ ≤ 1/α.Our focus is with the processes of economic growth and economic development,
which, in this model, will be driven by technological progress, that is, by increases
in At (i). We will assume that each monopolist i ∈ [0, 1] can increase its At (i) by
two complementary processes: (i) imitation (adoption of existing technologies); and (ii)
innovation (discovery of new technologies). All the key results of the framework will
rely on the feature that different economic arrangements will lead to different amounts
of imitation and innovation.
To prepare for this point, let us define the average productivity of the economy in
question at date t as:
At ≡Z 1
0
At (i) di.
Let At, on the other hand, denote the the productivity at the world frontier. Naturally,
At ≤ At for all t. Throughout the paper with simplified the analysis by assuming that
the world technology frontier, At, grows at the constant rate g (see AAZ), i.e.,
At = (1 + g) At−1. (4)
We assume that the process of imitation and innovation leads to the following law of
motion of each sector’s productivity:
At (i) = ηAt−1 + γAt−1 + εt (i) , (5)
10

where η > 0 and γ > 0, and εt (i) is a mean-zero run than variable, capturing the feature
that there may be differences in innovation performance across sectors.
In equation (5), ηAt−1 stands for advances in productivity coming from adoption
of technologies from the frontier (and thus depends on the productivity level of the
frontier, At−1), and γAt−1 stands for the component of productivity growth coming
from innovation (building on the existing knowledge stock at time t− 1, At−1).
Finally let us define
at ≡At
At
the (inverse) measure of the country’s distance to the technological frontier at date t.
Now, we can integrate (5) over i ∈ [0, 1], use the fact that εt (i) has mean zero, divideboth sides by At and use (4) to obtain a simple linear relationship between a country’s
distance to frontier at at date t and the distance to frontier at−1 at date t− 1:
at =1
1 + g(η + γat−1). (6)
Though simple, this equation encapsulates a number of important points. First,
it shows how the dual process of imitation and innovation may lead to a process of
convergence. In particular, as long as γ > 1 + g, equation (6) implies that at will
eventually converge to 1. Second, the equation also shows that the relative importances
of imitation and innovation will depend on the distance to the frontier of the economy
in question. In particular when at is large (meaning the country is close to the frontier),
γ–thus innovation–matters more for growth. In contrast when at is small (meaning the
country is farther from the frontier), η–thus imitation–is relatively more important.
To obtain further insights from this framework, we need to endogenize η and γ, which
is what we turn to next.
4 Distance to Frontier and Selection
4.1 Investment-Based and Innovation-Based Growth
In AAZ, the parameters η and γ are modeled as functions of the investments undertaken
by the entrepreneurs and the contractual arrangement between firms and entrepreneurs.
There are two types of entrepreneurs: high- and low-skill entrepreneurs. When an en-
trepreneur starts a business, her ability is unknown, and is revealed over time through
11

her subsequent performance. The economy may involve long-term relationships with the
entrepreneurs (“long-term contracts”, R = 1), meaning that entrepreneurs keep their job
even if they are revealed to be low skill. Alternatively, the process of “creative destruc-
tion” may replace low-skill entrepreneurs by new entrepreneurs (“short-term contracts”,
R = 0). Long-term contracts are valuable for investments since the entrepreneurs have
incentives to use retained earnings to finance greater investments. If the underlying
economy features credit market imperfections, long-term contracts might be useful in
mitigating the underinvestment resulting from these credit market imperfections. How-
ever, with long-term contracts, many of the active entrepreneurs of the society will have
low skills and will be less innovative.
The crucial assumption in AAZ is that high skills matter more for innovation than
imitation. This is a natural assumption, and in AAZ, we provided some regression evi-
dence consistent with the notion that ability and skills are more important for innovation
(and nearer the technology frontier).
Here, rather than repeat the derivation and the details of the analysis in AAZ, we
present a simple reduced-form analysis. In particular, let us assume that the equation
for the law of motion of the distance the frontier, (6), takes the form
at =
⎧⎨⎩11+g(η + γat−1) if Rt = 1
11+g(η + γat−1) if Rt = 0
(7)
as a function of the contractual/organizational decision at time t, Rt ∈ {0, 1}. In thisequation we assume that
η > η and γ < γ < 1 + g. (8)
The first part of this assumption follows immediately from the notion that high-skill
entrepreneurs are better at innovation.
The second part requires more explanation. We naturally expect high-skill en-
trepreneurs to be better at imitation as well. In that case, there would be no trade-off
and low-skill entrepreneurs would always be replaced by market forces (unless they had
some other, political or economic advantage). However, the use of retained earnings
to finance investments, mentioned above, means that incumbent entrepreneurs have an
advantage relative to young entrepreneurs. If the importance of skills in imitation is
12

limited, then we can have a situation where the overall effect of retaining an incum-
bent low-skill entrepreneur is to increase the rate of imitation (the rate of investment in
existing technologies), and thus γ < γ. This is what equation (8) introduces.
Finally, the last part of Assumption (8), γ < 1 + g, ensures that there are always
“convergence” dynamics (i.e., no instability in the dynamical behavior of at).
Assumption (8) also explains why we refer to Rt = 0 as the innovation-based regime
(since it encourages innovation by replacing low-skill entrepreneurs), and to Rt = 1 as
the investment-based regime (since it makes use of the retained earnings of incumbent
entrepreneurs to increase investment in existing technologies and make use of imitation
rather than emphasizing innovation).
Figure 4 draws equation (7), under the further assumption that
g = η + γ − 1,
which ensures that an economy in the innovation-based regime, R = 1, at the frontier
grows exactly at the rate g. In other words, this assumption implicitly endogenizes the
world frontier growth rate as coming from innovation-based growth.
FIGURE 4
Figure 4 visually shows that the economy with long-term contracts (R = 1) achieves
greater growth (higher level of at for given at−1) through the investments/imitation
channel, but lower growth through the innovation channel. The figure also shows that
which regime maximizes the growth rate of the economy depends on the level of at−1.
In particular, there exists some level a ∈ (0, 1) of the distance the frontier, such thatwhen at−1 < a, the investment-based strategy, R = 1 leads to greater growth, and when
at−1 > a, the innovation-based strategy, R = 0, achieves higher growth.
It is straightforward to verify from (7) that a is given by the intersection of the R = 0
and R = 1 lines, thus by:
a ≡η − η
γ − γ. (9)
The growth-maximizing sequence starts with the investment-based strategy and then
switches to an innovation-based strategy. In the investment-based regime, incumbent
entrepreneurs are sheltered from the competition of younger ones and this may enable
13

the economy to finance greater investments out of the retained earnings of incumbent
entrepreneurs. In contrast, in the innovation-based regime, there is greater selection of
entrepreneurs (and more generally of firms) and the emphasis is on maximizing innova-
tion at the expense of investment.
Figure 4 describes the law of motion of technology in an economy as a function of the
organization of firms (markets), captured by R. It does not specify what the equilibrium
sequence of {Rt}∞t=0 is. To determine this equilibrium sequence, we need to specify the
organization of the credit market, incentives of entrepreneurs, the amount of retained
earnings and the behavior of the consumers in the economy. Here our purpose is not to
provide an exhaustive analysis, but to communicate the main ideas. For this reason, we
will refer the reader to the analysis in AAZ, and simply explain a number of possibilities.
4.2 Equilibrium Patterns
There are four interesting configurations to consider (see AAZ for the conditions under
which each of these configurations will emerge as the equilibrium):
1. Growth-maximizing equilibrium: the first and the most obvious possibility is an
equilibrium that is growth maximizing. In particular, if markets and entrepreneurs
are able to solve the agency problems, have the right decision-making horizon and
are able to internalize the pecuniary and non-pecuniary externalities, we would
obtain an efficient equilibrium. This equilibrium will take a simple form:
Rt =
⎧⎨⎩ 1 if at−1 < a
0 if at−1 ≥ a
so that the economy achieves the upper envelope of the two lines in Figure 4. In
this case, there is no possibility of outside intervention to increase the growth rate
of the economy.5 Moreover, an economy starting with a0 < 1 always achieves a
growth rate greater than g, and will ultimately converge to the world technol-
ogy frontier, i.e., at = 1. In this growth-maximizing equilibrium, the economy
5As discussed in AAZ, growth maximization may not coincide with welfare maximization. Herewe ignore this issue and refer the reader once again to AAZ for the characterization of the welfare-maximizing equilibrium.
14

first starts with a particular set of organizations/institutions, corresponding to
R = 1. Then, in line with Kuznets’ vision of a structural transformation as the
economy grows, the economy switches from R = 1 to R = 0. In our simple
economy, this structural transformation takes the form of long-term relationships
disappearing and being replaced by shorter-term relationships, by greater compe-
tition among entrepreneurs and firms, and by better selection of entrepreneurs.
Therefore, even in this growth-maximizing equilibrium there is a notion of “ap-
propriate organizations/institutions”–the economy with at−1 < a chooses the
appropriate organization of firms for growth maximization. However, importantly,
this is not the outcome of some outside intervention; the “appropriate organiza-
tions/institutions” emerge as the decentralized equilibrium of the economy.
2. Underinvestment equilibrium: the second potential equilibrium configuration in-
volves the following equilibrium organizational form:
Rt =
⎧⎨⎩ 1 if at−1 < ar (δ)
0 if at−1 ≥ ar (δ)
where ar (δ) < a. Figure 5 depicts this visually, with the thick black lines corre-
sponding to the equilibrium law of motion of the distance the frontier, a. This
equilibrium is referred to as the “underinvestment equilibrium” because for a ∈(ar (δ) , a), the economy can reach a higher growth rate (as shown in the figure)
by choosing Rt = 0, and this would correspond to a higher investment level by
incumbent entrepreneurs that have more retained earnings to undertake greater
investments. AAZ show why this particular configuration can arise as equilibrium.
The main reason is that technological progress, i.e., an increase in at, creates a pos-
itive externality on consumers, which is not internalized by the monopolist–this is
the usual appropriability effect present in all monopolistic competition models. As
a result, there is a tendency for underinvestment in equilibrium. Since Rt = 0 in-
volves greater investments out of retained earnings, there is a natural bias against
Rt = 0 and the investment-based regime.
The most notable feature is that though equilibrium is different from the previous
case, it again follows the sequence of R = 1 followed by a structural transformation
15

and a switch to greater competition among and selection of entrepreneurs with the
innovation-based regime. Therefore, this equilibrium also exhibits the feature that
the process of growth and economic development is associated with structural
transformation. Moreover, the economy still ultimately converges to the world
technology frontier, i.e., at = 1 is reached as t → ∞. The only difference isthat the structural transformation from R = 1 to R = 0 happens too soon at
at−1 = ar (δ) rather than at a.
Consequently, in this case, a temporary government intervention may increase the
growth rate of the economy. The temporary aspect is important here, since the best
that the government can do is to increase the growth rate while a ∈ (ar (δ) , a). Howcan the government achieve this? Subsidies to investment would be one possibility.
AAZ show that the degree of competition in the product market also has an indirect
effect on the equilibrium, as emphasized by the notation ar (δ). In particular, a
higher level of δ, which corresponds to lower competition in the product market
(i.e., higher χ), will increase ar (δ), and thus may close the gap between ar (δ) and
a. This may be related to why some less developed economies support monopolies
and the effect of entry barriers is different at different stages of development as
shown in Section 2. Nevertheless, it has to be noted that reducing competition will
create other, static distortions (because of higher markups). Moreover and more
importantly, we will see in the next two configurations that reducing competition
can have much more disastrous effects for economic growth.
FIGURE 5
3. Sclerotic equilibrium: the third possibility a sclerotic in which ar (δ) > a, so that
incumbent low-skill, low-productivity firms survive even when they are damag-
ing to growth. In AAZ, we show why this can happen: the retained earnings of
incumbent entrepreneurs, which was useful in relaxing credit constraints, also cre-
ates a shield protecting them against the competition of more productive young
entrepreneurs. Which effect dominates and whether we are in the underinvest-
ment or the sclerotic equilibrium depends on parameter values. In particular, as
the above discussion suggests, ar (δ) is increasing in δ, so there exists a level of δ,
16

δ, such that if δ > δ, incumbent entrepreneurs have so much monopoly power and
retained earnings that they can protect themselves against young entrepreneurs.
The resulting pattern is drawn in Figure 6a. Now the economy fails to achieve the
maximum growth rate for a range of values of a such that a ∈ (a, ar (δ)). In thisrange, the innovation-based regime would be growth-maximizing, but the economy
is stuck with the investment-based regime because of the retained earnings and the
power of the incumbents.
Nevertheless, as shown in Figure 6a, this economy also follows the pattern of
starting with a different set organizations, represented by R = 1, and then, as
envisaged by Kuznets, switching to a different set of arrangements, R = 0. Like
the previous two equilibria, this equilibrium also features convergence to the world
technology frontier, i.e., to a = 1. Therefore, this economy also starts with different
“appropriate” institutions and then these institutions and arrangements become
transformed in the process of economic growth, making way to the innovation-
based regime, which ensures that the economy converges to the world technology
frontier. Nevertheless, this equilibrium configuration also shows that there will be
a range, precisely a ∈ (a, ar (δ)), where these alternative arrangements, thoughthey may appear “appropriate,” are in fact detrimental to economic growth.
4. Non-convergence trap equilibrium: the fourth possibility is related to the third one
and also involves ar (δ) > a. However, now the gap between ar (δ) and a is even
larger as depicted in Figure 6b, and includes the level of a, atrap, such that
atrap ≡η
1 + g − γ.
Inspection of (7) will immediately reveal that if at−1 = atrap and Rt = 1, the econ-
omy will remain at atrap. Therefore, in this case the protection of incumbent firms
(with their stock of retained earnings) not only retards growth for a temporary
interval, but pushes the economy into a non-convergence trap. In particular, this
is the only equilibrium pattern in which the economy fails to converge to the fron-
tier; with the investment-based regime, R = 1, the economy does not grow beyond
atrap, and at this distance to frontier, the equilibrium keeps choosing R = 1.
17

This equilibrium therefore illustrates the most dangerous scenario, that of non-
convergence. Encouraging investment-based growth, by supporting existing, in-
cumbent firms, may appear as “appropriate policy”, but in fact it condemns the
economy to non-convergence. This is also the only case in which the Kuznetsian
structural transformation does not occur because the economy remains trapped.
In many ways, this is in line with Kuznets’ vision; the resulting economy is an
underdeveloped one, unable to realize the structural transformation necessary for
the process of economic development.
FIGURE 6
4.3 Policy, Political Economy and Inappropriate Institutions
The above discussion highlighted how the equilibrium pattern of economic arrangements
may involve the organization of the economy in non-standard ways (long-term contracts,
limited competition etc.), and the process of economic growth brings the structural
transformation of these arrangements. It also highlighted how certain policies, such
as reducing product market competition, may appear attractive as a way of increasing
growth temporarily, but can quickly turn into inappropriate institutions, causing the
economy to become trapped and stop converging to the world technology frontier.
In fact, once the analysis is expanded to incorporate political economy features,
where incumbent firms can lobby to influence equilibrium policies, the danger of ap-
propriate institutions turning into inappropriate institutions increases significantly. For
example, under the plausible assumption that economic power can buy political power,
once the economy adopts less competitive markets or subsidies to investment, encour-
aging investment-based growth, these policies become easily entrenched; incumbent en-
trepreneurs become enriched by existing policies and institutions, and can successfully
lobby to maintain them (and thus preventing a switch to the innovation-based equilib-
rium).
These political-economy considerations therefore reiterate that societies may get
trapped in a non-convergence pattern with “inappropriate institutions” and relatively
backward technologies, because earlier they adopted “appropriate institutions” for their
circumstances at the time, but in the process also created a powerful constituency against
18

change.
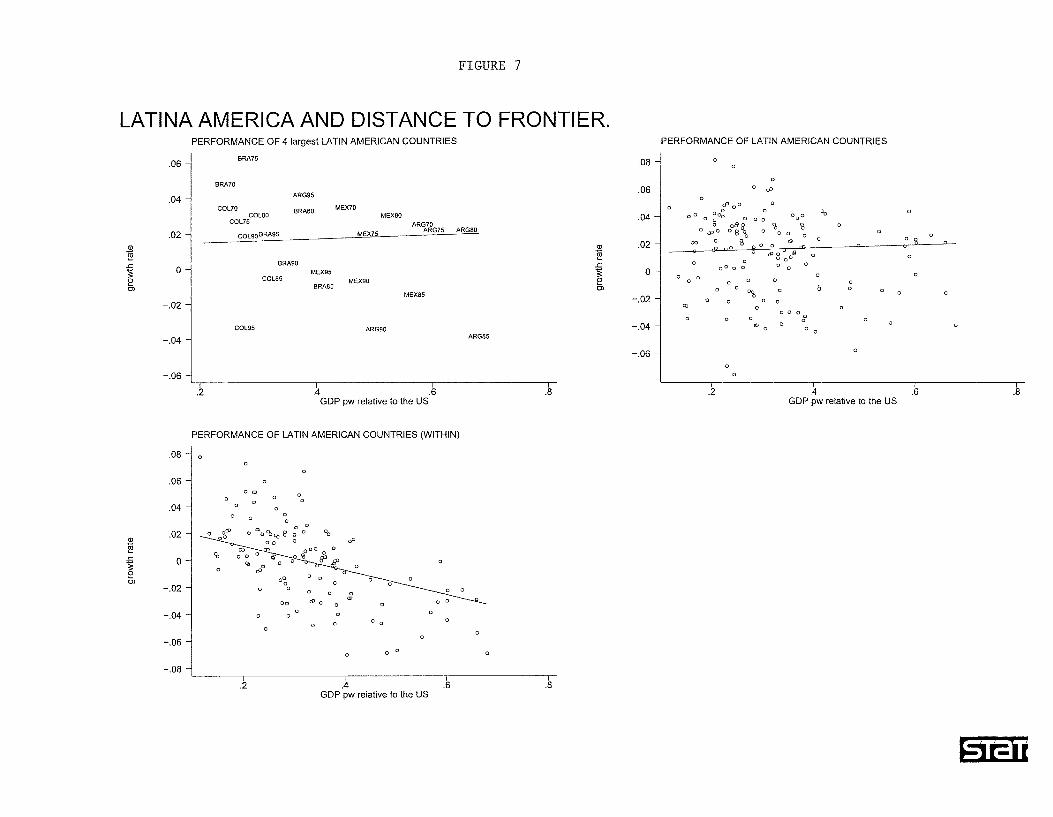
The non-convergence trap and the associated political economy interactions, may be
a good description of the experiences of a number of Latin American countries such a
Brazil, Mexico and Peru, which grew relatively rapidly with import substitution and pro-
tectionist policies until the mid-1970s, stagnated and were taken over by other economies
with relatively more competitive policies, such as Hong Kong.
Figure 7 shows the growth performance of Central and South American countries at
different stages of their development process. On the vertical axis we plot the average
growth rate over five-year periods, while on the horizontal axis we plot the GDP per
capita relative to the US at the beginning of each five-year period. The continuous line
is for comparison. It represents the average growth rate across all non-OECD countries
in the world (not only in Central and South America) conditional on the distance to
frontier. Figure 7a plots the growth performance of the four largest Central and South
American countries: Brazil, Argentina, Mexico and Colombia. All of these countries
actively engaged in import-substitution policies. Clearly, when their relative GDP is
below 40%, these four countries outperformed the average non-OECD country at the
same level of development. But their performance was below average when their relative
GDP was larger than 40%.6
Figure 7b plots all Central and South American countries, showing the same broad
pattern. One concern about Figures 7a and 7b is that the evidence can be largely driven
by the cross-sectional variation. For instance, Brazil and Colombia account for most of
the positive deviations in Figure 7a. To address this concern, Figure 7c plots the growth
rates controlling for fixed effects. In this figure, each points represents the deviation of
the growth rate from the “usual growth rate” of that country. In this panel, the cross-
sectional variation is by construction removed. The continuous line is now calculated as
the regression line of a convergence equation for the entire world sample after control-
ling for fixed effects.7 As the figure shows, the performance of Latin American countries
deteriorates at a faster rate than that of the average developing country. A likely expla-
6Note that the continuous line is positively sloped. This reflects the well-known fact: there is noabsolute convergence across countries in the world.
7In contrast to the cross-sectional pattern, in the fixed-effect regression, there is convergence asindicated by the downward sloping line.
19

nation for this pattern is the important-substitution and incumbent-protective policies
adopted by many countries in Latin America. As suggested by our approach, these
policies appear to have led to relatively rapid initial growth, followed by stagnation.
Moreover, the political economy of these countries suggests that the economic stagna-
tion was associated with a persistent inability to implement policy reforms.
FIGURE 7
Our simple theory also sheds new light on the experiences of Korea and Japan.
Though in many ways more market friendly than Latin American countries, for much
of the post-war period both Korea and Japan achieved rapid growth and convergence
relying on high investment, large conglomerates, government subsidies, and relatively
protected internal markets. In Japan, the Ministry of International Trade and Industry
(MITI) played a crucial role by regulating foreign currency allocations, import licenses,
and the extent of competition, by directing industrial activity and by encouraging invest-
ment by the keiretsu, the large groupings of industrial firms and banks (e.g., Johnson,
1982, Evans, 1995, Hoshi and Kashyap, 2002). In the Korean case, the large family-
run conglomerates, the chaebol appear to have played an important role, especially in
generating large investments and rapid technological development. The chaebol, similar
to the keiretsu in Japan, received strong government support in the form of subsidized
loans, anti-union legislation and preferential treatment that sheltered them from both
internal and external competition. An additional important feature of both the chaebol
and the keiretsu was their low managerial turnover, emphasis on long-term relationships
and generally rigid structures (e.g., Wade, 1990, Vogel, 1991, Evans, 1995).
In both Korea and Japan, a long period of convergence and growth came to an end in
the mid-1980s in Japan and during the Asian crisis in Korea. The Korean case illustrates
the politico-economic problems discussed above. Kong (2002, p. 3) writes
“...political–not economic–considerations dominated policymaking... [in
Korea].... and ...corruption was far greater than the conventional wisdom al-
lows”.
Nevertheless, the crisis appears to have eventually opened the way to reforms in
Korea: a number of the chaebol went bankrupt, while others were split, or like Daewoo,
20

were forced into restructuring. Political reforms seem to have weakened the highly
entrenched politico-economic elite: the patriarchs of Samsung, Daewoo and Jinro, the
three major chaebol, were convicted in the late 1990s of major bribing of two former
presidents (although their jail sentences were pardoned in 1997, see Asiaweek, October
10, 1997). Interestingly, the speed of reforms seems to have been much slower in Japan.
This may explain why Korea has by now managed to resume growth rapidly after the
crisis, while the economic performance of Japan continues to be weak.
5 Distance to Frontier and Internal Organization of Firms
The framework introduced above can also be used to study how the internal organization
of firms changes with the process of economic growth and economic development. Here
we illustrate these ideas looking at two facets of the internal organization of firms; (i)
vertical integration; (ii) delegation of decision-making authority to managers.
5.1 Vertical Integration
Here we outline a model of how vertical integration decisions of firms change as an
economy develops, which builds on Acemoglu, Aghion and Zilibotti (2004). In particular,
let us consider a slight modification of equation (5) whereby
At (i) = ηAt−1 + γt (i)At−1, (10)
where
γt (i) = γ + θt (i) (11)
captures the rate of innovation of the firm an intermediate goods sector i. For example,
we can think of the term θt (i) as the probability that an innovation in sector i at time t
is successful. If so, there is innovation in the amount 1+γ. Otherwise, there is a smaller
innovation, of size γ. As before, these innovations build on the knowledge stock of the
country, thus they multiply At−1. The first term in (10), on the other hand, reflects
imitation from the world technology frontier, hence the term At−1.
The key assumption of the model of this subsection will be that the probability of
innovation, θt (i), is affected by the internal organization of the firm, in particular, by
whether the firm is vertically integrated or not. In particular, imagine that innovations
21

result from effort and initiatives by the owner/manager of the firm. Greater effort leads
to greater θt (i). However, the owner/manager of the firm also engages in other tasks,
such as production, marketing, distribution. The key decision is how to allocate his or
her scarce time between these different activities. The internal organization of the firm
affects these decisions. For example, with vertical integration, the owner/manager will
perform all of these tasks himself or herself, whereas with outsourcing some of these
tasks will be allocated to other agents. The key from the viewpoint of this paper is
how this trade-off changes over the process of development, and whether there is also a
structural transformation associated with the internal organization of the firm showing
a tendency to change as an economy develops.
To investigate this issue in the simplest possible way, consider a symmetric equilib-
rium in which θt (i) = θ for all i ∈ [0, 1]. Then, dividing both sides of the above equationby At−1, and integrating over i ∈ [0, 1], we once again obtain a simple linear equationdescribing how the state variable at = At/At evolves over time:
at =1
1 + g
¡η +
¡γ + θ
¢at−1
¢, (12)
where g is again the growth rate of world technology frontier.
Now returning to the trade-off between vertical integration and outsourcing, we in-
troduce the basic idea ofmanagerial overload, that is, the inability of the manager/owner
of the firm to exert effort to deal with all possible problems that arise in production,
marketing, distribution as well as innovation. Outsourcing mitigates this problem by
having another agent performs some of these tasks. But at the same time, it creates a
holdup problem as in the incomplete contracts literature pioneered by Grossman and
Hart (1986); the agent will receive a fraction of the revenue of the firm. In particular,
we follow Grossman and Hart and the incomplete contracts literature, in modeling this
holdup problem in the simplest possible way and assume that no ex ante contract can
induce an enforceable division of surplus; sharing of profits must rely entirely upon ex
post bargaining. In particular, with outsourcing, the agent brought into the produc-
tion process will share some of the rents with the owner, thereby reducing the owner’s
income. This dissipation of income makes outsourcing an attractive to the owner, and
also if outsourcing is adopted, reduces the owner’s incentives to innovate.
22

The analysis in Acemoglu, Aghion and Zilibotti (2004) establishes that there exists
a critical threshold of the distance to frontier av such that for all a < av, equilibrium
organizational form is vertical integration, and for a > av, there will be outsourcing.
The threshold av is typically less than 1, so that there will be a switch to outsourcing
before reaching the technology frontier.
The reason for this pattern is that the value of innovation, and thus the value of
higher θ, increases with at−1. When at−1 is close to zero, that is, in a relatively backward
economy, imitation is much more important than innovation. Outsourcing may increase
innovation, but it is not worth for the owner, since it will involve sharing the surplus
with the agent. As at−1 increases, the value of innovation and thus the value of high
levels of θ increase. Now it may become worthwhile for the owner to bring in another
agent–outsource some of the activities–in order to take advantage of greater innovation
possibilities.
Therefore, this simple model also predicts a structural transformation, this time with
the internal organization of the firm shifting from vertical integration to outsourcing, as
an economy develops.
Using a panel data set of UK firms during the period 1980-2000, in Acemoglu, Aghion,
Griffith and Zilibotti (2003), we provide some evidence consistent with the pattern dis-
cussed here. Table 1, replicated from that paper, shows a negative and significant
correlation between vertical integration and the interaction term between closeness of
the firm to the technological frontier of its four-digit industry and R&D intensity of its
suppliers. The evidence suggests that as innovation becomes more important, there may
indeed be shift from vertical integration to outsourcing.
TABLE 1
5.2 Delegation of Authority
Another important aspect of firms’ organization is the extent to which decision making
is centralized or decentralized within each firm, for example as captured by delegation of
authority to lower-layer managers. Recent evidence based on French firm-level panel data
by Acemoglu et al. (2006) shows a robust positive correlation between decentralization
and distance of a firm to the technological frontier of its industry; firms that are relatively
23

closer to the frontier are more likely to delegate authority to lower-later managers.
Acemoglu et al. (2006) provide an explanation for this based on learning, whereby firms
farther from the frontier can learn from the experiences of more advanced firms about
implementation of new technologies and does not need to delegate as much authority to
specialized agents.
Here, we present a complementary explanation more closely related to the framework
developed in this paper.
As in the previous section, consider a firm engaged in production and innovation. The
firm (the owner) decides how much authority to delegate to a manager about production
decisions. There is a conflict of interest between the owner and the manager, however.
The manager may prefer to take actions that do not maximize the profits of the firm,
instead choosing actions that provides him with private benefits (see Aghion and Tirole,
1997). We measure the degree of conflict of interest between the firm and the manager
with the “congruence” parameter, β. In particular, β is the probability that the interests
of the manager are aligned with those of the firm. If the manager is delegated authority,
he will choose the action that he prefers most. With probability β, this will be the action
that leads to positive revenues for the firm, and with probability 1 − β, it will lead to
zero revenues. Clearly, the case with β = 1 corresponds to no conflict of interest, while
β = 0 implies that the manager will always choose an action that leads to zero profits
for the firm.
Let p be our (inverse) measure of delegation of authority to the manager. In par-
ticular, p is the probability that the firm monitors the manager. When the manager is
monitored, he must take the decision maximizing the firm’s profit. If p = 1, there is
no delegation of authority, and the firm monitors the manager and enforces the profit-
maximizing action with probability 1. On the other hand, if p = 0, there is no monitoring
of the manager, thus full delegation. In this case, the manager decides the best action
unilaterally. In intermediate cases, the firm/owner decides with probability p and the
manager decides with probability 1− p.
Finally, the productivity of firm i ∈ [0, 1] is again
At (i) = ηAt−1 + ξθt (i)At−1
with θt (i) denoting the amount of effort invested by the firm’s owner for innovation.
24

Using the same expressions for pricing, the expected profits of the firm is a function of
its decentralization decision, p, and the level of productivity, At (i), is given by:
πt (pt (i) , At (i)) = δL (pt (i) + (1− pt (i))β)At (i) .
The “overload” faced by the owner is modeled with the following simple quadratic cost:
C (pt (i) , θt (i)) =1
2(pt (i) + θt (i))
2At−1,
where the presence of the term At−1 implies that these costs increase with the level of
productivity in the economy. This cost function captures, in a simple way, the issue of
overload; the marginal cost of either activity that the owner performance (monitoring
and innovation) is increasing in the amount of the other activity.
Using these expressions, the maximization problem of the owner of the firm becomes:
max{pt(i)∈[0,1],θt(i)≥0}
δL (pt (i) + (1− pt (i))β)¡ηAt−1 + ξθt (i)At−1
¢− 12(pt (i) + θt (i))
2At−1.
Now dividing by At−1 and noting that nothing depends on i, this maximization problem
can be written as
max{pt∈[0,1],θt≥0}
δL (pt + 1− ptβ) (η + ξθtat−1)−1
2(pt + θt)
2 .
Assuming that δLξ ≤ 1,the solution takes the following simple form. There existsthree thresholds (which are functions of the parameters)
ap=1 ≤ aθ=0 < ap=0
such that:
1. If at−1 ∈ [0, ap=1], then the optimal (equilibrium) organization involves:
p = 1
θ = 0
2. If at−1 ∈ [ap=1, aθ=0] , the optimal solution involves:
p =δLη (1− β)
at−1θ = 0
25

3. If at−1 ∈ [aθ=0,ap=0] , the optimal solution has
p =η (1− β)− βξat−1 (1− δLξ (1− β))
(1− β) ξat−1 (2− δLξ (1− β))
θ =βξat−1 − η (1− β) (1− δLξ (1− β))
(1− β) ξat−1 (2− δLξ (1− β))
where p decreases and θ increases with a.
4. If at−1 ∈ [ap=0, 1], the optimal solution has
p = 0
θ = δLξβ.
The most important implication of this characterization is that it leads to a pattern
of structural transformation in the internal organization of the firm as a function of the
stage of development (distance to frontier) in the economy. When a is low, the owner
delegates no authority to the manager (p = 1, which can also be interpreted as not hiring
a manager). She also chooses zero innovation effort, θ = 0. As a increases to an inter-
mediate range, there is some delegation (thus some change in the internal organization
of the firm), but still no innovation effort. As a increases further, a more interesting
configuration emerges, where there is substantial delegation of authority to the manager,
and the owner specializes in innovation. Finally, as the economy approaches the world
technology frontier (i.e., a high level of economic development), there is full delegation to
the manager, i.e., p = 0, and the amount of innovative effort by the owner is maximized.
This model therefore also illustrates how the process of development will lead to a
structural transformation, along the lines of Kuznets’ emphasis, affecting not only the
organization of markets, but also the internal organization of firms.
6 Distance to Frontier and Human Capital
The final application of our framework concerns the changing role of human capital
(and its composition) over the process of development. The role of human capital in the
process of technology adoption and economic convergence was first emphasized by Nelson
and Phelps (1966). Figure 3 above suggests that the role of (formal) education could
26

be quite different for economies close to the frontier as compared to those farther away
from the frontier. This idea is explored in greater detail in Vandenbussche, Aghion and
Meghir (2003), who provide a model where in the importance of secondary versus higher
education changes depending on the economy’s distance to the frontier. Vandenbussche,
Aghion and Meghir (2003) and Aghion et al. (2006) provide evidence consistent with
this notion.
Here, we illustrate related ideas using the framework develop above. Let us suppose
that there are two different kinds of human capital in the economy, general-purpose and
specific, and denote the average specific human capital of workers in the economy at
time t by st. This type of specific human capital may be acquired in schools, but it also
includes skills acquired on the job or through non-formal education (for example, in the
household). The average general-purpose human capital of the workforce, on the other
hand, is denoted by et. This type of human capital can only be acquired through formal
schooling.
Let us go back to equation (5) and modify such that for all i ∈ [0, 1], we have
At (i) = η (st, et) At−1 + γ (et)At−1 + εt (i) , (13)
where εt (i) is again a mean-zero term and η is increasing and continuously differentiable
in both of its arguments, and γ is increasing and continuously differentiable in et.
Equation (13) implies that while specific human capital is useful for adoption and use
of existing technologies, only general-purpose human capital, acquired through formal
schooling, is useful for innovation. This is clearly extreme, but captures the notion that
formal schooling becomes more important at later stages of development. Moreover, let
us assume that∂η (s, e)
∂s≥ ∂η (s, e)
∂efor all e, s ≥ 0. (14)
and that∂γ (0)
∂e>
∂η (s = 1, e = 0)
∂s. (15)
The first condition states that specific skills are more important for imitation than
general-purpose skills, whereas the second condition states that general-purpose skills
are sufficiently important for innovation.
27

Let us also assume that the representative worker has a limited amount of time, so
that
st + et ≤ 1,
and naturally, et, st ≥ 0. Condition (14) implies that when at−1 is low in the economy
is far from the frontier, the growth-maximizing strategy is to invest only in the specific
skills of workers. In contrast, as the economy approaches the world technology frontier,
(15) ensures that it becomes beneficial for the economy to invest in the general-purpose
human capital of the workers.
If workers make their human capital decisions facing prices that reflect their con-
tributions to growth, this will also be the equilibrium pattern of investment; formal
education in general-purpose human capital will increase as the economy develops and
approaches the world technology frontier. Therefore, this simple model provides another
instance of a possible structural transformation, this time in the composition of skills of
the workforce, going hand-in-hand with the process of economic development.
7 Conclusion
The literatures on economic growth and economic development emphasize different as-
pects of the process of development. While models of economic growth focus on tech-
nological change, capital accumulation and the relatively steady process of economic
growth, much of development economics, building on the seminal work by Kuznets
(1966), emphasizes the structural transformations taking place in the process of eco-
nomic development.
In this paper, we presented a simple model that offers a unified framework for the
analysis of economic growth and economic development. In our model, the transforma-
tion of production relationships goes hand-in-hand with economic growth. The main
driving force of this pattern is that economic growth in relatively backward economies is
associated with adoption and imitation of and investment in existing technologies, while
growth in advanced (frontier) economies is driven by innovation. Consequently, the
process of economic development takes the form of a transformation of economic rela-
tionships in many spheres. The framework we present, though simple, enables us to offer
a number of new ideas about the relationship between the organization of production,
28

institutions, economic growth and economic development.
Using this basic framework, we illustrated how the organization of production, the
extent of creative distraction and entry, the extent of vertical integration, the extent
of delegation of authority to managers and the composition of human capital become
transformed over the process of economic development.
We also used this framework to critically discuss the concept of “appropriate institu-
tions/organizations.” The notion of appropriate institutions implies that the equilibrium
organization of production relationships and broader institutions may differ with this
stage of development. Our framework shows how the equilibrium process of economic de-
velopment might take the form of the economy shifting from “institutions/organizations”
appropriate for the early stages of development (which may be non-standard in many
ways) to different (perhaps more standard) institutions and organizations as the economy
develops.
Our framework, however, also highlights that attempts to impose such “appropriate
institutions” from the outside can turn them into “inappropriate institutions,” which
may have quite detrimental effect on the growth performance of less-developed countries.
In particular, attempts to encourage “appropriate institutions” and policies at early
stages of development might at best lead to temporary gains in growth, but will create
the risk of the economy becoming stuck in a non-convergence trap because of the powerful
constituencies that these institutions and policies create.
The framework presented in this paper is purposefully simple, so that it emphasizes
the main trade-offs and can be applied in a variety of different settings. This framework
can be develop in many ways both theoretically and also to bring it closer to data
area. In current work, we are investigating some of the empirical implications of this
framework for changes in the internal organization of the firm, but much else needs to
be done. We believe that further study of models combining insights from economic
growth and economic development and testing their implications with micro data our
exciting in important areas for future work.
29

References
[1] Acemoglu, Daron, Aghion, Philippe, and Fabrizio Zilibotti (2002), “Distance to
Frontier, Selection, and Economic Growth”, NBER Working Paper No 9066
[2] Acemoglu, Daron, Aghion, Philippe, Griffith, Rachel and Fabrizio Zilibotti (2004)
“Vertical Integration and Technology: Theory and Evidence” IFS Working Papers,
W04/34
[3] Acemoglu, Daron, Aghion, Philippe, and Fabrizio Zilibotti (2004): “Vertical Inte-
gration and Distance to Frontier”, Journal of the European Economic Association,
Papers and Proceedings.
[4] Acemoglu, Daron and Veronica Guerrieri (2005) “Capital Deepening and Non-
Balanced Growth” MIT mimeo.
[5] Acemoglu, Daron, Simon Johnson and James A. Robinson (2005) “Institutions as
a Fundamental Cause of Development,” in Handbook of Economic Growth, edited
by Philippe Aghion and Steven Durlauf, Amsterdam; North-Holland.
[6] Aghion, Philippe; Boustan, Leah; Hoxby, Caroline and Jerome Vandenbussche
(2005), “Exploiting States’ Mistakes to Evaluate the Impact of Higher Education
on Growth”, mimeo Harvard
[7] Aghion, Philippe, and Jean Tirole (1997): “Formal and Real Authority in Organi-
zations”, Journal of Political Economy, 105, 129.
[8] Barro, Robert and Jong-Wha Lee (2000),“International Data on Educational At-
tainment: Updates and Implications”, Working Paper No 42, Center for Interna-
tional Development at Harvard University.
[9] Barro, Robert and Xavier Sala-i-Martin (2004), Economic Growth, McGraw Hill,
New York.
[10] Baumol, William J. (1967), “Macroeconomics of Unbalanced Growth: The
Anatomy of Urban Crisis”, American Economic Review, LVII, 415-426.
30

[11] Denison, Edward F. (1974), “Accounting for United States Economic Growth, 1929-
1969” Washington, DC: Brookings Institution.
[12] Djankov, Simeon, Rafael La Porta, Florencio Lopez-de-Silanes, and Andrei Shleifer
(2002). “The Regulation of Entry.” Quarterly Journal of Economics, 117, 1—38.
[13] Evans, Peter, (1998), Embedded Autonomy: States and Industrial Transformation,
Princeton University Press.
[14] Frankel, Jeffrey and David Romer, (1999) “Does Trade Cause Growth?” American
Economic Review, vol. 89, pp. 379-399.
[15] Galor, Oded (2005) “From Stagnation to Growth: Unified Growth Theory,” Hand-
book of Economic Growth (forthcoming).
[16] Galor, Oded and Weil, David (2000) “Population, Technology, and Growth: From
Malthusian Stagnation to the Demographic Transition and Beyond,” The American
Economic Review, 90(4), 806-828.
[17] Gerschenkron, Alexander, (1962) Economic Backwardness in Historical Perspective,
Harvard University Press, Cambridge MA.
[18] Grossman, Sandford and Oliver Hart (1986): ”The Costs and Benefits of Ownership:
A Theory of Vertical and Lateral Integration,” Journal of Political Economy, 94,
691-719.
[19] Hansen, Gary D. and Edward C. Prescott (2002) “Malthus to Solow,” American
Economic Review, 92(4), 1205-1217.
[20] Hoshi, Takeo and Anil Kashyap (2001)Corporate financing and governance in Japan
: the road to the future, Cambridge, Massachusetts, MIT Press.
[21] Johnson, Chalmers, (1982), MITI and the Japanese Miracle: The Growth of Indus-
trial Policy, 1925-75, Stanford University Press.
31

[22] Kaldor, Nicholas (1963), “Capital Accumulation and Economic Growth”, in
Friedrich A. Lutz and Douglas C. Hague, eds., Proceedings of a Conference Held
by the International Economics Association, London, Macmillan.
[23] Kang, David, (2002) Crony Capitalism: Corruption and Development and South
Korea and the Philippines, Cambridge, Cambridge University Press.
[24] Kongsamut, Piyabha , Sergio Rebelo and Danyang Xie (2001), “Beyond Balanced
Growth”, Review of Economic Studies, LXVIII, 869-882.
[25] Kuznets, Simon (1957), “Quantitative Aspects of the Economic Growth of Nations:
II, Industrial Distribution of National Product and Labour Forcce”, Economic De-
velopment and Cultural Change, V Supplement.
[26] Kuznets, Simon (1966), Modern Economic Growth: Rate, Structure and Spread,
Yale University Press, New Haven.
[27] Kuznets, Simon (1973), “Modern Economic Growth: Findings and Reflections”,
American Economic Review, LXIII, 829-846.
[28] Laitner, John (2000), “Structural Change and Economic Growth”, Review of Eco-
nomic Studies, LXVII, 545-561.
[29] Nelson, Richard and Edmund Phelps (1966), “Investment in Humans, Technolog-
ical Diffusion, and Economic Growth”, American Economic Review, Papers and
Proceedings, 61, 69-75.
[30] Ngai Rachel and Christopher Pissarides (2005), “Structural Change in a Multi-
Sector Model of Growth”, mimeo.
[31] North, Douglass C. (1990) Institutions, institutional change and economic perfor-
mance, New York; Cambridge University Press.
[32] Vandenbussche, Jerome; Aghion, Philippe; and Costas Meghir (2004), “Growth,
Distance to Frontier and the Composition of Human Capital”, mimeo Harvard-
UCL.
32

[33] Vogel, Ezra F. (1991) The Four Little Dragons: the Spread of Industrialization in
East Asia, Cambridge, MA, Harvard University press.
[34] Wade, Robert (1990) Governing the Market: Economic Theory and the Role of
Government in East Asian Industrialization, Princeton, Princeton University Press.
33

1 Introduction
The literatures on economic growth and economic development have exactly the same
focus: how does an economy grow and develop from relative poverty to prosperity?
Despite their obvious unity of purpose, the two literatures have often diverged in their
interpretations and approaches. Growth theory, building on the growth experience of
more advanced nations, strives to capture the orderly process of economic growth, most
famously captured by the Kaldor facts,1 and models a relatively constant and sustained
process of economic growth. Development economics, on the other hand, in many ways
starts from the important observations of Kuznets (1957, 1966, 1973), which highlighted
the process of structural transformation taking place simultaneously with economic de-
velopment. Kuznets emphasized how development went hand in hand with changes
in the sectoral composition of output, transformation of production relationships, ur-
banization, growing importance of skills and perhaps even changes in social relation-
ships. These powerful, and largely accurate, observations have led many development
economists to focus on what is different–and thus what needs to be changed–in less-
developed economies. It is in fact possible to see this Kuznetsian unified theme as the
foundation of both the development economics of the 1950s and 1960s and the new
empirical development economics of the last decade or so.
In this paper, we offer a simple framework that unifies these two disparate approaches
to the process of development. The basic idea of our approach, which builds on our ear-
lier work (Acemoglu, Aghion and Zilibotti, 2006, from now on AAZ), is that economic
growth in relatively backward economies takes the form of adoption and imitation of
existing technologies and capital accumulation in already existing lines of business. In
contrast, in more advanced economies, there is limited potential for growth by simply
adopting existing technologies, so much of growth is driven by innovation. Imitation
and innovation require different organizational forms, different relations between entre-
preneurs and credit markets, different processes of selection of entrepreneurs and firms.
In our model, we capture the stage of development by the distance of an economy to
1Kaldor facts refer to the relative constancy of the growth rate, the capital-output ratio, the shareof capital income in GDP and the real interest rate in the process of economic growth of many nationsover the past hundred years (see Kaldor, 1963, Denison, 1974, Barro and Sala-i-Martin, 2004).
1

the world technological frontier. Consequently, the model predicts a close link between
distance to frontier and equilibrium organizational forms, equilibrium market relations
and consequently, equilibrium institutions.2
For example, in our baseline model, which builds on AAZ, the equilibrium could
take an investment-based or innovation-based form. Farther from the world technology
frontier, economies choose the investment-based regime, which enables them to grow
faster. The investment-based regime is associated with less selection, longer-term re-
lationships and in many ways less competition. As they approach the frontier, many
economies will change their organizational forms and market relations to transition to
an innovation-based regime, with more competitive relationships, ensuring better selec-
tion of entrepreneurs and firms. Interestingly, however, the Kuznetsian transformation
is not inevitable. Economies may get stuck in an investment-based regime, thus stop
converging to the world frontier, even though a switch to the innovation-based regime
would have generated convergence.
The ideas captured by this framework build not only on Kuznets, but also on Ger-
schenkron’s famous essay Economic Backwardness in Historical Perspective (1962). Ger-
schenkron (1962, p. 7) argued:
“... in a number of important historical instances industrialization processes,
when launched at length in a backward country, showed considerable differ-
ences with more advanced countries, not only with regard to the speed of
development (the rate of industrial growth) but also with regards to the pro-
ductive and organizational structures of industry... these differences in the
speed and character of industrial development were to a considerable extent
the result of application of institutional instruments for which there was little
or no counterpart in an established industrial country.”
Examples of rapid growth with a different set of economic and contractual arrange-
ments (and perhaps “institutions”), than the frontier economies include the late indus-
2Here “institutions” are used to cover a variety of different economic, social and legal arrangementsand modes of organizations, partly emerging from the interaction of agents and party resulting fromthe political process. Thus the notion of institutions is similar to that of North (1990), and broaderthan that used in Acemoglu, Johnson and Robinson (2005).
2

trialization experiences of Germany, Italy and Russia. They also include the import-
substitution growth strategies of many Latin American countries during the 1950s and
60s, and the growth strategies of many Asian economies, such as Korea and Japan, during
the postwar period, which relied on large firms, and long-term bank-firm and employee-
firm relationships. These organizations contrast in many ways with the equilibrium
organizations observed in the United States or other advanced economies. The frame-
work highlights that there are natural reasons for these types of different organizations
to emerge and then to become transformed in the process of economic development. It
also suggests how these different organizations may become a barrier to growth if they
persist, rather than change in the process of economic development as envisioned by
Kuznets’ structural transformation.
There are two important points to note in this context:
1. The alternative economic arrangements, organizations and perhaps institutions,
were not necessarily imposed from the outside, but emerged as equilibria in these
late-industrializing countries. In the same way, the differences in sectoral compo-
sition, urbanization, credit relations that we observe in less-developed countries
today are equilibrium phenomena. They may or may not be efficient. What is im-
portant is that the logic of the process of economic growth leads to the emergence
of different equilibrium organizations at different stages of development.
2. As economies grow, these arrangements have a tendency to change, thus echo-
ing Kuznets’ insights that the process of economic development corresponds to
a process of structural transformation of the economy. However, if they fail to
change, they would condemn the economy toa non-convergence trap.3
These two points also suggest a new perspective on the issue of appropriate insti-
tutions. Countries far from the frontier may develop organizational forms (or more
broadly, “institutions”) that are appropriate for their own conditions, and the fact that
these arrangements are different from those in frontier counties does not necessarily
3We refer to “non-convergence traps” because an economy in such a trap does not stop growing, butstops converging to the world technology frontier at an income level below those of advanced/frontiereconomies.
3

mean that they are inefficient or a barrier to economic growth. In fact, in some situa-
tions, as emphasized by Gerschenkron, such appropriate and non-standard institutions
might encourage growth at the early stages of development. However, these appropriate
institutions always come with the risk of quickly turning into inappropriate institutions,
and preventing further economic progress and convergence in relatively less-developed
economies. It is therefore dangerous to encourage non-standard, non-competitive prac-
tices in the name of appropriate institutions, since these do contain the seeds of their
own destruction and the capacity to become the inappropriate institutions of the future,
blocking economic development.
The current paper illustrates these issues using a minimalist model, which can be
used for a variety of different applications. Before doing so, in Section 2, we provide some
cross-country evidence consistent with the notion that various economic arrangements
have different impacts on economic growth at different stages of economic development.
Finally, it is useful to note that ours is not the only approach that attempts to unify
the processes of economic growth and economic development. Two alternatives are par-
ticularly noteworthy. The first approach comes from models that reconcile aggregate
balanced growth with sectoral non-balanced growth (i.e., changes in the sectoral compo-
sition of output). This approach is taken by, among others, Laitner (2000), Kongsamut,
Rebelo and Xie (2001), Acemoglu and Guerrieri (2005) and Ngai and Pissarides (2005)–
see also Baumol (1967). The second approach comes from models of transition from a
Malthusian growth regime with high population growth and low or no growth in income
per capita to a high productivity growth regime associated with a demographic tran-
sition (see, for example, Galor and Weil, 2000, Hansen and Prescott, 2002, or Galor,
2005). Both of these differ from the approach in this paper because they either focus on
the sectoral composition of output and the reconciliation of balanced and non-balanced
growth at different levels of aggregation, or on the changes in the population dynamics
and the associated changes in growth. In contrast, our purpose is to build a simple
model that can be used to understand changes in various different facets of economic re-
lationships in the process of economic development in line with Kuznets’ insights about
structural transformation associated with economic development. In doing this, we also
want to emphasize how equilibrium appropriate institutions emerge at different stages of
4
development and then become transformed, and how their failure to become transformed
may lead to non-convergence traps.
The rest of the paper is organized as follows. Section 2 provides some motivating
cross-country evidence. Section 3 provides a simple framework for modeling the process
of growth based on imitation and innovation. In Section 4, we use this basic model
to show how the process of selection of entrepreneurs and the relationship between
entrepreneurs and society change in the process of economic development, and how
the failure of some of these arrangements to change may lead to a non-convergence
trap for the economy (where “inappropriate institutions” act as a barrier for further
convergence). Section 5 shows how similar ideas can be applied to show the process of
economic development affects the internal organization of the firm. Section 6 applies the
same ideas to the role of skills and education in the process of economic development.
Section 7 concludes.
2 Motivating Empirical Evidence
We now present some cross-country empirical evidence to motivate our analysis. The
purpose of this empirical evidence is not to establish causal effects, but to give a sense
that various important economic arrangements appear to have differential relationships
with growth at different stages of development. In particular we focus on (i) barriers to
entry, (ii) trade openness and (iii) education.
Figures 1a and 1b plot the relationship between growth and initial distance to frontier
(GDP per capita relative to the U.S.) in a sample of non-OECD, non-socialist countries
separately for those with high and low degree of “non-competitive” policies/barriers
to entry. Barriers are measured by the number of procedures necessary for opening a
new business (Djankov, La Porta, Lopez-de-Silanes, and Shleifer, 2002). The sample of
countries includes all non-OECD (including those that joined the OECD in the 1990s,
such as Korea and Mexico) and all non-socialist countries for which we have data. We
split the sample into low-barrier and high-barrier countries according to the “number of
procedures to open a new business” variable from Djankov, La Porta, Lopez-de-Silanes,
and Shleifer (2002). Countries are classified into the “low-barrier” group if the number of
procedures is smaller or equal to 10 and into the “high-barriers” group otherwise. This
5

implies that 20 countries are classified as high barrier and 23 countries as low barrier.4
The figures show growth in per capita income between 1965 and 1995 plotted against
distance to frontier in 1965, where we also control for a dummy for sub-Saharan African
countries which have much lower growth rates. While there is a strong negative rela-
tionship between growth and distance to frontier for countries with high barriers, the
relationship is much weaker for countries with low barriers. In other words, high-barrier
countries do relatively well when they are far from the frontier, but much worse near the
frontier, while low-barrier countries grow almost equally successfully near or far from
the frontier.
To see this more clearly, consider two separate regressions of country growth rates
between 1965 and 1995 on the sub-Saharan Africa dummy and distance to frontier in
1965 in the samples of low-barrier and high-barrier countries. For low-barrier countries,
the coefficient on distance to frontier is -0.028 (s.e.=0.029), thus highly insignificant
(shown in Figure 1b). The same coefficient is -0.078 (s.e.=0.028) in the sample of high-
barrier countries, which is significant at the 5 percent (shown in Figure 1a). The vertical
axes in the figures show country growth rates after the constant and the effect of the
sub-Saharan Africa dummy, estimated in the corresponding multivariate regression, are
taken out.
This pattern is highly suggestive that the impact of non-competitive practices asso-
ciated with entry barriers is very different depending on the stage of development. The
evidence does not necessarily imply that entry barriers are conducive to fast growth,
but suggests that they may have less harmful effects on economic growth for countries
farther from the frontier.
FIGURE 1
Figures 1d and 1e show the same pattern when we look at growth in 5-year intervals
and control for time effects and country fixed effects. These figures show that near the
frontier a country with high barriers grows less than its “usual” growth rate. Therefore,
as implied by our model, countries with high barriers slow down more significantly as
they approach the frontier. With country fixed effects and time effects, the coefficient
4Further details are provided in AAZ.
6

on the distance to frontier in the low-barrier sample is -0.039 (s.e.= 0.037), while in the
high-barrier sample it is -0.109 (s.e.= 0.047). We also obtain similar results in fixed
effect regressions when distance to frontier is instrumented by its past values in order
to avoid biases resulting from the fact that distance to frontier is correlated with lags of
the dependent variable.
A potential problem with the results in Figures 1a-1d is that entry barriers are both
endogenous and measured towards the end of our sample. As an alternative, Figures 2a-
2d show similar results exploiting “exogenous” differences in openness to international
trade (another measure of competition policy). Here we split the sample according to the
openness measure constructed by Frankel and Romer (1999), which predicts openness
from a standard “gravity equation,” as a function of differences in population, land
area, proximity and common borders to other countries, and whether or not a country is
landlocked. In the cross-sectional regressions, the coefficient on the distance to frontier
for the “closed” economies is -0.049 (s.e.= 0.021), while for the “open” economies, it is
-0.041 (s.e.= 0.029). In the fixed effect regressions, the coefficient for closed economies
is -0.197 (s.e.= 0.051), while for open economies, it is -0.087 (s.e.= 0.032).
FIGURE 2
The contrast between “open” and “closed” economies is somewhat weaker in the
cross-section than was the case in Figures 1a and 1b, but the fixed effect specifications
show a significantly stronger relationship between distance to frontier and growth for
closed economies than for open economies. In conclusion, there is some evidence that
openness (or at least its exogenous component) has a positive effect on growth, but
this effect becomes particularly important for economies that are relatively close to the
technology frontier.
Another dimension that will be explored in our analysis is the relationship between
human capital accumulation and distance to frontier. For this reason, Figures 3a-d per-
form the same exercise, splitting the sample by human capital (total years of schooling
in 1965). Here, the analysis intends to detect non-linear effects of education and educa-
tional policies. The results show that skills and human capital matter more nearer the
frontier: there is a more negative relationship between growth and distance to frontier
7

for low-human capital than for high-human capital countries. In the cross-sectional re-
gressions, the coefficient on the distance to frontier for low-education countries is -0.122
(s.e.= 0.049), while for high-education countries, it is -0.063 (s.e.= 0.025). In the fixed
effect regressions, the coefficient for the low-education countries is -0.228 (s.e.= 0.066)
and for the high-education countries, it is -0.051 (s.e.= 0.031).
FIGURE 3
3 Baseline Model of Imitation and Innovation
Throughout, our purpose is to provide a simple framework that can be used in a variety
of applications. This basic model is a simplified version of the model used in AAZ,
but we make a number of stronger assumptions to simplify the exposition and refer the
reader to that paper for some of the details that are not essential for the exposition.
Here we describe the production side of the economy, which consists of a unique
final good, always taken as the numéraire. This good is produced competitively using a
continuum of intermediate inputs according to:
yt =
Z 1
0
(At (i))1−αxt (i)
α di, (1)
where At (i) is the productivity of the intermediate good in intermediate sector i at time
t, xt(i) is the amount of intermediate good i used in the production of the final good at
time t, and α ∈ (0, 1).Each intermediate good is produced by a monopolist i ∈ [0, 1] at a unit marginal
cost in terms of the unique final good. The monopolist faces a competitive fringe of
imitators that can copy its technology and also produce an identical intermediate good
with productivity At (i), but will do so more expensively. In particular, the competitive
fringe can produce each intermediate good at the cost of χ > 1 units of final good. The
existence of this competitive fringe forces the monopolist to charge a limit price:
pt (i) = χ > 1. (2)
Naturally, this limit price configuration will be an equilibrium when χ is not so high
that the monopolist prefers to set a lower unconstrained monopoly price. The condition
8

for this is simply
χ ≤ 1/α,
which we assume throughout.
We think of the parameter χ as capturing both technological factors and government
regulation regarding competitive policy. A higher χ corresponds to a less competitive
market.
Given the demand implied by the final goods technology in (1) and the equilibrium
limit price in (2), equilibrium monopoly profits are simply:
πt (i) = δAt (i) , where δ ≡ (χ− 1)χ−1
1−α . (3)
In this expression, δ is a measure of the extent of monopoly power. In particular it can
be verified that δ is increasing in χ for all χ ≤ 1/α.Our focus is with the processes of economic growth and economic development,
which, in this model, will be driven by technological progress, that is, by increases
in At (i). We will assume that each monopolist i ∈ [0, 1] can increase its At (i) by
two complementary processes: (i) imitation (adoption of existing technologies); and (ii)
innovation (discovery of new technologies). All the key results of the framework will
rely on the feature that different economic arrangements will lead to different amounts
of imitation and innovation.
To prepare for this point, let us define the average productivity of the economy in
question at date t as:
At ≡Z 1
0
At (i) di.
Let At, on the other hand, denote the the productivity at the world frontier. Naturally,
At ≤ At for all t. Throughout the paper with simplified the analysis by assuming that
the world technology frontier, At, grows at the constant rate g (see AAZ), i.e.,
At = (1 + g) At−1. (4)
We assume that the process of imitation and innovation leads to the following law of
motion of each sector’s productivity:
At (i) = ηAt−1 + γAt−1 + εt (i) , (5)
9

where η > 0 and γ > 0, and εt (i) is a mean-zero run than variable, capturing the feature
that there may be differences in innovation performance across sectors.
In equation (5), ηAt−1 stands for advances in productivity coming from adoption
of technologies from the frontier (and thus depends on the productivity level of the
frontier, At−1), and γAt−1 stands for the component of productivity growth coming
from innovation (building on the existing knowledge stock at time t− 1, At−1).
Finally let us define
at ≡At
At
the (inverse) measure of the country’s distance to the technological frontier at date t.
Now, we can integrate (5) over i ∈ [0, 1], use the fact that εt (i) has mean zero, divideboth sides by At and use (4) to obtain a simple linear relationship between a country’s
distance to frontier at at date t and the distance to frontier at−1 at date t− 1:
at =1
1 + g(η + γat−1). (6)
Though simple, this equation encapsulates a number of important points. First,
it shows how the dual process of imitation and innovation may lead to a process of
convergence. In particular, as long as γ > 1 + g, equation (6) implies that at will
eventually converge to 1. Second, the equation also shows that the relative importances
of imitation and innovation will depend on the distance to the frontier of the economy
in question. In particular when at is large (meaning the country is close to the frontier),
γ–thus innovation–matters more for growth. In contrast when at is small (meaning the
country is farther from the frontier), η–thus imitation–is relatively more important.
To obtain further insights from this framework, we need to endogenize η and γ, which
is what we turn to next.
4 Distance to Frontier and Selection
4.1 Investment-Based and Innovation-Based Growth
In AAZ, the parameters η and γ are modeled as functions of the investments undertaken
by the entrepreneurs and the contractual arrangement between firms and entrepreneurs.
There are two types of entrepreneurs: high- and low-skill entrepreneurs. When an en-
trepreneur starts a business, her ability is unknown, and is revealed over time through
10

her subsequent performance. The economy may involve long-term relationships with the
entrepreneurs (“long-term contracts”, R = 1), meaning that entrepreneurs keep their job
even if they are revealed to be low skill. Alternatively, the process of “creative destruc-
tion” may replace low-skill entrepreneurs by new entrepreneurs (“short-term contracts”,
R = 0). Long-term contracts are valuable for investments since the entrepreneurs have
incentives to use retained earnings to finance greater investments. If the underlying
economy features credit market imperfections, long-term contracts might be useful in
mitigating the underinvestment resulting from these credit market imperfections. How-
ever, with long-term contracts, many of the active entrepreneurs of the society will have
low skills and will be less innovative.
The crucial assumption in AAZ is that high skills matter more for innovation than
imitation. This is a natural assumption, and in AAZ, we provided some regression evi-
dence consistent with the notion that ability and skills are more important for innovation
(and nearer the technology frontier).
Here, rather than repeat the derivation and the details of the analysis in AAZ, we
present a simple reduced-form analysis. In particular, let us assume that the equation
for the law of motion of the distance the frontier, (6), takes the form
at =
⎧⎨⎩11+g(η + γat−1) if Rt = 1
11+g(η + γat−1) if Rt = 0
(7)
as a function of the contractual/organizational decision at time t, Rt ∈ {0, 1}. In thisequation we assume that
η > η and γ < γ < 1 + g. (8)
The first part of this assumption follows immediately from the notion that high-skill
entrepreneurs are better at innovation.
The second part requires more explanation. We naturally expect high-skill entre-
preneurs to be better at imitation as well. In that case, there would be no trade-off
and low-skill entrepreneurs would always be replaced by market forces (unless they had
some other, political or economic advantage). However, the use of retained earnings
to finance investments, mentioned above, means that incumbent entrepreneurs have an
advantage relative to young entrepreneurs. If the importance of skills in imitation is
11

limited, then we can have a situation where the overall effect of retaining an incum-
bent low-skill entrepreneur is to increase the rate of imitation (the rate of investment in
existing technologies), and thus γ < γ. This is what equation (8) introduces.
Finally, the last part of Assumption (8), γ < 1 + g, ensures that there are always
“convergence” dynamics (i.e., no instability in the dynamical behavior of at).
Assumption (8) also explains why we refer to Rt = 0 as the innovation-based regime
(since it encourages innovation by replacing low-skill entrepreneurs), and to Rt = 1 as
the investment-based regime (since it makes use of the retained earnings of incumbent
entrepreneurs to increase investment in existing technologies and make use of imitation
rather than emphasizing innovation).
Figure 4 draws equation (7), under the further assumption that
g = η + γ − 1,
which ensures that an economy in the innovation-based regime, R = 1, at the frontier
grows exactly at the rate g. In other words, this assumption implicitly endogenizes the
world frontier growth rate as coming from innovation-based growth.
FIGURE 4
Figure 4 visually shows that the economy with long-term contracts (R = 1) achieves
greater growth (higher level of at for given at−1) through the investments/imitation
channel, but lower growth through the innovation channel. The figure also shows that
which regime maximizes the growth rate of the economy depends on the level of at−1.
In particular, there exists some level a ∈ (0, 1) of the distance the frontier, such thatwhen at−1 < a, the investment-based strategy, R = 1 leads to greater growth, and when
at−1 > a, the innovation-based strategy, R = 0, achieves higher growth.
It is straightforward to verify from (7) that a is given by the intersection of the R = 0
and R = 1 lines, thus by:
a ≡η − η
γ − γ. (9)
The growth-maximizing sequence starts with the investment-based strategy and then
switches to an innovation-based strategy. In the investment-based regime, incumbent
entrepreneurs are sheltered from the competition of younger ones and this may enable
12

the economy to finance greater investments out of the retained earnings of incumbent
entrepreneurs. In contrast, in the innovation-based regime, there is greater selection of
entrepreneurs (and more generally of firms) and the emphasis is on maximizing innova-
tion at the expense of investment.
Figure 4 describes the law of motion of technology in an economy as a function of the
organization of firms (markets), captured by R. It does not specify what the equilibrium
sequence of {Rt}∞t=0 is. To determine this equilibrium sequence, we need to specify the
organization of the credit market, incentives of entrepreneurs, the amount of retained
earnings and the behavior of the consumers in the economy. Here our purpose is not to
provide an exhaustive analysis, but to communicate the main ideas. For this reason, we
will refer the reader to the analysis in AAZ, and simply explain a number of possibilities.
4.2 Equilibrium Patterns
There are four interesting configurations to consider (see AAZ for the conditions under
which each of these configurations will emerge as the equilibrium):
1. Growth-maximizing equilibrium: the first and the most obvious possibility is an
equilibrium that is growth maximizing. In particular, if markets and entrepreneurs
are able to solve the agency problems, have the right decision-making horizon and
are able to internalize the pecuniary and non-pecuniary externalities, we would
obtain an efficient equilibrium. This equilibrium will take a simple form:
Rt =
⎧⎨⎩ 1 if at−1 < a
0 if at−1 ≥ a
so that the economy achieves the upper envelope of the two lines in Figure 4. In
this case, there is no possibility of outside intervention to increase the growth rate
of the economy.5 Moreover, an economy starting with a0 < 1 always achieves a
growth rate greater than g, and will ultimately converge to the world technol-
ogy frontier, i.e., at = 1. In this growth-maximizing equilibrium, the economy
5As discussed in AAZ, growth maximization may not coincide with welfare maximization. Herewe ignore this issue and refer the reader once again to AAZ for the characterization of the welfare-maximizing equilibrium.
13

first starts with a particular set of organizations/institutions, corresponding to
R = 1. Then, in line with Kuznets’ vision of a structural transformation as the
economy grows, the economy switches from R = 1 to R = 0. In our simple
economy, this structural transformation takes the form of long-term relationships
disappearing and being replaced by shorter-term relationships, by greater compe-
tition among entrepreneurs and firms, and by better selection of entrepreneurs.
Therefore, even in this growth-maximizing equilibrium there is a notion of “ap-
propriate organizations/institutions”–the economy with at−1 < a chooses the
appropriate organization of firms for growth maximization. However, importantly,
this is not the outcome of some outside intervention; the “appropriate organiza-
tions/institutions” emerge as the decentralized equilibrium of the economy.
2. Underinvestment equilibrium: the second potential equilibrium configuration in-
volves the following equilibrium organizational form:
Rt =
⎧⎨⎩ 1 if at−1 < ar (δ)
0 if at−1 ≥ ar (δ)
where ar (δ) < a. Figure 5 depicts this visually, with the thick black lines corre-
sponding to the equilibrium law of motion of the distance the frontier, a. This
equilibrium is referred to as the “underinvestment equilibrium” because for a ∈(ar (δ) , a), the economy can reach a higher growth rate (as shown in the figure)
by choosing Rt = 0, and this would correspond to a higher investment level by
incumbent entrepreneurs that have more retained earnings to undertake greater
investments. AAZ show why this particular configuration can arise as equilibrium.
The main reason is that technological progress, i.e., an increase in at, creates a pos-
itive externality on consumers, which is not internalized by the monopolist–this is
the usual appropriability effect present in all monopolistic competition models. As
a result, there is a tendency for underinvestment in equilibrium. Since Rt = 0 in-
volves greater investments out of retained earnings, there is a natural bias against
Rt = 0 and the investment-based regime.
The most notable feature is that though equilibrium is different from the previous
case, it again follows the sequence of R = 1 followed by a structural transformation
14

and a switch to greater competition among and selection of entrepreneurs with the
innovation-based regime. Therefore, this equilibrium also exhibits the feature that
the process of growth and economic development is associated with structural
transformation. Moreover, the economy still ultimately converges to the world
technology frontier, i.e., at = 1 is reached as t → ∞. The only difference isthat the structural transformation from R = 1 to R = 0 happens too soon at
at−1 = ar (δ) rather than at a.
Consequently, in this case, a temporary government intervention may increase the
growth rate of the economy. The temporary aspect is important here, since the best
that the government can do is to increase the growth rate while a ∈ (ar (δ) , a). Howcan the government achieve this? Subsidies to investment would be one possibility.
AAZ show that the degree of competition in the product market also has an indirect
effect on the equilibrium, as emphasized by the notation ar (δ). In particular, a
higher level of δ, which corresponds to lower competition in the product market
(i.e., higher χ), will increase ar (δ), and thus may close the gap between ar (δ) and
a. This may be related to why some less developed economies support monopolies
and the effect of entry barriers is different at different stages of development as
shown in Section 2. Nevertheless, it has to be noted that reducing competition will
create other, static distortions (because of higher markups). Moreover and more
importantly, we will see in the next two configurations that reducing competition
can have much more disastrous effects for economic growth.
FIGURE 5
3. Sclerotic equilibrium: the third possibility a sclerotic in which ar (δ) > a, so that
incumbent low-skill, low-productivity firms survive even when they are damaging
to growth. In AAZ, we show why this can happen: the retained earnings of incum-
bent entrepreneurs, which was useful in relaxing credit constraints, also creates a
shield protecting them against the competition of more productive young entre-
preneurs. Which effect dominates and whether we are in the underinvestment
or the sclerotic equilibrium depends on parameter values. In particular, as the
above discussion suggests, ar (δ) is increasing in δ, so there exists a level of δ, δ,
15

such that if δ > δ, incumbent entrepreneurs have so much monopoly power and
retained earnings that they can protect themselves against young entrepreneurs.
The resulting pattern is drawn in Figure 6a. Now the economy fails to achieve the
maximum growth rate for a range of values of a such that a ∈ (a, ar (δ)). In thisrange, the innovation-based regime would be growth-maximizing, but the economy
is stuck with the investment-based regime because of the retained earnings and the
power of the incumbents.
Nevertheless, as shown in Figure 6a, this economy also follows the pattern of
starting with a different set organizations, represented by R = 1, and then, as
envisaged by Kuznets, switching to a different set of arrangements, R = 0. Like
the previous two equilibria, this equilibrium also features convergence to the world
technology frontier, i.e., to a = 1. Therefore, this economy also starts with different
“appropriate” institutions and then these institutions and arrangements become
transformed in the process of economic growth, making way to the innovation-
based regime, which ensures that the economy converges to the world technology
frontier. Nevertheless, this equilibrium configuration also shows that there will be
a range, precisely a ∈ (a, ar (δ)), where these alternative arrangements, thoughthey may appear “appropriate,” are in fact detrimental to economic growth.
4. Non-convergence trap equilibrium: the fourth possibility is related to the third one
and also involves ar (δ) > a. However, now the gap between ar (δ) and a is even
larger as depicted in Figure 6b, and includes the level of a, atrap, such that
atrap ≡η
1 + g − γ.
Inspection of (7) will immediately reveal that if at−1 = atrap and Rt = 1, the econ-
omy will remain at atrap. Therefore, in this case the protection of incumbent firms
(with their stock of retained earnings) not only retards growth for a temporary
interval, but pushes the economy into a non-convergence trap. In particular, this
is the only equilibrium pattern in which the economy fails to converge to the fron-
tier; with the investment-based regime, R = 1, the economy does not grow beyond
atrap, and at this distance to frontier, the equilibrium keeps choosing R = 1.
16

This equilibrium therefore illustrates the most dangerous scenario, that of non-
convergence. Encouraging investment-based growth, by supporting existing, in-
cumbent firms, may appear as “appropriate policy”, but in fact it condemns the
economy to non-convergence. This is also the only case in which the Kuznetsian
structural transformation does not occur because the economy remains trapped.
In many ways, this is in line with Kuznets’ vision; the resulting economy is an
underdeveloped one, unable to realize the structural transformation necessary for
the process of economic development.
FIGURE 6
4.3 Policy, Political Economy and Inappropriate Institutions
The above discussion highlighted how the equilibrium pattern of economic arrangements
may involve the organization of the economy in non-standard ways (long-term contracts,
limited competition etc.), and the process of economic growth brings the structural
transformation of these arrangements. It also highlighted how certain policies, such
as reducing product market competition, may appear attractive as a way of increasing
growth temporarily, but can quickly turn into inappropriate institutions, causing the
economy to become trapped and stop converging to the world technology frontier.
In fact, once the analysis is expanded to incorporate political economy features, where
incumbent firms can lobby to influence equilibrium policies, the danger of appropriate
institutions turning into inappropriate institutions increases significantly. For exam-
ple, under the plausible assumption that economic power can buy political power, once
the economy adopts less competitive markets or subsidies to investment, encouraging
investment-based growth, these policies become easily entrenched; incumbent entrepre-
neurs become enriched by existing policies and institutions, and can successfully lobby
to maintain them (and thus preventing a switch to the innovation-based equilibrium).
These political-economy considerations therefore reiterate that societies may get
trapped in a non-convergence pattern with “inappropriate institutions” and relatively
backward technologies, because earlier they adopted “appropriate institutions” for their
circumstances at the time, but in the process also created a powerful constituency against
change.
17

The non-convergence trap and the associated political economy interactions, may be
a good description of the experiences of a number of Latin American countries such a
Brazil, Mexico and Peru, which grew relatively rapidly with import substitution and pro-
tectionist policies until the mid-1970s, stagnated and were taken over by other economies
with relatively more competitive policies, such as Hong Kong.
Figure 7 shows the growth performance of Central and South American countries at
different stages of their development process. On the vertical axis we plot the average
growth rate over five-year periods, while on the horizontal axis we plot the GDP per
capita relative to the US at the beginning of each five-year period. The continuous line
is for comparison. It represents the average growth rate across all non-OECD countries
in the world (not only in Central and South America) conditional on the distance to
frontier. Figure 7a plots the growth performance of the four largest Central and South
American countries: Brazil, Argentina, Mexico and Colombia. All of these countries
actively engaged in import-substitution policies. Clearly, when their relative GDP is
below 40%, these four countries outperformed the average non-OECD country at the
same level of development. But their performance was below average when their relative
GDP was larger than 40%.6
Figure 7b plots all Central and South American countries, showing the same broad
pattern. One concern about Figures 7a and 7b is that the evidence can be largely driven
by the cross-sectional variation. For instance, Brazil and Colombia account for most of
the positive deviations in Figure 7a. To address this concern, Figure 7c plots the growth
rates controlling for fixed effects. In this figure, each points represents the deviation of
the growth rate from the “usual growth rate” of that country. In this panel, the cross-
sectional variation is by construction removed. The continuous line is now calculated as
the regression line of a convergence equation for the entire world sample after control-
ling for fixed effects.7 As the figure shows, the performance of Latin American countries
deteriorates at a faster rate than that of the average developing country. A likely expla-
nation for this pattern is the important-substitution and incumbent-protective policies
6Note that the continuous line is positively sloped. This reflects the well-known fact: there is noabsolute convergence across countries in the world.
7In contrast to the cross-sectional pattern, in the fixed-effect regression, there is convergence asindicated by the downward sloping line.
18

adopted by many countries in Latin America. As suggested by our approach, these
policies appear to have led to relatively rapid initial growth, followed by stagnation.
Moreover, the political economy of these countries suggests that the economic stagna-
tion was associated with a persistent inability to implement policy reforms.
FIGURE 7
Our simple theory also sheds new light on the experiences of Korea and Japan.
Though in many ways more market friendly than Latin American countries, for much
of the post-war period both Korea and Japan achieved rapid growth and convergence
relying on high investment, large conglomerates, government subsidies, and relatively
protected internal markets. In Japan, the Ministry of International Trade and Industry
(MITI) played a crucial role by regulating foreign currency allocations, import licenses,
and the extent of competition, by directing industrial activity and by encouraging invest-
ment by the keiretsu, the large groupings of industrial firms and banks (e.g., Johnson,
1982, Evans, 1995, Hoshi and Kashyap, 2002). In the Korean case, the large family-
run conglomerates, the chaebol appear to have played an important role, especially in
generating large investments and rapid technological development. The chaebol, similar
to the keiretsu in Japan, received strong government support in the form of subsidized
loans, anti-union legislation and preferential treatment that sheltered them from both
internal and external competition. An additional important feature of both the chaebol
and the keiretsu was their low managerial turnover, emphasis on long-term relationships
and generally rigid structures (e.g., Wade, 1990, Vogel, 1991, Evans, 1995).
In both Korea and Japan, a long period of convergence and growth came to an end in
the mid-1980s in Japan and during the Asian crisis in Korea. The Korean case illustrates
the politico-economic problems discussed above. Kong (2002, p. 3) writes
“...political–not economic–considerations dominated policymaking... [in
Korea].... and ...corruption was far greater than the conventional wisdom al-
lows”.
Nevertheless, the crisis appears to have eventually opened the way to reforms in
Korea: a number of the chaebol went bankrupt, while others were split, or like Daewoo,
19

were forced into restructuring. Political reforms seem to have weakened the highly
entrenched politico-economic elite: the patriarchs of Samsung, Daewoo and Jinro, the
three major chaebol, were convicted in the late 1990s of major bribing of two former
presidents (although their jail sentences were pardoned in 1997, see Asiaweek, October
10, 1997). Interestingly, the speed of reforms seems to have been much slower in Japan.
This may explain why Korea has by now managed to resume growth rapidly after the
crisis, while the economic performance of Japan continues to be weak.
5 Distance to Frontier and Internal Organization of Firms
The framework introduced above can also be used to study how the internal organization
of firms changes with the process of economic growth and economic development. Here
we illustrate these ideas looking at two facets of the internal organization of firms; (i)
vertical integration; (ii) delegation of decision-making authority to managers.
5.1 Vertical Integration
Here we outline a model of how vertical integration decisions of firms change as an
economy develops, which builds on Acemoglu, Aghion and Zilibotti (2004). In particular,
let us consider a slight modification of equation (5) whereby
At (i) = ηAt−1 + γt (i)At−1, (10)
where
γt (i) = γ + θt (i) (11)
captures the rate of innovation of the firm an intermediate goods sector i. For example,
we can think of the term θt (i) as the probability that an innovation in sector i at time t
is successful. If so, there is innovation in the amount 1+γ. Otherwise, there is a smaller
innovation, of size γ. As before, these innovations build on the knowledge stock of the
country, thus they multiply At−1. The first term in (10), on the other hand, reflects
imitation from the world technology frontier, hence the term At−1.
The key assumption of the model of this subsection will be that the probability of
innovation, θt (i), is affected by the internal organization of the firm, in particular, by
whether the firm is vertically integrated or not. In particular, imagine that innovations
20

result from effort and initiatives by the owner/manager of the firm. Greater effort leads
to greater θt (i). However, the owner/manager of the firm also engages in other tasks,
such as production, marketing, distribution. The key decision is how to allocate his or
her scarce time between these different activities. The internal organization of the firm
affects these decisions. For example, with vertical integration, the owner/manager will
perform all of these tasks himself or herself, whereas with outsourcing some of these
tasks will be allocated to other agents. The key from the viewpoint of this paper is
how this trade-off changes over the process of development, and whether there is also a
structural transformation associated with the internal organization of the firm showing
a tendency to change as an economy develops.
To investigate this issue in the simplest possible way, consider a symmetric equilib-
rium in which θt (i) = θ for all i ∈ [0, 1]. Then, dividing both sides of the above equationby At−1, and integrating over i ∈ [0, 1], we once again obtain a simple linear equationdescribing how the state variable at = At/At evolves over time:
at =1
1 + g
¡η +
¡γ + θ
¢at−1
¢, (12)
where g is again the growth rate of world technology frontier.
Now returning to the trade-off between vertical integration and outsourcing, we in-
troduce the basic idea ofmanagerial overload, that is, the inability of the manager/owner
of the firm to exert effort to deal with all possible problems that arise in production,
marketing, distribution as well as innovation. Outsourcing mitigates this problem by
having another agent performs some of these tasks. But at the same time, it creates a
holdup problem as in the incomplete contracts literature pioneered by Grossman and
Hart (1986); the agent will receive a fraction of the revenue of the firm. In particular,
we follow Grossman and Hart and the incomplete contracts literature, in modeling this
holdup problem in the simplest possible way and assume that no ex ante contract can
induce an enforceable division of surplus; sharing of profits must rely entirely upon ex
post bargaining. In particular, with outsourcing, the agent brought into the produc-
tion process will share some of the rents with the owner, thereby reducing the owner’s
income. This dissipation of income makes outsourcing an attractive to the owner, and
also if outsourcing is adopted, reduces the owner’s incentives to innovate.
21

The analysis in Acemoglu, Aghion and Zilibotti (2004) establishes that there exists
a critical threshold of the distance to frontier av such that for all a < av, equilibrium
organizational form is vertical integration, and for a > av, there will be outsourcing.
The threshold av is typically less than 1, so that there will be a switch to outsourcing
before reaching the technology frontier.
The reason for this pattern is that the value of innovation, and thus the value of
higher θ, increases with at−1. When at−1 is close to zero, that is, in a relatively backward
economy, imitation is much more important than innovation. Outsourcing may increase
innovation, but it is not worth for the owner, since it will involve sharing the surplus
with the agent. As at−1 increases, the value of innovation and thus the value of high
levels of θ increase. Now it may become worthwhile for the owner to bring in another
agent–outsource some of the activities–in order to take advantage of greater innovation
possibilities.
Therefore, this simple model also predicts a structural transformation, this time with
the internal organization of the firm shifting from vertical integration to outsourcing, as
an economy develops.
Using a panel data set of UK firms during the period 1980-2000, in Acemoglu, Aghion,
Griffith and Zilibotti (2003), we provide some evidence consistent with the pattern dis-
cussed here. Table 1, replicated from that paper, shows a negative and significant
correlation between vertical integration and the interaction term between closeness of
the firm to the technological frontier of its four-digit industry and R&D intensity of its
suppliers. The evidence suggests that as innovation becomes more important, there may
indeed be shift from vertical integration to outsourcing.
TABLE 1
5.2 Delegation of Authority
Another important aspect of firms’ organization is the extent to which decision making
is centralized or decentralized within each firm, for example as captured by delegation of
authority to lower-layer managers. Recent evidence based on French firm-level panel data
by Acemoglu et al. (2006) shows a robust positive correlation between decentralization
and distance of a firm to the technological frontier of its industry; firms that are relatively
22

closer to the frontier are more likely to delegate authority to lower-later managers.
Acemoglu et al. (2006) provide an explanation for this based on learning, whereby firms
farther from the frontier can learn from the experiences of more advanced firms about
implementation of new technologies and does not need to delegate as much authority to
specialized agents.
Here, we present a complementary explanation more closely related to the framework
developed in this paper.
As in the previous section, consider a firm engaged in production and innovation. The
firm (the owner) decides how much authority to delegate to a manager about production
decisions. There is a conflict of interest between the owner and the manager, however.
The manager may prefer to take actions that do not maximize the profits of the firm,
instead choosing actions that provides him with private benefits (see Aghion and Tirole,
1997). We measure the degree of conflict of interest between the firm and the manager
with the “congruence” parameter, β. In particular, β is the probability that the interests
of the manager are aligned with those of the firm. If the manager is delegated authority,
he will choose the action that he prefers most. With probability β, this will be the action
that leads to positive revenues for the firm, and with probability 1 − β, it will lead to
zero revenues. Clearly, the case with β = 1 corresponds to no conflict of interest, while
β = 0 implies that the manager will always choose an action that leads to zero profits
for the firm.
Let p be our (inverse) measure of delegation of authority to the manager. In par-
ticular, p is the probability that the firm monitors the manager. When the manager is
monitored, he must take the decision maximizing the firm’s profit. If p = 1, there is
no delegation of authority, and the firm monitors the manager and enforces the profit-
maximizing action with probability 1. On the other hand, if p = 0, there is no monitoring
of the manager, thus full delegation. In this case, the manager decides the best action
unilaterally. In intermediate cases, the firm/owner decides with probability p and the
manager decides with probability 1− p.
Finally, the productivity of firm i ∈ [0, 1] is again
At (i) = ηAt−1 + ξθt (i)At−1
with θt (i) denoting the amount of effort invested by the firm’s owner for innovation.
23

Using the same expressions for pricing, the expected profits of the firm is a function of
its decentralization decision, p, and the level of productivity, At (i), is given by:
πt (pt (i) , At (i)) = δL (pt (i) + (1− pt (i))β)At (i) .
The “overload” faced by the owner is modeled with the following simple quadratic cost:
C (pt (i) , θt (i)) =1
2(pt (i) + θt (i))
2At−1,
where the presence of the term At−1 implies that these costs increase with the level of
productivity in the economy. This cost function captures, in a simple way, the issue of
overload; the marginal cost of either activity that the owner performance (monitoring
and innovation) is increasing in the amount of the other activity.
Using these expressions, the maximization problem of the owner of the firm becomes:
max{pt(i)∈[0,1],θt(i)≥0}
δL (pt (i) + (1− pt (i))β)¡ηAt−1 + ξθt (i)At−1
¢− 12(pt (i) + θt (i))
2At−1.
Now dividing by At−1 and noting that nothing depends on i, this maximization problem
can be written as
max{pt∈[0,1],θt≥0}
δL (pt + 1− ptβ) (η + ξθtat−1)−1
2(pt + θt)
2 .
Assuming that δLξ ≤ 1,the solution takes the following simple form. There existsthree thresholds (which are functions of the parameters)
ap=1 ≤ aθ=0 < ap=0
such that:
1. If at−1 ∈ [0, ap=1], then the optimal (equilibrium) organization involves:
p = 1
θ = 0
2. If at−1 ∈ [ap=1, aθ=0] , the optimal solution involves:
p =δLη (1− β)
at−1θ = 0
24

3. If at−1 ∈ [aθ=0,ap=0] , the optimal solution has
p =η (1− β)− βξat−1 (1− δLξ (1− β))
(1− β) ξat−1 (2− δLξ (1− β))
θ =βξat−1 − η (1− β) (1− δLξ (1− β))
(1− β) ξat−1 (2− δLξ (1− β))
where p decreases and θ increases with a.
4. If at−1 ∈ [ap=0, 1], the optimal solution has
p = 0
θ = δLξβ.
The most important implication of this characterization is that it leads to a pattern
of structural transformation in the internal organization of the firm as a function of the
stage of development (distance to frontier) in the economy. When a is low, the owner
delegates no authority to the manager (p = 1, which can also be interpreted as not hiring
a manager). She also chooses zero innovation effort, θ = 0. As a increases to an inter-
mediate range, there is some delegation (thus some change in the internal organization
of the firm), but still no innovation effort. As a increases further, a more interesting
configuration emerges, where there is substantial delegation of authority to the manager,
and the owner specializes in innovation. Finally, as the economy approaches the world
technology frontier (i.e., a high level of economic development), there is full delegation to
the manager, i.e., p = 0, and the amount of innovative effort by the owner is maximized.
This model therefore also illustrates how the process of development will lead to a
structural transformation, along the lines of Kuznets’ emphasis, affecting not only the
organization of markets, but also the internal organization of firms.
6 Distance to Frontier and Human Capital
The final application of our framework concerns the changing role of human capital
(and its composition) over the process of development. The role of human capital in the
process of technology adoption and economic convergence was first emphasized by Nelson
and Phelps (1966). Figure 3 above suggests that the role of (formal) education could
25

be quite different for economies close to the frontier as compared to those farther away
from the frontier. This idea is explored in greater detail in Vandenbussche, Aghion and
Meghir (2003), who provide a model where in the importance of secondary versus higher
education changes depending on the economy’s distance to the frontier. Vandenbussche,
Aghion and Meghir (2003) and Aghion et al. (2006) provide evidence consistent with
this notion.
Here, we illustrate related ideas using the framework develop above. Let us suppose
that there are two different kinds of human capital in the economy, general-purpose and
specific, and denote the average specific human capital of workers in the economy at
time t by st. This type of specific human capital may be acquired in schools, but it also
includes skills acquired on the job or through non-formal education (for example, in the
household). The average general-purpose human capital of the workforce, on the other
hand, is denoted by et. This type of human capital can only be acquired through formal
schooling.
Let us go back to equation (5) and modify such that for all i ∈ [0, 1], we have
At (i) = η (st, et) At−1 + γ (et)At−1 + εt (i) , (13)
where εt (i) is again a mean-zero term and η is increasing and continuously differentiable
in both of its arguments, and γ is increasing and continuously differentiable in et.
Equation (13) implies that while specific human capital is useful for adoption and use
of existing technologies, only general-purpose human capital, acquired through formal
schooling, is useful for innovation. This is clearly extreme, but captures the notion that
formal schooling becomes more important at later stages of development. Moreover, let
us assume that∂η (s, e)
∂s≥ ∂η (s, e)
∂efor all e, s ≥ 0. (14)
and that∂γ (0)
∂e>
∂η (s = 1, e = 0)
∂s. (15)
The first condition states that specific skills are more important for imitation than
general-purpose skills, whereas the second condition states that general-purpose skills
are sufficiently important for innovation.
26

Let us also assume that the representative worker has a limited amount of time, so
that
st + et ≤ 1,
and naturally, et, st ≥ 0. Condition (14) implies that when at−1 is low in the economy
is far from the frontier, the growth-maximizing strategy is to invest only in the specific
skills of workers. In contrast, as the economy approaches the world technology frontier,
(15) ensures that it becomes beneficial for the economy to invest in the general-purpose
human capital of the workers.
If workers make their human capital decisions facing prices that reflect their con-
tributions to growth, this will also be the equilibrium pattern of investment; formal
education in general-purpose human capital will increase as the economy develops and
approaches the world technology frontier. Therefore, this simple model provides another
instance of a possible structural transformation, this time in the composition of skills of
the workforce, going hand-in-hand with the process of economic development.
7 Conclusion
The literatures on economic growth and economic development emphasize different as-
pects of the process of development. While models of economic growth focus on tech-
nological change, capital accumulation and the relatively steady process of economic
growth, much of development economics, building on the seminal work by Kuznets
(1966), emphasizes the structural transformations taking place in the process of eco-
nomic development.
In this paper, we presented a simple model that offers a unified framework for the
analysis of economic growth and economic development. In our model, the transforma-
tion of production relationships goes hand-in-hand with economic growth. The main
driving force of this pattern is that economic growth in relatively backward economies is
associated with adoption and imitation of and investment in existing technologies, while
growth in advanced (frontier) economies is driven by innovation. Consequently, the
process of economic development takes the form of a transformation of economic rela-
tionships in many spheres. The framework we present, though simple, enables us to offer
a number of new ideas about the relationship between the organization of production,
27

institutions, economic growth and economic development.
Using this basic framework, we illustrated how the organization of production, the
extent of creative distraction and entry, the extent of vertical integration, the extent
of delegation of authority to managers and the composition of human capital become
transformed over the process of economic development.
We also used this framework to critically discuss the concept of “appropriate institu-
tions/organizations.” The notion of appropriate institutions implies that the equilibrium
organization of production relationships and broader institutions may differ with this
stage of development. Our framework shows how the equilibrium process of economic de-
velopment might take the form of the economy shifting from “institutions/organizations”
appropriate for the early stages of development (which may be non-standard in many
ways) to different (perhaps more standard) institutions and organizations as the economy
develops.
Our framework, however, also highlights that attempts to impose such “appropriate
institutions” from the outside can turn them into “inappropriate institutions,” which
may have quite detrimental effect on the growth performance of less-developed countries.
In particular, attempts to encourage “appropriate institutions” and policies at early
stages of development might at best lead to temporary gains in growth, but will create
the risk of the economy becoming stuck in a non-convergence trap because of the powerful
constituencies that these institutions and policies create.
The framework presented in this paper is purposefully simple, so that it emphasizes
the main trade-offs and can be applied in a variety of different settings. This framework
can be develop in many ways both theoretically and also to bring it closer to data
area. In current work, we are investigating some of the empirical implications of this
framework for changes in the internal organization of the firm, but much else needs to
be done. We believe that further study of models combining insights from economic
growth and economic development and testing their implications with micro data our
exciting in important areas for future work.
28

References
[1] Acemoglu, Daron, Aghion, Philippe, and Fabrizio Zilibotti (2002), “Distance to
Frontier, Selection, and Economic Growth”, NBER Working Paper No 9066
[2] Acemoglu, Daron, Aghion, Philippe, Griffith, Rachel and Fabrizio Zilibotti (2004)
“Vertical Integration and Technology: Theory and Evidence” IFS Working Papers,
W04/34
[3] Acemoglu, Daron, Aghion, Philippe, and Fabrizio Zilibotti (2004): “Vertical Inte-
gration and Distance to Frontier”, Journal of the European Economic Association,
Papers and Proceedings.
[4] Acemoglu, Daron and Veronica Guerrieri (2005) “Capital Deepening and Non-
Balanced Growth” MIT mimeo.
[5] Acemoglu, Daron, Simon Johnson and James A. Robinson (2005) “Institutions as
a Fundamental Cause of Development,” in Handbook of Economic Growth, edited
by Philippe Aghion and Steven Durlauf, Amsterdam; North-Holland.
[6] Aghion, Philippe; Boustan, Leah; Hoxby, Caroline and Jerome Vandenbussche
(2005), “Exploiting States’ Mistakes to Evaluate the Impact of Higher Education
on Growth”, mimeo Harvard
[7] Aghion, Philippe, and Jean Tirole (1997): “Formal and Real Authority in Organi-
zations”, Journal of Political Economy, 105, 129.
[8] Barro, Robert and Jong-Wha Lee (2000),“International Data on Educational At-
tainment: Updates and Implications”, Working Paper No 42, Center for Interna-
tional Development at Harvard University.
[9] Barro, Robert and Xavier Sala-i-Martin (2004), Economic Growth, McGraw Hill,
New York.
[10] Baumol, William J. (1967), “Macroeconomics of Unbalanced Growth: The
Anatomy of Urban Crisis”, American Economic Review, LVII, 415-426.
29

[11] Denison, Edward F. (1974), “Accounting for United States Economic Growth, 1929-
1969” Washington, DC: Brookings Institution.
[12] Djankov, Simeon, Rafael La Porta, Florencio Lopez-de-Silanes, and Andrei Shleifer
(2002). “The Regulation of Entry.” Quarterly Journal of Economics, 117, 1—38.
[13] Evans, Peter, (1998), Embedded Autonomy: States and Industrial Transformation,
Princeton University Press.
[14] Frankel, Jeffrey and David Romer, (1999) “Does Trade Cause Growth?” American
Economic Review, vol. 89, pp. 379-399.
[15] Galor, Oded (2005) “From Stagnation to Growth: Unified Growth Theory,” Hand-
book of Economic Growth (forthcoming).
[16] Galor, Oded and Weil, David (2000) “Population, Technology, and Growth: From
Malthusian Stagnation to the Demographic Transition and Beyond,” The American
Economic Review, 90(4), 806-828.
[17] Gerschenkron, Alexander, (1962) Economic Backwardness in Historical Perspective,
Harvard University Press, Cambridge MA.
[18] Grossman, Sandford and Oliver Hart (1986): ”The Costs and Benefits of Ownership:
A Theory of Vertical and Lateral Integration,” Journal of Political Economy, 94,
691-719.
[19] Hansen, Gary D. and Edward C. Prescott (2002) “Malthus to Solow,” American
Economic Review, 92(4), 1205-1217.
[20] Hoshi, Takeo and Anil Kashyap (2001)Corporate financing and governance in Japan
: the road to the future, Cambridge, Massachusetts, MIT Press.
[21] Johnson, Chalmers, (1982), MITI and the Japanese Miracle: The Growth of Indus-
trial Policy, 1925-75, Stanford University Press.
30

[22] Kaldor, Nicholas (1963), “Capital Accumulation and Economic Growth”, in
Friedrich A. Lutz and Douglas C. Hague, eds., Proceedings of a Conference Held
by the International Economics Association, London, Macmillan.
[23] Kang, David, (2002) Crony Capitalism: Corruption and Development and South
Korea and the Philippines, Cambridge, Cambridge University Press.
[24] Kongsamut, Piyabha , Sergio Rebelo and Danyang Xie (2001), “Beyond Balanced
Growth”, Review of Economic Studies, LXVIII, 869-882.
[25] Kuznets, Simon (1957), “Quantitative Aspects of the Economic Growth of Nations:
II, Industrial Distribution of National Product and Labour Forcce”, Economic De-
velopment and Cultural Change, V Supplement.
[26] Kuznets, Simon (1966), Modern Economic Growth: Rate, Structure and Spread,
Yale University Press, New Haven.
[27] Kuznets, Simon (1973), “Modern Economic Growth: Findings and Reflections”,
American Economic Review, LXIII, 829-846.
[28] Laitner, John (2000), “Structural Change and Economic Growth”, Review of Eco-
nomic Studies, LXVII, 545-561.
[29] Nelson, Richard and Edmund Phelps (1966), “Investment in Humans, Technolog-
ical Diffusion, and Economic Growth”, American Economic Review, Papers and
Proceedings, 61, 69-75.
[30] Ngai Rachel and Christopher Pissarides (2005), “Structural Change in a Multi-
Sector Model of Growth”, mimeo.
[31] North, Douglass C. (1990) Institutions, institutional change and economic perfor-
mance, New York; Cambridge University Press.
[32] Vandenbussche, Jerome; Aghion, Philippe; and Costas Meghir (2004), “Growth,
Distance to Frontier and the Composition of Human Capital”, mimeo Harvard-
UCL.
31

[33] Vogel, Ezra F. (1991) The Four Little Dragons: the Spread of Industrialization in
East Asia, Cambridge, MA, Harvard University press.
[34] Wade, Robert (1990) Governing the Market: Economic Theory and the Role of
Government in East Asian Industrialization, Princeton, Princeton University Press.
32

FIGURE 1.Fig. 1a: HIGH BARRIERS
grow
th r
ate
GDP pw relative to the US0 .2 .4 .6
.04
.02
0
-.02
-.04
-.06
TANZANIABURKINA UGANDAMALAWIINDONESI
KENYA
MALIMADAGASC
MOZAMBIQ
SENEGAL
KOREA
PHILIPPI
DOMINICAEGYPT
MOROCCO
ECUADOR
BOLIVIA
BRAZIL
COLOMBIA
JORDAN
MEXICO
ARGENTIN
VENEZUEL
Fig. 1b: LOW BARRIERS
grow
th r
ate
GDP pw relative to the US0 .2 .4 .6
.04
.02
0
-.02
-.04
-.06
INDIANIGERIA
THAILAND
SRI LANK
PAKISTANGHANA
ZIMBABWE
TAIWAN
ZAMBIA
MALAYSIA
JAMAICA
PANAMA
HONG KON
SINGAPOR
CHILE
PERU
URUGUAY
SOUTH AF
ISRAEL
Fig. 1c: HIGH BARRIERS (FE)
grow
th r
ate
GDP pw relative to the US0 .2 .4 .6
.08
.06
.04
.02
0
-.02
-.04
-.06
-.08
-.1
Fig. 1d: LOW BARRIERS (FE)
grow
th r
ate
(FE
)
GDP pw relative to the US0 .2 .4 .6
.08
.06
.04
.02
0
-.02
-.04
-.06
-.08
-.1
fi

FIGURE 2.Fig. 2a: CLOSED ECONOMIES
grow
th r
ate
GDP pw relative to the US0 .2 .4 .6
.05
.025
0
-.025
-.05
TANZANIABURKINA UGANDAMALAWI
ETHIOPIA
NEPAL
INDONESI
KENYA
DEM.REP.
INDIA
MALI
NIGERIA
MADAGASC
THAILAND
NIGER
SRI LANKBANGLADE
PAKISTAN
CHAD
CAMEROON
MOZAMBIQCENTRAL
ZIMBABWE
ZAMBIAPHILIPPIANGOLAPAPUA NE
EGYPTMOROCCO
ECUADORPARAGUAY
BOLIVIA
BRAZIL
COLOMBIAFIJI
IRAN
CHILE
PERU
URUGUAY
SOUTH AF
MEXICO
ARGENTIN
VENEZUEL
Fig. 2b: OPEN ECONOMIES
grow
th r
ate
GDP pw relative to the US0 .2 .4 .6
.05
.025
0
-.025
-.05
BURUNDI
RWANDA
GUINEA-B
LESOTHO
BENIN
CONGO
BOTSWANA
TOGOGAMBIA
CAPE VER
GHANA
COTE D’I
SENEGAL
MAURITAN
KOREA
GUINEA
TAIWAN
COMOROS
HONDURAS
DOMINICA
SEYCHELL
MALAYSIA
SYRIA
JAMAICA
GUYANA
MAURITIU
GUATEMAL
PANAMA
HONG KON
CYPRUS
SINGAPOR
GABON
JORDAN
EL SALVA
COSTA RI
NAMIBIA
NICARAGU
BARBADOSTRINIDAD
ISRAEL
Fig. 2c: CLOSED ECONOMIES (FE)
grow
th r
ate
GDP pw relative to the US0 .2 .4 .6
.08
.06
.04
.02
0
-.02
-.04
-.06
-.08
-.1
-.12
-.14
-.16
Fig. 2d: OPEN ECONOMIES (FE)
grow
th r
ate
(FE
)
GDP pw relative to the US0 .2 .4 .6
.08
.06
.04
.02
0
-.02
-.04
-.06
-.08
-.1
-.12
-.14
-.16
fi

FIGURE 3.Fig. 3a: LOW EDUCATION
grow
th r
ate
GDP pw relative to the US0 .2 .4 .6
.06
.04
.02
0
-.02
-.04
-.06
UGANDAMALAWI
NEPAL
INDONESI
LESOTHO
KENYA
DEM.REP.
INDIA
MALI
BOTSWANA
TOGO
NIGER
BANGLADE
PAKISTAN
GHANA
CAMEROON
MOZAMBIQCENTRAL
SENEGAL
ZIMBABWE
HONDURAS
PAPUA NE
DOMINICA
SYRIA
JAMAICA
GUATEMAL
IRAN
EL SALVA
NICARAGU
Fig. 3b: HIGH EDUCATION
grow
th r
ate
GDP pw relative to the US0 .2 .4 .6
.06
.04
.02
0
-.02
-.04
-.06
THAILAND
SRI LANK
KOREATAIWAN
ZAMBIA
PHILIPPI
ECUADOR
MALAYSIA
PARAGUAY
GUYANABOLIVIA
BRAZIL
MAURITIU
COLOMBIA
PANAMA
HONG KON
FIJI
CYPRUS
SINGAPOR
JORDAN
COSTA RI
CHILE
PERU
URUGUAY
BARBADOSTRINIDAD
SOUTH AF
MEXICO
ISRAEL
ARGENTIN
VENEZUEL
Fig. 3c: LOW EDUCATION (FE)
grow
th r
ate
GDP pw relative to the US0 .2 .4 .6
.1
.08
.06
.04
.02
0
-.02
-.04
-.06
-.08
-.1
-.12
-.14
Fig. 3d: HIGH EDUCATION (FE)
grow
th r
ate
GDP pw relative to the US0 .2 .4 .6
.1
.08
.06
.04
.02
0
-.02
-.04
-.06
-.08
-.1
-.12
-.14
fi

FIGURE 4
1at-1
at
R=1
R=0
45O
aa

1
R=1
aaaarr(δ)
aatt
R=0
FIGURE 5
00aaaatt‐‐11

1
R=1
aa aarr(δ)
aattR=0
FIGURE 6a
aa00aatt‐‐11

1
R=1
aa aarr(δ)aatraptrap
aattR=0
FIGURE 6b
aa00aatt‐‐11