growth drivers and investment opportunities in european construction to 2016 michael weingärtler...
TRANSCRIPT

GROWTH DRIVERS AND GROWTH DRIVERS AND INVESTMENT OPPORTUNITIES IN INVESTMENT OPPORTUNITIES IN
EUROPEAN CONSTRUCTION TO 2016EUROPEAN CONSTRUCTION TO 2016
Michael Weingä[email protected]
Metal Expert Europe Steel Trade Conference 2014
28 April 2014 - Stresa, Italy

OVERVIEW
Macro-economic Framework
Overall Trends in Construction
Construction Outlook by Sectors Housing Non-residential construction Civil Engineering

EUROCONSTRUCT NETWORKEUROPE (EC-19)Austria, Belgium, Denmark, Finland, France, Germany, Ireland, Italy, Nether-lands, Norway, Portugal, Spain, Sweden, Switzerland, United Kingdom, Czech & Slovak Republic, Hungary, Poland.
BIG 5 CountriesFrance, Germany, Italy, Spain, United Kingdom
Northern EuropeNorway, Sweden, Finland, Denmark, Ireland
Smaller European CountriesAustria, Belgium, Netherlands, Portugal, Switzerland
Eastern EuropeCzech Republic, Hungary,Slovak Republic, Poland
ES
FR
PT
IR
UK
FI
SE
NO
DEPL
DK
AT HUCH
CZSK
IT
NLBE


DOUBLE DIP IN CONSTRUCTION
-9,0
-5,2
-10
-5
0
5
10
'00 '01 '02 '03 '04 '05 '06 '07 '08 '09 '10 '11 '12 '13
GDP EC-19Total Construction EC-19
Source: EUROCONSTRUCT .

WHAT HAPPENED?
(1) INCREASING
WORLD TRADE
(2) DYNAMICEXPORTS
(3) MACHINERYINVESTMENTS
(4) CONSTRUCTION INVESTMENTSEUROPEAN EUROPEAN
PUBLIC PUBLIC DEBT DEBT CRISISCRISIS
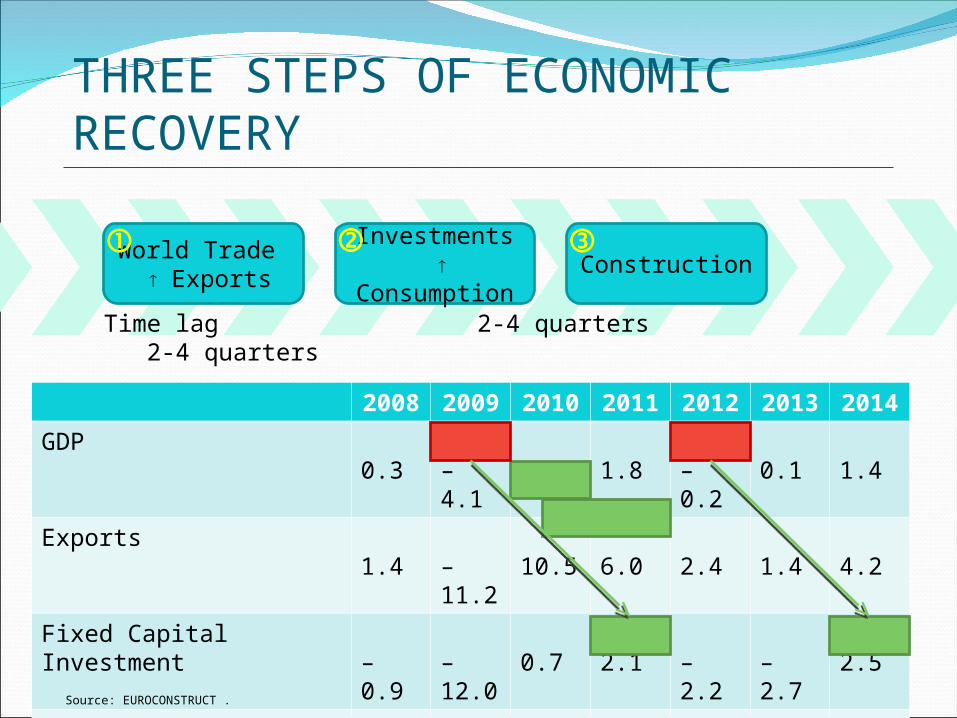
THREE STEPS OF ECONOMIC RECOVERY
2008
2009
2010
2011
2012
2013
2014
GDP0.3 – 4.1 2.2 1.8 – 0.2 0.1 1.4
Exports1.4 –
11.210.5 6.0 2.4 1.4 4.2
Fixed Capital Investment – 0.9 –
12.00.7 2.1 – 2.2 – 2.7 2.5
Private Consumption0.2 –1.2 1.4 0.5 – 0.4 0.0 1.1
Public Consumption2.3 2.3 0.9 0.0 0.0 0.4 0.2
Construction– 3.9 – 9.0 – 3.4 0.3 – 5.2 – 3.0 0.9
Investments
Consumption
World Trade Exports
Construction
Time lag 2-4 quarters 2-4 quarters
Source: EUROCONSTRUCT .
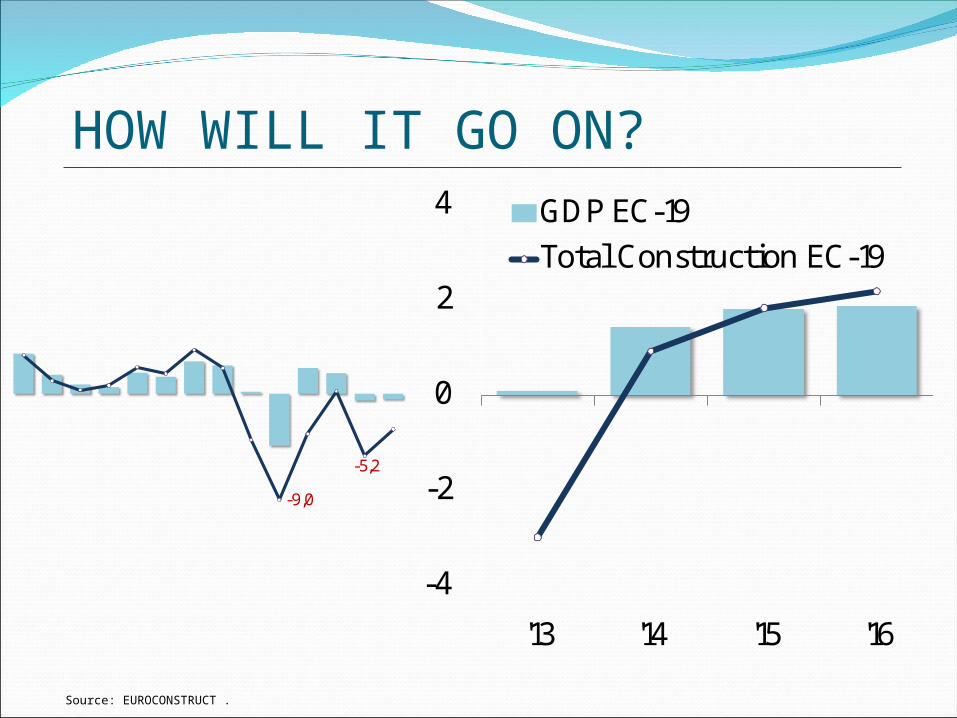
HOW WILL IT GO ON?
-9,0
-5,2
-4
-2
0
2
4
'13 '14 '15 '16
GDP EC-19Total Construction EC-19
Source: EUROCONSTRUCT .

EUROPEAN CONSTRUCT ION 2014
low volume high volume
low
acti
vity
h
igh
acti
vity
low volume high volume
low
acti
vity
h
igh
acti
vity
Volume: construction output per capita in mill. Euro (horizontal axis)Activity: real annual average growth 2014 in % (vertical axis)
ATBE
DK
FIFR
DE
IR
IT NL
NO
PT
ES
SF
CHUK
CZ
HU
PL
SK
-8-6-4-202468
1012
0 2 4 6 8 10
average volume
ave
rag
e g
row
th
ave
rag
e g
row
th

RENOVATION DOMINATES WESTERN CIVIL ENGINEERING & NON-RESIDENTIAL EASTERN EUROPE
21%
18%
22%
30%
17%
BUILDING RENOVATION542 bill. €
16%
31%
45%
NEW HOUSING 215 bill. €
NEW NON-RESIDENTIAL196 bill. €
TOTAL CIVILENGINEERING263 bill. €
NEW HOUSING 12 Mrd. €
NEW NON-RESIDENTIAL21 bill. €
EC-15 EC-4
BUILDING RENOVATION16 bill. €
TOTAL CIVILENGINEERING21 bill. €
Source: EUROCONSTRUCT. – Western Europe: Belgium, Denmark, Germany, Finland, France, Ireland, Italy, Great Britain, Netherlands, Norway, Austria, Portugal, Sweden, Switzerland, Spain. Eastern Europe: Czech Republic, Hungary, Poland, Slovak Republic.
European Construction – A 1.28 bn Euro Market (2013)

SLOW RECOVERY IN CONSTRUCTION
Source: EUROCONSTRUCT. – Western Europe: Belgium, Denmark, Germany, Finland, France, Ireland, Italy, Great Britain, Netherlands, Norway, Austria, Portugal, Sweden, Switzerland, Spain. Eastern Europe: Czech Republic, Hungary, Poland, Slovak Republic.
96
107
80
90
100
110
120
'10 '11 '12 '13 '14 '15 '16
Western Europe EC-15
GDP
Total Construction
113
102
8680
90
100
110
120
'10 '11 '12 '13 '14 '15 '16
Eastern Europe EC-4
GDP
Total Construction
gdp and construction outputindex 2010 = 100
without Poland
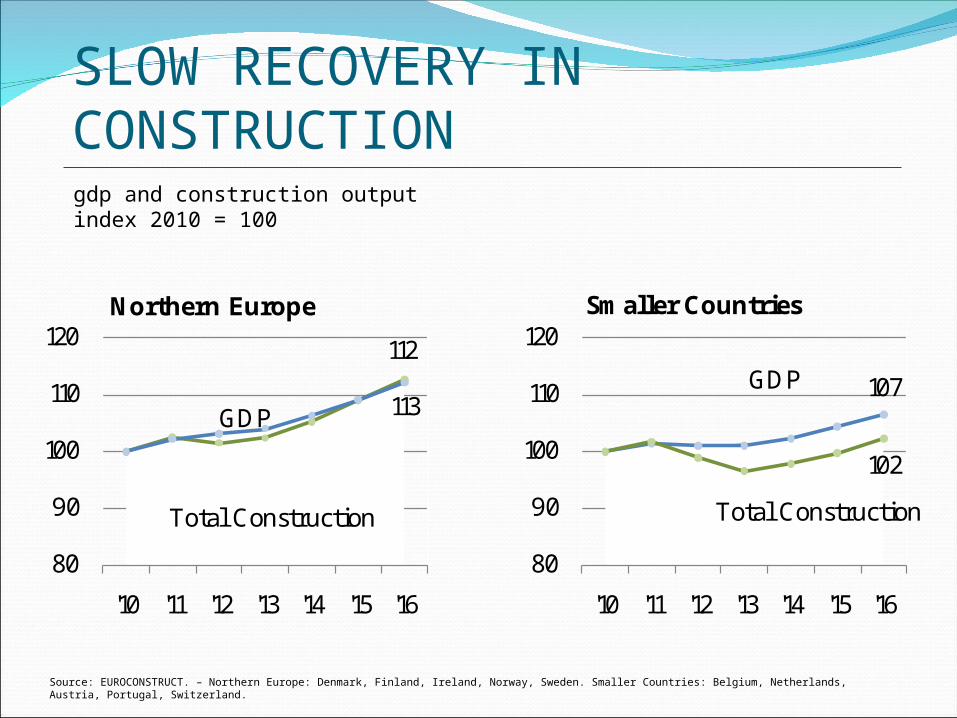
SLOW RECOVERY IN CONSTRUCTION
Source: EUROCONSTRUCT. – Northern Europe: Denmark, Finland, Ireland, Norway, Sweden. Smaller Countries: Belgium, Netherlands, Austria, Portugal, Switzerland.
gdp and construction outputindex 2010 = 100
113
112
80
90
100
110
120
'10 '11 '12 '13 '14 '15 '16
Northern Europe
GDP
Total Construction
107
102
80
90
100
110
120
'10 '11 '12 '13 '14 '15 '16
Smaller Countries
GDP
Total Construction


RECOVERY OF NEW HOUSING IN EUROPE
90
95
100
105
110
115
13 14 15 16
00 0102 0304 0506 0708 09 10 11 12 13
NEW HOUSING
TOTAL
HOUSING RENOVATION
Source: EUROCONSTRUCT .
housing outputindex 2013 = 100

500
550
600
650
700
750
800
00 01 02 03 04 05 06 07 08 09 10 11 12 13 14 15 16
LONG TERM HOUSING IN EC-19total housing outputin billion Euro at 2012 prices
– – 3434%%
+ + 6%6%
Source: EUROCONSTRUCT .

500
550
600
650
700
750
800
00 01 02 03 04 05 06 07 08 09 10 11 12 13 14 15 16
BACK TO 2010 total housing outputin billion Euro at 2012 prices
Source: EUROCONSTRUCT .

TOTAL HOUSING IN BIG-5 COUNTRIES
-30
-25
-20
-15
-10
-5
0
5
10
15
France Germany Italy Spain United Kingdom
bn E
uro
10-13 13-16volume change in billion Euro
Source: EUROCONSTRUCT .

20
30
40
50
60
70
80
00 01 02 03 04 05 06 07 08 09 10 11 12 13 14 15 16
HOUSING TRENDS – NORTHERN EUROPE
– – 2828%%
+ + 17%17%
total housing outputin billion Euro at 2012 prices
Source: EUROCONSTRUCT. – Northern Europe: Denmark, Finland, Ireland, Norway, Sweden.

30
40
50
60
70
80
90
100
110
00 01 02 03 04 05 06 07 08 09 10 11 12 13 14 15 16
HOUSING TRENDS - Smaller Countries
– – 1010%%
+ + 4%4%
Source: EUROCONSTRUCT. – Northern Europe: Denmark, Finland, Ireland, Norway, Sweden. Smaller Countries: Belgium, Netherlands, Austria, Portugal, Switzerland.
total housing outputin billion Euro at 2012 prices

TOTAL HOUSING - SMALLER COUNTRIES
-4
-3
-2
-1
0
1
2
3
4
Austria Belgium Netherlands Portugal Switzerland
bn E
uro
10-13 13-16volume change in billion Euro
Source: EUROCONSTRUCT .
0
5
10
15
20
25
00 01 02 03 04 05 06 07 08 09 10 11 12 13 14 15 16
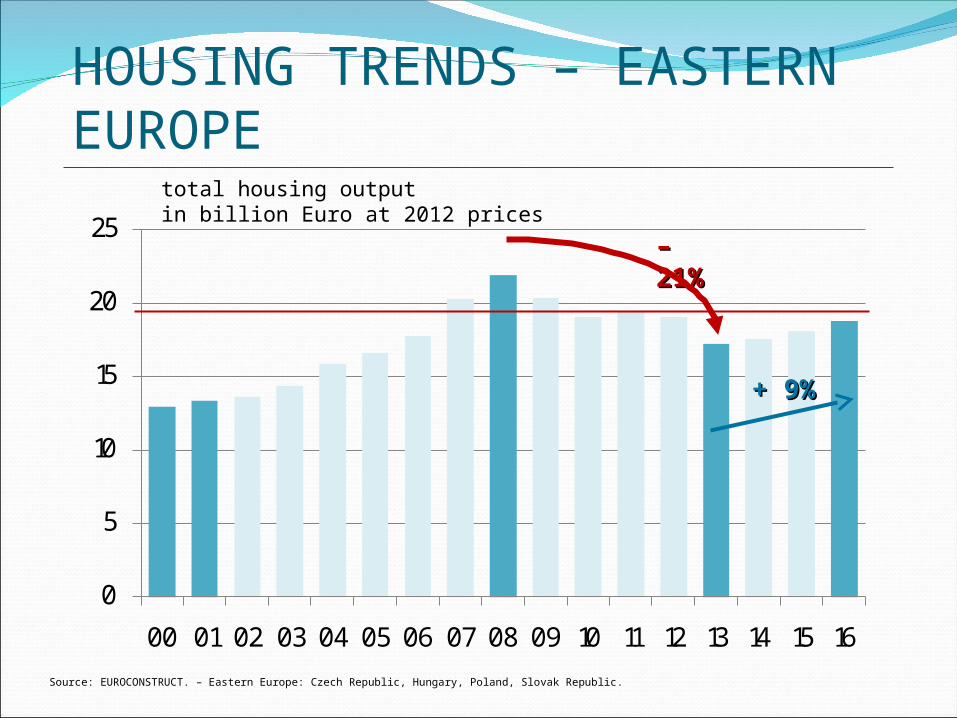
HOUSING TRENDS – EASTERN EUROPE
– – 2121%%
+ + 9%9%
Source: EUROCONSTRUCT. – Eastern Europe: Czech Republic, Hungary, Poland, Slovak Republic.
total housing outputin billion Euro at 2012 prices
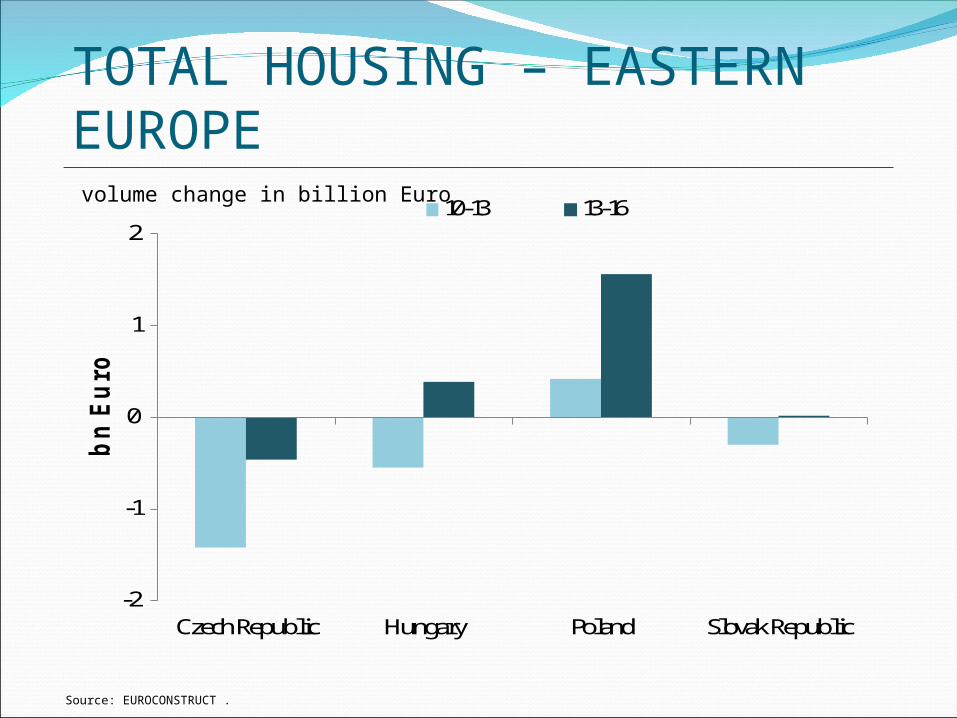
TOTAL HOUSING – EASTERN EUROPE
-2
-1
0
1
2
Czech Republic Hungary Poland Slovak Republic
bn E
uro
10-13 13-16volume change in billion Euro
Source: EUROCONSTRUCT .

SIGNIFICANT GROWTH DIFFERENCESaverage housing permits per 1000 inhabitants 2013-2016
Source: EUROCONSTRUCT .
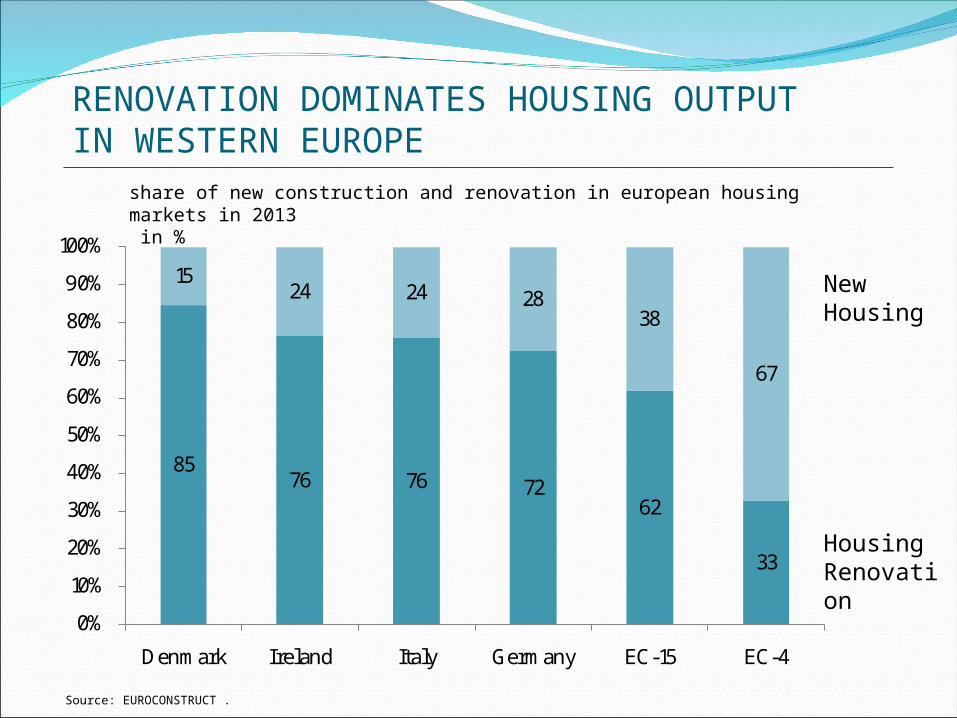
RENOVATION DOMINATES HOUSING OUTPUT IN WESTERN EUROPE
8576 76 72
62
33
1524 24 28
38
67
0%
10%
20%
30%
40%
50%
60%
70%
80%
90%
100%
Denmark Ireland Italy Germany EC-15 EC-4
HousingRenovation
New Housing
share of new construction and renovation in european housing markets in 2013 in %
Source: EUROCONSTRUCT .

TOTAL HOUSING PRODUCTION
ES
FR
PT
IR
UK
FI
SE
NO
DEPL
DK
AT HUCH
CZSK
IT
NLBE
average growth 2013-2016: 2.0%
4% and above
2% to less than 4% 1% to less than 2%below 1%
shrinking market
Western Europe: 1.1%Eastern Europe: 2.6%
Source: EUROCONSTRUCT .


MINOR RECOVERY IN EUROPEAN NON-RESIDENTIAL CONSTRUCTION
00 01020304 0506 070809 10 11 12 13 14 15 16
90
95
100
105
110
13 14 15 16
Renovation
Total
New
non-residential construction outputindex 2013 = 100
Source: EUROCONSTRUCT .

BEST OUTLOOK:NEW INDUSTRIAL CONSTRUCTION
Source: EUROCONSTRUCT .
new non-residential construction outputindex 2013 = 100
95,0
105,0
115,0
125,0
2010 2011 2012 2013 2014 2015 2016
Industry
Office
Public
Total
Commercial

95
107
80
90
100
110
120
'10 '11 '12 '13 '14 '15 '16
Western Europe EC-15
GDP
Non-Residential
113
109
96
80
90
100
110
120
'10 '11 '12 '13 '14 '15 '16
Eastern Europe EC-4
GDP
Non-Residential
POOR NON-RESIDENTIAL PERFORMANCE
Poland,excluded
gdp & non-residential construction Outputindex 2010 = 100
Source: EUROCONSTRUCT. – Western Europe: Belgium, Denmark, Germany, Finland, France, Ireland, Italy, Great Britain, Netherlands, Norway, Austria, Portugal, Sweden, Switzerland, Spain. Eastern Europe: Czech Republic, Hungary, Poland, Slovak Republic.

BIG-5 EUROPEAN COUNTRIES STAGNATION IN NON-RESIDENTIAL CONSTRUCTION
GermanyUnited KingdomItaly
FranceSpain
BIG-5
90
95
100
105
110
115
120
10 11 12 13 14 15 16
France22%
Germany28%Italy
17%
Spain8%
United Kingdom
25%
new non-residential construction outputindex 2013=100
Source: EUROCONSTRUCT .
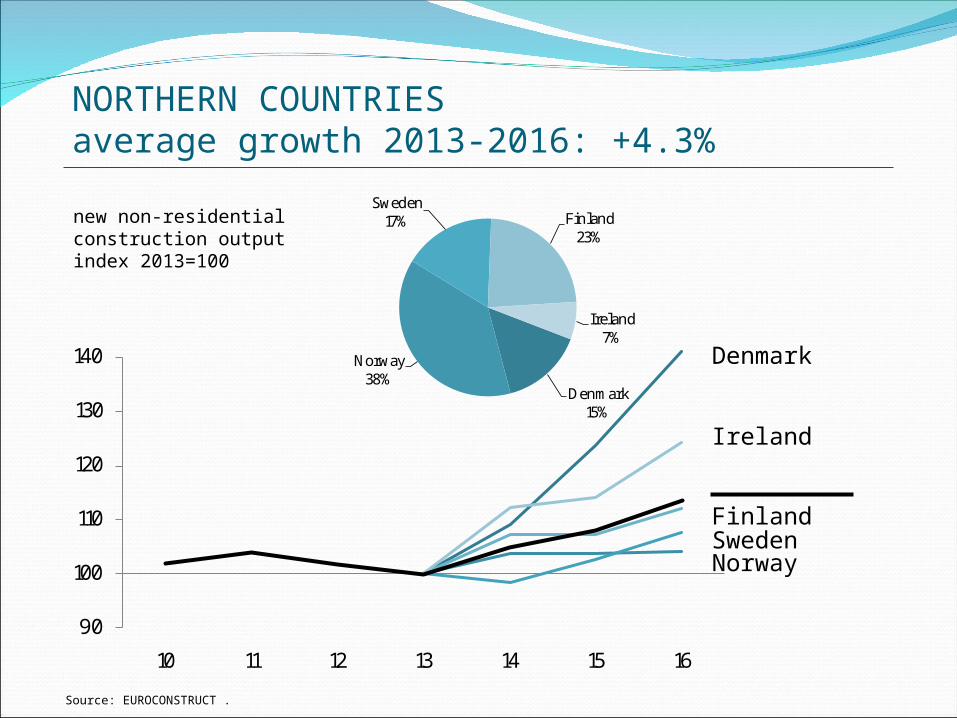
NORTHERN COUNTRIESaverage growth 2013-2016: +4.3%
90
100
110
120
130
140
10 11 12 13 14 15 16
Denmark15%
Norway38%
Sweden17% Finland
23%
Ireland7%
Denmark
Ireland
FinlandSwedenNorway
new non-residential construction outputindex 2013=100
Source: EUROCONSTRUCT .

SMALLER WESTERN EUROPEAN COUNTRIESaverage growth 2013-2016: +1.5%
Netherlands
AustriaSwitzerland,BelgiumPortugal
90
100
110
120
10 11 12 13 14 15 16
Austria20%
Belgium26%
Netherlands24%
Switzerland22%
Portugal8%
new non-residential construction outputindex 2013=100
Source: EUROCONSTRUCT .

CENTRAL EASTERN EUROPEAN COUNTRIESaverage growth 2013-2016: +2.5%
Hungary
Poland
Czech RepublicSlovak Republic
Czech25%
Hungary9%
Poland60%
Slovak Republic
6%
90
100
110
120
10 11 12 13 14 15 16
new non-residential construction outputindex 2013=100
Source: EUROCONSTRUCT .

NON-RESIDENTIAL OUTLOOK
ES
FR
PT
IR
UK
FI
SE
NO
DEPL
DK
AT HUCH
CZSK
IT
NLBE
average growth
2013-2016: 1.2%
3% and above
1.2% to less than 3% 0.6% to less than 1.2%below 0.6%
shrinking market
Western Europe: 1.1%Eastern Europe: 2.6%
Source: EUROCONSTRUCT .


CIVIL ENGINEERING OUTLOOK
89
107
80
90
100
110
120
'10 '11 '12 '13 '14 '15 '16
Western Europe EC-15
GDP
Civil Engineering
113
97
8270
80
90
100
110
120
'10 '11 '12 '13 '14 '15 '16
Eastern Europe EC-4
GDP
Civil Engineering
gdp and civil engineering outputindex 2010 = 100
Poland,excluded
Source: EUROCONSTRUCT. – Western Europe: Belgium, Denmark, Germany, Finland, France, Ireland, Italy, Great Britain, Netherlands, Norway, Austria, Portugal, Sweden, Switzerland, Spain. Eastern Europe: Czech Republic, Hungary, Poland, Slovak Republic.

CIVIL ENGINEERING OUTLOOKgdp and civil engineering outputindex 2010 = 100
112
112
80
90
100
110
120
'10 '11 '12 '13 '14 '15 '16
Northern Countries
GDP
Civil Engineering
107
98
70
80
90
100
110
120
'10 '11 '12 '13 '14 '15 '16
Smaller Countries
GDP
Civil Engineering
Source: EUROCONSTRUCT. – Northern Europe: Denmark, Finland, Ireland, Norway, Sweden. Smaller Countries: Belgium, Netherlands, Austria, Portugal, Switzerland.

40
11515
18
11
ROAD SECTOR DOMINATES CE
ENERGY 43 bn. €
STRUCTURE IN CIVIL ENGINEERING PRODUCTION OUTPUT 2013
ROADS 94 bn. €
RAILWAY45 bn. €
EC-19 EC-4
OTHERTRAFFIC22 bn. €
ROADS 8.5 bn. €
RAILWAY2 bn. €
TELECOM & OTHER CE2 bn. €
OTHER TRAFFIC1 bn. €
WATER36 bn. €
ENERGY 3 bn. €
WATER4 bn. €
TELECOM & OTHER CE45 bn. € 33
16815
13
16
Source: EUROCONSTRUCT .

ENERGY SECTOR AS GROWTH DRIVERtotal civil engineering outputindex 2010 = 100
Source: EUROCONSTRUCT.
90,0
100,0
110,0
120,0
130,0
2010 2011 2012 2013 2014 2015 2016
Energy
Road
Total
Telecom
Rail
Water

CIVIL ENGINEERING OUTLOOK IN BIG-5 EUROPEAN COUNTRIES total civil engineering outputindex 2013 = 100
80
85
90
95
100
105
110
2013 2014 2015 2016
United Kingdom
Germany
BIG-5
France
Italy
Spain
Source: EUROCONSTRUCT .

CIVIL ENGINEERING OUTLOOK
ES
FR
PT
IR
UK
FI
SE
NO
DEPL
DK
AT HUCH
CZSK
IT
NLBE
average growth 2013-2016: 1.5%
4.2% and above2% to less than 4.2% 0.5% to less than 2%below 0.5%
shrinking market
Western Europe: 1.3%Eastern Europe: 4.5%
Source: EUROCONSTRUCT .

SUMMARY
Economic recovery is mainly drivingEuropean Housing
Civil Engineering
HIGHEST RISKSLOW AND UNSTABLE OVERALLECONOMIC DEVELOPMENT