growth effects, services and factor markets integration factor markets... · growth effects,...
TRANSCRIPT

Growth Effects, Services and
Factor Markets Integration
Introduction into Economic System of the EU
Faculty of law, Belgrade
R.Baldwin and C.Wyplosz: The Economics of European Integration, Ch.7 and 8
J.Pelkmans: European Integration, Ch.7 and 9
Thursday, November 24 , 2014
18:00 – 20:25
Miroljub Labus

Five topics
1. From product market integration to the entire market
integration
2. Financial and other services
3. Free movement of capital
4. Free movement of labor
5. Growth effectsGoods
Services/
Financial
services
Capital
mobility/Accumulation
and growth
Labor
mobility/unemployment

1. Market services integration
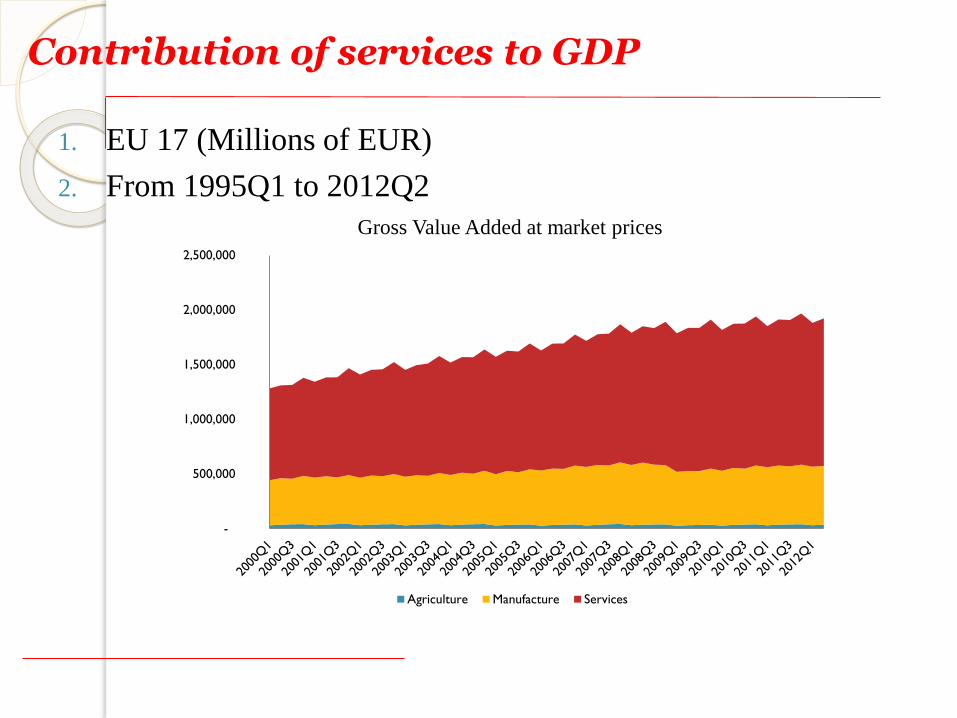
Contribution of services to GDP
1. EU 17 (Millions of EUR)
2. From 1995Q1 to 2012Q2
-
500,000
1,000,000
1,500,000
2,000,000
2,500,000
Gross Value Added at market prices
Agriculture Manufacture Services

Breakdown of services
1. EU 17 (Millions of EUR)
2. From 1995Q1 to 2012Q2
-
500,000
1,000,000
1,500,000
2,000,000
2,500,000
Services in the Euro Zone
Entertaiment Insurance Real estate Communication
Professional Information Public service Whole/Retail

A list of services
Tourism
Consulting
Market research
Broadcasting
Postal services
Telecom
Electricity and gas
Transportation
Advertising
Construction
Audio-visual
Banking
Insurance
Government services
Education
Health services
Local communal services
Hotel services
Restaurants
Coffee shops
Entertainment
Internet services
Cleaning
Printing shops
Weather forecasting
Legal services…

Classification of services in the internal market
All servicesTradable Non-Tradable
•Government
services
•Public
education
•Public health
•Local services
Non-regulated
•Tourism
•Consultancy
•Market
research…
RegulatedNetwork-based services
•Broadcasting
•Postal
•Telecoms
•Gas and electricity…
Non-network
based services
Real
•Transport
•Advertising
•Audio-visual
•Construction,…
Financial
•Banking
•Insurance
•Investment
Consumer services
•Hotels, restaurants
•Health
•Education
•Entertainment

Services market integration
Cross-border services are not tangible and are not subject to tariffs
ToR had no specific principles on services market liberalization
In 1990 share of services in GDP was 48%, in 2012 it was 70%
Job creation in the services sector between 1980-90 amounts to 10 millions
compared to 3.5 millions job losses in the manufacturing
Tradable services are twice larger than non-tradable services
B2B services are less regulated than B2C services
Two principles were crucial to promote liberalization of services
◦ Free movements
◦ Freedom of establishments
They directly apply to “economic” (tradable) services
The main obstacle is related to the “general-good clause” (“fit and proper”), i.e. a
general clause that introduces a minimum standard of soundness of market behavior
of banks and insurance companies, that is implemented by national supervisory
boards

From freedom of services to financial market integration
European financial area
◦ Internal market for financial services
◦ Internal market for financial capital and money
◦ A single currency
◦ Fiscal and accounting approximation
For major types financial services
◦ Banking
◦ Insurance
◦ Investment
◦ Assets management
Banks in the EU provide most of the investment services
Banks and insurance companies can merge in EU across the borders
The EU case law extends policy of liberalization of goods to liberalization of services
◦ Mutual recognition principle (EU passport or license)

Financial market integration path
1957 The ToR
◦ Unclear, to many conditions
1986 Single European Act – Breakthrough
◦ The first major revision of the ToR
◦ Basic objective was to create a single market in goods by 1992
1992 Maastricht Treaty – codified four freedoms
◦ Impossibility trinity
Free movement of capital
Pegged exchange rates, and
National autonomy in macroeconomic policy
◦ Freedom for financial capital

Impossible trinity
Free
capital
flow
Monetary
autonomyHard peg
No financial
services
liberalization

Impossible trinity
Free
capital
flow
Monetary
autonomyHard peg
Financial services
liberalization +
EUR

Impossible trinity
Free
capital
flow
Monetary
autonomyHard peg
Financial
services
liberalization
Free float
threatens trade
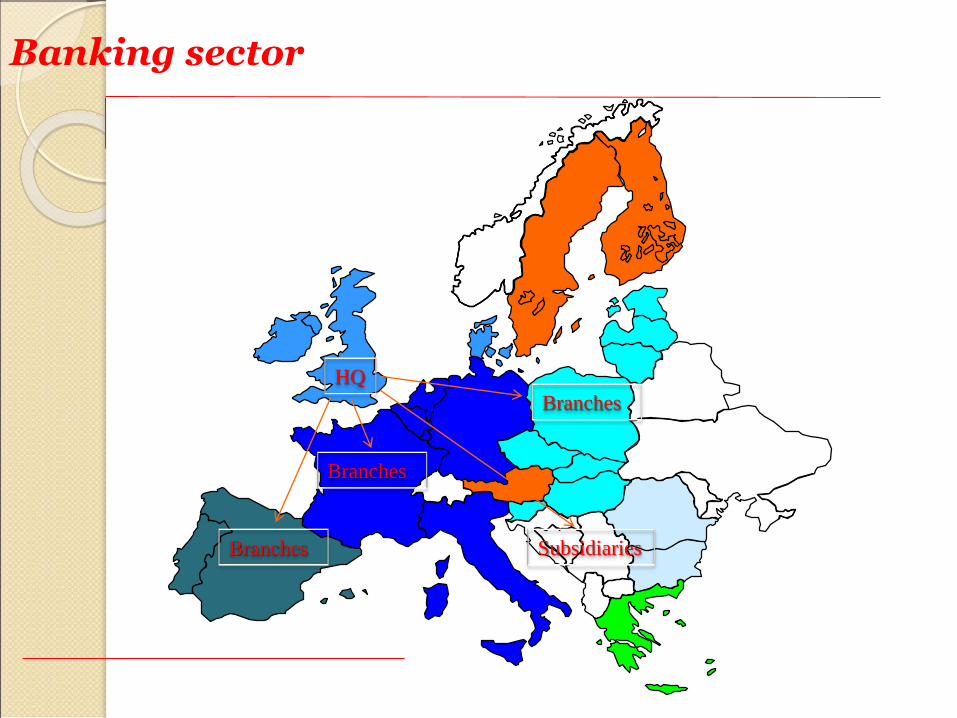
Banking sector
HQ
Branches
Branches
SubsidiariesBranches

Banking sector in Serbia: Exposure to HQs
Italy
31%
Austria
27%
Greece
26%
France
12%
Others
4%

Deepening financial market after 1992
Wholesales
•Securities settlement
•Mutual fund directive
•Pension fund directive
Retail
•Payment directive
•Insurance directive
•Anti money laundering
directive
Supervision
•Financial conglomerate dir.
•Re-Insurance supervision
•Basel III directive
•Cooperation of supervisions
•EBA
Horizontal
•Accounting rules
Corporate restructuring
•European company
statute
•Takeover bid directive

2. Capital market integration
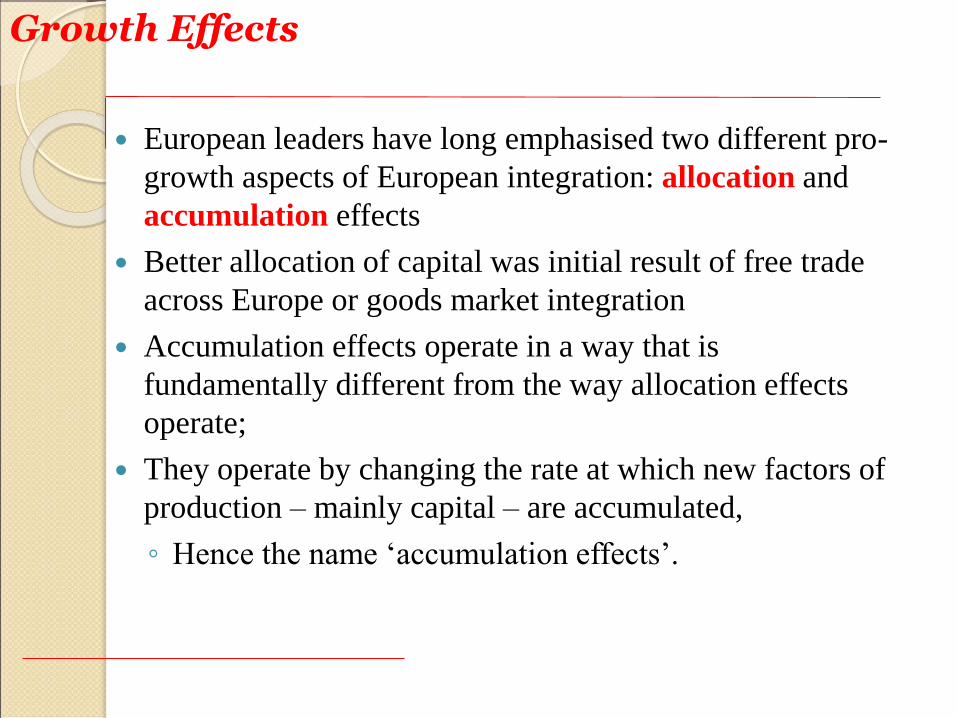
Growth Effects
European leaders have long emphasised two different pro-
growth aspects of European integration: allocation and
accumulation effects
Better allocation of capital was initial result of free trade
across Europe or goods market integration
Accumulation effects operate in a way that is
fundamentally different from the way allocation effects
operate;
They operate by changing the rate at which new factors of
production – mainly capital – are accumulated,
◦ Hence the name ‘accumulation effects’.
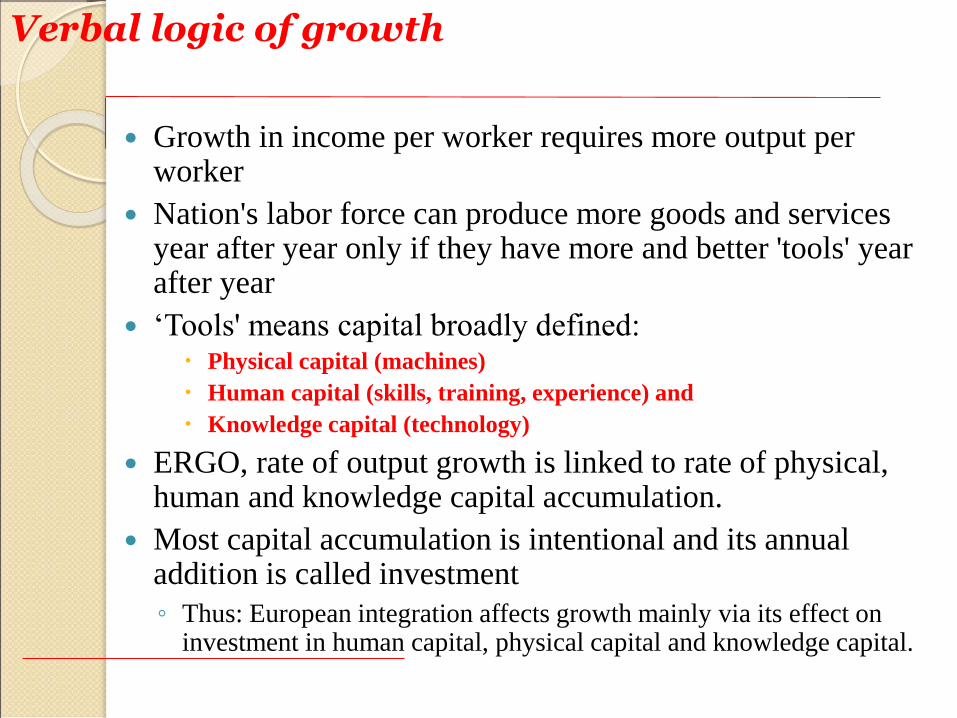
Verbal logic of growth
Growth in income per worker requires more output per worker
Nation's labor force can produce more goods and services year after year only if they have more and better 'tools' year after year
‘Tools' means capital broadly defined: Physical capital (machines)
Human capital (skills, training, experience) and
Knowledge capital (technology)
ERGO, rate of output growth is linked to rate of physical, human and knowledge capital accumulation.
Most capital accumulation is intentional and its annual addition is called investment
◦ Thus: European integration affects growth mainly via its effect on investment in human capital, physical capital and knowledge capital.

Verbal logic of growth: summary
•European
•integration
•Allocation
•effects
•Improved
•efficiency
•Better
•investment
•climate
•More
•investments
•Accumulation
•effects
•Higher
•output per
•worker

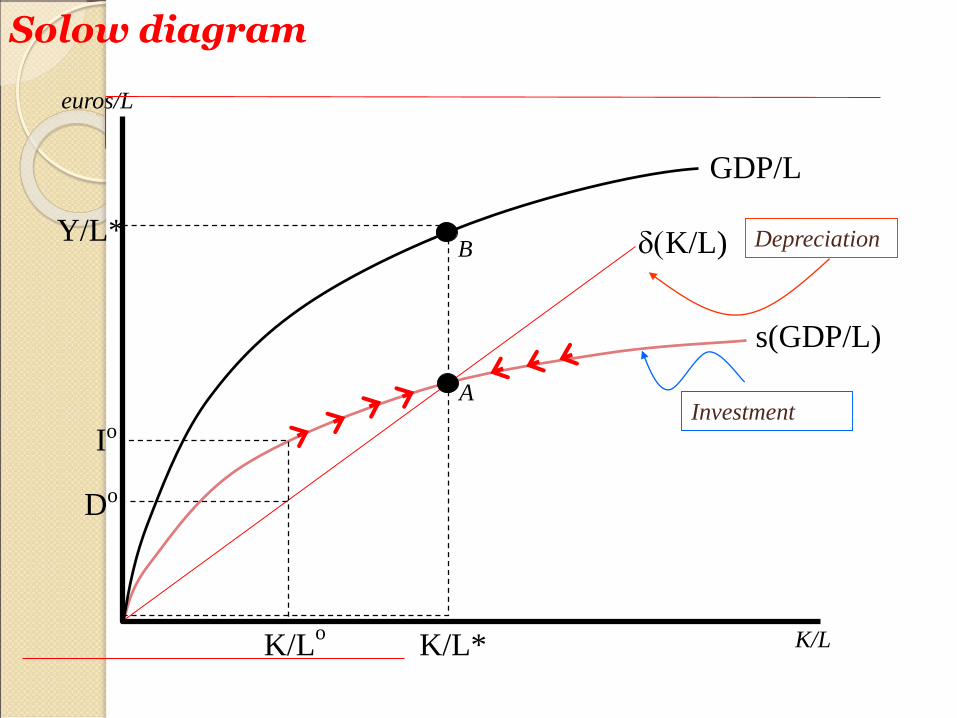
Solow diagram
Shows growth effects in a simple diagram
To simplify, start with whole EU as a single, closed
economy with fully integrated capital and labor markets
and the same technology everywhere.

Solow diagram
K/L
euros/L
GDP/L
Solow diagram
A
B
K/L
euros/L
GDP/L
s(GDP/L)
d(K/L)Y/L*
K/L*K/Lo
Io
Do
Depreciation
Investment

CE
D
B
K/L
euros/L
GDP/L
s(GDP/L)
d(K/L)
K/L’
GDP/L’
A
s(GDP/L)’
Y/Lc
Y/L’
Induced accumulation effect
Y/L*
K/L*
Technological progress (capital saving one)
Allocation effect
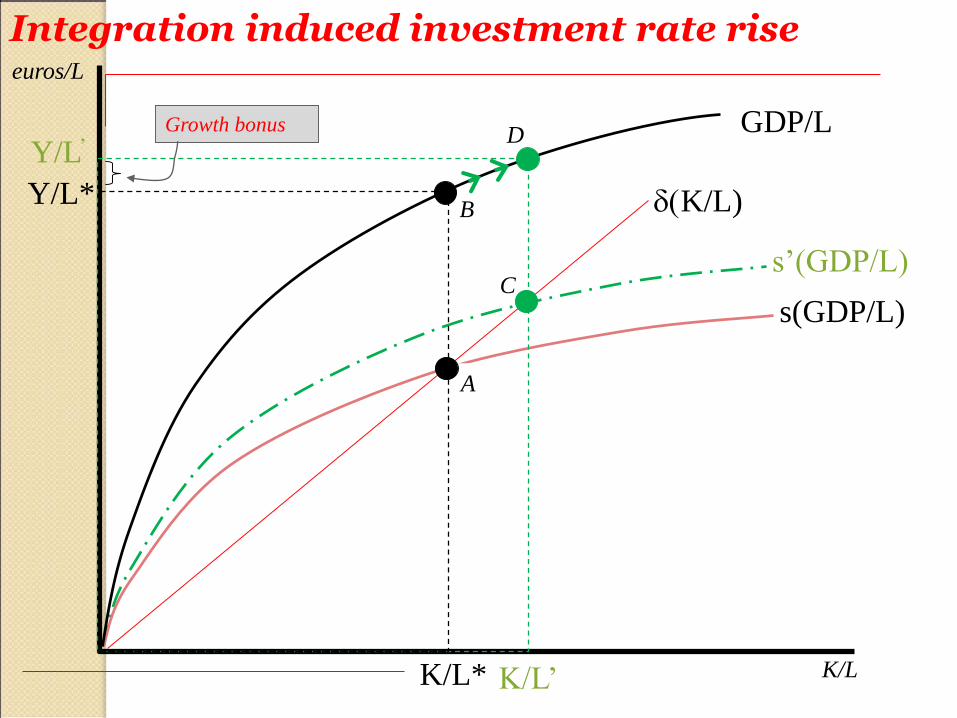
Integration induced investment rate rise
C
D
B
K/L
euros/L
GDP/L
s(GDP/L)
d(K/L)
K/L’
A
s’(GDP/L)
Y/L’Growth bonus
Y/L*
K/L*
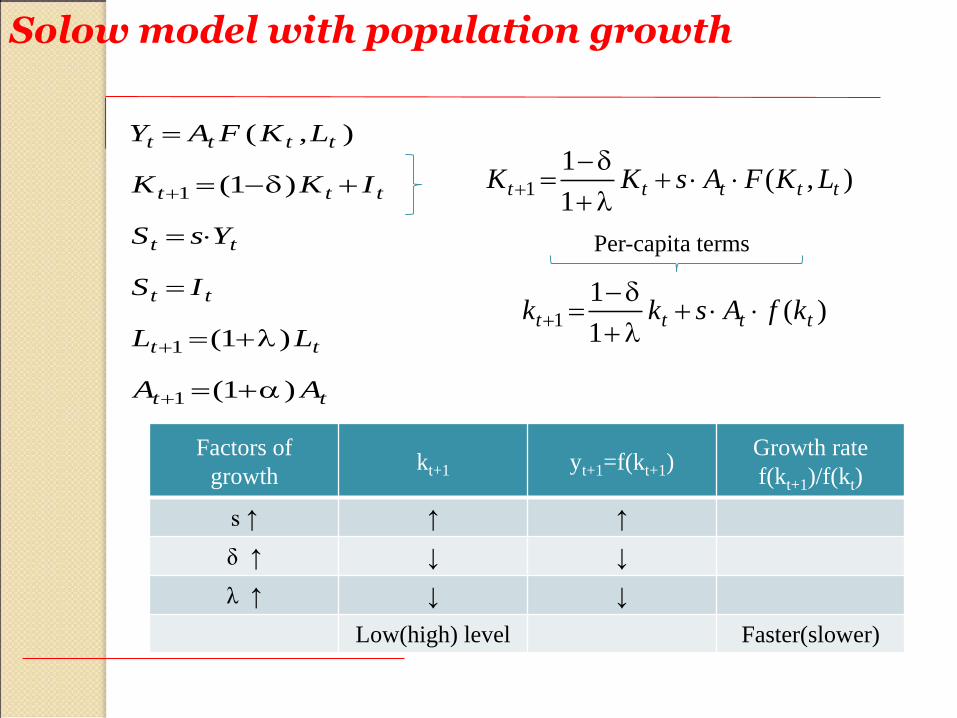
Solow model with population growth
tt
tt
tt
tt
ttt
tttt
AA
LL
IS
YsS
IKK
LKFAY
)1(
)1(
)1(
),(
1
1
1
d
),(
1
11 ttttt LKFAsKK
d
)(1
11 tttt kfAskk
d
Factors of
growthkt+1 yt+1=f(kt+1)
Growth rate
f(kt+1)/f(kt)
s ↑ ↑ ↑
δ ↑ ↓ ↓
λ ↑ ↓ ↓
Low(high) level Faster(slower)
Per-capita terms
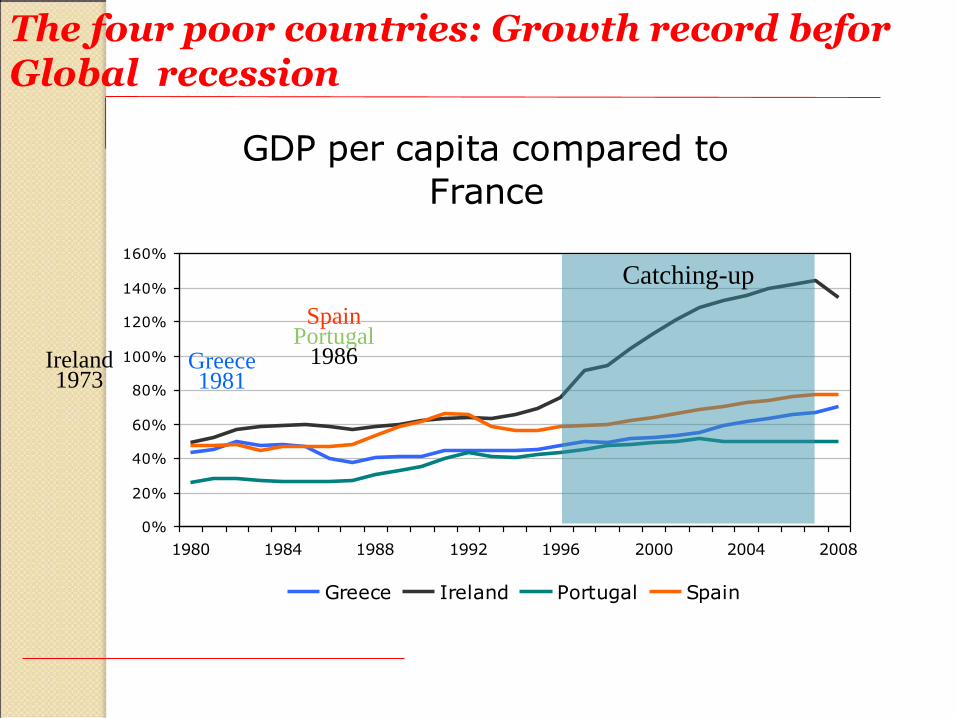
The four poor countries: Growth record befor Global recession
GDP per capita compared to
France
0%
20%
40%
60%
80%
100%
120%
140%
160%
1980 1984 1988 1992 1996 2000 2004 2008
Greece Ireland Portugal Spain
Catching-up
Spain Portugal
1986Greece1981
Ireland1973

What happened to the Irish Miracle?
What created the miracle?
1. Tax haven and inflow of foreign capital
2. Increased public spending and commitments
3. Increased private and public borrowing on the Euro market
4. Heavy investments in the real estate sector
...And what caused the crises?
1. Credit crunch and sudden stop of capital inflow
2. Fall of prices of real estate and increase in number of defaults
3. Expensive bailing-out of banks, unsustainable pensions and social
programs
4. Borrowing under unfavourable terms
5. Treat of defaults and bankruptcies
IMF SBA

What happened to Serbia?
Use the Solow diagram to analyses the following
situation:
1. Serbia’s K/L was pushed bellow its equilibrium by
war damage to its capital stock
2. EU granted ATP to Serbia that have two effects
1. It increases the efficiency of the Serbian economy
(allocation effect) and
2. It raises the Serbian investment rate (s) over next ten years
(accumulation effect)
Show where the Serbian economy would end up in the
long-run.
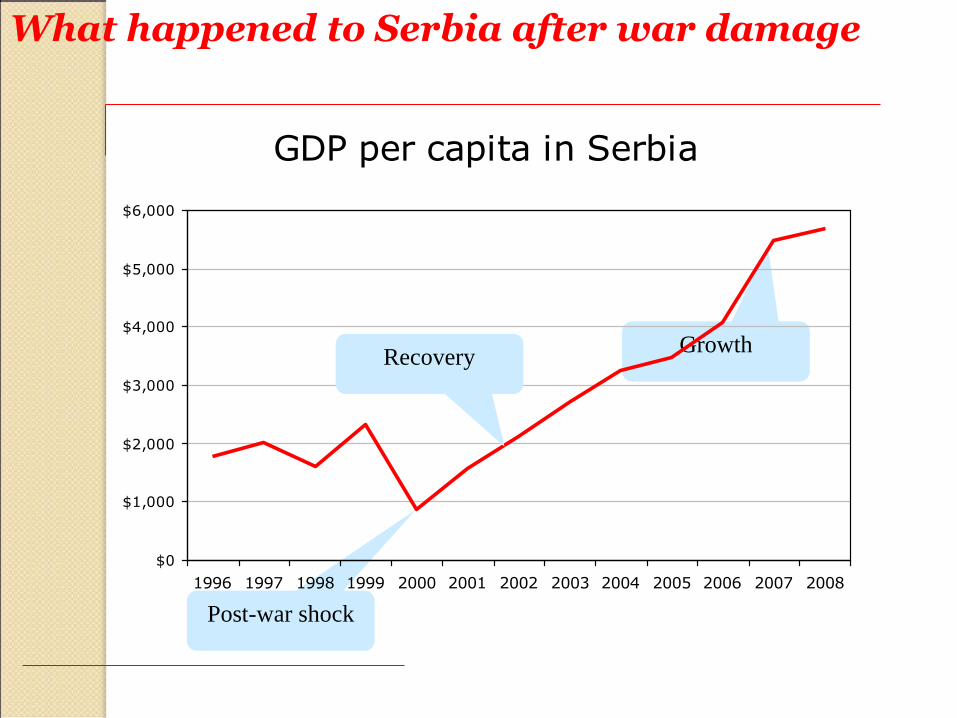
Post-war shock
Growth
GDP per capita in Serbia
$0
$1,000
$2,000
$3,000
$4,000
$5,000
$6,000
1996 1997 1998 1999 2000 2001 2002 2003 2004 2005 2006 2007 2008
What happened to Serbia after war damage
Recovery

What happened to Serbia after war damage
A*
B*
K/L
euros/L
GDP/L
s0(GDP/L)
d(K/L)
Y/L0
K/L*K/Lo
A0
B0
B’
C
D
Y/L’
K/Law
saw(GDP/L)
Y/Law
GDP/L’

3. Labor market integration
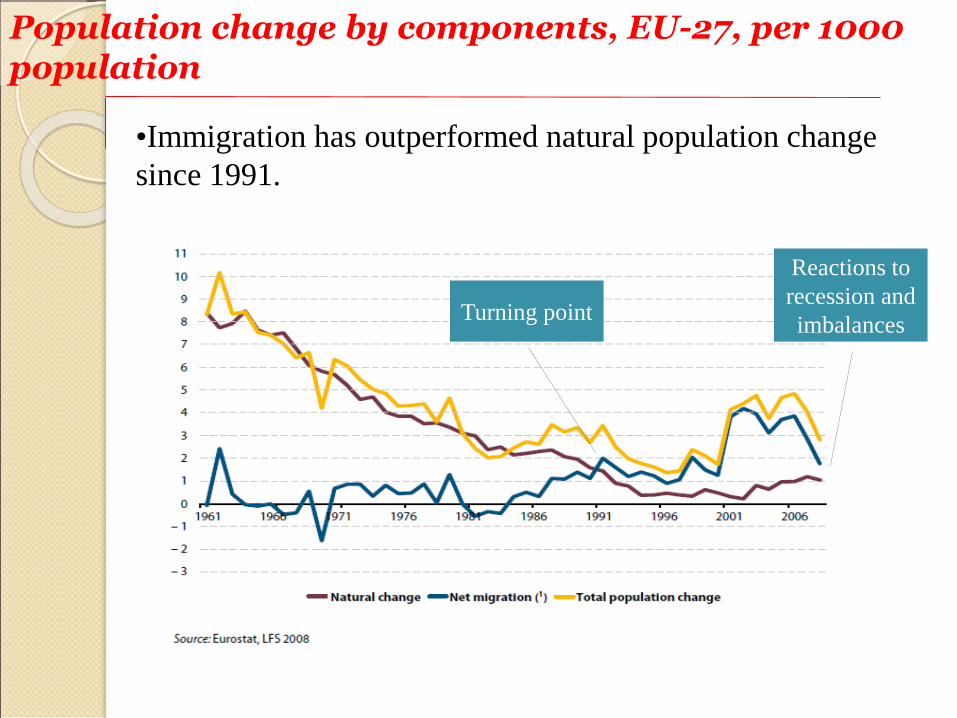
Population change by components, EU-27, per 1000 population
•Immigration has outperformed natural population change
since 1991.
Turning point
Reactions to
recession and
imbalances

Immigration density
Share of foreigners in the resident population, as of 1.1.2012.
0
10
20
30
40
50L
uxe
mb
ourg
Cypru
s
Latv
ia
Esto
nia
Sp
ain
Au
str
ia
Be
lgiu
m
Ire
lan
d
Ge
rma
ny
Gre
ece
Italy
Unite
d K
ing
do
m
Sw
ed
en
Den
ma
rk
Fra
nce
Ma
lta
Neth
erl
an
ds
Po
rtug
al
Slo
ve
nia
Czech
Rep
ublic
Fin
land
Hun
ga
ry
Slo
va
kia
Lith
uan
ia
Bu
lga
ria
Cro
atia
Rom
an
ia
Po
lan
d
Avera
ge
Non-EU foreigners EU foreigners
Source: Eurostat, YB2013
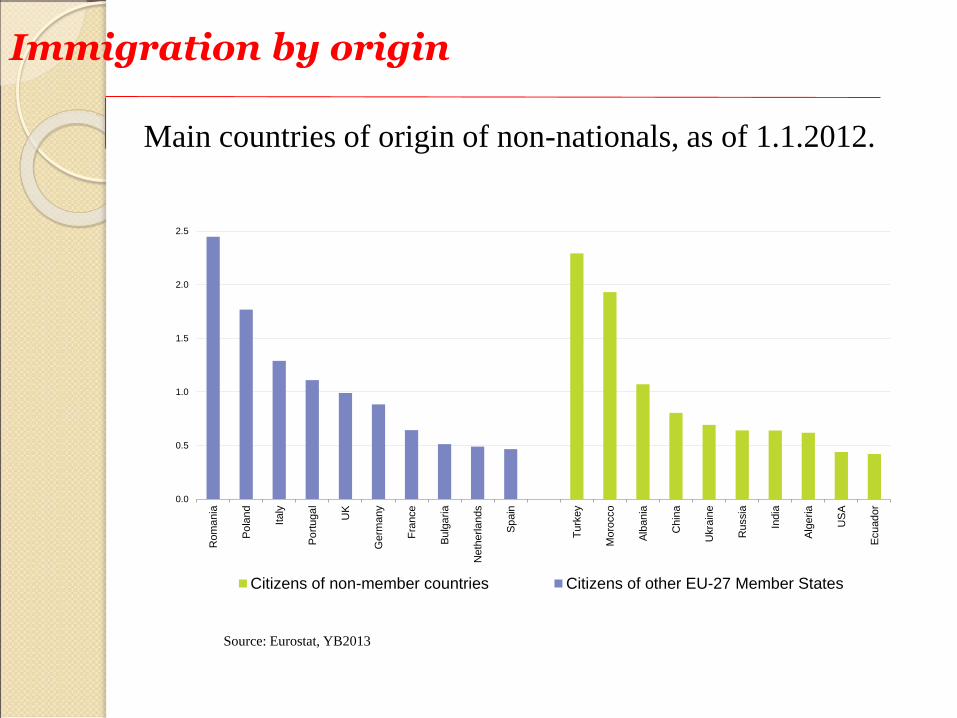
Immigration by origin
Main countries of origin of non-nationals, as of 1.1.2012.
Source: Eurostat, YB2013
0.0
0.5
1.0
1.5
2.0
2.5
Rom
ania
Po
lan
d
Italy
Po
rtuga
l
UK
Germ
any
Fra
nce
Bu
lga
ria
Neth
erla
nds
Sp
ain
Tu
rkey
Mo
rocco
Alb
an
ia
Chin
a
Ukra
ine
Russia
India
Alg
eria
US
A
Ecuador
Citizens of non-member countries Citizens of other EU-27 Member States

Age structure of the EU population in 2011
Age structure of the national and non-national populations
Source: Eurostat, YB2013
0
25
50
75
100
3% 2% 1% 0% 1% 2% 3%
Nationals Foreigners
Men Women
Age
100+

ECB: Unemployment in the euro zone
Shares in total labor force

ECB: Unit labor cost (compensation per employee and labour productivity)
Rate of growth

Labour market is regulated
Existing institutions differ from country to country
They are the outcome of a long, and often conflicting,
history
Various forms
◦ Collective negotiations
◦ Minimum wage legislation
◦ Unemployment insurance
◦ Payroll taxes

Collective negotiations
Social objective: protect workers from bosses’ excessive
powers
Economic impact: unemployment
The role of the degree of centralization
Plant level: induces some wage restraint
National level: induces some wage restraint
Branch level: less restraint
The integration and monetary union impact
◦ One big market: current degree of coordination in collective
negotiations decline
◦ One central bank: more wage discipline
Will trade unions respond by organizing at EU level?

Minimum wage legislation
Social objectives
◦ Protect the weakest
◦ Reduce inequality
Economic impact: unemployment of the least skilled
The integration and monetary union impact
◦ Enhanced competition favors low cost countries
◦ Accessions of CEECs sharpens this aspect
◦ Trade unions fear social dumping and call for harmonization of social norms
Unemployment insurance
Social objective: protect workers from a major risk
Economic impact: more unemployment
The integration and monetary union impact
◦ Asymmetric shocks create temporary unemployment
◦ Generous insurance may prolong the adjustment
◦ Pressure to reduce generosity, mainly duration, of benefits
◦ Trade unions fear social dumping.

Payroll taxes
Social objective: solidarity among workers in financing unemployment, health, retirement
Economic impact: raises cost of labor, or reduces wages, or both
The integration and monetary union impact
◦ Enhanced competition favors low cost countries
◦ Incentive to either reduce welfare payments or raise other taxes
◦ Politically difficult.
How to respond to deeper integration?
Deeper integration desirable because it enhances
competition on the good markets
More competition raises the economic costs of many
labor market institutions
A sharpening of the conflict between economic
effectiveness and social objectives
Existing arrangements are threatened by the present
crisis.

Three possible evolutions
Two-speed Europe
Deep reforms
Social harmonization

Possible evolution No.1
Two-speed Europe
◦ Some countries flex their labor markets, others retain
their highly social existing arrangements
◦ Firms and risk-taking individuals move to the most
flexible countries
◦ Welfare-conscious are attracted by welfare-magnet
countries
◦ Part of Europe grows fast with low unemployment,
another part grows slowly with permanently high
unemployment.
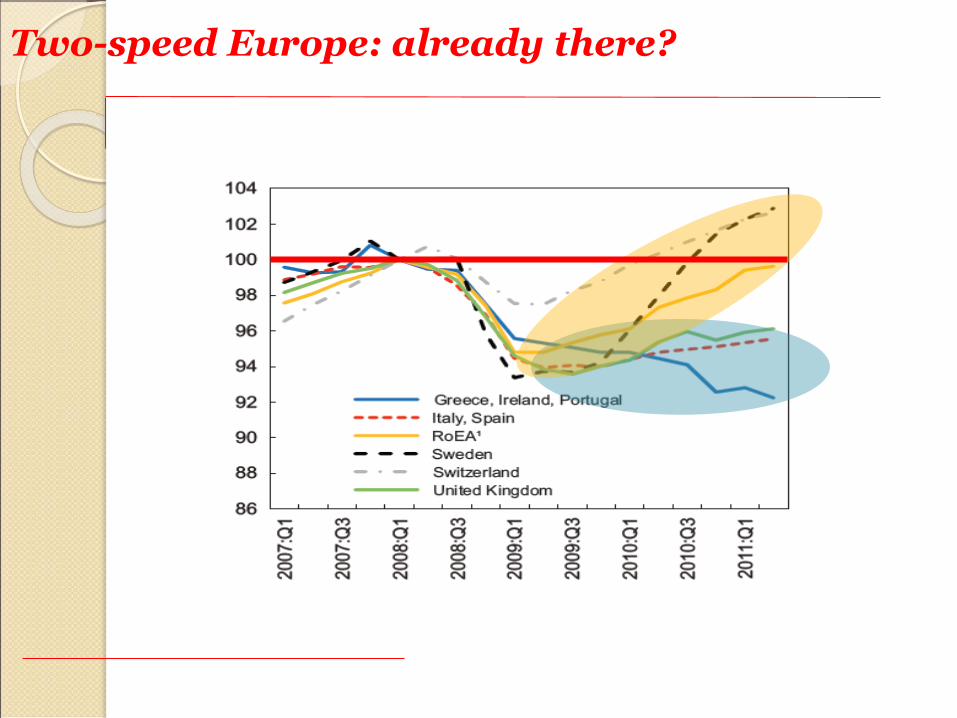
Two-speed Europe: already there?

Possible evolution No.2
Deep reforms
◦ Thatcher takes over Europe
◦ Labor market institutions made more flexible
◦ Labor taxes reduced.

Possible evolution No.3
Social harmonization
◦ The large countries export their welfare systems
through social norms applicable to all EU countries.

In the end
There is no better way, just different socio-economic
equilibria.