growth, engagement & search metrics: snake oil or north stars
TRANSCRIPT
Search, Growth & Engagement Metrics:Snake Oil or North Stars
Dr. June Andrews
April 29, 2015
Table of Contents
1 Product Evolution
2 Metric Case StudiesGrowthEngagementSearch
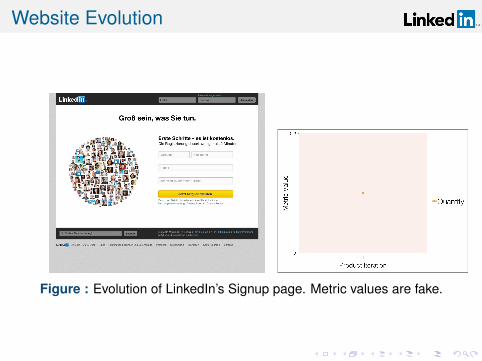
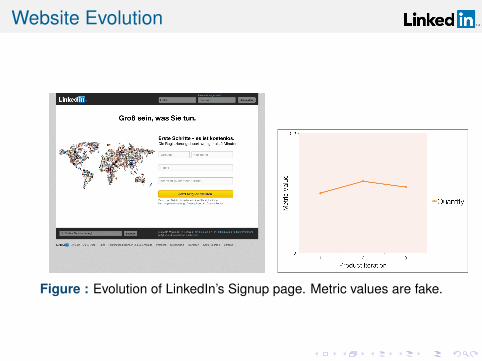
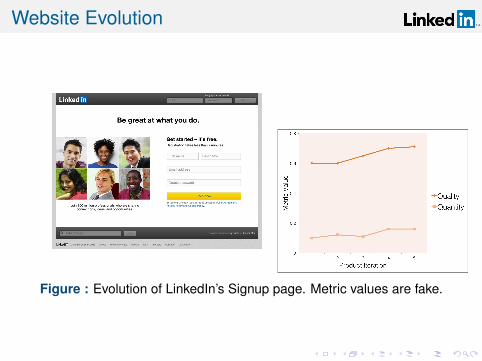
Website Evolution
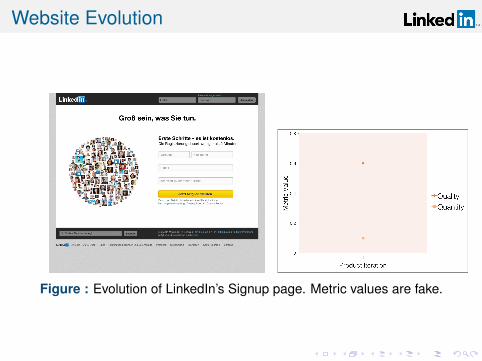
Figure : Evolution of LinkedIn’s Signup page. Metric values are fake.
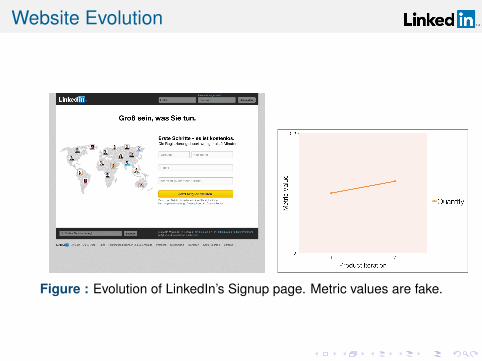
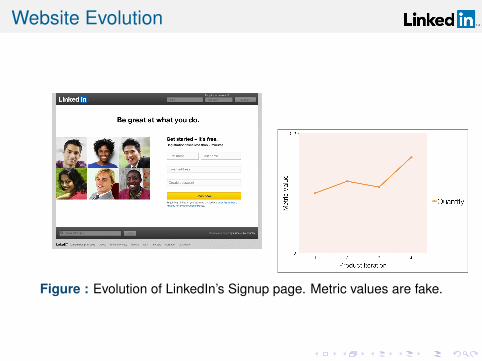
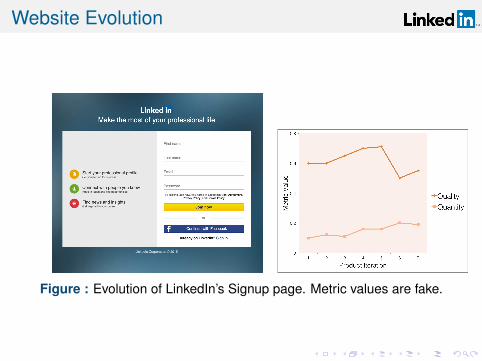
Website Evolution
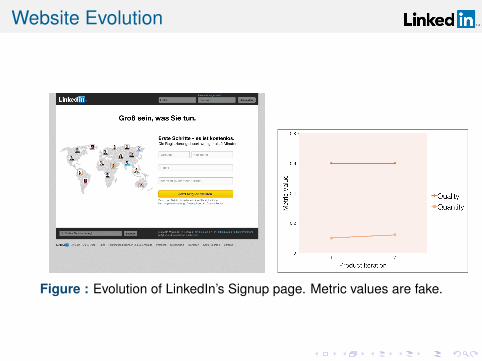
Figure : Evolution of LinkedIn’s Signup page. Metric values are fake.
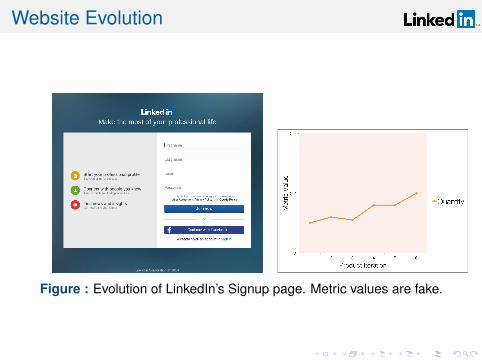
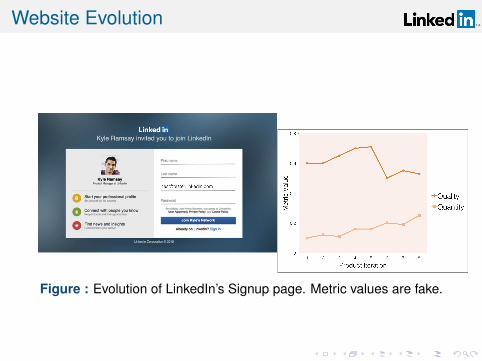
Website Evolution
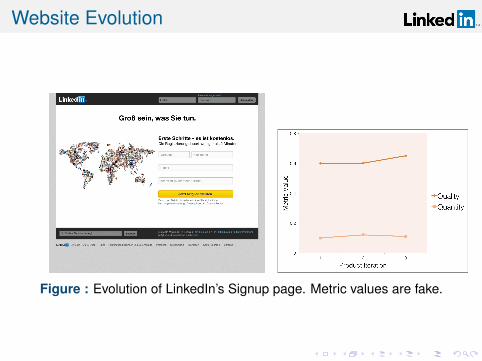
Figure : Evolution of LinkedIn’s Signup page. Metric values are fake.
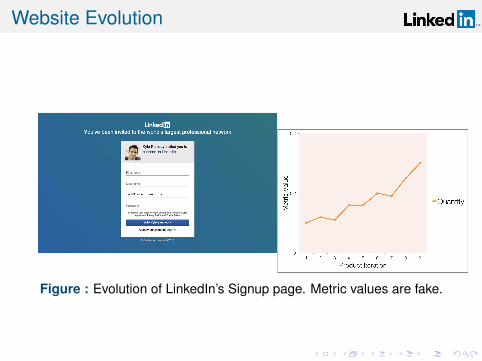
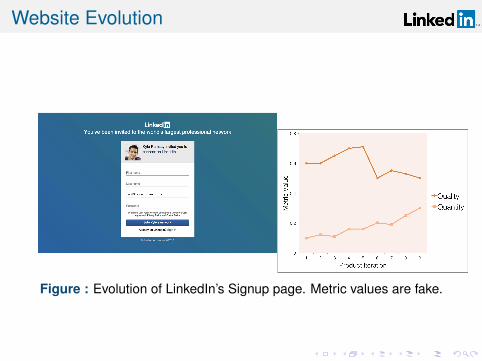
Website Evolution
Figure : Evolution of LinkedIn’s Signup page. Metric values are fake.

Website Evolution
Figure : Evolution of LinkedIn’s Signup page. Metric values are fake.
Website Evolution
Figure : Evolution of LinkedIn’s Signup page. Metric values are fake.

Website Evolution
Figure : Evolution of LinkedIn’s Signup page. Metric values are fake.

Website Evolution
Figure : Evolution of LinkedIn’s Signup page. Metric values are fake.
Website Evolution
Figure : Evolution of LinkedIn’s Signup page. Metric values are fake.
Website Evolution
One Team, One MetricNot the complete picture.
Website Evolution
Figure : Evolution of LinkedIn’s Signup page. Metric values are fake.
Website Evolution
Figure : Evolution of LinkedIn’s Signup page. Metric values are fake.
Website Evolution
Figure : Evolution of LinkedIn’s Signup page. Metric values are fake.

Website Evolution
Figure : Evolution of LinkedIn’s Signup page. Metric values are fake.
Website Evolution
Figure : Evolution of LinkedIn’s Signup page. Metric values are fake.

Website Evolution
Figure : Evolution of LinkedIn’s Signup page. Metric values are fake.
Website Evolution
Figure : Evolution of LinkedIn’s Signup page. Metric values are fake.
Website Evolution
Figure : Evolution of LinkedIn’s Signup page. Metric values are fake.
Website Evolution
Figure : Evolution of LinkedIn’s Signup page. Metric values are fake.

Website Evolution
One Team, One Multiple MetricsNot the complete picture.

Website Evolution
Figure : 6 teams impact first 5 pages in registration flow: Security,Profile, Connections, Channels, Mobile, Registration
Website Evolution
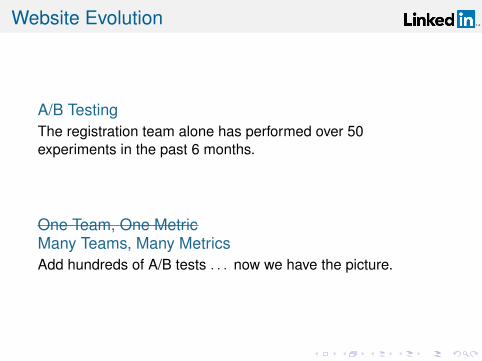
A/B TestingThe registration team alone has performed over 50experiments in the past 6 months.
One Team, One MetricMany Teams, Many MetricsAdd hundreds of A/B tests . . . now we have the picture.
Worst Case
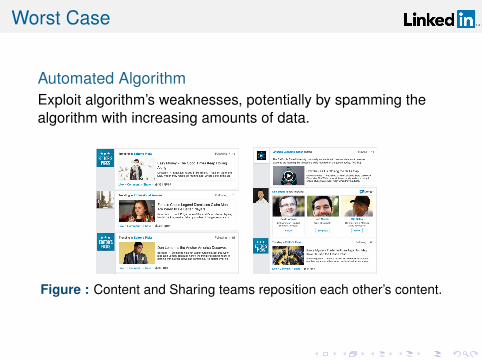
Automated AlgorithmExploit algorithm’s weaknesses, potentially by spamming thealgorithm with increasing amounts of data.
Figure : Content and Sharing teams reposition each other’s content.

Worst Case
Figure : Teams undo each other’s work.
Figure : Content and Sharing teams reposition each other’s content.

Enter Metrics
Figure : Metrics act as conductors for website development.(De La Parra in SF)
Metrics
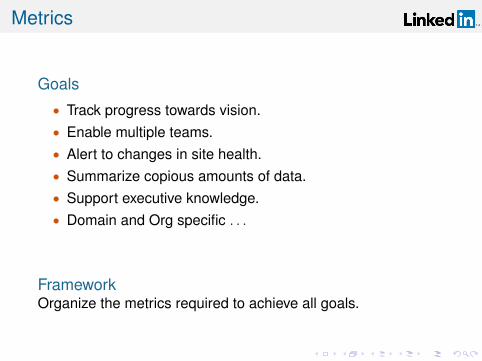
Goals
• Track progress towards vision.• Enable multiple teams.• Alert to changes in site health.• Summarize copious amounts of data.• Support executive knowledge.• Domain and Org specific . . .
FrameworkOrganize the metrics required to achieve all goals.
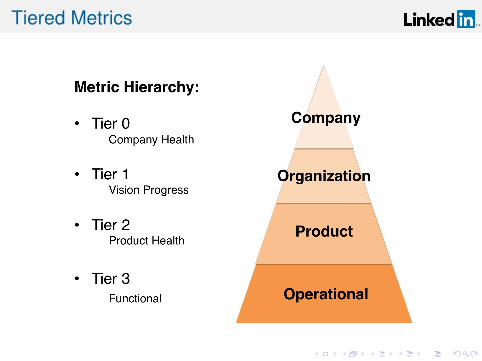
Tiered Metrics
Progress
1 Product Evolution
2 Metric Case StudiesGrowthEngagementSearch

Growth
VisionConnect the world’s professionals to make them moreproductive and successful.
Growth’s VisionReach the world’s professionals.
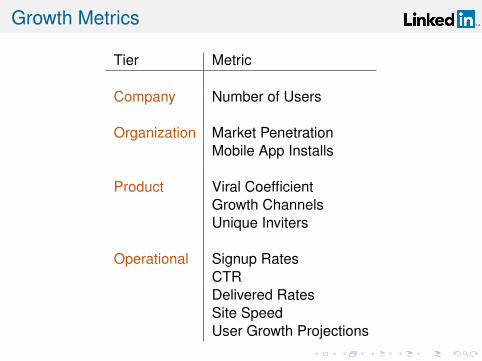
Growth Metrics
Tier Metric
Company Number of Users
Organization Market PenetrationMobile App Installs
Product Viral CoefficientGrowth ChannelsUnique Inviters
Operational Signup RatesCTRDelivered RatesSite SpeedUser Growth Projections
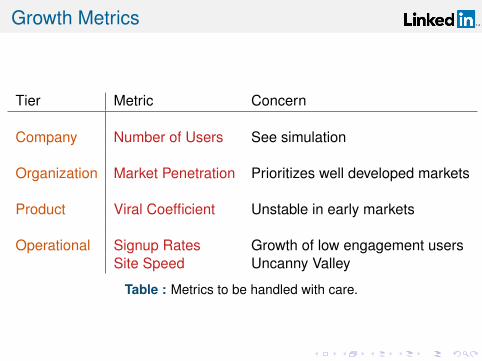
Growth Metrics
Tier Metric Concern
Company Number of Users See simulation
Organization Market Penetration Prioritizes well developed markets
Product Viral Coefficient Unstable in early markets
Operational Signup Rates Growth of low engagement usersSite Speed Uncanny Valley
Table : Metrics to be handled with care.
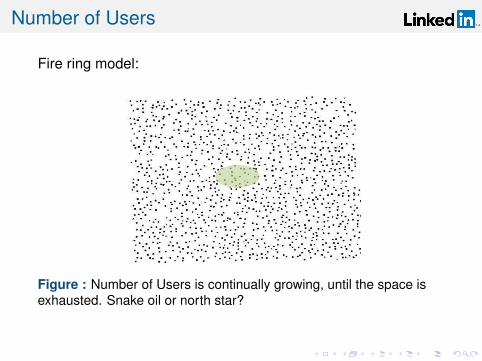
Number of Users
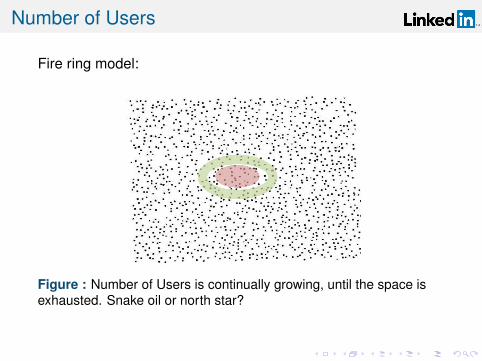
Fire ring model:
Figure : Number of Users is continually growing, until the space isexhausted. Snake oil or north star?
Number of Users
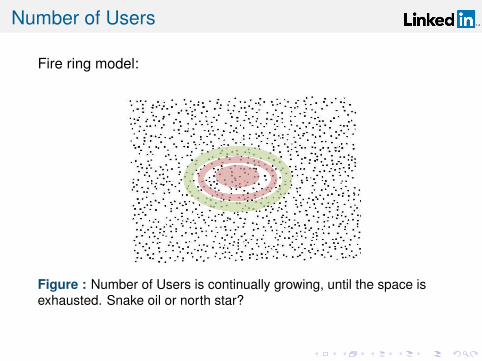
Fire ring model:
Figure : Number of Users is continually growing, until the space isexhausted. Snake oil or north star?
Number of Users
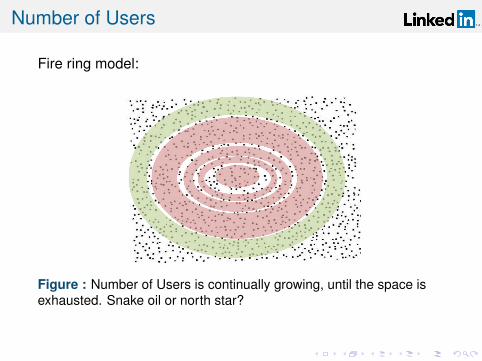
Fire ring model:
Figure : Number of Users is continually growing, until the space isexhausted. Snake oil or north star?
Number of Users
Fire ring model:
Figure : Number of Users is continually growing, until the space isexhausted. Snake oil or north star?
Progress
1 Product Evolution
2 Metric Case StudiesGrowthEngagementSearch
Engagement
VisionConnect the world’s professionals to make them moreproductive and successful.
Engagement’s VisionFoster interactions among the world’s professionals.
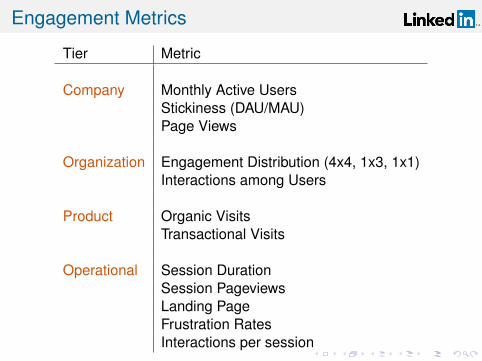
Engagement Metrics
Tier Metric
Company Monthly Active UsersStickiness (DAU/MAU)Page Views
Organization Engagement Distribution (4x4, 1x3, 1x1)Interactions among Users
Product Organic VisitsTransactional Visits
Operational Session DurationSession PageviewsLanding PageFrustration RatesInteractions per session
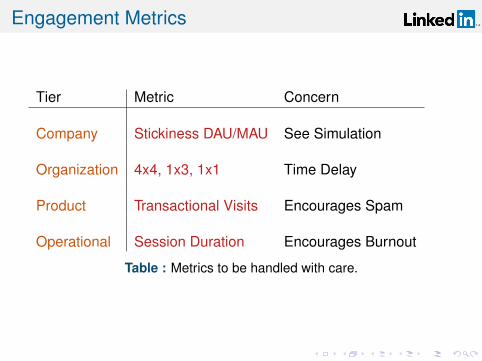
Engagement Metrics
Tier Metric Concern
Company Stickiness DAU/MAU See Simulation
Organization 4x4, 1x3, 1x1 Time Delay
Product Transactional Visits Encourages Spam
Operational Session Duration Encourages Burnout
Table : Metrics to be handled with care.
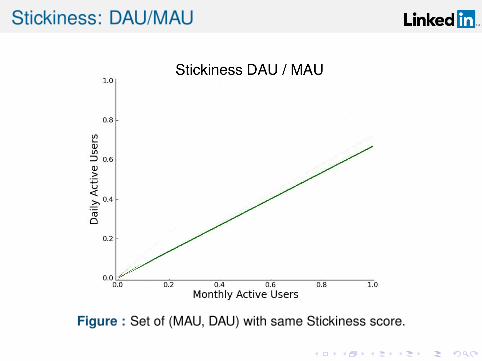
Stickiness: DAU/MAU
Figure : Set of (MAU, DAU) with same Stickiness score.
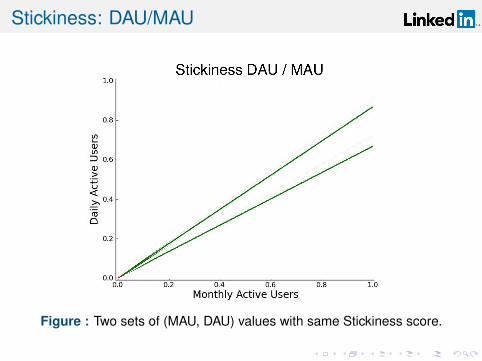
Stickiness: DAU/MAU
Figure : Two sets of (MAU, DAU) values with same Stickiness score.
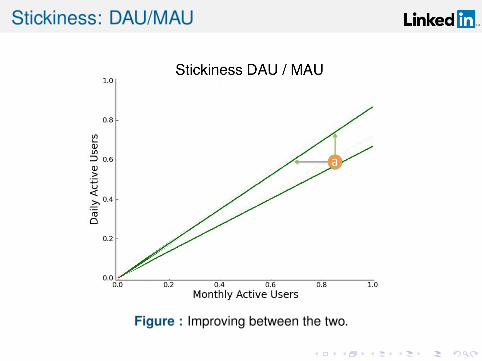
Stickiness: DAU/MAU
Figure : Improving between the two.

Stickiness: DAU/MAU
Snake OilDecrease in MAU leads to an increase in Stickiness. Exclusivitywas not part of the engagement vision. Optimizing the metricdoes not lead to achieving the vision.
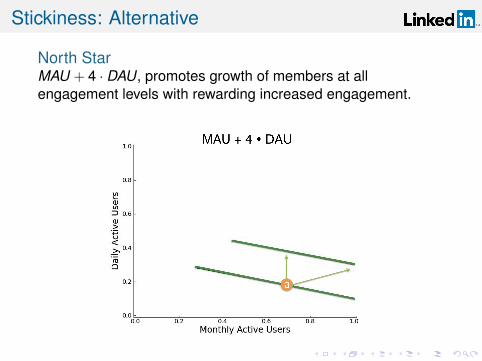
Stickiness: Alternative
North StarMAU + 4 · DAU, promotes growth of members at allengagement levels with rewarding increased engagement.
Progress
1 Product Evolution
2 Metric Case StudiesGrowthEngagementSearch
Search
VisionConnect the world’s professionals to make them moreproductive and successful.
Search’s VisionProvide fast efficient search to enable professional to be moreproductive.
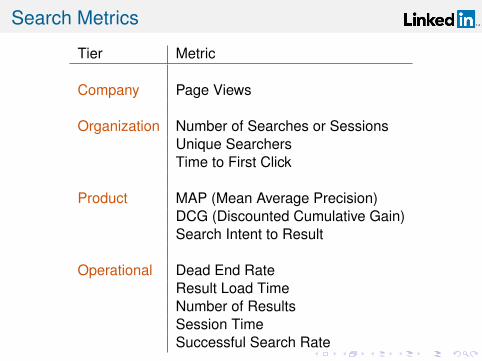
Search Metrics
Tier Metric
Company Page Views
Organization Number of Searches or SessionsUnique SearchersTime to First Click
Product MAP (Mean Average Precision)DCG (Discounted Cumulative Gain)Search Intent to Result
Operational Dead End RateResult Load TimeNumber of ResultsSession TimeSuccessful Search Rate
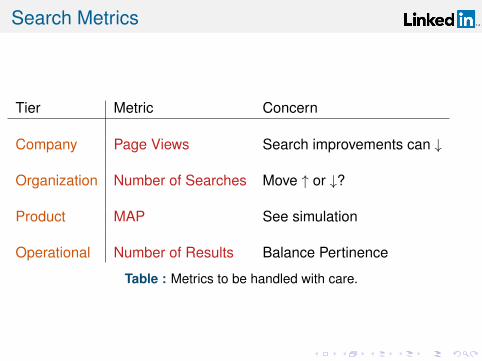
Search Metrics
Tier Metric Concern
Company Page Views Search improvements can ↓
Organization Number of Searches Move ↑ or ↓?
Product MAP See simulation
Operational Number of Results Balance Pertinence
Table : Metrics to be handled with care.

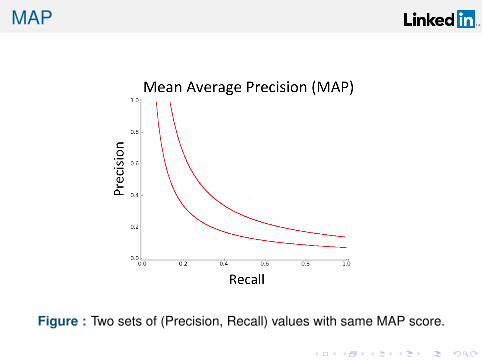
MAP
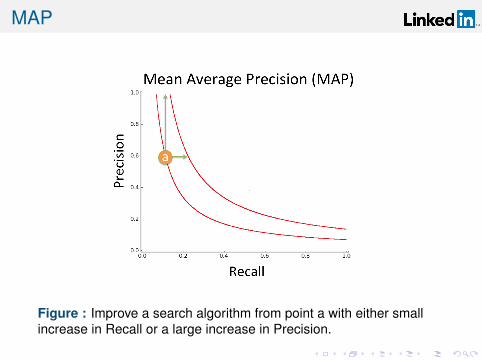
MAP combines:• Precision - Give me only what I want• Recall - Give me everything I want
Figure : (Precision, Recall) values with same MAP score.
MAP
Figure : Two sets of (Precision, Recall) values with same MAP score.
MAP
Figure : Improve a search algorithm from point a with either smallincrease in Recall or a large increase in Precision.
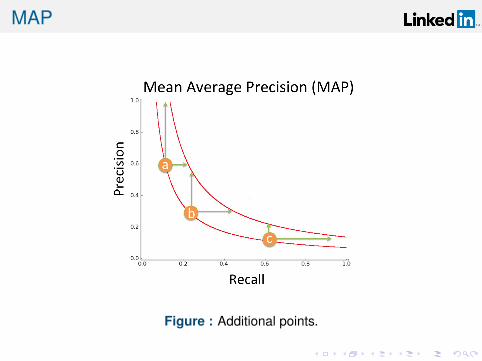
MAP
Figure : Additional points.

MAP
Snake OilWhen Precision and Recall values are not balanced, MAP onlyresponds to changes in the lower one.
North StarWhen Precision and Recall values are balanced, promotesimprovement of both Precision and Recall.
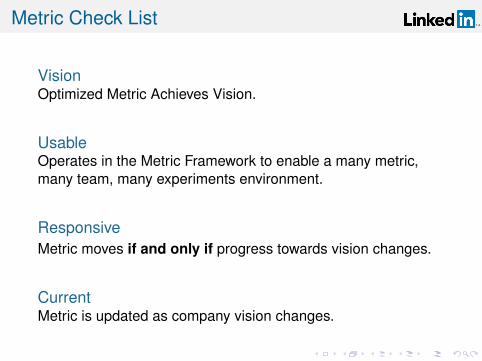
Metric Check List
VisionOptimized Metric Achieves Vision.
UsableOperates in the Metric Framework to enable a many metric,many team, many experiments environment.
ResponsiveMetric moves if and only if progress towards vision changes.
CurrentMetric is updated as company vision changes.
Thankyou!
References:• Fire Ring - Johan Ugander• Measure Me• Mean Average Precision Isn’t So Nice
juneandrews.com