growth – investment strategies based on strong growth stocks
TRANSCRIPT

1
Abstract — In this work was developed a stock selection model
based on genetic algorithms and fundamental analysis using
financial ratios obtained through an extensive analysis of financial
reports of American companies. The effectiveness of the algorithm
is evaluated in the major indices US: NASDAQ 100, S&P 500 and
NASDAQ, with three different strategies in a test period
comprising the years 2014 and 2015 and with training data
between the years 2011 and 2013. The used strategies involved the
use of growth ratios, profitability and debt. Genes that are used in
the chromosomes of genetic algorithm corresponds to weights that
are applied to a financial data matrix that was previously
transformed by a process rank. This process transforms the actual
data of each ratio in a ranking company, where the value obtained
is the relative position of that company in the index. The obtained
results in the tests showed that strategies based on genetic
algorithms and financial analysis can generate greater returns
than investments based only on the index, with values that can be
around 56% and 36% for the NASDAQ 100 and S&P 500
respectively.
Index Terms — Fundamental Analysis, Financial Statements,
Financial Ratios, Genetic Algorithms, Stock Picking, Computing
I. INTRODUCTION
OR many years the capital markets, particularly the stock
market, is of great interest in the financial environment,
particularly by investors. As the main objective of an investor
is to get the maximum profit with minimal risk as possible,
always tried to improve the tools for selecting the best stocks.
However, an analysis of all US stock indexes can easily become
a extremely complex task because of the size of those markets.
The main US stock market index, the National Association of
Securities Dealers Automated Quotation System or simply
NASDAQ, consists of more than 3000 companies. If investors
want to analyze the financial data of all these companies over
the last five years, they would have to analyze approximately
60000 financial reports reported to the .S. Securities and
Exchange Commission (SEC). Therefore, an intelligent
decision support systems research began to be important and to
be largely investigated.
The use of intelligent systems, including machine learning
algorithms for stock market analysis, made possible the analysis
of all this data in a timely manner for the decision-making in
terms of investment. Methods such as neural networks (ANN),
support vector machines (SVM) and genetic algorithms (GA)
have been used and developed to respond to these problems.
II. RELATED WORK
A. Financial Market
Financial markets allows sellers and buyers negotiate
financial products through legal contracts, which guarantee the
buyer future income rights [1].
According the analysis pretended, the financial markets can
be classified according the following distribution, affected by
financial product maturity traded:
Money Market: in this market are transacted short-
term financial products, like treasure bills,
commercial paper and certificates of deposit;
Derivatives Market: the financial instruments in this
market have an intrinsic value linked to other asset.
Swaps, forwards, futures and options are examples
of financial instruments transacted in this market;
Capital Market: long-term financial instruments are
transacted in this market. This market can be spitted
in two: stock market and bond market.
In this work only the stock market is studied and analyzed. The
financial instrument traded in this market is the stock. A stock
symbolizes the smallest percentage of the capital of an
enterprise that an investor may have in their possession. Thus,
an investor to buy a set of stocks will become owner of a
percentage of the company share capital in which it invested.
The stock price is not fixed and depends on many different
factors that influence the price evolution such as the current
performance of the company, future expectations, the current
economic environment, industry developments, and other more
factors [2].
B. Fundamental Analysis
Fundamental analysis is the most used tool in evaluating
company’s financial conditions over time. Furthermore, it’s
possible to check about current performance and predict future
gains, or losses, and provide to investors the risk level that a
Growth – Investment Strategies based on Strong
Growth Stocks
Fábio Rúben R. Sendim
Instituto Superior Técnico, Av. Rovisco Pais 1, 1049-001 Lisboa, Portugal
F

2
particular company has. Fundamental analysis is based on
information provided by Financial Statements: balance sheet,
income statements, cash flows and changes in shareholders’
equity.
The use of financial ratios is possibly the most widely used
method for a company financial analysis. The temporal analysis
of ratios allows to investor monitoring the company in which it
invested in the financial level and evaluating in a quantitative
way if your investment may generate profits [3][4]. The main
ratios used are the following:
Debt to Equity Ratio:
The debt to equity ratio measures the financial leverage of a
related company and the source of external financing [5]:
/Liabilities
D EEquity
(1)
Gross Margin Ratio:
Gross margin ratio shows the profitability of revenues, or in
other words, the percentage of revenues that a company retains
after cost of goods sold deduction:
Revenues-Cost of goods sold
RevenuesGM (2)
Net Profit Margin Ratio:
The ratio of net profit margin gives the percentage of
revenues that are really retained into profit:
Net Profit
RevenuesNPM (3)
Return on Equity – ROE:
The Return on Equity (ROE) shows the investors the
percentage of return of investments made. It’s capability of a
company in generate profits:
Net Income
Total EquityROE (4)
Price-Earnings Ratio - PER:
Price-Earnings Ratio (PER) is the coefficient between
stock price and Earnings per Share (EPS) for a given
company. This ratio could define if a stock value is
appropriate or not, based on companies’ earnings:
Share Price
Earnings per SharePER (5)
Earnings Yield:
The inverse of PER, earnings yield is other returns
measure:
Earnings per Share
Share PriceYield (6)
Growing Ratios:
In this work were used growing ratios, like EPS growth,
Income, EBITDA and cash growth and debt, liabilities and
current liabilities growth. All this ratios are obtained as
following:
1
1
time t time tGrowth
time t
Ratio RatioRatio
Ratio
(7)
C. Stock Picking and Machine Learning Algorithms
The stock picking is the process of systematically selecting
stocks with potential return by an investor to build up their
investment portfolios. However, this process is highly complex
for many reasons, such as the high volume of data available for
analysis of a stock market index like the NASDAQ, for
example, and the difficulty of predicting future stock price. The
use of computational methods to perform this task becomes so
essential for the investor to analyze in time an entire stock
market index and to choose good companies to invest. There
are several algorithms for machine learning that has been
applied in solving this optimization problem, since neural
networks, support vector machines and genetic algorithms.
Artificial Neural Networks (ANN) have been studied and
used in portfolios return prediction problems because they have
a good adaptability to the non-linearity inherent in financial
markets [6][7][8]. Another technique used in stock portfolios
return prediction problems are the Support Vector Machines
(SVM) [9][10]. This technique has gained relevance among the
machine learning algorithms because of their very good results,
sometimes better than using ANN algorithms. The main
objective is to obtain an output function with a good
generalizability given a set of training data [11][12].
Genetic algorithms (GA) is also used in stock selection
problems and are the focus of the work presented in this paper.
Several studies have shown that the use of GA could generate
very good results [13][14][15].
D. Genetic Algorithms
Designed by John Holland, GA are one of the most currently
used methods of evolutionary computation. This algorithm is a
method of optimization and search, aiming to calculate the best
approximate solution to a given problem. The name of this
algorithm comes from its inspiration in biological and
evolutionary processes and uses similar processes such as
mutation, crossover and selection [16][17].

3
Figure 1 – Genetic Algorithm
As shown in Figure 1, the algorithm is based on a set of
operators that represent the evolutionary biological processes
[17][18]. The phases of the algorithm are as follows:
1) Evaluation
In this phase the individuals of the population are submitted to
an evaluation process, using a fitness function, where the value
obtained define the chances that each particular individual has
to be selected. Measures of return and risk are usually used for
this function:
Return:
1j
N
Portolio i i
i
R W
(8)
Risk (Sharpe Ratio):
j
Portfolio j
j
Portolio free
R
Portfolio
R RS
(9)
where freeR is the return of a free risk asset, like German
Treasure Bonds (with AAA classification) and jPortfolio the
standard deviation of portfolio’s returns.
2) Selection
After evaluation it’s necessary to make a selection of the best
individuals taking into account the results obtained in the
evaluation process, which are used to define the new population
and generate offspring. The main selection methods are the
Roulette-Wheel, Truncation and Rank.
3) Crossover
The new individuals of the population will be generated by
crossing pairs of chromosomes of the surviving population
from the selection process, with exchange of genetic
information.
4) Mutation
After the crossover process a percentage of chromosomes is
selected to undergo changes in their randomly selected genes,
modifying the genetic information.
III. PROGRAM’S ARCHITECTURE
The program presented in this paper is all developed in R
language [19] using RStudio user interface [20]. The program
structure is presented in Figure 2.
Figure 2 – Program Architecture
The main parts of the program are the following:
A. Extraction, Cleaning and Data Processing
The data source used in this work are SEC website [21] for
all financial information, through the 10-Q and 10-K statements
reports, and Yahoo Finance [22] for stock prices. The Figure 3
shows the extraction and cleaning model developed. The
program download all statement reports from SEC, convert
them in a R language readable format, extract all the
information needed from the files. To accomplish that is
necessary a word dictionary to find the right information in the
report files, as shown in Figure 4. All this information read is
grouped in a financial information matrix.
After that, the matrix obtained is subjected to a cleaning
algorithm that consists in a several rules to apply to all data like
remove special characters, dates verification, remove duplicate
entries and calculate some information that could be missing.
4
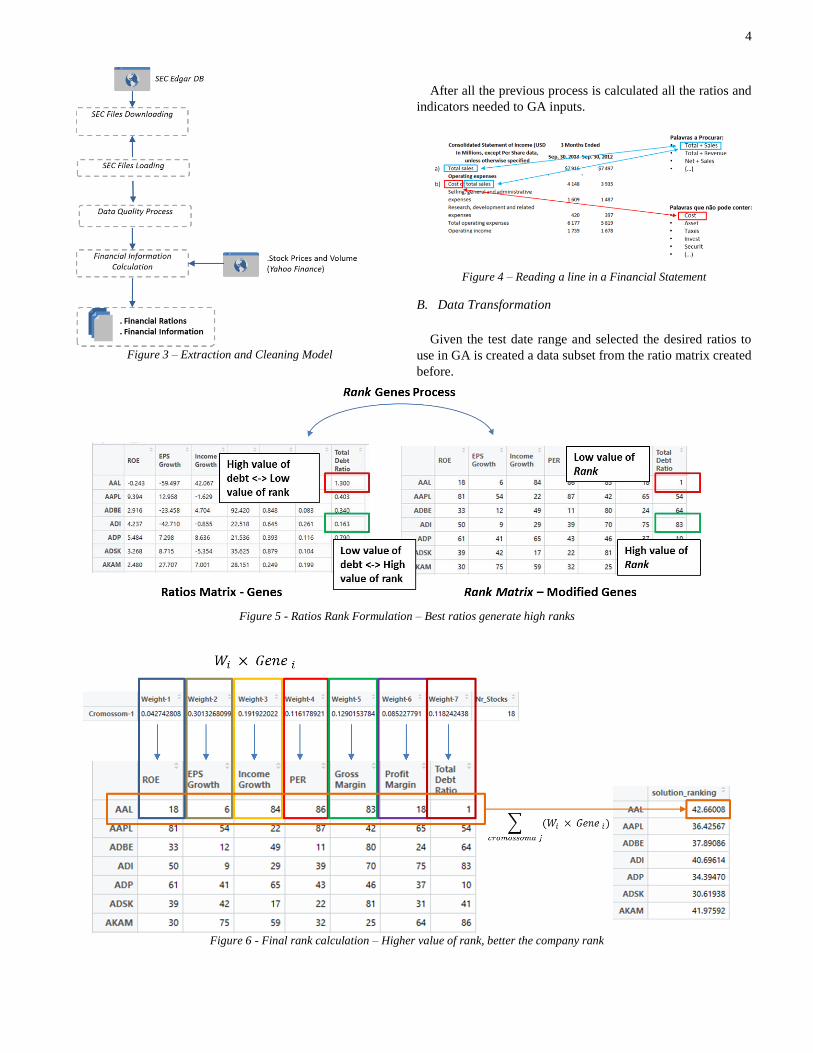
Figure 3 – Extraction and Cleaning Model
After all the previous process is calculated all the ratios and
indicators needed to GA inputs.
Figure 4 – Reading a line in a Financial Statement
B. Data Transformation
Given the test date range and selected the desired ratios to
use in GA is created a data subset from the ratio matrix created
before.
Figure 5 - Ratios Rank Formulation – Best ratios generate high ranks
Figure 6 - Final rank calculation – Higher value of rank, better the company rank

5
This new matrix is transformed into ranks values as
represented in Figure 5. For each ratio, the rank function is
applied to all companies of the index. Therefore, if a ratio value
of a company was good, the rank value obtained will be high,
increasing probabilities of selection in the GA process (Figure
6). Applying this transformation we intend to incorporate in
their value its financial position on this ratio in global
companies: a large sales increase in value may not mean a
respective high value rank, as it also depends on the
performance of other companies.
C. Genetic Algorithm Formulation
The chromosome used in the formulation of this work
consists in a set of genes that represent weights (to apply in
evaluation phase of algorithm), and an additional gene
corresponding to the range of companies that can be selected
for the porfolio. With the exception of the latter gene, the
remaining match weights, Wi, to be assigned to each of the
ratios corresponding to each gene. Figure 7 shows the
chromosome constitution.
Figure 7 – Gene representation
The weights of each genes (except for Genei+1) and the
number of companies to be selected follows the following
rules:
0 1iW (10)
where the value of each gene (except for Genei+1) must be
between 0 and 1,
10 1
i
iW (11)
where the sum of weights must be between 0 and 1 and for
Genei+1:
_min _maxstocks stocks stocksN N N (12)
where the number of stocks to be selected by algorithm must
be between the limits previously defined by user.
IV. RESULTS
To evaluate the developed model were performed three
different tests with the indexes NASDAQ 100, S&P 500 and
NASDAQ. In general terms, during the tests are used training
data between 2011 and 2013, and the test data set between 2014
and 2015. The program has to select between 5-20% of the
companies of the index used and limit gains to 100% and the
losses to 25% and financial sector companies are excluded. For
the GA, the population consists of 100 chromosomes that are
processed for 100 generations, a selection rate of 50% and
mutation rate of 5%. The selection and crossover methods used
were Truncation with the selection percentage of 50% and the
one-point crossover, respectively. The return/risk coefficient in
the evaluation function will depend on the market analysis and
are indicated in Table 1.
Table 1 – Return/Risk Coefficient
NASDAQ 100 0.8
S&P 500 0.6
NASDAQ 0.5
For the results of the previously defined tests were performed
10 executions of GA to each of the index. In Test 2 is performed
only one execution because the weight values are forced to have
the same value (0.5 each). In all the tests chosen companies by
model will have the same representation in the portfolio.
A. Case Study I – Growth Ratios
In this test the genes used are ROE, EPS Growth, Income
Growth, Total Debt Ratio, PER, Gross Margin, Profit Margin
and the number of companies to select.
Table 2 shows the results obtained for this test. It can be seen
that the average GA returns are greater than the index return for
NASDAQ 100 and S&P500. For the best GA execution, the
model generate 55% and 24% of returns, respectively. For
NASDAQ, the results were slightly below than the market
return, with 15.8% average return (-5% than market).
Table 2 – Test 1 – Return Results
NASDAQ 100 S&P 500 NASDAQ
Best GA Exec. 55.02% 24.09% 17.85%
Average GA Return 39.40% 19.55% 15.79%
Worst GA Exec. 10.71% 14.07% 14.25%
Index 28.90% 11.57% 20.86%
B. Case Study II – ROE and Earnings Yield
Using some guidelines used by Joel Greenblatt in this book
‘The Little Book That Beats the Market’ [23], in this test it’s
used only genes ROE and Earnings Yields in chromosome
structure and selected 20 companies to construct portfolio, with
the restriction that the minimum market capitalization value is
100 million dollars.
As seen in Table 3, in this case study the return values were
much lower than obtained in previously test, where only the
execution in the S&P500 index matched approximately the
market returns.
Table 3 - Test 2 – Return Results
NASDAQ 100 S&P 500 NASDAQ
Porfolio Return 21.06% 11.66% 7.20%
Index 28.90% 11.57% 20.86%

6
C. Case Study III – Growth and Debt Ratios
In this test are used the genes of Test 1 with the inclusion of
debt information and cash. The ratios were Debt Growth,
Liabilities Growth, Current Liabilities Growth and value Cash
Growth. One aim will be to analyze the impact of the inclusion
of these genes on the results obtained in Test 1.
The results obtained for this test, presented in Table 4, were
superior to those obtained in Case Study I for NASDAQ 100
and S&P500, and especially for the worst GA execution, where
the return was more than twice previously obtained. As in Case
Study I, the average return of the execution of the program is
well above the return value of the index. However, the results
for NASDAQ index remain weak, with the average return value
only about 15% (-5% than market return). The inclusion of debt
ratios improved returns from the developed model, especially
for the worst GA execution.
Table 4 - Test 3 - Return Results
NASDAQ 100 S&P 500 NASDAQ
Best GA Exec. 56.26% 36.65% 20.38%
Average GA Return 40.44% 32.71% 15.00%
Worst GA Exec. 23.42% 28.32% 11.43%
Index 28.90% 11.57% 20.86%
The time evolution of returns obtained in all case studies are
represented in Figure 8.
V. CONCLUSIONS
In this work was presented the methodology developed for
automatic stock picking and constitution of portfolios whose
returns could be higher than those obtained if the investment
was made in the index. This program developed was based on
genetic algorithms with financial information. The program has
the ability to get all the necessary information of the financial
statements reported by US companies. The reports download,
reading and processing is all provided by the program.
The chromosome used in a GA corresponding to weights that
are applied to a matrix of financial data that was previously
transformed by a process rank. This process transforms the
actual data of each ratio in a ranking company, where the value
obtained is the relative position of that company in the index
used.
Although the results for the NASDAQ are slightly lower than
expected, the obtained for the NASDAQ 100 and the S&P500
were very satisfactory and consistent (remained good results
between Case Study I and III), which concluded that the best
strategy to follow would be to add the debt growth ratios to the
previous profitability and growth ratios. Therefore, it can be
concluded that the use of GA based on fundamental analysis
can be extremely useful to decision support in choosing good
stocks that can generate good returns to investors.
Test
1Te
st 2
Test
3
NASDAQ 100 S&P 500 NASDAQ
Figure 8 - Index Return vs Portfolio Return

7
REFERENCES
[1] C. Pires, Mercados e Investimentos Financeiros, 3a ed.
Lisboa: Escolar Editora, 2011.
[2] K. P. Finance, “The Basics for Investing in Stocks,”
Kiplinger’s Pers. Financ. Mag., p. 18, 2005.
[3] C. Walsh, Key Management Ratios, 3th ed. Hall,
Prentice, 2002.
[4] J. V. da Silva and P. J. S. Ferreira, Prícipios de Gestão
Financeira, 1a ed. Lisboa: Livros, Rei dos, 2014.
[5] S. Baresa, S. Bogdan, and Z. Ivanovic, “Strategy of
Stock Evaluation by Fundamental Analysis,” UTMS J.
Econ., vol. 4, no. 1, pp. 45–51, 2013.
[6] M. Qiu, Y. Song, and F. Akagi, “Application of
artificial neural network for the prediction of stock
market returns: The case of the Japanese stock
market,” Chaos, Solitons & Fractals, vol. 85, pp. 1–7,
2016.
[7] A. Adam, Z. Ibrahim, M. I. Shapiai, L. C. Chew, L.
W. Jau, M. Khalid, and J. Watada, “A two-step
supervised learning artificial neural network for
imbalanced dataset problems,” Int. J. Innov. Comput.
Inf. Control, vol. 8, no. 5 A, pp. 3163–3172, 2012.
[8] D. Enke and S. Thawornwong, “The use of data
mining and neural networks for forecasting stock
market returns,” Expert Syst. Appl., vol. 29, no. 4, pp.
927–940, 2005.
[9] H. Yu, R. Chen, and G. Zhang, “A SVM stock
selection model within PCA,” Procedia Comput. Sci.,
vol. 31, pp. 406–412, 2014.
[10] C.-F. Huang, “A hybrid stock selection model using
genetic algorithms and support vector regression,”
Appl. Soft Comput., vol. 12, no. 2, pp. 807–818, Feb.
2012.
[11] J. Gama, A. Carvalho, A. C. Lorena, and M. Oliveira,
Extração de Conhecimento de Dados - Data Mining.
Lisboa, 2012.
[12] K. Bennett and C. Campbell, “Support Vector
Machines: Hype or Hallelujah?,” SIGKDD Explor.,
vol. 2, no. 2, pp. 1–13, 2000.
[13] A. Gorgulho, R. Neves, and N. Horta, “Applying a
GA kernel on optimizing technical analysis rules for
stock picking and portfolio composition,” Expert Syst.
Appl., vol. 38, pp. 14072–14085, 2011.
[14] C. Zhou, L. Yu, T. Huang, S. Wang, and K. K. Lai,
“Selecting Valuable Stock Using Genetic Algorithm,”
Springer-Verlag Berlin Heidelb., pp. 688–694, 2006.
[15] C.-F. Huang, C.-H. Chang, B. R. Chang, and T.-N.
Hsieh, “A genetic-based stock selection model using
investor sentiment indicators,” 2011 IEEE Int. Conf.
Granul. Comput., pp. 262–267, 2011.
[16] A. E. Eiben and J. E. Smith, Introduction to
Evolutionary Computing. 2003.
[17] L. M. Schmitt, “Theory of genetic algorithms,” Theor.
Comput. Sci., vol. 259, no. 1–2, pp. 1–61, 2001.
[18] M. Melanie, An Introduction to Genetic Algorithms,
Fifth. Cambridge, Massachusetts, 1999.
[19] The R Foundation., “The R Project for Statistical
Computing,” 2016. [Online]. Available:
https://www.r-project.org/. [Accessed: 28-Mar-2016].
[20] RStudio, “RStudio,” 2016. [Online]. Available:
https://www.rstudio.com/. [Accessed: 28-Mar-2016].
[21] SEC, “U.S. Securities and Exchange Commission,”
2016. [Online]. Available:
http://www.sec.gov/edgar/searchedgar/companysearch
.html. [Accessed: 28-Mar-2016].
[22] Yahoo!, “Yahoo! Finance,” 2016. [Online]. Available:
http://finance.yahoo.com/. [Accessed: 28-Mar-2016].
[23] J. Greenblatt, The Little Book That Beats the Market.
New Jersey, USA, 2006.