growth of tree species and hydrology in … · À ce moment sont entrés en jeu jean bégin et...
TRANSCRIPT
SYLVAIN JUTRAS GROWTH OF TREE SPECIES AND HYDROLOGY IN
MANAGED FORESTED PEATLANDS, QUEBEC
Thèse présentée à la Faculté des études supérieures de l’Université Laval
dans le cadre du programme de doctorat en Sciences Forestières pour l’obtention du grade de Philosophiae Doctor (Ph. D.)
DÉPARTEMENT DES SCIENCES DU BOIS ET DE LA FORÊT FACULTÉ DE FORESTERIE ET DE GÉOMATIQUE
UNIVERSITÉ LAVAL QUÉBEC
MAI 2006 © Sylvain Jutras, 2006
i
Résumé
Le bilan hydrique des tourbières forestières est régi par une combinaison complexe de
processus hydrologiques. Relativement stable en milieu naturel, ce bilan est facilement
bouleversé par les activités d’aménagement forestier qui affectent le couvert végétal. Cette
thèse de doctorat avait pour objectif d’étudier certaines interrelations existant entre la
productivité forestière, la compétition pour les ressources et l’hydrologie des tourbières
forestières du Québec.
Le premier chapitre visait à déterminer s’il était pertinent d’utiliser le drainage forestier afin
de transformer des pessières noires improductives en sites productifs. Les résultats ont
démontré que même si ce traitement avait significativement augmenté la croissance de
certains arbres, seul le drainage intensif utilisant des fossés rapprochés permettrait la
conversion de tels peuplements. Les quatre autres chapitres visaient à évaluer l’influence de
la végétation sur le contrôle des processus hydrologiques et indirectement sur la croissance
forestière. La nappe phréatique a été mesurée dans une tourbière forestière pré-mature afin
d’évaluer son comportement à la suite du drainage et à la récolte (Chapitre 2). Des mesures
comparables ont été effectuées afin de mesurer la remontée de la nappe phréatique causée
par l’éclaircie précommerciale sur des sites humides drainées et fortement régénérés
(Chapitre 3). Ces deux études ont démontré l’influence significative de la végétation
forestière sur le contrôle de la nappe phréatique en milieux forestiers humides. Puisque
cette végétation possède une influence évidente sur la nappe phréatique, la croissance d’une
tige devrait être favorisée par la présence immédiate de voisins. Le rôle du drainage
biologique (Chapitre 4) ainsi que l’effet de la présence de compétition (Chapitre 5) sur la
croissance ont été évalués pour des sites drainés. Il a été démontré que le pouvoir de
contrôle de la nappe phréatique que possède la végétation est favorable à la croissance
forestière, mais uniquement dans certaines situations particulières. Il semble donc pertinent
de recommander des pratiques sylvicoles qui préservent une proportion considérable de la
végétation sur les tourbières forestières.
ii
Abstract
The water budget of forested peatland sites is regulated by a complex combination of
hydrological processes. Relatively stable in natural environments, this budget is exposed to
major changes by forest management activities affecting the tree canopy. This Ph.D. thesis
aimed to study the specific interrelations existing between growth and yield of tree species,
above-ground competition, and hydrology of Quebec forested peatlands.
The first chapter aimed to determine the pertinence of using drainage to transform
unproductive black spruce stands into productive ones. Results showed that even if tree
growth was significantly increased by drainage, only intensive drainage using narrow ditch
spacing would enable stand productivity improvement. The four other chapters intended to
evaluate the influence of the vegetation on the regulation of hydrological processes and,
indirectly, tree growth. The water table has been monitored on a pre-mature forested
peatland site to evaluate its behaviour following drainage and harvesting (Chapter 2).
Comparable water table monitoring has been done in densely regenerated post-harvest and
drained peatland sites to measure the watering-up after precommercial thinning (Chapter 3).
Both studies demonstrated the valuable water table regulation capacities of the treed
vegetation in forested peatlands. Since this vegetation has an evident influence on soil
growing conditions, tree growth should be affected by the presence of neighbours. The role
of biological drainage (Chapter 4) and the presence of competition (Chapter 5) on growth
have been evaluated for drained sites. The water table regulation power of the vegetation
stratum was found to be favourable to tree growth, but only in specific situations.
Management practices that preserve notable amount of vegetation on forested peatland
stands seem to be the most pertinent guideline that should be considered in these fragile
ecosystems.
iii
Avant-Propos
Mon intérêt pour l’aménagement des milieux forestiers humides est né tout simplement. En
tant que jeune étudiant motivé et prêt à tout pour acquérir de l’expérience, j’ai accepté en
1998 un emploi d’été nécessitant l’utilisation d’une bonne paire de bottes imperméables et
d’une quantité importante de crème anti-moustique. J’ai donc passé mon été entre
Matagami et Lebel-sur-Quévillon à rubaner des fossés de drainage dans des sites ayant été
ravagés par des récoltes abusives, il y a plus de 20 ans, et aujourd’hui fortement paludifiés.
Mon esprit critique s’est alors fortement manifesté en me faisant douter de la pertinence de
mon travail. C’est alors que, pour la toute première fois dans ma vie, j’allais vérifier
scientifiquement des hypothèses que j’avais moi-même formulées.
À ce moment sont entrés en jeu Jean Bégin et André Plamondon. Dès lors que je leur eusse
exposé mon idée, ils m’ont accordé leur entière confiance et ont mis en œuvre toutes les
mesures nécessaires à l’accomplissement de mon projet. Je leur suis extrêmement
reconnaissant d’avoir découvert mon potentiel pour la recherche scientifique et d’en avoir
permis l’épanouissement. Vous m’avez sans cesse poussé à atteindre des objectifs que je
croyais hors de ma portée et c’est ce qui m’a permis, bon an mal an, d’accéder à de
nouveaux sommets. Sincèrement, merci.
Hannu Hökkä was the third mentor who gave me his full trust. When we first met, I was
just a beginner but you discovered in me the germ of a competent researcher. You gave me
an extraordinary opportunity to make it bloom. The Finnish journey Geneviève and I lived
in 2001 was remarkable and we owe it to you. Paljon kiitoksia.
Je dois aussi remercier les divers intervenants des milieux forestier et scientifique qui ont
permis, par leur soutien financier et technique, la réalisation des divers projets que
constituent ma thèse. Tout d’abord, merci à nos partenaires de longue date en forêt boréale :
Abitibi-Consolidated inc., Barette-Chapais ltée, les Chantiers de Chibougamau inc., ainsi
que les unités de gestion Chibougamau et Quévillon du Ministère des ressources naturelles
et de la faune. Dans la région de Québec cette fois, merci à Papier Stadacona inc. pour le
iv
maintien à long terme des sites de St-Gilles. Merci au ministère des Ressources naturelles
et de la faune pour le soutien financier obtenu par le biais du PMVRMF - Volet 1. Merci au
FQRNT pour la bourse doctorale qui m’a aidé à compléter, sans soucis financier, ce grand
projet de vie qu’est un doctorat. Merci à la faculté de foresterie et de géomatique et au
CRBF pour la généreuse aide financière offerte par le biais de bourses d’excellence. Je me
dois aussi de souligner l’essentiel support financier provenant de Jean et André qui ont
consenti, surtout en fin de parcours, à explorer leurs fonds de tiroirs.
Il serait difficile de dresser une liste exhaustive de tous les gens qui ont participé de près ou
de loin à mes travaux de recherche au cours de mes études graduées tant ils sont nombreux.
J’ai énormément apprécié votre aide et je vous en suis très reconnaissant. Affronter les
hordes d’insectes piqueurs de toutes sortes, les longues heures de travail acharné sous des
conditions climatiques souvent défavorables, les trous de « bouettes » mangeurs de bottes,
ainsi que les milliers de kilomètres d’asphalte, de gravier, de boue et d’autres sentiers à
peine carrossables n’auraient assurément pas été aussi agréables sans votre présence.
Merci!
À mes parents, je voudrais une fois de plus exprimer ma gratitude pour leur support
inconditionnel.
Geneviève, mon amour, ton dévouement pour moi et pour notre petite famille n’est pas
passé inaperçu. Je suis un homme heureux. Je t’aime.
« J’te donnerais tout c’que j’ai mais c’pas sérieux parce qu’au fond, tout c’que j’ai, c’est toi. »
Richard Desjardins; Jenny , album Kanasuta
Merci à la vie qui est si belle...
v
Table des matières Résumé ...................................................................................................................................i Abstract................................................................................................................................ ii Avant-Propos ...................................................................................................................... iii Table des matières ................................................................................................................ v Liste des tableaux...............................................................................................................viii Liste des figures ...................................................................................................................ix General introduction.............................................................................................................1 References...........................................................................................................................5
CHAPTER 1 Draining an unproductive black spruce peatland stand: 18-year post-treatment tree growth assessment and future stand productivity estimation
Abstract...............................................................................................................................9 Résumé..............................................................................................................................10 Introduction.......................................................................................................................11 Material and methods........................................................................................................14
Diameter growth assessment ........................................................................................17 Stand productivity estimation .......................................................................................17
Results...............................................................................................................................20 Discussion.........................................................................................................................23
Diameter growth assessment ........................................................................................23 Stand productivity estimation .......................................................................................26
Conclusion ........................................................................................................................27 Acknowledgements...........................................................................................................28 References.........................................................................................................................28
CHAPTER 2 Water-table rise after harvesting in a treed fen previously drained for forestry
Abstract.............................................................................................................................34 Résumé..............................................................................................................................34 Introduction.......................................................................................................................35 Material and methods........................................................................................................35 Results and discussion ......................................................................................................40 Conclusion ........................................................................................................................42 Acknowledgments ............................................................................................................43 References.........................................................................................................................43

vi
CHAPTER 3 Water table changes following precommercial thinning on post-harvest drained wetlands
Abstract.............................................................................................................................46 Résumé..............................................................................................................................47 Introduction.......................................................................................................................48 Material and methods........................................................................................................49
Water table calibration..................................................................................................54 Statistical analysis.........................................................................................................57
Results...............................................................................................................................59 Discussion.........................................................................................................................62 Conclusion ........................................................................................................................66 Acknowledgements...........................................................................................................67 References.........................................................................................................................67
CHAPTER 4 Beneficial influence of plant neighbours on tree growth in drained forested peatlands – A case study
Abstract.............................................................................................................................72 Résumé..............................................................................................................................73 Introduction.......................................................................................................................74 Material and methods........................................................................................................76
Study site and experimental design ..............................................................................76 Model building..............................................................................................................78 Data structure and model estimation ............................................................................81
Results...............................................................................................................................83 Discussion.........................................................................................................................87 Conclusion ........................................................................................................................91 Acknowledgements...........................................................................................................92 References.........................................................................................................................92
vii
CHAPTER 5 Influence of intra- and inter-specific competition on black spruce growth in post-harvest drained forested peatlands
Abstract.............................................................................................................................98 Résumé..............................................................................................................................99 Introduction.....................................................................................................................100 Introduction.....................................................................................................................100 Material and methods......................................................................................................103
Competition establishment dynamics study ...............................................................103 Black spruce growth study..........................................................................................105 Statistical analysis.......................................................................................................108
Results.............................................................................................................................110 Competition establishment dynamics .........................................................................110 Black spruce growth ...................................................................................................112
Discussion.......................................................................................................................117 Conclusion ......................................................................................................................122 Acknowledgements.........................................................................................................123 References.......................................................................................................................123
General conclusion ...........................................................................................................127
viii
Liste des tableaux CHAPTER 1: Table 1: Black spruce diameters at stump height (DSH), stem heights (H) and ages at stand
drainage (1984) and 18 years after drainage (2002), together with mean pre- and post-drainage annual diameter increments. ............................................................16
Table 2: Analysis of covariance (ANCOVA) of the 18-year post-drainage mean annual stump diameter increment (ln(ADI84-02)).............................................................20
CHAPTER 2: Table 1: Site characteristics before drainage. .......................................................................36 CHAPTER 3: Table 1: Description of the six selected sites........................................................................51 Table 2: Analysis of covariance of the water table rise (WTR) after precommercial thinning
(PCT). .....................................................................................................................59 CHAPTER 4: Table 1: Attributes of the plots and the eastern larch and black spruce trees.......................78 Table 2: Estimates, standard errors (SE) and p value of the fixed parameters and the
variance components of the annual stump diameter increment models. ................83 CHAPTER 5: Table 1: Ecological descriptions of the study sites (OG adapted from Jones et al. 1983) .105 Table 2: Frequency tables of alder-willow in the permanent regeneration plots located in
recently harvested and drained peatlands. ............................................................110 Table 3: Frequency tables of aspen-birch in the permanent regeneration plots located in
recently harvested and drained peatlands. ............................................................110 Table 4: Frequency tables of black spruce in the permanent regeneration plots located in
recently harvested and drained peatlands. ............................................................110 Table 5: Logistic regression summaries on the occurrence of the principal black spruce’s
competitive tree species in the permanent regeneration plots located in recently harvested and drained peatlands. ..........................................................................111
Table 6: Summary of the variance analysis on ln-transformed last annual diameter (ln(DI)) and height increment (ln(HI)) of black spruce seedlings located on drained peatland sites.........................................................................................................112
ix
Liste des figures CHAPTER 1: Figure 1. Map of the drained unproductive black spruce peatland stand, showing the
numbered experimental plot locations. .........................................................................15 Figure 2. Initial black spruce dimensions as a tree growth factor on a drained unproductive
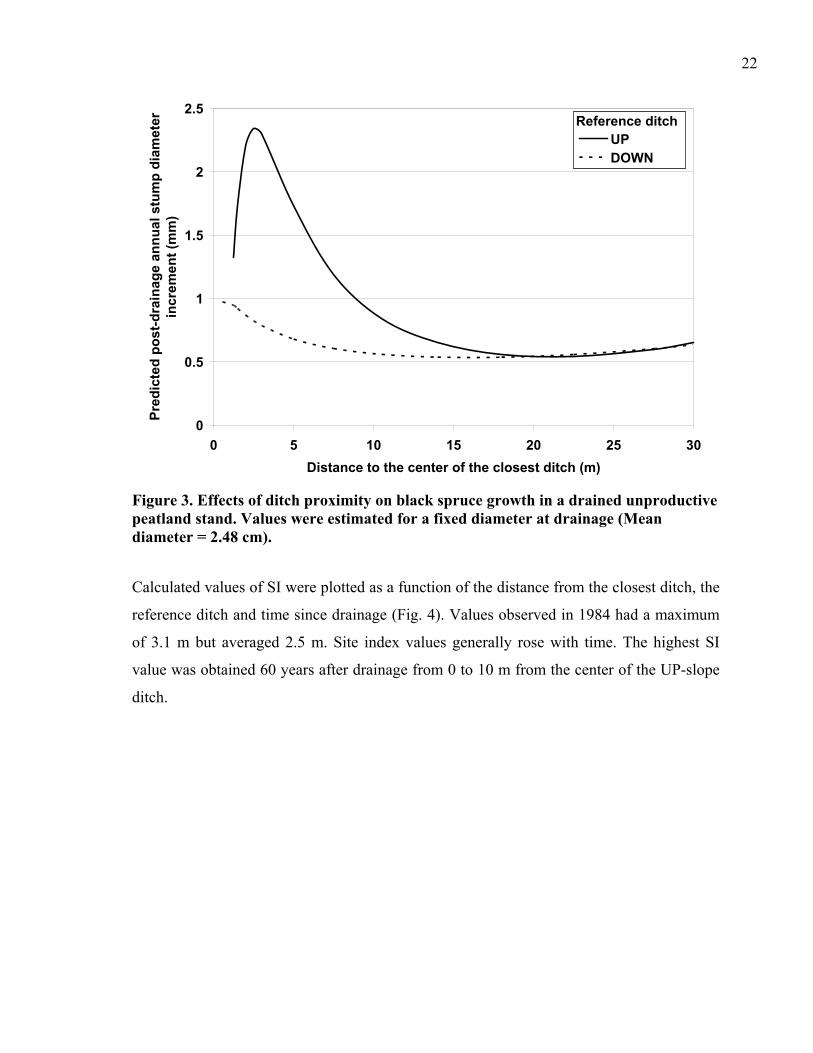
peatland stand. ..............................................................................................................21 Figure 3. Effects of ditch proximity on black spruce growth in a drained unproductive
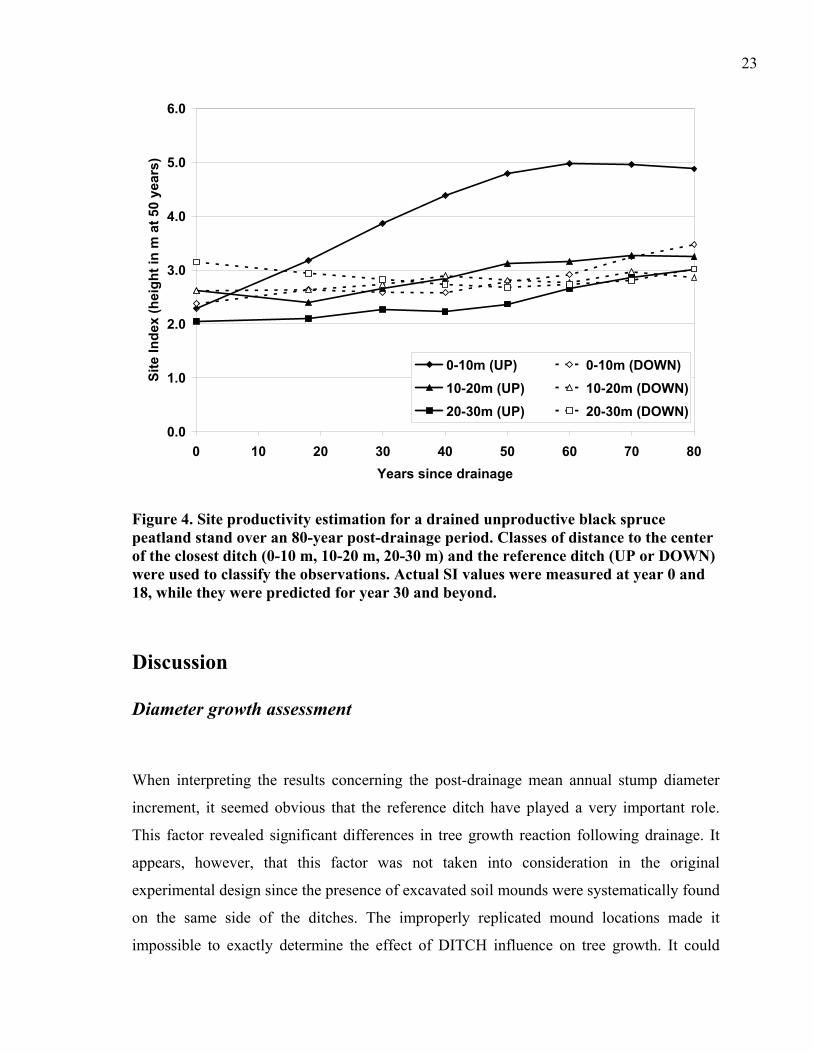
peatland stand. ..............................................................................................................22 Figure 4. Site productivity estimation for a drained unproductive black spruce peatland
stand over an 80-year post-drainage period. .................................................................23 CHAPTER 2: Figure 1: Drainage and sampling design on treated site. ......................................................37 Figure 2: Calibration curve of the water-table depth for the treated site without drainage
effect and the water-table of the control site.................................................................39 Figure 3: Predicted water-table depth (PWT) following drainage and timber harvesting of a
forested peatland site in function of ditch spacing, distance to the closest ditch, period of observation and predicted water-table depth if no treatment was applied (PWTno).......................................................................................................................................41
CHAPTER 3: Figure 1: Details of the experimental design of a hypothetical study site. ...........................52 Figure 2: Daily precipitation and mean water table depth to the soil level for the control
wells (diamonds, thin line) and the thinned wells (+, hatched line), before (2003) and after (2004-2005) precommercial thinning (all sites included). ...................................53
Figure 3: Example of the regression between treated and control wells for the calibration period (2003) and the post-treatment values for 2004 and 2005 ..................................56
Figure 4: Least square means and error bars (± 2SE) of the water table rise (WTR) in function of the year of measurement and the soil type. ................................................60
Figure 5: Predicted mean values of the water table rise (WTR) as a function of the basal area removal..................................................................................................................61
Figure 6: Predicted mean values of the water table rise (WTR) as a function of the predicted water table depth...........................................................................................................61
Figure 7: Predicted mean values of the water table rise (WTR) as a function of the observation day .............................................................................................................62

x
CHAPTER 4: Figure 1: Annual stump diameter increment (ΔD0.3) for eastern larch, 5, 10 and 15 years
after plantation (TIME) as a function of distance to the closest ditch (NEAR: 1 to 6 m; FAR: 6 to 16 m) and neighbourhood occupancy (G<3m). .............................................84
Figure 2: Annual stump diameter increment (ΔD0.3) for black spruce, 5, 10 and 15 years after plantation (TIME) as a function of distance to the closest ditch (NEAR: 1 to 6 m; FAR: 6 to 16 m) and neighbourhood occupancy (G<3m). .............................................85
CHAPTER 5: Figure 1: Annual diameter (A) and height (B) increments of naturally regenerated black
spruce seedlings in post-harvest drained, forested peatlands as a function of the initial dimensions and the operational group (OG)...............................................................113
Figure 2: Annual diameter (A) and height (B) increments of naturally regenerated black spruce seedlings in post-harvest drained forested peatlands in function of the distance to the ditch (DIST). .....................................................................................................114
Figure 3: Annual diameter (A) and height (B) annual increments of naturally regenerated black spruce seedlings in post-harvest drained, forested peatlands as a function of light interception (LI). .........................................................................................................116
1
General introduction
Being remarkable carbon and water reservoirs, peatlands have crucial ecological functions
in our global environment. Recently, scientists from eastern Canada have been putting
together their efforts to publish the most exhaustive book on peatland ecology of Quebec-
Labrador (Payette and Rochefort 2001). The state of knowledge in peatland ecology,
hydrology, geology, geography, forestry, agriculture and land management, among others,
have been documented and synthesised meticulously. A complete chapter concerned
peatland forestry and concluded with these comments:
Canadian boreal forested peatlands are important source of wood fibres for forest
industries, therefore providing a substantial economical function. While the society
claims for forest practices respectful of the vital functions of ecosystems, foresters
recognise that peatland forestry should encompass practices adapted to their specific
particularities. The lack of knowledge concerning the effects of perturbations on
peatland hydrologic processes is considerably limiting our ability to evaluate the
resilience capacities of these ecosystems.
Prévost, Plamondon and Roy 2001
Not long ago, great expectations were put on the beneficial effects of peatland management
practices in Canada (Jeglum 1991). Many research projects were ongoing at that time but a
rapid decline of interest occurred shortly after, leaving many unverified hypothesis. One of
the reasons explaining this situation was the difficulty to observe significant changes in
peatland black spruce growth on a short-term basis (Payandeh 1982, Sundstrom 1992,
Sundstrom and Jeglum 1992, Prévost et al. 1999, Roy et al. 1999). Since the access to
financial support for long-term experiments is very difficult (Hillman 1987, McLaren and
Jeglum 1998), numerous research sites have ceased to be maintained. Moreover, the few
scientific evaluations of drainage over periods exceeding 10 years showed deceiving results
compared to what was first expected (Payandeh and Papadopol 1994, MacLaren and
Jeglum 1998, Prévost et al. 2005). The resulting absence of forested peatlands management
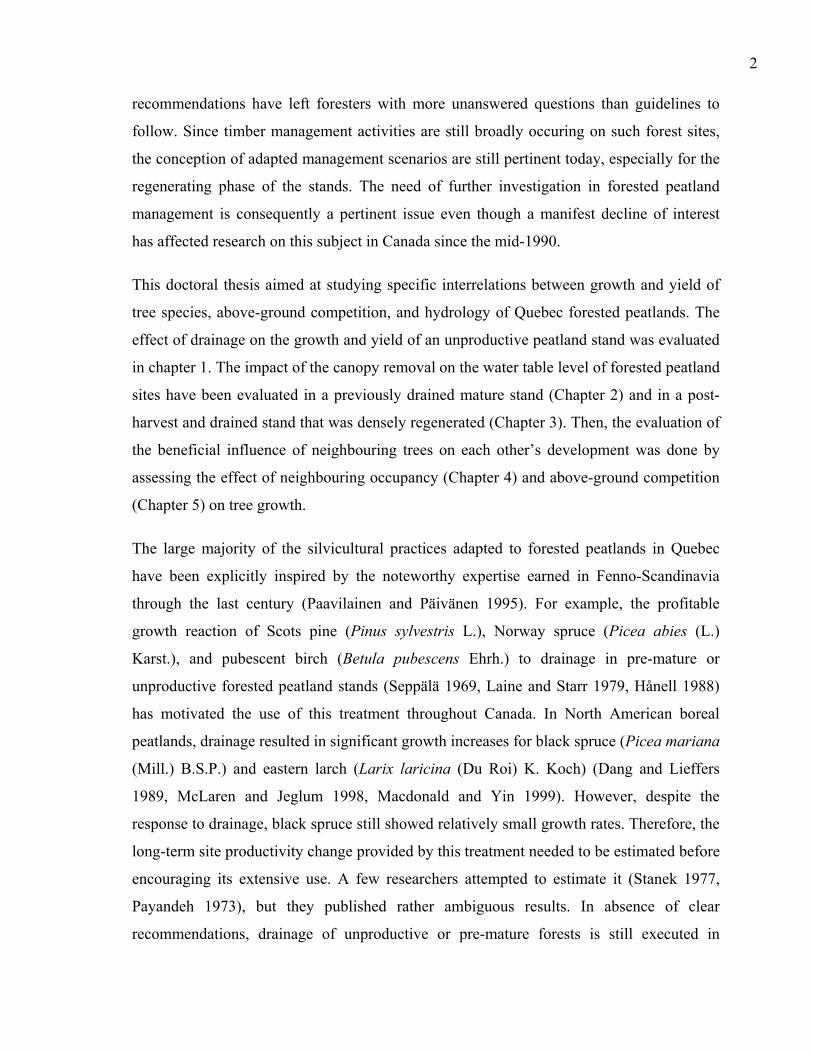
2
recommendations have left foresters with more unanswered questions than guidelines to
follow. Since timber management activities are still broadly occuring on such forest sites,
the conception of adapted management scenarios are still pertinent today, especially for the
regenerating phase of the stands. The need of further investigation in forested peatland
management is consequently a pertinent issue even though a manifest decline of interest
has affected research on this subject in Canada since the mid-1990.
This doctoral thesis aimed at studying specific interrelations between growth and yield of
tree species, above-ground competition, and hydrology of Quebec forested peatlands. The
effect of drainage on the growth and yield of an unproductive peatland stand was evaluated
in chapter 1. The impact of the canopy removal on the water table level of forested peatland
sites have been evaluated in a previously drained mature stand (Chapter 2) and in a post-
harvest and drained stand that was densely regenerated (Chapter 3). Then, the evaluation of
the beneficial influence of neighbouring trees on each other’s development was done by
assessing the effect of neighbouring occupancy (Chapter 4) and above-ground competition
(Chapter 5) on tree growth.
The large majority of the silvicultural practices adapted to forested peatlands in Quebec
have been explicitly inspired by the noteworthy expertise earned in Fenno-Scandinavia
through the last century (Paavilainen and Päivänen 1995). For example, the profitable
growth reaction of Scots pine (Pinus sylvestris L.), Norway spruce (Picea abies (L.)
Karst.), and pubescent birch (Betula pubescens Ehrh.) to drainage in pre-mature or
unproductive forested peatland stands (Seppälä 1969, Laine and Starr 1979, Hånell 1988)
has motivated the use of this treatment throughout Canada. In North American boreal
peatlands, drainage resulted in significant growth increases for black spruce (Picea mariana
(Mill.) B.S.P.) and eastern larch (Larix laricina (Du Roi) K. Koch) (Dang and Lieffers
1989, McLaren and Jeglum 1998, Macdonald and Yin 1999). However, despite the
response to drainage, black spruce still showed relatively small growth rates. Therefore, the
long-term site productivity change provided by this treatment needed to be estimated before
encouraging its extensive use. A few researchers attempted to estimate it (Stanek 1977,
Payandeh 1973), but they published rather ambiguous results. In absence of clear
recommendations, drainage of unproductive or pre-mature forests is still executed in

3
Quebec peatland sites. Hence, the first chapter evaluated the long term productivity of the
oldest experimentally drained unproductive peatland stands of eastern Canada. The 18-year
post-drainage stump diameter increment of black spruce was assessed in relation to ditch
proximity and initial tree size. The change in site index that followed drainage operation
was also monitored as a function of ditch proximity and was estimated over an 80-year
period after drainage. While individual black spruce growth was expected to be
significantly increased by drainage, substantial stand productivity gains did not seemed to
be achievable on drained unproductive stand, even with optimistic assumptions.
Timber harvesting activities on undrained forested peatlands are known to create problems
of water table rise (Dubé et al. 1995, Roy et al. 1997). The drastic reduction of the
evapotranspiration is known as the principal cause of this watering-up (Dubé et al. 1995).
Since tree establishment and growth are negatively affected by high water table levels
(Lieffers and Rothwell 1986; Lieffers and MacDonald 1990; Landhäusser et al. 2003),
corrective treatments will be needed to regenerate adequately those sites. Post-harvest
drainage partly compensates for the watering-up and its effect varies with the distance from
the ditch (Roy et al. 2000). Observations of watering-up have been made after clearcutting
in forested peatlands previously drained in Finland (Heikurainen and Päivänen 1970,
Päivänen 1980) but never beforein Canada. Up to now, neither the influence of distance to
the ditch nor ditch spacing on the water table rise had been evaluated in such conditions.
Therefore, the objective of the second chapter was to quantify the effect of harvesting on
the water table level at five different distances from a ditch for three different ditch
spacings in an old stagnant black spruce stand drained 10 years before clearcutting. The
canopy removal, causing an important reduction of the evapotranspiration, was expected to
drastically affect the site hydrological balance. Close to the ditch, the dominating influence
of subsurface runoff over other hydrological processes was suspected to maintain the water
table to the pre-harvest level. Farther away from the ditch, the water table was expected to
rise.
The hydrological balance of mature forested peatland stands is strongly regulated by the
evapotranspiration processes into which the treed vegetation plays an important role
(Heikurainen 1967, Heikurainen and Päivänen 1970, Paavilainen and Päivänen 1995, Ahti
4
and Päivänen 1997). Since recently harvested peatland stands are favourably regenerated
after post-harvest drainage (Jutras et al. 2002, Prévost et al. 2005), stand density may be
such that a release from competition may be required in the near future. As the vegetation
re-establishes itself on harvested sites, evapotranspiration processes are gradually taking
back their water table regulating role (Marcotte 2005). Precommercial thinning is actually
the most important stand density treatment applied in Quebec’s regenerated stands and
guidelines bounding its application have never been evaluated for the specific situation of
forested peatland sites. Since a large part of the hydrological balance of such sites is
expected to be supplied by evapotranspiration, it was hypothesised that water-table level
should increase after precommercial thinning. Thereafter, unfavourable growing conditions
would be re-initiated. The third chapter evaluated the water table rise after precommercial
thinning on post-harvest drained forested peatlands in relation to soil type, distance to the
ditch, year of observation and other factors influencing the evapotranspiration processes.
These were: basal area removal, residual basal area, water table depth, and observation day.
The importance of the evapotranspiration as regulator of water table depth in regenerated
stands was expected to be demonstrated in this chapter.
The re-establishment of dense and well growing vegetation after drainage is influencing the
water table depth and it should consequently enhance the root-zone growing conditions.
The beneficial effect of above-ground competition on tree growth have rarely been the
direct object of scientific papers, but the existence of a biological drainage phenomenon in
forested peatlands has been stated by different authors (Paavilainen and Päivänen 1995,
Penner et al. 1995, Ahti and Päivänen 1997). Never studied in Canadian peatlands before,
the effect of biological drainage on tree growth in post-harvest drained forested peatland
stands has been the main objective of the fourth chapter. A retrospective annual diameter
increment analysis was used to describe the influence of increasing tree neighbourhood
occupancy on the growth of selected trees. Both the beneficial and detrimental effects of
neighbourhood occupancy on tree growth were expected to be observed on the study site.
In order to extend such conclusions to a broader variety of forested peatland types, the fifth
chapter intended to evaluate the positive and negative interferences of different levels of
above-ground competition on black spruce growth in post-harvest drained forested peatland
5
site types. The study areas used in Jutras et al. (2002), from which site specific growth
reactions to drainage have been found, were re-analysed in combination to another
experimental network of regeneration plots evaluating the establishment dynamics of black
spruce’s competitive tree species after drainage.
References
Ahti, E. and Päivänen, J. 1997. Response of stand growth and water table level to maintenance of ditch networks within forest drainage areas. In: Trettin, C.C., Jurgensen, M.F., Grigal, D.F., Gale, M.R. and Jeglum, J.K. (eds) Northern forested wetlands: ecology and management. Lewis Publishers, CRC Press. pp. 449-457.
Dang, Q.L. and Lieffers, V.J. 1989. Assessment of patterns of response of tree ring growth of black spruce following peatland drainage. Can. J. For. Res. 19: 924-929.
Dubé, S., Plamondon, A.P. and Rothwell, R.L. 1995. Watering-up after clear-cutting on forested wetlands of the St. Lawrence lowland. Water Resour. Res. 31: 1741-1750.
Hånell, B. 1988. Postdrainage forest productivity of peatlands in Sweden. Can. J. For. Res. 18: 1443-1456;
Heikurainen, L. 1967. Hakkuun vaikutus ojitettujen soiden vesitalouteen (Summary: On the influence of cutting on the water economy of drained peatlands). Acta For. Fenn. 82(2): 1-45.
Heikurainen, L. and Päivänen, J. 1970. The Effect of Thinning, Clear Cutting and Fertilization on the Hydrology of Peatland Drained for Forestry. Acta Forestalia Fennica 104: 23 p.
Hillman, G.R. 1987. Improving wetlands for forestry in Canada. Can. For. Serv. Inf. Rep. NOR-X-288. 29 p.
Jeglum, J.K. 1991. Concluding comments and recommendations. In: Jeglum, J.K. and Overend, R.P. (eds) Proceedings, Peat and Peatlands: Diversification and Innovation, 6-10 Aug. 1989, Québec City, Que. Edited by Canadian Society for Peat and Peatlands, Darmouth, N.S. pp. 223-227.
Jutras, S., Bégin, J. and Plamondon, A.P. 2002. Impact du drainage forestier après coupe sur la croissance de l’épinette noire en forêt boréale. Can. J. For. Res. 32: 1585-1596.
Laine, J. and Starr, M.R. 1979. An analysis of the post-drainage stand increment in relation to the peatland site type classification in Finland. In: International Peat Society (eds)

6 Proceedings of the International Symposium on Classification of Peat and Peatland, Hyytiälä, Finland, September 17-21, 1979. pp.147-159.
Landhäusser, S.M., Lieffers, V.J. and Silins, U. 2003. Utilizing pioneer species as a hydrological nurse crop to lower water table for reforestation of poorly drained boreal sites. Ann. For. Sci. 60: 741-748.
Lieffers, V.J. and MacDonald, S.E. 1990. Growth and foliar nutrient status of black spruce and tamarack in relation to depth of water table in some Alberta peatlands. Can. J. For. Res. 20 : 805-809.
Lieffers, V.J. and Rothwell, R.L. 1986. Effects of depth of water table and substrate temperature on root and top growth of Picea mariana and Larix laricina seedlings. Can. J. For. Res. 16: 1201-1206.
Macdonald, S.E. and Yin, F. 1999. Factor influencing size inequality in peatland black spruce and tamarack: evidence from post-drainage release growth. J. Ecol. 87: 404-412.
Marcotte, P. 2005. Rétablissement hydrologique après coupe et vigueur de la regeneration naturelle en sapin baumier (Abies balsamea (L.) Mill.) de milieux forestiers humides de la vallée du St-Laurent. Mémoire de maîtrise, Faculté de foresterie et de géomatique, Université Laval. 60 p.
McLaren, B.E., and Jeglum, J.K. 1998. Black spruce growth and foliar nutrient responses to drainage and fertilisation: Wally Creek, Ontario. For. Chron. 74: 106-115.
Paavilainen, E. and Päivänen, J. 1995. Peatland forestry: ecology and principles. Springer-Verlag, Berlin. 248 p.
Päivänen, J. 1980. The effect of silvicultural treatments on the ground water table in Norway spruce ands Scots pine stands on peat. In: Proceedings of the 6th International Peat Congress, Duluth, Minn., USA.
Payandeh, B. 1973. Analyses of a forest drainage experiment in northern Ontario. II: An economic analysis. Can. J. For. Res. 3: 399-408.
Payandeh, B. 1982. Five-year growth response of northern Ontario peatland black spruce to fertilization and drainage. Can. For. Serv. Inf. Rep. 0-X-340. 20 p.
Payandeh, B. and Papadopol, P.E. 1994. Calibrating ONTWIGS for drained and fertilized peatland black spruce in northern Ontario. Nat. Resour. Can., Canadian Forest Service – Ontario, Sault Ste. Marie, Ontario. Inf. Rep. O-X-441. 7 p.
Payette, S., and Rochefort, L. 2001. Écologie des tourbières du Québec-Labrador. Les Presses de l'Université Laval. 621 p.
7
Penner, M., Penttilä, T., and Hökkä, H. 1995. A method for using random parameters in analyzing permanent sample plots. Silva Fennica 29(4): 287-296.
Prévost, M., Plamondon, A.P., and Belleau, P. 1999. Effects of drainage of a forested peatland on water quality and quantity. J. Hydrol. 214: 130-143.
Prévost, M., Plamondon, A.P., and Roy, V. 2001. La production forestière. In: Payette, S. and Rochefort, L. (eds) Écologie des tourbières du Québec-Labrador. Les Presses de l'Université Laval. pp. 423-447.
Prévost, M., Dumais, D. and Plamondon, A.P. 2005. Effects du drainage sur la croissance et le statut nutritif d’un peuplement d’épinette noire de structure inéquienne: résultats de 10 ans. For. Chron. 81: 516-524.
Roy, V., Jeglum, J.K. and Plamondon, A.P. 1997. Water table Fluctuations Following Clearcutting and Thinning on Wally Creek Wetlands. In: Trettin, C.C., Jurgensen, M.F., Grigal, D.F., Gale, M.R. and Jeglum, J.K. (eds) Northern forested wetlands: ecology and management. Lewis Publishers, CRC Press. pp. 239-251.
Roy, V., Bernier, P.-Y., Plamondon, A.P. and Ruel, J.-C. 1999. Effect of drainage and microtopography in forested wetlands on the microenvironment and growth of planted black spruce seedlings. Can. J. For. Res. 29: 563-574.
Roy, V., Plamondon, A.P. and Bernier, P. 2000. Draining forested wetland cutovers to improve seedling root zone conditions. Scan. J. For. Res. 15: 58-67.
Seppälä, K. 1969. Kuusen ja männyn kasvun kehitys ojitetuilla turvemailla (Summary: Post-drainage growth rate of Norway spruce and Scots pine on peat). Acta For. Fenn. 93. 78 p.
Stanek, W. 1977. Ontario clay belt peatlands - are they suitable for forest drainage? Can. J. For. Res. 7: 656-665.
Sundström, E. 1992. Five-year growth response in drained and fertilised black spruce peatlands. I. Permanent growth plot analysis. NEST Tech. Rep. TR-02 / For. Can. Inf. Rep. 0-X-417. 19 p.
Sundstrom, E. and Jeglum, J.K. 1992. Five-year growth response in drained and fertilised black spruce peatlands. II. Stem analysis. NEST Tech. Rep. TR-03 / For. Can. Inf. Rep. 0 X-420. 13 p.

CHAPTER 1
Draining an unproductive black spruce peatland stand: 18-year post-treatment tree growth assessment and future stand productivity estimation
9
Jutras, S.1, Bégin, J.1, Plamondon, A.P.1, and Hökkä, H.2 To be submitted to Forestry
Chronicle. Draining an unproductive black spruce peatland stand: 18-year post-
treatment tree growth assessment and future stand productivity estimation. 1Faculty
of Forestry and Geomatics, Université Laval, Ste-Foy, Québec, G1K 7P4, CANADA. 2Finnish Forest Research Institute, Rovaniemi Research Station, P.O. Box 16, FIN 96301
Rovaniemi, FINLAND. This chapter is the result of the candidate’s labour. Jean Bégin,
André Plamondon and Hannu Hökkä have been giving suggestions on the design and the
preparation of this chapter.
Abstract
In eastern Canadian boreal forest, drainage of unproductive black spruce peatland stands is
a marginally used silvicultural treatment. The rare scientific literature concerning its
influence on tree growth is moreover relatively enthusiast about the possibility to reach
stand productivity. This study aimed to address this issue by assessing the individual tree
growth and by estimating the future stand productivity on this type of drained site. Results
showed larger mean annual post-drainage stump diameter increment with increasing ditch
proximity but they also showed the minor effect of the treatment at distances greater than
15 m from the ditch. Small trees reacted more efficiently to the treatment than the larger
ones. Estimated future stand productivity was also influenced by the ditch proximity. The
unintended presence of excavating mounds on only one side of the ditch greatly influenced
tree growth and site productivity. Considering the obtained results, intensive drainage
operations, utilizing narrow ditch spacing, would be necessary in order to transform
unproductive sites into productive ones. Using the estimated productivity rates, drained
stands should yield, at maturity, relatively low merchantable volume.

10
Résumé
Le drainage de peuplements forestiers improductifs tels que les pessières noires sur sol
organique est un traitement sylvicole marginal en forêt boréale de l’est du Canada. La
littérature scientifique à ce sujet est rare et relativement enthousiaste à propos de la
possibilité d’en obtenir éventuellement des peuplements productifs. Cette étude visait à
clarifier cette possibilité en mesurant la croissance de tiges individuelles d’épinette noire et
en estimant la productivité future d’un peuplement improductif drainé. Les résultats ont
démontré des accroissements annuels moyens post-drainage en diamètre à la souche
augmentant avec la proximité du fossé. Toutefois, ce traitement a peu d’effet à des
distances supérieures à 15 m. Les petits arbres ont mieux réagi au traitement que les arbres
plus gros. La productivité future a aussi été influencée par la proximité des fossés. La
présence non planifiée de butons d’excavation sur un seul coté des fossés s’est avérée
déterminante pour la croissance forestière et la productivité du site. En considérant les
résultats obtenus, l'emploi de réseaux de drainage intensifs utilisant des espacements étroits
entre les fossés semblerait nécessaire afin de rendre productif un peuplement improductif.
En utilisant les taux de productivité estimés, les sites drainés devraient produire, à maturité,
un volume marchant relativement bas.
11
Introduction
The periodically revived threat of stock rupture has brought Canadian foresters to think
about different ways to avoid this undesirable eventuality. Managing slow-growing and
unproductive boreal black spruce (Picea mariana (Mill.) B.S.P) peatland stands by draining
them to achieve greater stand merchantability has been suggested by numerous authors in
Alberta (Wang et al. 1985; Hillman 1987, 1991a, 1991b; Dang and Lieffers 1989; Hillman
and Takyi 1998), in Ontario (Stanek 1968, 1977; Payandeh 1973a, 1973b, 1975, 1982,
1989; Rosen 1989; Jeglum 1991a, 1991b), in Québec (Stanek 1970; Nadeau and Parent
1982; Zarnovican 1989) and in Newfoundland (Heikurainen 1968; Pollett 1969; Päivänen
and Wells 1978).
In Quebec, unproductive boreal peatland stands, by definition, support < 30 m³/ha of
merchantable timber at 120 years (Saucier 1994). These stands have a site index of 3 m or
less at 50 years (Payandeh 1978, 1990). They correspond to various ecological stand types,
from treeless to sparsely wooded peatlands such as treed ombrotrophic bogs and extreme
poor treed fens (e.g., Jeglum 1991c). According to the 3rd National Forest Inventory,
unproductive peatland stands cover about 4 Mha, which represents 6.7 % of Quebec’s total
land cover under forest management. On these boreal sites, black spruce is the most
abundant commercial tree species. Tamarack (Larix laricina (Du Roi) K. Koch), balsam fir
(Abies balsamea (L.) Mill.) and eastern white-cedar (Thuja occidentalis L.) also are
occasionally found in small numbers. The high water-table level and poor nutrient
availability that characterise such sites severely limit tree growth (Payandeh 1973a; Leiffers
and Rothwell 1986; Leiffers and Macdonald 1990).
Forest drainage is a silvicultural treatment that removes excess soil water through a
network of inter-connected ditches, thereby lowering the water-table level of peatland sites
(Heikurainen 1964; Paavilainen and Päivänen 1995; Lieffers and Rothwell 1987; Hillman
1992; Roy et al. 2000). Consequently, soil aeration will be improved, peat decomposition
accelerated and nutrient availability increased (Lieffers and Rothwell 1987; Lieffers 1988;
Prévost et al. 1997, 1999; Roy et al. 2000). Slow-growing black spruce subsequently can

12
show enhanced annual diameter and height increments (Payandeh 1973a; Jutras et al. 2002;
Prévost et al. 2005). The most favourable reactions to this treatment have been reported for
small trees (Macdonald and Yin 1999) and for trees located in close proximity to ditches
(McLaren and Jeglum 1998), while old and narrow-crowned trees are not likely to show
response to drainage (Stanek 1968). Black spruce often has shown delayed growth
reactions to improved soil conditions, with significant growth increments appearing only in
the sixth year after drainage (McLaren and Jeglum 1998; Dang and Lieffers 1989).
Consequently, most studies evaluating 5-year post-treatment black spruce growth have
revealed no significant reaction to drainage (Payandeh 1982; Sundstrom 1992; Sundstrom
and Jeglum 1992; Prévost et al. 1999).
In Canada, many papers have been published concerning the positive effects of forest
drainage on tree growth in mid-rotation or pre-mature stagnant peatland stands. Some of
the most enthusiast ones are however leaving readers perplex concerning the validity of
their silvicultural recommendations (Stanek 1968; Nadeau and Parent 1982; Wang et al.
1985; Bolghari 1986; Zarnovican and Laberge 1994). Data selection often was questionable
and the statistical analysis inappropriate, if not absent. Few well-designed, reproducible
experiments have studied drainage of pre-mature stagnant peatland stands in the Canadian
boreal forest (Payandeh 1973a; Stanek 1977; Dang and Lieffers 1989; McLaren and Jeglum
1998; Macdonald and Yin 1999; Prévost et al. 2005). When drainage is applied at mid-
rotation on a relatively fertile, densely stocked, productive peatland stand, reasonable
increases in stand yield can be expected (Payandeh 1973a; McLaren and Jeglum 1998;
Macdonald and Yin 1999). However, no concrete management recommendations have
originated from these studies. Also, very little is known about the potential transformation
of unproductive peatland sites into productive ones, since only Stanek (1977) estimated the
growth reaction of black spruce after drainage in such stands.
The effects of forest drainage on the quality of runoff water have been documented in
Canada (Berry and Jeglum 1991a; Prévost et al. 1999). Even if on-site and downstream
water quality is rarely degraded beyond acceptable limits when appropriate methods are
used, environmental changes inevitably follow the drainage of peatland ecosystems.
Ecological cautiousness and low anticipated financial returns have made drainage of
13
unproductive and over-mature black spruce peatland stands a marginal treatment in eastern
Canadian forests. With the currently renewed threat of stock depletion and the growing
interest in intensive management (Coulombe et al. 2004), drainage may regain popularity
in eastern Canada boreal regions where forested peatland stands cover wide areas.
However, the extent of growth and productivity improvement due to this treatment is still
undetermined. In the Canadian boreal forest, the oldest scientifically designed drainage
experiments were established in the early 1980’s (Hillman 1987; Paavilainen and Päivänen
1995). Determining stand productivity of drained unproductive peatland at maturity
consequently requires monitoring periods exceeding the 20-year span of most study sites.
In order to compensate for the lack of long-term information, Stanek (1977) used Plonski’s
(1974) yield tables while attempting to estimate the future yield of drained sites by
monitoring alterations to the site index following drainage. Payandeh (1978) later
demonstrated that the data used to create these yield tables grossly overestimated the true
site index for short and old peatland black spruce stands, and suggested new height growth
and site index formulae.
Using one of the oldest experimentally drained unproductive peatland stands of eastern
Canada, we assessed the 18-year post-drainage stump diameter increment of black spruces
in relation to ditch proximity and initial size. In this strongly uneven-sized slow growing
stand, we hypothesised that black spruce diameter increment would be significantly greater
for trees located in the first few meters from the ditch, and mainly for small-sized trees. The
change in site index that followed drainage operations was monitored as a function of ditch
proximity and was predicted over the 80-year period following drainage. We verified the
hypothesis that, even with optimistic assumptions, stand productivity would not be
achieved on this drained unproductive black spruce peatland stand.
14
Material and methods
The study area (49°28.7’N, 74°38.3’W) is located 60 km south of the town of Chapais,
Quebec, Canada. In 1984, a 15 ha unproductive uneven-sized black spruce stand was
drained for experimental purposes. This study site was part of a larger research project of
the Ministry of Energy and Resources (Bolghari and Veilleux 1987), and was abandoned in
1993. Most information concerning the drained unproductive site and the network of
permanent plots covering it was lost. However, the ditch network was still intact and the
ecological descriptions of the sites were still available. Therefore, new experimental plots
specifically designed to test the hypotheses were established in 2002.
The site was described as a Chamaedaphne-dominated peatland stand or OG14, using the
Ontario Forest Ecosystem Classification for the Clay Belt, site Region 3e (Jones et al.
1983). Using the Quebec Forest Ecosystem Classification (Bergeron et al. 1998), the site
was described as a Picea mariana-Sphagnum ombrotrophic peatland stand or RE39/LEG
CAL SPS. The tree layer consisted exclusively of black spruce. The shrub layer was
characterized by the presence of abundant Chamaedaphne calyculata (L.) D. Don. and
Rhododendron groenlandicum (Oeder) Kron & Judd , as well as Kalmia polifolia Wang.,
Kalmia angustifolia L. and Andromeda glaucophylla Link. The moss layer was dominated
largely by Sphagnum flexuosum Dozy & Molk., S. fuscum (Schimp.) Klinggr. and S.
magellanicum Brid.; Pleurozium schreberi (Brid.) Mitt. was present in smaller proportions.
The soil consisted of a deep organic layer (> 0.9 m) composed of weakly decomposed
sphagnum moss. The thirty-year mean annual precipitation, temperature and degree-days
above 5ºC, which were obtained from the “Chapais 2” meteorological station (49º46'N,
74º51'W), are 961.3 mm, 0.0ºC and 1235 degree-days, respectively (Environment Canada
2004).
15
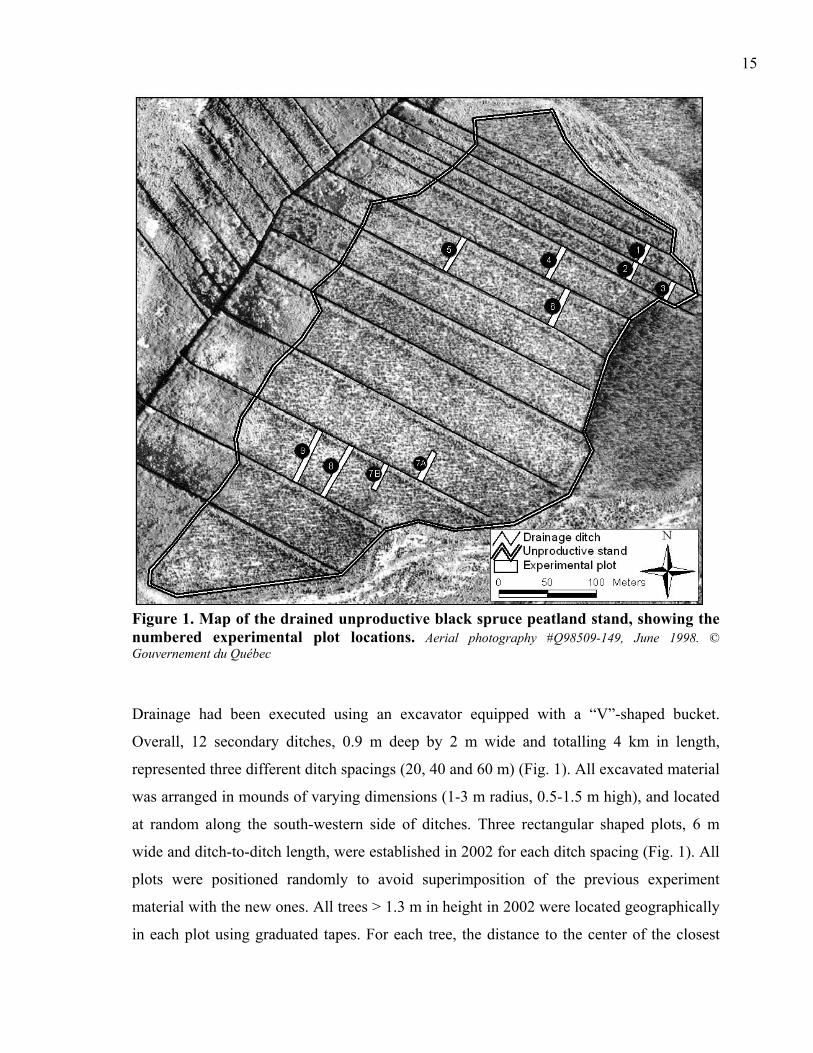
Figure 1. Map of the drained unproductive black spruce peatland stand, showing the numbered experimental plot locations. Aerial photography #Q98509-149, June 1998. © Gouvernement du Québec
Drainage had been executed using an excavator equipped with a “V”-shaped bucket.
Overall, 12 secondary ditches, 0.9 m deep by 2 m wide and totalling 4 km in length,
represented three different ditch spacings (20, 40 and 60 m) (Fig. 1). All excavated material
was arranged in mounds of varying dimensions (1-3 m radius, 0.5-1.5 m high), and located
at random along the south-western side of ditches. Three rectangular shaped plots, 6 m
wide and ditch-to-ditch length, were established in 2002 for each ditch spacing (Fig. 1). All
plots were positioned randomly to avoid superimposition of the previous experiment
material with the new ones. All trees > 1.3 m in height in 2002 were located geographically
in each plot using graduated tapes. For each tree, the distance to the center of the closest
16
ditch (DIST) was measured at the nearest 5 cm. A categorical value described which ditch
was used as reference (i.e., the closest ditch) by relating its slope position (DITCH: UP or
DOWN). All trees were felled and a wood disk was collected at stump height (H = 0.3 m).
The 5-year pre-drainage diameter increment (1979-1984) and the 18-year post-drainage
diameter increment (1984-2002) were determined from rings in 1979, 1984, and 2002,
which were measured on two perpendicular radii of the air-dried and sanded wood discs.
Dendrochronological measurements were executed with a scanner and the WinDendro™
system (Regent Technology Inc., Sainte-Foy, QC, Canada) or a micro-metric table. The
diameter distribution of the 967 black spruce that were measured in 1984 confirmed the
uneven-size structure of the stand.
For each felled tree, total height was measured at the nearest cm. The height at the time of
drainage was estimated by counting down annual whorls on the stem. Since the exhaustive
assessment of annual whorl scars was rather imprecise, especially for slow growing trees, a
second disc was collected under the estimated 1984 whorl for all trees. After being air-dried
and sanded, these discs were used to confirm or adjust the 1984 height estimates. Mean
stem characteristics of the treated plots are summarised in Table 1.
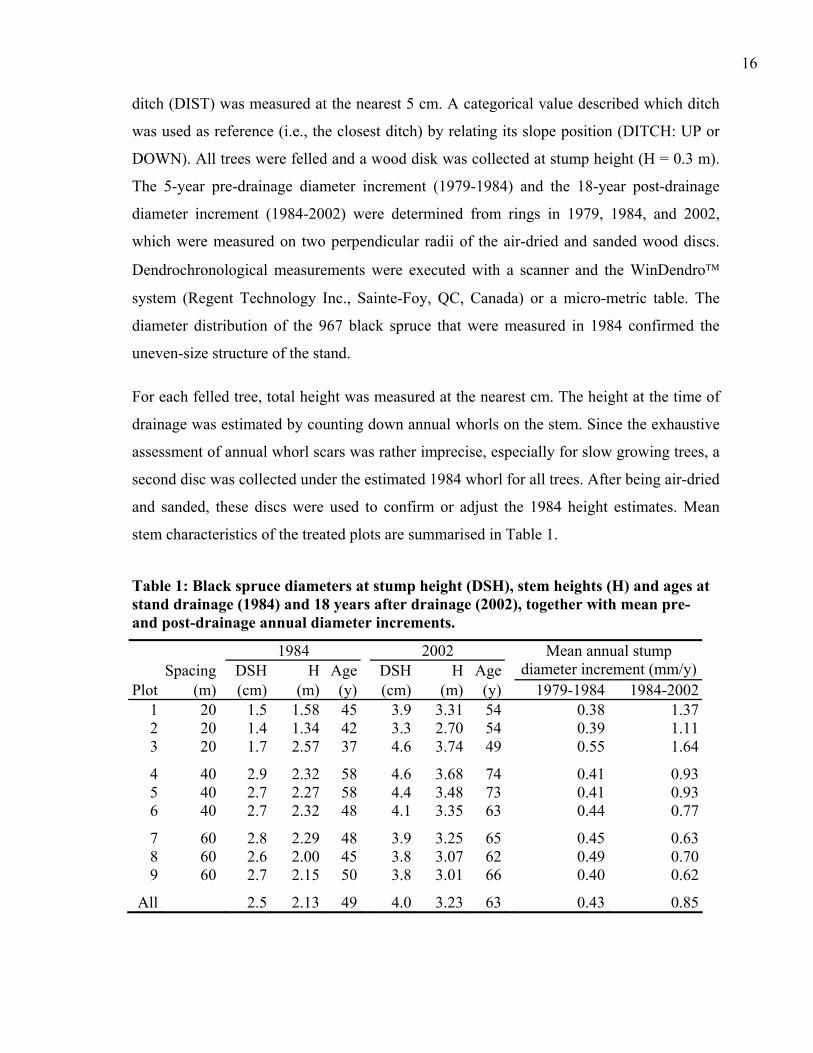
Table 1: Black spruce diameters at stump height (DSH), stem heights (H) and ages at stand drainage (1984) and 18 years after drainage (2002), together with mean pre- and post-drainage annual diameter increments.
1984 2002 Spacing DSH H Age DSH H Age
Mean annual stump diameter increment (mm/y)
Plot (m) (cm) (m) (y) (cm) (m) (y) 1979-1984 1984-20021 20 1.5 1.58 45 3.9 3.31 54 0.38 1.372 20 1.4 1.34 42 3.3 2.70 54 0.39 1.113 20 1.7 2.57 37 4.6 3.74 49 0.55 1.64
4 40 2.9 2.32 58 4.6 3.68 74 0.41 0.935 40 2.7 2.27 58 4.4 3.48 73 0.41 0.936 40 2.7 2.32 48 4.1 3.35 63 0.44 0.77
7 60 2.8 2.29 48 3.9 3.25 65 0.45 0.638 60 2.6 2.00 45 3.8 3.07 62 0.49 0.709 60 2.7 2.15 50 3.8 3.01 66 0.40 0.62
All 2.5 2.13 49 4.0 3.23 63 0.43 0.85
17
Diameter growth assessment
Individual tree mean annual stump diameter increment for the 18-year post-drainage period
(ADI84-02) was expressed as a function of the diameter at drainage (D84) by means of
analysis of covariance (ANCOVA). Logarithmic transformation of ADI84-02 and D84
were used to satisfy assumptions of normality and homogeneity of variance and to obtain a
linear relationship between the two variables. The distance to the closest ditch (DIST),
susceptible to express a non linear relationship with the response variable, was tested in the
model with various transformations such as DIST, DIST2, DIST0.5, DIST-1 and ln(DIST).
The reference ditch (DITCH: UP or DOWN) was used independently and in interaction
with diameter and distance variables in the model. Growth variation between ditch spacings
and plots were considered as random variables in the model. The MIXED procedure of
SAS 9.1 (SAS Institute Inc., 2003) was used to perform the statistical analysis. All fixed
and random parameters of the model were estimated simultaneously using the restricted
maximum likelihood method. A level of significance of 5 % was used throughout this
study. Selection of each explanatory variable or interaction was based on its significant
influence on the response variable and its influence on the -2·log-likelihood value of the
entire model. Minimising AIC (Akaike’s Information Criterion) was an additional step used
in selecting the final model.
Stand productivity estimation
By enhancing soil growing conditions, forest drainage should positively affect site
productivity of forested peatlands. Site index, i.e., tree height at a given age, is commonly
used to estimate site productivity. It is measured on a sub-sample of dominant or
codominant stems selected within a plot, and normally necessitates the measurement of
their height and age. When using changes in site index to evaluate the effect of a treatment
on productivity, it is assumed that the status of the selected stems forming the dominant and
codominant layers remained the same throughout time (Payandeh 1978; Hökkä and
Ojansuu 2004). Since drainage is known to reduce size inequity of uneven-sized black

18
spruce peatland stands (Macdonald and Yin 1998), the previous assumption might not be
appropriate for the study area. It is preferable that site index should incorporate changing
hierarchical height structure of these stands instead of being considered stable in time. This
can be achieved by selecting the most dominant stems during each period of measurement
and not restricting stem selection to the ones selected during the previous measurement.
This site index estimation method was considered adequate to compensate for the low
degree of reaction to drainage of large stems forming the dominant layer compared to that
of smaller stems.
Future stand productivity was estimated for an 80-year period after drainage. This estimate
required the calculation of individual tree heights for time periods beyond the 18-year
period of observation. In order to determine the height growth of each tree with reasonable
confidence, Payandeh’s (1978) black spruce peatland height growth curve was used (Eq. 1).
[1] 5
432
1 1bSIbAbebSIbH
⋅⎟⎠⎞
⎜⎝⎛ ⋅−−⋅=
Where H is the measured height at a given age; SI is the site index, i.e., the total tree height
at 50 year; A is tree age measured at stump height (30 cm); b1, b2, b3, b4, and b5 are
parameters corresponding to 16.2149, 0.1496, 0.01326, 4.6602, and 0.5787 respectively;
Future tree height growth was assumed to be reasonably related to the observed 18-year
post-drainage tree height growth increment. This assumption meant that the 18-year
selected period of observation was representative of new site productivity and that the
effect of drainage which occurred during this period would remain constant through time.
Even if this statement is a working hypothesis, it appears the most appropriate for the
following reasons. First, post-drainage height growth should provide a reasonable estimate
of site productivity since it includes the growth reaction delay and the maximum growth
effect of the treatment, which was occurred between 13 to 19 years after drainage (Dang
and Lieffers 1989). Second, this 18-year average growth response is likely to be maintained
for up to 40 years following treatment since ditches normally show reduced water flow
capacities after 30 to 40 years. Flow reduction is due to ditch deterioration caused by peat
19
subsidence, wall collapse and erosion (Paavilainen and Päivänen 1995). Hence, the
expected height growth projected for the 80-year period after drainage is rather optimistic.
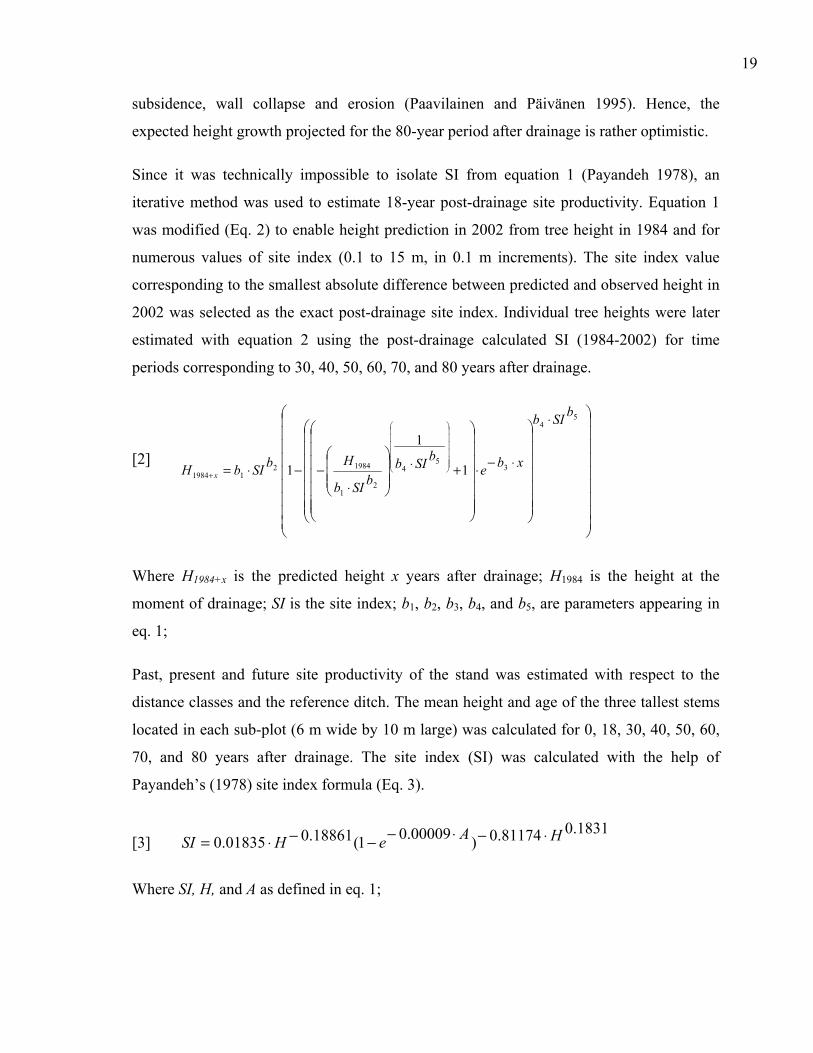
Since it was technically impossible to isolate SI from equation 1 (Payandeh 1978), an
iterative method was used to estimate 18-year post-drainage site productivity. Equation 1
was modified (Eq. 2) to enable height prediction in 2002 from tree height in 1984 and for
numerous values of site index (0.1 to 15 m, in 0.1 m increments). The site index value
corresponding to the smallest absolute difference between predicted and observed height in
2002 was selected as the exact post-drainage site index. Individual tree heights were later
estimated with equation 2 using the post-drainage calculated SI (1984-2002) for time
periods corresponding to 30, 40, 50, 60, 70, and 80 years after drainage.
[2]
⎟⎟⎟⎟⎟⎟⎟⎟⎟
⎠
⎞
⎜⎜⎜⎜⎜⎜⎜⎜⎜
⎝
⎛ ⋅
⎟⎟⎟⎟⎟⎟⎟
⎠
⎞
⎜⎜⎜⎜⎜⎜⎜
⎝
⎛
⋅−⋅
⎟⎟⎟⎟⎟⎟⎟
⎠
⎞
⎜⎜⎜⎜⎜⎜⎜
⎝
⎛
+⋅⎟⎟⎟
⎠
⎞
⎜⎜⎜
⎝
⎛
⋅−−⋅= ⎟⎟
⎟⎟⎟⎟
⎠
⎞
⎜⎜⎜⎜⎜⎜
⎝
⎛
+
54
35
4
21
1984211984 1
1
1
bSIb
xbebSIb
bSIb
HbSIbH x
Where H1984+x is the predicted height x years after drainage; H1984 is the height at the
moment of drainage; SI is the site index; b1, b2, b3, b4, and b5, are parameters appearing in
eq. 1;
Past, present and future site productivity of the stand was estimated with respect to the
distance classes and the reference ditch. The mean height and age of the three tallest stems
located in each sub-plot (6 m wide by 10 m large) was calculated for 0, 18, 30, 40, 50, 60,
70, and 80 years after drainage. The site index (SI) was calculated with the help of
Payandeh’s (1978) site index formula (Eq. 3).
[3] 1831.081174.0)00009.01(18861.001835.0 HAeHSI ⋅−⋅−−−⋅=
Where SI, H, and A as defined in eq. 1;
20
Results
The statistical analysis demonstrated the significant influence of initial stem dimension, the
distance to the ditch, and the reference ditch used on black spruce growth (Table 2). The
mean stem characteristics showed small variations between plots (Table 1), which were
accounted for in the model by the plot random effect. This random effect almost showed a
significant effect (p = 0.0882).
Table 2: Analysis of covariance (ANCOVA) of the 18-year post-drainage mean annual stump diameter increment (ln(ADI84-02)).
Source of variation df F value p valueFixed variables
ln(D84) 1 45.94 <0.0001DITCH 1 24.09 <0.0001ln(D84) × DITCH 1 16.40 <0.0001DIST 1 41.66 <0.0001DIST0.5 1 54.31 <0.0001DIST-1 1 19.93 <0.0001DIST × DITCH 1 12.59 0.0004DIST0.5 × DITCH 1 16.92 <0.0001DIST-1 × DITCH 1 19.70 <0.0001
Random effects Spacing 2 0.2332Plots 8 0.0882Residual error 914 Corrected total 931
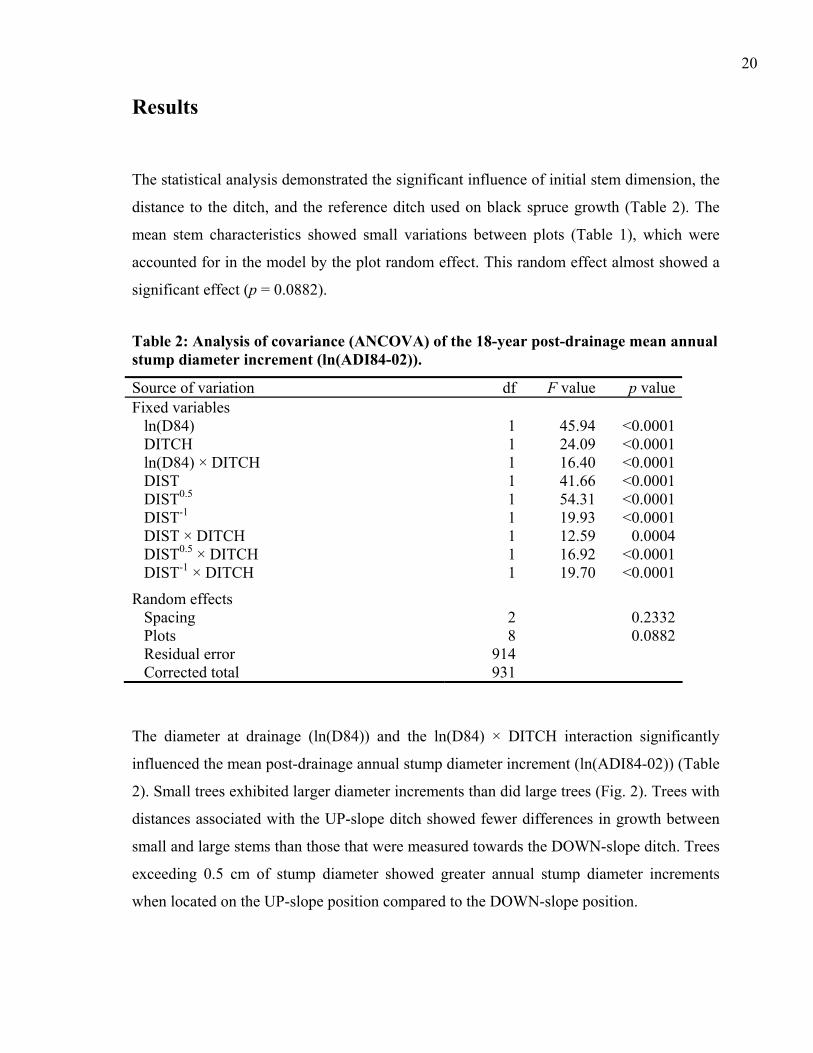
The diameter at drainage (ln(D84)) and the ln(D84) × DITCH interaction significantly
influenced the mean post-drainage annual stump diameter increment (ln(ADI84-02)) (Table
2). Small trees exhibited larger diameter increments than did large trees (Fig. 2). Trees with
distances associated with the UP-slope ditch showed fewer differences in growth between
small and large stems than those that were measured towards the DOWN-slope ditch. Trees
exceeding 0.5 cm of stump diameter showed greater annual stump diameter increments
when located on the UP-slope position compared to the DOWN-slope position.
21
0
0.5
1
1.5
2
2.5
0 2 4 6 8 10 12Diameter at the moment of drainage (cm)
Pred
icte
d po
st-d
rain
age
annu
al s
tum
p di
amet
er
incr
emen
t (m
m)
UPDOWN
Reference ditch
Figure 2. Initial black spruce dimensions as a tree growth factor on a drained unproductive peatland stand. Values were estimated for a fixed distance to the center of the ditch (mean distance = 11.68 m).
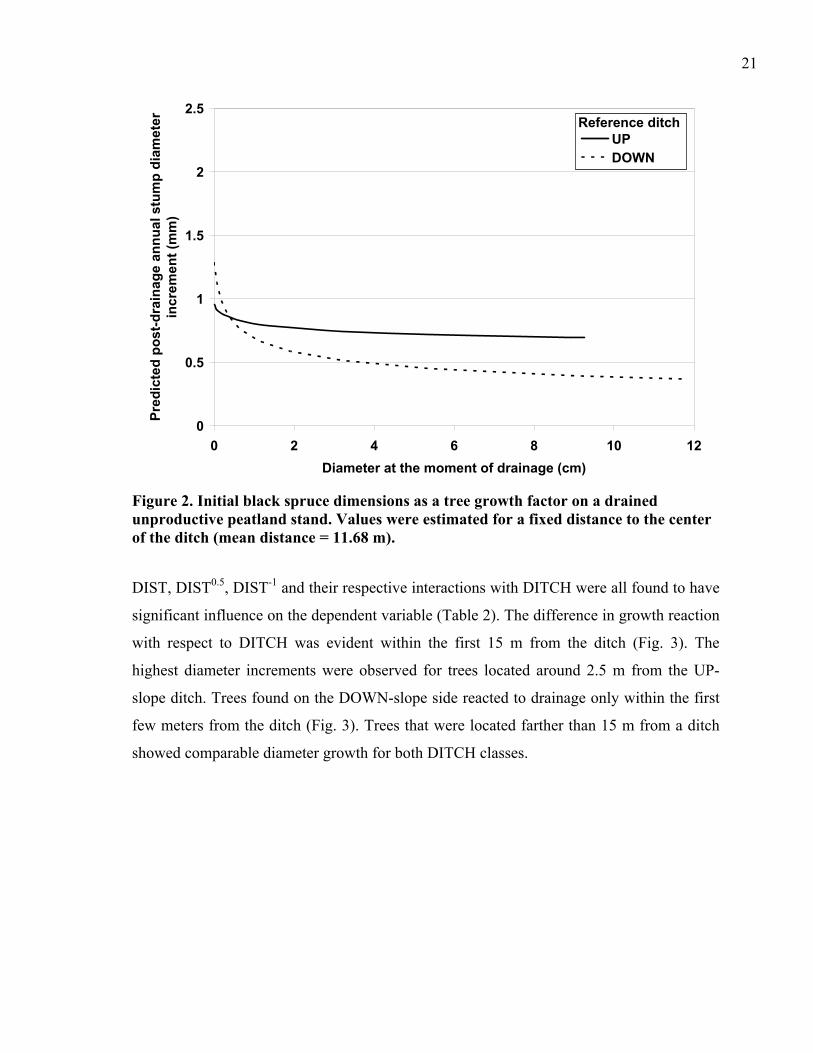
DIST, DIST0.5, DIST-1 and their respective interactions with DITCH were all found to have
significant influence on the dependent variable (Table 2). The difference in growth reaction
with respect to DITCH was evident within the first 15 m from the ditch (Fig. 3). The
highest diameter increments were observed for trees located around 2.5 m from the UP-
slope ditch. Trees found on the DOWN-slope side reacted to drainage only within the first
few meters from the ditch (Fig. 3). Trees that were located farther than 15 m from a ditch
showed comparable diameter growth for both DITCH classes.
22
0
0.5
1
1.5
2
2.5
0 5 10 15 20 25 30Distance to the center of the closest ditch (m)
Pred
icte
d po
st-d
rain
age
annu
al s
tum
p di
amet
er
incr
emen
t (m
m)
UPDOWN
Reference ditch
Figure 3. Effects of ditch proximity on black spruce growth in a drained unproductive peatland stand. Values were estimated for a fixed diameter at drainage (Mean diameter = 2.48 cm).
Calculated values of SI were plotted as a function of the distance from the closest ditch, the
reference ditch and time since drainage (Fig. 4). Values observed in 1984 had a maximum
of 3.1 m but averaged 2.5 m. Site index values generally rose with time. The highest SI
value was obtained 60 years after drainage from 0 to 10 m from the center of the UP-slope
ditch.
23
0.0
1.0
2.0
3.0
4.0
5.0
6.0
0 10 20 30 40 50 60 70 80Years since drainage
Site
Inde
x (h
eigh
t in
m a
t 50
year
s)
0-10m (UP) 0-10m (DOWN)10-20m (UP) 10-20m (DOWN)20-30m (UP) 20-30m (DOWN)
Figure 4. Site productivity estimation for a drained unproductive black spruce peatland stand over an 80-year post-drainage period. Classes of distance to the center of the closest ditch (0-10 m, 10-20 m, 20-30 m) and the reference ditch (UP or DOWN) were used to classify the observations. Actual SI values were measured at year 0 and 18, while they were predicted for year 30 and beyond.
Discussion
Diameter growth assessment
When interpreting the results concerning the post-drainage mean annual stump diameter
increment, it seemed obvious that the reference ditch have played a very important role.
This factor revealed significant differences in tree growth reaction following drainage. It
appears, however, that this factor was not taken into consideration in the original
experimental design since the presence of excavated soil mounds were systematically found
on the same side of the ditches. The improperly replicated mound locations made it
impossible to exactly determine the effect of DITCH influence on tree growth. It could

24
have been the consequence of varying soil conditions that were triggered by differing
shapes of the water-table along each side of the drained strip. For example, the commonly
observed arch-shaped form of the water-table height between two ditches (Berry and
Jeglum 1991b; Hillman 1992; Prévost et al. 1997) can be slightly tilted, showing lower
water-table levels on the high side of the drained strip compared to the low side (Braekke
1983). Therefore, on our gently sloped study area (> 0.5 % slope), only small differences
between water-table levels on opposite sides of the drained strip would have prevailed.
Consequently, the possible differences in water-table shape along each side of the drained
strip might have only resulted in minor differences in tree growth.
The most probable explanation for the observed tree growth difference with respect to the
reference ditch was the systematic presence of excavation mounds located between 2 and 6
m from the center of the uppermost ditch. These mounds, made of dark and well
decomposed peat, could have enhanced local soil conditions by leaching nutrients into the
soil. On the DOWN-slope ditch side, soil conditions were likely enhanced only by lowering
of the water-table caused by drainage, since excavated material was never laid on this side
of the ditch. Tree growth and site productivity differences observed between UP and
DOWN-slope positions of the reference ditch were consequently largely attributed to the
presence of excavating mounds on the UP-slope ditch side.
The observed higher diameter growth of small trees compared to that of larger ones (Fig. 2)
was consistent with some observations from other drainage experiments (Dang and Lieffers
1989; Macdonald and Yin 1999). Small trees, which were normally represented by young
stems with vigorous green crowns, logically had superior abilities to take advantage of new
soil conditions induced by drainage compared to large trees. Larger trees often were
represented by old and stagnant stems showing narrow tufted living crowns. However, the
small growth difference observed between small and large stems located close to the UP-
slope ditch revealed that, in these sections of the drained site, drainage might have more
equitably affected the growth of all stems. In the absence of excavation mounds, i.e.,
DOWN-slope, large stems generally showed annual stump diameter increments lower than
0.5 mm/y, a result comparable to pre-drainage growth increments (Table 1).

25
The arch-shaped form of the water-table between two ditches is the principal cause of
gradually enhanced soil growing conditions with increasing ditch proximity (Roy et al.
2000). Most studies that assess lowering of water-table levels following drainage in organic
soils have demonstrated that the significant effect of this treatment was limited to the first
10 to 15 m from the ditch (Belleau et al. 1992; Prévost et al. 1997; Jutras and Plamondon
2005). The mean annual stump diameter increments measured in our study reacted
accordingly to the known spatially limited effect of drainage. Tree growth was high from 0
to 15 m from the ditch and it varied as a function of the ditch proximity. However, 15 to 30
m from the ditch, measured diameter increments showed low and constant values
regardless of the distance to the ditch or the reference ditch used. These observations
confirmed the absence of drainage effects farther than 15 m from the ditch.
Drainage enhanced growth within the first 15 m from the ditch, but important variations
were observed with respect to the ditch used as reference. On the DOWN-slope ditch side,
the highest diameter increments were found within the first 5 m from the ditch, showing
evidence of the spatially restricted amelioration of the soil growing conditions caused by
water-table drawdown in weakly decomposed organic soils. On the opposite side of the plot
(DITCH = UP), higher diameter increments were observed since trees were simultaneously
influenced by the effect of drainage and the presence of decomposing organic mounds. The
rapidly rising diameter growth between 1.5 and 2.5 m from the UP-slope ditch could
mainly be explained by modelling shortcomings. In presence of only the DIST and DIST0.5
factors in the model, tree growth would rise exponentially with increasing ditch proximity.
The DIST-1 factor was mainly responsible for limiting the exponential shape of the curve,
but diameter growth was underestimated for very low values of distance to the ditch.
Biased growth estimation by the model could also have been caused by the poor
representation of very low distance to the ditch values within the data set. Observations
found in this specific area (DIST < 2.5 m, DITCH = UP) represented only 4% of the whole
data set. From 2.5 to 15 m, the mean annual stump diameter increment gradually decreased,
following the pattern of average water table level across the strip which has been observed
in several studies (Berry and Jeglum 1991b; Hillman 1992; Prévost et al. 1997).
26
The results that we obtained confirmed our first hypothesis, since black spruce diameter
increment was significantly greater for small-sized compared to large-sized trees and for
trees located in the first few meters from the ditch compared to ones located farther away.
Moreover, the influence of excavation mounds on tree growth was pronounced, since post-
drainage mean annual stump diameter increments showed very important differences with
respect to the presence or absence of such mounds.
Stand productivity estimation
Periodic calculations of SI that were executed for 1984 confirmed the unproductive state of
the treated site at drainage. The highest SI estimate of 3.1 m corresponds to a merchantable
volume at 120 years of 30.9 m³/ha, a value which barely meets Quebec productivity criteria
(Saucier 1994). After drainage, site productivity was considerably enhanced for the 0-10 m
UP-slope class, where the highest individual post-drainage tree growth was observed. The
determination of future SI values was strongly influenced by the very rapid growth of small
trees, which quickly out-grew stems that were dominant in 1984. Estimated future SI for
the 0-10 m UP-slope distance class showed a gradual increase in site productivity that
reached a maximum value of 5.0 m, which corresponds to an expected merchantable
volume at 120 years of 125 m³/ha (Payandeh 1990). This calculated yield does not consider
the physical presence of open ditches where trees will never grow. Considering the average
width of a ditch, a one meter large strip of land should be subtracted, thereby reducing the
merchantable yield of the 0-10 m classes by 10%. Moreover, if a realistic maintenance
scenario is planned, ditches will need to be cleaned after a few decades to sustain their
water flow capacities. The necessary passage of the excavation machinery required for
ditch maintenance will destroy vegetation encountered within the first 2 meters on each
side of the ditch, reducing the productive area of the 0-10 m classes by a further 10%. In
such situations, it would be reasonable to expect a maximum merchantable volume at 120
years of 100 m³/ha in the 0-10 m UP-slope class and of 42.7 m³/ha in the 0-10 m DOWN-
slope class. In all other distance classes (10-20 m and 20-30 m), SI barely surpassed the
productivity criteria, even 80 years after the treatment. The restricted influence of drainage
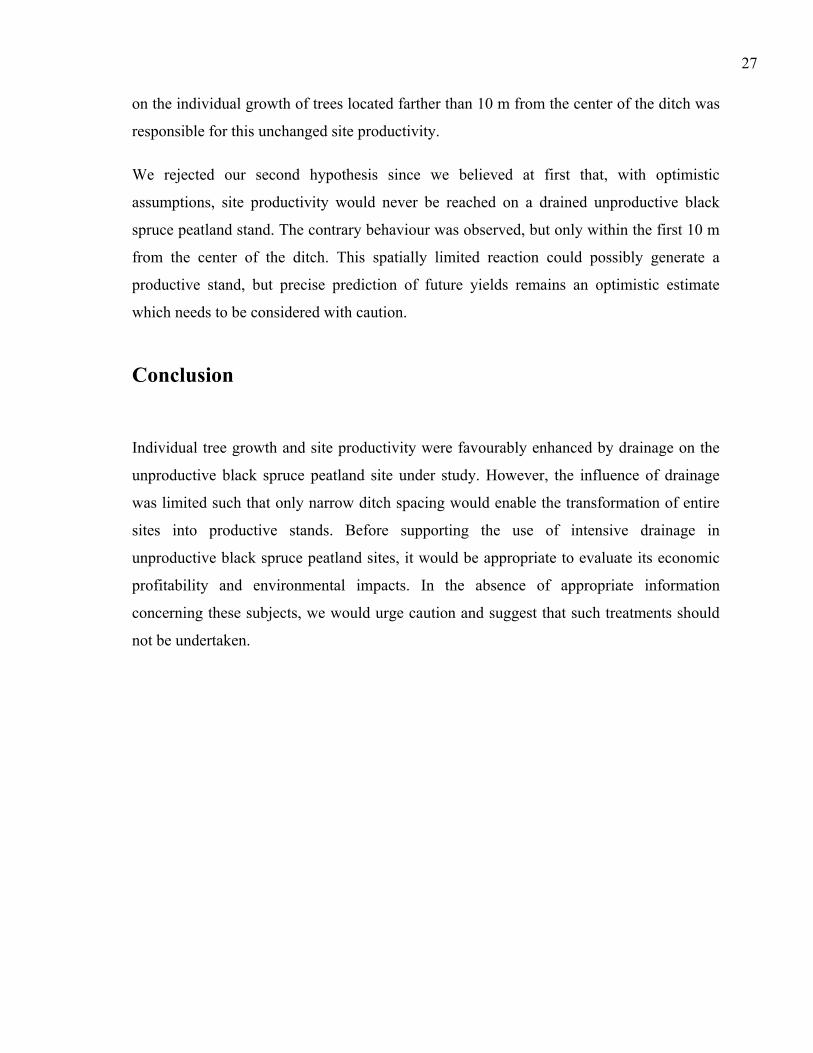
27
on the individual growth of trees located farther than 10 m from the center of the ditch was
responsible for this unchanged site productivity.
We rejected our second hypothesis since we believed at first that, with optimistic
assumptions, site productivity would never be reached on a drained unproductive black
spruce peatland stand. The contrary behaviour was observed, but only within the first 10 m
from the center of the ditch. This spatially limited reaction could possibly generate a
productive stand, but precise prediction of future yields remains an optimistic estimate
which needs to be considered with caution.
Conclusion
Individual tree growth and site productivity were favourably enhanced by drainage on the
unproductive black spruce peatland site under study. However, the influence of drainage
was limited such that only narrow ditch spacing would enable the transformation of entire
sites into productive stands. Before supporting the use of intensive drainage in
unproductive black spruce peatland sites, it would be appropriate to evaluate its economic
profitability and environmental impacts. In the absence of appropriate information
concerning these subjects, we would urge caution and suggest that such treatments should
not be undertaken.

28
Acknowledgements
The authors would like pay tribute to Dr. Hassan Ali Bolghari (1938-1992), who
established in 1983 the innovative experimental area where the study was performed. This
research was supported by the Quebec Ministry of Natural resources and Wildlife and Les
Chantiers de Chibougamau Ltée. throught the ‘Programme de mise en valeur des
ressources du milieu forestier – Volet 1’. The first author was financially supported by a
doctoral scholarship from FQRNT (Fonds québecois de la recherche sur la nature et les
technologies).
References
Belleau, P., A.P. Plamondon, R. Lagacé and S. Pepin. 1992. Hydrodynamique d'une pessière noire drainée. Can. J. For. Res. 22: 1063-1070.
Bergeron, J.F., P. Grondin and J. Blouin. 1998. Rapport de classification écologique du sous-domaine bioclimatique de la pessière à mousses de l’ouest. Ministère des Ressources naturelles du Québec, Direction des inventaires forestiers. 178 pp.
Berry, G.J. and J.K. Jeglum. 1991a. Hydrology of drained and undrained black spruce peatlands: surface water and groundwater quality. For. Can., Ont. Region, Sault Ste. Marie, Ont. COFRDA Rep. 3316. 29 pp.
Berry, G.J. and J.K. Jeglum. 1991b. Hydrology of drained and undrained black spruce peatlands: groundwater table profiles and fluctuations. For. Can., Ont. Region, Sault Ste. Marie, Ont. COFRDA Rep. 3307. 31 pp.
Bolghari, H. 1986. Perspectives du drainage forestier au Québec. In: Colloque sur le drainage forestier, 10-11 sept. 1985, Ste-Foy, Québec. Edited by Ordre des Ingénieurs Forestiers du Québec. pp. 47-65.
Bolghari, H. and J.-M. Veilleux. 1987. Évaluation du drainage forestier comme technique de préparation du terrain pour régénérer par différentes méthodes (plantions, ensemencements naturels et artificiels) les pessières noires humides récemment exploitées. Projet R82315. Ministère de l’Énergie et des Ressources, Quebec. 8 pp.
29
Coulombe, G., J. Huot, J. Arsenault, E. Bauce, J.-T. Bernard, A. Bouchard, M.A. Liboiron and G. Szaraz. 2004. Commission d’étude sur la gestion de la forêt publique québécoise. Québec. 307 pp.
Dang, Q.L. and V.J. Lieffers. 1989. Assessment of patterns of response of tree ring growth of black spruce following peatland drainage. Can. J. For. Res. 19: 924-929.
Environment Canada. 2004. Canadian climate normals 1971-2000. Atmospheric Environment Service, Downsview, Ontario, Canada.
Heikurainen, L. 1964. Improvement of forest growth on poorly drained peat soils. Int. Rev. For. Res. 1. Academic Press, New York. pp. 39-113.
Heikurainen, L. 1968. Peatlands of Newfoundland and possibilities of utilizing them in forestry. Can. For. Serv., For. Res. Lab. Inf. Rep. N-X-16. 57 pp.
Hillman, G.R. 1987. Improving wetlands for forestry in Canada. Can. For. Serv. Inf. Rep. NOR-X-288. 29 pp.
Hillman, G.R. 1991a. Black spruce growth on drained, forested peatland in northern Alberta. Can. For. Serv. For. Manag. Note No. 53. 8 pp.
Hillman, G.R. 1991b. The Canada-Alberta wetlands drainage and improvement program for forestry: an update. In: Proceedings, Peat and Peatlands: Diversification and Innovation, 6-10 Aug. 1989, Québec City, Que. Edited by Jeglum, J.K. & Overend, R.P. Canadian Society for Peat and Peatlands, Darmouth, N.S. pp. 54-61.
Hillman, G.R. 1992. Some hydrological effects of peatland drainage in Alberta’s boreal forest. Can. J. For. Res. 22: 1588-1596.
Hillman, G.R. and S.K. Takyi. 1998. Response of black spruce to thinning and fertilization in a drained swamp. North. J. Appl. For. 15: 98-105.
Hökkä, H. and R. Ojansuu. 2004. Height development of Scots pine on peatlands: describing change in site productivity with a site index model. Can. J. For. Res. 34: 1081-1092.
Jeglum, J.K. 1991a. The Wally Creek Area Forest Drainage Project in Ontario Clay Belt: Progress Report. In: Proceedings, Peat and Peatlands: Diversification and Innovation, 6-10 Aug. 1989, Québec City, Que. Edited by Jeglum, J.K. & Overend, R.P. Canadian Society for Peat and Peatlands, Darmouth, N.S. pp. 47-53.
Jeglum, J.K. 1991b. Concluding comments and recommendations. In: Proceedings, Peat and Peatlands: Diversification and Innovation, 6-10 Aug. 1989, Québec City, Que. Edited by Jeglum, J.K. & Overend, R.P. Canadian Society for Peat and Peatlands, Darmouth, N.S. pp. 223-227.
30
Jeglum, J.K. 1991c. Definition of trophic classes in wooded peatlands by means of vegetation types and plant indicators. Ann. Bot. Fenn. 28: 175-192.
Jones, R.K., G. Pierpoint, G.M. Wickware, J.K. Jeglum, R.W. Arnup and J.M. Bowles. 1983. Field guide to forest ecosystem classification for the Clay Belt, site Region 3e. Ontario Ministry of Natural Ressources, Maple, Ontario. 123 pp.
Jutras, S. and A.P. Plamondon. 2005. Water table rise after harvesting in a treed fen previously drained for forestry. Suo 56: 95-100.
Jutras, S. J. Bégin and A.P. Plamondon. 2002. Impact du drainage forestier après coupe sur la croissance de l’épinette noire en forêt boréale. Can. J. For. Res. 32: 1585-1596.
Lieffers, V.J. 1988. Sphagnum and cellulose decomposition in drained and natural areas of an Alberta peatland. Can. J. Soil Sci. 755-761.
Lieffers, V.J. and S.E. Macdonald. 1990. Growth and foliar nutrient status of black spruce and tamarack in relation to depth of water table in some Alberta peatlands. Can. J. For. Res. 20: 805-809.
Lieffers, V.J. and R.L. Rothwell. 1986. Effects of depth of water table and substrate temperature on root and top growth of Picea mariana and Larix laricina seedlings. Can. J. For. Res. 16: 1201-1206.
Lieffers, V.J. and R.L. Rothwell. 1987. Effects of drainage on substrate temperature and phenology of some trees and shrubs in an Alberta peatland. Can. J. For. Res. 17: 97-104.
Macdonald, S.E. and F. Yin. 1999. Factors influencing size inequality in peatland black spruce and tamarack: evidence from post-drainage release growth. J. Ecol. 87: 404-412.
McLaren, B.E. and J.K. Jeglum. 1998. Black spruce growth and foliar nutrient responses to drainage and fertilisation: Wally Creek, Ontario. For. Chron. 74: 106-115.
Nadeau, J.-P. and B. Parent. 1982. L’économique du drainage forestier au Québec. Ministère de l’Énergie et des Ressources, Service de la Recherche, Québec. Mémoire no. 80. 177 p.
Paavilainen, E. and J. Päivänen. 1995. Peatland forestry: ecology and principles. Springer-Verlag, Berlin. 248 pp.
Päivänen, J. and E.D. Wells. 1978. Guidelines for the development of peatland drainage systems for forestry in Newfoundland. Can. For. Serv. Inf. Rep. N-X-156. 44 pp.
Payandeh, B. 1973a. Analyses of a forest drainage experiment in northern Ontario. I: Growth analysis. Can. J. For. Res. 3: 387-398.

31
Payandeh, B. 1973b. Analyses of a forest drainage experiment in northern Ontario. II: An economic analysis. Can. J. For. Res. 3: 399-408.
Payandeh, B. 1975. Growth and economic analyses of a forest drainage experiment in northern Ontario. In: Proc. of the Black Spruce Symp., Thunder Bay, Ontario, Canada, Sept. 23-25, 1975. Symp. Proc. O-P-4. Edited by Can. For. Serv. pp. 61-76.
Payandeh, B. 1978. A site index formula for peatland black spruce in Ontario. For. Chron. 54: 39-41.
Payandeh, B. 1982. Five-year growth response of northern Ontario peatland black spruce to fertilization and drainage. Can. For. Serv. Inf. Rep. 0-X-340. 20 pp.
Payandeh, B. 1989. Growth of black spruce trees following fertilization on drained peatland. For. Chron. 65: 102-106.
Payandeh, B. 1990. Preliminary yield functions and tables for peatland black spruce in Ontario. Can. For. Serv. Inf. Rep. 0-X-405. 10 pp.
Plonski, W.L. 1974. Normal yield tables (metric) for major forest species of Ontario. Ontario Ministry of Natural Resources, Toronto.
Pollett, F.C. 1969. A program for the development of peatland forestry in Newfoundland. Can. For. Serv., For. Res. Lab., Inf. Rep. N-X-29. 28 pp.
Prévost, M., P. Belleau and A.P. Plamondon. 1997. Substrate conditions in a treed peatland: Responses to drainage. Ecoscience 4: 543-554.
Prévost, M., A.P. Plamondon and P. Belleau. 1999. Effects of drainage of a forested peatland on water quality and quantity. J. Hydro. 214: 130-143.
Prévost, M., D. Dumais and A.P. Plamondon. 2005. Effects du drainage sur la croissance et le statut nutritif d’un peuplemnet d’épinette noire de structure inéquienne: résultats de 10 ans. For. Chron. 81: 516-524.
Rosen, M. 1989. Forest drainage manual. Ont. Min. Nat. Resour., Cochrane, Ont. Sci. and Tech. Ser. Vol 4. 32 pp.
Roy, V., A.P. Plamondon and P. Bernier. 2000. Draining forested wetland cutovers to improve seedling root zone conditions. Scand. J. For. Res. 15: 58-67.
SAS Institute Inc. 2003. SAS OnlineDoc®, Version 9.1. SAS Institute Inc., Cary, NC, USA.
Saucier, J.-P. 1994. Le point d’observation écologique : normes techniques. Direction de la gestion des stocks forestiers, Service des inventaires forestiers, Ministère des Ressources naturelles, Québec. 116 pp.
32
Stanek, W. 1968. A forest drainage experiment in northern Ontario. Pulp Pap. Mag. Can. 69 : 58-62.
Stanek, W. 1970. Amelioration of water-logged terrain in Quebec. I: Description of the area, hydrology and drainage. Can. For. Serv. Inf. Rep. Q-X-17. 18 pp.
Stanek, W. 1977. Ontario clay belt peatlands - are they suitable for forest drainage? Can. J. For. Res. 7: 656-665.
Sundström, E. 1992. Five-year growth response in drained and fertilised black spruce peatlands. I. Permanent growth plot analysis. NEST Tech. Rep. TR-02 / For. Can. Inf. Rep. 0-X-417. 19 pp.
Sundström, E. and J.K. Jeglum. 1992. Five-year growth response in drained and fertilised black spruce peatlands. II. Stem analysis. NEST Tech. Rep. TR-03 / For. Can. Inf. Rep. 0 X-420. 13 pp.
Wang, E.I.C., T. Mueller and M.M Micko. 1985. Drainage effect on growth and wood quality of some bog grown trees in Alberta. For. Chron. 61: 489-493.
Zarnovican, R. 1989. Suivi des travaux de drainage forestier : 1) Production forestière et caractéristiques écologiques des massifs de Saint-Anaclet et de Cabano. Forêts Canada, Région de Québec. Inf. Rep. LAU-X-90. 37 pp.
Zarnovican, R. and C. Laberge. 1994. Suivi des travaux de drainage forestier : 2) Effet du drainage sur la croissance de l’épinette noire et du mélèze laricin à Saint-Anaclet. Forêts Canada, Région de Québec. Inf. Rep. LAU-X-107. 26 pp..
CHAPTER 2
Water-table rise after harvesting in a treed fen previously drained for forestry
34
Jutras, S., and Plamondon, A.P. 2005. Water-table rise after harvesting in a treed fen
previously drained for forestry. Suo. 56(3): 95-100. Forest Biology Research Centre,
Université Laval, Sainte-Foy, QC, G1K 7P4, Canada. This chapter is the result of the
candidate’s labour. André Plamondon has been giving suggestions on the design and the
preparation of this chapter.
Abstract
Water-table measurements were obtained in a treed fen that was drained in 1987 and
harvested for timber in 1997. The water-table level was quantified at five different
distances from the ditch for three ditch spacings. Water-table levels were compared
between post-drainage and post-removal of the canopy. The phenomenon of watering-up
after clear-cutting did not occur where a drawdown of at least 10 cm was caused by the
drainage. This lowering was observed across the 20 m ditch spacing and within the first 6
m from the ditch, in the 40 and the 60 m spacings. The water-table fluctuations were also
reduced after harvesting.
Résumé
La profondeur de la nappe phréatique a été mesurée pendant plusieurs saisons de
croissances dans une tourbière forestière ayant été drainée en 1987 et récoltée en 1997. Le
niveau de la nappe phréatique a été quantifié à cinq différentes distances du fossé, pour
trois différents espacements et pour deux différentes périodes (post-drainage et post-
récolte). La remontée de la nappe après la récolte n’est pas survenue aux endroits où un
rabattement d’au moins 10 cm avait été préalablement causé par le drainage. Un tel
rabattement a été observé partout pour l’espacement de 20 m et uniquement à moins de 6 m
des fossés pour les espacements de 40 et 60 m. Les fluctuations annuelles de la nappe ont
aussi été réduites après la récolte.
35
Introduction
Water-table rise, also called watering-up, has been observed on undrained forested
peatlands in Canada after timber harvesting (Dubé et al. 1995, Roy et al. 1997, Roy et al.
2000b). Observations of watering-up have also been made after harvesting in forested
peatlands previously drained in Finland (Heikurainen & Päivänen 1970, Päivänen 1980).
Drainage on recently harvested sites is known to reduce watering-up (Prévost et al. 2001),
to avoid further paludification, to improve rooting zone conditions (Roy et al. 2000a), and
to improve seedling growth (Jutras et al. 2002). Vompersky & Sirin (1997) and Braekke
(1983) found that the water-table depth in a drained peatland was largely dependent on the
distance from the ditch and drainage intensity. However, these two factors have not been
studied when drainage occurred several years before harvesting.
The objective of this study was to quantify the effect of harvesting on the water table level
at five different distances from a ditch (3, 6, 10, 20 and 30 m) for three different ditch
spacings (20, 40 and 60 m width) in an old stagnant black spruce (Picea mariana (Mill.)
B.S.P.) stand drained 10 years before clearcutting.
Material and methods
The study was carried out on property owned by Stadacona Paper Inc, located 50 km
southwest of Quebec City, Quebec Canada, (46º27'N, 71º23'W). Based on data collected at
the St-Flavien meteorological station located 10 km from the study site (46º29'N, 71º34'W),
the thirty-year mean annual precipitation is 1125 mm (Environment Canada 2004). For this
same period, the mean annual temperature is 3.9ºC and the mean annual degree-days above
5ºC is 1674. Potential evapo-transpiration is 550 mm based on Thornthwaite's method
(Wilson 1971)
This project evaluated two sites, a treated one and a control. They were located 270 m apart
in a stand dominated by black spruce. Other tree species that were present included larch
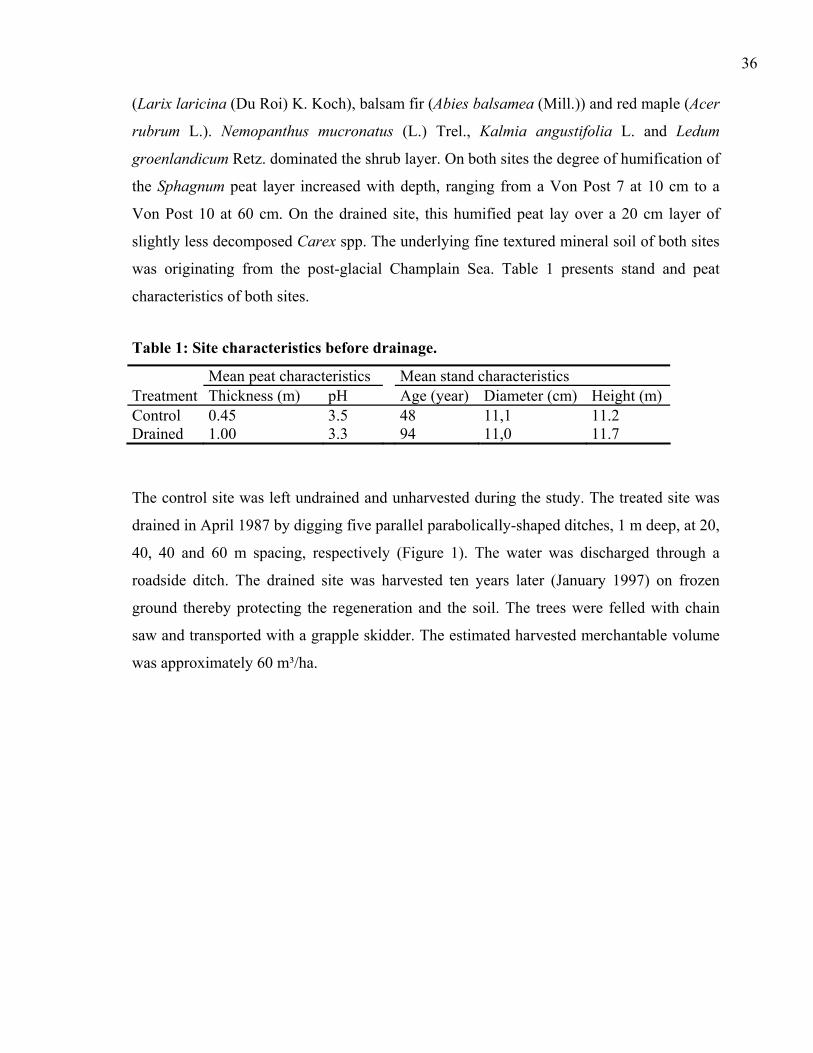
36
(Larix laricina (Du Roi) K. Koch), balsam fir (Abies balsamea (Mill.)) and red maple (Acer
rubrum L.). Nemopanthus mucronatus (L.) Trel., Kalmia angustifolia L. and Ledum
groenlandicum Retz. dominated the shrub layer. On both sites the degree of humification of
the Sphagnum peat layer increased with depth, ranging from a Von Post 7 at 10 cm to a
Von Post 10 at 60 cm. On the drained site, this humified peat lay over a 20 cm layer of
slightly less decomposed Carex spp. The underlying fine textured mineral soil of both sites
was originating from the post-glacial Champlain Sea. Table 1 presents stand and peat
characteristics of both sites.
Table 1: Site characteristics before drainage.
Mean peat characteristics Mean stand characteristics Treatment Thickness (m) pH Age (year) Diameter (cm) Height (m) Control 0.45 3.5 48 11,1 11.2 Drained 1.00 3.3 94 11,0 11.7
The control site was left undrained and unharvested during the study. The treated site was
drained in April 1987 by digging five parallel parabolically-shaped ditches, 1 m deep, at 20,
40, 40 and 60 m spacing, respectively (Figure 1). The water was discharged through a
roadside ditch. The drained site was harvested ten years later (January 1997) on frozen
ground thereby protecting the regeneration and the soil. The trees were felled with chain
saw and transported with a grapple skidder. The estimated harvested merchantable volume
was approximately 60 m³/ha.
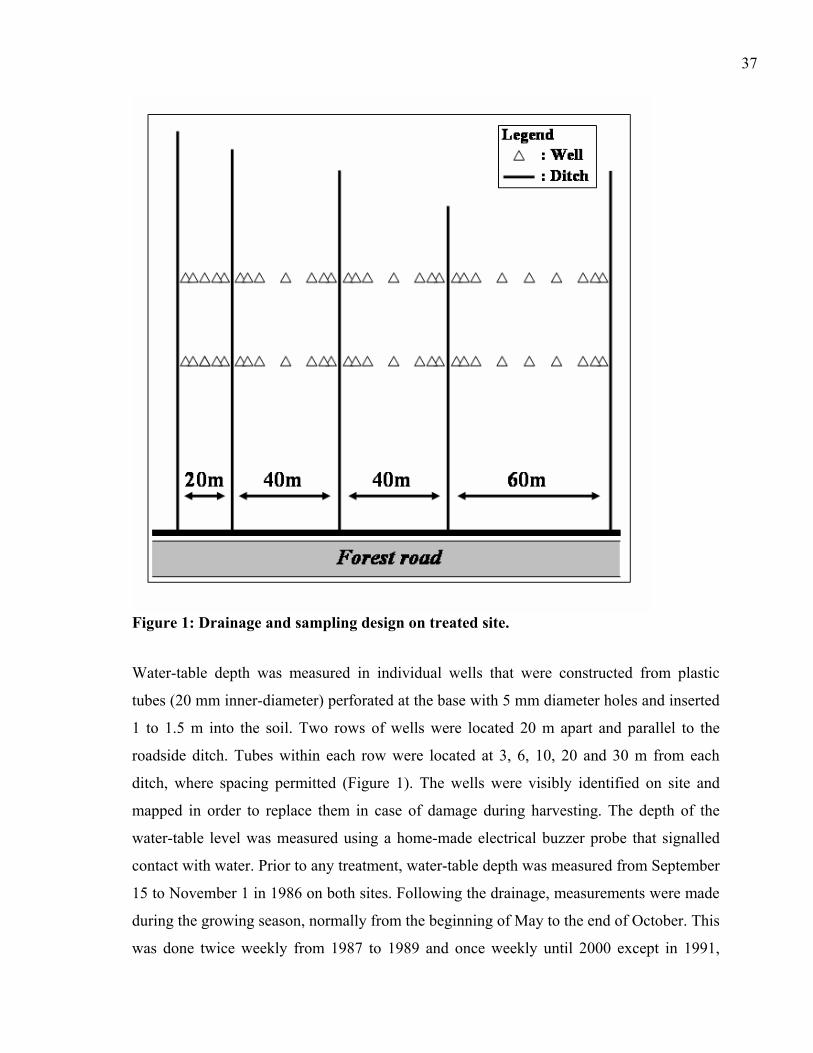
37
Figure 1: Drainage and sampling design on treated site.
Water-table depth was measured in individual wells that were constructed from plastic
tubes (20 mm inner-diameter) perforated at the base with 5 mm diameter holes and inserted
1 to 1.5 m into the soil. Two rows of wells were located 20 m apart and parallel to the
roadside ditch. Tubes within each row were located at 3, 6, 10, 20 and 30 m from each
ditch, where spacing permitted (Figure 1). The wells were visibly identified on site and
mapped in order to replace them in case of damage during harvesting. The depth of the
water-table level was measured using a home-made electrical buzzer probe that signalled
contact with water. Prior to any treatment, water-table depth was measured from September
15 to November 1 in 1986 on both sites. Following the drainage, measurements were made
during the growing season, normally from the beginning of May to the end of October. This
was done twice weekly from 1987 to 1989 and once weekly until 2000 except in 1991,
38
1992 and 1995 when no measurements were taken. In 1999 measurements were done bi-
weekly. The elevation of the well above the peat was measured every year so that the water
table depth was referenced to the peat surface.
Pre-drainage water-table depths were used by Belleau et al. (1992) to produce a calibration
curve for this same study area. It was used to take into account the differences in water-
table fluctuations and tree stand characteristics naturally occurring between the control and
the treated sites. However, the curve had to be adjusted for deeper water-table levels
because it was relatively high during the calibration of 1986. At the center of the 60 m
spacing, the water-table drawdown caused by drainage was negligible. Therefore, the 1987
to 1989 summer data from this location was used to establish a new calibration curve
(Figure 2). This curve was later used to predict the water-table depth for the treated site if
no treatment was applied (PWTno) using the water-table depth of the control site. The
possible bias caused by this calculation would give a slight underestimation of the drainage
effects. However, it had no effect on the comparison of water-table depths before and after
harvesting.
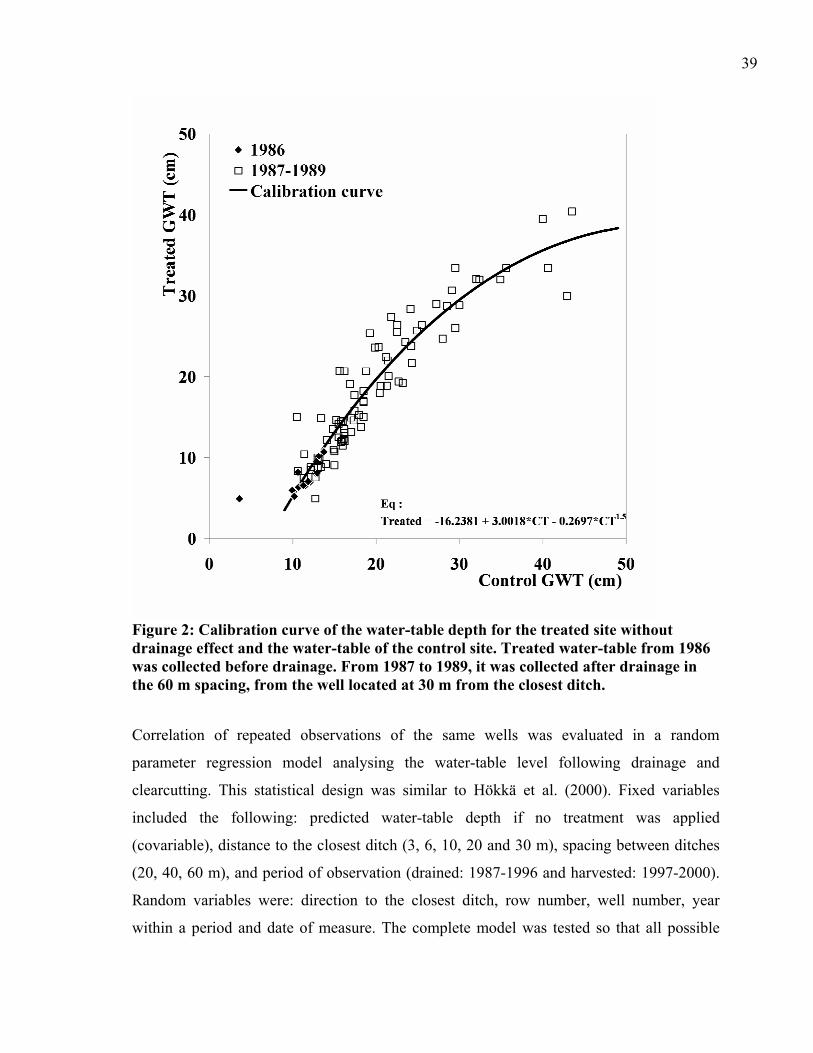
39
Figure 2: Calibration curve of the water-table depth for the treated site without drainage effect and the water-table of the control site. Treated water-table from 1986 was collected before drainage. From 1987 to 1989, it was collected after drainage in the 60 m spacing, from the well located at 30 m from the closest ditch.
Correlation of repeated observations of the same wells was evaluated in a random
parameter regression model analysing the water-table level following drainage and
clearcutting. This statistical design was similar to Hökkä et al. (2000). Fixed variables
included the following: predicted water-table depth if no treatment was applied
(covariable), distance to the closest ditch (3, 6, 10, 20 and 30 m), spacing between ditches
(20, 40, 60 m), and period of observation (drained: 1987-1996 and harvested: 1997-2000).
Random variables were: direction to the closest ditch, row number, well number, year
within a period and date of measure. The complete model was tested so that all possible
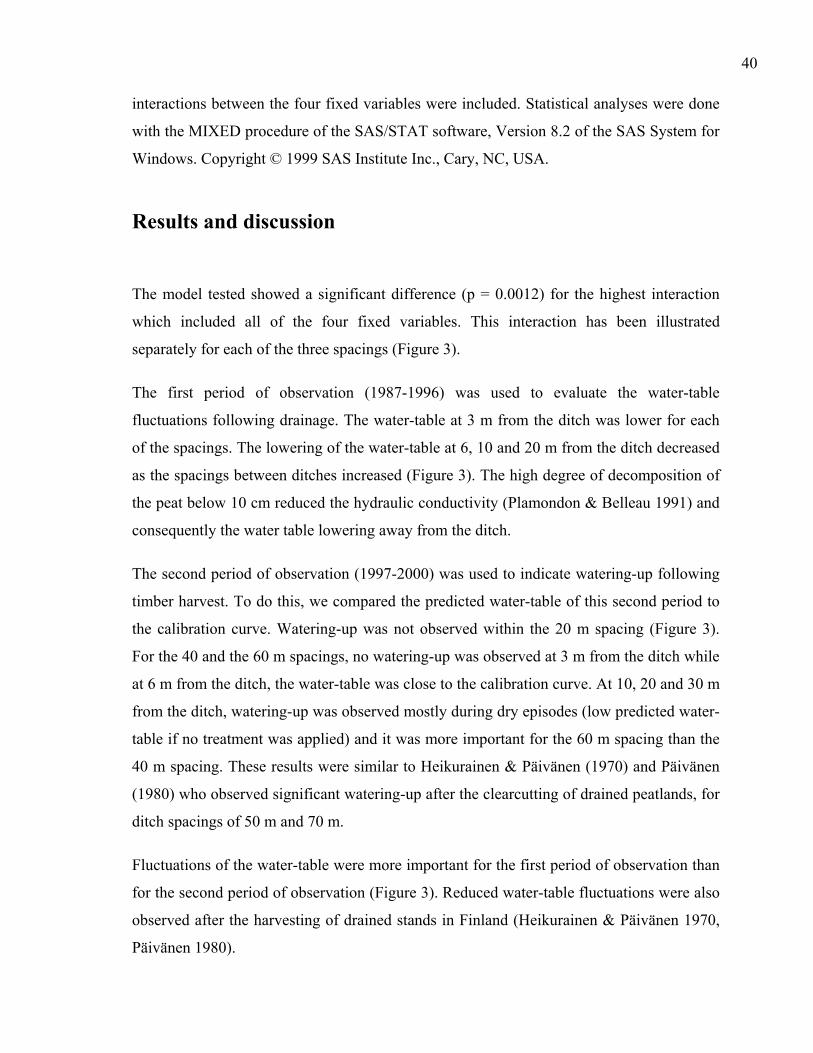
40
interactions between the four fixed variables were included. Statistical analyses were done
with the MIXED procedure of the SAS/STAT software, Version 8.2 of the SAS System for
Windows. Copyright © 1999 SAS Institute Inc., Cary, NC, USA.
Results and discussion
The model tested showed a significant difference (p = 0.0012) for the highest interaction
which included all of the four fixed variables. This interaction has been illustrated
separately for each of the three spacings (Figure 3).
The first period of observation (1987-1996) was used to evaluate the water-table
fluctuations following drainage. The water-table at 3 m from the ditch was lower for each
of the spacings. The lowering of the water-table at 6, 10 and 20 m from the ditch decreased
as the spacings between ditches increased (Figure 3). The high degree of decomposition of
the peat below 10 cm reduced the hydraulic conductivity (Plamondon & Belleau 1991) and
consequently the water table lowering away from the ditch.
The second period of observation (1997-2000) was used to indicate watering-up following
timber harvest. To do this, we compared the predicted water-table of this second period to
the calibration curve. Watering-up was not observed within the 20 m spacing (Figure 3).
For the 40 and the 60 m spacings, no watering-up was observed at 3 m from the ditch while
at 6 m from the ditch, the water-table was close to the calibration curve. At 10, 20 and 30 m
from the ditch, watering-up was observed mostly during dry episodes (low predicted water-
table if no treatment was applied) and it was more important for the 60 m spacing than the
40 m spacing. These results were similar to Heikurainen & Päivänen (1970) and Päivänen
(1980) who observed significant watering-up after the clearcutting of drained peatlands, for
ditch spacings of 50 m and 70 m.
Fluctuations of the water-table were more important for the first period of observation than
for the second period of observation (Figure 3). Reduced water-table fluctuations were also
observed after the harvesting of drained stands in Finland (Heikurainen & Päivänen 1970,
Päivänen 1980).

41
01020304050607080
010
2030
40
PWT (cm)
PW
Tno
(cm
)
20 m spacing
01020304050607080
010
2030
40
PW
Tno
(cm
)
PWT (cm)
01020304050607080
010
2030
40
PW
Tno
(cm
)
PWT (cm)
40 m spacing
60 m spacing
Dist
ance
to th
e clo
sest
ditc
h
3 m
20 m
6
m
30
m 1
0 m
Perio
d of
obs
erva
tion
Dra
ined
(198
7-19
96)
Har
vest
ed (1
997-
2000
)C
alib
ratio
n cu
rve
1:1
Fi
gure
3: P
redi
cted
wat
er-t
able
dep
th (P
WT
) fol
low
ing
drai
nage
and
tim
ber
harv
estin
g of
a fo
rest
ed p
eatla
nd si
te in
func
tion
of d
itch
spac
ing,
dis
tanc
e to
the
clos
est d
itch,
per
iod
of o
bser
vatio
n an
d pr
edic
ted
wat
er-t
able
dep
th if
no
trea
tmen
t was
ap
plie
d (P
WT
no).
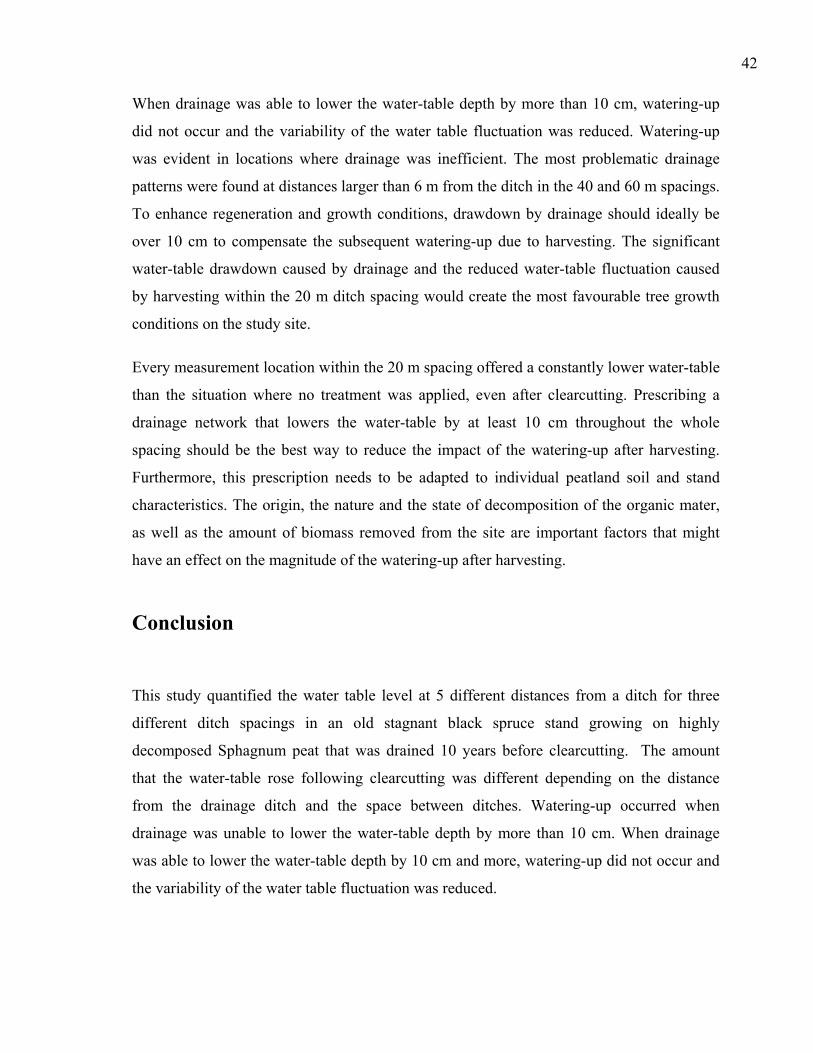
42
When drainage was able to lower the water-table depth by more than 10 cm, watering-up
did not occur and the variability of the water table fluctuation was reduced. Watering-up
was evident in locations where drainage was inefficient. The most problematic drainage
patterns were found at distances larger than 6 m from the ditch in the 40 and 60 m spacings.
To enhance regeneration and growth conditions, drawdown by drainage should ideally be
over 10 cm to compensate the subsequent watering-up due to harvesting. The significant
water-table drawdown caused by drainage and the reduced water-table fluctuation caused
by harvesting within the 20 m ditch spacing would create the most favourable tree growth
conditions on the study site.
Every measurement location within the 20 m spacing offered a constantly lower water-table
than the situation where no treatment was applied, even after clearcutting. Prescribing a
drainage network that lowers the water-table by at least 10 cm throughout the whole
spacing should be the best way to reduce the impact of the watering-up after harvesting.
Furthermore, this prescription needs to be adapted to individual peatland soil and stand
characteristics. The origin, the nature and the state of decomposition of the organic mater,
as well as the amount of biomass removed from the site are important factors that might
have an effect on the magnitude of the watering-up after harvesting.
Conclusion
This study quantified the water table level at 5 different distances from a ditch for three
different ditch spacings in an old stagnant black spruce stand growing on highly
decomposed Sphagnum peat that was drained 10 years before clearcutting. The amount
that the water-table rose following clearcutting was different depending on the distance
from the drainage ditch and the space between ditches. Watering-up occurred when
drainage was unable to lower the water-table depth by more than 10 cm. When drainage
was able to lower the water-table depth by 10 cm and more, watering-up did not occur and
the variability of the water table fluctuation was reduced.
43
Acknowledgments
We thank the hydrological research team who collected data throughout the years. The
authors are particularly grateful to Pierre Belleau, Frank Mussenburger, Martin Riopel,
Gilles Grégoire and Denis Lévesque for their implication in this project. This research was
supported by grants from the Natural Sciences and Engineering Research Council and the
Quebec Ministry of Natural Resources throught the 'Fonds Forestier' program. This
research was made possible because of a partnership with Papier Stadacona inc.
Constructive comments about the manuscript were given by Hannu Hökkä. Editorial
comments provided by Marie Coyea were greatly appreciated. A portion of this paper was
presented at the Ecohydrological Processes in Northern Wetland International Conference
& Educational Workshop held in Tallinn, Estonia from June 30 to July 4, 2003.
References
Belleau, P., Plamondon, A.P., Lagacé, R. & Pepin, S. 1992. Hydrodynamique d'une pessière noire drainée. Canadian Journal of Forest Research 22: 1063-1070.
Braekke, F.H. 1983. Water table levels at different drainage intensities on deep peat in northern Norway. Forest Ecology and Management 5: 169-192.
Dubé, S., Plamondon, A.P. & Rothwell, R.L. 1995. Watering-up after clear-cutting on forested wetlands of the St. Lawrence lowland. Water Resource Research 31: 1741-1750.
Environment Canada. 2004. Canadian climate normals, 1971-2000. Atmospheric Environment Service, Downsview, Ontario, Canada. Online, http://www.climate.weatheroffice.ec.gc.ca/climate_normals/index_e.html
Heikurainen, L. & Päivänen, J. 1970. The Effect of Thinning, Clear Cutting and Fertilization on the Hydrology of Peatland Drained for Forestry. Acta Forestalia Fennica 104: 23 p.
Hökkä, H., Penttilä, T. & Siipola, M. 2000. Spatial and temporal patterns in groundwater table level after thinning in a spruce mire. In: Rochefort, L. & Daigle, J.-Y. (eds.)
44 Proceedings of the 11th International Peat Congress. International Peat Society. Quebec. pp. 937-942.
Jutras, S., Bégin, J. & Plamondon, A.P. 2002. Impact du drainage forestier après coupe sur la croissance de l’épinette noire en forêt boréale. Canadian Journal of Forest Research 32 : 1585-1596.
Päivänen, J. 1980. The effect of silvicultural treatments on the ground water table in Norway spruce and Scots pine stands on peat. Proceedings of the 6th International Peat Congress, Duluth, Minn., USA.
Plamondon, A.P. & Belleau, P. 1991. Estimation of the hydraulic conductivity of peat from bulk density and von Post decomposition. Proceedings, Symposium ‘89. Peat and Peatlands, Diversification and Innovation, Vol. 1. Peatland Forestry. The Canadian Society For Peat and Peatlands. pp. 146-152.
Prévost, M., Plamondon, A.P. & Roy, V. 2001. La production forestière. In: Payette, S. & Rochefort, L. (eds.) Écologie des tourbières du Québec-Labrador. Les Presses de l'Université Laval. pp. 423-447.
Roy, V., Jeglum, J.K. & Plamondon, A.P. 1997. Water table fluctuations following clearcutting and thinning on Wally Creek wetlands. In: Trettin, C.C., Jurgensen, M.F., Grigal, D.F., Gale, M.R. & Jeglum, J.K. (eds.) Northern forested wetlands: ecology and management. Lewis Publishers, CRC Press. pp. 239-251.
Roy, V., Plamondon, A.P. & Bernier, P. 2000a. Draining forested wetland cutovers to improve seedling root zone conditions. Scandinavian Journal of Forest Research 15:58-67.
Roy, V., Plamondon, A.P. & Bernier, P. 2000b. Influence of vegetation removal and regrowth on interception and water table level on wetlands. International Peat Journal. 10:3-12.
Vompersky, S.E. & Sirin, A.A. 1997. Hydrology of drained forested wetlands. In: Trettin, C.C., Jurgensen, M.F., Grigal, D.F., Gale, M.R. & Jeglum, J.K. (eds.) Northern forested wetlands: ecology and management. Lewis Publishers, CRC Press. pp. 189-209.
Wilson, C.V. 1971. Le climat du Québec. Première partie, Atlas climatique. Service Météorologique du Canada, Environment Canada, Ottawa.

CHAPTER 3
Water table changes following precommercial thinning on post-harvest drained wetlands
46
Jutras, S.1, Plamondon, A.P.1, Hökkä, H.2, and Bégin, J.1 To be submitted to Silva Fennica.
Water table changes following precommercial thinning on post-harvest drained
wetlands. 1Faculty of Forestry and Geomatics, Université Laval, Ste-Foy, Québec, G1K
7P4, CANADA. 2Finnish Forest Research Institute, Rovaniemi Research Station, P.O. Box
16, FIN 96301 Rovaniemi, FINLAND. This chapter is the result of the candidate’s labour.
André Plamondon, Hannu Hökkä and Jean Bégin have been giving suggestions on the
design and the preparation of this chapter.
Abstract
Precommercial thinning is a silvicultural treatment commonly used to reduce the number of
stems in densely regenerated stands. When applied to organic or mineral wetland sites, this
treatment drastically eliminates a great portion of the canopy, which is responsible for
maintaining evapotranspiration processes. The water table is susceptible, therefore, to rise
in those sites where evapotranspiration is a significant regulator of the hydrological
balance. The objective of this study was to investigate and quantify water table rise after
precommercial thinning on post-harvest, drained forested wetlands, and to relate this rise to
factors influencing evapotranspiration processes. The water table rose after precommercial
thinning regardless of soil type, the distance to the drainage ditch, or the year of
observation. In the second year after thinning on mineral soils, canopy openings were
invaded by abundant and vigorous ground vegetation. Water table rise was significantly
lower at that time than for the preceding year, indicating rapid hydrological recovery on
mineral soil sites. The water table rise was related to the basal area removed, indicating the
importance of woody vegetation in regulating water table depth in forested wetlands.
Seasonal patterns in water table depth further illustrated the role of vegetation in the
hydrological balance of such sites. Light to moderate thinning practices, therefore, appeared
to be the most appropriate recommendation to avoid watering-up in young forested wetland
stands.
47
Résumé
L’éclaircie précommerciale est un traitement sylvicole fréquemment utilisé afin de réduire
le nombre de tiges des peuplements densément régénérés. Lorsque appliqué sur des sites
humides, ce traitement élimine de façon drastique une grande portion de la canopée qui est
responsable du maintient des processus d’évapotranspiration. La nappe phréatique est alors
sujette à une remontée sur ces sites où l’évapotranspiration est un important régulateur du
bilan hydrologique. L’objectif de cette étude était d’investiguer et de quantifier la remontée
de la nappe phréatique après l’éclaircie précommerciale sur des milieux humides forestiers
récoltés et drainés en fonction des facteurs influençant les processus d’évapotranspiration.
La nappe phréatique a remonté après l’éclaircie précommerciale peu importe le type de sol,
la distance du fossé et l’année d’observation. La deuxième année après l’éclaircie sur les
sols minéraux, les ouvertures du couvert ont été envahies par une végétation basse
abondante et vigoureuse. La remontée de la nappe phréatique était significativement plus
basse à ce moment que pour l’année précédente, indiquant un rétablissement hydrologique
rapide sur sol minéral. La nappe phréatique a présenté des remontées de plus en plus
grandes lorsque le prélèvement de la surface terrière augmentait, indiquant l’importance de
la végétation arborescente dans la régulation de la nappe phréatique des milieux humides
forestiers. La variation saisonnière de la nappe phréatique indiquait aussi l’importance de la
végétation dans le bilan hydrologique de tels sites. L’utilisation de pratiques d’éclaircies
plus délicates apparaît donc comme la recommandation la plus appropriée afin de prévenir
la remontée de la nappe phréatique sur les milieux humides forestiers.
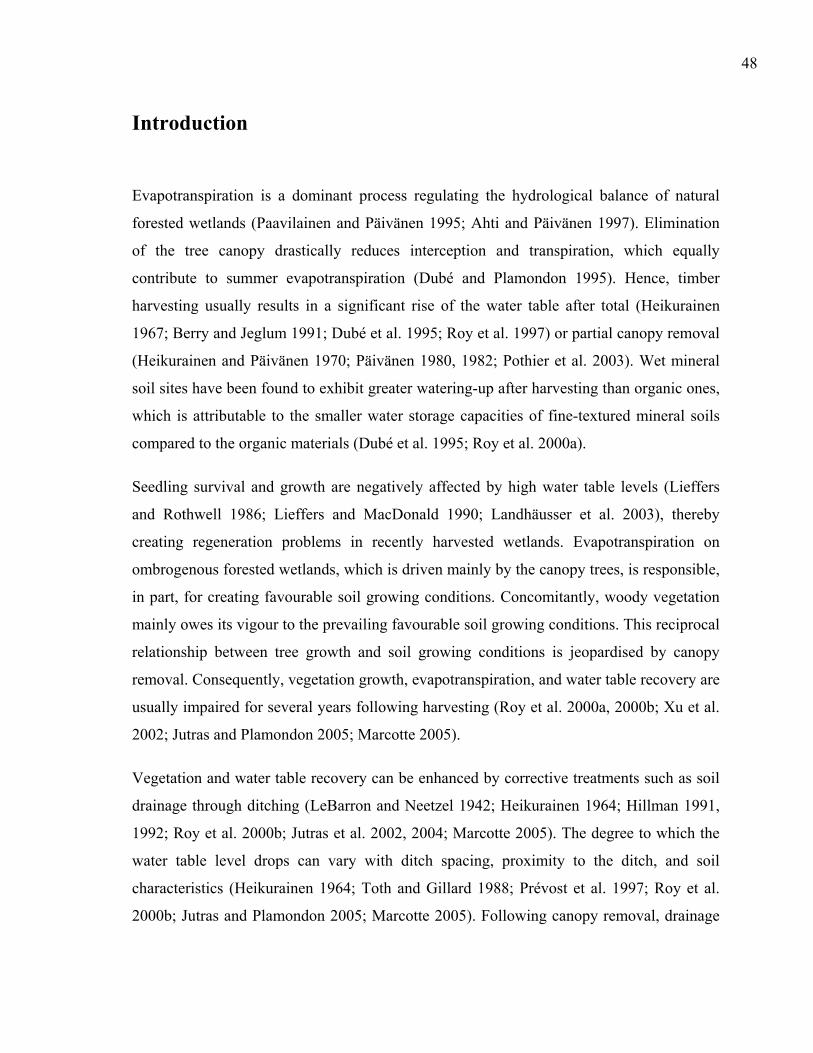
48
Introduction
Evapotranspiration is a dominant process regulating the hydrological balance of natural
forested wetlands (Paavilainen and Päivänen 1995; Ahti and Päivänen 1997). Elimination
of the tree canopy drastically reduces interception and transpiration, which equally
contribute to summer evapotranspiration (Dubé and Plamondon 1995). Hence, timber
harvesting usually results in a significant rise of the water table after total (Heikurainen
1967; Berry and Jeglum 1991; Dubé et al. 1995; Roy et al. 1997) or partial canopy removal
(Heikurainen and Päivänen 1970; Päivänen 1980, 1982; Pothier et al. 2003). Wet mineral
soil sites have been found to exhibit greater watering-up after harvesting than organic ones,
which is attributable to the smaller water storage capacities of fine-textured mineral soils
compared to the organic materials (Dubé et al. 1995; Roy et al. 2000a).
Seedling survival and growth are negatively affected by high water table levels (Lieffers
and Rothwell 1986; Lieffers and MacDonald 1990; Landhäusser et al. 2003), thereby
creating regeneration problems in recently harvested wetlands. Evapotranspiration on
ombrogenous forested wetlands, which is driven mainly by the canopy trees, is responsible,
in part, for creating favourable soil growing conditions. Concomitantly, woody vegetation
mainly owes its vigour to the prevailing favourable soil growing conditions. This reciprocal
relationship between tree growth and soil growing conditions is jeopardised by canopy
removal. Consequently, vegetation growth, evapotranspiration, and water table recovery are
usually impaired for several years following harvesting (Roy et al. 2000a, 2000b; Xu et al.
2002; Jutras and Plamondon 2005; Marcotte 2005).
Vegetation and water table recovery can be enhanced by corrective treatments such as soil
drainage through ditching (LeBarron and Neetzel 1942; Heikurainen 1964; Hillman 1991,
1992; Roy et al. 2000b; Jutras et al. 2002, 2004; Marcotte 2005). The degree to which the
water table level drops can vary with ditch spacing, proximity to the ditch, and soil
characteristics (Heikurainen 1964; Toth and Gillard 1988; Prévost et al. 1997; Roy et al.
2000b; Jutras and Plamondon 2005; Marcotte 2005). Following canopy removal, drainage
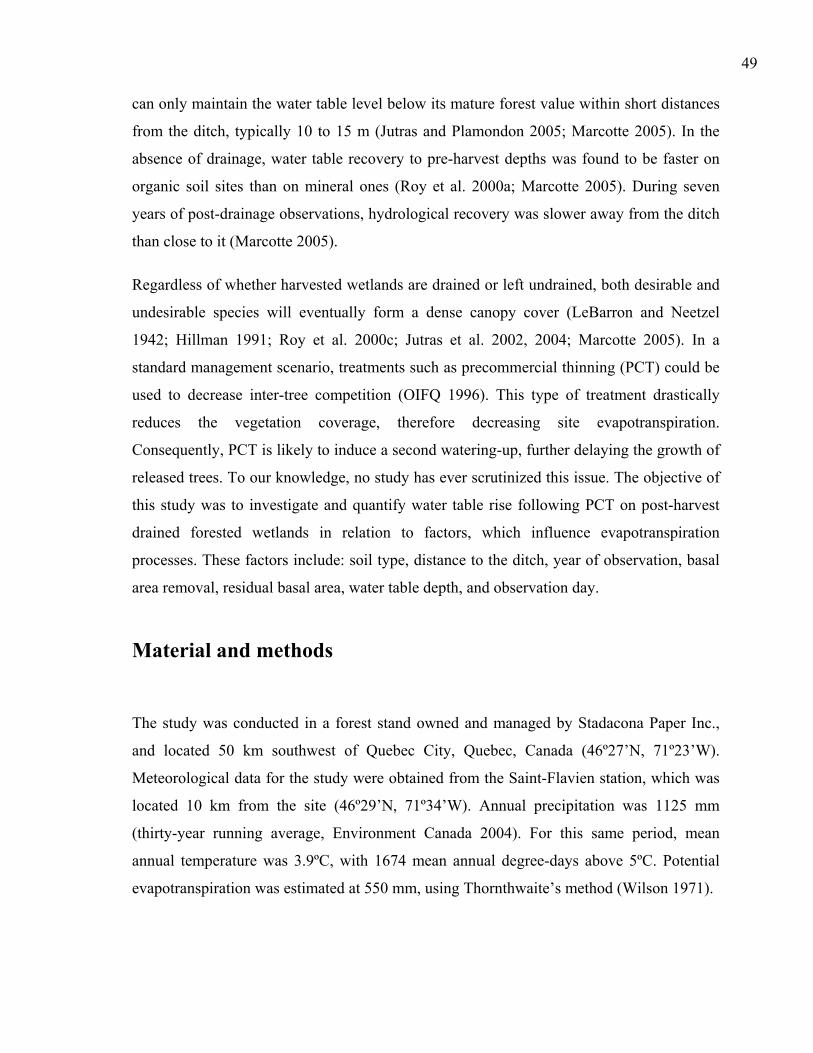
49
can only maintain the water table level below its mature forest value within short distances
from the ditch, typically 10 to 15 m (Jutras and Plamondon 2005; Marcotte 2005). In the
absence of drainage, water table recovery to pre-harvest depths was found to be faster on
organic soil sites than on mineral ones (Roy et al. 2000a; Marcotte 2005). During seven
years of post-drainage observations, hydrological recovery was slower away from the ditch
than close to it (Marcotte 2005).
Regardless of whether harvested wetlands are drained or left undrained, both desirable and
undesirable species will eventually form a dense canopy cover (LeBarron and Neetzel
1942; Hillman 1991; Roy et al. 2000c; Jutras et al. 2002, 2004; Marcotte 2005). In a
standard management scenario, treatments such as precommercial thinning (PCT) could be
used to decrease inter-tree competition (OIFQ 1996). This type of treatment drastically
reduces the vegetation coverage, therefore decreasing site evapotranspiration.
Consequently, PCT is likely to induce a second watering-up, further delaying the growth of
released trees. To our knowledge, no study has ever scrutinized this issue. The objective of
this study was to investigate and quantify water table rise following PCT on post-harvest
drained forested wetlands in relation to factors, which influence evapotranspiration
processes. These factors include: soil type, distance to the ditch, year of observation, basal
area removal, residual basal area, water table depth, and observation day.
Material and methods
The study was conducted in a forest stand owned and managed by Stadacona Paper Inc.,
and located 50 km southwest of Quebec City, Quebec, Canada (46º27’N, 71º23’W).
Meteorological data for the study were obtained from the Saint-Flavien station, which was
located 10 km from the site (46º29’N, 71º34’W). Annual precipitation was 1125 mm
(thirty-year running average, Environment Canada 2004). For this same period, mean
annual temperature was 3.9ºC, with 1674 mean annual degree-days above 5ºC. Potential
evapotranspiration was estimated at 550 mm, using Thornthwaite’s method (Wilson 1971).
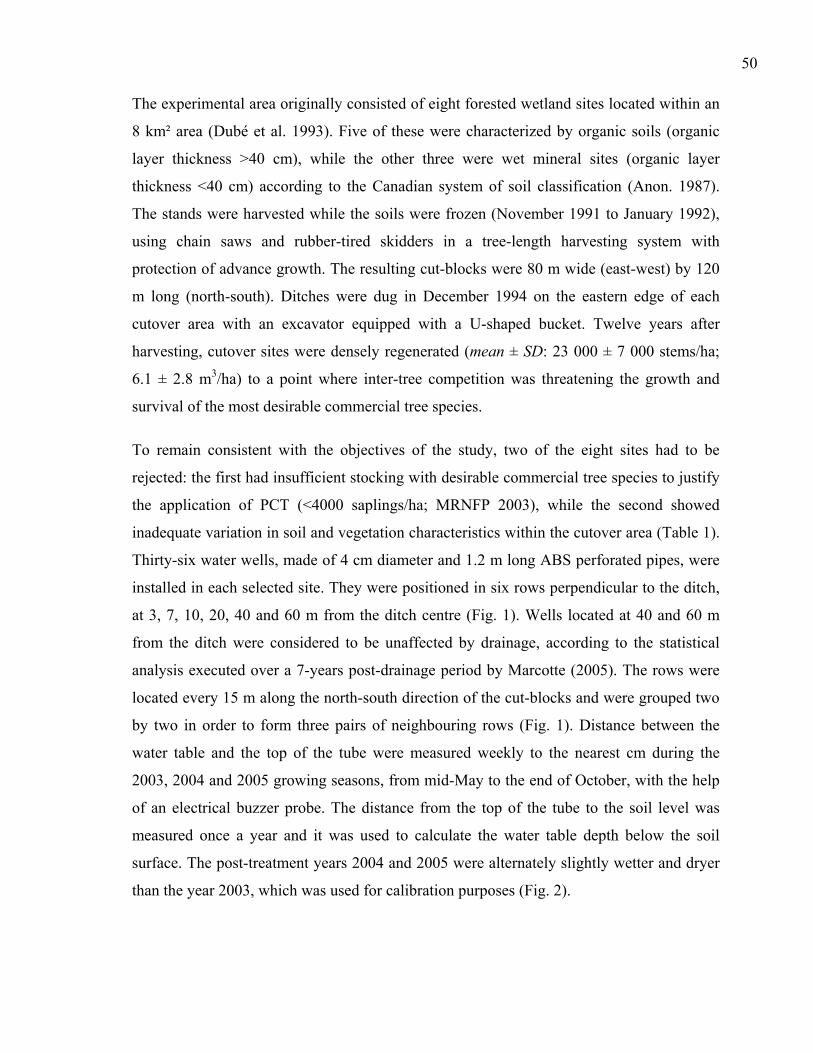
50
The experimental area originally consisted of eight forested wetland sites located within an
8 km² area (Dubé et al. 1993). Five of these were characterized by organic soils (organic
layer thickness >40 cm), while the other three were wet mineral sites (organic layer
thickness <40 cm) according to the Canadian system of soil classification (Anon. 1987).
The stands were harvested while the soils were frozen (November 1991 to January 1992),
using chain saws and rubber-tired skidders in a tree-length harvesting system with
protection of advance growth. The resulting cut-blocks were 80 m wide (east-west) by 120
m long (north-south). Ditches were dug in December 1994 on the eastern edge of each
cutover area with an excavator equipped with a U-shaped bucket. Twelve years after
harvesting, cutover sites were densely regenerated (mean ± SD: 23 000 ± 7 000 stems/ha;
6.1 ± 2.8 m3/ha) to a point where inter-tree competition was threatening the growth and
survival of the most desirable commercial tree species.
To remain consistent with the objectives of the study, two of the eight sites had to be
rejected: the first had insufficient stocking with desirable commercial tree species to justify
the application of PCT (<4000 saplings/ha; MRNFP 2003), while the second showed
inadequate variation in soil and vegetation characteristics within the cutover area (Table 1).
Thirty-six water wells, made of 4 cm diameter and 1.2 m long ABS perforated pipes, were
installed in each selected site. They were positioned in six rows perpendicular to the ditch,
at 3, 7, 10, 20, 40 and 60 m from the ditch centre (Fig. 1). Wells located at 40 and 60 m
from the ditch were considered to be unaffected by drainage, according to the statistical
analysis executed over a 7-years post-drainage period by Marcotte (2005). The rows were
located every 15 m along the north-south direction of the cut-blocks and were grouped two
by two in order to form three pairs of neighbouring rows (Fig. 1). Distance between the
water table and the top of the tube were measured weekly to the nearest cm during the
2003, 2004 and 2005 growing seasons, from mid-May to the end of October, with the help
of an electrical buzzer probe. The distance from the top of the tube to the soil level was
measured once a year and it was used to calculate the water table depth below the soil
surface. The post-treatment years 2004 and 2005 were alternately slightly wetter and dryer
than the year 2003, which was used for calibration purposes (Fig. 2).
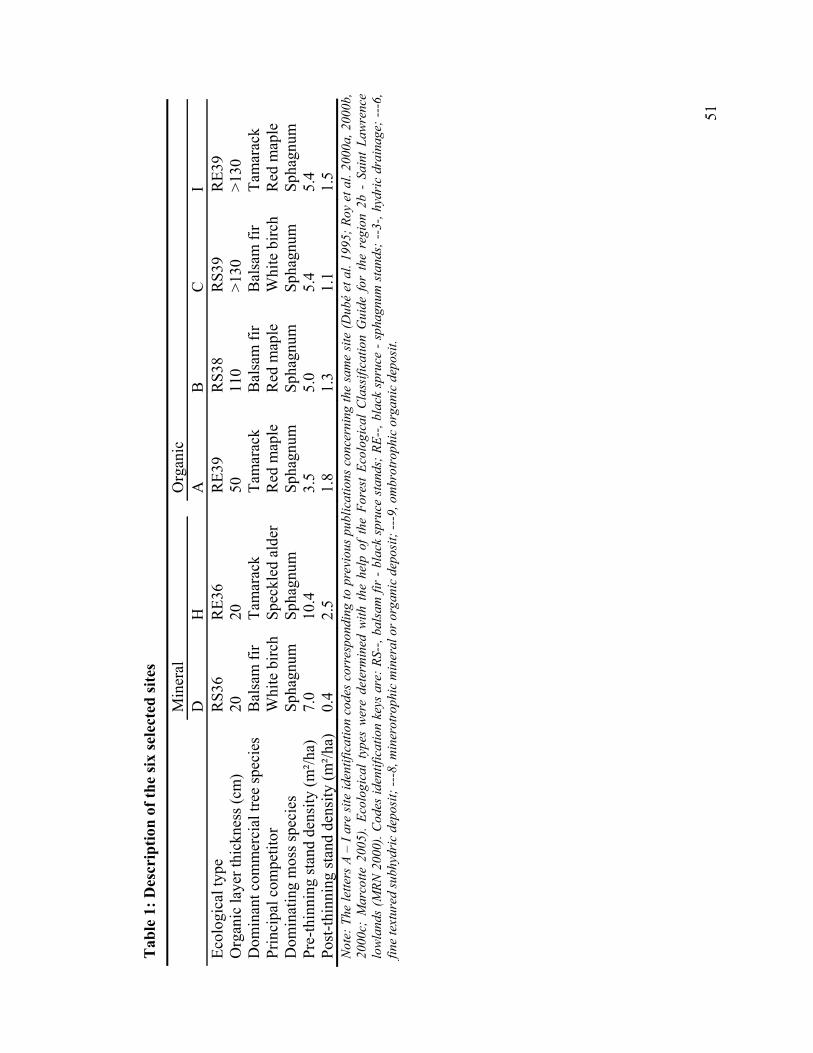
51
Tab
le 1
: Des
crip
tion
of th
e si
x se
lect
ed si
tes
M
iner
al
Org
anic
D
H
A
B
C
I Ec
olog
ical
type
R
S36
RE3
6
RE3
9 R
S38
RS3
9 R
E39
Org
anic
laye
r thi
ckne
ss (c
m)
20
20
50
11
0 >1
30
>130
D
omin
ant c
omm
erci
al tr
ee sp
ecie
s B
alsa
m fi
r Ta
mar
ack
Ta
mar
ack
Bal
sam
fir
Bal
sam
fir
Tam
arac
k Pr
inci
pal c
ompe
titor
W
hite
birc
h Sp
eckl
ed a
lder
Red
map
le
Red
map
le
Whi
te b
irch
Red
map
le
Dom
inat
ing
mos
s spe
cies
Sp
hagn
um
Spha
gnum
Spha
gnum
Sp
hagn
um
Spha
gnum
Sp
hagn
um
Pre-
thin
ning
stan
d de
nsity
(m²/h
a)
7.0
10.4
3.5
5.0
5.4
5.4
Post
-thin
ning
stan
d de
nsity
(m²/h
a)
0.4
2.5
1.
8 1.
3 1.
1 1.
5 N
ote:
The
lette
rs A
– I
are
site
iden
tific
atio
n co
des
corr
espo
ndin
g to
pre
viou
s pu
blic
atio
ns c
once
rnin
g th
e sa
me
site
(Dub
é et
al.
1995
; Roy
et a
l. 20
00a,
200
0b,
2000
c; M
arco
tte 2
005)
. Ec
olog
ical
typ
es w
ere
dete
rmin
ed w
ith t
he h
elp
of t
he F
ores
t Ec
olog
ical
Cla
ssifi
catio
n G
uide
for
the
reg
ion
2b -
Sai
nt L
awre
nce
low
land
s (M
RN 2
000)
. Cod
es id
entif
icat
ion
keys
are
: RS-
-, ba
lsam
fir
- bla
ck s
pruc
e st
ands
; RE-
-, bl
ack
spru
ce -
spha
gnum
sta
nds;
--3-
, hyd
ric
drai
nage
; ---
6,
fine
text
ured
subh
ydri
c de
posi
t; --
-8, m
iner
otro
phic
min
eral
or o
rgan
ic d
epos
it; --
-9, o
mbr
otro
phic
org
anic
dep
osit.
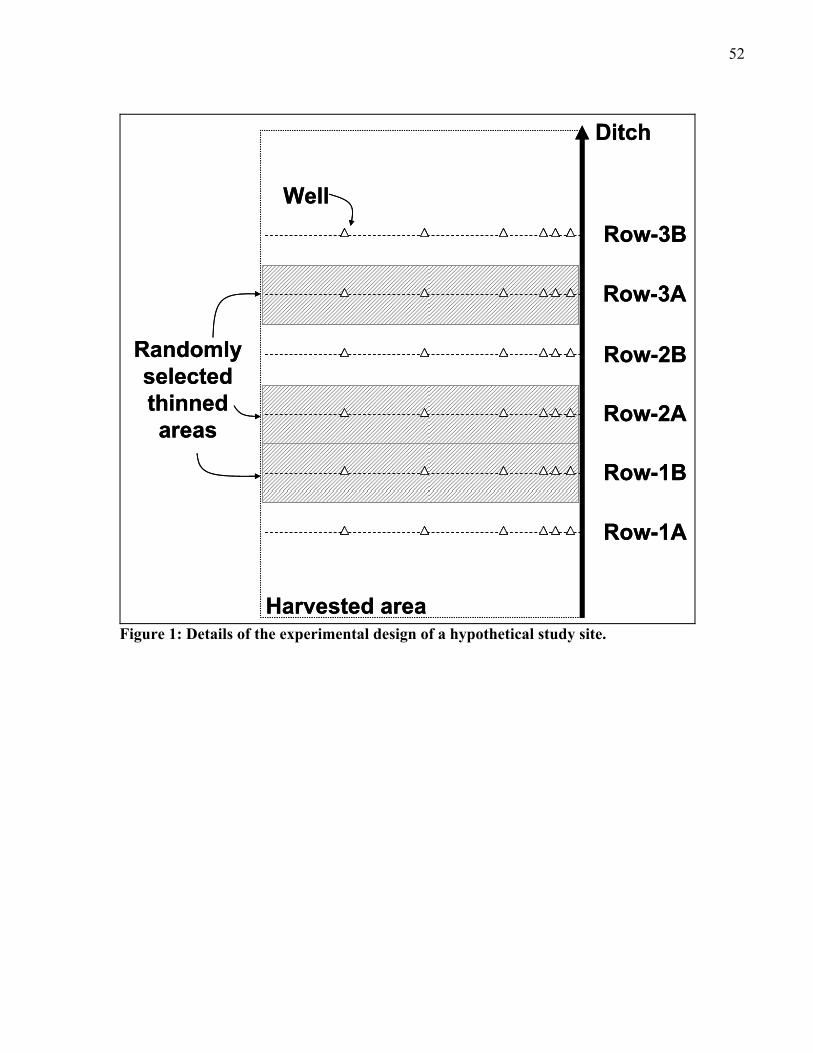
52
Row-1A
Row-1B
Row-2A
Row-2B
Row-3A
Row-3B
Ditch
Harvested area
Well
Randomlyselectedthinnedareas
Row-1A
Row-1B
Row-2A
Row-2B
Row-3A
Row-3B
Ditch
Harvested area
Well
Randomlyselectedthinnedareas
Figure 1: Details of the experimental design of a hypothetical study site.
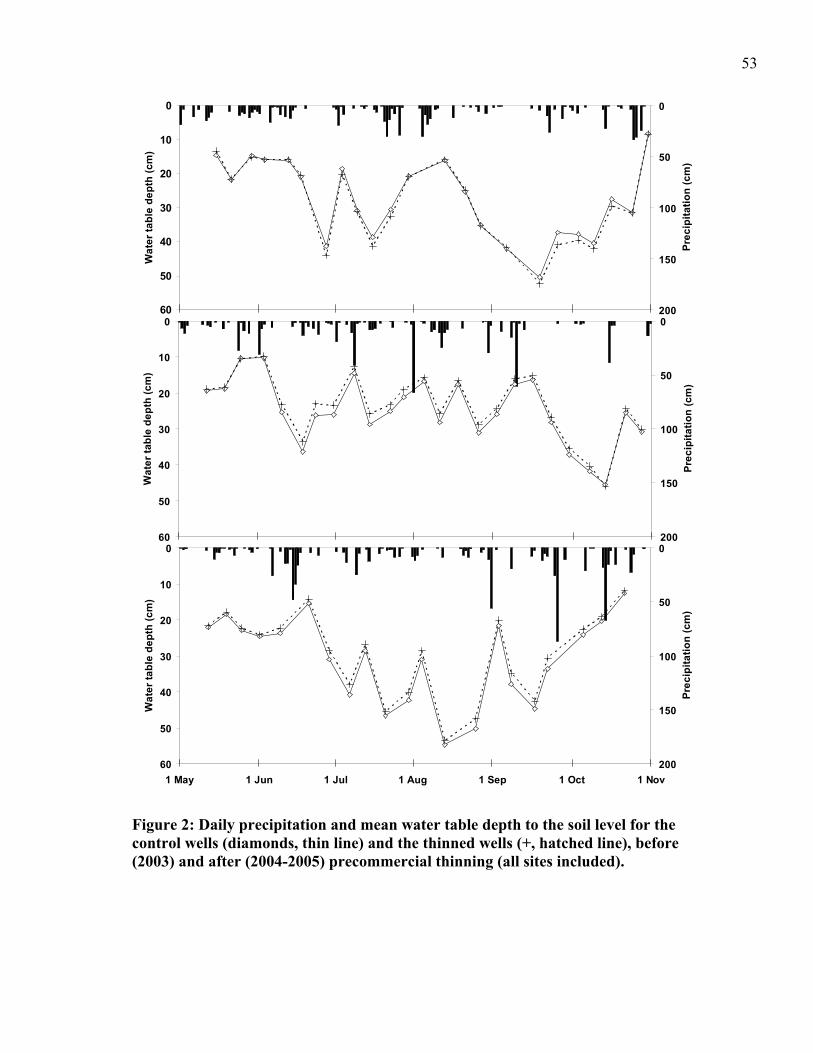
53
0
10
20
30
40
50
60
Wat
er ta
ble
dept
h (c
m)
0
50
100
150
200
Prec
ipita
tion
(cm
)
0
10
20
30
40
50
60
Wat
er ta
ble
dept
h (c
m)
0
50
100
150
200
Prec
ipita
tion
(cm
)
0
10
20
30
40
50
60
Wat
er ta
ble
dept
h (c
m)
0
50
100
150
200
Prec
ipita
tion
(cm
)
1 May 1 Jun 1 Jul 1 Aug 1 Sep 1 Oct 1 Nov
Figure 2: Daily precipitation and mean water table depth to the soil level for the control wells (diamonds, thin line) and the thinned wells (+, hatched line), before (2003) and after (2004-2005) precommercial thinning (all sites included).
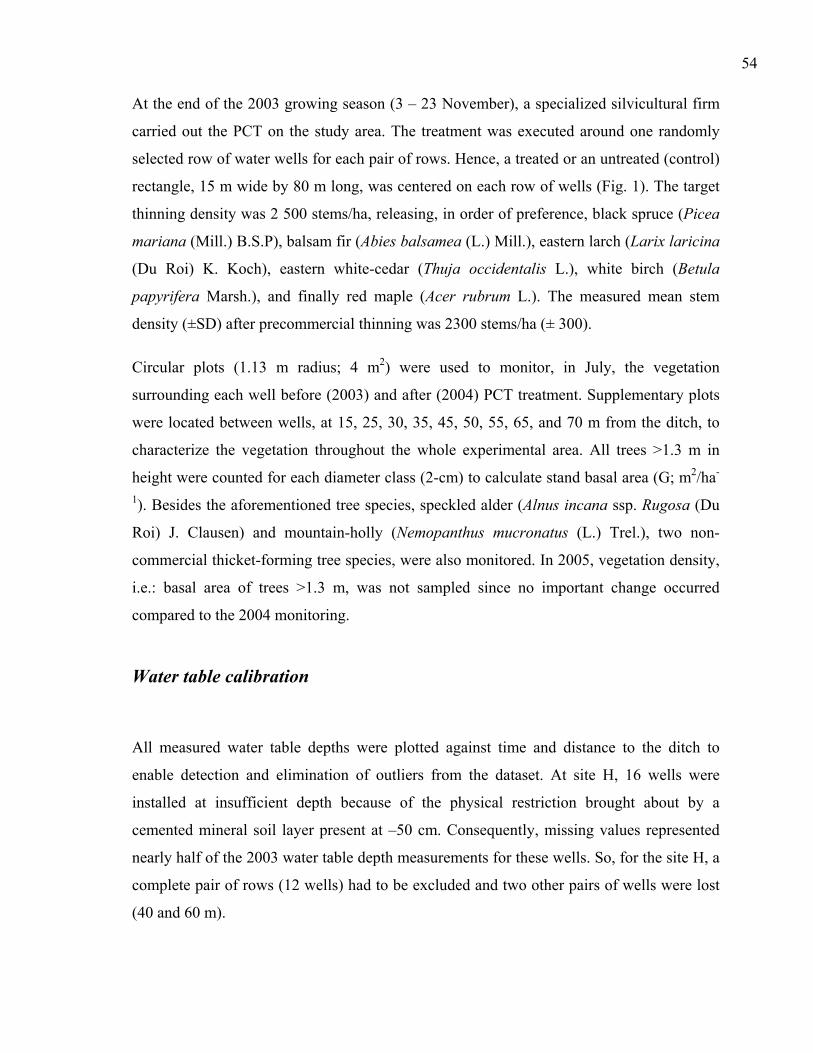
54
At the end of the 2003 growing season (3 – 23 November), a specialized silvicultural firm
carried out the PCT on the study area. The treatment was executed around one randomly
selected row of water wells for each pair of rows. Hence, a treated or an untreated (control)
rectangle, 15 m wide by 80 m long, was centered on each row of wells (Fig. 1). The target
thinning density was 2 500 stems/ha, releasing, in order of preference, black spruce (Picea
mariana (Mill.) B.S.P), balsam fir (Abies balsamea (L.) Mill.), eastern larch (Larix laricina
(Du Roi) K. Koch), eastern white-cedar (Thuja occidentalis L.), white birch (Betula
papyrifera Marsh.), and finally red maple (Acer rubrum L.). The measured mean stem
density (±SD) after precommercial thinning was 2300 stems/ha (± 300).
Circular plots (1.13 m radius; 4 m2) were used to monitor, in July, the vegetation
surrounding each well before (2003) and after (2004) PCT treatment. Supplementary plots
were located between wells, at 15, 25, 30, 35, 45, 50, 55, 65, and 70 m from the ditch, to
characterize the vegetation throughout the whole experimental area. All trees >1.3 m in
height were counted for each diameter class (2-cm) to calculate stand basal area (G; m2/ha-
1). Besides the aforementioned tree species, speckled alder (Alnus incana ssp. Rugosa (Du
Roi) J. Clausen) and mountain-holly (Nemopanthus mucronatus (L.) Trel.), two non-
commercial thicket-forming tree species, were also monitored. In 2005, vegetation density,
i.e.: basal area of trees >1.3 m, was not sampled since no important change occurred
compared to the 2004 monitoring.
Water table calibration
All measured water table depths were plotted against time and distance to the ditch to
enable detection and elimination of outliers from the dataset. At site H, 16 wells were
installed at insufficient depth because of the physical restriction brought about by a
cemented mineral soil layer present at –50 cm. Consequently, missing values represented
nearly half of the 2003 water table depth measurements for these wells. So, for the site H, a
complete pair of rows (12 wells) had to be excluded and two other pairs of wells were lost
(40 and 60 m).
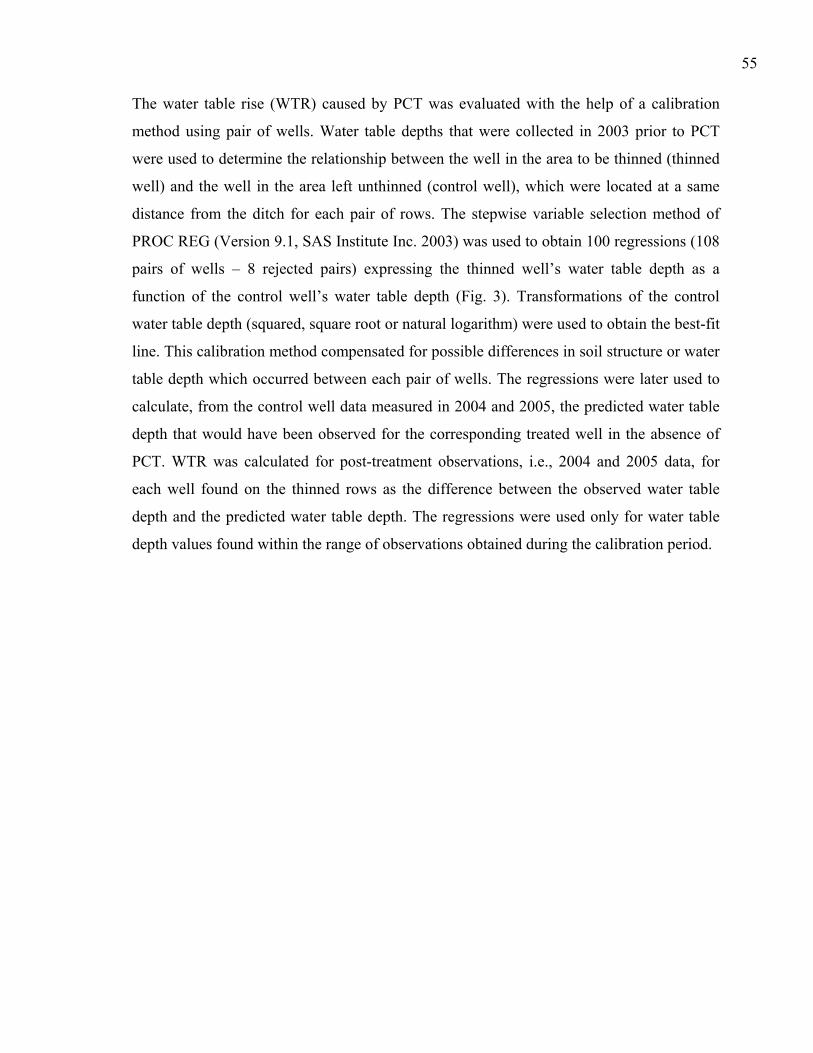
55
The water table rise (WTR) caused by PCT was evaluated with the help of a calibration
method using pair of wells. Water table depths that were collected in 2003 prior to PCT
were used to determine the relationship between the well in the area to be thinned (thinned
well) and the well in the area left unthinned (control well), which were located at a same
distance from the ditch for each pair of rows. The stepwise variable selection method of
PROC REG (Version 9.1, SAS Institute Inc. 2003) was used to obtain 100 regressions (108
pairs of wells – 8 rejected pairs) expressing the thinned well’s water table depth as a
function of the control well’s water table depth (Fig. 3). Transformations of the control
water table depth (squared, square root or natural logarithm) were used to obtain the best-fit
line. This calibration method compensated for possible differences in soil structure or water
table depth which occurred between each pair of wells. The regressions were later used to
calculate, from the control well data measured in 2004 and 2005, the predicted water table
depth that would have been observed for the corresponding treated well in the absence of
PCT. WTR was calculated for post-treatment observations, i.e., 2004 and 2005 data, for
each well found on the thinned rows as the difference between the observed water table
depth and the predicted water table depth. The regressions were used only for water table
depth values found within the range of observations obtained during the calibration period.
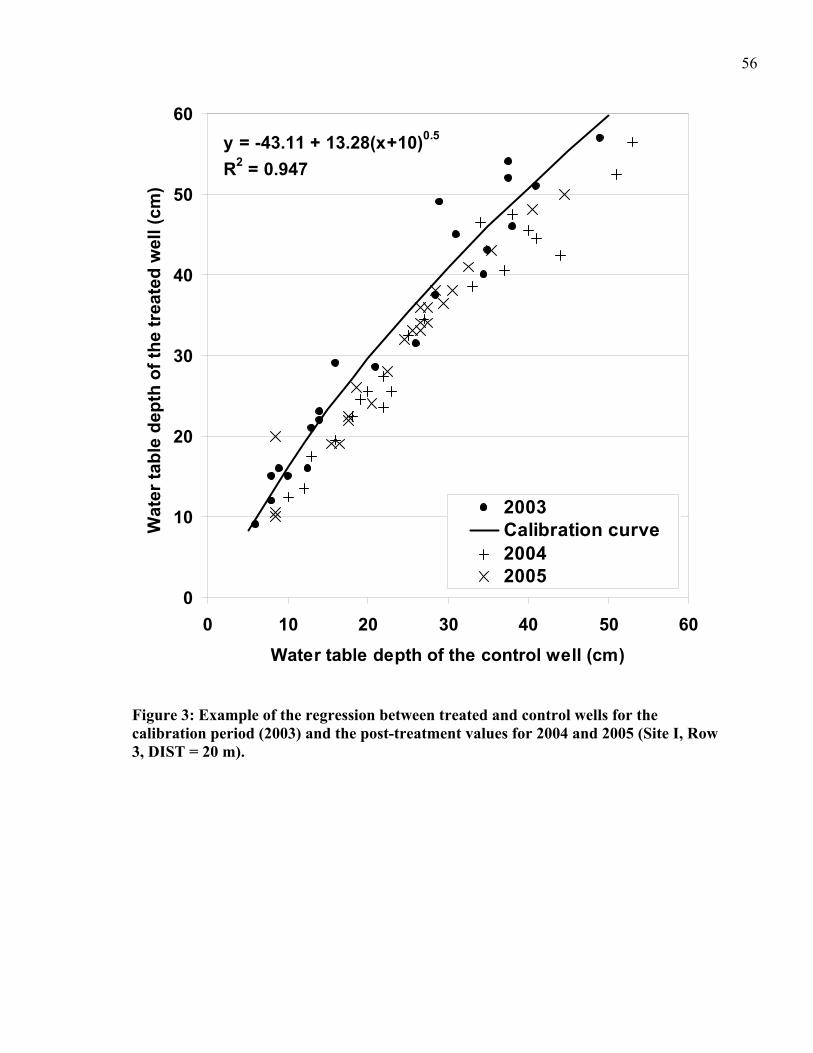
56
0
10
20
30
40
50
60
0 10 20 30 40 50 60Water table depth of the control well (cm)
Wat
er ta
ble
dept
h of
the
trea
ted
wel
l (cm
)
2003Calibration curve20042005
y = -43.11 + 13.28(x+10)0.5
R2 = 0.947
Figure 3: Example of the regression between treated and control wells for the calibration period (2003) and the post-treatment values for 2004 and 2005 (Site I, Row 3, DIST = 20 m).
57
Statistical analysis
An analysis of covariance (ANCOVA), which incorporated a split-split-plot arrangement of
factors, was used to assess variation in WTR as a function of: soil type (TYPE: organic vs.
mineral) as the main plot, distance to the ditch (DIST: 3, 7, 10, 20, 40, 60 m) as the
subplots, and year of measurement (YEAR; 2004 vs. 2005), as the sub-subplots. Additional
covariates were used to account for the basal area removal (ΔG, m²/ha), the residual basal
area (G, m²/ha), the predicted water table depth (WT, cm) and the observation day (DAY,
Julian day). Covariates were introduced in the model as continuous variables and different
transformations were tested (squared, square root, natural logarithm). Covariates offering
the best fit with the dependent variable and showing no trends in the residual plots were
selected. Three random variables were used to serve as error terms for the fixed effects of
the split split-plot design of the experiment: SITE(TYPE), DIST × SITE(TYPE), and DIST
× YEAR × SITE(TYPE). An additional random variable was introduced in the model to
account for variation between the three rows of wells in each site (ROW(SITE(TYPE))). A
contrast was used to compare the WTR for the drained area (DIST = 3, 7, 10, and 20 m)
with the undrained area (DIST = 40 and 60 m). The analysis was executed in PROC
MIXED of SAS.
Depending on each individual well’s pre-treatment stand density and PCT intensity, a broad
range of basal area removal (ΔG, m²ּha-1) was encountered after application of the
treatment. ΔG was calculated for each thinned well as the difference between the basal area
that would have been found in absence of PCT in 2004 (G2004P) and the residual basal area
measured in 2004 after PCT (G, m²ּha-1). All vegetation plots located in the control rows
(no-thinning) were used to produce an equation (Eq. 1) that estimated the basal area in
absence of PCT in 2004 (G2004P) from the basal area measured in 2003 (G2003). This
equation was later used to estimate the G2004P for each thinned well.
58
[1] 1)1ln(9145.02875.0 20032004P −+⋅+= GeG
where G2004P is the basal area in absence of PCT in 2004 and G2003 is the measured basal
area in 2003.
Basal area measurements are strongly correlated to the abundance of above-ground tree
biomass, which is directly influencing evapotranspiration processes. Therefore, ΔG and G
were considered as adequate estimators of the evapotranspiration changes caused by PCT,
evaluating the evapotranspiration depletion and its actual level, respectively.
Water table depth is a simple and objective indicator of the broad precipitation regime
prevailing in an area and also is correlated to the potential evapotranspiration in wetlands
(Verry 1997). Therefore, soil water availability (lack or excess) was described by the
covariate WT, which was used to explain WTR fluctuations following PCT. The DAY
covariate was mainly used to describe the expected influence of tree phenology on
evapotranspiration. Both the presence of leaves and the seasonal tree growth activity were
accounted for by this covariate.
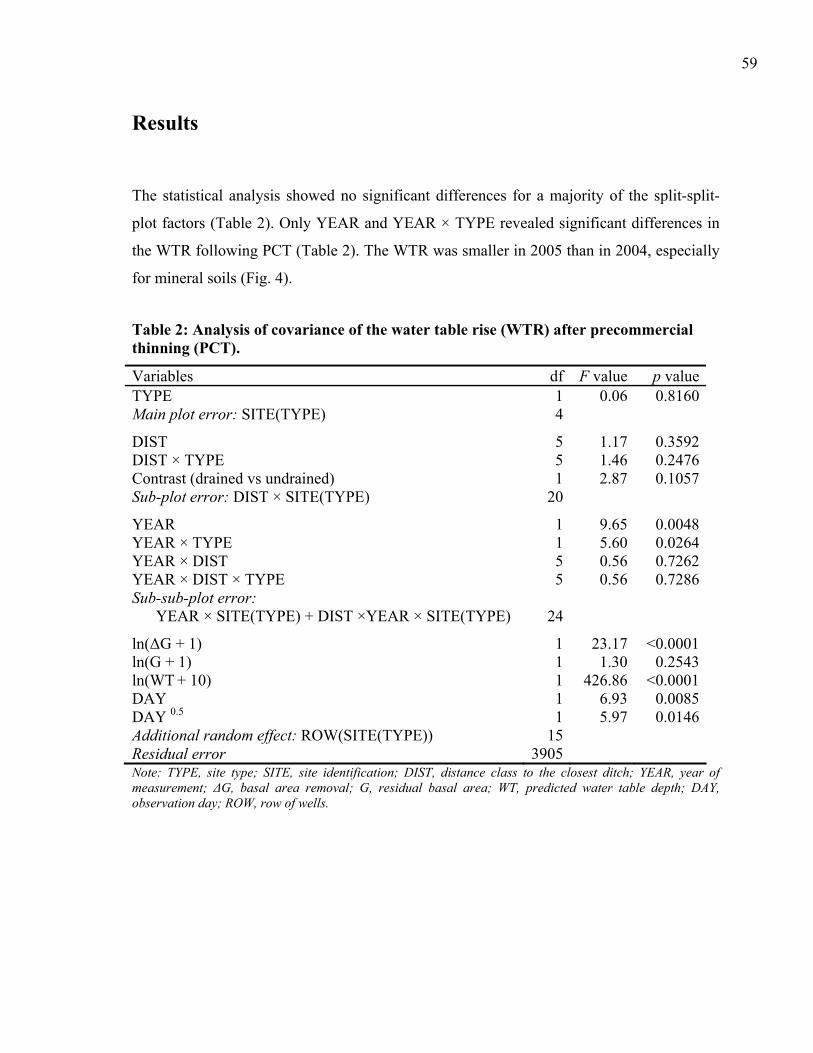
59
Results
The statistical analysis showed no significant differences for a majority of the split-split-
plot factors (Table 2). Only YEAR and YEAR × TYPE revealed significant differences in
the WTR following PCT (Table 2). The WTR was smaller in 2005 than in 2004, especially
for mineral soils (Fig. 4).
Table 2: Analysis of covariance of the water table rise (WTR) after precommercial thinning (PCT).
Variables df F value p valueTYPE 1 0.06 0.8160Main plot error: SITE(TYPE) 4
DIST 5 1.17 0.3592DIST × TYPE 5 1.46 0.2476Contrast (drained vs undrained) 1 2.87 0.1057Sub-plot error: DIST × SITE(TYPE) 20
YEAR 1 9.65 0.0048YEAR × TYPE 1 5.60 0.0264YEAR × DIST 5 0.56 0.7262YEAR × DIST × TYPE 5 0.56 0.7286Sub-sub-plot error: YEAR × SITE(TYPE) + DIST ×YEAR × SITE(TYPE) 24
ln(ΔG + 1) 1 23.17 <0.0001ln(G + 1) 1 1.30 0.2543ln(WT + 10) 1 426.86 <0.0001DAY 1 6.93 0.0085DAY 0.5 1 5.97 0.0146Additional random effect: ROW(SITE(TYPE)) 15 Residual error 3905 Note: TYPE, site type; SITE, site identification; DIST, distance class to the closest ditch; YEAR, year of measurement; ΔG, basal area removal; G, residual basal area; WT, predicted water table depth; DAY, observation day; ROW, row of wells.
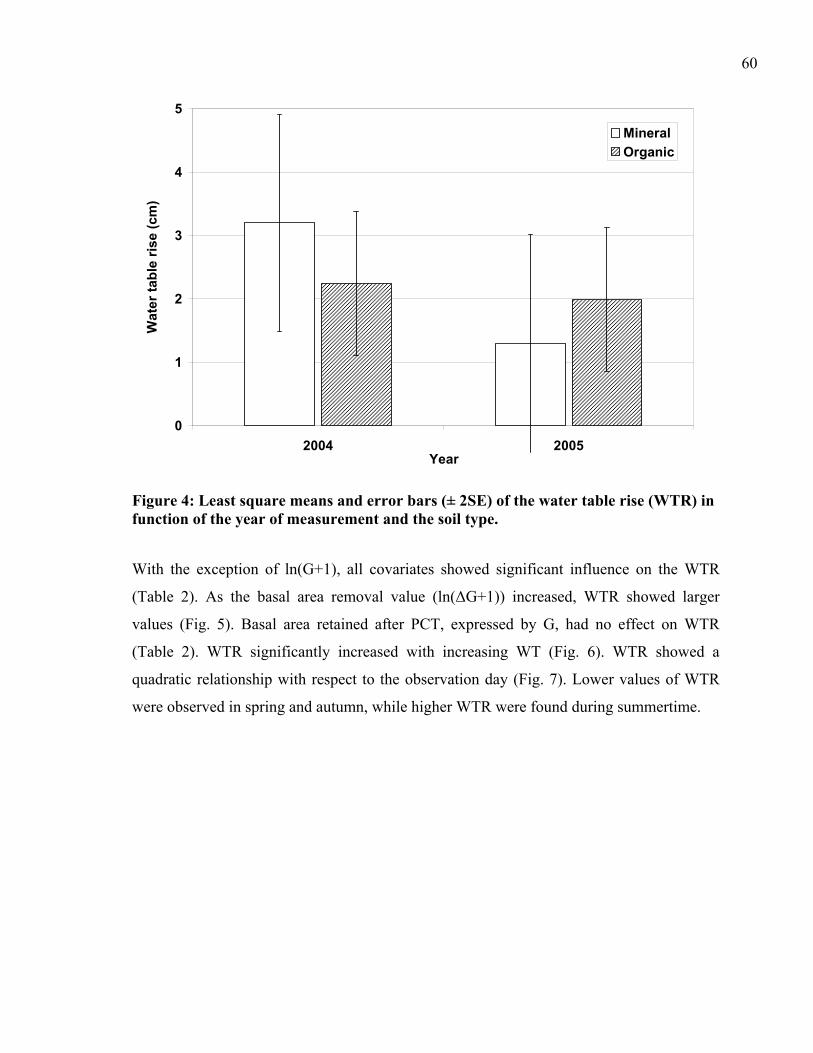
60
0
1
2
3
4
5
2004 2005Year
Wat
er ta
ble
rise
(cm
)MineralOrganic
Figure 4: Least square means and error bars (± 2SE) of the water table rise (WTR) in function of the year of measurement and the soil type.
With the exception of ln(G+1), all covariates showed significant influence on the WTR
(Table 2). As the basal area removal value (ln(ΔG+1)) increased, WTR showed larger
values (Fig. 5). Basal area retained after PCT, expressed by G, had no effect on WTR
(Table 2). WTR significantly increased with increasing WT (Fig. 6). WTR showed a
quadratic relationship with respect to the observation day (Fig. 7). Lower values of WTR
were observed in spring and autumn, while higher WTR were found during summertime.
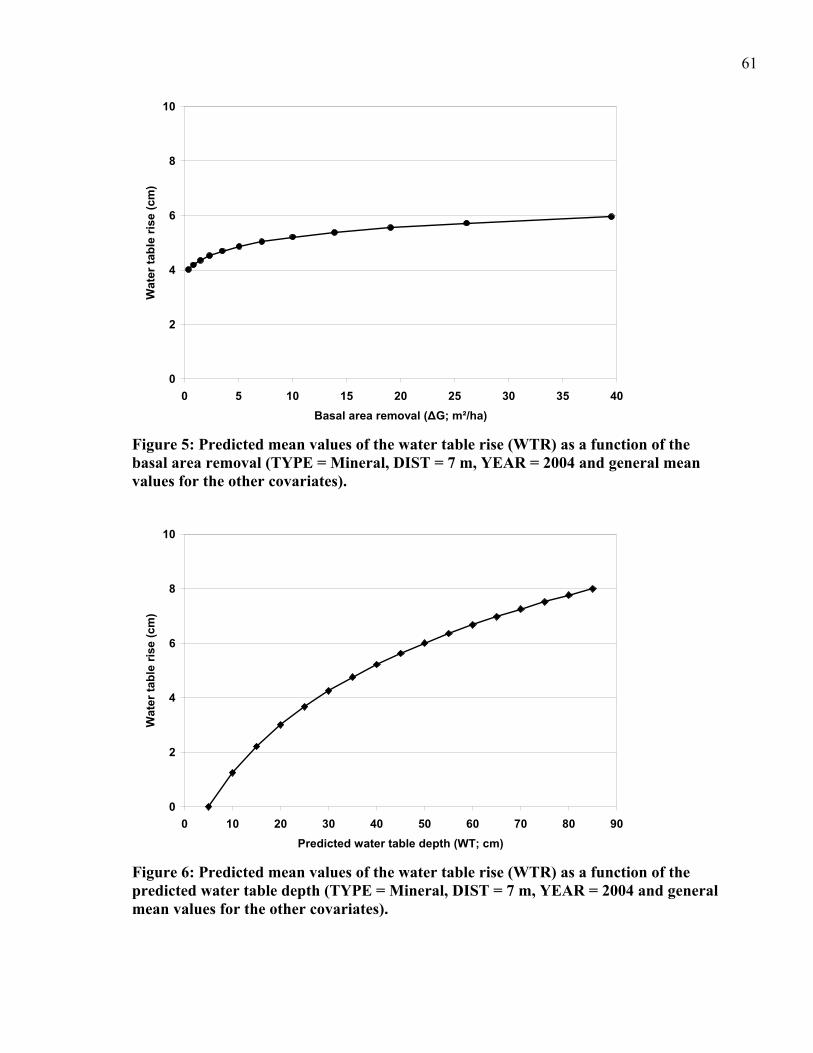
61
0
2
4
6
8
10
0 5 10 15 20 25 30 35 40Basal area removal (ΔG; m²/ha)
Wat
er ta
ble
rise
(cm
)
Figure 5: Predicted mean values of the water table rise (WTR) as a function of the basal area removal (TYPE = Mineral, DIST = 7 m, YEAR = 2004 and general mean values for the other covariates).
0
2
4
6
8
10
0 10 20 30 40 50 60 70 80 90Predicted water table depth (WT; cm)
Wat
er ta
ble
rise
(cm
)
Figure 6: Predicted mean values of the water table rise (WTR) as a function of the predicted water table depth (TYPE = Mineral, DIST = 7 m, YEAR = 2004 and general mean values for the other covariates).
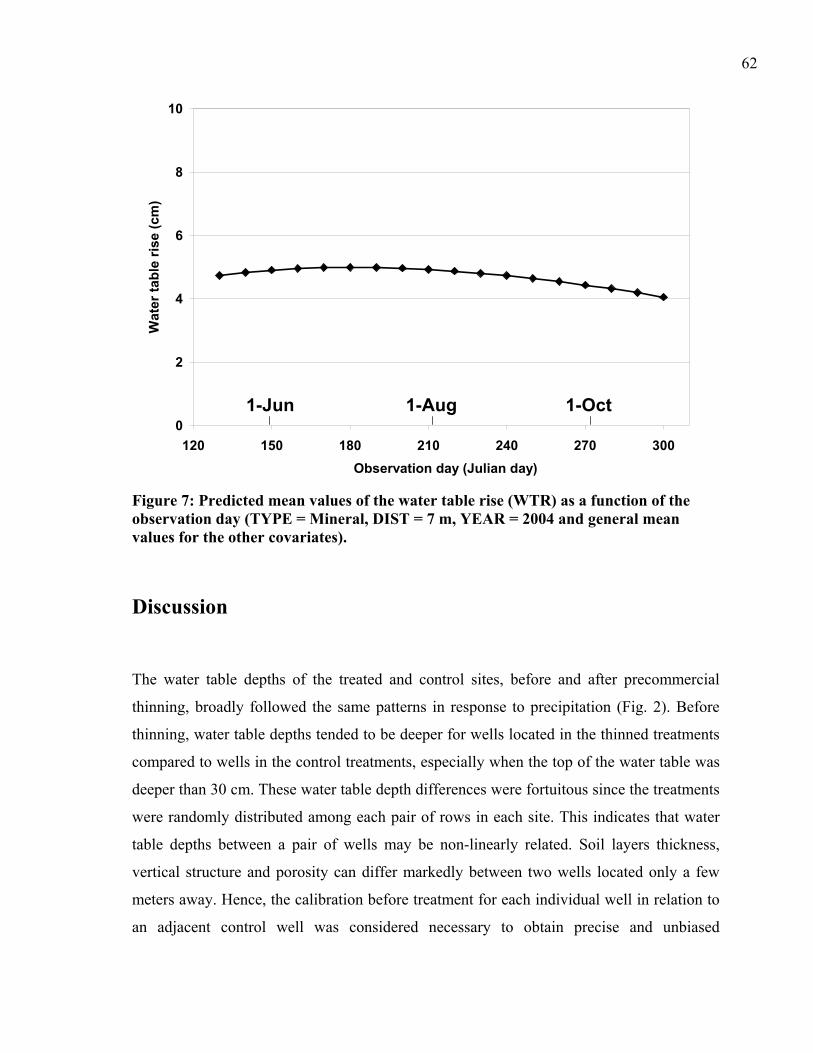
62
0
2
4
6
8
10
120 150 180 210 240 270 300Observation day (Julian day)
Wat
er ta
ble
rise
(cm
)
1-Jun 1-Aug 1-Oct
Figure 7: Predicted mean values of the water table rise (WTR) as a function of the observation day (TYPE = Mineral, DIST = 7 m, YEAR = 2004 and general mean values for the other covariates).
Discussion
The water table depths of the treated and control sites, before and after precommercial
thinning, broadly followed the same patterns in response to precipitation (Fig. 2). Before
thinning, water table depths tended to be deeper for wells located in the thinned treatments
compared to wells in the control treatments, especially when the top of the water table was
deeper than 30 cm. These water table depth differences were fortuitous since the treatments
were randomly distributed among each pair of rows in each site. This indicates that water
table depths between a pair of wells may be non-linearly related. Soil layers thickness,
vertical structure and porosity can differ markedly between two wells located only a few
meters away. Hence, the calibration before treatment for each individual well in relation to
an adjacent control well was considered necessary to obtain precise and unbiased
63
evaluation of the water table rise due to PCT. Calibration methods based on graphical
analysis of water table depth between treated and control plots have been frequently used to
assess the water table changes following a treatment (Heikurainen 1967; Heikurainen and
Päivänen 1970; Päivänen 1980; Belleau et al. 1992; Dubé et al. 1995; Marcotte 2005).
However, the use of regressions to compare treated and control water table depths is
considered a more robust method than graphical analysis (Pothier et al. 2003; Jutras and
Plamondon 2005).
The statistical analysis simultaneously addressed several categorical and continuous
variables influencing the fixed effects. The data structure was correctly accounted for using
the mixed model approach. No apparent problems of multicollinearity appeared between
explanatory variables, and the final model was very stable regardless of modifications made
to its structure. No trend could be found in the residuals when they were plotted against
explanatory variables or predicted values.
The investigations carried out since 1991 on the study sites indicated important differences
between mineral and organic soils with respect to the water table level changes over time
(Dubé et al. 1995; Roy et al. 2000a,b; Marcotte 2005). The differences observed in
watering-up after harvest were explained by the lower water retention capacity of fine
textured mineral soils compare to organic soils. Therefore, for a same quantity of water in
excess, watering-up will be more important on mineral sites than on organic ones. Marcotte
(2005) demonstrated that, after clearcutting the mature stands, water table depth recovery
was faster on organic sites than on mineral sites. The vegetation involved in the water table
depth regulation was judged to be more efficient in decreasing the water table on organic
sites. In the present study, contrary behaviour was observed after PCT.
The YEAR × TYPE interaction showed the similar effect of PCT on WTR in 2004 for both
site types (Fig. 4). The significantly lower WTR in 2005 compared to 2004 for mineral soil
sites suggested a faster hydrological recovery in this site type. This reaction was consistent
with field observations (data not shown) indicating a gradual invasion of thinned areas by
vigorous ground vegetation (mean height = 0.5 - 1 m), especially visible on mineral soil
sites by the end of the 2005 growing season. PCT created noticeable openings in the
64
canopy and therefore increased light availability at the ground surface. Pioneer broadleaved
species, such as red maple, white birch, speckled alder and red raspberry (Rubus idaeus L.),
which were especially frequent on mineral soils, rapidly proliferated through stump
sprouting and seedling establishment. Although this ground vegetation is suspected of
having an important role in interception (Prévost and Plamondon 1987; Xu et al. 2002), it
was not monitored by the stand density measurement method that we used, but gradually
reduced WTR caused by PCT on mineral sites. Since the stand composition and
development largely differed at the times of harvesting, drainage and thinning, it seems
difficult to explain intelligibly the results obtained in this study with those of Marcotte’s
(2005) study.
Forest drainage may strongly influence the hydrological balance of wetlands by changing
an evapotranspiration-dominated process to a runoff-dominated one (Ahti and Päivänen
1997). Therefore, the impact of PCT, which was directly affecting evapotranspiration, was
expected to have a smaller effect on WTR in drained areas than in undrained ones. In a
nearby stand that had been drained 10 years prior to harvesting, clearcutting caused no
watering-up in the first 6 m from the ditch, while the water table rose significantly at ditch
spacings exceeding 40 m (Jutras and Plamondon 2005). In the present study, WTR was
expected to be negligible < 20 m from the ditch, but high at 40 and 60 m. Results have
shown that neither DIST class nor the contrast testing the effect of drainage revealed a
difference in WTR (Table 2). The observed WTR, however, illustrated a slight trend
showing smaller values close to the ditch than farther from it. The lower water table and the
more important peat subsidence in proximity to the ditch (Prévost et al. 1997, Roy et al.
2000b) could partly explain the WTR occurring within the first few meters from the ditch.
The various combinations of distance to the ditch, vegetation density and effective
hydrological recovery were probably too numerous on the study area to clearly ascertain
the individual effects of both drainage and PCT on the water table depth. Nevertheless, a
significant watering-up occurred after PCT regardless of distance to the ditch.
The increase of WTR with increasing ΔG reinforces the assumption that the
evapotranspiration provided by the vegetation on regenerating forested wetlands is playing
65
an important role as a water table depth regulator. Small basal area removals corresponded
to low WTR, while substantial canopy removal was related to considerably higher WTR.
However, the lack of statistically significant influence of G on the WTR might have been
caused by a large variance of the estimated local basal area around each well due to the plot
size used. When the study areas were established, plots of small dimensions (4 m²) were
chosen over larger plots since the vegetation was characterized by the presence of abundant
and evenly distributed small-sized saplings. Small plots are exponentially less time-
consuming than larger ones while they provided reasonably precise estimate of the local
basal area. This permitted us to distribute many plots to uniformly characterize the whole
studied areas. The use of these small plots after PCT may locally under- or overestimated
the basal area due to non-harvested veteran stem outside or within the plots. However, the
small-sized plots used gave unbiased values of ΔG and G, but, in certain situations, they
might be less accurate than values obtained with larger plots. Though, the greatest
disadvantage of the small-sized plots was related to the determination of G.
The very important influence of WT on the WTR (Table 2) confirmed the importance of
the vegetation in the water table depth regulation of wetland sites. After PCT, the WTR was
greater during dry episodes than during wet ones. Under dry conditions, the water table
depth is expected to be mainly influenced by transpiration and runoff, while water table
depth under wet conditions is mostly regulated by precipitation, interception and runoff.
PCT only affected interception and transpiration since precipitation was the same
regardless the treatment. The variation of runoff within each site, which is strongly affected
by drainage, was accounted for by the DIST factor. The minor WTR observed when WT
was near the surface (high precipitation or spring snowmelt recharge) is mainly attributed
to the reduced interception after thinning. The largest WTR was obtained during dry
episodes, since the reduced transpiration provided by the residual vegetation could not
affect the hydrological balance of the site as much as complete vegetation coverage could.
Transpiration and interception were largely related to tree phenology, explaining the
seasonal pattern of WTR observed during each annual sampling period. Water depth
monitoring started each year before bud break and ended a few weeks after broadleaf
66
litterfall. The full development of leaves and growth activity was reached by the end of
May to early June. WTR was maximal from this period until about the end of August. At
that time, tree growth activities and evapotranspiration are significantly reduced (Bernier et
al. 1999). From mid-September to mid-October, leaves were gradually senescing and
falling from deciduous trees, while decreasing interception, which explained the lower
WTR in thinned area.
Evapotranspiration by the woody vegetation was found to be a very important part of the
hydrological balance of densely regenerated wetlands. However, this study did not evaluate
the impact of WTR on the productivity of forested wetland sites. After harvesting,
watering-up averaged 10 cm on mineral sites and 4 cm on organic sites (Marcotte 2005).
The mean value of WTR following PCT from early June to the end of August was 2.6 ± 4.9
cm (mean ± SD). This WTR represents a 10.2 % change of the water table depth during the
most critical growth period for trees. It is actually difficult to predict if a value of this
magnitude could significantly affect tree growth. Tree growth would have to be followed
for another 5 to 10 years to assess the impact of WTR on site productivity. Otherwise,
lighter precommercial thinning intensities should efficiently limit WTR on densely
regenerated wetland sites. Mechanical release of a smaller number of desired commercial
stems, would simultaneously lower inter-tree competition and preserve a favourable
hydrological balance of the site. However, further yield investigations are necessary to
assess the profitability of such treatments over standard intensity precommercial thinning.
Conclusion
Precommercial thinning, by drastically reducing stand density, caused a significant (2.6
cm) rise in the water table on a wide range of densely regenerated wetland sites in the
Saint-Lawrence lowlands. Water table rise was found to be similar for mineral and organic
sites in the first year after treatment, but a marked hydrological recovery was observed
during the second year on mineral sites. The abundant ground vegetation, which was
established after the canopy was opened up, likely contributed to a higher interception rate,
67
causing the water table depth to reach its pre-treatment level. The reduced
evapotranspiration rate caused by canopy loss was considered the most important factor
causing the water table to rise. Low basal area removal showed a smaller degree of water
table rise than did more intense treatments, suggesting the application of light to moderate
precommercial thinning practices on forested wetlands.
Acknowledgements
We would like to thank Papier Stadacona inc., represented by Jacques Morin and Yves
Montmigny, for its long-lasting financial and technical support concerning the Forested
Wetland Management Research Program. Monitoring activities were mainly provided by
Philippe Marcotte, Daniel Breton, Étienne Lemieux, Yohann Tremblay and Lucie Günther.
The first author was financially supported by a doctoral scholarship from FQRNT (Fonds
québecois de la recherche sur la nature et les technologies) and field work was partly
supported by NSERC.
References
Ahti, E. and Päivänen, J. 1997. Response of stand growth and water table level to maintenance of ditch networks within forest drainage areas. In: Trettin, C.C., Jurgensen, M.F., Grigal, D.F., Gale, M.R. and Jeglum, J.K. (eds) Northern forested wetlands: ecology and management. Lewis Publishers, CRC Press, Boca Raton, FL. pp. 449-457.
Anon. 1987. The system of soil classification of Canada. 2nd edition. Agriculture Canada, Publ. 1646. Ottawa, Ontario, Canada. 170 pp.
Belleau, P., Plamondon, A.P., Lagacé, R. and Pepin, S. 1992. Hydrodynamique d'une pessière noire drainée. Can. J. For. Res. 22: 1063-1070.
Bernier, P.Y., Fournier, R., Ung, C.H., Robitaille, G., Larocque, G., Lavigne, M.B., Boutin, R., Raulier, F., Paré, D., Beaubien, J., and Delisle, C. 1999. Linking ecophysiology and forest productivity: an overview of the ECOLEAP project. Forestry Chronicle. 75: 417-421.
68
Berry, G.J. and Jeglum, J.K. 1991. Hydrology of drained and undrained black spruce peatlands: groundwater table profiles and fluctuations. For. Can., Ont. Region, Sault Ste. Marie, Ont. COFRDA Rep. 3307. 31 pp.
Dubé, S. and Plamondon, A.P. 1995. Relative importance of interception and transpiration changes causing watering-up after clearcutting on four wet sites. Intern. Ass. Sci. Hydrol, Boulder Symposium. Publ. 230: 113-120.
Dubé, S., Villeneuve, N., Grandtner, M.M. and Plamondon, A.P. 1993. Cluster and ordination analyses of the vegetation and the soil in the Beaurivage forested wetland (Québec). Fragmenta Floristica et Geobotanica. Suppl. 2: 539-556.
Dubé, S., Plamondon, A.P. and Rothwell, R.L. 1995. Watering-up after clear-cutting on forested wetlands of the St. Lawrence lowland. Water Resour. Res. 31: 1741-1750.
Environment Canada. 2004. Canadian climate normals 1971-2000. Atmospheric Environment Service, Downsview, Ontario, Canada. http://www.climat.meteo.ec.gc.ca/ climate_normals/results_f.html.
Heikurainen, L. 1964. Improvement of forest growth on poorly drained peat soils. Int. Rev. For. Res. Academic Press, New York. pp. 39-113.
Heikurainen, L. 1967. Hakkuun vaikutus ojitettujen soiden vesitalouteen (Summary: On the influence of cutting on the water economy of drained peatlands). Acta For. Fenn. 82: 1-45.
Heikurainen, L. & Päivänen, J. 1970. The effect of thinning, clear cutting and fertilization on the hydrology of peatland drained for forestry. Acta Forestalia Fennica 104: 23 pp.
Hillman, G.R. 1991. Black spruce growth on drained, forested peatland in northern Alberta. Can. For. Serv. For. Manag. Note No. 53. 8 pp.
Hillman, G.R. 1992. Some hydrological effects of peatland drainage in Alberta’s boreal forest. Can. J. For. Res. 22: 1588-1596.
Jutras, S. and Plamondon, A.P. 2005. Water-table rise after harvesting in a treed fen previously drained for forestry. Suo. 56: 95-100.
Jutras, S., Bégin, J. and Plamondon, A.P. 2002. Impact du drainage forestier après coupe sur la croissance de l’épinette noire en forêt boréale. Can. J. For. Res. 32: 1585-1596.
Jutras, S., Bégin, J. and Plamondon, A.P. 2004. Illustration of biological drainage in forested peatlands by spatially explicit single-tree growth modelling. In: Päivänen, J. Proceedings of the 12th International Peat Congress: “Wise use of peatlands”, Volume 1, Oral presentations. June 2004, Tampere, Finland. pp. 445-450.
69
Landhäusser, S.M., Lieffers, V.J. and Silins, U. 2003. Utilizing pioneer species as a hydrological nurse crop to lower water table for reforestation of poorly drained boreal sites. Ann. For. Sci. 60: 741-748.
LeBarron, R.K. and Neetzel, J.R. 1942. Drainage of forested swamps. Ecology 23: 457-465.
Lieffers, V.J. and MacDonald, S.E. 1990. Growth and foliar nutrient status of black spruce and tamarack in relation to depth of water table in some Alberta peatlands. Can. J. For. Res. 20: 805-809.
Lieffers, V.J. and Rothwell, R.L. 1986. Effects of depth of water table and substrate temperature on root and top growth of Picea mariana and Larix laricina seedlings. Can. J. For. Res. 16: 1201-1206.
Marcotte, P. 2005. Rétablissement hydrologique après coupe et vigueur de la regeneration naturelle en sapin baumier (Abies balsamea (L.) Mill.) de milieux forestiers humides de la vallée du St-Laurent. Mémoire de maîtrise, Faculté de foresterie et de géomatique, Université Laval, Ste.-Foy, Quebec. 60 pp.
MRN. 2000. Guide de terrain d’identification du type écologique. Sous-domaine de l’érablière à tilleul de l’est. Région écologique 2b, Plaine du St-Laurent. 35 p.
MRNFP. 2003. Instructions relatives à l’application du règlement sur la valeur des traitements sylvicoles admissibles en paiement des droits. Ministère des Ressources naturelles, de la faune et des parcs. Direction de l’assistance technique, Division des traitements sylvicoles. Ste.-Foy, Quebec, Canada.
OIFQ. 1996. Manuel de foresterie. Les presses de l’Université Laval, Sainte-Foy, QC, Canada. 1428 pp.
Paavilainen, E. and Päivänen, J. 1995. Peatland forestry: ecology and principles. Springer-Verlag, Berlin. 248 pp.
Päivänen, J. 1980. The effect of silvicultural treatments on the ground water table in Norway spruce and Scots pine stands on peat. Proceedings of the 6th International Peat Congress, Duluth, MN, USA.
Päivänen, J. 1982. Hakkuun ja lannoituksen vaikutus vanhan metsäojitusalueen vesitalouteen (Summary: The effect of cutting and fertilization on the hydrology of an old forest drainage area). Folia For. 516: 1-19.
Pothier, D., Prévost, M. and Auger, I. 2003. Using the shelterwood method to mitigate water table rise after forest harvesting. For. Ecol. Manag. 179: 573-583.

70
Prévost, M. and Plamondon, AP. 1987. Interception de la pluie par les débris et la couverture végétale établie après la coupe à blanc. Naturaliste Canadien. 114: 127-132.
Prévost, M., Belleau, P. and Plamondon, A.P. 1997. Substrate conditions in a treed peatland: Responses to drainage. Ecoscience. 4: 543-554.
Roy, V., Jeglum, J.K. and Plamondon, A.P. 1997. Water table fluctuations following clearcutting and thinning on Wally Creek wetlands. In: Trettin, C.C., Jurgensen, M.F., Grigal, D.F., Gale, M.R. and Jeglum, J.K. (eds) Northern forested wetlands: ecology and management. Lewis Publishers, CRC Press, Boca Raton, FL. pp. 239-251.
Roy, V., Plamondon, A.P. and Bernier, P. 2000a. Influence of vegetation removal and regrowth on interception and water table level on wetlands. International Peat Journal. 10: 3-12.
Roy, V., Plamondon, A.P. and Bernier, P. 2000b. Draining forested wetland cutovers to improve seedling root zone conditions. Scan. J. For. Res. 15: 58-67.
Roy, V., Ruel, J.-C. and Plamondon, A.P. 2000c. Establishment, growth and survival of natural regeneration after clearcutting and drainage on forested wetlands. For. Ecol. Manag. 129: 253-267.
SAS Institute Inc. 2003. SAS OnlineDoc®, Version 9.1. SAS Institute Inc. Cary, NC, USA.
Toth, J. and Gillard, D. 1988. Experimental design and evaluation of a peatland drainage system for forestry by optimization of synthetic hydrographs. Can. J. For. Res. 18: 353-373.
Verry, E.S. 1997. Hydrological processes of natural, northern forested wetlands. In: Trettin, C.C., Jurgensen, M.F., Grigal, D.F., Gale, M.R. and Jeglum, J.K. (eds) Northern forested wetlands: ecology and management. Lewis Publishers, CRC Press, Boca Raton, FL. pp. 163-188.
Wilson, C.V. 1971. Le climat du Québec. Première partie, Atlas climatique. Service Météorologique du Canada, Environment Canada, Ottawa.
Xu, Y.-J., Burger, J.A., Aust, W.M., Patterson, S.C., Miwa, M. and Preston, D.P. 2002. Changes in surface water table depth and soil physical properties after harvest and establishment of loblolly pine (Pinus taeda L.) in Atlantic coastal plain wetlands of South Carolina. Soil & Tillage Res. 63: 109-121.
CHAPTER 4
Beneficial influence of plant neighbours on tree growth in drained forested peatlands – A case study
72
Jutras, S.1, Hökkä, H.2, Bégin, J.1, Plamondon, A.P.1 Submitted to the Canadian Journal of
Forest Research. Beneficial influence of plant neighbours on tree growth in drained
forested peatlands – A case study. 1Faculty of Forestry and Geomatics, Université Laval,
Ste-Foy, Québec, G1K 7P4, CANADA. 2Finnish Forest Research Institute, Rovaniemi
Research Station, P.O. Box 16, FIN 96301 Rovaniemi, FINLAND. This chapter is the
result of the candidate’s labour. Hannu Hökkä, Jean Bégin and André Plamondon have
been giving suggestions on the design and the preparation of this chapter.
Abstract
In boreal forest, drainage can be successfully used to lower the water-table level of post-
harvest forested peatland stands suffering from watering-up. The later vegetation revival
and growth is suspected to gradually create a water-table drawdown described in this study
as biological drainage. Its effect on the annual stump diameter increment of planted eastern
larch (Larix laricina (Du Roi) K. Koch.) and naturally regenerated black spruce (Picea
mariana (Mill.) B.S.P.) was studied on a post-harvested and drained forested peatland
located in eastern part of the Canadian boreal forest. A factor describing the neighbourhood
occupancy of every subject tree was used to illustrate biological drainage in a retrospective
growth analysis. Results showed the dual effect of the neighbourhood occupancy factor:
competing situations close to the ditch and growth-favouring situations farther from it. In
the latter case, the studied trees demonstrated better growth with moderately increasing
neighbourhood occupancy. This was interpreted as evidence of the beneficial effect of
biological drainage on tree growth. The presence of speckled alder (Alnus incana ssp.
rugosa (Du Roi) J. Clausen) in the neighbourhood of selected trees corresponded to
improved growth for both studied species.
73
Résumé
En forêt boréale, le drainage permet de rabattre efficacement la nappe phréatique des
tourbières forestières récemment récoltées affectés par une nappe haute. La croissance
subséquente de la végétation forestière sur ces sites est susceptible de créer un rabattement
de la nappe phréatique, appelé ici drainage biologique. Son effet sur l’accroissement annuel
en diamètre à la souche de plants de mélèze laricin (Larix laricina (Du Roi) K. Koch.) et de
semis naturels d’épinette noire (Picea mariana (Mill.) B.S.P.) a été étudié sur une tourbière
forestière récoltée et drainée. Un facteur décrivant l’occupation du voisinage des arbres
étudiés a été utilisé afin de décrire le drainage biologique dans une analyse de croissance
rétrospective. Les résultats ont démontré les deux effets opposés de l’occupation du
voisinage sur l’accroissement en diamètre : des situations de compétition à proximité des
fossés et des situations favorables à la croissance forestière plus loin. Dans ce dernier cas,
les arbres étudiés ont démontrés une meilleure croissance avec une augmentation modérée
de l’occupation du voisinage. Ceci a été interprété comme une démonstration de l’effet
bénéfique du drainage biologique sur la croissance forestière. La présence d’aulne rugueux
(Alnus incana ssp. rugosa (Du Roi) J. Clausen) dans le voisinage des arbres étudiés
correspondait à une croissance accrue des deux essences étudiées.
74
Introduction
Boreal forested peatland sites are susceptible to watering-up after canopy removal
(Heikurainen and Päivänen 1970; Dubé et al. 1995; Roy et al. 1997). This rise of the water-
table level is principally caused by the abrupt change of evapotranspiration resulting from
the removal of the higher vegetation cover. The reduction of the interception and
transpiration were each responsible for about 50% the watering-up (Dubé and Plamondon
1995).
High water-table level results in anoxic conditions within the rooting zone (Ponnamperuma
1972; Campbell 1980), diminished soil volume available for rooting, nutrient uptake
(Lieffers and Rothwell 1987; Koslowski 1997) and cold soil temperature (Lieffers 1988).
The growth of North-American boreal tree species such as black spruce (Picea mariana
(Mill.) B.S.P.), eastern larch (Larix laricina (Du Roi) K. Koch.) and white spruce (Picea
glauca (Moench) Voss) is impaired by high water-table level (Lieffers and Rothwell 1986;
Lieffers and MacDonald 1990; Landhäusser et al. 2003a).
Successful regeneration of water-logged sites is therefore closely linked to the water
budget. Forest drainage can be used to promptly lower the water-table level of recently
harvested forested peatlands (Roy et al. 2000a). The gradual re-establishment of the
evapotranspiration, proportional to the vegetation revival, is also expected to play a major
role in the future water budget of such sites (Paavilainen and Päivänen 1995). Biological
drainage is the most common term used to describe the vegetation induced water-table
drawdown observed on forested peatlands (Heikurainen and Päivänen 1970; Paavilainen
and Päivänen 1995; Ahti and Päivänen 1997; Sun et al. 2001; Lauhanen and Ahti 2002;
Ahti et al. 2004). The terms hydrological recovery (Roy et al. 2000b; Pothier at al. 2003;
Xu et al. 2002) and hydrological nurse (Landhäusser et al. 2003a, 2003b) have also been
used alternatively. Biological drainage has been studied in arid environments (Zhao et al.
2004) and in agroforestry systems (Livesley et al. 2004), however, neither its possible
impact on water-table level, ecohydrological processes nor tree growth has ever been
75
directly studied in regenerating forested peatlands (Jutras et al. 2002, 2004). With a better
understanding of the reciprocal interaction between plant neighbours in water-logged sites,
specific silvicultural guidelines concerning the education of such forest stands could be
developed.
Biological drainage is assumed to induce a notable water-table drawdown (Heikurainen
1963; Heikurainen and Päivänen 1970; Aust et al. 1997; Roy et al. 2000b; Sun et al. 2001;
Xu et al. 2002) which could consequently increase tree growth (Penner et al. 1995; Hökkä
and Groot 1999). The best approach to the study of biological drainage would be based on
simultaneous analysis of vegetation coverage, tree growth, and water-table spatial
variability at tree-scale. Such intensive monitoring, executed through many growing
seasons, would however be extremely laborious. Alternatively, the evaluation of past
annual tree diameter increments of regenerating trees as a function of their plant neighbour
abundance and their soil water conditions could enable the evaluation of the influence of
biological drainage on tree growth. This approach would necessitate a study site where
forest drainage has been implemented years ago, and where the tree stand is currently
characterized by notable size-differences among trees, resulting from differences in local
stem density around tree and soil water conditions. Such an area was available from a
former innovative research project concerning the effect of drainage on post-harvested
peatlands suffering from water-table rise caused by the vegetation removal and the
impeding of evapotranspiration (Bolghari and Veilleux 1987).
Eastern larch was planted on sections of the experimental area to monitor the performance
of this species in drained peatland soils. Sixteen years later, tree growth varied considerably
with respect to proximity of the ditch. Consequently, the site appeared appropriate to
attempt an evaluation of plant neighbour influence on tree growth through different soil
water conditions, which were provided by the presence of drainage ditches. The aim of this
study was to demonstrate the effect of biological drainage on tree growth in post-harvest
drained forested peatlands. The quantification of its influence was expected to be possible
by the study of individual tree growth in varying situations in terms of local competition
and site water conditions. A retrospective annual diameter increment analysis was used to
76
describe the influence of increasing tree neighbourhood occupancy on the growth of
selected trees.
Material and methods
Study site and experimental design
The study area (49°28.5’N, 74°38.3’W) is located 60 km south of the town of Chapais,
Quebec, Canada. The thirty-year mean annual precipitation, temperature and degree-days
above 5ºC based on weather data collected at the “Chapais 2” meteorological station
(49º46'N, 74º51'W), are 961.3 mm, 0.0ºC and 1235, respectively (Environment Canada
2004). The 120-year old black spruce-dominated stand was harvested using the whole tree
method in 1981. Suspected to show severe regeneration problems because of its obvious
poor soil drainage (Bolghari and Veilleux 1987), the site was experimentally drained in
1983. This experimental area is, to our knowledge, the oldest post-harvest drainage
experiment in Canadian boreal forest. An excavator equipped with a “V”-shaped bucket
dug 1 m deep by 2 m wide ditches with a mean spacing of 30 m (± 2 m). The effective
water-table drawdown could not be estimated since no water-table level measurement took
place before drainage. However, two wells located outside the experimental area (less than
200 m away) were used to measure weekly the water-table level during the four growing
seasons that followed drainage. The 4-year mean annual water-table depth at mid-distance
of 30 m-spaced drained strips was 41 cm. Conversely, a depth of 24 cm was observed for a
well situated in comparable soil conditions but within a 70 m wide drained strip.
The soil characteristics and the vegetation type were uniform throughout the study area.
The soil was characterized by a 30 cm thick, weakly decomposed (VonPost = 4) peat layer
overlying a silty-clay textured mineral soil. The site corresponded to a OG 8 of the Ontario
Forest Ecosystem Classification (Jones et al. 1983) and to a RE26/KAA LEG of the
Quebec Forest Ecological Classification (Bergeron et al. 1998). At the time of drainage, the
tree layer was dominated by advanced black spruce regeneration, speckled alder (Alnus

77
incana ssp. rugosa (Du Roi) J. Clausen) was also present. The shrub layer was
characterized by an abundant presence of Rhododendron groenlandicum (Oeder) Kron &
Judd (syn. Ledum groenlandicum Oeder) associated with Kalmia angustifolia L. and
Vaccinium angustifolium Ait.. The moss layer was dominated by Sphagnum flexuosum
Dozy & Molk. and Sphagnum magellanicum Brid., Pleurozium shreberi (Bird.) Mitt. was
present in smaller proportions. The study site is referred to as peatland in this paper even
though it is considered a mineral soil site (organic layer < 40 cm) in the Canadian System
of Soil Classification (Canada Soil Survey Committee 1978). The abundance of typical
ombrotrophic peatland species, the obvious paludification processes responsible for the soil
formation and the Sphagnum spp. dominated moss layer are the principal reasons why the
term peatland was used.
In 1985, bare-root eastern larches were planted manually with approximately 2 m spacing
in areas where black spruce regeneration was insufficient. There has not been any
fertilization or vegetation control performed in the following years. In 2002, tree growth
and neighbourhood occupancy was evaluated within 11 plots varying in size from 64.5 to
110.4 m². The plots were fitted to enclose at least three strips of planted larches (4.3 to 6.9
m in width) and to cover the distance from the ditch edge to the midpoint between ditches
(14.2 to 16 m in length). All trees > 1 cm diameter over bark at breast height (DBH; h = 1.3
m) located within the plots were mapped and felled. The distance to the center of the
closest ditch was measured with a graduated tape at the nearest 5 cm for each tree. In total,
168 planted eastern larches and 72 naturally regenerated black spruces were analysed. DBH
and diameter over bark at stump height (DBH; h = 0.3 m) were measured on all felled trees.
Discs, collected at stump height, were air-dried and sanded. Their annual ring increments (4
radiuses) were measured using a scanner and Windendro® software (Regent Technology
Inc., Sainte-Foy, QC). Principal attributes of the studied plots and trees appear in table 1.
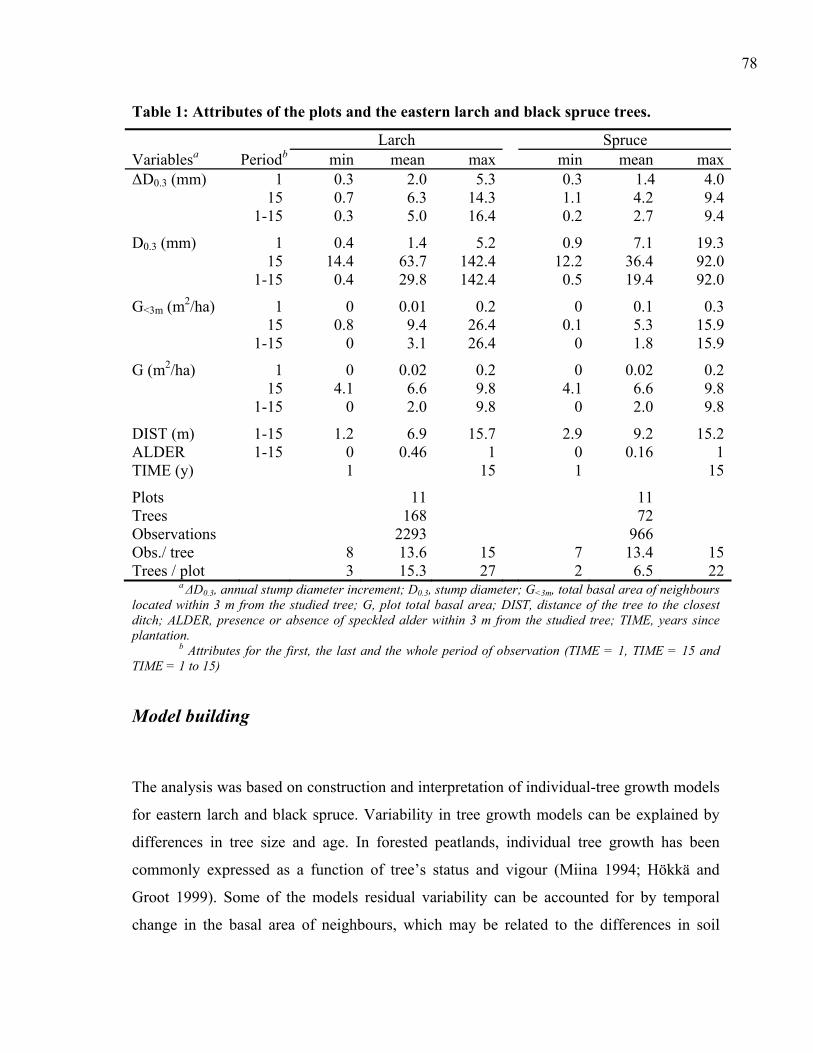
78
Table 1: Attributes of the plots and the eastern larch and black spruce trees.
Larch Spruce Variablesa Periodb min mean max min mean maxΔD0.3 (mm) 1 0.3 2.0 5.3 0.3 1.4 4.0 15 0.7 6.3 14.3 1.1 4.2 9.4 1-15 0.3 5.0 16.4 0.2 2.7 9.4
D0.3 (mm) 1 0.4 1.4 5.2 0.9 7.1 19.3 15 14.4 63.7 142.4 12.2 36.4 92.0 1-15 0.4 29.8 142.4 0.5 19.4 92.0
G<3m (m2/ha) 1 0 0.01 0.2 0 0.1 0.3 15 0.8 9.4 26.4 0.1 5.3 15.9 1-15 0 3.1 26.4 0 1.8 15.9
G (m2/ha) 1 0 0.02 0.2 0 0.02 0.2 15 4.1 6.6 9.8 4.1 6.6 9.8 1-15 0 2.0 9.8 0 2.0 9.8
DIST (m) 1-15 1.2 6.9 15.7 2.9 9.2 15.2ALDER 1-15 0 0.46 1 0 0.16 1TIME (y) 1 15 1 15
Plots 11 11 Trees 168 72 Observations 2293 966 Obs./ tree 8 13.6 15 7 13.4 15Trees / plot 3 15.3 27 2 6.5 22
a ΔD0.3, annual stump diameter increment; D0.3, stump diameter; G<3m, total basal area of neighbours located within 3 m from the studied tree; G, plot total basal area; DIST, distance of the tree to the closest ditch; ALDER, presence or absence of speckled alder within 3 m from the studied tree; TIME, years since plantation.
b Attributes for the first, the last and the whole period of observation (TIME = 1, TIME = 15 and TIME = 1 to 15)
Model building
The analysis was based on construction and interpretation of individual-tree growth models
for eastern larch and black spruce. Variability in tree growth models can be explained by
differences in tree size and age. In forested peatlands, individual tree growth has been
commonly expressed as a function of tree’s status and vigour (Miina 1994; Hökkä and
Groot 1999). Some of the models residual variability can be accounted for by temporal
change in the basal area of neighbours, which may be related to the differences in soil
79
saturation. If significant, these effects could then be interpreted as indicators of biological
drainage.
In this study, the growth models’ response variable was the annual stump diameter
increment under bark (ΔD0.3) of planted larches and of naturally regenerated black spruces.
The assumptions of normality and homogeneity of the variance were satisfied by adding a
constant (c = 2) and making a logarithmic transformation for the response variable.
ΔD0.3 was expressed here as a function of the initial stump diameter under bark (D0.3).
Combination of both the first power of D0.3 and logarithmic transformation of D0.3 resulted
in a linear relationship. As larches were planted in the same year and naturally regenerated
black spruces were small at that time, age was replaced in the analysis by the number of
years since the larch plantation occurred (TIME). The plot stump basal area (G) was used
as a plot-level stand density indicator in the model. Since the site index was assumed to be
uniform among plots, it was consequently omitted from the model.
Tree growth is affected by ditch closeness in drained forested peatlands (Miina 1994;
McLaren and Jeglum 1998; Jutras et al. 2002). Following ditching, the maximum water-
table lowering occurs near the ditch while the minimum occurs at the midpoint between
them, describing a parabolic shape (Braekke 1983; Berry and Jeglum 1991; Hillman 1992;
Prévost et al. 1997). The nutrient content of peat soil water and the soil aeration are higher
in proximity to ditches (Prévost et al. 1999), resulting in enhanced tree growth at shorter
distances from the ditch edge (Heikurainen 1964; Seppälä 1972; McLaren and Jeglum
1998; Jutras et al. 2002). The different water conditions across the drainage strips were
utilized in this study to demonstrate biological drainage, which was assumed to be more
important where soil water is in excess than where soil water is not limiting growth. Since
the form of the relationship between ditch closeness and tree growth was unknown, the use
of categorical variables was preferred to a continuous one. Ditch distances, ranging from 1
to 16 m, were reclassified into two unequally sized classes; DISTNEAR and DISTFAR, based
on their influence on growth as detected in the analysis. Each class represents the distance
from the closest ditch; 1 to 6 m, and 6 to 16 m, respectively. Since the average diameter
80
growth rate was highest close to the ditch and lowest far from the ditch, interactions
between distance class and initial diameter were included in the model.
The neighbourhood occupancy of subject trees was determined by the concept of the “zone
of influence” defined by Opie (1968) as “the total area over which the tree may at present
obtain or compete for site factors”. The use of a fixed-radius plot, a distance-independent
index, was preferred to diameter-dependent radius plot and to distance-dependent
competition indices because the latter ones only marginally improve estimates of individual
tree growth in growth models (Opie 1968; Biging and Dobertin 1992, 1995; Woodall et al.
2003). Miina (1994) assumed that a 3 m radius adequately expressed the area that Scots
pine (Pinus sylvestris L.) saplings growing on drained peatlands need for access to below-
ground resources. Neighbourhood occupancy values were calculated here for fixed radiuses
of 1, 2, 3, 4, 5 and 6 m. A correlation analysis revealed no major additional contribution of
the competitors beyond a 3 m radius.
The tree neighbourhood occupancy factor (G<3m) was calculated as the sum of the stump
basal area of all trees located within three meters of the subject tree. It has been computed
for each year of the 15-year period of observation. G<3m for trees located close to the plot
borders was estimated by positioning and measuring the DBH of 990 trees located outside
the plots, within a 6 m distance from its border. Fifteen regression equations were built
from the trees measured within the plots using the DBH and the distance from the ditch to
reclusively estimate each annual D0.3. These regressions were later applied to the trees
outside the plot to calculate their development.
Known to be a good estimator of competition (Woodall et al. 2003), neighbourhood
occupancy normally shows a negative effect on growth as it increases (Biging and
Dobbertin 1992; Miina 1994; Woodall et al. 2003) in areas where the below-ground
resources are the principal factor limiting growth. In this study, the neighbourhood
occupancy factor is expected to be strongly correlated to the evapotranspiration rate of the
area that it is describing. Consequently, in areas where excess water in the soil is the
limiting growth factor, the neighbourhood occupancy factor is assumed to be an indicator
of the potential for biological drainage. Optimum tree growth conditions are therefore
81
expected to appear when the opposing effects of neighbourhood occupancy counter-balance
each other. Various transformation of G<3m, such as second power, square root, natural
logarithm and inverse value, were tested.
G<3m showed constantly increasing value through time. At TIME = 1, trees were inevitably
subjected to low neighbourhood occupancy due to the small size of trees, while at TIME =
15, neighbourhood occupancy could vary from low to high values, depending on the
number and size of neighbours found within the fixed-radius plot. The beneficial effect of
biological drainage might consequently be present only after neighbourhood occupancy
attained specific levels, which needed time to occur after clearcutting. In addition, this
interaction is probably different for different intensity of soil water excess, i.e., among the
DIST classes. The triple interaction ln(G<3m)×DIST×TIME term in the model was used to
test whether neighbourhood occupancy had different effects on growth at different soil
water conditions in these data.
Another growth factor introduced in the model was the presence of speckled alder, a shrub
with no commercial value. This thicket forming species was the only other treed vegetation,
apart from eastern larch and black spruce, to be found on the site. Known to be a vigorous
competitor for light in regenerating coniferous stands (Jobidon 1995), speckled alder might
also play a role in the biological drainage phenomenon. A dummy variable expressing the
presence or absence of this species within a 3 m radius from the subject tree (ALDER) was
used in the model. This value was determined for observations completed in 2002 and thus
has remained unchanged over time.
Data structure and model estimation
The data, like in many other tree growth model studies (Miina 1994; Hökkä & Groot 1999;
Hökkä & Ojansuu 2004), were hierarchically structured. Three levels were specified:
annual diameter increment observations repeated within each tree, numerous trees within
plots, and several plots in the whole data. Furthermore, a non-hierarchical random
interaction was detected between annual diameter increment observations and the plots. To
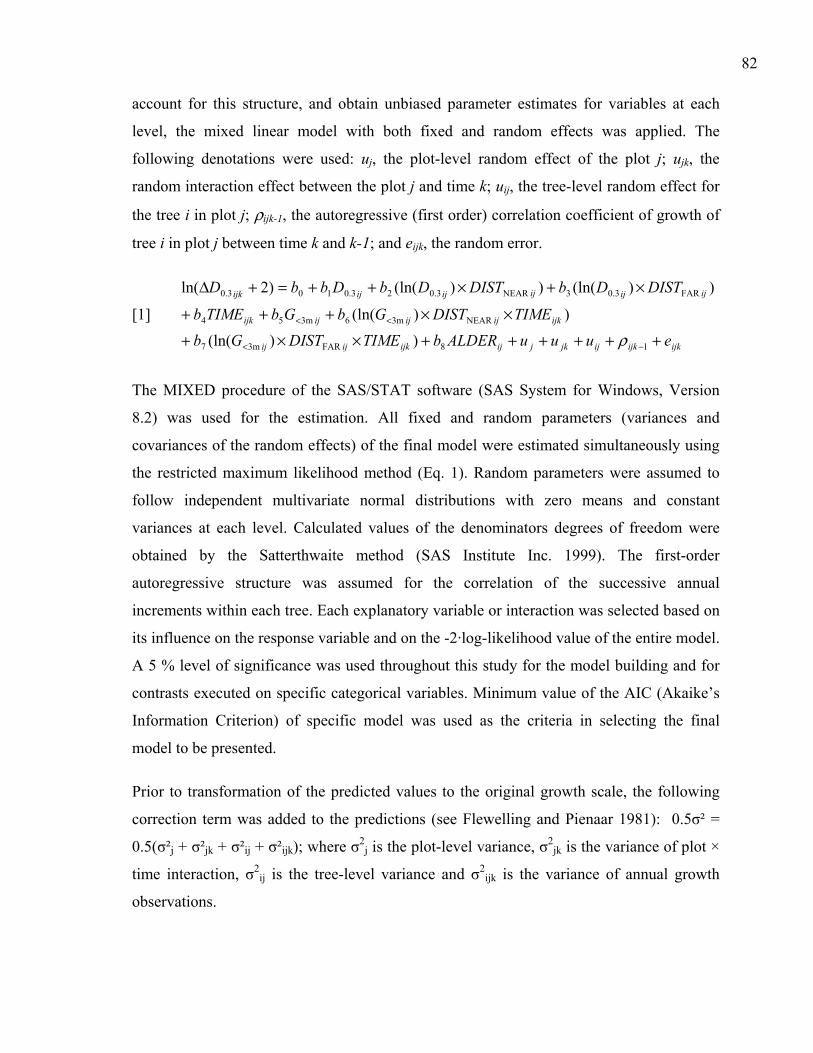
82
account for this structure, and obtain unbiased parameter estimates for variables at each
level, the mixed linear model with both fixed and random effects was applied. The
following denotations were used: uj, the plot-level random effect of the plot j; ujk, the
random interaction effect between the plot j and time k; uij, the tree-level random effect for
the tree i in plot j; ρijk-1, the autoregressive (first order) correlation coefficient of growth of
tree i in plot j between time k and k-1; and eijk, the random error.
[1]
ijkijkijjkjijijkijij
ijkijijijijk
ijijijijijijk
euuuALDERbTIMEDISTGb
TIMEDISTGbGbTIMEb
DISTDbDISTDbDbbD
++++++××+
××+++
×+×++=+Δ
−<
<<
18 FAR 3m7
NEAR 3m6 3m54
FAR3.03 NEAR3.023.0103.0
))(ln(
))(ln(
))(ln())(ln()2ln(
ρ
The MIXED procedure of the SAS/STAT software (SAS System for Windows, Version
8.2) was used for the estimation. All fixed and random parameters (variances and
covariances of the random effects) of the final model were estimated simultaneously using
the restricted maximum likelihood method (Eq. 1). Random parameters were assumed to
follow independent multivariate normal distributions with zero means and constant
variances at each level. Calculated values of the denominators degrees of freedom were
obtained by the Satterthwaite method (SAS Institute Inc. 1999). The first-order
autoregressive structure was assumed for the correlation of the successive annual
increments within each tree. Each explanatory variable or interaction was selected based on
its influence on the response variable and on the -2·log-likelihood value of the entire model.
A 5 % level of significance was used throughout this study for the model building and for
contrasts executed on specific categorical variables. Minimum value of the AIC (Akaike’s
Information Criterion) of specific model was used as the criteria in selecting the final
model to be presented.
Prior to transformation of the predicted values to the original growth scale, the following
correction term was added to the predictions (see Flewelling and Pienaar 1981): 0.5σ² =
0.5(σ²j + σ²jk + σ²ij + σ²ijk); where σ2j is the plot-level variance, σ2
jk is the variance of plot ×
time interaction, σ2ij is the tree-level variance and σ2
ijk is the variance of annual growth
observations.
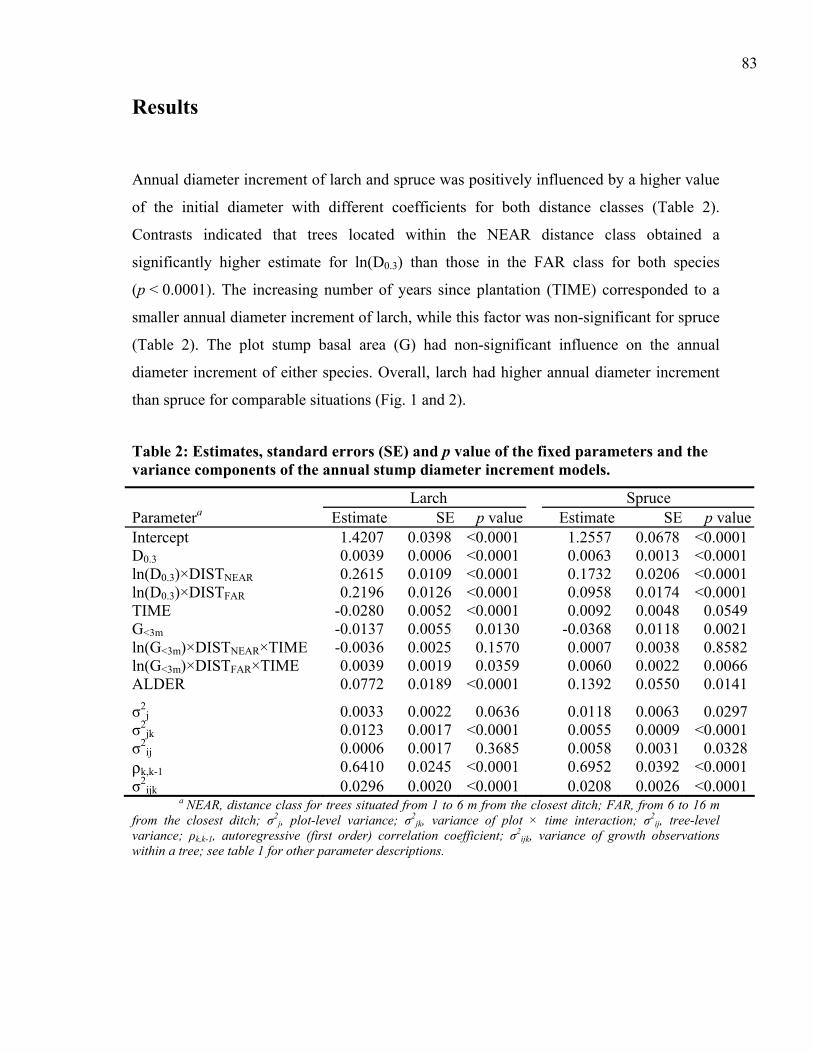
83
Results
Annual diameter increment of larch and spruce was positively influenced by a higher value
of the initial diameter with different coefficients for both distance classes (Table 2).
Contrasts indicated that trees located within the NEAR distance class obtained a
significantly higher estimate for ln(D0.3) than those in the FAR class for both species
(p < 0.0001). The increasing number of years since plantation (TIME) corresponded to a
smaller annual diameter increment of larch, while this factor was non-significant for spruce
(Table 2). The plot stump basal area (G) had non-significant influence on the annual
diameter increment of either species. Overall, larch had higher annual diameter increment
than spruce for comparable situations (Fig. 1 and 2).
Table 2: Estimates, standard errors (SE) and p value of the fixed parameters and the variance components of the annual stump diameter increment models.
Larch Spruce Parametera Estimate SE p value Estimate SE p valueIntercept 1.4207 0.0398 <0.0001 1.2557 0.0678 <0.0001D0.3 0.0039 0.0006 <0.0001 0.0063 0.0013 <0.0001ln(D0.3)×DISTNEAR 0.2615 0.0109 <0.0001 0.1732 0.0206 <0.0001ln(D0.3)×DISTFAR 0.2196 0.0126 <0.0001 0.0958 0.0174 <0.0001TIME -0.0280 0.0052 <0.0001 0.0092 0.0048 0.0549G<3m -0.0137 0.0055 0.0130 -0.0368 0.0118 0.0021ln(G<3m)×DISTNEAR×TIME -0.0036 0.0025 0.1570 0.0007 0.0038 0.8582ln(G<3m)×DISTFAR×TIME 0.0039 0.0019 0.0359 0.0060 0.0022 0.0066ALDER 0.0772 0.0189 <0.0001 0.1392 0.0550 0.0141
σ2j 0.0033 0.0022 0.0636 0.0118 0.0063 0.0297
σ2jk 0.0123 0.0017 <0.0001 0.0055 0.0009 <0.0001
σ2ij 0.0006 0.0017 0.3685 0.0058 0.0031 0.0328
ρk,k-1 0.6410 0.0245 <0.0001 0.6952 0.0392 <0.0001σ2
ijk 0.0296 0.0020 <0.0001 0.0208 0.0026 <0.0001a NEAR, distance class for trees situated from 1 to 6 m from the closest ditch; FAR, from 6 to 16 m
from the closest ditch; σ2j, plot-level variance; σ2
jk, variance of plot × time interaction; σ2ij, tree-level
variance; ρk,k-1, autoregressive (first order) correlation coefficient; σ2ijk, variance of growth observations
within a tree; see table 1 for other parameter descriptions.
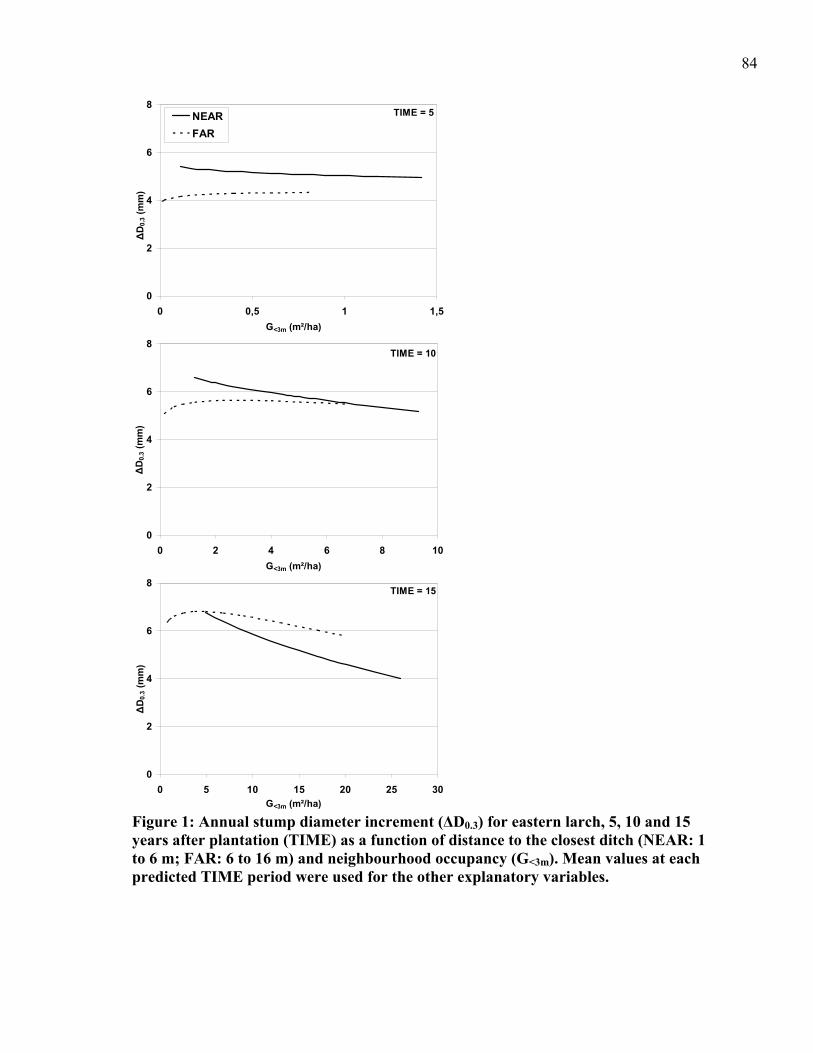
84
0
2
4
6
8
0 0,5 1 1,5
NEARFAR
0
2
4
6
8
0 2 4 6 8 10
0
2
4
6
8
0 5 10 15 20 25 30
G<3m (m²/ha)
G<3m (m²/ha)
G<3m (m²/ha)
TIME = 5
TIME = 15
TIME = 10
ΔD
0.3 (
mm
)Δ
D0.
3 (m
m)
ΔD
0.3 (
mm
)
Figure 1: Annual stump diameter increment (ΔD0.3) for eastern larch, 5, 10 and 15 years after plantation (TIME) as a function of distance to the closest ditch (NEAR: 1 to 6 m; FAR: 6 to 16 m) and neighbourhood occupancy (G<3m). Mean values at each predicted TIME period were used for the other explanatory variables.
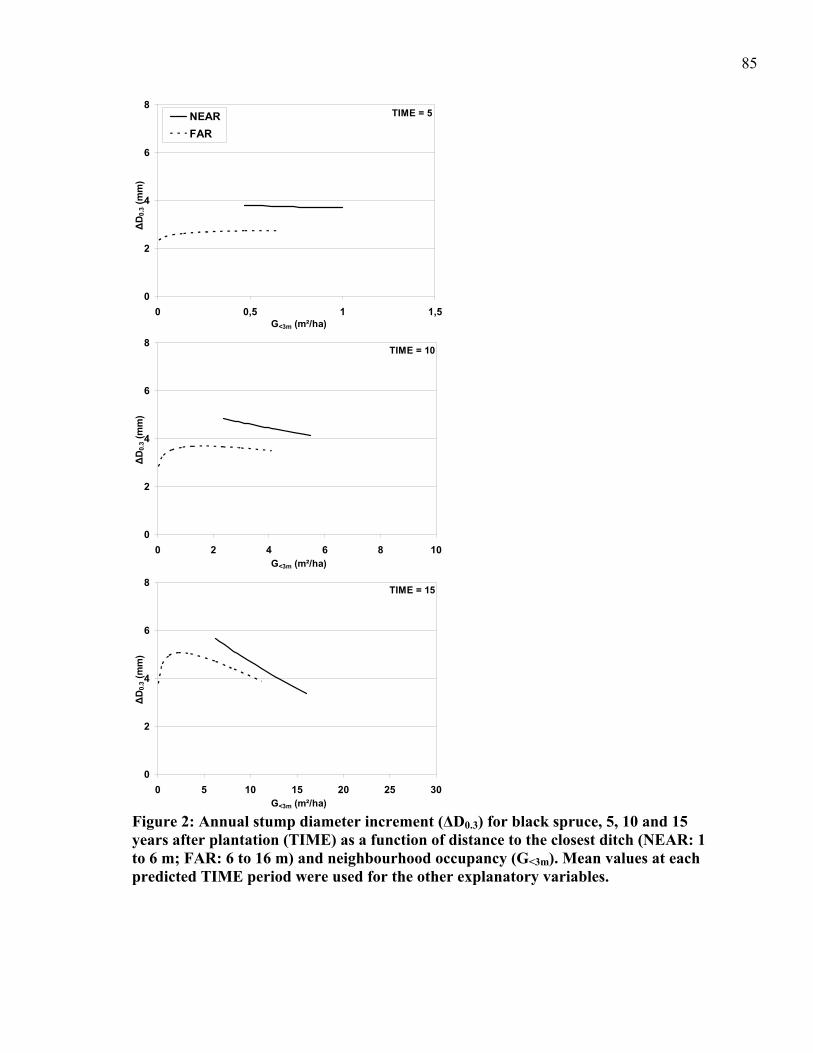
85
0
2
4
6
8
0 0,5 1 1,5
NEARFAR
0
2
4
6
8
0 2 4 6 8 10
0
2
4
6
8
0 5 10 15 20 25 30
ΔD
0.3 (
mm
)
G<3m (m²/ha)
G<3m (m²/ha)
G<3m (m²/ha)
ΔD
0.3 (
mm
)Δ
D0.
3 (m
m)
TIME = 5
TIME = 10
TIME = 15
Figure 2: Annual stump diameter increment (ΔD0.3) for black spruce, 5, 10 and 15 years after plantation (TIME) as a function of distance to the closest ditch (NEAR: 1 to 6 m; FAR: 6 to 16 m) and neighbourhood occupancy (G<3m). Mean values at each predicted TIME period were used for the other explanatory variables.
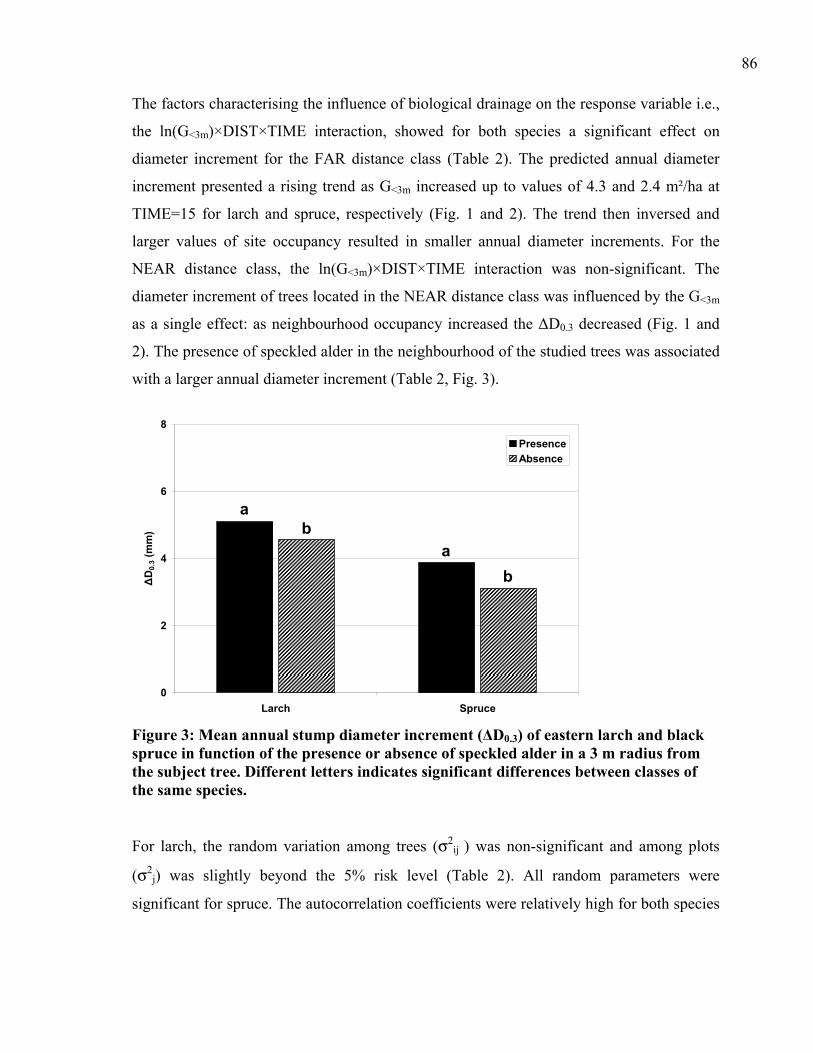
86
The factors characterising the influence of biological drainage on the response variable i.e.,
the ln(G<3m)×DIST×TIME interaction, showed for both species a significant effect on
diameter increment for the FAR distance class (Table 2). The predicted annual diameter
increment presented a rising trend as G<3m increased up to values of 4.3 and 2.4 m²/ha at
TIME=15 for larch and spruce, respectively (Fig. 1 and 2). The trend then inversed and
larger values of site occupancy resulted in smaller annual diameter increments. For the
NEAR distance class, the ln(G<3m)×DIST×TIME interaction was non-significant. The
diameter increment of trees located in the NEAR distance class was influenced by the G<3m
as a single effect: as neighbourhood occupancy increased the ΔD0.3 decreased (Fig. 1 and
2). The presence of speckled alder in the neighbourhood of the studied trees was associated
with a larger annual diameter increment (Table 2, Fig. 3).
0
2
4
6
8
Larch Spruce
ΔD
0.3 (
mm
)
PresenceAbsence
ab
ab
Figure 3: Mean annual stump diameter increment (ΔD0.3) of eastern larch and black spruce in function of the presence or absence of speckled alder in a 3 m radius from the subject tree. Different letters indicates significant differences between classes of the same species. For larch, the random variation among trees (σ2
ij ) was non-significant and among plots
(σ2j) was slightly beyond the 5% risk level (Table 2). All random parameters were
significant for spruce. The autocorrelation coefficients were relatively high for both species
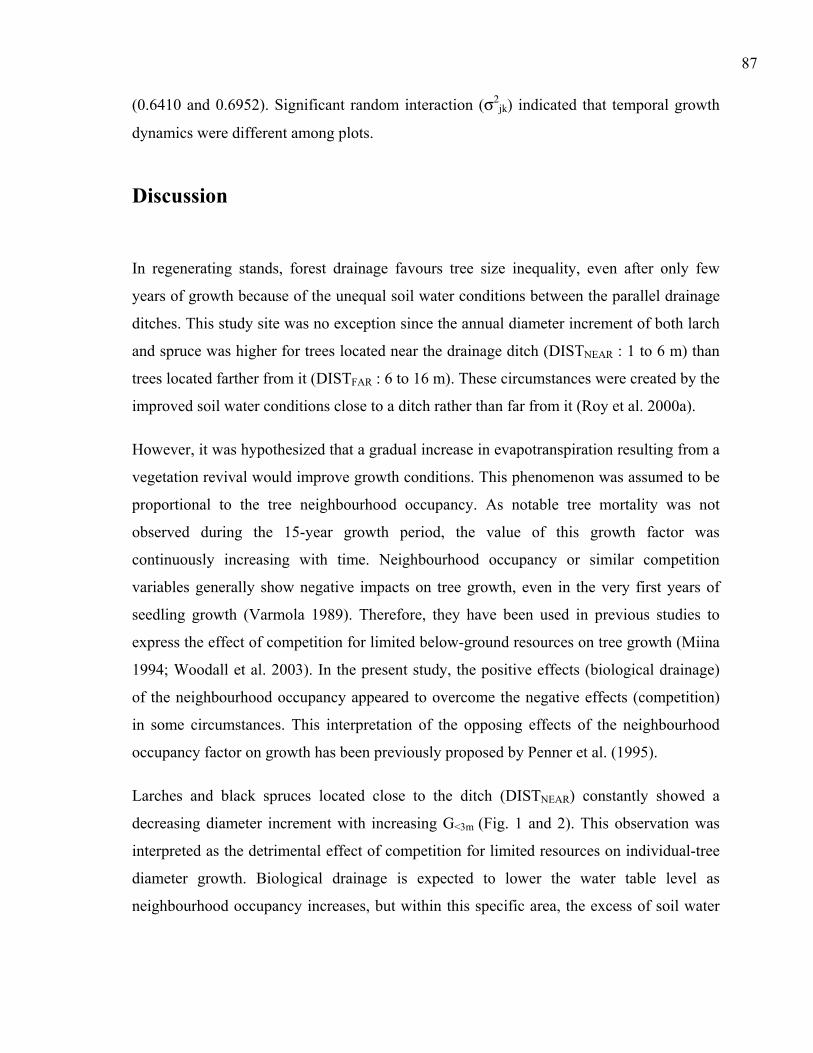
87
(0.6410 and 0.6952). Significant random interaction (σ2jk) indicated that temporal growth
dynamics were different among plots.
Discussion
In regenerating stands, forest drainage favours tree size inequality, even after only few
years of growth because of the unequal soil water conditions between the parallel drainage
ditches. This study site was no exception since the annual diameter increment of both larch
and spruce was higher for trees located near the drainage ditch (DISTNEAR : 1 to 6 m) than
trees located farther from it (DISTFAR : 6 to 16 m). These circumstances were created by the
improved soil water conditions close to a ditch rather than far from it (Roy et al. 2000a).
However, it was hypothesized that a gradual increase in evapotranspiration resulting from a
vegetation revival would improve growth conditions. This phenomenon was assumed to be
proportional to the tree neighbourhood occupancy. As notable tree mortality was not
observed during the 15-year growth period, the value of this growth factor was
continuously increasing with time. Neighbourhood occupancy or similar competition
variables generally show negative impacts on tree growth, even in the very first years of
seedling growth (Varmola 1989). Therefore, they have been used in previous studies to
express the effect of competition for limited below-ground resources on tree growth (Miina
1994; Woodall et al. 2003). In the present study, the positive effects (biological drainage)
of the neighbourhood occupancy appeared to overcome the negative effects (competition)
in some circumstances. This interpretation of the opposing effects of the neighbourhood
occupancy factor on growth has been previously proposed by Penner et al. (1995).
Larches and black spruces located close to the ditch (DISTNEAR) constantly showed a
decreasing diameter increment with increasing G<3m (Fig. 1 and 2). This observation was
interpreted as the detrimental effect of competition for limited resources on individual-tree
diameter growth. Biological drainage is expected to lower the water table level as
neighbourhood occupancy increases, but within this specific area, the excess of soil water
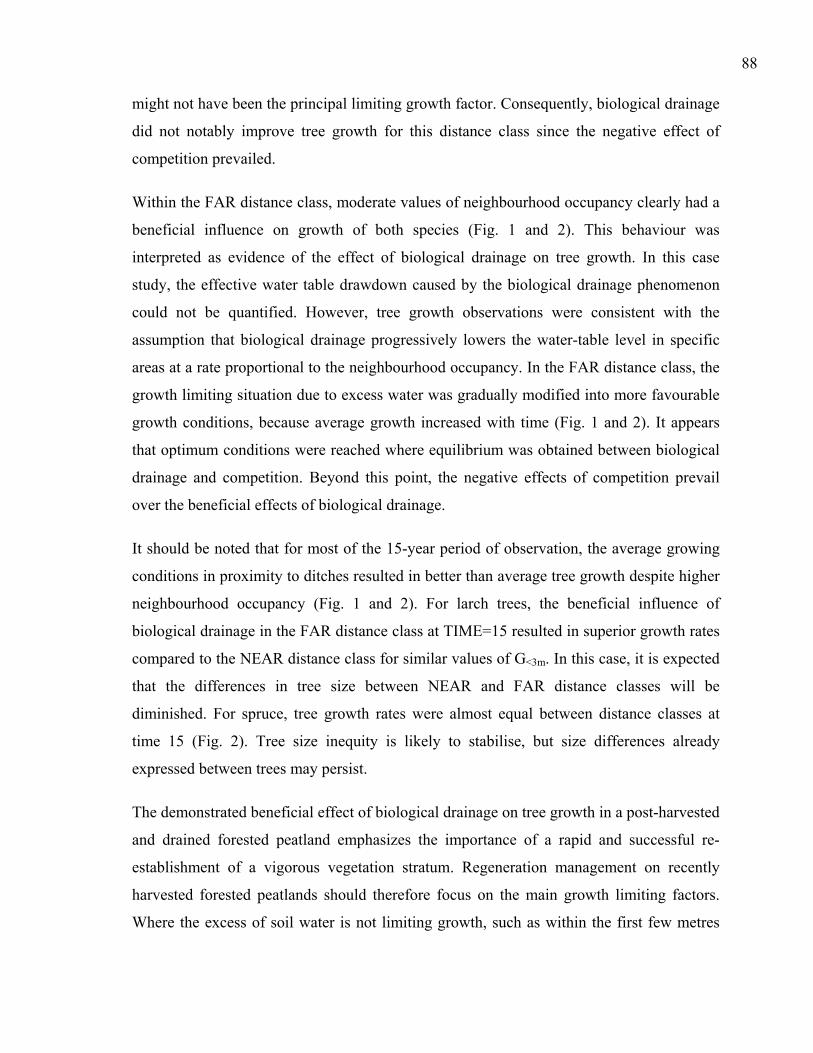
88
might not have been the principal limiting growth factor. Consequently, biological drainage
did not notably improve tree growth for this distance class since the negative effect of
competition prevailed.
Within the FAR distance class, moderate values of neighbourhood occupancy clearly had a
beneficial influence on growth of both species (Fig. 1 and 2). This behaviour was
interpreted as evidence of the effect of biological drainage on tree growth. In this case
study, the effective water table drawdown caused by the biological drainage phenomenon
could not be quantified. However, tree growth observations were consistent with the
assumption that biological drainage progressively lowers the water-table level in specific
areas at a rate proportional to the neighbourhood occupancy. In the FAR distance class, the
growth limiting situation due to excess water was gradually modified into more favourable
growth conditions, because average growth increased with time (Fig. 1 and 2). It appears
that optimum conditions were reached where equilibrium was obtained between biological
drainage and competition. Beyond this point, the negative effects of competition prevail
over the beneficial effects of biological drainage.
It should be noted that for most of the 15-year period of observation, the average growing
conditions in proximity to ditches resulted in better than average tree growth despite higher
neighbourhood occupancy (Fig. 1 and 2). For larch trees, the beneficial influence of
biological drainage in the FAR distance class at TIME=15 resulted in superior growth rates
compared to the NEAR distance class for similar values of G<3m. In this case, it is expected
that the differences in tree size between NEAR and FAR distance classes will be
diminished. For spruce, tree growth rates were almost equal between distance classes at
time 15 (Fig. 2). Tree size inequity is likely to stabilise, but size differences already
expressed between trees may persist.
The demonstrated beneficial effect of biological drainage on tree growth in a post-harvested
and drained forested peatland emphasizes the importance of a rapid and successful re-
establishment of a vigorous vegetation stratum. Regeneration management on recently
harvested forested peatlands should therefore focus on the main growth limiting factors.
Where the excess of soil water is not limiting growth, such as within the first few metres
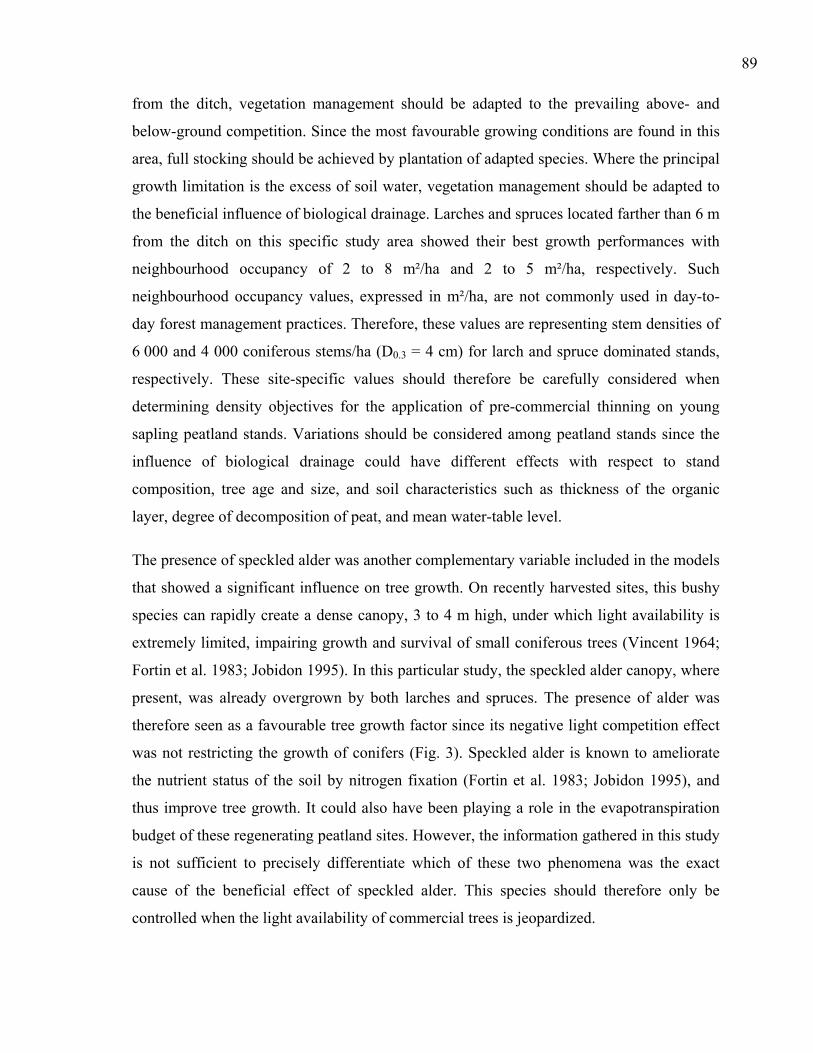
89
from the ditch, vegetation management should be adapted to the prevailing above- and
below-ground competition. Since the most favourable growing conditions are found in this
area, full stocking should be achieved by plantation of adapted species. Where the principal
growth limitation is the excess of soil water, vegetation management should be adapted to
the beneficial influence of biological drainage. Larches and spruces located farther than 6 m
from the ditch on this specific study area showed their best growth performances with
neighbourhood occupancy of 2 to 8 m²/ha and 2 to 5 m²/ha, respectively. Such
neighbourhood occupancy values, expressed in m²/ha, are not commonly used in day-to-
day forest management practices. Therefore, these values are representing stem densities of
6 000 and 4 000 coniferous stems/ha (D0.3 = 4 cm) for larch and spruce dominated stands,
respectively. These site-specific values should therefore be carefully considered when
determining density objectives for the application of pre-commercial thinning on young
sapling peatland stands. Variations should be considered among peatland stands since the
influence of biological drainage could have different effects with respect to stand
composition, tree age and size, and soil characteristics such as thickness of the organic
layer, degree of decomposition of peat, and mean water-table level.
The presence of speckled alder was another complementary variable included in the models
that showed a significant influence on tree growth. On recently harvested sites, this bushy
species can rapidly create a dense canopy, 3 to 4 m high, under which light availability is
extremely limited, impairing growth and survival of small coniferous trees (Vincent 1964;
Fortin et al. 1983; Jobidon 1995). In this particular study, the speckled alder canopy, where
present, was already overgrown by both larches and spruces. The presence of alder was
therefore seen as a favourable tree growth factor since its negative light competition effect
was not restricting the growth of conifers (Fig. 3). Speckled alder is known to ameliorate
the nutrient status of the soil by nitrogen fixation (Fortin et al. 1983; Jobidon 1995), and
thus improve tree growth. It could also have been playing a role in the evapotranspiration
budget of these regenerating peatland sites. However, the information gathered in this study
is not sufficient to precisely differentiate which of these two phenomena was the exact
cause of the beneficial effect of speckled alder. This species should therefore only be
controlled when the light availability of commercial trees is jeopardized.
90
The use of a retrospective diameter increment analysis was deemed an appropriate
approach to show the effect of biological drainage on tree growth. The unique data used in
this study provided a wide range of competition situations and soil water conditions that
were reflected in the growth dynamics of individual trees. To some extent, the results
obtained were conditional to the choices made during model building, such as the selection
of the variables and their transformations. These adjustments were intentionally made to
enable the verification of the biological drainage hypothesis. The final models
demonstrated logical behaviour and optimal fit with the data in terms of statistical
measures. Moreover, the diameter increment models showed similar reactions of tree
growth to the same explanatory variables used in other drained peatland growth models
(Miina 1994; Hökkä et al. 1997; Hökkä & Groot 1999). Prior to our study, Penner et al.
(1995) were the first to show that neighbouring trees can have a beneficial effect on tree
growth in mature forested peatland stands. They also stressed the importance of separating
the positive and negative effects of competition in forested peatlands growth models. The
differentiation of the varying effect of the neighbourhood occupancy with distance to the
ditch has been a key issue in this study to demonstrate of the existence of biological
drainage in a regenerating drained peatland stand.
In an adapted post-harvest management scenario, drainage could be used to re-establish the
favourable vegetation water-table interaction that prevailed prior to harvesting of forested
peatland stands. Hypothetically, a successfully regenerated site should eventually benefit
from biological drainage up to a point where the water-table level will be mainly regulated
by the vegetation, therefore decreasing the utility of ditches. In such a case, ditch
maintenance, an operation that destroys all the treed vegetation in the first few meters on
the sides of the ditches, would be unnecessary.
In the province of Quebec, Canada, forest drainage is at the moment mainly restricted to
post-harvested stands (Prévost et al. 2001). The state of knowledge concerning this
treatment in north-American boreal forests is restricted to a short period of time. Our study
site consisted of a small section of the oldest and largest Canadian post-harvested drainage
experimental area located in boreal forest. It was established using the latest equipment and
91
methods (Päivänen and Wells 1978) that have not changed since. Consequently, the data
collected is representative of operational methods actually used in forested peatland stands.
Furthermore, the ecological characteristics of the study site were representative of post-
harvested eastern boreal peatlands that respond adequately to drainage (Jutras et al. 2002).
However, this case-study is among the first successful attempts describing the beneficial
growth effect of biological drainage on a forested peatland site. Important aspects
concerning the complex mechanisms affecting the relationship between vegetation, soil and
water are still unknown and further investigation is needed.
Conclusion
This study revealed a complex growth pattern of post-harvested drained peatland stands
that was not previously reported in other forested peatlands growth model. The opposing
effects of the neighbourhood occupancy factor on growth were essential to describe the
situation observed in the present study. The favourable effect of neighbourhood occupancy,
biological drainage, was demonstrated for specific situations where the excess of soil water
is limiting growth. Near the ditch, the water-table might not have been the main limiting
growth factor. This explains why the effect of biological drainage on growth could not be
demonstrated there while evidence of competition was observed. This study highlights the
need for a rapid and successful re-establishment of a vigorous vegetation stratum in post-
harvested peatland stands. Regeneration management objectives should therefore consider
the main limiting growth factors as guidelines for silvicultural treatment applications.
92
Acknowledgements
The authors would like pay tribute to Dr. Hassan Ali Bolghari (1938-1992), who
established in 1983 the innovative experimental area where the study was performed. This
research was supported by the Quebec Ministry of Natural resources and Wildlife and Les
Chantiers de Chibougamau Ltée. throught the ‘Programme de mise en valeur des
ressources du milieu forestier – Volet 1’. The first author was financially supported by a
doctoral scholarship from FQRNT (Fonds québecois de la recherche sur la nature et les
technologies). We thank Gaétan Daigle, Marie-Claude Lambert, and Virpi Alenius for their
statistical support and Dr. Qing-Lai Dang and two anonymous reviewers for their
constructive comments on earlier version of the manuscript.
References
Ahti, E. and Päivänen, J. 1997. Response of stand growth and water table level to maintenance of ditch networks within forest drainage areas. In: Trettin, C.C., Jurgensen, M.F., Grigal, D.F., Gale, M.R. and Jeglum, J.K. (eds) Northern forested wetlands: ecology and management. Lewis Publishers, CRC Press. pp. 449-457.
Ahti, E., Konstantinov, V.K., Nousiainen, H., and Tikhonov, S. 2004. Long-term development of drained peatland forests in Roshino, north-west Russia. In : Päivänen, J. 2004. Proceeding of the 12th International peat Congress : “Wise use of peatlands”, Volume 1, Oral presentations. June 2004, Tampere, Finland.
Aust, W.M., Schoenholtz, S.H., Zaebst, T.W., and Szabo, B.A. 1997. Recovery status of a tupelo-cypress wetland seven years after disturbance: silvicultural implications. For. Ecol. Manage. 90: 161-169.
Bergeron, J.F., Grondin, P., and Blouin, J. 1998. Rapport de classification écologique du sous-domaine bioclimatique de la pessière à mousses de l’ouest. Ministère des Ressources naturelles du Québec, Direction des inventaires forestiers. 178 p. (In French).
Berry, G.J., and Jeglum, J.K. 1991. Hydrology of drained and undrained black spruce peatlands: groundwater table profiles and fluctuations. For. Can., Ont. Region, Sault Ste. Marie, Ont. COFRDA Rep. 3307. 31 p.
93
Biging, G.S., and Dobertin, M. 1992. A comparison of distance-dependent competition measures for height and basal area growth of individual conifer trees. For. Sci. 38: 695-720.
Biging, G.S., and Dobertin, M. 1995. Evaluation of competition indices in individual tree growth models. For. Sci. 41: 360-377.
Bolghari, H., and Veilleux, J.-M. 1987. Évaluation du drainage forestier comme technique de préparation du terrain pour régénérer par différentes méthodes (plantions, ensemencements naturels et artificiels) les pessières noires humides récemment exploitées. Projet R82315. Ministère de l’Énergie et des Ressources, Quebec.
Braekke, F.H. 1983. Water table levels at different drainage intensities on deep peat in northern Norway. For. Ecol. Manage. 5: 169-192.
Campbell, J.A. 1980. Oxygen flux measurements in organic soils. Can. J. Soil Sci. 60: 641-650
Canada Soil Survey Committee. 1978. The Canadian system of soil classification. Can. Dep. Agric., Ottawa, Ont., Publ. 1646. 164 p.
Dubé, S., and Plamondon, A.P. 1995. Relative importance of interception and transpiration changes causing watering-up after clearcutting on four wet sites. Intern. Ass. Sci. Hydrol, Boulder Symposium. Publ. 230: 113-120.
Dubé, S., Plamondon, A.P., and Rothwell, R.L. 1995. Watering-up after clear-cutting on forested wetlands of the St. Lawrence lowland. Water Resour. Res. 31: 1741-1750.
Environment Canada. 2004. Canadian climate normals 1971-2000. Atmospheric Environment Service, Downsview, Ontario, Canada. http://www.climat.meteo.ec.gc.ca/climate_normals/results_f.html.
Flewelling J.W., and Pienaar, L.V. 1981. Multiplicative regression with lognormal errors. For. Sci. 27(2): 281-289.
Fortin, A., Chatarpaul, L., and Carlisle, A. 1983. The role of nitrogen fixation in intensive forestry in Canada. Part I: Principles, practice and potential. Environ. Can., Can. For. Serv., Petawawa Nat. For. Inst., Inf. Rep. PI-X-28.
Heikurainen, L. 1963. On using ground water table fluctuations for measuring evapotranspiration. Acta For. Fenn. 76(5): 1–16.
Heikurainen, L. 1964. Improvement of forest growth on poorly drained peat soils. Int. Rev. For. Res. 1. Academic Press, New York. pp. 39-113.
94
Heikurainen, L., and Päivänen, J. 1970. The Effect of Thinning, Clear Cutting and Fertilization on the Hydrology of Peatland Drained for Forestry. Acta For. Fenn. 104: 1-23.
Hillman, G.R. 1992. Some hydrological effects of peatland drainage in Alberta’s boreal forest. Can. J. For. Res. 22: 1588-1596.
Hökkä, H., and Groot, A. 1999. An individual-tree basal area growth model for black spruce in second-growth peatland stands. Can. J. For. Res. 29: 621-629.
Hökkä, H., and Ojansuu, R. 2004. Height development of Scots pine on peatlands: describing change in site productivity with a site index model. Can. J. For. Res. 34: 1081-1092.
Hökkä, H., Alenius, V., and Penttilä, T. 1997. Individual-tree basal area growth models for Scots pine, Norway spruce and pubescent birch on drained peatlands in Finland. Silva Fennica 31(2): 161-178.
Jobidon, R. 1995. Autecologie de quelques espèces de compétition d’importance pour la régénération forestière au Québec. Revue de littérature. Mémoire de recherche forestière no 177. Direction de la recherche forestière. Ministère des Ressources naturelles. Québec. Canada. 180 p.
Jones, R.K., Pierpoint, G., Wickware, G.M., Jeglum, J.K., Arnup, R.W., and Bowles, J.M. 1983. Field guide to forest ecosystem classification for the Clay Belt, site Region 3e. Ontario Ministry of Natural Ressources, Maple, Ontario. 123 p.
Jutras, S., Bégin, J., and Plamondon, A.P. 2002. Impact du drainage forestier après coupe sur la croissance de l’épinette noire en forêt boréale. Can. J. For. Res. 32 : 1585-1596. (In French).
Jutras, S., Bégin, J., and Plamondon, A.P. 2004. Illustration of biological drainage in forested peatlands by spatially explicit single-tree growth modelling. In: Päivänen, J. 2004. Proceeding of the 12th International Peat Congress: “Wise use of peatlands”, Volume 1, Oral presentations. June 2004, Tampere, Finland.
Kozlowski, T.T. 1997. Responses of woody plants to flooding and salinity. Online, http://www.heronpublishing.com/tp/monograph/kozlowski.pdf
Landhäusser, S.M., Silins, U., Lieffers, V.J., and Liu, W. 2003a. Response of Populus tremuloides, Populus balsamifera, Betula papyrifera and Picea glauca seedlings tp low soil temperature and water-logged soil conditions. Scand. J. For. Res. 18: 391-400.
Landhäusser, S.M., Lieffers, V.J., and Silins, U. 2003b. Utilizing pioneer species as a hydrological nurse crop to lower water table for reforestation of poorly drained boreal sites. Ann. For. Sci. 60: 741-748.
95
Lauhanen, R., and Ahti, E. 2002. Effects of maintaining ditch networks on the development of Scots pine stands. Suo 52(1): 29-38.
Lieffers, V.J. 1988. Sphagnum and cellulose decomposition in drained and natural areas of an Alberta peatland. Can. J. Soil Sci. 755-761.
Lieffers, V.J., and Macdonald, S.E. 1990. Growth and foliar nutrient status of black spruce and tamarack in relation to depth of water table in some Alberta peatlands. Can. J. For. Res. 20: 805-809.
Lieffers, V.J., and Rothwell, R.L. 1986. Effects of depth of water table and substrate temperature on root and top growth of Picea mariana and Larix laricina seedlings. Can. J. For. Res. 16: 1201-1206.
Lieffers, V.J., and Rothwell, R.L. 1987. Rooting of peatland black spruce and tamarack in relation to depth of water table. Can. J. Bot. 65: 817-821.
Livesley, S.J., Gregory, P.J., and Buresh, R.J. 2004. Competition in tree row agroforestry systems. 3. Soil water distribution and dynamics. Plant and Soil. 264: 129-139.
McLaren, B.E., and Jeglum, J.K. 1998. Black spruce growth and foliar nutrient responses to drainage and fertilisation: Wally Creek, Ontario. For. Chron. 74: 106-115.
Miina, J. 1994. Spatial growth model for Scots pine on drained peatland. Silva Fennica 28(1): 15-27.
Opie, J. 1968. Predictability of individual tree growth using various definitions of competing basal area. For. Sci. 14(3): 314-323.
Paavilainen, E., and Päivänen, J. 1995. Peatland forestry: ecology and principles. Springer-Verlag, Berlin. 248 p.
Päivänen, J. and Wells, E.D. 1978. Guidelines for the development of peatland drainage systems for forestry in Newfoundland. Can. For. Serv. Inf. Rep. N-X-156. 44 p.
Penner, M., Penttilä, T., and Hökkä, H. 1995. A method for using random parameters in analyzing permanent sample plots. Silva Fennica 29(4): 287-296.
Ponnamperuma, F.N. 1972. The chemistry of submerged soil. Adv. Agron. 24: 29-96.
Pothier, D., Prévost, M., and Auger, I. 2003. Using the shelterwood method to mitigate water table rise after forest harvesting. For. Ecol. Manage. 179 : 573-583.
Prévost, M., Belleau, P., and Plamondon, A.P. 1997. Substrate conditions in a treed peatland: Responses to drainage. Écoscience 4(4): 543-554.
Prévost, M., Plamondon, A.P., and Belleau, P. 1999. Effects of drainage of a forested peatland on water quality and quantity. J. Hydrol. 214: 130-143.
96
Prévost, M., Plamondon, A.P., and Roy, V. 2001. La production forestière. In: Payette, S., and Rochefort, L. (eds) Écologie des tourbières du Québec-Labrador. Les Presses de l'Université Laval. pp. 423-447. (In French).
Roy, V., Jeglum, J.K., and Plamondon, A.P. 1997. Water table Fluctuations Following Clearcutting and Thinning on Wally Creek Wetlands. In: Trettin, C.C., Jurgensen, M.F., Grigal, D.F., Gale, M.R., and Jeglum, J.K. (eds) Northern forested wetlands : ecology and management. Lewis Publishers, CRC Press. pp. 239-251.
Roy, V., Plamondon, A.P., and Bernier, P. 2000a. Draining forested wetland cutovers to improve seedling root zone conditions. Scan. J. For. Res. 15: 58-67.
Roy, V., Plamondon, A.P., and Bernier, P. 2000b. Influence of vegetation removal and regrowth on interception and water table level on wetlands. International Peat Journal. 10: 3-12.
SAS Institute Inc. 1999. SAS OnlineDoc®, Version8. SAS Institute Inc. Cary, NC, USA.
Seppälä, K. 1972. Ditch spacing as a regulator of post-drainage stand development in spruce and pine swamps. Acta For. Fenn. Vol. 125. 23 p.
Sun, G., McNulty, S.G., Shepard, J.P., Amatya, D.M., Riekerk, H., Comerford, N.B., Skaggs, W., and Swift, Jr L. 2001. Effects of timber management on the hydrology of wetland forests in the southern United States. For. Ecol. Manage. 143: 227-236.
Varmola, M. 1989. Männyn istutustaimikoiden lustonleveysmalli. Asbtarct: A model for ring width of planted Scots pine. Silva Fenn. 23(4): 259-269. (In Finnish with English Abstract).
Vincent, A.B. 1964. Growth and numbers of speckled alder following logging of black spruce peatlands. For. Chron. 40: 514-518.
Woodall, C.W., Fiedler, C.E., and Milner, K.S. 2003. Intertree competition in uneven-aged ponderosa pine stands. Can. J. For. Res. 33: 1719-1726.
Xu, Y.-J., Burger, J.A., Aust, W.M., Patterson, S.C., Miwa, M., and Preston, D.P. 2002. Changes in surface water table depth and soil physical properties after harvest and establishment of loblolly pine (Pinus taeda L.) in Atlantic coastal plain wetlands of South Carolina. Soil & Tillage Res. 63: 109-121.
Zhao, C., Wang, Y., Song, Y., and Li, B. 2004. Biological drainage characteristics of alakalized desert soils in north-western China. J. Arid Env. 56: 1-9.

CHAPTER 5
Influence of intra- and inter-specific competition on black spruce growth in post-harvest drained forested peatlands
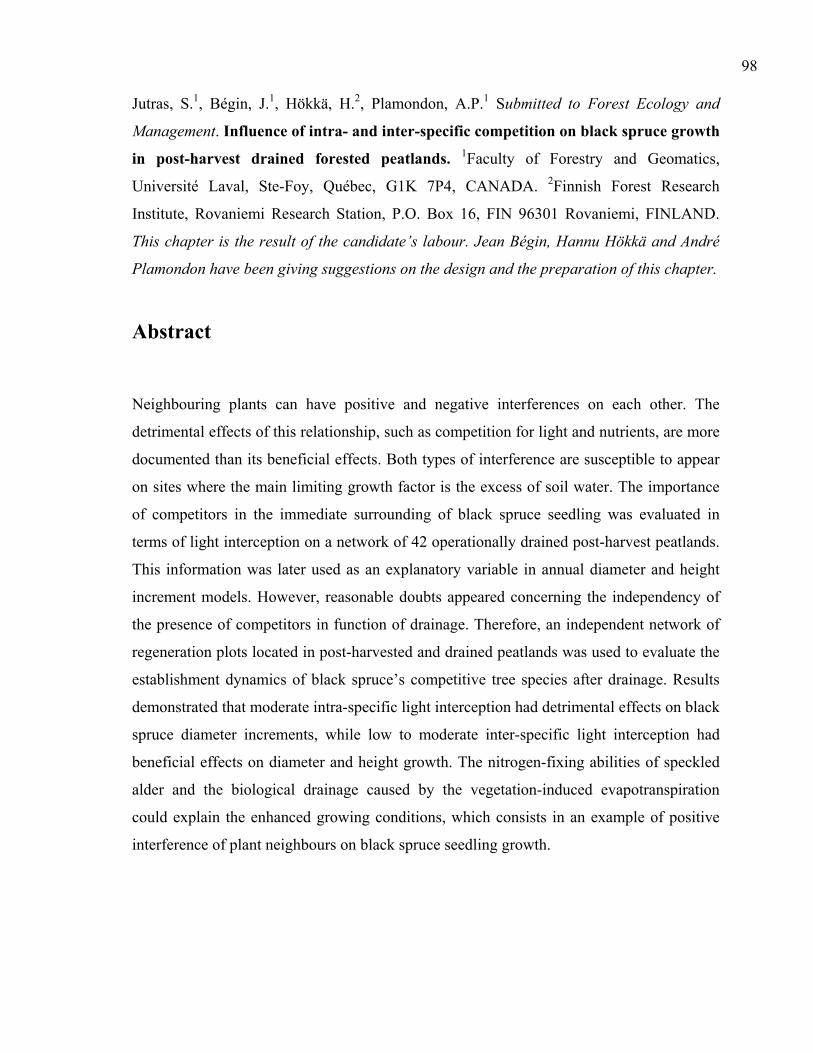
98
Jutras, S.1, Bégin, J.1, Hökkä, H.2, Plamondon, A.P.1 Submitted to Forest Ecology and
Management. Influence of intra- and inter-specific competition on black spruce growth
in post-harvest drained forested peatlands. 1Faculty of Forestry and Geomatics,
Université Laval, Ste-Foy, Québec, G1K 7P4, CANADA. 2Finnish Forest Research
Institute, Rovaniemi Research Station, P.O. Box 16, FIN 96301 Rovaniemi, FINLAND.
This chapter is the result of the candidate’s labour. Jean Bégin, Hannu Hökkä and André
Plamondon have been giving suggestions on the design and the preparation of this chapter.
Abstract
Neighbouring plants can have positive and negative interferences on each other. The
detrimental effects of this relationship, such as competition for light and nutrients, are more
documented than its beneficial effects. Both types of interference are susceptible to appear
on sites where the main limiting growth factor is the excess of soil water. The importance
of competitors in the immediate surrounding of black spruce seedling was evaluated in
terms of light interception on a network of 42 operationally drained post-harvest peatlands.
This information was later used as an explanatory variable in annual diameter and height
increment models. However, reasonable doubts appeared concerning the independency of
the presence of competitors in function of drainage. Therefore, an independent network of
regeneration plots located in post-harvested and drained peatlands was used to evaluate the
establishment dynamics of black spruce’s competitive tree species after drainage. Results
demonstrated that moderate intra-specific light interception had detrimental effects on black
spruce diameter increments, while low to moderate inter-specific light interception had
beneficial effects on diameter and height growth. The nitrogen-fixing abilities of speckled
alder and the biological drainage caused by the vegetation-induced evapotranspiration
could explain the enhanced growing conditions, which consists in an example of positive
interference of plant neighbours on black spruce seedling growth.
99
Résumé
Les plantes voisines peuvent avoir des interférences positives et négatives sur leur
croissance respective. Les effets nuisibles de ce voisinage, tel que la compétition pour la
lumière et les nutriments, sont plus documentés que ses effets bénéfiques. Ces deux types
d’interférences sont susceptibles d’être présents sur les sites où le principal facteur limitant
la croissance est l’excès d’eau du sol. L’importance des compétiteurs dans le voisinage
immédiat de semis naturels d’épinette noire a été évaluée en terme d’obstruction lumineuse
sur un réseau de 42 tourbières forestières récemment récoltées et drainées. Cette
information a ensuite été utilisée comme variable explicative dans des modèles
d’accroissement annuel en diamètre et en hauteur. Toutefois, des doutes raisonnables
apparaissaient à propos de l’indépendance de la présence de compétiteurs par rapport au
drainage. Un réseau indépendant de parcelles de régénération localisé dans des tourbières
forestières récoltées et drainées a alors été utilisé afin évaluer la dynamique d’établissement
des espèces compétitrices de l’épinette noire à la suite du drainage. Les résultats ont
démontré qu’une interception lumineuse intra-spécifique modérée était nuisible à
l’accroissement en diamètre de l’épinette noire, tandis qu’une interception lumineuse inter-
spécifique allant de légère à modérée était favorable à la croissance en diamètre et en
hauteur. Les propriétés fixatrices d’azote de l’aulne rugueux ainsi que le drainage
biologique causé par l’évapotranspiration provenant de la végétation expliqueraient
l’amélioration des conditions de croissance, ce qui constituerait un exemple d’interférence
positive du voisinage sur la croissance de l’épinette noire.
100
Introduction
Harvesting activities on undrained forested peatlands are known to create problems of
water-table rise (Dubé et al. 1995; Roy et al. 1997; Verry 1997). By reducing the rainfall
interception and transpiration (Dubé and Plamondon 1995), vegetation removal increases
soil water accumulation. Excess soil water restricts the growth of planted, recently
installed, or protected advance black spruce seedlings (Lieffers and Rothwell 1986, 1987;
Lieffers and Macdonald 1990). Such growth stagnation may last for decades (Bolghari
1986). Depending on the magnitude of watering-up, corrective treatments might be needed
to adequately regenerate post-harvest, waterlogged sites.
Forest drainage, when applied to recently harvested forested peatlands, can markedly lower
the water-table level (Roy et al. 2000). Implementation of drainage increases the root-
accessible soil volume, raises soil temperature and accelerates the decomposition of peat
soils (Prévost et al. 1997), while improving root zone conditions (Roy et al. 2000). This
situation enhances the growth of black spruce (Picea mariana (Mill.) B.S.P) (LeBarron and
Neetzel 1942; McLaren and Jeglum 1998; Macdonald and Yin 1999; Jutras et al. 2002), but
drainage is also expected to influence the growth of black spruce’s principal competitors.
Abundant intra- and inter-specific competition has been observed and reported in post-
harvest drained forested peatlands (LeBarron and Neetzel 1942; Hillman 1991; Jutras et al.
2002), but its influence on black spruce growth has never been directly evaluated. In the
forested peatlands of eastern boreal Canada, the principal tree species that compete with
black spruce are speckled alder (Alnus incana ssp. rugosa (Du Roi) J. Clausen), pussy
willow (Salix discolor Mühl.), trembling aspen (Populus tremuloides Michx.), white birch
(Betula papyrifera Marsh.), eastern larch (Larix laricina (Du Roi) K. Koch) and balsam fir
(Abies balsamea (L.) Mill.). Ericaceous shrubs, such as Labrador tea (Rhododendron
groenlandicum (Oeder) Kron & Judd; syn. Ledum groenlandicum Oeder) and sheep laurel
(Kalmia angustifolia L.) are also known to interfere with black spruce growth (Inderjit and
Mallik 1996, 1997, 2002; Mallik 2003).
101
Plant neighbours can have positive and negative interferences on each other, depending on
the species involved and the nature of the factors limiting growth. Positive interferences are
rare and often masked by more important negative interferences (Radosevich and
Osteryoung 1987). The few positive effects that are found in boreal forested peatland sites
include the association with speckled alder of nitrogen-fixing symbionts in the genus
Frankia, which is known to increase nitrogen availability in soils (Chatarpaul and Carlisle
1983; Fortin et al. 1985) and to favour growth of tree species, such as black spruce
(Jobidon 1995). Likewise, the evapotranspiration of vigorous neighbouring vegetation may,
in certain circumstances, diminish the adverse effects of excess soil water on tree growth.
This later positive interference of plant neighbours on waterlogged sites is referred to as
biological drainage (Paavilainen and Päivänen 1995; Penner et al. 1995; Jutras et al. 2004)
or hydrological nurse (Landhausser et al. 2003). Negative interferences in boreal forested
sites have been widely documented and they mostly refer to the limitation of light and
nutrients.
On mesic sites, the growth of planted black spruce seedlings is affected by both intra-
specific (Newton and Jolliffe 1998; Mailly et al. 2003) and inter-specific competition
(Wagner and Radosevich 1991; Morris and MacDonald 1991; MacDonald and Weetman
1993; Jobidon 1994; Wang et al. 2000; Noland et al. 2001; Jobidon et al. 2003). In each
situation, optimal growth was observed in the absence of competition. On one hand, intra-
specific competition is known to be very intense because closely related individuals must
exist in similar, if not identical, microenvironments (Radosevich and Osteryoung 1987). On
the other hand, different species interacting together in inter-specific competitive situations
are exerting influences on different parts of the environment, and may therefore more
equitably share available resources. However, the simultaneous consideration of both types
of competition in growth analysis is rare (Canham et al. 2004).
On the post-harvest and drained forested peatland sites that were studied by Jutras et al.
(2002), it was obvious that the tallest black spruce stems were found in moderate, above-
ground competitive situations. The importance of competition was therefore measured for
every black spruce seedling under study so that it could be used as an explanatory variable
102
in tree growth analysis. However, there was no way to determine precisely vegetational
composition when drainage was initiated. Black spruce found in competitive situations
could have exhibited higher growth rates because: a) they were located in especially fertile
micro-environments, where the establishment of other species was favoured; or b)
neighbours exerted a positive growth interference with them. Therefore, if drainage was
responsible for initiating competition with respect to ditch proximity, competition could not
be considered as an independent black spruce growth factor. Conversely, if establishment
dynamics of competitive tree species were not affected by drainage, competition could be
considered as an independent growth factor. Since there was no means of evaluating
competitive behaviour following drainage on the study area, competition had been omitted
from the analysis of black spruce growth by Jutras et al. (2002).
A 16-year-old experimental network of regeneration plots that had been established in post-
harvested and drained peatlands was located in the same ecological region as that in Jutras
et al. (2002). This area was used to evaluate the establishment dynamics of black spruce’s
competitive tree species after drainage. With the addition of this second study area,
independence between the presence of competition and drainage could be assessed. It was
then possible to evaluate simultaneously the beneficial and detrimental interferences of
neighbours on black spruce seedling growth in the Jutras et al. (2002) dataset. The
objective of the present study was to evaluate the positive and negative interferences of
different levels of competition on black spruce growth in post-harvest drained forested
peatlands.
103
Material and methods
Competition establishment dynamics study
The first part of this study describes establishment dynamics of the principal black spruce’s
competitive tree species on post-harvest, drained forested peatlands. Vegetational
composition of the network of regeneration plots, established before drainage operations,
was compared to their composition 16 years later. Three experimental sites that had been
established in 1985 were used: Hazeur (49°29’N, 74°38’W), Bruneau (49°22’N, 77°09’W)
and Dalet (49°14’N, 78°15’W). These sites were situated in the western black spruce-
mosses bioclimatic sub-domain, as were the majority of the study sites of Jutras et al.
(2002). Typical 30-year climate normals from the closest meteorological station (Chapais
2: 49°47'N, 74°51'W) were: 0.0 °C, mean annual air temperature; 1235 degree-days (over 5
°C); 961.3 mm, annual precipitation (Environment Canada 2004).
All of these experimental sites were dominated by black spruce before they were harvested
(whole-tree) in 1981 (Hazeur) and in 1983 (Dalet, Bruneau). Severe regeneration problems
were expected on these sites because of their poor natural soil drainage and the evidence of
watering-up, which occurred as a consequence of harvesting (Bolghari and Veilleux 1987);
consequently, they were drained experimentally in 1985. Ditch spacing varied from 30 to
60 m. The installation, marking and measurement of 200 circular regeneration plots (1.13
m radius = 4 m2) in each site took place in 1985, just prior to drainage. The plots were
systematically installed at 50 m intervals using parallel (Hazeur and Dalet) or randomly
oriented (Bruneau) transects, with random positioning of the first plot. These plots were
measured again in 1986 after the completion of ditching operations to assess the possible
destruction or modification of the vegetation and soils by the machinery. In 2002,
regeneration plots that were still available and undisturbed were remeasured using the same
inventory method. Overall, 85, 84 and 52 plots were remeasured for the Hazeur, Bruneau
and Dalet sites, respectively. Plots were unavailable for inventory in 2002 due to flooding
caused by beaver dams (195 plots), insufficient information that enabled the exact
104
relocation of the plot in the field (156 plots), and plot destruction during ditching operations
(28 plots).
The data collected in 1986 contained information about the soil and vegetation
characteristics of the individual plots. In keeping with the objectives of the present study,
only data related to black spruce’s competitive tree species was considered. In every plot,
the presence or absence of speckled alder, pussy willow, trembling aspen, white birch and
black spruce had been recorded. However, alder and willow had been lumped into one
category on the Dalet site. Since these two thicket-forming species have comparable sizes
and shapes (max. height ≈ 6 m, Farrar 1995), they were grouped together for all sites.
Trembling aspen and white birch also were grouped together, since their respective
occurrences were relatively infrequent and their role as competitors was expected to be
comparable on regenerating forested peatland sites. Eastern larch and balsam fir were
observed within the plots, but their occurrence (4 % and 3 %, respectively) was too low to
enable an adequate statistical analysis. Black spruce, considered as an intra-specific
competitor, was also taken into account.
In 2002, the presence-absence of alder-willow, aspen-birch and black spruce categories was
recorded in every accessible plot. The ecological description of each plot (Table 1) was
done at the same time using the operational group (OG) classification key of the Ontario
Forest Ecological Classification system (Jones et al. 1983). Ditches and remeasured plots
were located on the landscape using a March II® GPS handset (CMTinc, Corvallis, OR).
Differential correction was done later with PCGPS 3.7® software (CMTinc, Corvallis,
OR), with reference data coming from two different bases (49°56’N, 74°22’W and
48°15’N, 79°02’W). Distance of each plot to the closest ditch was determined using
ArcView GIS 3.2® (ESRI, Redlands, CA). Measured distances ranged from 1 to 30 m,
with a mean value of 13 m.
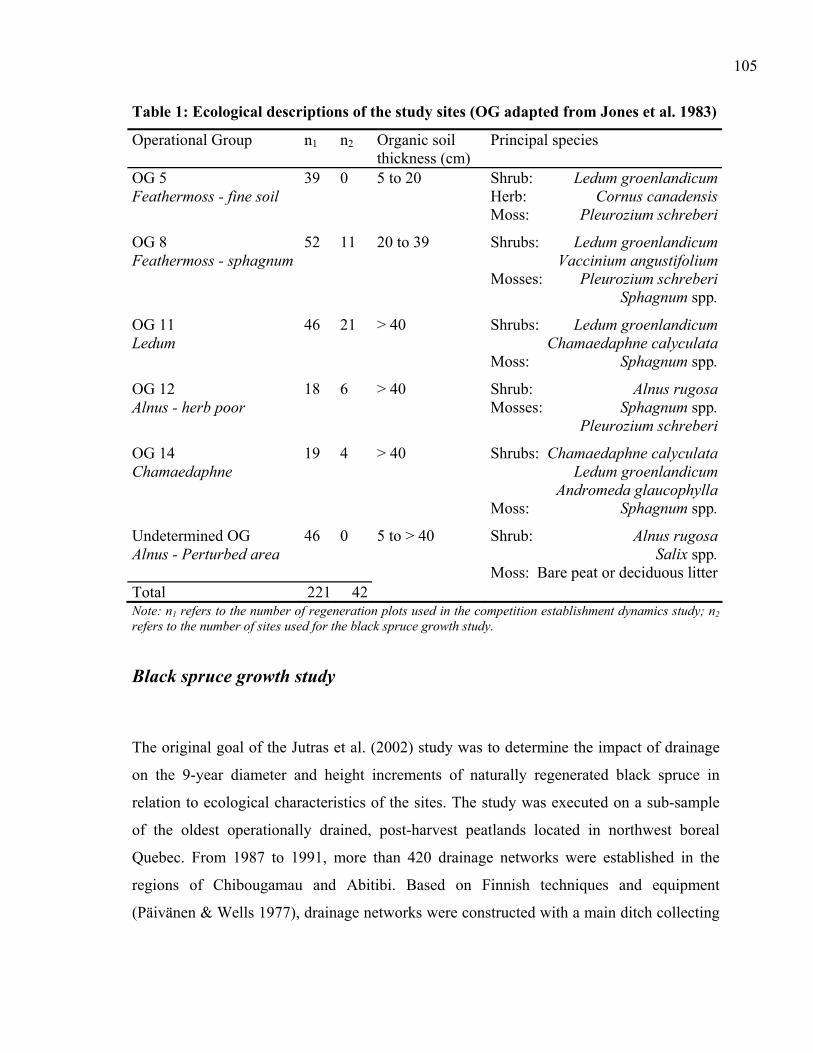
105
Table 1: Ecological descriptions of the study sites (OG adapted from Jones et al. 1983)
Operational Group n1 n2 Organic soil thickness (cm)
Principal species
OG 5 Feathermoss - fine soil
39 0 5 to 20
Shrub: Ledum groenlandicumHerb: Cornus canadensisMoss: Pleurozium schreberi
OG 8 Feathermoss - sphagnum
52 11 20 to 39
Shrubs: Ledum groenlandicum Vaccinium angustifoliumMosses: Pleurozium schreberi Sphagnum spp.
OG 11 Ledum
46 21 > 40
Shrubs: Ledum groenlandicum Chamaedaphne calyculataMoss: Sphagnum spp.
OG 12 Alnus - herb poor
18 6 > 40
Shrub: Alnus rugosa Mosses: Sphagnum spp. Pleurozium schreberi
OG 14 Chamaedaphne
19 4 > 40
Shrubs: Chamaedaphne calyculata Ledum groenlandicum Andromeda glaucophyllaMoss: Sphagnum spp.
Undetermined OG Alnus - Perturbed area
46 0 5 to > 40 Shrub: Alnus rugosa Salix spp.Moss: Bare peat or deciduous litter
Total 221 42 Note: n1 refers to the number of regeneration plots used in the competition establishment dynamics study; n2 refers to the number of sites used for the black spruce growth study.
Black spruce growth study
The original goal of the Jutras et al. (2002) study was to determine the impact of drainage
on the 9-year diameter and height increments of naturally regenerated black spruce in
relation to ecological characteristics of the sites. The study was executed on a sub-sample
of the oldest operationally drained, post-harvest peatlands located in northwest boreal
Quebec. From 1987 to 1991, more than 420 drainage networks were established in the
regions of Chibougamau and Abitibi. Based on Finnish techniques and equipment
(Päivänen & Wells 1977), drainage networks were constructed with a main ditch collecting
106
the water that was evacuated by several secondary ditches, which ran parallel to one
another and which were separated by 30 m. Ninety drainage networks were visited during
the 1999 and 2000 growing seasons. Evaluation of the study potential of each drainage
network was carried out based on three criteria: the uniformity of the growth conditions
throughout the drained area, the proximity of a similar undrained area that could be used as
a control, and the uninterrupted flow capacity of the ditches since drainage. This last aspect
was estimated by assuming a minimum ditch depth of 50 cm and an apparent capacity to
evacuate water, characterized by the absence of beaver dams or any misconception of
ditches, e.g.: inverse slope or disconnection to the network. Overall, 48 drainage networks
were retained for monitoring black spruce growth.
Black spruce growth was evaluated retrospectively using a method modified after Dang and
Lieffers (1989). Post-drainage tree growth was evaluated for paired drained and undrained
sites, which were selected for their proximity, their similar ecological characteristics and
their comparable pre-drainage growth rates. Undrained sites were located at least 100 m
from any drainage ditches. Based on paired pre-drainage tree growth comparisons, 9 out of
the 48 sites selected from Jutras et al. (2002) study were rejected. In 2004, establishment of
new control sites, followed by pre-drainage growth comparisons, allowed 3 out of the 9
rejected sites to be included in the database. For the present study, 42 pairs of drained-
undrained sites were used (Table 1).
On each drained site, growth was measured on the most dominant black spruce tree found
in each of the 24 circular plots (4 m²), which were situated along eight transects
perpendicular to the ditch. Transects were located at 5 m distances from one another, four
on either side of a ditch; three plots were located along the transects at 2.5, 7.5 and 12.5 m
from the ditch edge. On every control site, 12 plots of the same size were located in a 5 m
systematic grid within a 10 × 15 m area (see Jutras et al. 2002 for details).
Selected black spruce trees were felled at ground level to collect a wood disk, which was
later air-dried and sanded. Annual ring increments were measured along four radii with the
help of a digitizer and WinDendro™ software (Regent Instruments Inc., Ste.-Foy, Canada).
Annual diameter increments were calculated as two times the mean value of the four
107
measured ring widths. Annual black spruce height increments were measured by assessing
the lengths separating each annual whorl scars. Mean (±SD) diameter and height of study
trees were 20 ± 12 mm and 120 ± 74 cm, respectively.
Black spruce above-ground competition was assessed from the respective light interception
percentage (5 % classes) at mid-crown height offered by the two most important
competitive species. This measurement was done by the same evaluator for all selected
trees, as a visual estimate. Several studies have stressed the utility and accuracy of
predicting competition from rapid visual estimates over photosynthetically active radiation
(PAR) measurements (Wagner and Radosevich 1991, 1998; Ter-Mikaelian et al. 1999;
Wang et al. 2000). The visual estimates of light interception were considered appropriate
for the proportion of full sunlight intercepted by the canopy of competitive tree species
surrounding each black spruce targeted for study. The abundance of foliage blocking light
transmittance was also considered to be proportional to the amount of biomass found in the
area immediately surrounding the study trees. It was therefore assumed that these light
interception measurements would correlate with local evapotranspiration provided by the
vegetation.
For growth analysis, the type and intensity of light interception (LI) were described by a
single categorical variable. Intra-specific, mixed or inter-specific types of competition were
described as the proportion of light intercepted by black spruce (> 75 %, 74 to 25 % and
<25 %, respectively). The intensity of light interception was separated into three classes for
each type of competition: low (L, 5-30 % of total intercepted light), moderate (M, 35-60
%), and high (H, >60 %). A 0 % class was also added for trees free of light interception.
Of the selected black spruces subjected to mixed and inter-specific light interception, 44 %
contained speckled alder. Among all competitive species found in the study area, it is the
only one having documented nitrogen-fixing abilities (Fortin et al. 1985). A dummy
variable (ALDER), which indicated the presence of alder among the species blocking light
interception, was added to differentiate this competitor from the others.
108
Ericaceous shrubs that intercepted light above black spruce seedlings were rarely found.
The presence of Labrador tea and sheep laurel appeared to be constant for all trees within
each site and comparable for all sites described by the same OG. The measurement method
was therefore considered inappropriate for this type of competition. The adverse effect of
ericaceous shrubs on black spruce growth was consequently considered as a component of
the OG factor.
Statistical analysis
The establishment dynamics of black spruce’s competitive tree species was evaluated as a
function of the distance to the ditch, using a logistic regression approach. The presence of
alder-willow, aspen-birch and black spruce within each plot in 2002 was analysed in
relation to their respective presences in 1986, their distance to the closest ditch (DIST: 0-5
m, 5-10 m, 10-15 m, 15-20 m and >20 m) and their operational group (OG). The presence
in 1986 × DIST interaction was used in the analysis to consider the possibly drainage-
dependent differences in post-drainage tree establishment. Variation occurring within the
three different studied sites was taken into account, as a random block effect.
For the black spruce growth study, the last growing season’s diameter (DI) and height (HI)
increments were used as the dependent variables in a split-plot design. Operational group
(OG) was used as the main plot effect while distance to the ditch (DIST: control, 0-5 m, 5-
10 m and 10-15 m) was used as the sub-plot effect. Other explanatory variables used in the
analysis were: initial dimension (D0, H0); light interception (LI: 0 %, L-intra, M-intra, H-
intra, L-mixed, M-mixed, H-mixed, L-inter, M-inter and H-inter); presence of alder
(ALDER: 0 and 1) and last measured growing season (YEAR: 1998, 1999 or 2000, as
categorical values). Logarithmic transformations were used for continuous variables
(ln(DI), ln(HI), ln(D0), ln(H0)) to satisfy assumptions of normality and homogeneity of the
variance. Numerous interactions, such as OG × DIST, LI × DIST, LI × ALDER, ln(D0) ×
OG and ln(H0) × OG were also tested in the models. Each explanatory variable or
interaction was selected based on its significant influence on the response variable and its
109
influence on the -2ּlog-likelihood statistic for the entire model. Random parameters were
included to consider the variation between sites within the same operational group
(SITE(OG); main plot error) and the variation between trees located in the same distance
class for each site (DIST × SITE(OG); sub-plot error).
All statistical analyses were performed with the SAS/STAT Version 8.2 software (SAS
Institute Inc., 1999). The GLIMMIXED macro was used for the competition establishment
dynamics study. The MIXED procedure was used for the estimation of the parameters of
the black spruce growth model. All fixed and random parameters of the models were
estimated simultaneously using the restricted maximum likelihood method. The
denominator degrees of freedom were estimated by the Satterthwaite approximation (SAS
Institute Inc. 1999). A level of significance of 5 % was used throughout this study. When
significant results were obtained for a categorical variable, a Tukey multiple comparison
test was performed (Steel and Torrie 1980).

110
Results
Competition establishment dynamics
In 2002, alder-willow and black spruce were present in a majority of the regeneration plots
(69 and 54 %, respectively), while aspen-birch were found only in 17 % of them (Table 2, 3
and 4). Tree establishment following drainage (absence in 1986 and presence in 2002)
occurred for every species under study, even though most situations remained unchanged
over the measurement period (Table 2, 3 and 4).
Table 2: Frequency tables of alder-willow in the permanent regeneration plots located in recently harvested and drained peatlands. Percentage appears in parenthesis.
2002 Absence Presence Total
Absence 63 (28) 64 (29) 127 (57)1986 Presence 6 (3) 88 (40) 94 (43) Total 69 (31) 152 (69) 221 (100)
Table 3: Frequency tables of aspen-birch in the permanent regeneration plots located in recently harvested and drained peatlands. Percentage appears in parenthesis
2002 Absence Presence Total
Absence 166 (73) 19 (9) 185 (84)1986 Presence 17 (8) 19 (9) 36 (16) Total 183 (83) 38 (17) 221 (100)
Table 4: Frequency tables of black spruce in the permanent regeneration plots located in recently harvested and drained peatlands. Percentage appears in parenthesis
2002 Absence Presence Total
Absence 72 (33) 27 (12) 99 (45)1986 Presence 29 (13) 92 (42) 121 (55) Total 101 (46) 119 (54) 220 (100)

111
The presence of every competitive species in 2002 was highly dependent (p < 0.0001) on
its presence in 1986 (Table 5). The presence of alder-willow in 2002 also was dependent on
OG (Table 5). A multiple comparison Tukey test showed the significantly higher presence
of alder-willow in 2002 in the Feathermoss - sphagnum (OG 8) and Alnus - perturbed area
(undetermined OG) comparatively to the Chamaedaphne (OG 14) operational group (p =
0.0130 and 0.0053, respectively). High presence of alder-willow was also found in the
Alnus – herb poor (OG 12) group, but it did not significantly differ from OG 14. DIST and
the 1986 presence × DIST interaction were non-significant in all three models.
Table 5: Logistic regression summaries on the occurrence of the principal black spruce’s competitive tree species in the permanent regeneration plots located in recently harvested and drained peatlands.
Presence in 2002 Explanatory variables df p valuesFixed effects
Alder-willow presence in 1986 1 <0.0001DIST 4 0.9382Alder-willow presence in 1986 × DIST 4 0.8742OG 5 0.0069
Random effect Block 2 0.2019
Alder-willow
Fixed effects
Aspen-birch presence in 1986 1 <0.0001DIST 4 0.8722Aspen-birch presence in 1986 × DIST 4 0.4916OG 5 0.0633
Random effect Block 2 0.1944
Aspen-birch
Fixed effects
Black spruce presence in 1986 1 <0.0001DIST 4 0.1828Black spruce presence in 1986 × DIST 4 0.3114OG 5 0.2730
Random effect Block 2 0.2290
Black spruce
Note: DIST = Distance to the closest ditch (classes)
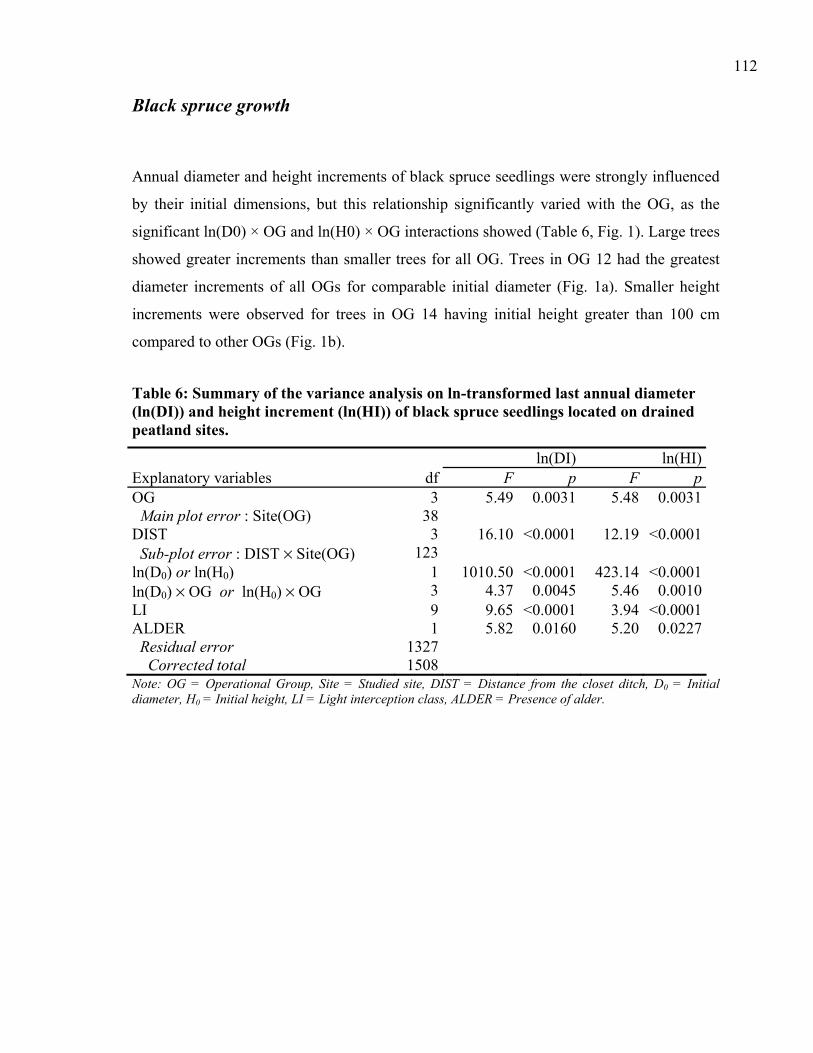
112
Black spruce growth
Annual diameter and height increments of black spruce seedlings were strongly influenced
by their initial dimensions, but this relationship significantly varied with the OG, as the
significant ln(D0) × OG and ln(H0) × OG interactions showed (Table 6, Fig. 1). Large trees
showed greater increments than smaller trees for all OG. Trees in OG 12 had the greatest
diameter increments of all OGs for comparable initial diameter (Fig. 1a). Smaller height
increments were observed for trees in OG 14 having initial height greater than 100 cm
compared to other OGs (Fig. 1b).
Table 6: Summary of the variance analysis on ln-transformed last annual diameter (ln(DI)) and height increment (ln(HI)) of black spruce seedlings located on drained peatland sites.
ln(DI) ln(HI)Explanatory variables df F p F pOG 3 5.49 0.0031 5.48 0.0031Main plot error : Site(OG) 38
DIST 3 16.10 <0.0001 12.19 <0.0001Sub-plot error : DIST × Site(OG) 123
ln(D0) or ln(H0) 1 1010.50 <0.0001 423.14 <0.0001ln(D0) × OG or ln(H0) × OG 3 4.37 0.0045 5.46 0.0010LI 9 9.65 <0.0001 3.94 <0.0001ALDER 1 5.82 0.0160 5.20 0.0227Residual error 1327 Corrected total 1508
Note: OG = Operational Group, Site = Studied site, DIST = Distance from the closet ditch, D0 = Initial diameter, H0 = Initial height, LI = Light interception class, ALDER = Presence of alder.
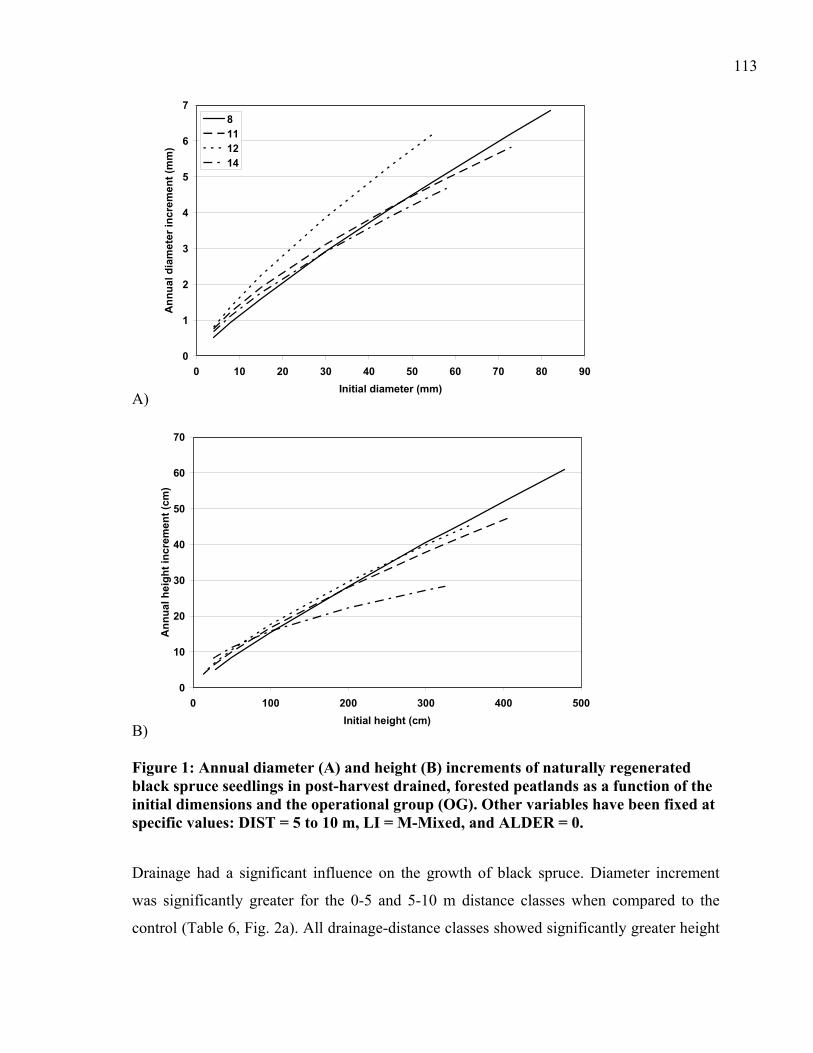
113
A)
0
1
2
3
4
5
6
7
0 10 20 30 40 50 60 70 80 90Initial diameter (mm)
Ann
ual d
iam
eter
incr
emen
t (m
m)
8111214
B)
0
10
20
30
40
50
60
70
0 100 200 300 400 500Initial height (cm)
Ann
ual h
eigh
t inc
rem
ent (
cm)
Figure 1: Annual diameter (A) and height (B) increments of naturally regenerated black spruce seedlings in post-harvest drained, forested peatlands as a function of the initial dimensions and the operational group (OG). Other variables have been fixed at specific values: DIST = 5 to 10 m, LI = M-Mixed, and ALDER = 0.
Drainage had a significant influence on the growth of black spruce. Diameter increment
was significantly greater for the 0-5 and 5-10 m distance classes when compared to the
control (Table 6, Fig. 2a). All drainage-distance classes showed significantly greater height
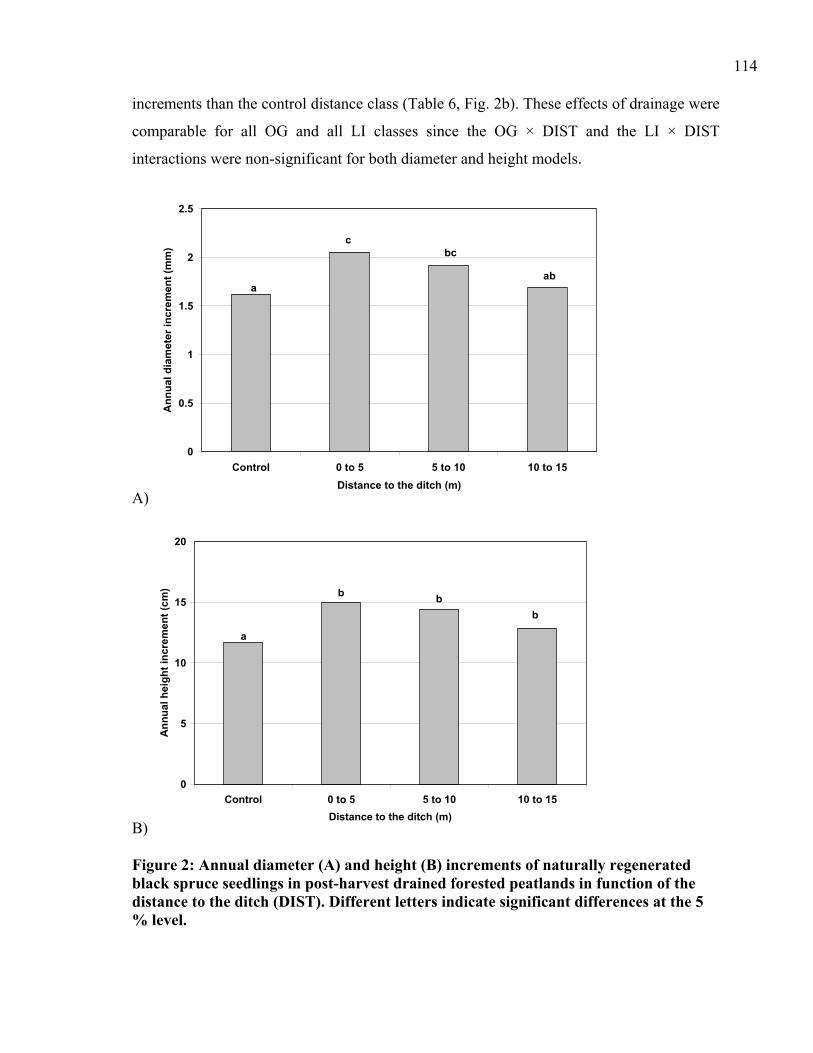
114
increments than the control distance class (Table 6, Fig. 2b). These effects of drainage were
comparable for all OG and all LI classes since the OG × DIST and the LI × DIST
interactions were non-significant for both diameter and height models.
A)
0
0.5
1
1.5
2
2.5
Control 0 to 5 5 to 10 10 to 15Distance to the ditch (m)
Ann
ual d
iam
eter
incr
emen
t (m
m)
a
cbc
ab
B)
0
5
10
15
20
Control 0 to 5 5 to 10 10 to 15Distance to the ditch (m)
Ann
ual h
eigh
t inc
rem
ent (
cm)
a
b bb
Figure 2: Annual diameter (A) and height (B) increments of naturally regenerated black spruce seedlings in post-harvest drained forested peatlands in function of the distance to the ditch (DIST). Different letters indicate significant differences at the 5 % level.
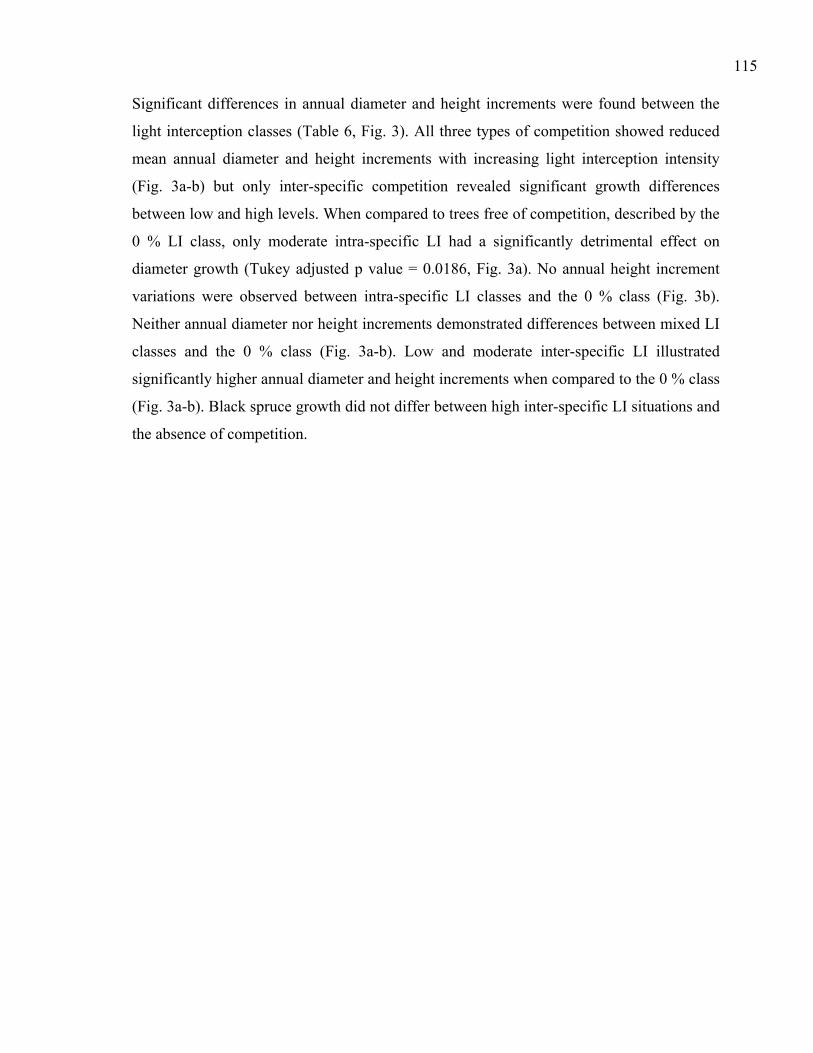
115
Significant differences in annual diameter and height increments were found between the
light interception classes (Table 6, Fig. 3). All three types of competition showed reduced
mean annual diameter and height increments with increasing light interception intensity
(Fig. 3a-b) but only inter-specific competition revealed significant growth differences
between low and high levels. When compared to trees free of competition, described by the
0 % LI class, only moderate intra-specific LI had a significantly detrimental effect on
diameter growth (Tukey adjusted p value = 0.0186, Fig. 3a). No annual height increment
variations were observed between intra-specific LI classes and the 0 % class (Fig. 3b).
Neither annual diameter nor height increments demonstrated differences between mixed LI
classes and the 0 % class (Fig. 3a-b). Low and moderate inter-specific LI illustrated
significantly higher annual diameter and height increments when compared to the 0 % class
(Fig. 3a-b). Black spruce growth did not differ between high inter-specific LI situations and
the absence of competition.
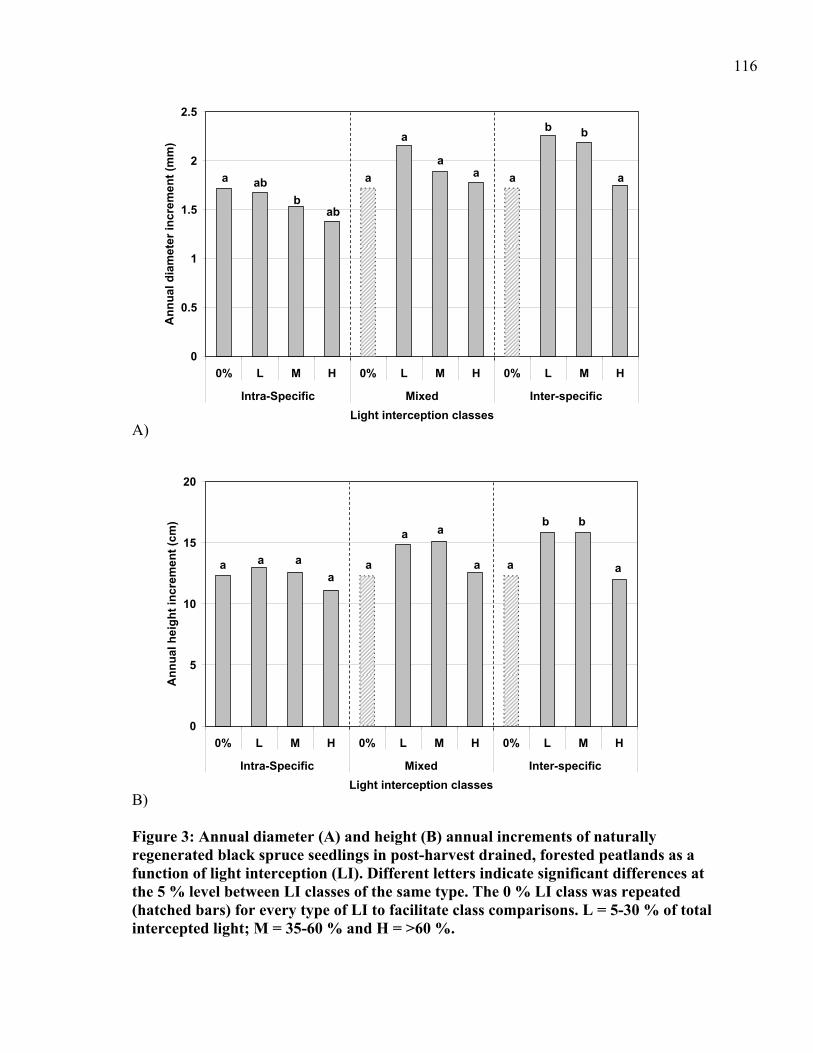
116
A)
0
0.5
1
1.5
2
2.5
0% L M H 0% L M H 0% L M H
Intra-Specific Mixed Inter-specificLight interception classes
Ann
ual d
iam
eter
incr
emen
t (m
m)
a abb
ab
a
a
aa a
b b
a
B)
0
5
10
15
20
0% L M H 0% L M H 0% L M H
Intra-Specific Mixed Inter-specificLight interception classes
Ann
ual h
eigh
t inc
rem
ent (
cm)
a a aa
a
a a
a a
b b
a
Figure 3: Annual diameter (A) and height (B) annual increments of naturally regenerated black spruce seedlings in post-harvest drained, forested peatlands as a function of light interception (LI). Different letters indicate significant differences at the 5 % level between LI classes of the same type. The 0 % LI class was repeated (hatched bars) for every type of LI to facilitate class comparisons. L = 5-30 % of total intercepted light; M = 35-60 % and H = >60 %.
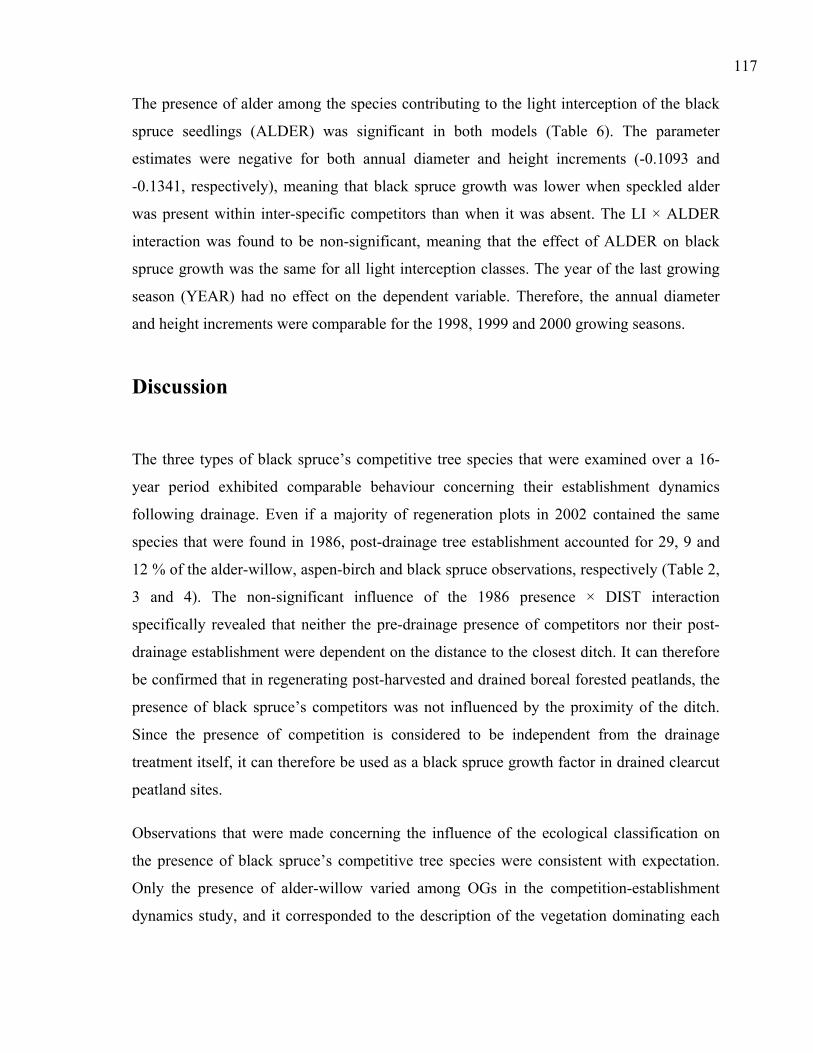
117
The presence of alder among the species contributing to the light interception of the black
spruce seedlings (ALDER) was significant in both models (Table 6). The parameter
estimates were negative for both annual diameter and height increments (-0.1093 and
-0.1341, respectively), meaning that black spruce growth was lower when speckled alder
was present within inter-specific competitors than when it was absent. The LI × ALDER
interaction was found to be non-significant, meaning that the effect of ALDER on black
spruce growth was the same for all light interception classes. The year of the last growing
season (YEAR) had no effect on the dependent variable. Therefore, the annual diameter
and height increments were comparable for the 1998, 1999 and 2000 growing seasons.
Discussion
The three types of black spruce’s competitive tree species that were examined over a 16-
year period exhibited comparable behaviour concerning their establishment dynamics
following drainage. Even if a majority of regeneration plots in 2002 contained the same
species that were found in 1986, post-drainage tree establishment accounted for 29, 9 and
12 % of the alder-willow, aspen-birch and black spruce observations, respectively (Table 2,
3 and 4). The non-significant influence of the 1986 presence × DIST interaction
specifically revealed that neither the pre-drainage presence of competitors nor their post-
drainage establishment were dependent on the distance to the closest ditch. It can therefore
be confirmed that in regenerating post-harvested and drained boreal forested peatlands, the
presence of black spruce’s competitors was not influenced by the proximity of the ditch.
Since the presence of competition is considered to be independent from the drainage
treatment itself, it can therefore be used as a black spruce growth factor in drained clearcut
peatland sites.
Observations that were made concerning the influence of the ecological classification on
the presence of black spruce’s competitive tree species were consistent with expectation.
Only the presence of alder-willow varied among OGs in the competition-establishment
dynamics study, and it corresponded to the description of the vegetation dominating each

118
OG. Speckled alder was an indicator species for OG 12 and commonly can be found
invading perturbed areas. The poorest group, OG 14, was characterised by the absence of
alder. Trembling aspen, white birch and black spruce could not be used to differentiate
OGs. They were found in all OGs with similar occurrences.
Results concerning the effect of drainage on black spruce growth were consistent with
previous observations made by Jutras et al. (2002). The favourable effect of drainage on
black spruce seedling diameter and height growth, expressed by the DIST factor, behaved
as expected. When compared to undrained areas, diameter increment of drained black
spruce seedlings increased within the first 10 m from the ditch. Height increment
significantly increased over the whole 30 m spacing drained area. This effect was not
significantly different among the OGs, suggesting a similar impact of drainage on the last
annual growth increment of black spruce for all OGs. In the study by Jutras et al. (2002),
differences among OGs with respect to the DIST classes were observed for the 9-year
growth period following drainage. Significant growth increments after drainage were
limited to the first DIST class on poor sites (e.g. OG 14), while drainage was having a
broader influence on richer sites (e.g. OG 8 and 12). Tree response to the treatment might
have differed among OGs, especially for the first few years after drainage. Possible OG-
specific delays in response could have influenced the 9-year growth period following
drainage. The non-significant effect of the OG × DIST interaction is therefore showing the
similar effect of DIST classes among OGs on the last measured annual diameter and height
increments.
The method used to account for the positive and the negative interferences between the
selected black spruce and their immediate tree neighbours was derived from the
measurement of shared above-ground resources. Light interception was assumed to be a
reasonable estimator of standing biomass in the immediate neighbourhood of the trees
being studied. We also assumed below-ground resource interferences to be proportional to
the LI factor. The adverse effects of the different interferences between plant neighbours
and black spruce growth were simultaneously considered in the growth models constructed.
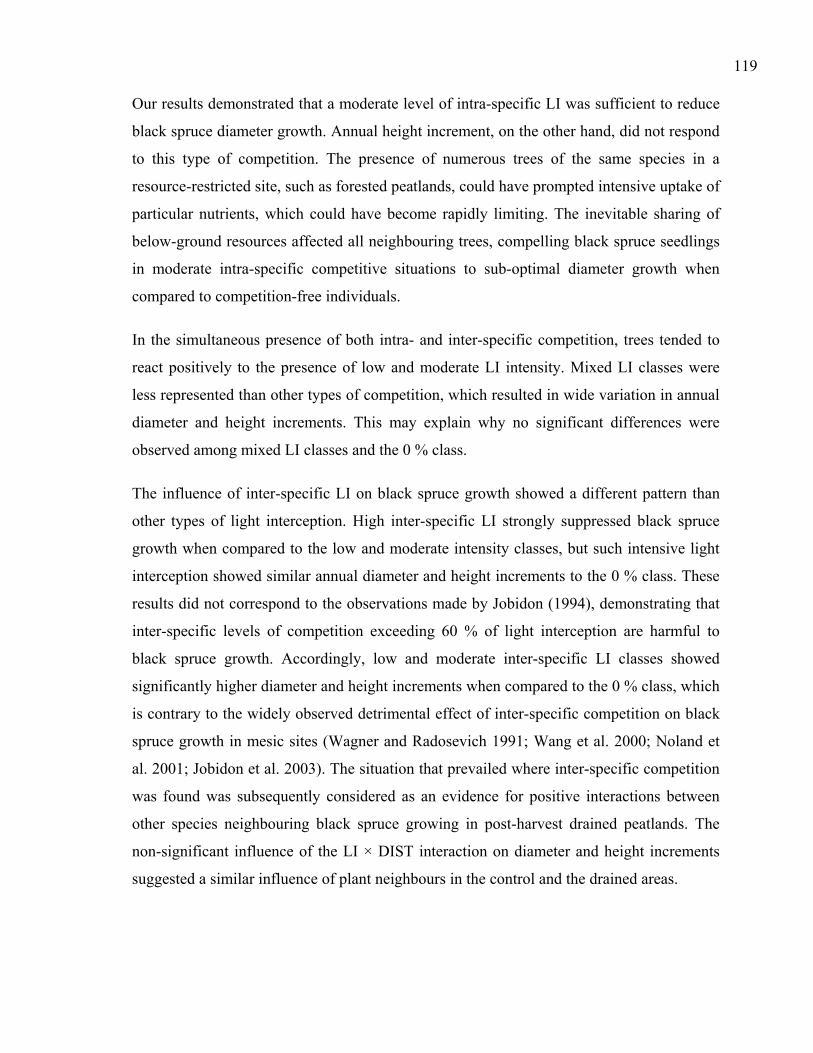
119
Our results demonstrated that a moderate level of intra-specific LI was sufficient to reduce
black spruce diameter growth. Annual height increment, on the other hand, did not respond
to this type of competition. The presence of numerous trees of the same species in a
resource-restricted site, such as forested peatlands, could have prompted intensive uptake of
particular nutrients, which could have become rapidly limiting. The inevitable sharing of
below-ground resources affected all neighbouring trees, compelling black spruce seedlings
in moderate intra-specific competitive situations to sub-optimal diameter growth when
compared to competition-free individuals.
In the simultaneous presence of both intra- and inter-specific competition, trees tended to
react positively to the presence of low and moderate LI intensity. Mixed LI classes were
less represented than other types of competition, which resulted in wide variation in annual
diameter and height increments. This may explain why no significant differences were
observed among mixed LI classes and the 0 % class.
The influence of inter-specific LI on black spruce growth showed a different pattern than
other types of light interception. High inter-specific LI strongly suppressed black spruce
growth when compared to the low and moderate intensity classes, but such intensive light
interception showed similar annual diameter and height increments to the 0 % class. These
results did not correspond to the observations made by Jobidon (1994), demonstrating that
inter-specific levels of competition exceeding 60 % of light interception are harmful to
black spruce growth. Accordingly, low and moderate inter-specific LI classes showed
significantly higher diameter and height increments when compared to the 0 % class, which
is contrary to the widely observed detrimental effect of inter-specific competition on black
spruce growth in mesic sites (Wagner and Radosevich 1991; Wang et al. 2000; Noland et
al. 2001; Jobidon et al. 2003). The situation that prevailed where inter-specific competition
was found was subsequently considered as an evidence for positive interactions between
other species neighbouring black spruce growing in post-harvest drained peatlands. The
non-significant influence of the LI × DIST interaction on diameter and height increments
suggested a similar influence of plant neighbours in the control and the drained areas.
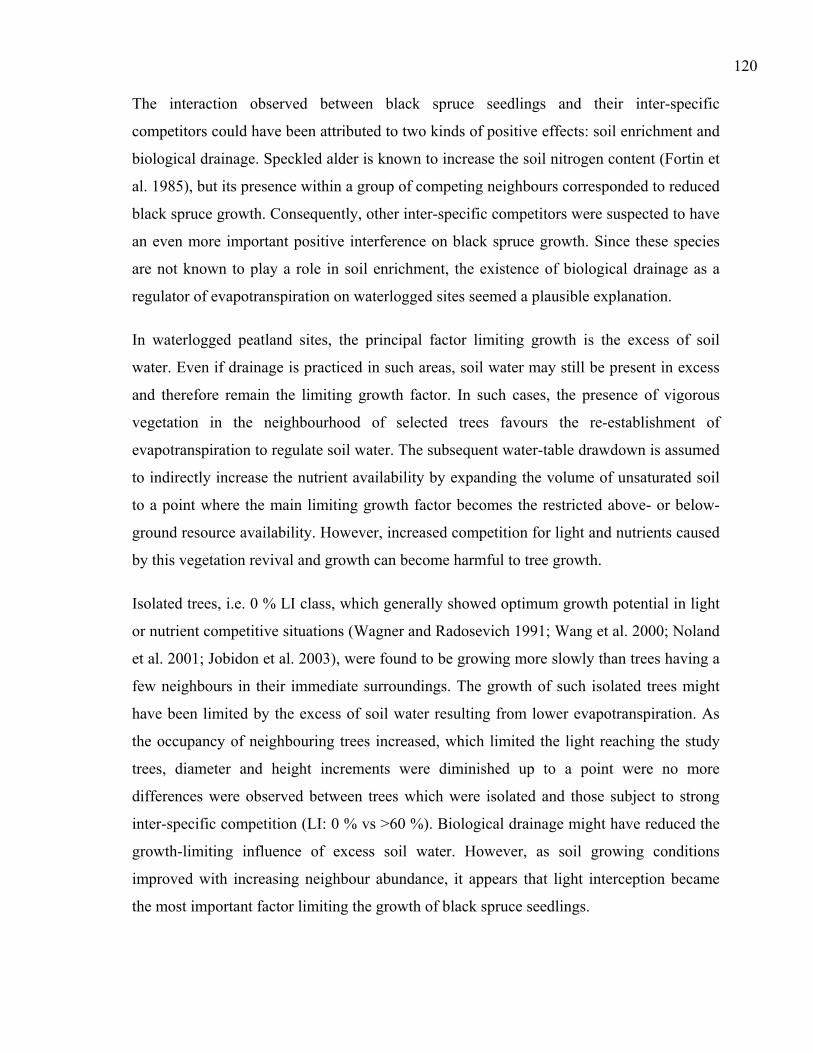
120
The interaction observed between black spruce seedlings and their inter-specific
competitors could have been attributed to two kinds of positive effects: soil enrichment and
biological drainage. Speckled alder is known to increase the soil nitrogen content (Fortin et
al. 1985), but its presence within a group of competing neighbours corresponded to reduced
black spruce growth. Consequently, other inter-specific competitors were suspected to have
an even more important positive interference on black spruce growth. Since these species
are not known to play a role in soil enrichment, the existence of biological drainage as a
regulator of evapotranspiration on waterlogged sites seemed a plausible explanation.
In waterlogged peatland sites, the principal factor limiting growth is the excess of soil
water. Even if drainage is practiced in such areas, soil water may still be present in excess
and therefore remain the limiting growth factor. In such cases, the presence of vigorous
vegetation in the neighbourhood of selected trees favours the re-establishment of
evapotranspiration to regulate soil water. The subsequent water-table drawdown is assumed
to indirectly increase the nutrient availability by expanding the volume of unsaturated soil
to a point where the main limiting growth factor becomes the restricted above- or below-
ground resource availability. However, increased competition for light and nutrients caused
by this vegetation revival and growth can become harmful to tree growth.
Isolated trees, i.e. 0 % LI class, which generally showed optimum growth potential in light
or nutrient competitive situations (Wagner and Radosevich 1991; Wang et al. 2000; Noland
et al. 2001; Jobidon et al. 2003), were found to be growing more slowly than trees having a
few neighbours in their immediate surroundings. The growth of such isolated trees might
have been limited by the excess of soil water resulting from lower evapotranspiration. As
the occupancy of neighbouring trees increased, which limited the light reaching the study
trees, diameter and height increments were diminished up to a point were no more
differences were observed between trees which were isolated and those subject to strong
inter-specific competition (LI: 0 % vs >60 %). Biological drainage might have reduced the
growth-limiting influence of excess soil water. However, as soil growing conditions
improved with increasing neighbour abundance, it appears that light interception became
the most important factor limiting the growth of black spruce seedlings.

121
It is unclear why black spruce under low and moderate intra-specific competition did not
show evidence of positive interference such as biological drainage. Selected trees consisted
of the dominant black spruce tree within each 4 m² circular plot, which had a mean initial
height H0 = 120 cm. Consequently, all intra-specific neighbours were smaller than the
selected tree, while inter-specific neighbours could be of any size, i.e., smaller or larger
than the selected black spruce. Intra-specific light interception was therefore provided by
black spruce shorter than the selected trees. On the other hand, inter-specific LI could have
been caused by fast-growing individuals overtopping the selected black spruce trees.
Hence, the relationship between light interception and the evapotranspiration potential in
each black spruce neighbourhood might have been dependent on the type of competition.
For equal values of LI, intra-specific competition might have yielded smaller relative
values of evapotranspiration than inter-specific competition. This explanation could partly
explain why low and moderate intra-specific LI were not showing evidence of biological
drainage. The stronger negative interference of intra-specific competition on resource pre-
emption, relative to that of to intra-specific competition could also be considered as an
adequate justification. Further investigation would be needed in order to differentiate the
exact influence of intra-specific competition on biological drainage and its resulting effect
on black spruce growth.
When planning drainage operations in recently harvested peatlands, forest managers could
predict with fair accuracy vegetational composition that will characterise the site in
subsequent years by carefully monitoring the actual vegetation. For example, if speckled
alder is found at the moment of drainage in a clearcut peatland, there is a high probability
that regenerating black spruce seedlings would be later subjected to a strong competitive
situation created by this fast growing pioneer species. On the contrary, if the site is almost
exclusively covered with black spruce, mainly intra-specific competition could be expected
during the coming years. The need for vegetation control could therefore be successfully
planned in advance depending on the competition susceptibility of each treated sites.
In drained, clearcut peatlands, the fastest growing black spruces were found in situations of
low and moderate inter-specific above-ground competition. This stresses the importance of
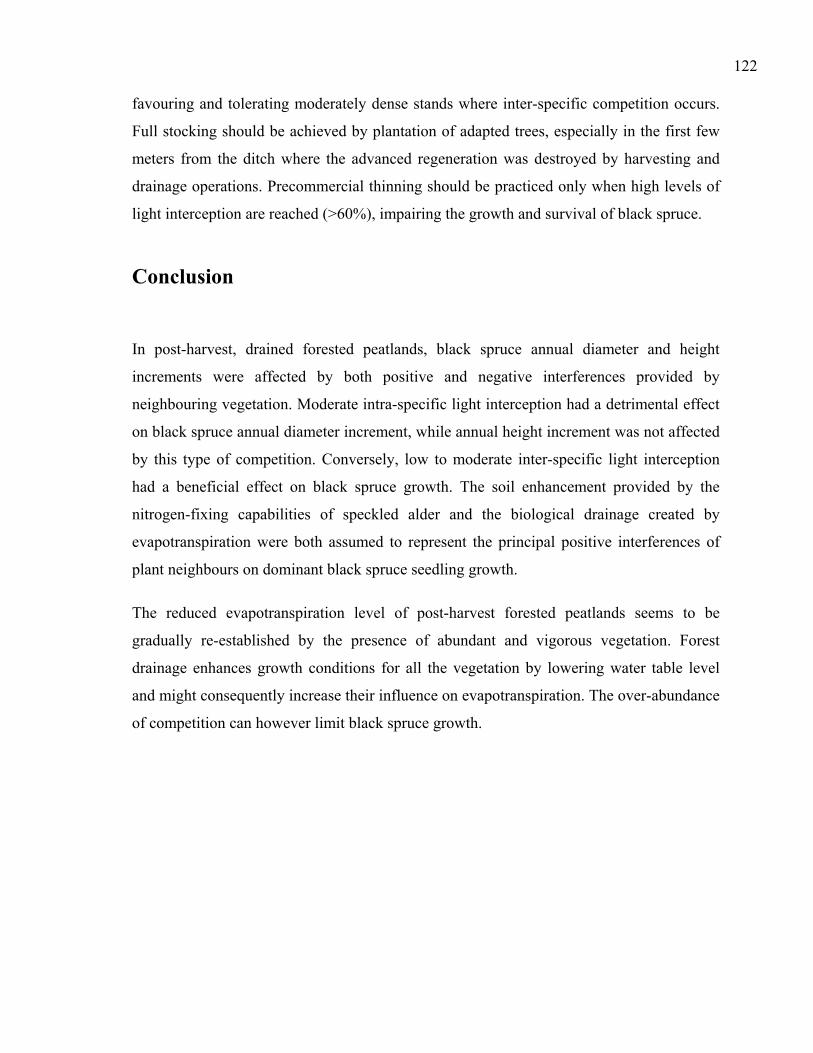
122
favouring and tolerating moderately dense stands where inter-specific competition occurs.
Full stocking should be achieved by plantation of adapted trees, especially in the first few
meters from the ditch where the advanced regeneration was destroyed by harvesting and
drainage operations. Precommercial thinning should be practiced only when high levels of
light interception are reached (>60%), impairing the growth and survival of black spruce.
Conclusion
In post-harvest, drained forested peatlands, black spruce annual diameter and height
increments were affected by both positive and negative interferences provided by
neighbouring vegetation. Moderate intra-specific light interception had a detrimental effect
on black spruce annual diameter increment, while annual height increment was not affected
by this type of competition. Conversely, low to moderate inter-specific light interception
had a beneficial effect on black spruce growth. The soil enhancement provided by the
nitrogen-fixing capabilities of speckled alder and the biological drainage created by
evapotranspiration were both assumed to represent the principal positive interferences of
plant neighbours on dominant black spruce seedling growth.
The reduced evapotranspiration level of post-harvest forested peatlands seems to be
gradually re-established by the presence of abundant and vigorous vegetation. Forest
drainage enhances growth conditions for all the vegetation by lowering water table level
and might consequently increase their influence on evapotranspiration. The over-abundance
of competition can however limit black spruce growth.
123
Acknowledgements
The authors would like pay tribute to Dr. Hassan Ali Bolghari (1938-1992), who
established the innovative Hazeur, Bruneau and Dalet experimental areas where the
competition establishment dynamic study was performed. This research was supported by
the Quebec Ministry of Natural resources and Wildlife, Abitibi-Consolidated Inc., Barrette-
Chapais Ltée. and Les Chantiers de Chibougamau Ltée. through the ‘Programme de mise
en valeur des ressources du milieu forestier – Volet 1’. The English was revised by William
F.J. Parsons. The first author was financially supported by a doctoral scholarship from
FQRNT (Fonds québecois de la recherche sur la nature et les technologies).
References
Bolghari, H. 1986. Perspectives du drainage forestier au Québec. In: Ordre des Ingénieurs Forestiers du Québec (Eds.) Colloque sur le drainage forestier, 10-11 September 1985, Ste.-Foy, Québec. pp. 47-65.
Bolghari, H., Veilleux, J.-M. 1987. Évaluation du drainage forestier comme technique de préparation du terrain pour régénérer par différentes méthodes (plantions, ensemencements naturels et artificiels) les pessières noires humides récemment exploitées. Projet R82315. Ministère de l’Énergie et des Ressources, Quebec.
Canham, C.D., LePage, P.T., Coates, K.D. 2004. A neighborhood analysis of canopy tree competition: effects of shading versus crowding. Can. J. For. Res. 34: 778-787.
Chatarpaul, L., Carlisle, A. 1983. Nitrogen fixation: a biotechnological opportunity for Canadian forestry. For. Chron. 59: 249-259.
Dang, Q.L., Lieffers, V.J. 1989. Assessment of patterns of response of tree ring growth of black spruce following peatland drainage. Can. J. For. Res. 19 : 924-929.
Dubé, S., Plamondon, A.P. 1995. Relative importance of interception and transpiration changes causing watering-up after clearcutting on four wet sites. Intern. Ass. Sci. Hydrol, Boulder Symposium. Publ. 230: 113-120.
Dubé, S., Plamondon, A.P., Rothwell, R.L. 1995. Watering up after clear-cutting on forested wetlands of the St. Lawrence lowland. Water Resour. Res. 31 : 1741-1750.
124
Environment Canada. 2004. Canadian climate normals 1971-2000. Atmospheric Environment Service, Downsview, Ontario, Canada.
Farrar, J.L. 1995. Trees in Canada. Fides & Can. For. Serv. 502 p.
Fortin, A., Chatarpaul, L., Carlisle, A. 1985. The role of nitrogen fixation in intensive forestry in Canada. Part I: Principles, practice, and potential. Can. For. Serv., Inf. Rep. PI-X-29.
Hillman, G.R. 1991. Black spruce growth on drained, forested peatland in northern Alberta. Can. For. Serv. For. Manag. Note No. 53. 8 p.
Inderjit, Mallik, A.U. 1996. Growth and physiological responses of black spruce (Picea mariana) to sites dominated by Ledum groenlandicum. J. Chem. Ecol. 22: 575-585.
Inderjit, Mallik, A.U. 1997. Effect of Ledum groenlandicum amendment on soil characteristics and black spruce seedling growth. Plant Ecol. 133: 29-36.
Inderjit, Mallik, A.U. 2002. Can Kalmia angustifolia interference to black spruce (Picea mariana) be explained by allelopathy? For. Ecol. Manage. 160: 75-84.
Jobidon, R. 1994. Light threshold for optimal black spruce (Picea mariana) seedling growth and development under brush competition. Can. J. For. Res. 24: 1629-1635.
Jobidon, R. 1995. Autecologie de quelques espèces de compétition d’importance pour la régénération forestière au Québec. Revue de littérature. Mémoire de recherche forestière no 177. Direction de la recherche forestière. Ministère des Ressources naturelles. Québec. Canada. 180 p.
Jobidon, R., Roy, V., Cyr, G. 2003. Net effect of competing vegetation on selected environmental conditions and performance of four spruce seedling stock sizes after eight years in Québec (Canada). Ann. For. Sci. 60: 691-699.
Jones, R.K., Pierpoint, G., Wickware, G.M., Jeglum, J.K., Arnup, R.W., Bowles, J.M. 1983. Field guide to forest ecosystem classification for the Clay Belt, site Region 3e. Ontario Ministry of Natural Ressources, Maple, Ontario. 123 p.
Jutras, S., Bégin, J., Plamondon, A.P. 2002. Impact du drainage forestier après coupe sur la croissance de l’épinette noire en forêt boréale. Can. J. For. Res. 32 : 1585-1596.
Jutras, S., Bégin, J., Plamondon, A.P. 2004. Illustration of biological drainage in forested peatlands by spatially explicit single-tree growth modelling. In: Päivänen, J. (Eds.) Proceeding of the 12th International Peat Congress: “Wise use of peatlands”, Volume 1, Oral presentations. June 2004, Tampere, Finland.
125
Landhäusser, S.M., Lieffers, V.J., Silins, U. 2003. Utilizing pioneer species as a hydrological nurse crop to lower water table for reforestation of poorly drained boreal sites. Ann. For. Sci. 60: 741-748.
LeBarron, R.K., Neetzel, J.R. 1942. Drainage of forested swamps. Ecology 23(4): 457-465.
Lieffers, V.J., Macdonald, S.E. 1990. Growth and foliar nutrient status of black spruce and tamarack in relation to depth of water table in some Alberta peatlands. Can. J. For. Res. 20: 805-809.
Lieffers, V.J., Rothwell, R.L. 1986. Effects of depth of water table and substrate temperature on root and top growth of Picea mariana and Larix laricina seedlings. Can. J. For. Res. 16: 1201-1206.
Lieffers, V.J., Rothwell, R.L. 1987. Rooting of peatland black spruce and tamarack in relation to depth of water table. Can. J. Bot. 65: 817-821.
MacDonald, G.B., Weetman, G.F. 1993. Functional growth of conifer seedling responses to competing vegetation. For. Chron. 69: 64-70.
MacDonald, S.E., Yin, F. 1999. Factors influencing size inequality in peatland black spruce and tamarack : evidence from post-drainage release growth. J. Ecol. 87: 404-412.
Mailly, D., Turbis, S., Pothier, D. 2003. Predicting basal area increment in a spatially explicit, individual tree model, a test of competition measures with black spruce. Can. J. For. Res. 33: 435-443.
Mallik, A.U. 2003. Conifer regeneration problems in boreal and temperate forests with ericaceous understory: Role of disturbance, seedbed limitation, and keystone species change. Crit. Rev. Plant Sci. 22: 341-366.
McLaren, B.E., Jeglum, J.K. 1998. Black spruce growth and foliar nutrient responses to drainage and fertilisation: Wally Creek, Ontario. For. Chron. 74: 106-115.
Morris, D.M., MacDonald, G.B. 1991. Development of a competition index for young conifer plantations established on boreal mixedwood sites. For. Chron. 67: 403-410.
Newton, P.F., Jolliffe, P.A. 1998. Assessing processes of intraspecific competition within spatially heterogeneous black spruce stands. Can. J. For. Res. 28:259-275.
Noland, T.L., Mohammed, G.H., Wagner, R.G. 2001. Morphological characteristics associated with tolerance to competition from herbaceous vegetation for seedlings of jack pine, black spruce and white pine. New For. 21: 199-215.
Paavilainen, E., Päivänen, J. 1995. Peatland forestry: ecology and principles. Springer-Verlag, Berlin. 248 p.
126
Päivänen, J. Wells, E.D. 1978. Guidelines for the development of peatland drainage systems for forestry in Newfoundland. Can. For. Serv. Inf. Rep. N-X-156. 44 p.
Penner, M., Penttilä, T., Hökkä, H. 1995. A method for using random parameters in analyzing permanent sample plots. Silva Fennica 29(4): 287-296.
Prévost, M., Belleau, P., Plamondon, A.P. 1997. Substrate conditions in a treed peatland: Responses to drainage. Écoscience 4(4): 543-554.
Radosevich, S.E., Osteryoung, K. 1987. Principles Governing Plant-Environment Interactions. In: Walstad, J.D., Kuch, P.J. (Eds) Forest vegetation management for conifer production. Wiley-Interscience, New York, USA. pp.105-156.
Roy, V., Jeglum, J.K., Plamondon, A.P. 1997. Water table fluctuations following clearcutting and thinning on Wally Creek Wetlands. In: Trettin, C.C., Jurgensen, M.F., Grigal, D.F., Gale, M.R., Jeglum, J.K. (Eds) Northern forested wetlands: ecology and management. Lewis Publishers, CRC Press, Boca Raton, FL. pp. 239-251.
Roy, V., Plamondon, A.P., Bernier, P. 2000. Draining forested wetland cutovers to improve seedling root zone conditions. Scan. J. For. Res. 15: 58-67.
SAS Institute Inc. 1999. SAS OnlineDoc®, Version8. SAS Institute Inc. Cary, NC, USA.
Steel, P.G.D., Torrie, J.H. 1980. Principles and procedures of statistics – A biometrical approach. 2nd edition. McGraw Hill. New York. 633 p.
Ter-Mikaelian, M.T., Wagner, R.G., Bell, F.W., Shropshire, C. 1999. Comparison of photosynthetically active radiation and cover estimation for measuring the effects of interspecific competition on jack pine seedlings. Can. J. For. Res. 29: 883-889.
Verry, E.S. 1997. Hydrological processes of natural, northern forested wetlands. In: Trettin, C.C., Jurgensen, M.F., Grigal, D.F., Gale, M.R., Jeglum, J.K. (Eds) Northern forested wetlands: ecology and management. Lewis Publishers, CRC Press, Boca Raton, FL. pp. 163-188.
Wagner, R.G., Radosevich, S.R. 1991. Neighborhood predictors of interspecific competition in young Douglas-fir plantations. Can. J. For. Res. 21: 821-828.
Wagner, R.G., Radosevich, S.R. 1998. Neighborhood approach for quantifying interspecific competition in coastal Oregon forests. Ecol. Appl. 8: 779-794.
Wang, G.G., Su, J., Wang, J.R. 2000. Height growth of planted black spruce seedlings in response to interspecific vegetation competition: a comparison of four competition measures at two measuring positions. Can. J. For. Res. 30: 573-579.
General conclusion
This thesis successfully demonstrated the existence of specific interrelations existing
between growth and yield of tree species, above-ground competition, and hydrology of
Quebec forested peatlands. Black spruce growth was significantly increased after forest
drainage, but this beneficial effect was insufficient to recommend the application of
drainage in unproductive forested peatland stands (Chapter 1). In mature or densely
regenerated wetland sites, the water table level has been significantly affected by the
depletion of the treed vegetation stratum (Chapter 2 and 3). The importance of this
vegetation in the evapotranspiration processes ruling the hydrological balance of such sites
has been reaffirmed. It has also been demonstrated that neighbouring trees do have a
beneficial influence on each other’s growth in specific vegetational situations (Chapter 4
and 5).
A fairly exhaustive evaluation of the Canadian scientific literature concerning the effect of
pre- and post-harvest drainage on tree growth inexorably lead me to believe that low-
productivity black spruce peatland stands should not be considered as good candidates for
intensive management. Taken independently thus, the articles published before the mid
1990’s on this subject were rather enthusiastic concerning the future of drainage. Chapter 1
therefore aimed to settle this confusing situation by accurately estimateing the long term
site productivity of a drained unproductive black spruce peatland site. As expected, the
individual tree growth was favourably enhanced by drainage, corroborating results obtained
in similar studies. However, only small sized trees and trees located within the first few
meters from the ditch demonstrated significant results. However, the overall productivity of
the drained site was very small. The change from an unproductive status to a productive
one occurred only within the first 10 m from the ditch. Only narrow ditch spacing would
enable such stand conversion but this solution seems, at a first sight, of little interest. The
high cost of intensive drainage operations would necessitate a very high yield to present, at
maturity, a profitable situation. Even with the optimistic estimation methods used, little
harvestable volume is expected to be produced on such sites over a very long period. For
128
these reasons, we would plead the principle of cautiousness and suggest that drainage of
unproductive black spruce peatland stands should not be undertaken anymore. This
experiment also shows the necessity to adapt foreign expertise into our particular climate
and our distinctive ecosystems instead of simply transferring it. Adaptations are often
needed and testing them remains the best way to accurately verify their effectiveness.
The objective of chapter 2 was also derived from an adaptation of the Fenno-Scandinavian
expertise. It aimed to acquire more knowledge about the watering-up caused by harvesting
on previously drained forested peatlands. The analysis put to evidence the important
influence of the distance to the ditch on the water table level within drained strips before
and after harvesting. At proximity of the ditches, the efficient water table regulation
overcomes the effect of the reduced evapotranspiration. Further away, watering-up
occurred after harvesting. Again, the evapotranspiration provided by the treed vegetation
was a non-negligible regulator of the water table level. The canopy removal also reduced
the variability of the water table fluctuations when compared to the pre-harvest period. This
reaction was explained by the increased open-water and soil evaporation during wet
episodes and the reduced interception and transpiration during dryer episodes. Once again,
the importance of evapotranspiration as a major regulator of the hydrological balance of
forested peatland stands was demonstrated. The prevailing soil growing conditions after
harvesting in a drained site should favour the re-establishment and growth of trees where
narrow ditch spacing was used. Otherwise, tree size inequality might prevail in the future
stand due to the varying growth conditions with respect to ditch proximity.
In recently harvested sites, a few studies have emphasised the importance of hydrological
recovery for successful site regeneration. As the vegetation revival is going on, both the
favourable and detrimental effects of high stand density might appear in regenerating
peatland sites. In chapter 3, the water table rise caused by precommercial thinning applied
on densely regenerated peatland sites was evaluated. The stand density was strongly
reduced by this silvicultural treatment and the water table rose significantly throughout the
study area. At proximity of the drainage ditch, the measured water table rise may not
considerably affect tree growth since the water table levels were low. However, farther

129
away from the ditch, tree growth might suffer more from this watering-up due to the
already high water table level. The vigorous ground vegetation that rapidly invaded mineral
sites showed their rapid resilience capacities. Consequently, precommercial thinning might
affect only a few years the soil growing conditions on mineral sites. The organic soils’
situation might return to its previous state on a short-time base too, but this study could not
validate such hypothesis. Since small basal area removal showed smaller water table rise
than heavier removal, the application of lighter precommercial thinning practices on
forested wetlands should show smaller watering-up than standard practices. The importance
of evapotranspiration as regulator of the water table depth in forested peatland stands was
once again demonstrated, but this time in regenerated stands.
Since evapotranspiration has an evident influence on soil growing conditions, tree growth
should be affected by the presence of neighbours surrounding them. This hypothesis was
evaluated in chapters 4 and 5. In chapter 4, the opposing effects of neighbourhood
occupancy, namely competition for limited resources and biological drainage, were
considered simultaneously when analysing tree growth in post-harvest drained peatland
stands. While biological drainage favoured the growth of trees found in areas where soil
water was in excess, competition for limited resources prevailed in effectively drained
areas. The water table regulation power of the vegetation stratum therefore seems to be
favourable to tree growth, mainly further away than 7 m from the ditch. The chapter 5
results are also confirming this issue since black spruce annual diameter and height
increments were affected by both positive and negative interferences provided by
neighbouring vegetation. Moderate intra-specific light interception had a detrimental effect
on black spruce annual diameter increment, while annual height increment was not affected
by this type of competition. Conversely, low to moderate inter-specific light interception
had a beneficial effect on black spruce growth. The soil enhancement provided by the
nitrogen-fixing capabilities of speckled alder and the biological drainage created by
evapotranspiration were both assumed to represent the principal positive interferences of
plant neighbours on dominant black spruce seedling growth. The results from these two last
chapters emphasise the importance of a rapid and successful tree re-establishment in post-

130
harvested peatland stands, but also that regeneration density should later be closely
monitored and controlled to reach optimal site productivity.
Clearcutting is practically the only forest management activity applied in Quebec’s forested
peatland stands. The poor reaction of old peatland black spruces to drainage made
unpopular most of the silvicultural treatments that could be adapted to such wet
ecosystems. However, the acute regeneration problems on recently harvested peatland
stands documented in the mid-1980s are still present today, even if very little is done to
straighten the situation. In many occasions, post-harvest drainage is an appropriate
treatment that can mitigate the detrimental effects of the canopy removal on water surplus.
Moreover, the vegetation revival is increasing tree growth and vigour by re-establishing the
evapotranspiration which is an essential regulator of the hydrological balance on peatland
sites. Supporting management practices that preserve a notable amount of vegetation on
forested peatland stands is the most pertinent guideline that should lead the decision
making process in these fragile ecosystems.