growth pattern and competitiveness of indian shrimp export
TRANSCRIPT

Fishery Technology2006, Vol. 43(1) pp : 99-106
Growth Pattern and Competitiveness of IndianShrimp Export Trade
K.B
. Fathima, R.S. Biradar and S.S. Salim
Central Institute of Fisheries Education, VersovaMumbai - 400 062, India
Shrimp is the world's most important commodity accounting for about 19 percent ofinternational seafood trade in value terms. In India's export trade shrimp contributed about29 percent in quantity and 67 percent in value in the year 2002-2003. The present study wasan attempt to critically examine compound growth rate and competitiveness of Indian shrimpin international seafood market based on the data collected from FAO fisheries statistics
database, MPEDA statistics and Globe fish commodity update. The results indicated that Indiahas been quite competitive in the shrimp trade, although there is a decline in thecompetitiveness of Indian shrimp in recent years. On the other hand, Thailand has emergedas a strong contender recording an increased competitiveness over the years. Certain policymeasures are suggested to sustain the competitiveness of Indian shrimp exports ininternational market.
Key words : Shrimp, Competitiveness, Compound growth rate. Constant market Share(CMS)
Marine products form an importantgroup of primary commodity exported fromIndia accounting for about four per cent ofthe total export earnings. Starting from merescrapes in the pre- independence period, itis a saga of steady striking and sustainedgrowth that the industry had recordedraising India
'
s status and prestige securingher a respectable position among the mari-time nations of the world. Export of marineproducts has increased considerably to an alltime high both in volume and value during2002-03 with actual export of 467297 tonnesvalued at Rs.6881 crores or US $ 1425 million.
Shrimp is the world's most importantseafood contributing to about 19 percent ofinternational trade in value terms and the
leading markets are USA, Japan, Spain,France, UK and Italy. Even though the shareof Shrimp export has decreased from 30.09per cent of the previous year to 28.85per centin quantity and from 69.50 per cent of theprevious year (2001-2002) to 66.97 per centin terms of value it recorded a growth of5
.56, 11.31 and 9.46 per cent in terms of
volume, rupee realization and in US $ termsduring 2002-03. The structural changes ininternational seafood trade in the last decade
in terms of structures of prodviction, con-sumption, trade flows, stocks and pricesseemed to have a significant impact on theexport trade. Being a signatory of WTO andhaving started its liberalization process, thereis a real need to evaluate the performanceof Indian shrimp export in the world seafoodmarket. This paper seeks to assess andcompare the growth and competitiveness ofIndian shrimp trade with that of itscompetitors in the international market byusing the well known constant market sharetechnique.
Materials and Methods
The present study is based on time-series data collected from different publishedgovernment and nongovernmental sources.The data pertaining to total shrimp productsexported from India, competitors and worldtotal are collected from the Food and

100 FATHIMA, BIRADAR AND SALIM
Agricultural Organization (FAO) Year Bookof Fishery Statistics. The data on imports ofshrimp for India, competitors and worldwere compiled from shrimp commodityupdate of Globefish and FAO fisherystatistics-commodities. Fishery products ex-ports for India and competitors were col-lected from Food and Agricultural Organi-zation (FAO) statistics for fishery commodi-ties. The country-wise shrimp and seafoodexport from India was compiled fromdifferent volumes of Marine Products ExportDevelopment Authority (MPEDA).All thevalues of exports and imports are in U. S.dollars to net out the effect of changes inexchange rates.
The growth in shrimp export of Indiaand that of the world was analyzed by usingthe exponential growth function of the form,
Y = ab'e (1)
Where,
Y= dependent variable for which growthrate was estimated
a = Intercept
b = Regression co-efficientt = Time variable
e = Error term
Logarithmic form of the equation (1)can be written as,
InY = lna + tlnb +ln e
i.
e., Y'=
Where,
Y' = InY
A = In a
B = In b
E = In e
Equation (2) is in the linear form.Parameters of this equation A and B wereestimated using the method of least squares.From A and B, a and b were worked out as,
a = eA
b = eB
Significance of the regression coefficientwas tested using t-test.
The compound growth rate(r) wascomputed by using the relationship
r = (eB - 1) X 100 (3)
'
The growth rates were calculated for1976 to 2001, in terms of volume, value and
unit value for India as well as the world.
The competitiveness of Indian shrimpexports to the major destinations has beenanalyzed using the Constant Market Share(CMS) model for the period 1982 to 2001covering 20 years. The data on exports tomajor destinations were obtained fromvarious issues of FAO, fisheries statistics-
commodities and MPEDA.
By using the CMS model the totalchange in exports can be decomposed intogrowth effect, market effect and competitive-ness effect. The data is divided into four sets
with a discrete two time period (a base yearand an end year) each covering five-year(1982-1986, 1987-1992, 1993-1996 and 1997-2001) data was employed for the ConstantMarket Share Analysis. (Richardson, 1971;Bishwas, 1982; and Tiwari, 1983)
A q. = S" Q.1 + S" AQ1+ AS
,
" Q.° + AS, AQ." S,0 Q,1
= S0 AQ,
+ AS,Q,1
i = subscript for import market
o = superscript indicating the baseperiod
1 = super script indicating the end ofthe observation period
A = change in a variable between twoperiods
GROWTH OF INDIAN SHRIMP EXPORT
= quantity exported from India tomarket 3 during the base period
Q.
0 = total quantity imported in market3 during the base period
S° = market share of Indian shrimp inmarket 3 during the base period
S ° = I Q °
q0 = quantity exported from India to allmarkets during the base period
Q0 = quantity imported by all marketsduring the base period
5° = market share of India in all markets
during the base period
This is the decomposition of the totalchanges in export value of the commoditywith respect to one import market. Summingthe equation over all import markets,
= Import growth effect + Market effect+ Competitiveness effect.
The import growth effect is the potentialchange in the total exports of a countryassuming a constant (base period) marketshare.
The market effect is the difference
between the overall import growth effect (5°AQ) and the sum of the market specificgrowth effects (X 5° AQ.).The growth effectis determined by the magnitude of S.0 orAQi. Hence, for an equal absolute change(AQ.), a large (region) effect is necessary.Also, under, the constant market share in the
base period, the sign and magnitude of theabsolute change (AQ.), determines the impor-tance of a region's contribution to the marketeffect. Therefore, the market effect is likelyto be negative under unfavourable importdemand conditions in the most importantregions.
The competitiveness effect is the re-sidual after subtracting the import growtheffect and the market effect from total change
101
in exports. The competitiveness effect takesthe charge in market shares (ASj) explicitlyinto consideration. The severity of a marketshare loss in an import market (-AS;
) is
proportional to the absolute size of theimport market (Q.). In short, the competitive-ness effect indicates the extent to which a
country is able to gain international marketshares despite potentially adverse worlddemand movements, in terms of both market
and commodity.
Results and Discussion
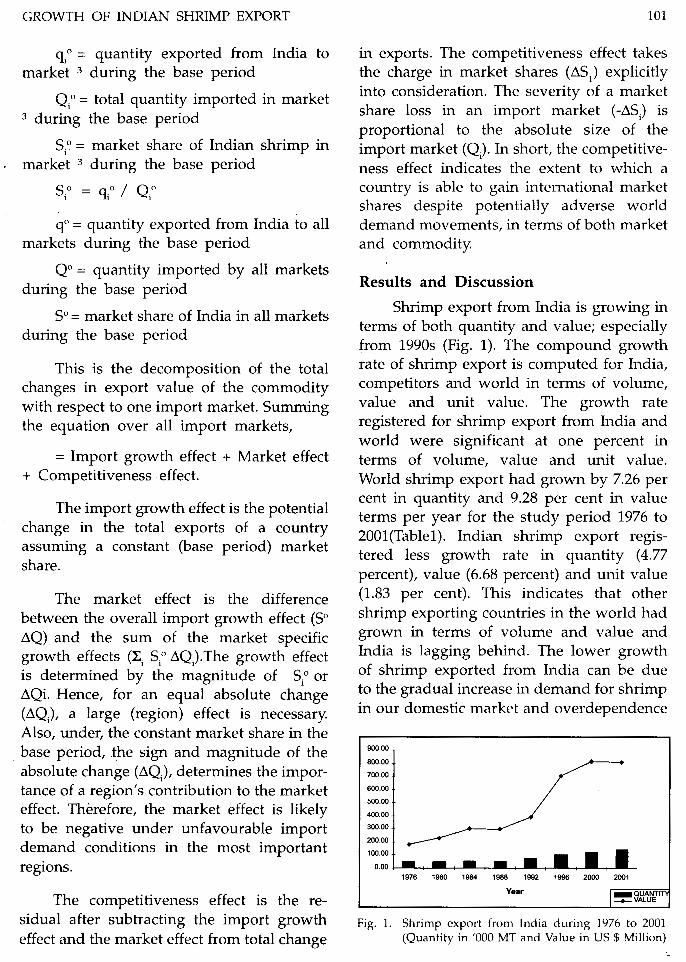
Shrimp export from India is growing interms of both quantity and value; especiallyfrom 1990s (Fig. 1). The compound growthrate of shrimp export is computed for India,competitors and world in terms of volume,value and unit value. The growth rateregistered for shrimp export from India andworld were significant at one percent interms of volume, value and unit value.
World shrimp export had grown by 7.26 percent in quantity and 9.28 per cent in valueterms per year for the study period 1976 to2001(Tablel). Indian shrimp export regis-tered less growth rate in quantity (4.77percent), value (6.68 percent) and unit value(1.83 per cent). This indicates that othershrimp exporting countries in the world hadgrown in terms of volume and value andIndia is lagging behind. The lower growthof shrimp exported from India can be dueto the gradual increase in demand for shrimpin our domestic market and overdependence
900.00
800.00
700.00
600.00
500.00
400.00
300.00
200.00
100.00
0.00
1976 1960 1984 1988 1992 1996 2000 2001
YearVALUE
Fig. 1. Shrimp export from India during 1976 to 2001(Quantity in '000 MT and Value in US $ Million)

102 FATHIMA, BIRADAR AND SALIM
on capture shrimp by Indian processors.There is lack of market research in seafood
export sector which in turn might haveresulted into poor brand image for Indianshrimp in foreign markets. Major part ofshrimp exported from India was in peeledand deveined (PD) or peeled and undeveined(PUD) form which serve as raw material forforeign importers. This is not the case withother countries like Thailand.
China,Thailand,Vietnam,Indonesia,Mexico,
Greenland and Ecuador are the majorcompetitors to India in shrimp exportmarkets namely, Japan, USA and EuropeanUnion. Compound growth rate of shrimpexported from these competing countrieswere also found out in order to have a
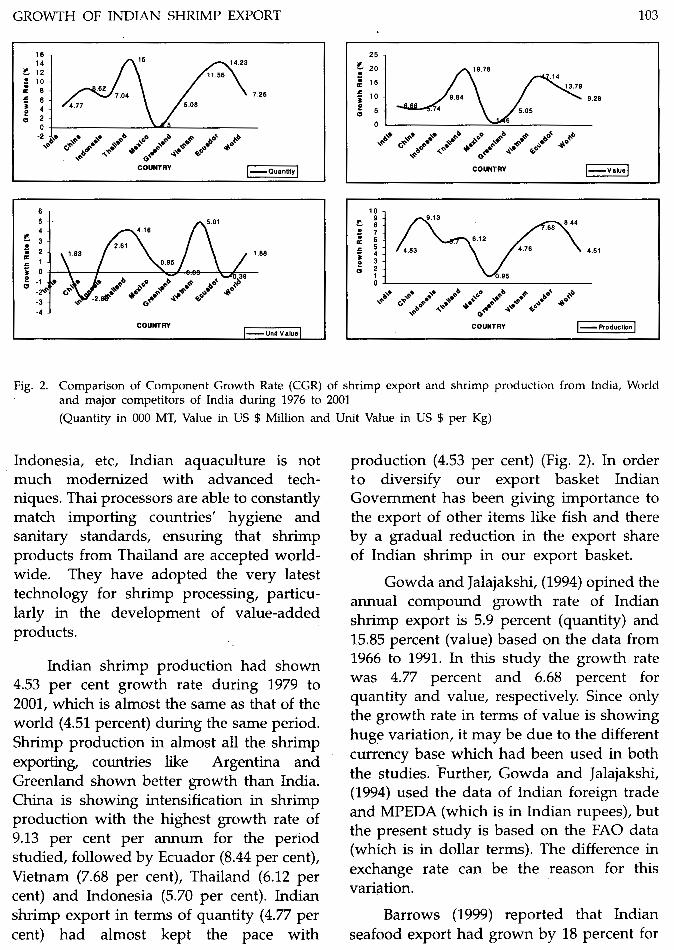
comparative look with that from India. Interms of volume of shrimp exported to theworld shrimp market, Thailand had grownhighest with a growth rate of 15.00 percentper annum during 1976 to 2001 (Table 1).Ecuador is next to Thailand with a com-
pound growth rate of 14.23 percent for thesame time period studied. All the countriesstudied except Mexico (0.50 percent) areshowing higher growth rate than that ofIndia in terms of volume of shrimp exported.In terms of value of shrimp exported also,Thailand is the leader with a growth rate of
Table la. Comparison of Compound Growth Rate (CGR)of Shrimp export (Quantity in
'000 MT) frommajor competitors of India During 1976 to 2001
Country Regression Compound GrowthCoefficient rate (CGR)
India 0.0466* 4
.77
China 0.0827* 8
.62
Indonesia 0.0681* 7
.04
Thailand 0.1397 15.00
Mexico 0.0050* 0
.50
Greenland 0.0496* 5
.08
Vietnam 0.1094 11.56
Ecuador 0.1331 14.23
World 0.0701* 7
.26
19.78 percent, followed by Vietnam (17.14percent), Ecuador (13.79 per cent) andIndonesia (9.84 per cent). Countries likeChina, Mexico and Greenland showed growthrate in value which is less than that of India.
Growth in unit value realization for the
shrimp export from countries like China(-2.65 percent), and Greenland (-0.03 percent)and Ecuador (0.39 percent) were negative.This indicates that unit value realized from
these countries has been on the down swingover the years. The growth in unit valuerealization is highest for Vietnam (5.01percent), followed by Thailand (4.16 per-cent). But the unit value realized for Indianshrimp export has shown only a growth rateof 1.83 percent, which is almost similar tothat of world (1.88 percent).
Thailand now processes importedshrimp, as well as its own domesticallyproduced shrimp, mainly for re-exports. Itsgeographical location, skilled human re-sources and well-developed infrastructurealso provide the ideal climate for investmentin the shrimp trade sector. Even though blacktiger shrimp can be farmed anywhere in thetropics, the long stretching western andeastern coastlines of Thailand is the ideal
location. Compared to other South-EastAsian countries like Thailand, Vietnam,
Table lb. Comparison of Compound Growth Rate (CGR)of Shrimp export from major competitors ofIndia During 1976 to 2001 (Value US $
'
Million)
Country Regression Compound GrowthCoefficient rate (CGR)
India 0.0647 6
.68
China 0.0558 5
.74
Indonesia 0.0939 9
.84
Thailand 0.1805 19.78
Mexico 0.0144 1
.46
Greenland 0.0493 5
.05
Vietnam 0.1582 17.14
Ecuador 0.1292 13.79
World 0.0887 9
.28
GROWTH OF INDIAN SHRIMP EXPORT 103
16 2515
14.2314~ 20 19.78
12 11.56.14
1013.79
.628
7.267
.04 10 9 84 9.
285.084
.77
5.05
<//////f 4?
ICOUNTRY | Ouantiiy| COUNTRY Value
6 109.13
5.01 8.
44684
.16
6.12
62.61 4.764.53 4
.51
1.83 1
.88
1 0.95
69139 95
Production ICOUNTRY COUNTRY
IUnit Value
Fig. 2. Comparison of Component Growth Rate (CGR) of shrimp export and shrimp production from India, Worldand major competitors of India during 1976 to 2001
(Quantity in 000 MT, Value in US $ Million and Unit Value in US $ per Kg)
Indonesia, etc, Indian aquaculture is notmuch modernized with advanced tech-
niques. Thai processors are able to constantlymatch importing countries
'
hygiene andsanitary standards, ensuring that shrimpproducts from Thailand are accepted world-wide. They have adopted the very latesttechnology for shrimp processing, particu-larly in the development of value-addedproducts.
Indian shrimp production had shown4
.53 per cent growth rate during 1979 to2001, which is almost the same as that of the
world (4.51 percent) during the same period.Shrimp production in almost all the shrimpexporting, countries like Argentina andGreenland shown better growth than India.China is showing intensification in shrimpproduction with the highest growth rate of9
.13 per cent per annum for the periodstudied, followed by Ecuador (8.44 per cent),Vietnam (7.68 per cent), Thailand (6.12 percent) and Indonesia (5.70 per cent). Indianshrimp export in terms of quantity (4.77 percent) had almost kept the pace with
production (4.53 per cent) (Fig. 2). In orderto diversify our export basket IndianGovernment has been giving importance tothe export of other items like fish and thereby a gradual reduction in the export shareof Indian shrimp in our export basket.
Gowda and Jalajakshi, (1994) opined theannual compound growth rate of Indianshrimp export is 5.9 percent (quantity) and15.85 percent (value) based on the data from1966 to 1991. In this study the growth ratewas 4.77 percent and 6.68 percent forquantity and value, respectively. Since onlythe growth rate in terms of value is showinghuge variation, it may be due to the differentcurrency base which had been used in boththe studies. Further, Gowda and Jalajakshi,(1994) used the data of Indian foreign tradeand MPEDA (which is in Indian rupees), butthe present study is based on the FAO data(which is in dollar terms). The difference inexchange rate can be the reason for thisvariation.
Barrows (1999) reported that Indianseafood export had grown by 18 percent for

104 FATHIMA, BIRADAR AND SALIM
Table Ic. Comparison of Compound Growth Rate (CGR)of Shrimp export from major competitors ofIndia During 1976 to 2001 (Unit value US $
Country Regression Compound GrowthCoefficient rate (CGR)
India 0.0181 1
.83
China -0.0269 -2
.65
Indonesia 0.0258 2
.61
Thailand 0.0407 4
.16
Mexico 0.0095 0
.95
Greenland -0.0003 -0
.03
Vietnam 0.0489 5
.01
Ecuador -0.0039 -0
.39
World.
0.0186 1
.88
a period of six years (1988 to 1994).Thisgrowth rate has been slightly higher thanThailand and Indonesia which achieved
compounded annual growth rates of around16 percent during the same period. But asper the present study, both these countriesshown a higher growth rate of shrimpexported than India for the period of 1976to 2001. India, Thailand and Indonesia have
been the most successful countries in terms
of growth rate in seafood exports during1988-1994.
The results reveal that Indian shrimp isvery much competitive in all the markets,particularly in Japan market with a maxi-mum value of 747.24 percent, followed byItaly (266.13 percent), USA (203.31 per cent)and Hong Kong (194.14 per cent). Thispositive competitive effect makes clear thatIndian shrimp export to world market ishighly competitive.
Import growth effect was positive forSpain (771.32 per cent) Italy (616.95 per cent)and UK (50.43 per cent), indicating thatIndian shrimp exports to these three marketshave been increasing over the recent past(Table2). Negative import growth effect in
India's major destinations namely. HongKong (-5453.07 per cent), Japan (-288.29 percent) and USA (-110.95 per cent) reveals thateven though Indian shrimp is competitive inthese markets, India's export share is comingdown in Japan and USA for the study period(1982 to 2001).
The market effect was positive for HongKong (5358.93 per cent), UK (32.08 per cent)and USA (7.64 per cent), but it was negativein the case of Italy (-783.08 per cent), Spain(-700
.35 per cent) and Japan (-358.95 percent). This negative market effect may beattributed to the uneven imports during thestudy period in these markets.
. Gowda and Jalajakshi, (1994) studiedthe competitiveness of Indian shrimp exportusing constant market share (CMS) methodfor a period of 1976-77 to 1986-87. Theirresults revealed that Indian exports to Japanmarket are increasing mainly due to theincreasing imports in to this market and theother two effects were negative. But thepresent study gives a different picture. InJapan market the import effect and marketeffect are negative and the competitivenesseffect is positive (in terms of volume ofshrimp exported). This may be due to thefact that the present study is for a periodof twenty years (1982 to 2001) and themarket situations might have changedtotally after 1986-87. But in USA market,Indian shrimp has been found to becompetitive by both these studies. Thepresent study shows that the growth ofIndian shrimp export in USA market is notdue to the increasing imports of shrimp inthis market as the value of import growtheffect for Indian shrimp in USA market isnegative. Gowda and Jalajakshi, (1994)opined that the increase in imports ofshrimps in this country play a favourable
GROWTH OF INDIAN SHRIMP EXPORT 105
role in Indian shrimp exports. AmongEuropean markets our major destination isUK. As per the present study all the effectsare showing positive values for Indianshrimp in this market while Gowda andJalajakshi, (1994) opined that except marketeffect, the other two effects are positive forIndian shrimp in UK market.
Amidst fisheries playing an importantrole in agricultural diversification, employ-ment generation, export promotion and foodsecurity, the present study reveals eventhough the export grew in terms of quantitythe rate of growth was marginal whencompared to the major competitors from theSouth East Asian countries The attainment of
increasing competitive advantage both inmarine products and in shrimp is attributedto foreign investment, deregulation and highprofile marketing approach which is basi-cally reflected in good relationship withbuyers, knowledge of market needs, assur-ance of quality and delivery on schedule.
Under the new trade policy initiated in1991, the major changes have been effectedin agricultural trade, with respect to thecanalization of agricultural trade has beenalmost abandoned and the government doesnot determine now the value or nature of the
exports or imports, except for a few items.In addition the Quantitative restrictions on
agricultural trade flows had been dismantledcompletely with effect from 1st April, 2001with the announcement of the tariff reduc-
tions.
In this situation, there is a great needfor more pragmatic interpretation of theexport - import policies as well as the tariffpolicy towards boosting the seafood trade ofthe country. Competitiveness involves pri-vate sector initiative, government initiative
and effective dialogue between the two.Strategic policies related to the production,
.
processing (including handling) and exportare the needs of the day. Some of thepertinent policies which are important in-clude the following:
. In order to keep pace with the SouthEast Asian countries more emphasisneeds to be given for increasing shrimpproduction by bringing more areaunder culture and increasing produc-tivity through better management. Itmay be further mentioned that fresh-water prawn farming, Macrobrachiurnrosenbergii, which has better growthand less susceptibility to disease ascompared to tiger prawn, Penaensmonodon, needs to be popularized.
. The processing sector needs to bediversified with more of value added
products.. For this exporters should beaware about quality requirements ofimporters and the value added prod-ucts preferred by them. In order toencourage value added exports, gov-ernmental interventions are requiredincluding subsidies.
. Export marketing research must bepromoted in order to find out theconsumer preference in foreign marketsand also the availability of new mar-kets for our seafood. Diversification of
fishing area, market destinations andproducts should be done in order tosustain shrimp export trade.
References
Barrows, O. J., (1999). Marine Products indus-try in India. In: Export Competitiveness inSouth-East Asia -Policy Initiatives and
106
Corporate Actions in Marine ProductsIndustry, (ed. Barrows, O.J.)- WheelerPublishing, New Delhi, pp 123-176.
Bishwas, B. (1982). Constant Market Share
Analysis of Export Performance: TheCase of India. The Indian Economic
Journal, 29(3): 41-50.
Gowda, S.M.V. and Jalajakshi, C.K., (1994).Growth, Demand elasticity and
FATHIMA, BIRADAR AND SALIM
competitiveness of Indian shrimp ex-ports. Export Potential of Indian Agricul-ture. pp 371-381.
Richardson, J.D. (1971). Constant Market
Shares Analysis of Export Growth. Jour-nal International Economics., 1: 227-239.
Tiwari, R. S., (1983). Constant- Market- Share
of Export Growth: The Indian Case.Indian Economic Journal. 33, pp 70-80.