growth strategies of international companies in the emerging
TRANSCRIPT

LAPPEENRANTA UNIVERSITY OF TECHNOLOGY Department of Industrial Engineering and Management
Growth strategies of international companies in the emerging markets of South-East Europe
Supervisor: Professor Tauno Tiusanen Instructors: Sales Director Markku Immonen and Business Manager Thomas Söderholm, Tikkurila Paints Oy Helsinki 28.5.2007 Mikko Pykäläinen Hämeentie 6, 17 A 00530 Helsinki Tel: +358 50 311 1223

II
TIIVISTELMÄ Tekijä: Mikko Pykäläinen
Aihe: Kansainvälisen yrityksen myynnin menestyksekkäät kasvustrategiat
Kaakkois-Euroopan kasvualueilla Osasto: Tuotantotalous Vuosi: 2007 Paikka: Vantaa Diplomityö. Lappeenrannan teknillinen yliopisto.
111 sivua, 15 kuvaa, 17 taulukkoa ja 10 liitettä
Tarkastaja: professori Tauno Tiusanen Hakusanat: myyntistrategia, kansainvälinen liiketoiminta, Kaakkois-Eurooppa,
kasvavat markkinat, Romania, Bulgaria, Serbia, Slovenia
Keywords: sales strategy, international business, South-East Europe, emerging
markets, Romania, Bulgaria, Serbia, Slovenia Työn tarkoituksena oli tutkia niitä tekijöitä jotka ovat vaikuttaneet kansainvälisten yritysten
myynnin kasvuun Romaniassa, Bulgariassa, Serbiassa ja Sloveniassa. Tutkimusta varten
haastateltiin neljää kansainvälisen yrityksen edustajaa sekä 16 kansainvälisen kaupan
ammattilaista. Työn akateemisena viitekehyksenä käytettiin keskeisiä kansainvälisen
liiketoiminnan teorioita sekä myynnin strategista viitekehystä.
Johtopäätöksenä katsotaan, että menestyvillä yrityksillä on selvä kansainvälistymis-strategia,
kansainvälinen organisaatio, konsultoiva myyntityyli ja resursseja investoida koulutukseen.
Tarkastelun alla olevista maista etenkin Romaniasta ja Bulgarista löytyy liiketoiminta
potentiaalia.
Tutkimuksen johtopäätökset perustuvat laadullisiin ja määrällisiin tutkimusmenetelmiin ja ne on
tarkoitettu palvemaan Tikkurila Oy:tä. Tutkimustuloksia on myös mahdollista soveltaa
laajemmin samanlaisessa tutkimusympäristössä, kunhan tutkittavan liiketoimintaympäristön
erityispiirteet ovat otetttu huomioon.

III
ABSTRACT Author: Mikko Pykäläinen
Name: Growth strategies of international companies in the emerging markets of
South-East Europe Department: Industrial Engineering and Management Year: 2007 Place: Vantaa Master’s Thesis. Lappeenranta University of Technology.
111 pages, 15 figures, 17 tables and 10 appendices
Supervisor: Professor Tauno Tiusanen Keywords: sales strategy, international business, South-East Europe, emerging
markets, Romania, Bulgaria, Serbia, Slovenia The purpose of this work was to study factors, which have influenced the sales growth of
international companies in Romania, Bulgaria, Serbia and Slovenia. For the study, four
representatives from international companies were interviewed and 16 professionals in the field
of international trade. Key theories on international business were used as an academic frame of
reference for the work, together with a strategic frame of reference for sales.
As a conclusion, I consider that, of the countries under examination, Romania and Bulgaria in
particular demonstrate purchasing potential. Successful companies have a clear
internationalisation strategy, an international organisation, a consultative sales style and
resources to invest in training.
The conclusions of the study are based on qualitative and quantitative research methods and
they are intended for the use of Tikkurila Oy. It is also possible to apply the research results to a
similar but broader research environment, if the characteristics of the business environment to
be studied are taken into account.

IV
FOREWORD I am very thankful that I had the possibility to do this Master’s Thesis for
Tikkurila Oy and its international department, Deco International. Being able to
work with real-life cases and within a supportive research environment has been a
great pleasure and a marvellous experience. I would therefore like to thank
Markku Immonen and Thomas Söderholm who have given their time, support and
resources to make this research possible. In addition, the patience they showed in
the face of all of my questions and their belief that I would finish my studies on
time have been remarkable.
There are many people who have supported me during my studies and while
writing my thesis. Within the academic realm, I would first like to thank my
supervisor, Prof. Tauno Tiusanen, for his support, guidance and comments on real
academic and business life. Throughout his courses, I have found inspiration for
Post-Communist Countries.
I would also like to thank my friends for all the fun moments I have had with you.
You have kept me sane by providing me with a sufficient number of non-
academic moments during my studies. You are also responsible of all those good
memories that will stay with me throughout my life, and which can not be
measured in monetary terms. I would also like to thanks all those who gave their
time and spirit to proofread my thesis.
And finally, the most special thanks go to my siblings, Pekka, Kari, Juha and
Mari. Without their financial and mental support, I would have never reached this
point in my life. I am fortunate to have you all in my life.
I would like to dedicate this work to my mother; you have given your support and
love throughout my life. You have believed in me, understood me in difficult
times, let me make my own choices and encouraged me on the path I selected.
You are the best mother in the world!
V
TABLE OF CONTENTS 1 INTRODUCTION ..........................................................................................1
1.1 GENERAL .................................................................................................1
1.2 RESEARCH OBJECTIVES AND LIMITATIONS ..............................................2
1.3 RESEARCH METHODOLOGY .....................................................................4
1.4 STRUCTURE OF THE STUDY ......................................................................5
2 LITERATURE REVIEW INTO THE RESEARCH TOPIC ....................7
2.1 ENTRY STRATEGIES .................................................................................7
2.1.1 Entering International Markets Through Exports.................11
2.1.2 Entering International Markets Through Investment............14
2.1.3 Deciding on the Right Entry Mode........................................17
2.2 COMPETITIVE STRATEGY AND COMPETITIVE ADVANTAGE....................18
2.3 MARKETING MIX ...................................................................................22
2.4 BRAND AND BRAND EQUITY..................................................................24
3 SALES STRATEGY FRAMEWORK........................................................29
3.1 ELEMENTS AND IMPORTANCE OF SALES STRATEGY...............................30
3.2 CUSTOMER SEGMENTATION AND PRIORITISATION.................................31
3.3 RELATIONSHIP OBJECTIVES AND SELLING MODELS...............................35
3.4 MULTIPLE SALES CHANNEL APPROACHES.............................................37
3.4.1 Types of Intermediaries .........................................................40
3.4.2 Channel Relationship ............................................................42
3.4.3 Channel Management............................................................43
3.5 LEADERSHIP AND MANAGEMENT...........................................................44
3.6 BENCHMARKING ....................................................................................48
4 RESEARCH METHODOLOGY................................................................51
4.1 QUALITATIVE AND QUANTITATIVE RESEARCH ......................................51
4.2 INTERVIEWS ...........................................................................................52
5 TIKKURILA OY..........................................................................................56
6 EVALUATING TARGET MARKETS......................................................61
VI
6.1 PREFERENCES OF TIKKURILA .................................................................61
6.2 BUSINESS ENVIRONMENT IN TARGET COUNTRIES..................................62
6.3 FOREIGN DIRECT INVESTMENT IN TARGET COUNTRIES .........................67
6.4 ECONOMIC TRENDS IN TARGET COUNTRIES...........................................70
6.5 SPECIAL FACTORS AND ECONOMIC TRENDS IN PAINT CONSUMPTION ...71
7 SUCCESFUL SALES FACTORS ..............................................................75
7.1 ENTRY MODE DECISIONS.......................................................................75
7.2 SEGMENTATION AND PRIORITISATION....................................................77
7.3 RELATIONSHIP OBJECTIVES AND SELLING MODELS...............................78
7.4 SALES CHANNELS ..................................................................................79
7.5 CUSTOMER-BASED STRUCTURE .............................................................80
7.6 LEADERSHIP AND MANAGEMENT ..........................................................81
7.7 PREMIUM PRICE .....................................................................................82
7.8 ADDITIONAL FINDINGS ..........................................................................84
7.9 SYNTHESIS OF THE FINDINGS .................................................................88
8 CONCLUSIONS...........................................................................................90
8.1 EVALUATING RESULTS...........................................................................91
8.2 SUGGESTIONS FOR FUTURE RESEARCH ..................................................92
8.3 CONCLUDING REMARKS.........................................................................92
REFERENCES ...................................................................................................93
PERSONS INTERVIEWED ...........................................................................100
APPENDICES...................................................................................................102
VII
LIST OF FIGURES FIGURE 1. OUTLINE OF THE THESIS.................................................................................................... 6
FIGURE 2. EXPORTING AS LEARNING EXPERIENCE ........................................................................... 12
FIGURE 3. PRINCIPAL OF INDIRECT AND DIRECT EXPORT CHANNELS................................................ 13
FIGURE 4. PORTER’S FIVE COMPETITIVE FORCES THAT DETERMINE INDUSTRY PROFITABILITY........ 20
FIGURE 5. STAKEHOLDER MODEL OF BRAND EQUITIES AND EXPECTATIONS .................................... 26
FIGURE 6. BUSINESS-RELATIONSHIP TRIAD AND SOCIAL INTERACTION............................................ 36
FIGURE 7. CHANNEL STRUCTURE FOR CONSUMER PRODUCTS......................................................... 38
FIGURE 8. INTERNATIONAL DISTRIBUTION LIFE CYCLE .................................................................. 43
FIGURE 9. COMPONENTS OF LEADING .............................................................................................. 45
FIGURE 10. TIKKURILA LOCATIONS................................................................................................. 56
FIGURE 11. MAJOR BRANDS IN TIKKURILA GROUP.......................................................................... 57
FIGURE 12. TIKKURILA’S CORPORATE STRUCTURE.......................................................................... 58
FIGURE 13. GEOGRAPHICAL DISTRIBUTION OF NET SALES IN 2006................................................. 59
FIGURE 14. SOUTH-EAST EUROPEAN COUNTRIES............................................................................ 61
FIGURE 15. PAINT CONSUMPTION IN EUROPE................................................................................... 72

VIII
LIST OF TABLES TABLE 1. SALES AND ENTRY STRATEGY APPROACH ......................................................................... 8
TABLE 2. CLASSIFICATION OF ENTRY MODES ................................................................................. 10
TABLE 3. ADVANTAGES AND DISADVANTAGES OF INVESTMENT ENTRY .......................................... 15
TABLE 4. THREE GENERIC STRATEGIES........................................................................................... 22
TABLE 5. THE FOUR P COMPONENTS OF THE MARKETING MIX ......................................................... 23
TABLE 6. THE FOUR C COMPONENTS OF THE MARKETING MIX......................................................... 23
TABLE 7. FRAMEWORK FOR SALES STRATEGY ................................................................................. 30
TABLE 8. FACTORS THAT INFLUENCE CHANNEL DESIGN .................................................................. 39
TABLE 9. INTERNATIONAL CHANNEL INTERMEDIARIES ................................................................... 40
TABLE 10. SOURCES FOR LOCATING FOREIGN INTERMEDIARIES ...................................................... 42
TABLE 11. PERFORMANCE PROBLEMS AND REMEDIES WHEN USING OVERSEAS DISTRIBUTION ........ 44
TABLE 12. EASE OF DOING BUSINESS COMPONENTS ....................................................................... 63
TABLE 13. EASE OF DOING BUSINESS RANKING .............................................................................. 64
TABLE 14. FDI INWARD STOCK 2005 .............................................................................................. 67
TABLE 15. CORRUPTION PERCEPTION INDEX 2005 AND GLOBAL PRESS FREEDOM INDEX 2007...... 69
TABLE 17. CHARACTERISTICS OF SUCCESSFUL AND SMALL GROWTH COMPANIES ......................... 89
1
1 INTRODUCTION
Progressive sales organisations are becoming more strategic in their approaches to
the initiation, development, and enhancement of customer relationships. In
moving to a more strategic, less tactical approach, these organisations will be the
ones to succeed in the coming decades. Branding is changing its form from image
branding to trust branding, so empty illusions will not sell in the future
(Blumenthal, 2004). Therefore, sales and salespersons are being viewed in more
important roles when making strategical decisions concerning the path to future
success. Together with company and product branding, salespersons are the ones
to build and gain trust between customer and company. In contemplating the
future of selling and sales management, it is becoming clear that the sales function
is in the midst of a renaissance.
This Master’s thesis is being done in co-operation with Tikkurila Paints Oy and
one of its international business units, Deco International. Sustainable organic
growth is one of Tikkurila’s cornerstones on its way to develop its leading
position in order to become the best paint company in its region. The growth
needed to reach this goal can not be created from a domestic base, and therefore
international business, and especially Deco International, fulfils an important role
in the internationalisation process. The aim of this thesis is to reduce the risks of
strategic internationalisation by benchmarking other similarly successful
companies, which are operating in target markets in South-East Europe, so that
targeted growth can be reached on a more solid base.
1.1 General
The organisations that prosper and thrive will be those organisations that have
learned to change, quickly, effectively and for the better. Effective change has
always been a prerequisite for organisational survival, but change now needs to
take place at a faster pace than before. The most efficient way to promulgate
effective change is by learning from the positive experiences of others (Camp
2
1995, xiv). The fast changes in companies are needed because markets are
changing fast. New markets are emerging, trading blocks are extending and
communications channels for products and their sales are changing at a
revolutionary pace (Kotler 1999, xv). Benchmarking and best practices are not
static. They are constantly being improved or being replaced with new practices
(Camp 1995, 423). A good way to study successful sales factors is by
benchmarking other international firms.
This study was carried out between 02.01.2007 and 25.05.2007 at Tikkurila’s
headquarters in Vantaa, Finland.
1.2 Research Objectives and Limitations
The main objective for this research is to find out different sales strategies and
best practices for Deco International in Romania, Bulgaria, Serbia and Slovenia,
by benchmarking other successful international companies operating in those
areas.
Although sustainable organic growth is the foundation of Tikkurila’s strategy,
investments or acquisitions are also considered possible, thus investments as an
entry mode are discussed. Sales are influenced by a large net of company
functions and different international business subjects, therefore marketing,
branding, sales channels, leadership and different selling models are discussed.
South-East Europe was chosen according to Tikkurila’s preferences, and the
countries under investigation, (Romania, Serbia, Slovenia, and Bulgaria) were
chosen by Deco International managers. Information collected and analysed will
form part of Deco International manager’s decision-making process, when
choosing different entry models, distributors or other issues related to the process
of internationalisation.
The benchmarking procedure was chosen because Tikkurila wanted to gain
knowledge of successful experiences outside its own industrial sector. It was
3
hoped that such an approach would give new ideas or support existing ones, when
starting business in South-East Europe. This was done by interviewing
international companies, which had to fulfil the following conditions:
• Company had to be international
• Company’s product(s) had to be within the top three most expensive
brands in their own market segment
• Company had to operate in at least one of the countries under review
• Company had to have been operating in the area for at least two years
• Company had to be operating in an industry other than paint
Based on these research limitations, four companies were chosen. All of them
have performed economically well in the target markets and also in their domestic
market. From these chosen companies, export managers or managers responsible
for the area under review were interviewed using an in-depth interviewing
method. To broaden the reader’s and researcher’s view of business in target
markets and to increase the validity of the research, 16 experts were also
interviewed using the same method. These experts represented the following areas
of expertise: commercial specialists from the Finnish and Swedish Embassies, a
Greek Commercial Attaché, Finpro’s representative agents from Finland and the
target countries, two international companies and local media and consulting
firms.
The sales strategy framework, created by Ingram (2001) and his colleagues, has
two limitations, which have to be taken into consideration when interpreting the
research results. First, the framework has not been tested in real business life. It is
just an academic review of available literature and the professional opinions of the
authors. Secondly, due to its publishing date of 2001, some parts of the framework
may be outdated.
While going through the research methodology literature, the researcher also
considered evaluating case study methodology, but because the object of research
was not the company itself, this was not done. Many similarities were, however,
4
found between different theses and such things as illustrative case studies research
(See more Erikson & Koistinen 2005).
1.3 Research Methodology
The study is a qualitative synthesis of the available primary data obtained from
interviews, but also from a collection of secondary data sources including research
reports. A significant part of the work concentrates on literature review of the
research topic, explaining sales strategy framework and analysing primary data
obtained from interviews.
The topic has not been widely studied in international academic society
(Lindblom 2007). This caused some difficulties in finding a relevant academic
framework for this study. After discussion with Arto Lindblom (2007), a
professor at the Helsinki School of Economics, it was decided that a combination
of different theories related to the research subject such as competitive strategy,
competitive advantage, marketing mix and brand equity should be used together
with the sales strategy framework of Ingram (2001) and his colleagues.
In-depth interviews create, as always in qualitative research, possibilities for error
and misinterpretation. Attempts were made to minimise these errors by acting
systematically. A list of questions was sent to the interviewees in advance, so that
all issues reviewed during the interview were familiar (Appendix 5). Benefits for
the interviewees were also mentioned. The list itself was formed according to
available literature and previous studies. All the subjects were discussed during
the interview, whether the interviewees knew much or little about them, giving a
statistical base for the research. Before starting the interview, interviewees were
asked to sign a document stating that all information collected during the
interview was confidential. Permission to record the interviews was also requested
(Appendix 6). This increased the willingness to reveal information that was not
public. All interviews were recorded electronically, except one which was
recorded manually. All the interviews were transcribed into a Word document
within one week of the interview. This process also helped the researcher to
5
remember other issues influencing the interview (atmosphere, openness) while
still having a fresh picture of the situation. Once all interviews had been carried
out and research theory largely completed, information from the interviews was
written down on nine A2 sheets and grouped according to their answers and the
researcher’s list of questions. From those findings, outliers1 were removed, and
experts’ opinions emphasised more than those from people who were not so
familiar with the subject.
Due to the confidential nature of the interviews and research, even small interview
examples can not be revealed. That would have spiced up the research topic and
provided the reader with more concrete results. However, the list of questions
together with empirical findings and conclusions will hopefully illuminate the
field of South-East European sales strategy for the reader.
1.4 Structure of the Study
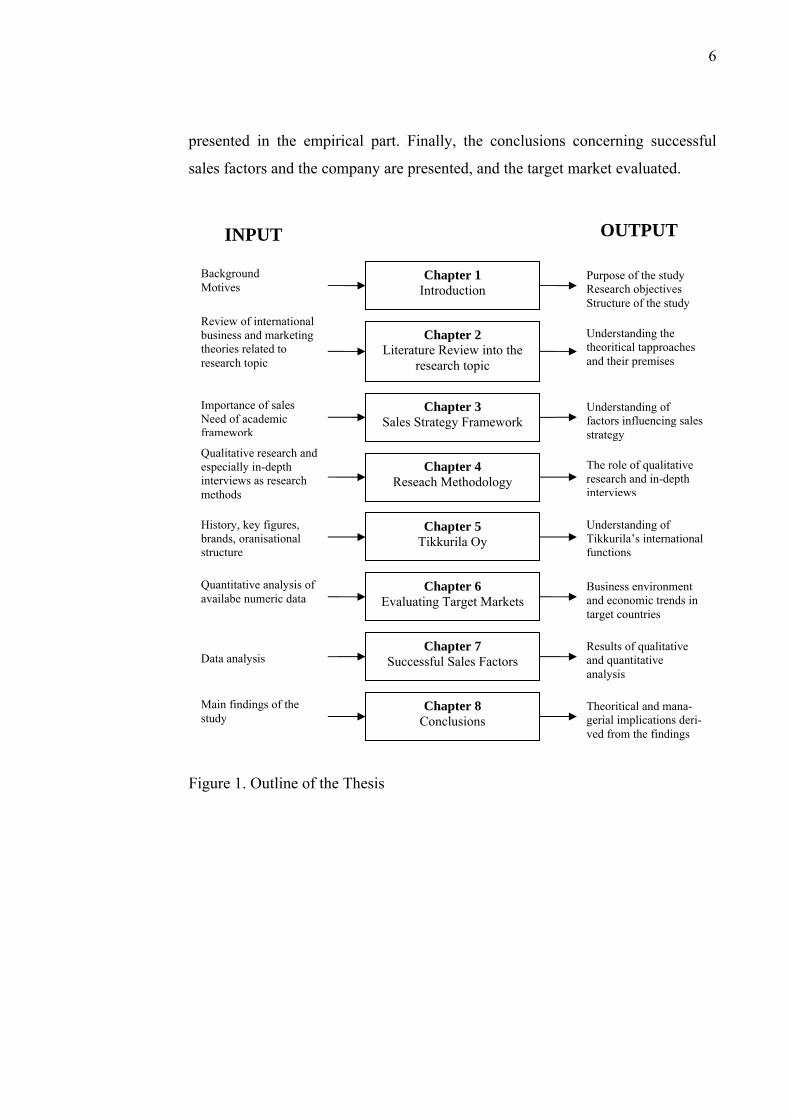
In academic studies the research process needs to be well documented and
presented in order to make the entire reasoning process, all the way from the data
to final implications, transparent for the reader. The structure of the present thesis
including the inputs and outputs of each phase of the research process, as well as
their relation to the chapter of the study is outlined in Figure 1.
The basic idea of the structure is to describe the process from top-down, from
origin country to target market. First, different entry strategies are described and
specific modes are discussed more carefully. Then international competitive
strategy, competitive advantage, marketing mix and brand equity are reviewed.
This section gives the reasons why, for example, branding is needed and how
competitive advantage can be sustained. After that, Ingram’s sales strategy
framework and research methodologies are presented. The actual study is
1 An outlier is an observation that lies outside the overall pattern of a distribution. Usually, the presence of an outlier indicates some sort of problem. This can be a case which does not fit the model under study or an error in measurement (Moore and McCabe 1999).
6
presented in the empirical part. Finally, the conclusions concerning successful
sales factors and the company are presented, and the target market evaluated.
Figure 1. Outline of the Thesis
Chapter 1 Introduction
Chapter 2 Literature Review into the
research topic
Chapter 3 Sales Strategy Framework
Chapter 4 Reseach Methodology
Chapter 5 Tikkurila Oy
Chapter 6 Evaluating Target Markets
Chapter 7 Successful Sales Factors
Chapter 8 Conclusions
INPUT OUTPUT
Background Motives
Review of international business and marketing theories related to research topic
Importance of sales Need of academic framework
Qualitative research and especially in-depth interviews as research methods
Results of qualitative and quantitative analysis
Business environment and economic trends in target countries
Understanding of factors influencing sales strategy
Understanding the theoritical tapproaches and their premises
Understanding of Tikkurila’s international functions
Purpose of the study Research objectives Structure of the study
The role of qualitative research and in-depth interviews
Quantitative analysis of availabe numeric data
History, key figures, brands, oranisational structure
Data analysis
Main findings of the study
Theoritical and mana-gerial implications deri-ved from the findings

7
2 LITERATURE REVIEW INTO THE RESEARCH TOPIC
International business has several globally known theories that are presented in
the following chapter. All of these theories have been previously studied as
individual topics by marketing and business scholars. However, there has been no
attempt to integrate these theories and combined effects. Most of the theories,
such as business relationships and brand equity, overlap, but are studied separately
and from a certain point of view. The following theories that influence the
research topic have been chosen together with Tiusanen and Lindblom (2007).
First, different entry strategies to the target markets are briefly reviewed. Two of
these entry strategies are selected for closer study based on Tikkurila’s
preferences. Then three rules for deciding upon entry mode are presented.
Secondly, Michael Porter’s competitive strategy and competitive advantage for
international business are studied. Thirdly, the general features of Philip Kotler’s
marketing mix are reviewed. Finally, the importance of brand and creation of
brand equity are illustrated.
2.1 Entry Strategies
An entry strategy for international markets is a complicated and comprehensive
plan. According to Root (1994), the chosen entry strategy sets forth the objectives,
goals, resources, and policies that will guide a company’s international business
operations over a future period long enough to achieve sustainable growth in the
chosen markets. For most companies, the entry strategy time horizon is from three
to five years, because it will take that long to achieve enduring market
performance (Root 1994, 22-23). At this point, the difference between entry mode
and market entry should be explained. Root (1994, 24-26) distinguishes them as
follows: market entry can be described as a marketing plan in a certain market,
and entry mode is how an international company finds its way into country and its
markets. Hence the international company must decide on both an entry mode and
a marketing plan for each foreign target country. (Root 1994, 24-26) Later on in

8
this chapter, issues influencing market entry such as marketing mix and branding
are discussed.
Without an entry strategy for a product or target market, a company has only a
sales approach to foreign markets. Table 1 contrasts the sales and entry strategy
approaches. Although having an entry strategy is highly recommended, Root
(1994, 24) points out that sales approach may be narrowly justified for a first-
entry company lacking international experience, and doubtful of its ability to
compete abroad. But prolonged adherence to the sales approach will almost
certainly destroy a company’s international business. That approach is simply not
viable in a world of international competitors who plan and act to create foreign
market positions for long-term success (Root 1994, 24).
Table 1. Sales and Entry Strategy Approach (Root 1996, 25)
Entry Strategy versus Sales Approach to International Markets
Sales Approach Entry Strategy Approach Time horizons Short run Long run (3-5 years) Target markets No systematic selection Selection based on
analysis of market /sales potential
Dominant Objective Immediate sales Build permanent market position Resource commitment Only enough to What is necessary
get immediate sales to gain permanent market position

9
Classification of Entry Modes
Since entry mode as a critical sales factor is only one part of the research, only
distinguishing features according to Root (1994, 27-28) are cited here, and two of
them have been chosen for closer study based on Tikkurila’s preferences. In
export entry modes, a company’s final or intermediate product is manufactured
outside the target country and subsequently transferred to it. Thus, exporting is
confined to physical products. Indirect exporting uses middlemen who are located
in the company’s own country and who actually do the exporting. In contrast,
direct exporting does not use home country middlemen, although it may use target
country middlemen (Root 1994, 27).
Contractual entry modes are long-term non-equity associations between an
international company and an entity in a foreign target country that involve the
transfer of technology or human skills from the former to the latter. Contractual
entry modes are distinguished from export modes because they are primarily
vehicles for the transfer of knowledge and skills, although they may also create
export opportunities. They are distinguished from investment entry modes
because there is no equity investment by the international company (Root 1994
27).
Entry mode No systematic choice Systematic choice of most appropriate mode
Channels No effort to control Effort to control in support of market objectives/ goals Price Determined by Determined by demand,
domestic full cost with competition, objectives, some ad hoc adjustments and other marketing to specific sales situations policies, as well as costs
Promotion Mainly confined to Advertising, sales
personal selling or promption, and personal left to middlemen selling mix to achieve
market objectives/ goals

10
Investment entry modes involve ownership by an international company of
manufacturing plants or other production units in the target country. Different
investment entry modes can be distinguished from each other in terms of
production stage and in terms of ownership and management control. (Root 1994,
28)
Table 2. Classification of Entry Modes (Root 1994, 26).
It is obvious, as Philip Kotler (2000, 365) says, that a company does not belong in
markets where it cannot be the best. This means that the company has to have
clear targets for the internationalisation or globalisation process. Practically, this
means that leaders have a clear mission and vision, and the correct strategies to
achieve them. According to Deco International managers, there are two common
and strategically reasonable ways to achieve the desired market position with
Tikkurila’s products: through exports and investments. Based on these starting-
Contractural Entry Modes
Licensing Franchising Technical agreements Service contracts Management contracts Contract manufacture Countertrade arrangements Other
Investment Entry Modes
Sole venture: new establishment (Green-field) Sole venture: acquisition (Brown-field) Joint venture: new establishment/ acquisition Other
Export Entry Modes
Indirect Direct agent/ distributor Direct branch/ subsidiary Other

11
points, the following pages will more closely review export mode and investment
mode as suitable entry strategies for Tikkurila.
2.1.1 Entering International Markets Through Exports
After deciding on its target country market and product, a company must decide
on the most appropriate entry mode. According to Root (1994, 73), the neophyte
international firm is therefore more concerned with minimising international
market and political risks than with maximising control over international
marketing operations. Given this situation, exporting is the most common way for
a manufacturer to engage in international business for the first time.
Root (1994, 73) claims that exporting can become an international learning
experience, a development process that takes the firm towards increasingly
international sophistication and commitment. Figure 2 describes the effect of this
learning experience on risk perception. Root (1994, 74) describes this learning
process as follows: at the start, the company has no experimental knowledge of
target markets, and this conscious ignorance generates uncertainties that cause
managers to perceive foreign business risks as far higher than domestic business
risks. But as the company gains knowledge and confidence from actual export
experience, perceived foreign risks decline to approach the level of perceived
domestic risks. At the same time, rational decision-making displaces or limits the
behavioural factors (fears, anxieties, ethnocentric biases, etc) that dominated
earlier decision-making. Managers now consider direct export modes that allow
greater control over the foreign marketing effort; risk is balanced against
opportunity.

12
Figure 2. Exporting as learning experience (Root 1994, 74).
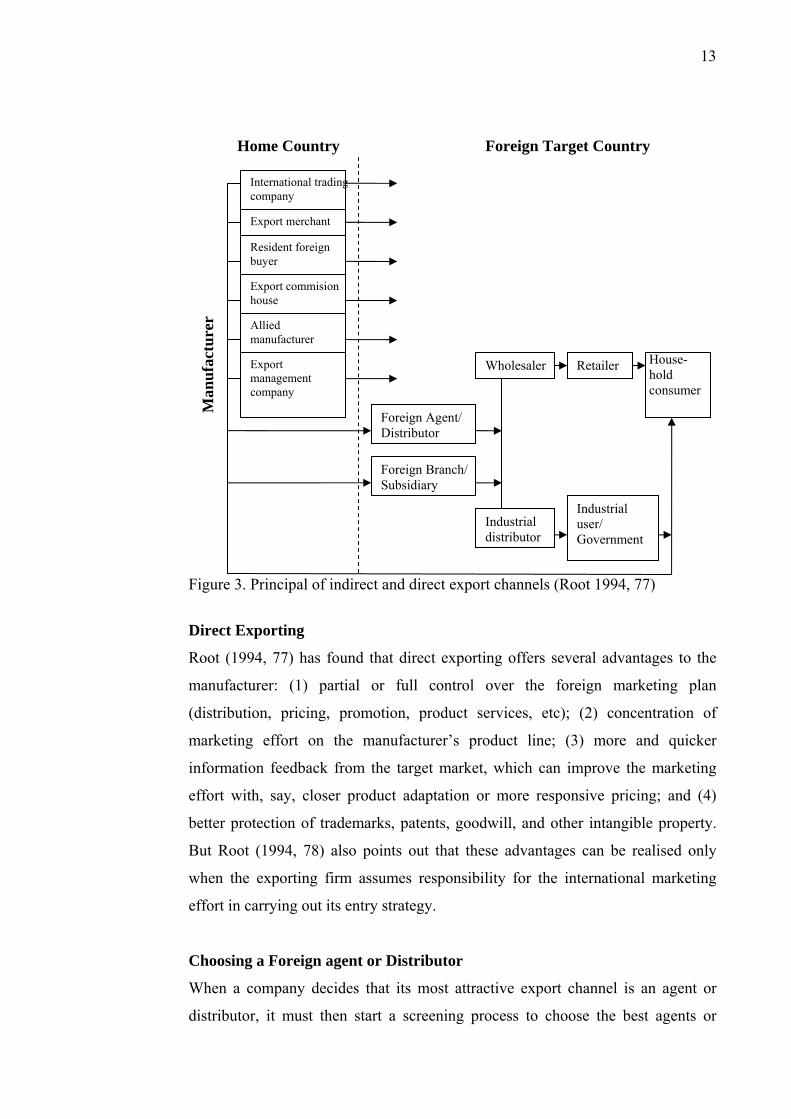
To get its product into a foreign target market, a company can use several export
modes or channels. Root (1994, 77) has collected principal export channels and
shown then in the figure 3 illustrated below. The key distinction among these
alternative channels is the presence or absence of independent export agencies
located in the home country. When a manufacturing firm uses domestic agencies,
it does not undertake exporting on its own and has at most a marginal role in the
foreign marketing of its product. That is why exporting through domestic
intermediaries is called indirect exporting (Root 1996, 75-76). In the case of
Tikkurila, indirect exporting is largely out of the question, because the company
wishes to keep a certain level of control over product and marketing in its target
market. That is why indirect exporting is left out of the more precise observation.
The only exception is allied manufacturing which, in some cases, might be
important enough for closer inspection.
Knowledge of foreign country / market
Perc
eive
d fo
reig
n ris
ks a
s co
mpa
red
to d
omes
tic ri
sks
Time
13
Figure 3. Principal of indirect and direct export channels (Root 1994, 77)
Direct Exporting
Root (1994, 77) has found that direct exporting offers several advantages to the
manufacturer: (1) partial or full control over the foreign marketing plan
(distribution, pricing, promotion, product services, etc); (2) concentration of
marketing effort on the manufacturer’s product line; (3) more and quicker
information feedback from the target market, which can improve the marketing
effort with, say, closer product adaptation or more responsive pricing; and (4)
better protection of trademarks, patents, goodwill, and other intangible property.
But Root (1994, 78) also points out that these advantages can be realised only
when the exporting firm assumes responsibility for the international marketing
effort in carrying out its entry strategy.
Choosing a Foreign agent or Distributor
When a company decides that its most attractive export channel is an agent or
distributor, it must then start a screening process to choose the best agents or
Man
ufac
ture
r
Foreign Target Country
International trading company
Export merchant
Resident foreign buyer
Export commision house
Allied manufacturer
Export management company
Foreign Agent/ Distributor
Foreign Branch/ Subsidiary
Wholesaler Retailer
Industrial distributor
Industrial user/ Government
Home Country
House-hold consumer
14
distributors. Finding good foreign distributors and agents is a difficult process and
demands considerable attention and effort from manufacturers. Root (1994, 85)
has divided this screening process of choosing a foreign distributor into four
phases: (1) drawing up the distributor profile, (2) locating distributor prospects,
(3) evaluating distributor prospects, and (4) choosing the distributor.
2.1.2 Entering International Markets Through Investment
Root (1994, 143-144) has divided companies investing in foreign production into
three groups: (1) Extractive investors, (2) Sourcing investors, and (3) Market
investors2. This latter group of investors, which regards investment as a foreign
market entry mode, is the subject of the next pages, based on Tikkurila’s
requirements. The probability of successful investment entry can be enhanced, for
example, by building on experience gained through export to the target country or
market. As Root (1994, 146) states: “prior export experience lessens a key
uncertainty in the investment entry decision: the sales potential in the target
market for the company’s product.”
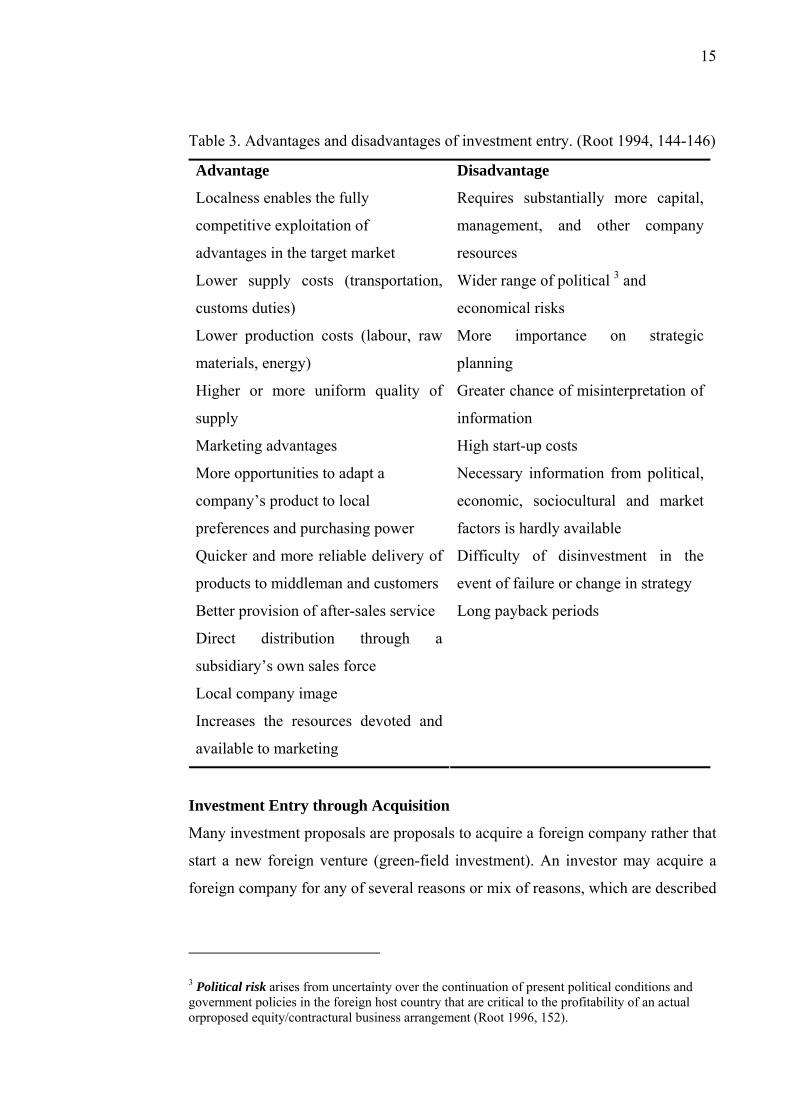
Advantages and Disadvantages of Investment Entry
As is true of other entry modes, investment also offers both advantages and
disadvantages to a company. By allowing a company to transfer managerial,
technical, marketing, financial, and other skills (its “knowledge assets”) to a target
country in the form of an enterprise under its control, investment entry can,
according to Root (1994, 144-146), have at least the following advantages and
disadvantages.
2 Extractive investors establish foreign subsidiaries to exploit natural resources in order to acquire raw materials for their own industrial operations or for sale on world markets. Sourcing investors establish foreign operations to manufacture products that are entirely or mainly exported to the home country or third countries. The purpose is to obtain lower-cost supplies of components, parts, or finished goods by taking advantage of abundant resources of labour, energy or other in a foreign country. Market investors account for the greatest investment abroad. Their objective is to penetrate a target market from a production base inside the target country (Root 1996, 143-144).
15
Table 3. Advantages and disadvantages of investment entry. (Root 1994, 144-146)
Advantage Disadvantage
Localness enables the fully
competitive exploitation of
advantages in the target market
Requires substantially more capital,
management, and other company
resources
Lower supply costs (transportation,
customs duties)
Wider range of political 3 and
economical risks
Lower production costs (labour, raw
materials, energy)
More importance on strategic
planning
Higher or more uniform quality of
supply
Greater chance of misinterpretation of
information
Marketing advantages High start-up costs
More opportunities to adapt a
company’s product to local
preferences and purchasing power
Necessary information from political,
economic, sociocultural and market
factors is hardly available
Quicker and more reliable delivery of
products to middleman and customers
Difficulty of disinvestment in the
event of failure or change in strategy
Better provision of after-sales service Long payback periods
Direct distribution through a
subsidiary’s own sales force
Local company image
Increases the resources devoted and
available to marketing
Investment Entry through Acquisition
Many investment proposals are proposals to acquire a foreign company rather that
start a new foreign venture (green-field investment). An investor may acquire a
foreign company for any of several reasons or mix of reasons, which are described
3 Political risk arises from uncertainty over the continuation of present political conditions and government policies in the foreign host country that are critical to the profitability of an actual orproposed equity/contractural business arrangement (Root 1996, 152).
16
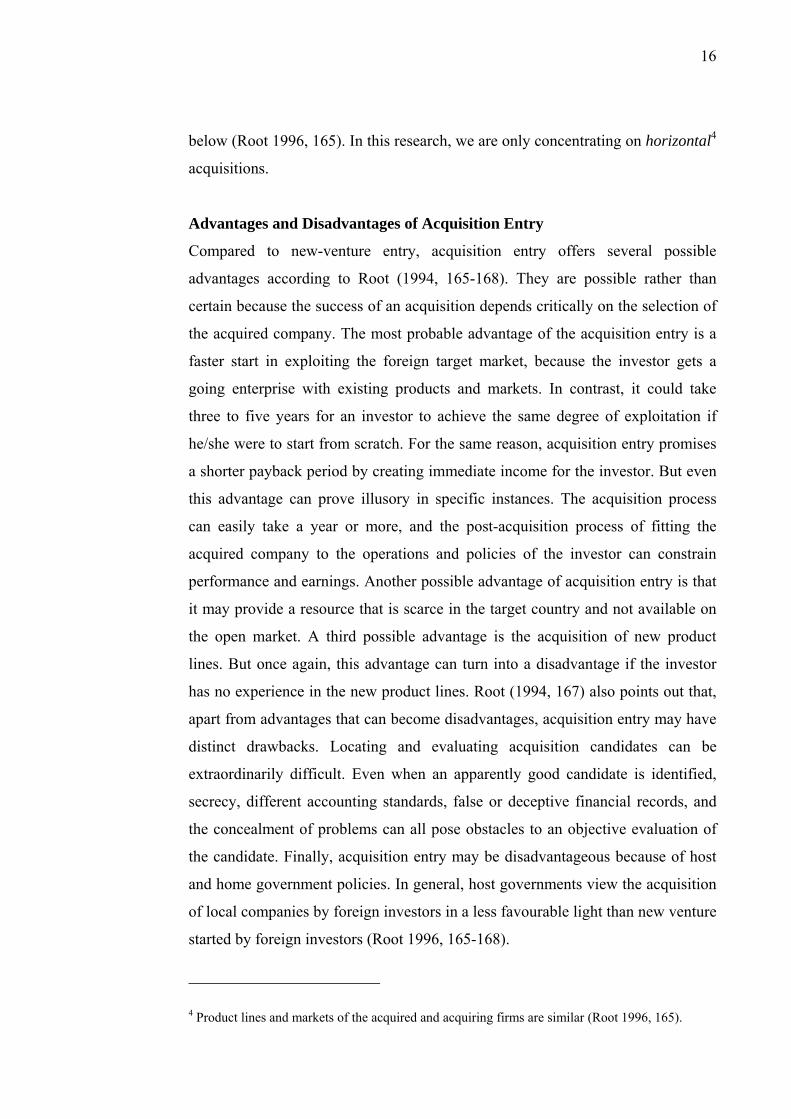
below (Root 1996, 165). In this research, we are only concentrating on horizontal4
acquisitions.
Advantages and Disadvantages of Acquisition Entry
Compared to new-venture entry, acquisition entry offers several possible
advantages according to Root (1994, 165-168). They are possible rather than
certain because the success of an acquisition depends critically on the selection of
the acquired company. The most probable advantage of the acquisition entry is a
faster start in exploiting the foreign target market, because the investor gets a
going enterprise with existing products and markets. In contrast, it could take
three to five years for an investor to achieve the same degree of exploitation if
he/she were to start from scratch. For the same reason, acquisition entry promises
a shorter payback period by creating immediate income for the investor. But even
this advantage can prove illusory in specific instances. The acquisition process
can easily take a year or more, and the post-acquisition process of fitting the
acquired company to the operations and policies of the investor can constrain
performance and earnings. Another possible advantage of acquisition entry is that
it may provide a resource that is scarce in the target country and not available on
the open market. A third possible advantage is the acquisition of new product
lines. But once again, this advantage can turn into a disadvantage if the investor
has no experience in the new product lines. Root (1994, 167) also points out that,
apart from advantages that can become disadvantages, acquisition entry may have
distinct drawbacks. Locating and evaluating acquisition candidates can be
extraordinarily difficult. Even when an apparently good candidate is identified,
secrecy, different accounting standards, false or deceptive financial records, and
the concealment of problems can all pose obstacles to an objective evaluation of
the candidate. Finally, acquisition entry may be disadvantageous because of host
and home government policies. In general, host governments view the acquisition
of local companies by foreign investors in a less favourable light than new venture
started by foreign investors (Root 1996, 165-168).
4 Product lines and markets of the acquired and acquiring firms are similar (Root 1996, 165).

17
2.1.3 Deciding on the Right Entry Mode
In this chapter, we return to the question: how should managers decide on the
right entry mode for a given product and given target country or market? Root
(1996, 181) presents three rules for deciding on entry mode selection, which can
be distinguished by their degree of sophistication: the naïve rule (use same entry
mode for each target market), the pragmatic rule (use a workable entry mode for
each target market), and the strategy rule (use the right entry mode for each target
market).
The Naïve Rule
Like the name implicates, naïve rule is simple and ignores the heterogeneity of
country markets and entry conditions. According to Root (1994, 181), managers
follow the naïve rule when they consider only one way to enter foreign markets.
Statements such as “We only export” or “We only license” are examples of the
naïve rule. Managers using this rule are guilty of tunnel vision, and, sooner or
later, they give up a promising foreign market that cannot be penetrated with their
only entry mode, or they will enter a market with an inappropriate mode. Entering
a foreign market with the wrong mode is also a likely consequence of the naïve
rule, because managers acting on the presumption that their preferred mode is also
the right one do not bother to assess the long-run profitability of the preferred
mode for a particular target country (Root 1996, 181-182).
The Pragmatic Rule
During his research, Root (1994, 182) has found out that most firms appear to
start their international business careers by using the pragmatic rule. Root explains
that the outstanding advantages of export as a learning experience and export as
low-risk entry mode has lead to a point that, in practice, new international
managers begin their search for an entry mode by assessing export prospects in a
target country. Only if export entry is not feasible or profitable do they continue to
look for a workable entry mode. Although the pragmatic rule is not best for entry
mode selection, Root points out that the rule holds certain advantages for a

18
company and its managers. The risk of entering a target market with the wrong
mode is minimised, because managers reject any mode that is not workable. This
rule also saves on the cost of gathering information on alternative entry modes and
the management time required assessing them. And if managers are rewarded for
positive results but are not punished for failing to do something that would bring
better results, why search for the right or best entry mode. What is most important
is that an entry mode that works may not be the right entry mode (Root 1996, 182-
183).
The Strategy Rule
The strategy rule –use the right entry mode– is more difficult for managers to
handle than the pragmatic rule, because it demands systematic comparisons of
alternative models. But, as previously stated, it also guides managers to better
entry decisions. Root (1994, 183) states that comparison of alternative entry
modes is complicated by the need of managers to assess the advantages and
disadvantages of each mode in terms of a company’s multiple objectives in the
target market, objectives that are seldom fully consistent. An entry mode that
scores highly on one objective (say, rate of growth rates) may score low on
another objective (say, profitability). Somehow, managers must decide on trade-
offs among their several objectives (Root 1996, 183-184).
According to Root (1994, 184) managers may view the strategy rule as too
arduous or time-consuming to apply in the real world. Given the complexity of
the entry mode decision, what is demanded is not abandonment of the strategy
rule, but rather an approach that facilitates systematic comparisons of alternative
modes (Root 1996, 184).
2.2 Competitive Strategy and Competitive Advantage
In this section, two globally known theories affecting corporate strategy are
reviewed. Michael E. Porter wrote about competitive strategy as early as 1980, but
it is still one of the most influential models of business strategy (Rugman and
D’Cruz 2000, 4). Competitive strategy set a framework for analysing industries
19
and competitors. It also described three generic strategies for achieving
competitive advantage: cost leadership, differentiation and focus. Competitive
advantage, written by the same author, is the heart of a firm’s performance in
competitive markets (Porter 1985, xv).
Competitive Strategy
Porter developed a model of competitive strategy, which extends the components
of business strategy from a concern with general and environmental factors to a
more specific focus on the nature of competition facing a firm (Rugman & D’Cruz
2000, 4). The ultimate aim of competitive strategy is to cope with and, ideally, to
change competition rules that determine an industry’s attractiveness in the firm’s
favour (Porter 1985, 4). Porter shows that competition in an industry is influenced
by five factors: the rivalry among existing firms, the threat of new entrants, the
threat of substitutes, and the bargaining power of suppliers (Rugman & D’Cruz
2000, 4). These are illustrated in figure 4.

20
Figure 4. Porter’s five competitive forces that determine industry profitability.
(Porter 1985, 5)
According to Rugman and D’Cruz (2000, 4), all these competitive forces reflect
structural (environmental) factors facing the firm, and together they determine the
attractiveness of the industry and the performance of the firm. However, the firms
can influence all these factors by the appropriate strategy; strategy unlocks the
environmental constraints (Rugman & D’Cruz 2000, 4). Industry profitability is
not a function of what the product looks like or whether it embodies high or low
technology, but of industry structure (Porter 1985, 5).
Porter explains that rivalry exists when a competitor sees the opportunity to
improve its position. Intense rivalry results from many factors, including
numerous or equally balanced competitors, high fixed costs, and high strategic
stakes. Since these factors can and do change, companies can attempt to defend or
improve their position, for example through strategic moves, such as offering a
new service or product development (Rugman & D’Cruz 2000, 4).
Threat of new entrants to industry
Bar
gain
ing
pow
er o
f su
pplie
rs
Threat of substitute products or services
Bargaining pow
er of buyers
EXISTING COMPETITORS
Buyers Su
pplie
rs
Substitutes
Potential Entrants

21
Porter found that the threat of new entrants depends largely on the ability of the
industry to erect entry barriers, which exclude newcomers, and substitute products
can act as a competitive threat by placing a limit on potential returns through price
ceilings. Two categories of substitutes deserve the most attention: those that are
subject to trends improving their price performance and those that are produced
by industries earning high profits (Rugman & D’Cruz 2000, 4).
Competition can also be influenced by the bargaining power of buyers and
suppliers. According to Rugman and D’Cruz, purchases compete by forcing down
prices or demanding higher quality or better service. Alternatively, a supplier can
use its market power to raise prices or lower quality. The complexities of this are
greater for multinational enterprises (MNE’s), since they often face government
purchases and local content requirements, which constrain the strategic choices,
open to them (Rugman & D’Cruz 2000, 5).
Competitive Advantage
The earlier section, competitive strategy, set forth a framework for analysing
industries and competitors. This chapter translates that understanding into
competitive advantage. Porter has developed three generic strategies that an
established firm can follow to protect its market position. These are: cost
leadership, involving strict cost control; product differentiation based on brand
names; and focus, which is the creation of a `unique` product or area of sale, that
is, the creation of market niche (Rugman and D’Cruz 2000, 7). The three generic
strategies are sometimes delusive because four strategies are commonly known.
This can be explained by the fact that the focus strategy has two variants, cost
focus and differentiation focus (Porter 1985, 11). The three generic strategies are
shown in Table 4. Rugman and D’Cruz (2000, 7) remind us that there are also
risks involved in these strategies. For example, a cost-leadership approach can be
undercut by a newcomer with low-cost learning. Similarly, product differentiation
narrows differences in product lines and leads to the risk of imitation. Finally,
competitors may be able to hit upon submarkets in the chosen niche, thus
destroying the focus of the MNE.

22
Table 4. Three Generic Strategies (Porter 1985, 12).
2.3 Marketing Mix
Marketers use numerous tools to elicit desired responses from their target markets.
One traditional depiction of marketing activities is in terms of the marketing mix.
According to Kotler (2000, 15) marketing mix is the set of marketing tools that
the firm uses to pursue its marketing objectives in the target market. Although
Kotler’s Marketing Management has 718 pages and Principles of marketing has
1,031 pages, this research settles only for shortly reviewing the 4P model, so that
reader can remember that marketing more than just TV commercials.
Kotler cited Jeremy McCarthy’s abstract classification of marketing tools, and
united them into well-known 4P’s of marketing: product, price, place and
promotion. The particular marketing variables under each P are shown in table 5.
Kotler (2000, 19) states that marketing-mix decisions must be made to influence
the trade channels as well as the final consumers. Kotler also reminds us that the
firm can change its price, sales force size, and advertising expenditure in the short
term, but it can develop new products and modify its distribution channels only in
COMPETITIVE ADVANTAGE C
OM
PET
ITIV
E S
CO
PE
Cost Leadership
Differentation Focus
Differentation
Cost Focus
Lower Cost Differentation
Bro
ad ta
rget
N
arro
w T
arge
t

23
the long term. Thus, the firm typically makes fewer period-to-period marketing-
mix changes in the short term than the number of marketing-mix decision
variables might suggest (Kotler 2000, 19).
Table 5. The four P components of the marketing mix (Kotler 2000, 15).
Note that the four Ps represent the sellers’ point of view of the marketing tools
available for influencing buyers. From a buyer’s point of view, each marketing
tool is designed to deliver a customer benefit. Robert Lauterborn suggested that
the sellers’ four Ps correspond to the customers’ four Cs as can be seen from table
6 below. (Kotler 2000, 16)
Table 6. The four C components of the marketing mix (Kotler 2000, 16).
MARKETING MIX
PRODUCT PROMOTION PRICE PLACE
Product variety Quality Design Features Brand name Packaging Sizes Services Warranties Returns
List price Discounts Allowances Payment period Credit terms
Sales promotion Advertising Sales Force Public relations Direct marketing
Channels Coverage Assortments Locations Inventory Transport
TARGET MARKET
Product Price Place Promotion
Customer solution Customer cost Convenience Communication
4 Ps 4 Cs

24
Kotler (2000, 16) wrote that: “Winning company will be those who can meet
customer needs economically and conveniently and with effective
communication.” Kotler found two key themes while studying the integrated
marketing from the buyers’ or sellers’ point of view, which are that (1) many
different marketing activities are employed to communicate and deliver value and
(2) all marketing activities are coordinated to maximise their joint effects. In other
words, the design and implementation of any marketing activity is done with all
other activities in mind (Kotler 2000, 19).
2.4 Brand and Brand Equity
Brand has become one of the most crucial success factors of companies (Herzen
2006, 41; Jones 2005, 13). It also allows marketers to charge a premium price
(Bennet and Rundle-Thiele 2005, 250; Noble 2006, 208). So what is ‘brand’?
Laakso (2004, 22-23) states that brand is the added value, which a consumer is
willing to pay on top of the price of an ordinary nameless product, which fulfils
the same function. A nameless product is just a commodity. When brand is not
able to offer something extra on comparison to a competitor’s product, it will
become a commodity. The future of commodities is determined by market price.
Laakso (2004, 24) also describes very well the necessity of brand: “Products are
needed, but brands are wanted.” This also leads to the dark side of the branding.
Brand is not created unless a customer sees the added value. For example, 71% of
new confectionery brands launched between 1995 and 1997 in Finland were
unsuccessful (Laakso 2004, 46).
Brand Equity
Brand equity is used to define the value of the brand. It is an important intangible
asset that has psychological and financial value to the firm (Kotler 2000, 276). Its
specific definition, however, varies considerably in literature. Broadly, existing
25
literature can be divided into three categories: mental brand equity, behavioural
brand equity and financial equity5. (Jones 2005, 14)
Discussions of brands and brand equity have, up until now, been almost solely
concerned with consumer markets (Jones 2005, 10; Hertzen 2006, 11). However,
Jones has found that a number of recent publications have begun to seriously look
at the application of the brand concept and that of brand equity to business-to-
business markets. These works reflect the growing consensus that the branding
concept is not only useful, but also powerful, in examining and explaining
relationships and value creation in all business relationships (Jones 2005, 10).
According to Jones, these studies reflect two important issues in brand
management: first, the importance of relationships, not just the relationship
between the firm and consumer, but also the relationships in B2B markets, and,
secondly, that brand equity in particular, and brand value in general, is not just
created through a dyadic relationship, but is a multifarious construct that is
affected by, or the sum of a gamut of relationships. (Jones 2005, 10)
There is a clear indication that financial performance is the key measure of
success today. Jones suggests in his research paper that firms need to be able to
justify their activities and investments to shareholders in term of value creation.
Brand managers are thus being challenged on two fronts: first, to broaden their
view of brand relationships to consider a range of different stakeholders where
brand value is created, and, secondly, to be able to assess and put value on the
worth on these relationships (Jones 2005, 10-11).
5 Mental brand equity: the impact of the brand on the consumer’s consciousness. Behavioural brand equity: The consumer’s behavioural response to the brand (or that which can be directly attributable to the brand). Financial brand equity: the financial impact of the brand as expressed through return on investment, profit, turnover, price-to-earnings ratio etc.

26
Stakeholder Approach
What can stakeholder6 theory tell us about equity? Stakeholder theory challenges
the notion that firms exist only to serve the needs of the shareholders (Hitt et al.
2001, 28-29). Jones states that, in relation to brand equity, the stakeholder concept
gives a much richer picture of sources of brand value and equity. It forces us to
examine the range of relationships in which the brand is engaged, and to recognise
that brand equity is created through multifarious relationships. The stakeholder
approach gives an important tool for managing these relationships, but is also a
tool for providing an overview and prioritising those relationships that are
strategically important (Jones 2005, 16).
The stakeholder model suggests two things: first, that multiple stakeholder
relations are important sources of equity for total brand equity, and, secondly that
there are relations between these stakeholders, and therefore between the
individual equity equations (Jones 2005, 17). Figure 5 illustrates these
relationships. It also describes expectations of different stakeholder groups.
Figure 5. Stakeholder model of brand equities and expectations (Jones 2005, 23)
6 Stakeholders are the individuals and groups who can affect, and are affected by, the strategic outcomes achieved and who have enforceable claims on a firm’s performance (Hitt et.al. 2001, 28).

27
Brand Loyalty
Marketers must understand what brand loyalty is, bearing in mind that brand
loyalty will be different for each brand managed. The research of Bennet and
Rundle–Thiele suggests that customers can demonstrate brand loyalty in a variety
of ways. For example, customers can demonstrate loyalty by purchasing, by being
willing to recommend, and by providing advice to the company, and finally,
through an intention to repurchase (Bennett and Rundle-Thiele 2005, 258).
Bennet and Rundle-Thiele suggests (2005, 258) in their research that brand
loyalty is more stable for market leaders than for others. Richard Jones (2005, 11),
on the other hand, thinks that it is clear that established brands are facing great
challenges to maintain their dominant position –challenges that come from newly
emerging brands, private labels and the increasing eclecticism or fragmentation of
the consumer from stringent competition and expectations from financial markets
for increased brand performance, and finally from a consumer backlash against
highly visible brand symbols. As Jones (2005, 11) says it: “Brand may never have
been stronger (at least in terms of brand equity valuations), but this is also true of
the forces that are working against them“.
According to Bennet and Rundle-Thiele, marketers of brand that do not have
market leadership status are presented with one challenge, and that is
differentiation. To achieve differentiation, marketers must take risks and introduce
products that are both different from the competition and meaningful to the
customer. For example, to achieve differentiation and hence loyalty, some
marketers are focusing on creating experience for customers. Experience is a very
useful basis for differentiation, as it is likely to be difficult to copy (Bennett and
Rundle-Thiele 2005, 259).
Why Branding?
Basically it all comes to one thing - money. Companies in Great Britain, for
example, which have concentrated heavily on branding during the last 15 years,
have approximately 15-20 % better stock value then average stock companies

28
(Laakso 2004, 25). Successful branding creates higher sales at higher margins,
greater competitiveness, higher levels of loyalty and lower risk, not only when
things go wrong but also when launching new products or entering new markets
(Noble 2006, 209). In 2004, in research among business leaders at the World
Economic Forum in Davos, 59% of the CEO’s present stated that brands
represented over 40% of their companies’ market value (for brand-focused
companies, this percentage will be significantly greater) (Noble 2006, 210).

29
3 SALES STRATEGY FRAMEWORK
Finding an appropriate academic framework for sales strategy was surprisingly
difficult. Sales has been traditionally seen as part of marketing decisions, and
therefore discussed under marketing-related topics. But due to need and target of
this thesis, the marketing point of view was felt to be inappropriate. A suitable
academic framework was finally found in a work by Thomas Ingram et al. While
interpreting the framework results, two limitations must be borne in mind: first,
the age of the research report. It was done in 2001, which can be seen as old
material within certain international business areas, as the world of business is
changing rapidly. Secondly, it is only an academic review of available literature
and is based on the authors’ own experiences. Moreover, it has not been tested in
real business life. It would have been extremely interesting to read and hear more
about further studies by Ingram and his colleagues on sales strategy framework
and its implications for real business life, but unfortunately this information was
not available.
Ingram et al. (2001) sees the change, or rather renaissance, in the value of sales in
comparison with other corporate functions. Ingram agues that progressive firms
are becoming more strategic in their approaches to the sales function. Therefore,
sales organisations are redirecting their salespersons’ time usage from
administrative activities to serving customers, so that they can become true
strategic partners with their customers. Successful firms view their customers as
key assets, and they entrust their salespeople with managing these assets.
Increasingly, salespeople are bringing a bottom-line orientation to the job rather
than concentrating solely on the production of sales revenue (Ingram et al. 2001,
559).
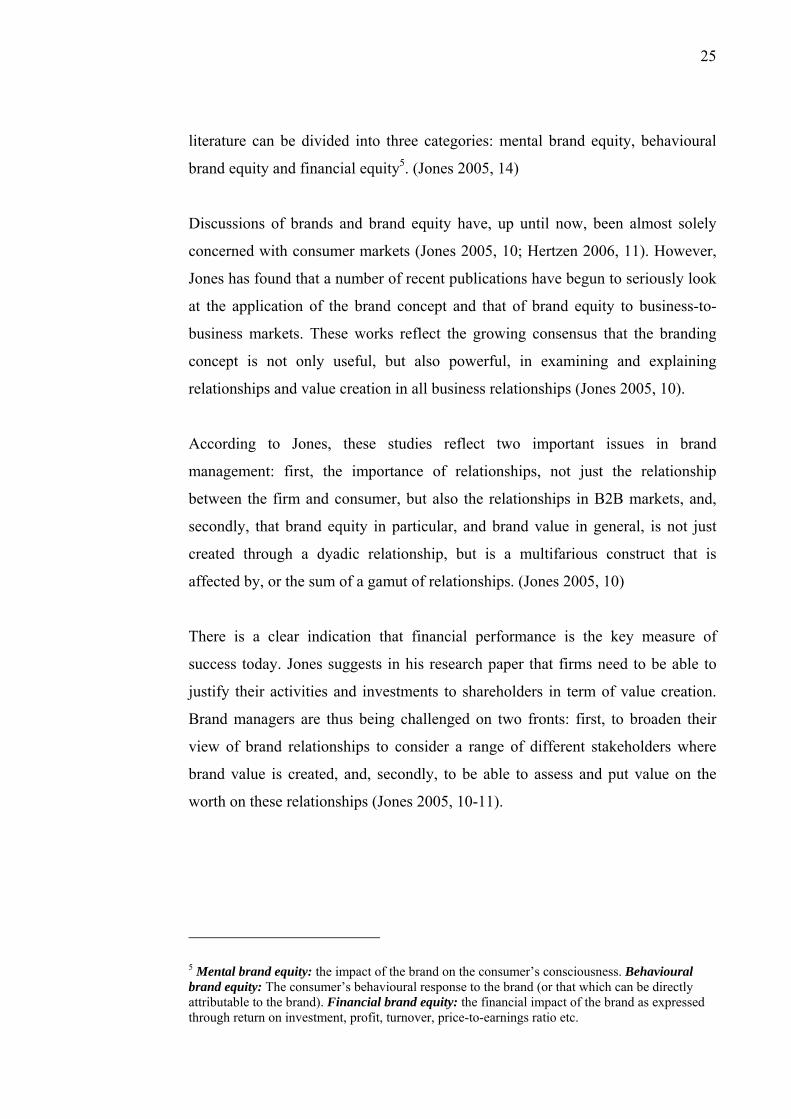
This research will only concentrate on sales strategy and structure components
from Ingram’s framework. Due to research limitations (the length and the depth of
the research) given by final thesis instructions, the sales leadership part will be
only be briefly reviewed. Sales leadership is also a subjective area and it would
30
have needed a totally different research approach to fulfil the reliability and
validity requirements of the research, It is, however, a highly interesting area
when studying sales success and therefore further research into this field is
recommended.
Table 7. Framework for sales strategy. (Ingram et al. 2001, 560)
3.1 Elements and Importance of Sales Strategy
As mentioned earlier there is no widely accepted conceptualisation of the
elements of a sales strategy. However, Ingram (2001) suggests some agreement
that an effective sales strategy must address the segmentation and prioritisation of
Sales strategy and Structure
Sales Leadership
Technological framing and
systems
Sales Force performance
Organisational performance
Leadership / Management Technology Performance
Segmentation and Prioritisation Relationship Objectives Sales Channels Selling Models Customer-based Structure
LMX Model Transformational Leadership Behavioural Self Management Sales Supervision Sales Management Development
Sales Force Automation CRM Technology Model CRM via Internet Wireless CRM PRM Technology Model
Revenue -Product -Key Customer Margins -Pricing -Upselling Customer Satisfaction -Respon siveness -Solution Expertise Customer Loyalty and Retention Cross-Selling Revenue Sales Force Efficiency
Sales Growth Returns on Sales Cash Flow New Product Success Less Enterprise Risk (Customer Churn)
31
customers, different relationship objectives and selling models, and multiple sales
channel approaches. Furthermore, an element of adaptability is assumed as a
condition for the successful development and implementation of sales strategy. In
the following chapters, these strategical elements are reviewed.
It is naïve to assume that in our modern, complex society, everyone needs and
wants the same. In the same way, it is naïve to think that all the customers would
present the same opportunity to a firm (Solomon et al. 2006, 203). Therefore,
Ingram (2001, 560) wrote that: “a strategy is needed to translate marketing
strategies defined at the target market level into sales strategies at the customer
level.”
According to Ingram (2001, 560), the specific sales strategy developed by a sales
organisation will, in turn, define the types of salespeople needed and the
appropriate selling and sales management processes, activities, and technologies.
The net result is that sales strategy drives the interaction with customers and has a
major impact on the management of a sales organisation. The centrality of the
customer to the firm strongly implies the need to re-examine the strategic role and
value of the selling function and the importance of developing a sales strategy to
drive the customer interaction process (Ingram et al. 2001, 560).
3.2 Customer Segmentation and Prioritisation
Marketers use different segmentation, targeting and positioning approaches to
design different marketing mixes to appeal certain consumers (Solomon 2006,
204). In contrast, according to Ingram, salespeople sell to customers within target
segments. Trying to sell to all of these customers in the same way is not likely to
be effective or profitable. Therefore, the first step in developing a sales strategy is
to define specific customer groups and prioritise them in terms of potential
importance to the firm. Once the customers groups are defined, the other sales
strategy elements address how to interact successfully with each customer group
(Ingram et al. 2001, 561). Because defining specific customer groups is highly
dependent on a company itself, and therefore can not be easily be compared
32
between other companies, the following pages will review the most commonly
known consumer segmentation theories.
Instead of trying to sell something to everyone (mass marketing), marketers select
a target marketing strategy, in which they divide the total market into different
segments based on customer characteristics, select one or more segments, and
develop products to meet the needs of those specific segments (Solomon et al.
2006, 203). The idea of target marketing is to build the right relationships with the
right customers. The target marketing process has three levels: (1) segmentation,
(2) targeting and (3) positioning. Segmentation is the process of dividing a larger
market into smaller pieces based on one or more meaningful shared
characteristics. The next step is targeting, in which marketers evaluate the
attractiveness of each potential segment and decide in which of these groups they
will invest resources to try to turn them into customers. The final stage of
developing a target marketing strategy is positioning. Positioning means
developing a market strategy aimed at influencing how a particular market
segment perceives a product or service in comparison to the competition
(Solomon et al. 204-220).
Segmentation of Consumer and Business Markets
There is no single way to segment a market. Therefore, the marketer tries different
variables to see which give the best segmentation opportunities. For consumer
marketing, the major segmentation variables are geographic, demographic,
psychographic and behavioural (Kotler & Keller 2006, 247). Geographic
segmentation calls for dividing the market into different geographical units such
as nations, states, regions, counties, cities, or neighbourhoods. In demographic
segmentation, the market is divided into groups on the basis of variables such as
age, family size, gender, income and education. In psychographic segmentation,
the market is divided into different groups based on social class, lifestyle, or
personality characteristics. In behavioural segmentation, the market is divided into
groups based on consumers’ knowledge, attitudes, uses or responses to a product
(Kotler & Keller 2006, 247-255).

33
Although the specific variables may differ in business-to-business markets, the
underlying logic of classifying the larger market into manageable pieces that share
relevant characteristics is the same as in consumer markets. According to Kotler
and Keller (2006, 258-261), business markets can also be segmented by business
consumer demographics (industry, company size), operating characteristics,
purchasing approaches, situational factors and personal characteristics. The
effectiveness of segmentation analysis depends on finding segments that are
measurable, accessible, substantial, differentiable and actionable.
Target Marketing Strategy
To target the best markets segments, a company first evaluates each segment’s
size and growth characteristics, structural attractiveness and compatibility with
company objectives and resources. The next step is targeting, in which, according
to Solomon (2006, 216), marketers evaluate the attractiveness of each potential
segment and decide in which of these groups they will invest resources to try to
turn them into customers. The customer group or groups are the firm’s target
market. Solomon et al. (2006, 218-220) presents five targeting strategies as
follows: undifferentiated targeting strategy appeals to a broad spectrum of people.
If successful, this type of operation can be very efficient, especially because
production, research, and promotion costs benefit from economies of scale.
Differentiated targeting strategy develops one or more products for each of
several customer groups with different product needs. A differentiated strategy is
called for when consumers are choosing among well-known brands that have
distinctive images and the company can identify one or more segments that have
distinct needs for different types of products. Concentrated targeting strategy is
used when companies focus their efforts on offering one or more products to a
single segment. Smaller firms that do not have the resources or the desire to be all
things to all people often use this strategy. A custom marketing strategy is
common in industrial contexts in which a manufacturer often works with one or a
few large clients and develops products that only these clients will use. This kind
of strategy can be also seen in the service sector where, for example, hairstylists

34
are satisfying the individual needs of a customer. Mass customisation can be said
to be a new trend in the area of segmentation. Its purpose is to modify a basic
product or service to meet the needs of an individual (Solomon et al. 2006, 218-
220).
Market Positioning Strategy
Once a company has decided which segments to enter, it must decide on its
market positioning strategy – which positions to occupy in its chosen segments.
According to Solomon (2006, 220), positioning strategy has four steps: (1)
analysing competitors’ positions, (2) offering a product or service that has a
competitive advantage, (3) matching elements of the marketing mix to the
selected segment and (4) evaluating the target market’s responses and modifying
strategies if needed.
Customer Relationship Management; Segment of One
CRM is about communicating with customers and about customers being able to
communicate with a company on a one-to-one basis (Solomon et.al.2006, 224).
Kotler and Keller (2006, 152) state that the idea in the CRM process is managing
detailed information about individual customers, and carefully managing all
customer touch points 7 to maximise customer loyalty. They also think that
customer relationship management enables companies to provide excellent real-
time customer service through the effective use of individual account information.
Based on what they know about each valued customer, companies can customise
market offerings, services, programmes, messages and the media. According to
Kotler and Keller (2006, 153), CRM is important because a major driver of
company profitability is the aggregate value of the company’s customer base.
Solomon (2006, 224) presents a four-step procedure for one-to-one marketing. (1)
Identify customers and know them in as much detail as possible. (2) Differentiate
7 A customer touch point is any occasion on which a customer encounters the brand and product – from actual experience to personal or mass communications to casual observation (Kotler&Keller 2006, 152).

35
between these customers in terms of both their needs and their value to the
company. (3) Interact with customers and find ways to improve cost efficiency
and the effectiveness of the interaction. (4) Customise some aspect of the goods or
services which can be offered to each customer. This means treating each
customer differently based on what has been learned through customer interaction.
3.3 Relationship Objectives and Selling Models
The research of Ingram et al. indicates that many customers think relationships
with suppliers provide them with more value and lower costs. However, many
customers still prefer to purchase on a transactional basis for all or some products,
and customers differ in the types of relationships desired. In addition, Ingram
(2001, 560) states that there are extreme cost differences for different types of
relationships. Practically this means that the type of relationship and the selling
model used for each customer group must balance customer value and cost.
Salespersons play an important role in this process, because they are the ones to
evaluate the value and cost of the customer and then to choose the right
relationship and selling model for them.
According to Ingram (2001, 561), the different types of relationships can be
viewed as a continuum, ranging from a price-sensitive transaction orientation on
one extreme, to a complex buyer–seller partnership on the other extreme. In
between these extremes are a variety of different types of relationships. Different
points along the relationship continuum typically require different selling models
depending upon the depth of the relationship, with more expensive and
customised models used in the closer relationships. Ingram (2001, 561) wrote
that:” correctly balancing cost considerations and customer preferences in
matching relationship objectives and selling models to customer groups is
critical.
Business-Relationship Triads
Business relationships are usually studied as if they were dyads between a selling
party and buying party (See e.g. Ford et al. 1998), for example, between a

36
manufacturer and a distributor, or between a manufacturer and an industrial
customer. However, according to Havila et al. (2004), in international business in
particular, the selling party is often represented by some kind of intermediary,
often located in the buying party’s country. Examples of intermediaries in
international settings are sales subsidiaries and agents (Root 1994, 77). This
means that these relationships are by nature not dyadic, but triadic. In particular,
Havila et al. (2004) assumes that important and complex international business
relationships require that both the manufacturer and the intermediary are involved
in the relationship. In some of these cases, the intermediary acts as a mediator
between the selling party and the buying party, meaning that there is no direct
contact between the seller and the buyer. In these situations, the dyadic approach
is appropriate, as one dyad exists between the selling party and the intermediary,
and another between the intermediary and buying party. However, in some
international business relationships, the intermediary takes care of some of the
contacts between the selling party and buying party, but not all contacts. This
means that these business relationships are triadic by nature (Havila et al. 2004,
172-183).
Figure 6. Business-relationship triad and social interaction (Havila et al. 2004,
175).
A Supplier
C Customer
B Intermediary
Social Interaction
37
In her research, Havila et al. found that triads have some specific characteristics
that do not exist in dyads. For example, in addition to the direct relationship
between A and B, for instance, there is also an indirect one, which is derived from
their common relation to C. In other words, each of the three parties functions as
an intermediary between the other two. Thus, in a triad, all three parties need not
always interact directly at the same time. Also the total amount of social
interaction is limited in a “true” triad. For example, if A is interacting with B, it
cannot at the same time interact with C unless they are all in the same place, or
engaging in a conference call or e-mailing (Havila et al. 2004, 175).
3.4 Multiple Sales Channel Approaches
Channels of distribution provide the essential linkages that connect producers and
customers. Optimal distribution systems are flexible and are able to adjust to
market conditions. In general, according to Czinkota and Ronkainen (2004, 334),
companies use one or more of the following distribution systems: (1) the firm
sells directly to customers through its own field sales force or through electronic
commerce; (2) the company operates through independent intermediaries, usually
at the local level; or (3) the business depends on an outside distribution system
that may have regional or global coverage
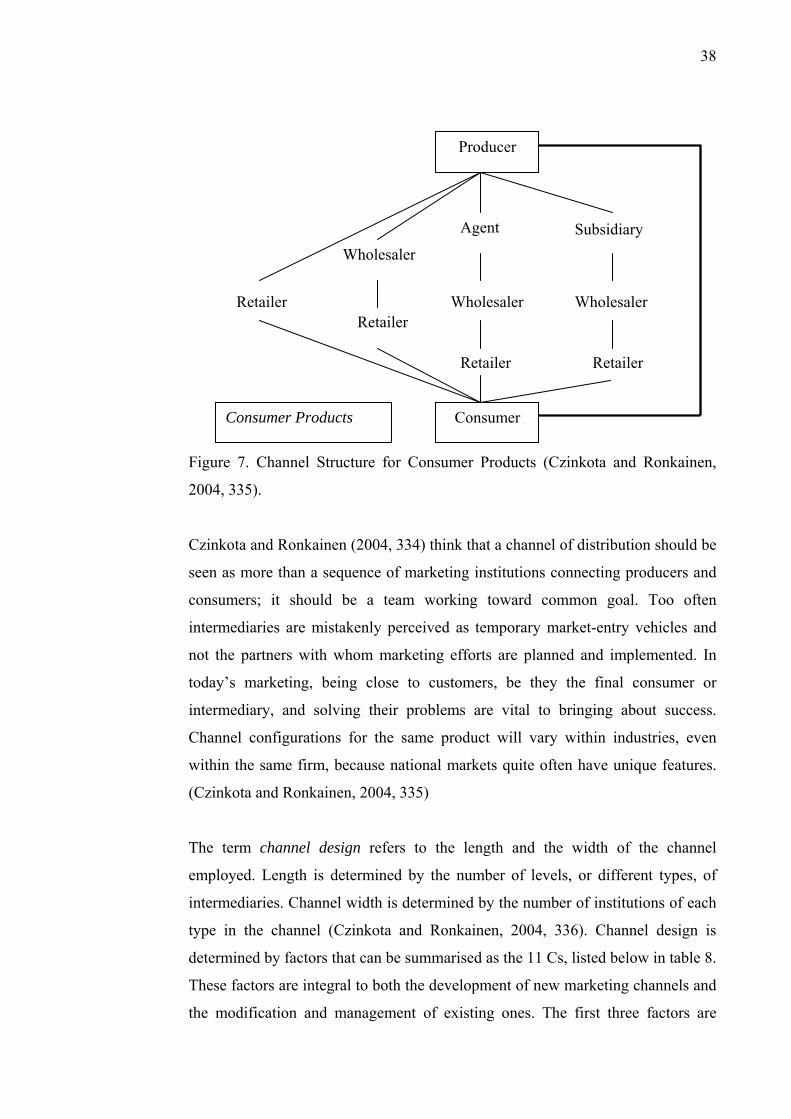
38
Figure 7. Channel Structure for Consumer Products (Czinkota and Ronkainen,
2004, 335).
Czinkota and Ronkainen (2004, 334) think that a channel of distribution should be
seen as more than a sequence of marketing institutions connecting producers and
consumers; it should be a team working toward common goal. Too often
intermediaries are mistakenly perceived as temporary market-entry vehicles and
not the partners with whom marketing efforts are planned and implemented. In
today’s marketing, being close to customers, be they the final consumer or
intermediary, and solving their problems are vital to bringing about success.
Channel configurations for the same product will vary within industries, even
within the same firm, because national markets quite often have unique features.
(Czinkota and Ronkainen, 2004, 335)
The term channel design refers to the length and the width of the channel
employed. Length is determined by the number of levels, or different types, of
intermediaries. Channel width is determined by the number of institutions of each
type in the channel (Czinkota and Ronkainen, 2004, 336). Channel design is
determined by factors that can be summarised as the 11 Cs, listed below in table 8.
These factors are integral to both the development of new marketing channels and
the modification and management of existing ones. The first three factors are
Producer
Consumer
Agent
Wholesaler
Wholesaler Subsidiary
Retailer
Retailer
Retailer
Retailer
Consumer Products
Wholesaler

39
givens, since the firm must adjust to the existing structures. The other eight are
controllable to a certain extent by the international marketer (Czinkota and
Ronkainen, 2004, 336).
Table 8. Factors that influence channel design (Czinkota and Ronkainen, 2004,
346).
The final sales strategy element is determining the appropriate mix of sales
channels used to interact with customers in different groups. In general, customer
groups at the transaction end of the relationship continuum are served by less
expensive sales channels, while those at the collaborative end are served by more
expensive sales channels (Ingram et al.2001, 560). However, Ingram points out
that the specific sales channel mix for each customer group should be determined
by delineating the specific selling activities to be performed for each customer
group and identifying the sales channel alternatives for each selling activity. Then,
the least expensive sales channel that will perform the sales activity effectively
should be selected. This type of approach will generate a cost-effective sales
channel mix for each customer group. Developing this type of comprehensive
sales strategy will assist the selling function in successfully implementing a firm’s
corporate, business and marketing strategies (Ingram et al. 2001, 560-561).
External:
Customer Characteristics
Culture
Competition
Internal:
Company Objectives
Character
Capital
Cost
Coverage
Continuity
Communication
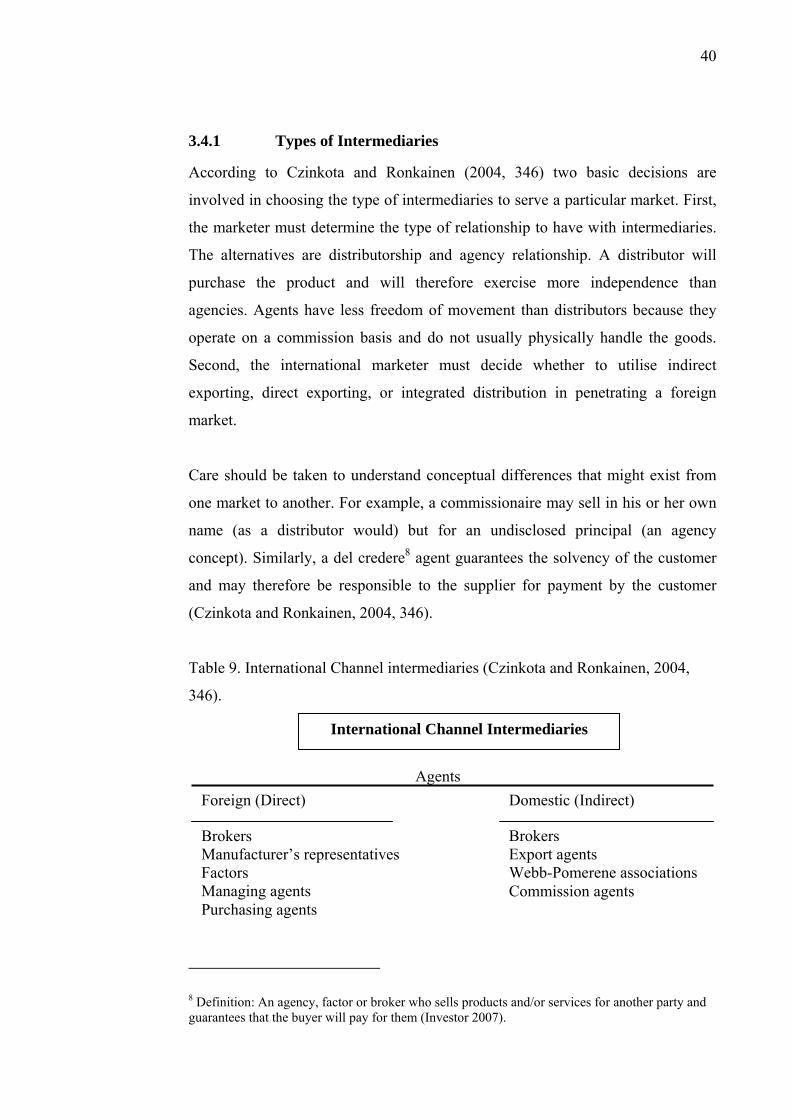
40
3.4.1 Types of Intermediaries
According to Czinkota and Ronkainen (2004, 346) two basic decisions are
involved in choosing the type of intermediaries to serve a particular market. First,
the marketer must determine the type of relationship to have with intermediaries.
The alternatives are distributorship and agency relationship. A distributor will
purchase the product and will therefore exercise more independence than
agencies. Agents have less freedom of movement than distributors because they
operate on a commission basis and do not usually physically handle the goods.
Second, the international marketer must decide whether to utilise indirect
exporting, direct exporting, or integrated distribution in penetrating a foreign
market.
Care should be taken to understand conceptual differences that might exist from
one market to another. For example, a commissionaire may sell in his or her own
name (as a distributor would) but for an undisclosed principal (an agency
concept). Similarly, a del credere8 agent guarantees the solvency of the customer
and may therefore be responsible to the supplier for payment by the customer
(Czinkota and Ronkainen, 2004, 346).
Table 9. International Channel intermediaries (Czinkota and Ronkainen, 2004,
346).
8 Definition: An agency, factor or broker who sells products and/or services for another party and guarantees that the buyer will pay for them (Investor 2007).
International Channel Intermediaries
Agents Foreign (Direct) Domestic (Indirect)
Brokers Manufacturer’s representatives Factors Managing agents Purchasing agents
Brokers Export agents Webb-Pomerene associations Commission agents
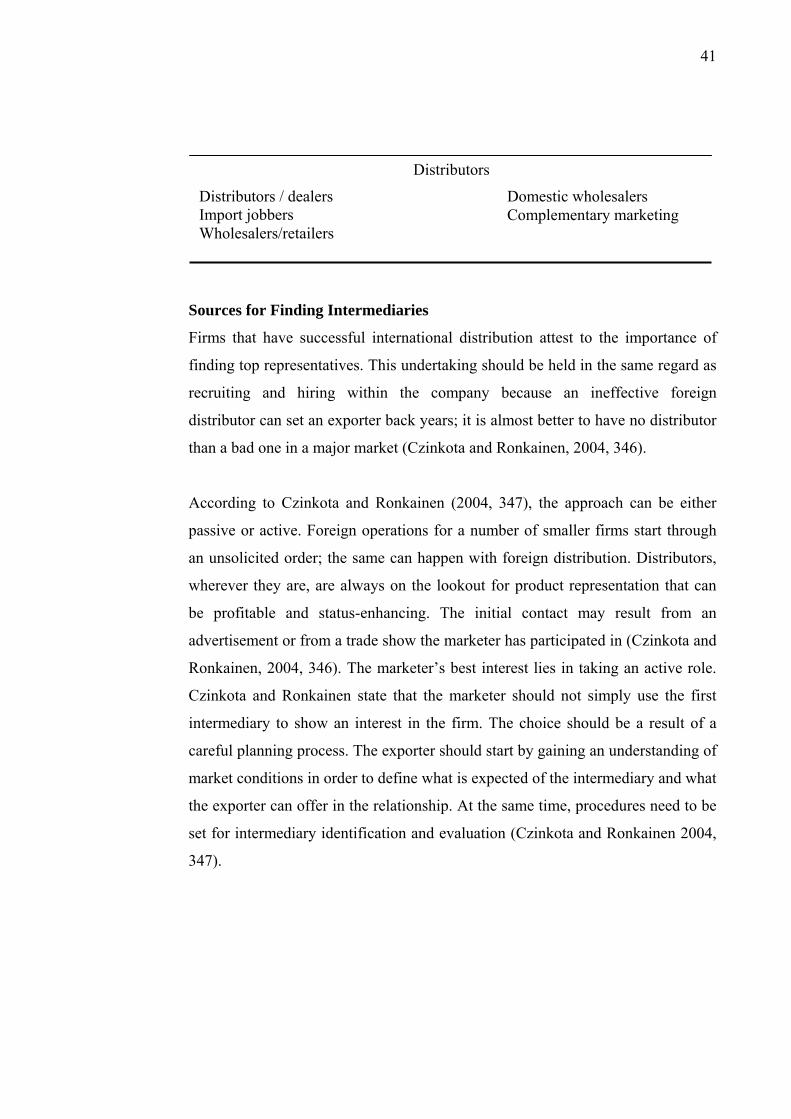
41
Sources for Finding Intermediaries
Firms that have successful international distribution attest to the importance of
finding top representatives. This undertaking should be held in the same regard as
recruiting and hiring within the company because an ineffective foreign
distributor can set an exporter back years; it is almost better to have no distributor
than a bad one in a major market (Czinkota and Ronkainen, 2004, 346).
According to Czinkota and Ronkainen (2004, 347), the approach can be either
passive or active. Foreign operations for a number of smaller firms start through
an unsolicited order; the same can happen with foreign distribution. Distributors,
wherever they are, are always on the lookout for product representation that can
be profitable and status-enhancing. The initial contact may result from an
advertisement or from a trade show the marketer has participated in (Czinkota and
Ronkainen, 2004, 346). The marketer’s best interest lies in taking an active role.
Czinkota and Ronkainen state that the marketer should not simply use the first
intermediary to show an interest in the firm. The choice should be a result of a
careful planning process. The exporter should start by gaining an understanding of
market conditions in order to define what is expected of the intermediary and what
the exporter can offer in the relationship. At the same time, procedures need to be
set for intermediary identification and evaluation (Czinkota and Ronkainen 2004,
347).
Distributors
Domestic wholesalers Complementary marketing
Distributors / dealers Import jobbers Wholesalers/retailers

42
Table 10. Sources for locating foreign intermediaries (Czinkota and Ronkainen,
2004, 350).
3.4.2 Channel Relationship
Channel relationships go through a life cycle. Over time, the manufacturer’s
marketing capabilities increase while a distributor’s ability and willingness to
grow the manufacturer’s business in that market decreases. When a producer
expands its market presence, it may expect more of a distributor’s effort than the
distributor is willing to make available. Furthermore, with expansion, the
manufacturer may want to expand its product line to items that the distributor is
neither interested in nor able to support. In some cases, intermediaries may not be
interested in growing the business beyond a certain point or as aggressively as the
principal may expect (Czinkota and Ronkainen, 2004, 361-362).
Sources for locating foreign intermediaries
1) Distributor inquiries 2) Home government
a. Trade opportunities programme b. Commercial service international contact c. Country directories of international contacts d. Agent/distributor service e. International company profile
3) Host government a. Representative offices b. Import promotion efforts
4) Trade sources a. Magazines, journals b. Directories c. Associations and Chambers of Commerce d. Banks, advertising agencies, carriers
5) Field sales organisations 6) Customers 7) Direct-mail solicitations/contact of previous applicants 8) Trade fairs 9) Websites 10) Independent consultants
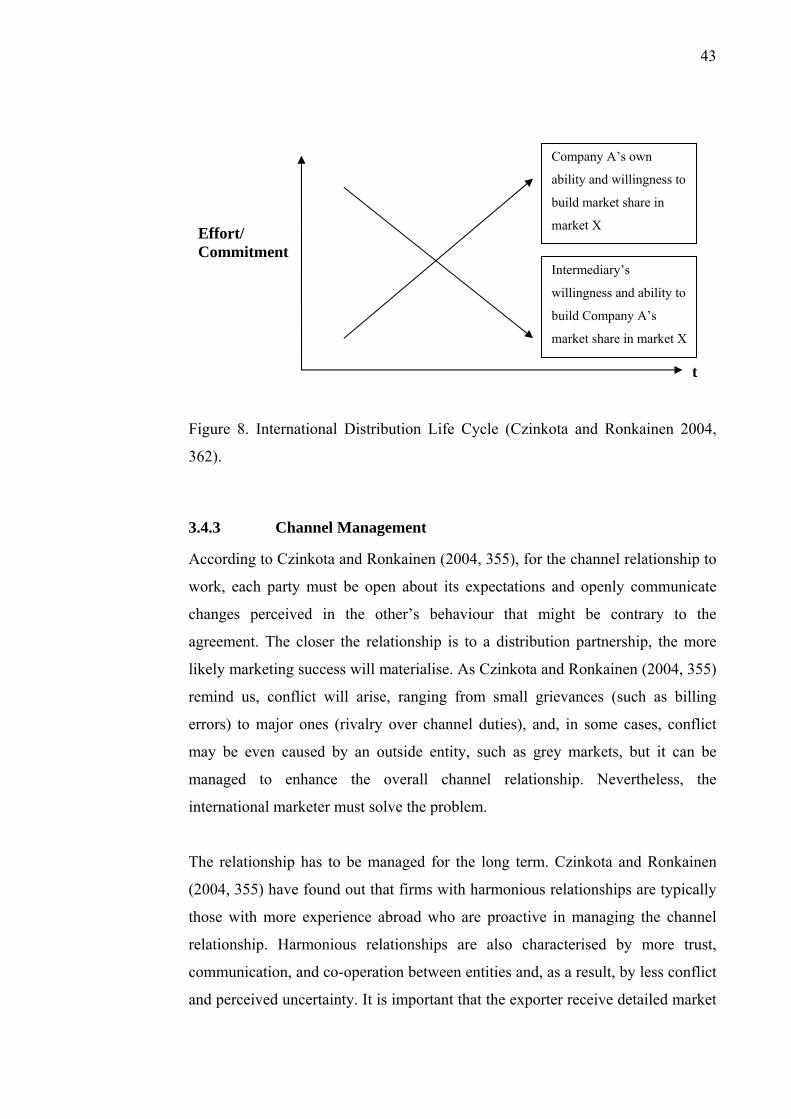
43
Figure 8. International Distribution Life Cycle (Czinkota and Ronkainen 2004,
362).
3.4.3 Channel Management
According to Czinkota and Ronkainen (2004, 355), for the channel relationship to
work, each party must be open about its expectations and openly communicate
changes perceived in the other’s behaviour that might be contrary to the
agreement. The closer the relationship is to a distribution partnership, the more
likely marketing success will materialise. As Czinkota and Ronkainen (2004, 355)
remind us, conflict will arise, ranging from small grievances (such as billing
errors) to major ones (rivalry over channel duties), and, in some cases, conflict
may be even caused by an outside entity, such as grey markets, but it can be
managed to enhance the overall channel relationship. Nevertheless, the
international marketer must solve the problem.
The relationship has to be managed for the long term. Czinkota and Ronkainen
(2004, 355) have found out that firms with harmonious relationships are typically
those with more experience abroad who are proactive in managing the channel
relationship. Harmonious relationships are also characterised by more trust,
communication, and co-operation between entities and, as a result, by less conflict
and perceived uncertainty. It is important that the exporter receive detailed market
Effort/ Commitment
Company A’s own
ability and willingness to
build market share in
market X
Intermediary’s
willingness and ability to
build Company A’s
market share in market X
t
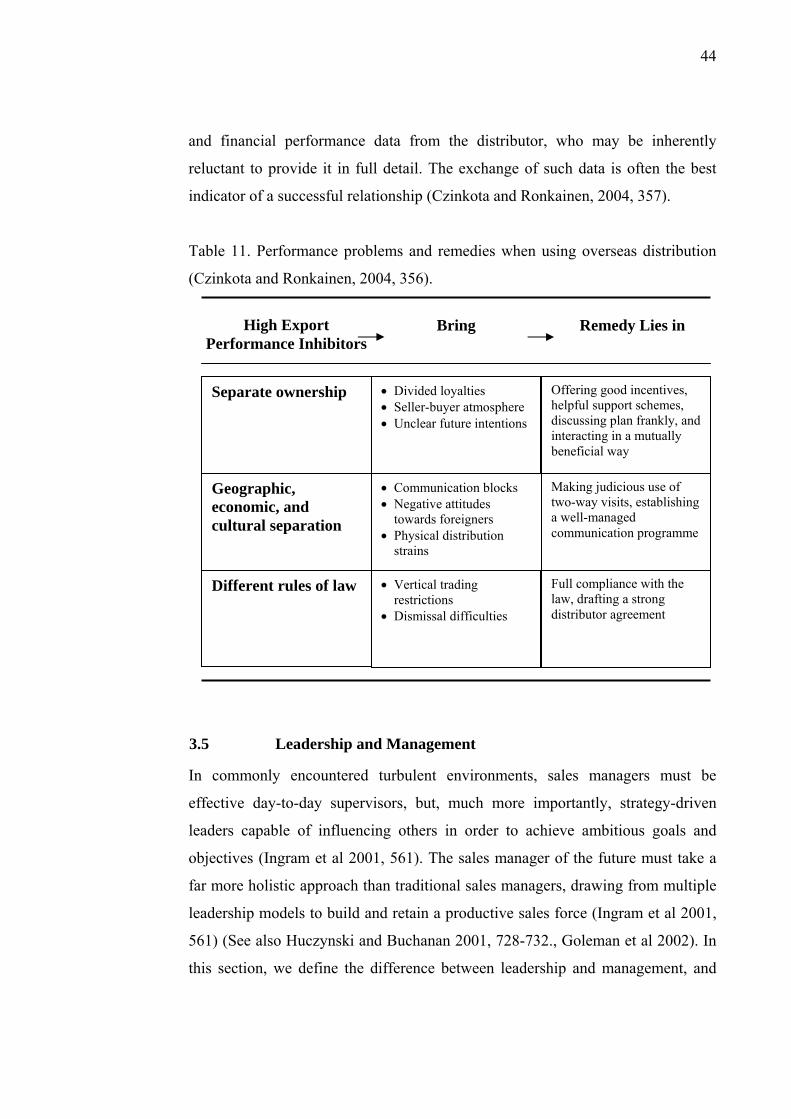
44
and financial performance data from the distributor, who may be inherently
reluctant to provide it in full detail. The exchange of such data is often the best
indicator of a successful relationship (Czinkota and Ronkainen, 2004, 357).
Table 11. Performance problems and remedies when using overseas distribution
(Czinkota and Ronkainen, 2004, 356).
3.5 Leadership and Management
In commonly encountered turbulent environments, sales managers must be
effective day-to-day supervisors, but, much more importantly, strategy-driven
leaders capable of influencing others in order to achieve ambitious goals and
objectives (Ingram et al 2001, 561). The sales manager of the future must take a
far more holistic approach than traditional sales managers, drawing from multiple
leadership models to build and retain a productive sales force (Ingram et al 2001,
561) (See also Huczynski and Buchanan 2001, 728-732., Goleman et al 2002). In
this section, we define the difference between leadership and management, and
High Export Performance Inhibitors
Remedy Lies in Bring
Separate ownership
Different rules of law
• Communication blocks • Negative attitudes
towards foreigners • Physical distribution
strains
Making judicious use of two-way visits, establishing a well-managed communication programme
Geographic, economic, and cultural separation
• Divided loyalties • Seller-buyer atmosphere • Unclear future intentions
Offering good incentives, helpful support schemes, discussing plan frankly, and interacting in a mutually beneficial way
• Vertical trading restrictions
• Dismissal difficulties
Full compliance with the law, drafting a strong distributor agreement

45
review sales leadership research that provides insights into sales management in
the 21st century
So what is the difference between leadership and management? Some
commentators argue that they are synonymous, as leadership is simply one facet
of the management role. Other commentators argue that this distinction is
significant. Leaders and managers play different roles and make different
contributions: leaders have followers and managers have subordinates (Huczynski
and Buchanan 2001, 703). It seems that distinction was more modest during
nineteenth and early twentieth century, but it has changed since then. Nowadays,
difference is seen more clearly, but, at the same time, overlapping phenomena are
accepted. Leadership is one dimension of a multifaceted management role. The
effective manager requires at least some leadership qualities (Huczynski and
Buchanan 2001, 705). Unfortunately, the neat conceptual distinction between
leader and manager does not translate neatly into practice. Toivo Lipiäinen (2001,
19) describes the difference as follows:
• Management is doing things right
• Leadership is doing right things
Figure 9. Components of leading (Lipiäinen 2001, 18)
There is quite a wide range of different leadership theories and models. They vary
from stress task and person-orientated leadership to cross-cultural leadership
LEADING THROUGH PEOPLE (Leadership).
LEADING THROUGH FACTS (Management).
46
(Onepine 2007). In recent years, sales researchers have become more active in
advancing new leadership concepts and models. In this section, we review three
contemporary models: the leader–member exchange (LMX) model,
transformational leadership, and behavioural self-management (BSM). All these
have been chosen because they relate closely to sales management and sales
leadership (Ingram et al 2001, 561).
LMX –model
According to Dionne (2000), LMX describes how a leader and an individual
subordinate develop a relationship as they influence each other and negotiate the
subordinate’s role in the organisation. As the relationship develops, the latitude
given to the subordinate by the supervisor can increase. Therefore, this model can
also be applied to the salesperson-sales manager relationship. LMX proposes that
sales managers interact uniquely with individual salespeople rather than prescribe
a particular leadership style or specific set of behaviour to match standardised
management situations. Ingram et al. (2001, 561) found that salespeople’s
perception of psychological climate at work varied greatly with the level of trust
they had in their sales managers. Salespeople with higher levels of trust in their
sales managers perceived more job autonomy, cohesion, and fairness in the
psychological climate, and felt that their organisation supported innovative sales
behaviour, and properly recognised and rewarded sales-force accomplishments.
Those who held lower levels of trust in their sales managers felt that the profit
motive was pre-eminent in the psychological climate of their organisations.
Given that sales organisations routinely deal with change, the impact of
salesperson–sales manager trust on salespeople’s willingness to change is an
important issue. Recognising that it is important for sales managers to build trust
with their salespeople is an important step in building a sales force. Ingram et al.
(2001, 561) found that trust can be gained through a role model approach or
leadership by example. Fairness and sales management familiarity with the
salesperson’s job also enhanced trust between salespeople and their managers.
One advantage of the LMX model is that it operates on the same trust-building
47
principles that many organisations are incorporating into customer relationships.
Salespeople and sales managers who routinely work on building trust with
customers may be especially motivated to engage in trust-building in the
employee–manager dyad (Ingram et al 2001, 561-562).
Transformational Leadership
In contrast to laissez-faire (sink or swim) and transactional (contingent reward)
leadership, transformational leadership adopts a long-term, highly involved style.
Transformational leaders are seen as charismatic individuals who inspire and
motivate other to go ´beyond contract´, to perform at unexpected levels
(Huczynski & Buchanan 2001, 728). Ingram (2001, 562) wrote that:
“Transformational leadership focuses on both current and future needs of
salespeople, and views intra- and extra-organisational issues holistically rather
than as discrete issues.” According to Ingram et al., transformational leaders are
seen as true ‘‘leaders,’’ not mere ‘‘managers.’’
According to Ingram (2001, 562), there are four key attributes of transformational
leaders. The first of these is attributed charisma, which requires that leaders have
a sense of mission, a vision of how to accomplish the mission, and the ability to
instill pride in and command respect from their employees. That is why
transformational leadership is also in some context called charismatic leadership9
(Onepine 2007). Second is the concept of inspirational leadership—the ability to
enthusiastically communicate what needs to be done, often through simple or
symbolic means. A transformational leader must also provide intellectual
stimulation, which results in employee willingness to try new ways of doing
things. In this capacity, the transformational leader is a change agent, utilising
rationality and intuition to stimulate progress. The fourth key attribute is
individualised consideration, through which each employee is given personalised
attention (See also McShane & Von Glinow 2000, 450-454).
9 Their leadership comes from their compelling vision that draws in commitment and acceptance of change, and offers a potential for anyone to grow and develop with the vision. Words used are trust, loyalty, devotion, commitment, inspiration, outstanding and exceptional (Onepine 2007).

48
Behavioural Self Management, BSM
Most literature on workplace motivation assumes that companies must do things
to motivate employees. Yet the truth is that employees motivate themselves most
of the time. This realisation is increasingly important as companies try to become
less reliant on direct supervision over employees (McShane & Von Glinow 2000,
119). According to Ingram (2001, 562), BSM involves self-imposed planning,
behaviour, evaluation, rewards and punishment. Ingram also reports that
approximately 20% of salespeople are self-managed. In the sales context Ingram
et al. have found BSM to be particularly appealing. First, salespeople typically
work without constant supervision, so self-directed behaviour is a key to success.
Second, salespeople may put forth incremental effort when they have significant
input into determining work priorities. Furthermore, sales managers who work
only periodically in the field with salespeople are limited in that they cannot
routinely monitor important salesperson behaviour. Worse yet, the sales manager
who works infrequently in the field may become a cue for prescribed sales
behaviour, but be unable to reinforce the prescribed behaviour when not working
in the field (Ingram et al 2001, 562-563).
3.6 Benchmarking
Many benchmarkers consider Sun Tzu, a Chinese author who lived fourth century
(B.C.) and wrote “The Art of War” to be patron saint of benchmarking (Camp
1995, xvii). In its modern form, benchmarking was developed in the 1950s, when
Japanese companies compared western products and production processes against
their own. They investigated the good features of the products, and, at the same
time, eliminated the bad features and extra costs (Junttila 1995, 8-9). Learning
from others and adopting or adapting best practice is a distinctive feature of the
benchmarking process (Jackson and Lund 2000, 4).
The purpose of benchmarking is to break the paradigm of not being able to learn
from others. The purpose of benchmarking is to (Camp 1995, 14-15):
• Analyse the operation. Benchmarking firms must assess the strengths and
weaknesses of their current work processes, analyse critical cost
49
components, consider customer complaints, spot areas for improvement
and cycle-time reduction, and find ways to reduce errors and defects or to
increase asset turns.
• Know the competition and industry leaders. Benchmarking firms must find
out who is the best of the best.
• Incorporate the best of the best. Benchmarking firms must learn from
leaders, uncover where they are and where they are going, learn the
leaders’ superior practices and why they work, and emulate the best
practices.
• Gain superiority. Benchmarking firms must try to become the new
benchmark.
Benchmarking is the search for implementation of best practices. The adoption or
adaptation of best practices allows an organisation to raise the performance of its
products, services, and business processes to leadership levels. The real benefit of
benchmarking, however, comes from understanding the practices that permit
performance and reasoned transfer to the organisation (Camp 1995, 15-16).
The American Productivity & Quality Centre has defined the process of
benchmarking as follows: ”Benchmarking is the process of comparing and
measuring your organisation against others, anywhere in the world, to gain
information on philosophies, practices, and measures that will help your
organisation take action to improve its performance. In simple terms,
benchmarking is the practice of being humble enough to admit that others are
better at something and being wise enough to learn how to match, and even
surpass, them at it.” (APQC 2006)
According to Camp (1995, 10) there are two focus levels in benchmarking:
strategic and operational. In strategic focus, benchmarking is concentrated on
strategic competitive strengths and weaknesses. It is used to understand and
develop competitive product and service strategies; to establish goals for product
performance, service, customer support levels, asset usage, and financial ratios;

50
and to develop key practices that will achieve the strategic goals. Strategically
focused benchmarking takes a broad company perspective, often called scanning,
to detect trends. It is typified by technology direction, industry trends, investment
selection, and basic competitive product and service offerings. In today’s fast-
moving business environment, benchmarking and process improvements are the
fundamentals of continuous improvement and competitiveness (Camp 1995, 13).
The base for the benchmarking is that the company itself should have proper
operational knowledge (measuring strengths and weaknesses), knowledge of
industry leaders and competitors, and the ability to combine best practices and
gain superiority (Juran & Godfrey, 1999, 12:2). According to Lecklin (1999, 175),
benchmarking can be conducted in two ways: (1) by comparing results and
measurement levels and (2) comparing practices like processes and job phases.
Lecklin also divides benchmarking into three groups (1) internal, (2) external and
(3) functional. In internal benchmarking, for example, different business units are
compared against each other. In external benchmarking a company is compared
against competitors and other companies operating in the same sector. Functional
benchmarking broadens the benchmarking view, assuming that best practices
come from outside one’s own industry (Lecklin 1999, 177).
Zairi (1996, 35) illustrates the difference in competitive behaviour with and
without the practice of benchmarking. Companies that do not adopt benchmarking
are usually characterised as: ”internally focused, without a clear understanding of
their strengths and weaknesses, a reactive approach to competitiveness and poor
knowledge of customers’ true requirements. Feeble efforts to innovate.
Companies who do practise the art of benchmarking can be described as: ”being
proactive, externally focused and close to the markets they operate in. They have
access to a limitless pool of ideas, use the market as a starting point for setting
their objectives and have a very good understanding of customer retirements.
They also tackle big problems to achieve quantum leaps in competitiveness.”

51
4 RESEARCH METHODOLOGY
Based on the research limitations presented in Chapter 1.2 (research objectives
and limitations), four companies were chosen. All of them have performed
economically well in the target markets and also in their domestic market. From
these chosen companies, export managers or managers responsible for the area
under review were interviewed using an in-depth interviewing method. To
broaden the reader’s and researcher’s view of business in the target markets and to
increase the validity of the research, 16 experts were also interviewed using the
same method. These experts included commercial specialist from the Finnish and
Swedish Embassies, a Greek Commercial Attaché, Finpro’s representative agents
from Finland and the target countries, two international companies and local
media and consulting firms. All the company interviews were held in Finland, but
most of the professional interviews were held either in Romania or in Serbia. Due
to limited time and other resources, interviews in Slovenia and Bulgaria were
cancelled. All together, over twenty interviews were conducted.
During the research, the researcher participated in one business training session
held at the trainer’s house (Finnish business consulting firm), and one presentation
held by Finpro’s (a Finnish internationalisation consulting organisation) area
manager. Both of these events dealt with international business or areas within
the scope of this research.
4.1 Qualitative and Quantitative Research
To understand the distinctions between qualitative and quantitative
methodologies, let us first define the latter. Quantitative research attempts precise
measurement of something. In marketing research, quantitative methodologies
usually measure consumer behaviour, knowledge, opinions or attitudes, with
questions related to how much, how often, how many, when and who (Cooper and
Schindler 2006, 216).
52
According to Cooper and Schindler (2006, 214), qualitative research is designed
to tell the researcher how (process) and why (meaning) things happen as they do.
To understand the different meanings that people place on their experiences often
requires research techniques that delve more deeply into people’s hidden
interpretations, understandings and motivations. Qualitative techniques are used in
both the data collection and data analysis stages of a research project. At the data
collection stage, the array of techniques includes focus groups, individual in-depth
interviews, case studies, ethnography, grounded theory, action research and
observation. During the analysis, the qualitative researcher uses content analysis
of written or recorded materials drawn from participants, behavioural
observations, debriefing of observations and the study of artefacts and trace
evidence from the physical environment (Cooper and Schindler 2006, 214).
In this research both methodologies are used. Quantitative research methodology
was used when evaluating target markets through available secondary data.
Qualitative research methodology was used while recording, analysing, and
reporting interviews.
4.2 Interviews
The researcher chooses a qualitative methodology based on the project’s purpose,
schedule, budget, the issues or topics being studied, the types of participants
needed, and the researcher’s skill, personality and preferences (Cooper and
Schindler 2006, 220).
The interview is the primary data collection technique for gathering data in
qualitative methodologies. Interviews vary based on the number of the people
involved during the interview, the level of the structure, the proximity of the
interviewer to the participant, and the number of interviews conducted during the
research. An interview can be conducted individually or in groups. Both have a
distinct place in qualitative research. The researcher chooses either an

53
unconstructive interview, a semi- structured interview or a structured interview10.
Structured interviews permit more direct comparability of responses; question
variability has been eliminated and thus answer variability is assumed to be real.
Also, in the structured interview, the interviewer’s neutrality has been maintained.
Many interviews are conducted face-to-face, with the obvious benefit of being
able to observe and record verbal as well as non-verbal behaviour. An interview,
however, can be conducted by phone or online (Cooper and Schindler 2006, 222-
223).
Individual Depth Interviews
Depth interviews are non-directive interviews in which the respondent is
encouraged to talk about the subject rather than to answer ‘yes’ or ‘no’ to specific
questions (Chisnall 1992, 157). Individual depth interviews generally take
between 20 minutes (telephone interviews) and two hours (prescheduled, face-to-
face interviews) to complete, depending on the issues or topics of interest and the
contact method used. Interviewees are often provided with advance materials,
such as question topics (Cooper and Schindler 2006, 226).
Managing Individual Depth Interviews
Participants for individual depth interviews are usually chosen not because their
opinions are representative of the dominant opinion but because their experiences
and attitudes will reflect the full scope of the issues under study. Individual depth
interviews are usually recorded and transcribed to provide the researcher with the
rich detail that the methodology is used for. Individual depth interviews use
extensive amounts of interviewer time, in both conducting interviews and
evaluating them. And while some respondents feel more comfortable discussing
sensitive topics or sharing their own observations, behaviour and attitudes with a
10 Unstructured interview: no specific questions or order of topics to be discussed, with each interview customised to each participant; generally starts with a participant narrative. Semi-sturctured interview: gererally starts with a few specific questions and then follows the individual’s tangents of thought with interviewer probes. Structured interview: often uses detailed interview guide similar to a questionnaire to guide the question order and the specific way the questions are asked, but the questions generally remain open-ended (Cooper and Schindler 2006, 222-223).
54
single person, others are more forthcoming in group situations (Cooper and
Schindler 2006, 226-228). Because interviews in this thesis were done mostly
face-to-face, and when group interviews occurred (three times out of sixteen),
they were not arranged with a certain purpose or goal, there is no need to explain
group interview theory more carefully.
Error in Interview Research
The great strength of the interview as a primary data collecting approach is its
versatility. Abstract information of all types can be gathered by questioning
others. Additionally, a few well-chosen questions can yield information that
would take much more time and effort to gather by observation. The bad news for
interview research is that all interview research has some error. Understanding the
various sources of error helps researchers avoid or reduce the possibility for such
error (Cooper and Schindler 2006, 274).
There are several points where the interviewer’s control of the process can affect
the quality of the data. These seven points, according to Cooper and Schindler
(2006, 274-276), are presented below:
1) Failure to secure full participant cooperation (sampling error). The
sample is likely to be biased if interviewers do not do a good job in
enlisting the participant’s co-operation.
2) Failure to record answers accurately and completely (data entry error).
3) Failure consistently to execute interview procedures.
4) Failure to establish an appropriate interview environment.
5) Falsification of individual answers or whole interviews. Falsification of an
answer to an overlooked question is perceived as an easy solution to
counterbalance the incomplete data.
6) Inappropriate influencing behaviour. e.g. tone of voice, body language.
7) Physical presence bias. e.g. some research indicates that the perceived
social distance between interviewer and participant has a distorting effect.
55
On the other hand, participants can cause error too. Basically this happens in two
ways: whether they respond (willingness) and how they respond. The following
participant-engendered errors, according to Cooper and Schindler (2006, 277-
280), have been recorded:
1) Lack of knowledge.
2) Mispresentation of information.
3) Concept or construct misinterpretation.
4) Incomplete participation.
5) Refusal of participation.
Recording, Analysing and Reporting Interviews
In face-to-face settings, some moderators use large sheets of paper on the wall of
the group room to record trends, others use a personal notepad. Facility managers
produce both video- and audiotapes to enable a full analysis of the interview. The
verbal portion of the interview is transcribed along with moderator debriefing
sessions and added to moderator notes. These are analysed across several focus
group sessions using, for example, content analysis (Cooper and Schindler 2006,
234-235). This analytical process provides the research sponsor, Tikkurila, with a
qualitative picture of the respondent’s concerns, ideas, attitudes and feelings.
Content analysis measures the semantic context or the what aspect of a message.
Its breadth makes it a flexible and wide-ranging tool that may be used as a stand-
alone methodology or as a problem-specific technique (Cooper and Schindler
2006, 497).
In this research all the interviews, written or recorded, were collected and written
down on large A2 sheets, which make the analysing process easier. At the
beginning of the interview, the purpose of this research was clearly explained, and
assurances were given that all information collected during the interview would be
confidential and only used by the interviewer. A more accurate description of
interview process can be found in Chapter 1.2. A list of questions and benefits for
the interviewed company or person can be found in Appendix 5.

56
5 TIKKURILA OY
Established in 1862, Tikkurila develops, markets, and produces paints and
coatings for DIY and professional painters and for industrial applications.
Decorative paints are made in Finland, Sweden, Estonia, Russia, Poland,
Germany and Ukraine. Industrial wood and metal coatings are produced in
Finland, Poland and Russia. The company also has sales units in Sweden,
Norway, Denmark, Estonia, Latvia, Lithuania, Hungary, Russia, Kazakhstan and
the Czech Republic. The newest sales company was set up in China in the end of
May 2007. (Tikkurila 2007; Schadewitz 2007) Following figure 10 gives good
overview of Tikkurila’s international operations and their locations.
Figure 10. Tikkurila Locations (Tikkurila 2007).
Tikkurila, which is responsible for Kemira's paints and coatings business, is a
Tikkurila, which is officially called Business Area Kemira Coatings, is
responsible for the paints and coatings business of the Finland-based chemical
company Kemira Oyj. Tikkurila is a strong regional player in Europe, with a
leading position in Northern and Eastern Europe. The strongest growth is
Production, sales, warehouse Sales, warehouse Warehouse
Czech Republic Denmark Estonia Finland Germany Hungary Kazakhstan
Norway Latvia Lithuania Poland Russia Sweden Ukraine

57
expected in Eastern Europe, where paint markets are expanding to keep pace with
the rising standard of living (Tikkurila 2007). Tikkurila’s strategy is based on
growth within decorative paints and certain industrial coatings segments.
Tikkurila is seeking to develop its position further and grow both organically and
through acquisitions in Europe and Asia (Kemira 2006, 14).
In decorative paints, the company has following local brands: Tikkurila in
Finland, Russia and Poland, Teks and Finncolor in Russia, Alcro and Beckers in
Sweden, Pigrol in Germany, Kolorit in Ukraine, Vivacolor in the Baltic countries
and Polifarb Debica in Poland. In industrial coatings, Tikkurila Coatings is a well-
known brand. Newcomers among industrial brands are Gamma and Ohtek
(Tikkurila 2007).
Figure 11. Major brands in Tikkurila Group (Tikkurila 2007).
INTERNATIONAL
REGIONAL
ОХТЭКОХТЭКОХТЭКОХТЭК
LOCAL

58
Tikkurilas's paint business is divided into two strategic business units: Tikkurila
Deco and Tikkurila Coatings. Tikkurila Oy produces services supporting the
business operations. Decorative paints are the responsibility of Tikkurila Deco
with do-it-yourself painters, professional painters and retailers as major customer
groups. These are served directly or through an extensive distribution network
with over 5,000 retail outlets in some 30 countries. Tikkurila Coatings is
responsible for the industrial coatings business in selected industrial sectors – the
wood industry and metal industry. Industrial customers are served either directly
or through the network of 260 Temaspeed distributors, currently operating in 27
countries. (Tikkurila 2007) Following figure 12 presents the general structure of
Tikkurila Oy
Figure 12. Tikkurila’s corporate structure (Corporate Structure 2007).
Tikkurila Oy
Supply Chain
R&D, Technology, HSEQ
Finance & IT
HR & Legal
Communications
Deco Coatings
Metal Wood
Marketing Development (Deco)
Finland Scandi- navia
East Poland Interna-tional
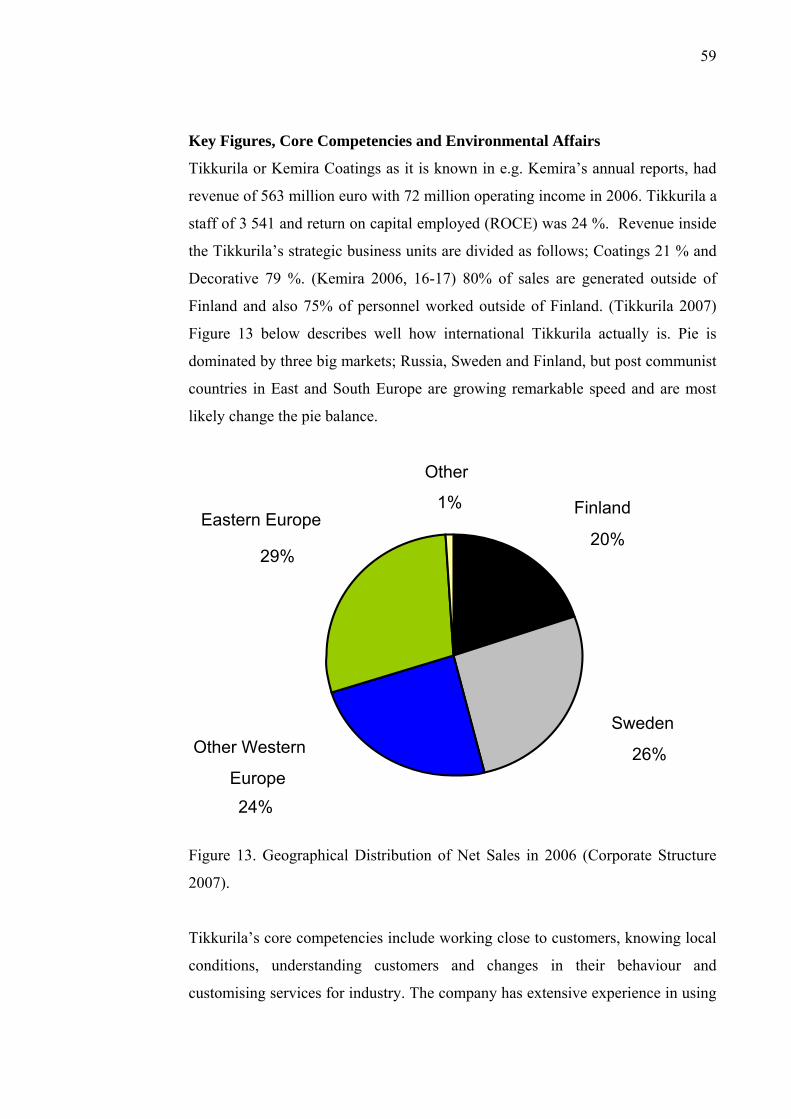
59
Key Figures, Core Competencies and Environmental Affairs
Tikkurila or Kemira Coatings as it is known in e.g. Kemira’s annual reports, had
revenue of 563 million euro with 72 million operating income in 2006. Tikkurila a
staff of 3 541 and return on capital employed (ROCE) was 24 %. Revenue inside
the Tikkurila’s strategic business units are divided as follows; Coatings 21 % and
Decorative 79 %. (Kemira 2006, 16-17) 80% of sales are generated outside of
Finland and also 75% of personnel worked outside of Finland. (Tikkurila 2007)
Figure 13 below describes well how international Tikkurila actually is. Pie is
dominated by three big markets; Russia, Sweden and Finland, but post communist
countries in East and South Europe are growing remarkable speed and are most
likely change the pie balance.
Figure 13. Geographical Distribution of Net Sales in 2006 (Corporate Structure
2007).
Tikkurila’s core competencies include working close to customers, knowing local
conditions, understanding customers and changes in their behaviour and
customising services for industry. The company has extensive experience in using
Sweden
26%
Finland
20% Eastern Europe
29%
Other Western
Europe24%
Other
1%
60
tinting systems and marketing branded products. The traditions of paint-making
are combined with the latest technological achievements and environmental
awareness. The consistently high quality of products and services is ensured by
extremely capable staff, innovative R&D, highly automated production
technology and efficient logistics (Schadewitz 2006).
In environmental affairs, Tikkurila has been a pacesetter in its field worldwide.
Back in 1994 the company’s environmental system earned accreditation according
to the BS 7750 standard; in 1996 this was changed to ISO 14001 certification. In
1996 Tikkurila Oy was the first Finnish company and the third paint company in
Europe to receive registration under the European Union’s Eco-Management and
Audit Scheme (EMAS). Most of Tikkurila’s production units in various parts of
Europe already have certified quality and environmental systems under the ISO
series of standards (Schadewitz 2006).
Business environmental changes
Paint consumption will remain stable in Western Europe, but it will increase, in
the pace of the improving living standard, in Eastern Europe, South-East Europe
and Asia. This fact will be discussed in the next chapter. Further structural
changes are taking place in distribution in some decorative paints markets and end
users’ awareness in environmental issues are changing too. Moreover, the EU’s
VOC11 and REACH12 legislation are changing product categories and styles of
marketing (Tikkurila 2007).
11 VOC stands for Volative Oraganic Compound. 12 REACH stands for Registration, Evaluation and Authorisation of Chemicals.
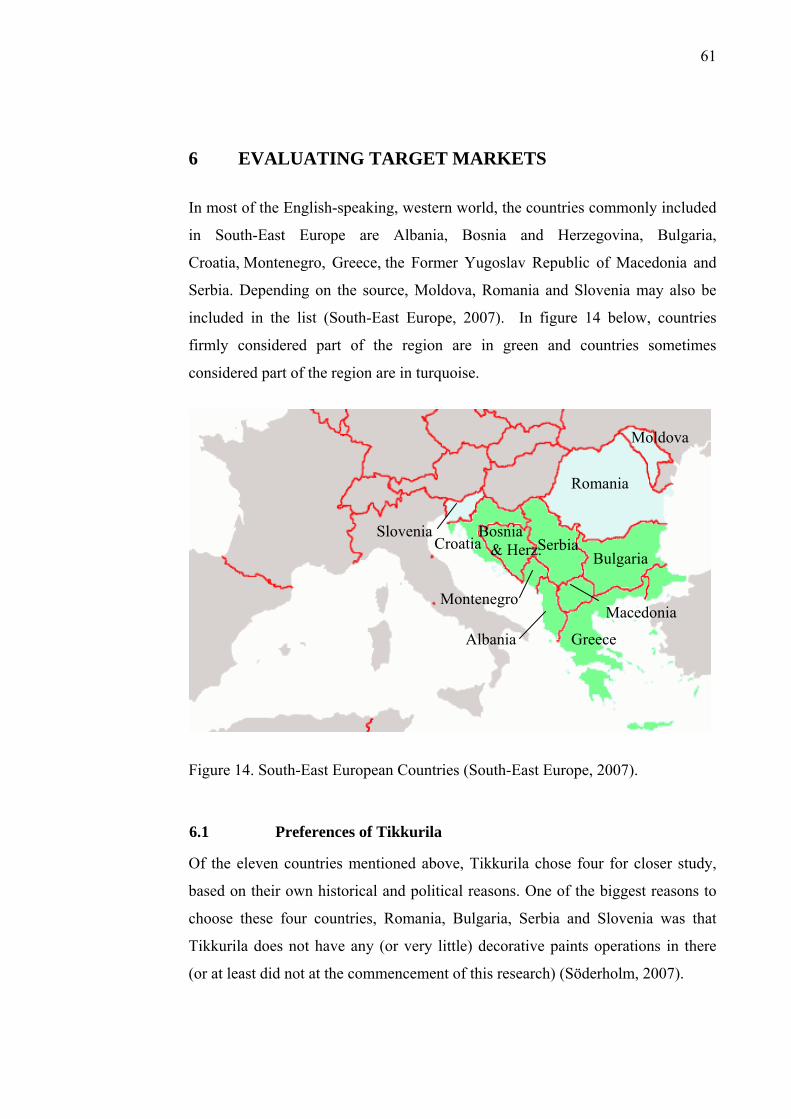
61
6 EVALUATING TARGET MARKETS
In most of the English-speaking, western world, the countries commonly included
in South-East Europe are Albania, Bosnia and Herzegovina, Bulgaria,
Croatia, Montenegro, Greece, the Former Yugoslav Republic of Macedonia and
Serbia. Depending on the source, Moldova, Romania and Slovenia may also be
included in the list (South-East Europe, 2007). In figure 14 below, countries
firmly considered part of the region are in green and countries sometimes
considered part of the region are in turquoise.
Figure 14. South-East European Countries (South-East Europe, 2007).
6.1 Preferences of Tikkurila
Of the eleven countries mentioned above, Tikkurila chose four for closer study,
based on their own historical and political reasons. One of the biggest reasons to
choose these four countries, Romania, Bulgaria, Serbia and Slovenia was that
Tikkurila does not have any (or very little) decorative paints operations in there
(or at least did not at the commencement of this research) (Söderholm, 2007).
Romania
Bulgaria
Greece
Bosnia & Herz.
Macedonia Montenegro
Croatia Serbia Slovenia
Albania
Moldova

62
Because of its political history, the situation in Serbia needs to be explained more
carefully. Due to Montenegro’s recent independence (2006) from Serbia, some of
the statistics, comments and research mentioned in this thesis are not clear and
unambiguous. After the dissolution of the Socialist Federal Republic of
Yugoslavia in 1992, Montenegro agreed on a federation with Serbia, first as the
Federal Republic of Yugoslavia, then as a looser state union of Serbia and
Montenegro, which broke up as soon as a deadline (May 21st 2006) for holding a
referendum on independence expired (World Factbook 2007; Montenegro 2007).
Despite Montenegro’s independence, all the available statistics come from pre-
independence times. These figures are, however, a good indication of the current
situation, because Montenegro’s population is only 7% of Serbia’s, and Serbia’s
GDP per capita (PPP) ($4,400) is higher than Montenegro’s ($3,800). Serbia is
also closer to EU membership than Montenegro. The only open question is the
future of Kosovo. The independence of Kosovo would reduce the population of
Serbia by approximately two million, and other implications for such things as
economics and politics remain unknown. (World Factbook 2007; Kosovo 2007)
6.2 Business Environment in Target Countries
It is clear that competitiveness has become one of the key factors in the modern
and fast-changing global economy (Tiusanen 2006, 4). However, it is rather
difficult to measure the relative competitiveness of nations in a comprehensive
manner, although there are some composite indices compiled annually by certain
international organisations attempting to measure it. Quantitative and qualitative
components are included in some of these measurements, in which for example
Nordic countries normally score well (Tiusanen 2006, 4).
Obviously, multinational companies (MNCs) collect plenty of quantitative
material on potential new target markets. In Foreign Direct Investment (FDI)
decisions, it is important to know various cost factors in countries targeted via
FDIs. In market-seeking FDIs, it is essential to estimate purchasing power in the
location of operation (Tiusanen 2006, 4).

63
In 2007, the World Bank (IBRD) and its subsidiary, International Financial
Corporation (IFC), published a report called “Doing Business in 2007”. This
report assesses business climate in a large group of countries, including
Tikkurila’s target countries. The IBRD report 2007 covers ten indicators on
business regulations and their enforcement across 175 countries. The ten
indicators are explained in the table 12 below. These components are measured
separately. At the end, the report provides a composite index called the ease of
doing business, ranking countries from 1 to 175 (Tiusanen 2006, 6; IBRD –
Economy Rankings 2007). This year’s research also incorporates the top-ten
ranking of best reformers. Among countries under review, only Romania made the
top ten, coming in at no. 2. (IBRD – Rank Method 2007)
Table 12. Ease of Doing Business components (IBRD – Rank Method 2007).
Ranking Indicators
Starting a business
Procedures, time, cost and paid-in minimum capital to open a new business
Protecting investors
Indices of the extent of disclosure, extent of director liability and ease of shareholder suits
Dealing with licences
Procedures, time and cost of business inspections and licensing (construction industry)
Paying taxes
Number of tax payments, time to prepare tax returns and total taxes as a share of commercial profits
Employing workers
Difficulty of hiring index, rigidity of hours index, difficulty of firing index and firing cost
Trading across borders
Documents, time and cost to export and import
Registering property
Procedures, time and cost to register commercial real estate
Enforcing contracts
Procedures, time and cost to resolve a commercial dispute
Getting credit
Strength of legal rights index, depth of credit information index
Closing a business
Recovery rate in bankruptcy
It is evident that none of the composite indices published regularly on business
climates in various parts of the global economy can give exact information for

64
investors choosing new target markets. That’s why the ease of doing business is
limited in scope. It does not take into account a country’s proximity to large
markets, quality of infrastructure services (other than services related to cross-
border trading), the security of property from theft and looting, macroeconomic
conditions or the strength of underlying institutions (Tiusanen 2006, 6-7; IBRD –
Economy Rankings 2007).
Thus, while Armenia ranks similarly (at 34) on the ease of doing business to
France (at 35), this clearly does not mean that businesses are better off operating
in Yerevan rather than in Paris. For example, crime and macroeconomic
imbalances – two issues not directly studied in Doing Business – make Armenia a
less attractive destination for investment (IBRD – Economy Rankings 2007).
Table 13 first shows the top-five countries then Finland and the countries under
review.
Table 13. Ease of doing Business Ranking (IBRD – Economy Rankings 2007)
Rank Country Population (Million) GNI (per capita US$)
1 Singapore 4,4 27,490
2 New Zealand 4,1 25,960
3 United States 296,5 43,740
4 Canada 32,3 32,600
5 Hong Kong, China 6,9 27,670
14 Finland 5,2 37,460
49 Romania 21,6 3,830
54 Bulgaria 7,7 3,450
61 Slovenia 2,0 17,350
68 Serbia 10,0 3,280
Slovenia is the most prosperous transitional economy (TE) within the EU with
only 2 million inhabitants. It is in 61st place in the above table, far behind Bulgaria
and Romania, which were not able to enter the EU before 2007. These two
rankings are rather surprising (Tiusanen 2006, 9; IBRD – Economy Rankings

65
2007; Romania 2007). The full list of components and rankings for countries
under review can be studied more closely in Appendices 1-4.
Bulgaria
Bulgaria was one of ten TEs aspiring for EU-membership after the collapse of
Communism. However, the Eastern enlargement of the Union in 2004 relegated
Bulgaria and Romania (Tiusanen 2006, 16), although both these countries joined
the EU on January 1, 2007 (Romania 2007, Bulgaria 2007).
Starting a business in Bulgaria requires nine procedures consuming 32 working
days. The cost of these procedures is 7.9 % of per capita income. Minimum share
capital is 91.3% of per capita income. Dealing with licences requires 22
procedures, which take 226 days to settle. The cost is very high at 270.5% of per
capita income. Workers made redundant are entitled to nine weeks’ salary.
Registering property in Bulgaria is relatively simple; there are nine procedures
that take 19 days to complete. The cost is 2.3% of the property value. Bulgarian
business must deal with 27 different taxes. The annual time required to settle tax
issues is 616 hours. Total tax payable is relatively moderate at 40.7% of profit
(adapted from Tiusanen 2006, 16-17; IBRD – Bulgaria 2007).
Slovenia
Among the four TEs under review here, Slovenia is the richest with GNI of USD
17,350 (Transition Economy 2007). The first sub-index in Slovenia, starting a
business, involves nine procedures, which can be settled in 60 days. The cost is
9.4% of per capita income. Minimum share capital is 16.1 % of per capita income.
The second one, dealing with licences, requires 14 procedures taking 207 days to
settle. The cost is 122.2% of per capita income. Firing workers in Slovenia is
rather expensive: 40 weeks salary must be paid for an employee leaving the
enterprise. Registering property requires six procedures in Slovenia. It takes 391
days to settle the issues at a cost of 2% of the property value. Business in Slovenia
is subject to 34 taxes, which together swallow 39.4% of gross profit. Annual time
66
required to settle tax issues is 272 hours (adapted from Tiusanen 2006, 17; IBRD
– Slovenia 2007).
Romania
Romania’s EU entry was postponed in 2004 but the country finally acceded in
2007 (Romania 2007). Top-ranked (49th) among the countries under review,
Romania was also chosen to be the second best reformer in IBRD research on
ease of doing business (IBRD Romania 2007). Starting a business in Romania is
rather easy requiring only five procedures, taking 11 days and costing 4.4% of per
capita income. There is no minimum capital requirement. Dealing with licences is
more complicated, because there are 17 procedures taking 242 days to settle. The
cost too is rather high at 332.6% of per capita income. In Romania, redundant
workers get three weeks’ salary (which had been 98 weeks in a previous report).
Registering property is rather simple, requiring only 8 procedures. The cost is
1.9% of the property value and it takes 150 days to settle procedures. In Romania,
business are subject to no less than 89 different categories of tax. Total tax
payable is rather high at 48.9% of gross profit and it takes 198 days per year to
settle tax matters (adapted from Tiusanen 2006, 17-18., IBRD – Romania 2007).
Serbia
Lowest-ranked (68th) among the countries under review, Serbia is the only country
which is not yet an EU member. The government of Serbia wants to prepare the
country for EU accession between 2012 and 2015 13 (Enlargement of EU, 2007).
Starting a business in Serbia requires 10 procedures consuming only 18 working
days. The cost is 10.2 % of per capita income. Minimum capital is 7.6% of per
capita income. Dealing with licences requires 20 procedures, which take 221 days
to settle. The cost is extremely high at 1,946.7% of per capita income. Redundant
workers are entitled to 27 weeks’ salary. Registering property is relatively simple
– there are 6 procedures, but they take 111 days complete. The cost is 5.4% of the 13 However, it seems much more likely that it would happen around 2015 due to many domestic problems and extensive reforms that should be implemented, and the current institutional crisis in the EU. The fact that alleged war criminals, Radovan Karadžić and Ratko Mladić, still have not been found is an obstruction to these negotiations (Enlargement of EU 2007).
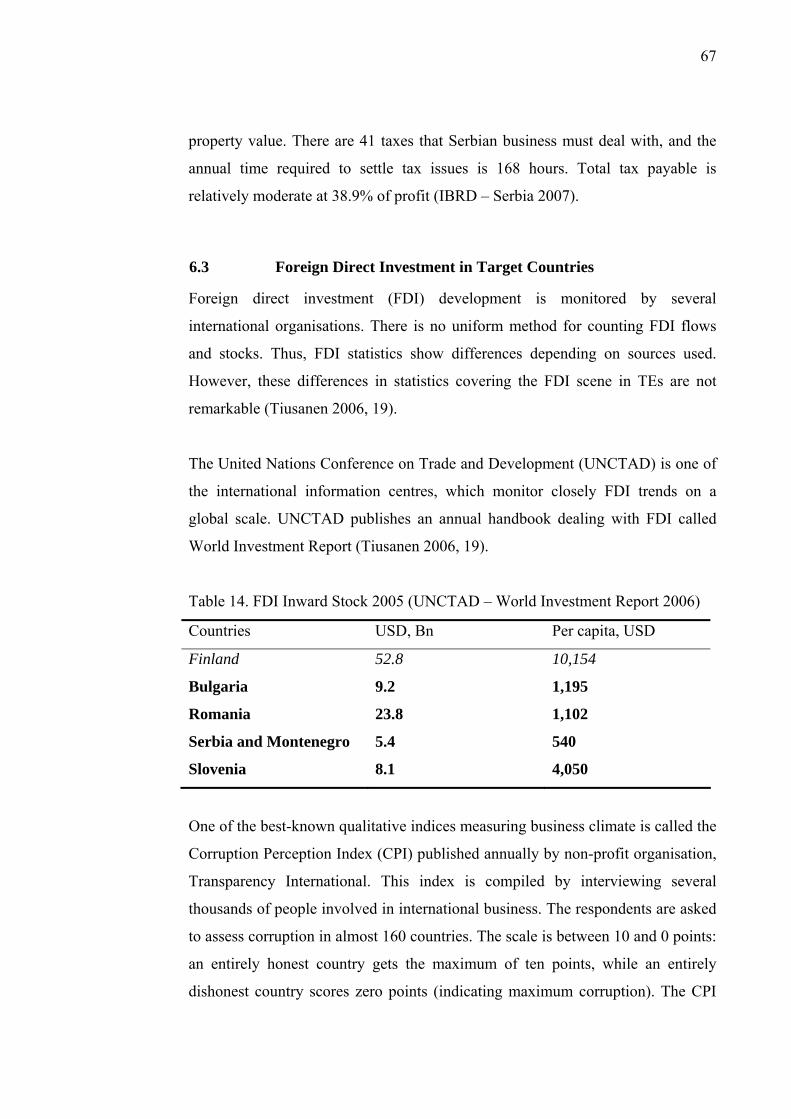
67
property value. There are 41 taxes that Serbian business must deal with, and the
annual time required to settle tax issues is 168 hours. Total tax payable is
relatively moderate at 38.9% of profit (IBRD – Serbia 2007).
6.3 Foreign Direct Investment in Target Countries
Foreign direct investment (FDI) development is monitored by several
international organisations. There is no uniform method for counting FDI flows
and stocks. Thus, FDI statistics show differences depending on sources used.
However, these differences in statistics covering the FDI scene in TEs are not
remarkable (Tiusanen 2006, 19).
The United Nations Conference on Trade and Development (UNCTAD) is one of
the international information centres, which monitor closely FDI trends on a
global scale. UNCTAD publishes an annual handbook dealing with FDI called
World Investment Report (Tiusanen 2006, 19).
Table 14. FDI Inward Stock 2005 (UNCTAD – World Investment Report 2006)
Countries USD, Bn Per capita, USD
Finland 52.8 10,154
Bulgaria 9.2 1,195
Romania 23.8 1,102
Serbia and Montenegro 5.4 540
Slovenia 8.1 4,050
One of the best-known qualitative indices measuring business climate is called the
Corruption Perception Index (CPI) published annually by non-profit organisation,
Transparency International. This index is compiled by interviewing several
thousands of people involved in international business. The respondents are asked
to assess corruption in almost 160 countries. The scale is between 10 and 0 points:
an entirely honest country gets the maximum of ten points, while an entirely
dishonest country scores zero points (indicating maximum corruption). The CPI

68
has been published annually for more than ten years. The results are extensively
covered in the financial press. Scores and rankings for countries involved do not
fluctuate strongly from year to year in the CPI table (Tiusanen 2006, 22).
A free press plays a key role in sustaining and monitoring a healthy democracy, as
well as in contributing to greater accountability, good government and economic
development. Freedom House (2007) is a non-profit, non-partisan organisation,
supporting democracy and freedom around the world. Through a vast array of
international programmes and publications, Freedom House is working to advance
worldwide expansion of political and economic freedom. Freedom House has
been monitoring threats to media independence since 1980. The annual survey,
Freedom of the Press, tracks trends in global press freedom and draws attention to
countries or regions where such freedom is under threat. Considered an
authoritative assessment of media freedom around the world, the survey's findings
are widely utilised by policy-makers, scholars focusing on democratic
development, educators and students, advocates of press freedom, journalists,
governments and international institutions (Freedom House 2007). Freedom of the
Press: A Global Survey of Media Independence 2007 covers 194 countries and
territories and provides numerical rankings and rates for each country's media.
Country narratives examine the legal environment for the media, political
pressures that influence reporting, and economic factors that affect access to
information.
In the table 15 below, these two ranking indices, CPI and GPFI (global press
freedom index), are presented together and figures and rankings correlate quite
well. The only exception is Singapore, where press liberty is ranked at the same
level as Afghanistan. This proves firstly that, although some communist or
totalitarian countries are low-ranking in the GPF index, this does not necessarily
mean that they are highly corrupt or difficult to do business with. Secondly, these
indices are indicative only; calculation methods, limitations and backgrounds
should be borne in mind when interpreting the results.

69
Table 15. Corruption Perception Index 2005 and Global Press Freedom Index
2007. (Transparency International 2006, 298; APPENDIX 7-10).
Country CPI Rank CPI Score GPFI Rank GPFI Score
Iceland 1 9.7 1 9
Finland 2 9.6 1 9
New Zealand 3 9.6 9 13
Denmark 4 9.5 3 11
Singapore 5 9.4 154 69
Slovenia 31 6.1 39 21
Bulgaria 55 4.0 76 34
Romania 85 3.0 90 42
Serbia and
Montenegro
97 2.8 84 (only Serbia) 39 (only Serbia)
The above table 15 shows the top-five countries from based on the CPI ranking
and the countries under review. The best country among the target countries is
Slovenia with 6.1 points and 31st position in the global ranking. Slovenia also
scores well in the GPFI ranking. Freedom of the press is guaranteed by the
Slovenian constitution and legal system (Appendix 9). Slovenia is the richest
country in our selection of TE’s. It is often maintained that relative poverty causes
high corruption. Relatively well-off Slovenia does not suffer from extensive
corruption, but in the CPI ranking, it is behind such countries as Estonia (27th),
which is poorer than Slovenia (Tiusanen 2006, 23). According to the FDI table 14
mentioned earlier, it can be also said that the moderate level of corruption is an
attraction for investment in Slovenia (Tiusanen 2006, 24). The newest accession
countries, Romania and Bulgaria, are both very low-ranking, but that can be partly
explained by the slightly outdated data from the CPI. Romania performed very
well in 2006, and was chosen as second best reformer among 175 countries.
Neither is Bulgaria far behind Romania, only 5 points, and this could have a
positive effect on Bulgaria’s position in the CPI index in 2006 (IBRD – Bulgaria,
Romania 2007). Overall, it can be said that press freedom correlates well with the
70
corruption index. According to the survey, Slovenia is the only country with Free
status. Bulgaria, Romania and Serbia are considered as Partly Free societies. In
Serbia, the government, media owners, local officials and businessmen continue
to place undue pressure on journalists (Appendix 8). In Romania, the government
and state institutions remain sensitive to media criticism. Many media outlets are
facing significant economic pressure due to ownership concentration, lack of
revenue and a limited advertising market (Appendix 7). In Bulgaria, the
government’s manipulation of media and the judiciary’s lack of independence are
causes for concern (Appendix 10).
It is often maintained that paying bribes means paying unofficial taxes on the top
of the official ones. Thus, high corruption level is an impediment to attracting
FDI. Romania, Bulgaria and Serbia are at the bottom of the scale in both FDI per
capita and in the corruption index (Tiusanen 2006, 24).
6.4 Economic Trends in Target Countries
In the Cold War period, it became obvious at an early stage that the Communist
system of central planning could not compete with the Western system of a
decentralised economy with a public sector social safety net. In Europe, a living
standard gulf between East and West emerged and became deeper in the 1970s
and 1980s. This welfare gap caused the collapse of Communism at the turn of the
1990s (Tiusanen 2006, 25).
In the early period of transition, all target markets in the TE region suffered an
economic slump. A recovery began in the mid-1990s, but economic revival under
market circumstances has not advanced with equal speed in all TEs. Thus, there
are considerable living standard differences within target markets (Tiusanen 2006,
25).
In the first years of the 21st century, energy prices have increased greatly in the
global market. This oil price boom has had a very positive effect on resource-rich
Russia, while other TEs under review have suffered because of their increasing

71
import bill (e.g. Basescu 2006). However, the global energy market shock has not
caused any severe economic harm in the region under review.
The most frequently used measure in international living standard comparisons is
Gross National Product (GNP) or Gross Domestic Product (GDP) per capita. GNP
differs from GDP in that the latter does not include a country’s net income from
abroad (a significant difference only for a few countries, like Kuwait, which have
a high proportion of investment overseas). GDP figures are presently used more
frequently than GNP data (Tiusanen 2006, 26).
6.5 Special Factors and Economic Trends in Paint Consumption
In this section, the special factors influencing paint consumption are briefly
reviewed, then economic factors affecting paint consumption and export are
looked at more closely. The following factors affect paint consumption (Tikkurila
2007):
• Standard of living
• Local ways of painting
• Construction styles used and materials available
• Trends in interior decoration, colours, etc.
• Level of activity in construction, renovation and industry
Based on these factors, standard of living correlates positively with Gross
National Income (GNI) presented in chapter 6.2. The higher the GNI, the higher
paint consumption per capita. This is illustrated well in figure 15 below. Figures
show the approximate population of the country or area, and the colours indicate
paint consumption per person in litres. As can be clearly seen, the biggest growth
potential can be found in Russia, Eastern Europe and South-East Europe.
Tikkurila already has a good market position in Russia and certain Eastern
European countries such as the Baltic states, and so new areas are under
investigation.

72
Figure 15. Paint consumption in Europe (Corporate Structure 2007)
In the following table 16, the key figures for the international paint and coatings
business have been gathered from various sources. Serbia-Montenegro is coloured
orange, just to highlight the fact that all the statistics are from 2005, when Serbia
was still together with Montenegro. The significance of the statistics is discussed
in more detail in the following pages.
Table 16. Key figures for the international paint and coatings business. (IRL 2006;
World Factbook, 2007; Verkholantsev 2006)
Country Subject Romania Bulgaria Slovenia
Serbia- Montenegro
Exports 2005 (Tonnes) 1,677 14,372 40,153 2,000 Imports 2005 (Tonnes) 52,203 14,401 11,704 5,000 Domestic Production 2005 (Tonnes) 49,474 34,971 73,449 40,000 Estimated Paint Demand 2005 (Tonnes) 100,000 35,000 45,000 43,000 Population 2005 (Million) 22,3 7,4 2,0 10,8 Estimated Per Capita Paint Consumption 2005 (kg/head) 4,5 4,7 22,4 4,0
5
9 5
5
82
26 60
4
61
40
15
58 21
4
11
70
22
10
16
39
7
10
47
4
8
143
15
27
5
6
Population / country: Million people
20 < litres/person 10 < litres/person 5 < litres/person

73
Slovenia
Slovenia, with a population of barely 2 million, boasts paint production of almost
74,000 tonnes, which exceeds the domestic demand of 45,000 tonnes. Exports,
however, accounted for 40,153 tonnes in 2005 and imports for 11,704 tonnes,
according to IRL. Based on these figures, Slovenia has the highest per capita paint
consumption of the countries under review at 22.3 kg, and its production as a
percentage of the total market is 163%. The growth of import in tonnes between
2000 and 2005 was 19.1%. Average annual growth rate (AAGR) between these
years was only 3.6% due to poor import years in 2003 (-3.5%) and 2005 (-14.7%)
(Coatings COMET 2005; IRL 2006, 3-10; World Factbook, 2007).
Slovenia has a long and impressive list of foreign customers for paint, headed by
Russia, Hungary, Croatia, Bosnia-Herzegovina, Serbia-Montenegro and Ukraine.
The old former Yugoslav ties are particularly striking, but smaller amounts have
gone to Germany, Italy, the Netherlands, Austria and UK, together with
Kazakhstan, Uzbekistan and Turkmenistan (Coatings COMET 2005).
Romania
Romania, with a population of some 22 million, has the largest paint market in the
area under review – 100,000 tonnes. Paint output, however, stood at only 49,474
tonnes in 2005, with imports accounting for 52,203 tonnes and exports for 1,677
tonnes. The growth of import between 2000 and 2005 was 55,2%. AAGR
between these years was relatively good at 9.2%, and could have been even better
if not for a 9.0% decrease in imports in 2003. Based on these figures, Romania
has quite low per capita paint consumption of 4.5 kg, and production as a
percentage of the total market is 49%, which is good for the importers (Coatings
COMET 2005; IRL 2006, 3-10; World factbook, 2007).
Romanian paint imports from the West are dominated by Germany and Italy,
followed by smaller shares from Austria, UK, France and Belgium. Major export
destinations are Moldova, Hungary, Bulgaria and other eastern countries
(Coatings COMET 2005).
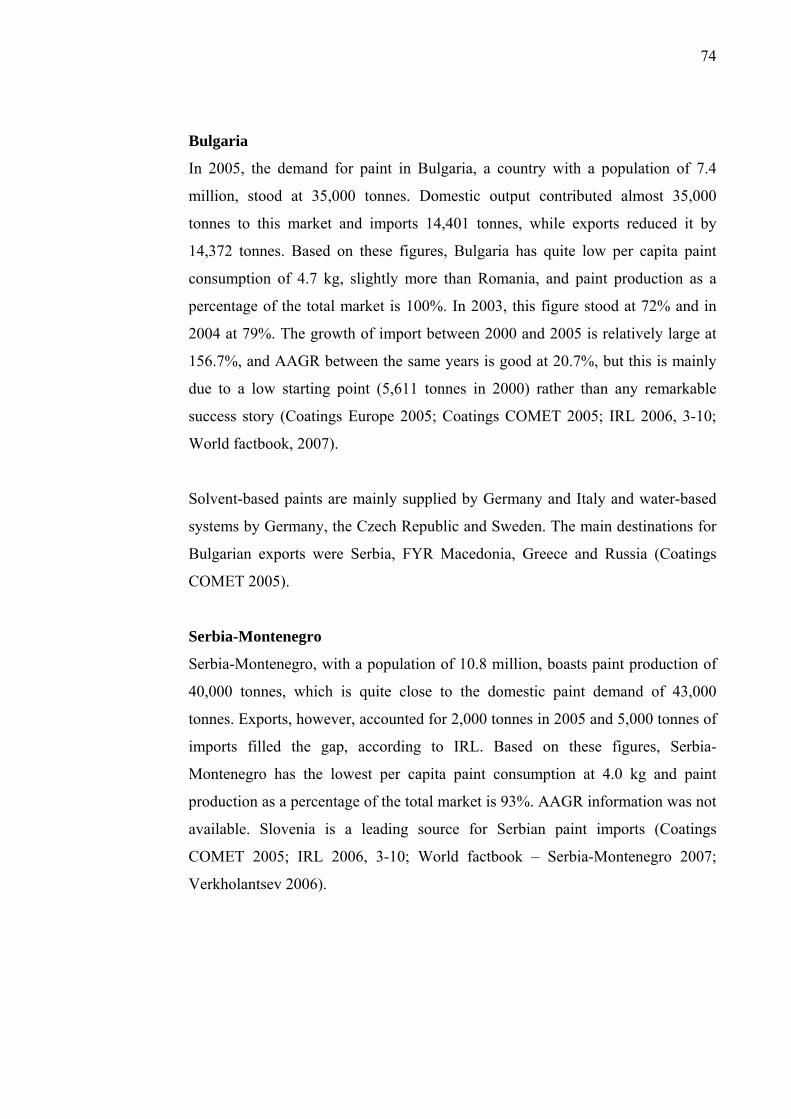
74
Bulgaria
In 2005, the demand for paint in Bulgaria, a country with a population of 7.4
million, stood at 35,000 tonnes. Domestic output contributed almost 35,000
tonnes to this market and imports 14,401 tonnes, while exports reduced it by
14,372 tonnes. Based on these figures, Bulgaria has quite low per capita paint
consumption of 4.7 kg, slightly more than Romania, and paint production as a
percentage of the total market is 100%. In 2003, this figure stood at 72% and in
2004 at 79%. The growth of import between 2000 and 2005 is relatively large at
156.7%, and AAGR between the same years is good at 20.7%, but this is mainly
due to a low starting point (5,611 tonnes in 2000) rather than any remarkable
success story (Coatings Europe 2005; Coatings COMET 2005; IRL 2006, 3-10;
World factbook, 2007).
Solvent-based paints are mainly supplied by Germany and Italy and water-based
systems by Germany, the Czech Republic and Sweden. The main destinations for
Bulgarian exports were Serbia, FYR Macedonia, Greece and Russia (Coatings
COMET 2005).
Serbia-Montenegro
Serbia-Montenegro, with a population of 10.8 million, boasts paint production of
40,000 tonnes, which is quite close to the domestic paint demand of 43,000
tonnes. Exports, however, accounted for 2,000 tonnes in 2005 and 5,000 tonnes of
imports filled the gap, according to IRL. Based on these figures, Serbia-
Montenegro has the lowest per capita paint consumption at 4.0 kg and paint
production as a percentage of the total market is 93%. AAGR information was not
available. Slovenia is a leading source for Serbian paint imports (Coatings
COMET 2005; IRL 2006, 3-10; World factbook – Serbia-Montenegro 2007;
Verkholantsev 2006).

75
7 SUCCESFUL SALES FACTORS
This chapter looks at the results of interviews. All company representatives said
that sales play a really important role in their decision-making process, although
this might also be due to their position in the company. Being sales or export
managers, they bear sales and profit responsibility for their leaders.
This research uses the following terminology, when discussing interviews.
Interviewed persons in this context include all people who have been interviewed,
both company representatives and business experts. Interviewed company or just
company only includes company representatives, and interviewed professionals
includes only business experts.
In the following pages, the results of the interviews have been divided and
organised according to the subjects suggested by Ingram et al. in their sales
strategy framework. Brand-related issues and how to gain premium price are
discussed separately after that. At the end of the chapter, additional information,
which arose during the in-depth interviews, is given.
7.1 Entry Mode Decisions
The internationalisation process of the companies varied from a sales approach to
a long-term entry strategy. The sales approach was commonly seen in those
companies, which had no clear strategy in the areas under review. Those
companies gave strategical priority to other regions. The entry strategy approach
was commonly seen in companies that are operating global and have a long
history of internationalisation in their operations. Those companies tend to have a
clear strategy for each of their market areas, and managers were more confident
about themselves and, moreover, confident about how to reach their targets.
The companies with an entry strategy approach were more willing to accept that
the process of internationalisation would take time and money. The timeframe

76
varied from 2-4 years and profitable years came after 2-3 years. Managers were
more willing to accept non-profit years at the beginning, knowing that such
investments were necessary to attain their goals. Goals for companies with an
entry strategy approach were much higher than those with a sales approach. Their
mission was to be number 1, or at least in the top three in their chosen markets.
Selection of target markets was more systematic and more market research was
used. All interviewed companies commented, however, that you can never know
enough about the markets, so additional market research could have been carried
out, had budgets allowed. Selection of the entry mode was more based on
previous experiences, market research and the managers’ own opinions rather than
any objective strategic decision. It can be said that both sales approach companies
and entry strategy companies were pragmatic when choosing their target markets,
although the use of a strategic rule was more evident in the companies, which had
a clear strategy for their internationalisation process.
The actual entry mode varied again from classical export to local manufacturing.
The distinction between companies was their vision of their future market
position. Those who wanted to be market leaders had either manufacturing or their
own sales company in their target market. Those who only wanted to gain extra
profit from the markets exported their goods. Contractual entry modes on a larger
scale were not seen as suitable for the business of the interviewed companies; of
course some separate contracts had been made, but those were mainly for
company- and product-related issues.
Investments as an entry mode were seen by the interviewed persons as key to
success if suitable timing, business climate, target company and reasonable
financing were available. Those companies, which have invested or are going to
invest in the near future have been operating in the area for at least few years to
gain experience from the business and market climate. All the companies rejected
the possibility of joint venture, either due to bad experiences or unsuitability with
their business strategy model. One of the managers commented that the local
partner in a joint venture is highly active at the beginning of the relationship
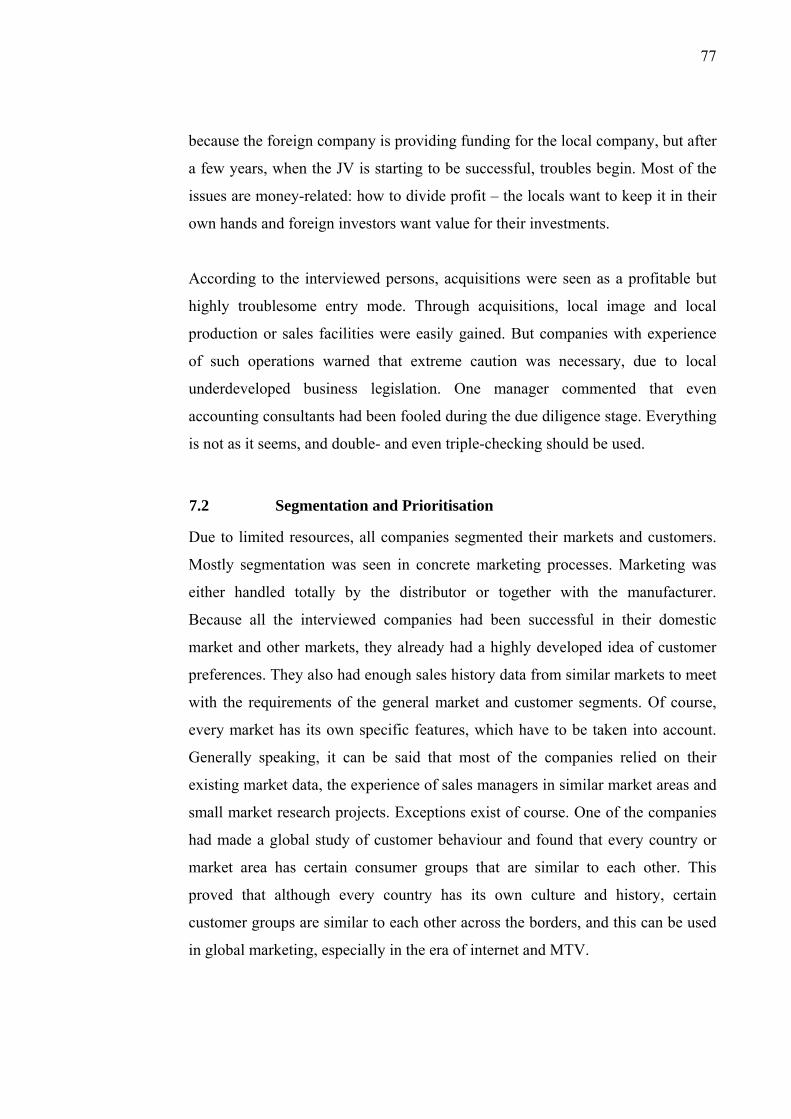
77
because the foreign company is providing funding for the local company, but after
a few years, when the JV is starting to be successful, troubles begin. Most of the
issues are money-related: how to divide profit – the locals want to keep it in their
own hands and foreign investors want value for their investments.
According to the interviewed persons, acquisitions were seen as a profitable but
highly troublesome entry mode. Through acquisitions, local image and local
production or sales facilities were easily gained. But companies with experience
of such operations warned that extreme caution was necessary, due to local
underdeveloped business legislation. One manager commented that even
accounting consultants had been fooled during the due diligence stage. Everything
is not as it seems, and double- and even triple-checking should be used.
7.2 Segmentation and Prioritisation
Due to limited resources, all companies segmented their markets and customers.
Mostly segmentation was seen in concrete marketing processes. Marketing was
either handled totally by the distributor or together with the manufacturer.
Because all the interviewed companies had been successful in their domestic
market and other markets, they already had a highly developed idea of customer
preferences. They also had enough sales history data from similar markets to meet
with the requirements of the general market and customer segments. Of course,
every market has its own specific features, which have to be taken into account.
Generally speaking, it can be said that most of the companies relied on their
existing market data, the experience of sales managers in similar market areas and
small market research projects. Exceptions exist of course. One of the companies
had made a global study of customer behaviour and found that every country or
market area has certain consumer groups that are similar to each other. This
proved that although every country has its own culture and history, certain
customer groups are similar to each other across the borders, and this can be used
in global marketing, especially in the era of internet and MTV.
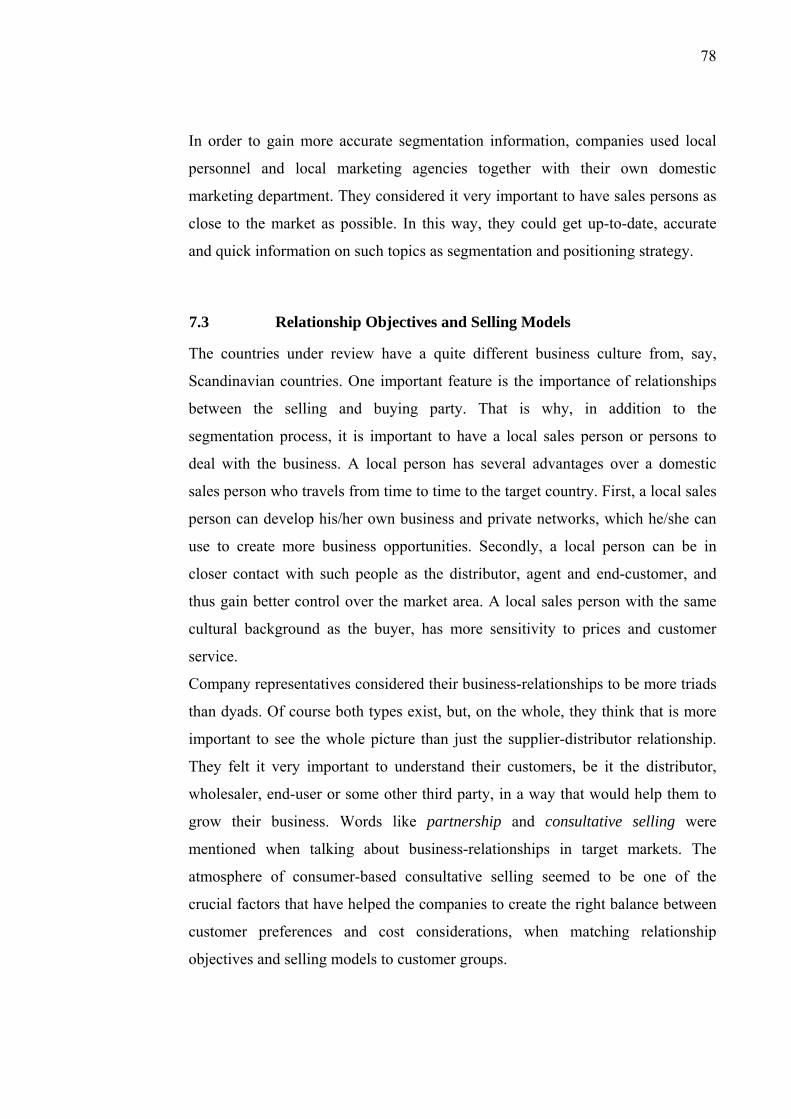
78
In order to gain more accurate segmentation information, companies used local
personnel and local marketing agencies together with their own domestic
marketing department. They considered it very important to have sales persons as
close to the market as possible. In this way, they could get up-to-date, accurate
and quick information on such topics as segmentation and positioning strategy.
7.3 Relationship Objectives and Selling Models
The countries under review have a quite different business culture from, say,
Scandinavian countries. One important feature is the importance of relationships
between the selling and buying party. That is why, in addition to the
segmentation process, it is important to have a local sales person or persons to
deal with the business. A local person has several advantages over a domestic
sales person who travels from time to time to the target country. First, a local sales
person can develop his/her own business and private networks, which he/she can
use to create more business opportunities. Secondly, a local person can be in
closer contact with such people as the distributor, agent and end-customer, and
thus gain better control over the market area. A local sales person with the same
cultural background as the buyer, has more sensitivity to prices and customer
service.
Company representatives considered their business-relationships to be more triads
than dyads. Of course both types exist, but, on the whole, they think that is more
important to see the whole picture than just the supplier-distributor relationship.
They felt it very important to understand their customers, be it the distributor,
wholesaler, end-user or some other third party, in a way that would help them to
grow their business. Words like partnership and consultative selling were
mentioned when talking about business-relationships in target markets. The
atmosphere of consumer-based consultative selling seemed to be one of the
crucial factors that have helped the companies to create the right balance between
customer preferences and cost considerations, when matching relationship
objectives and selling models to customer groups.
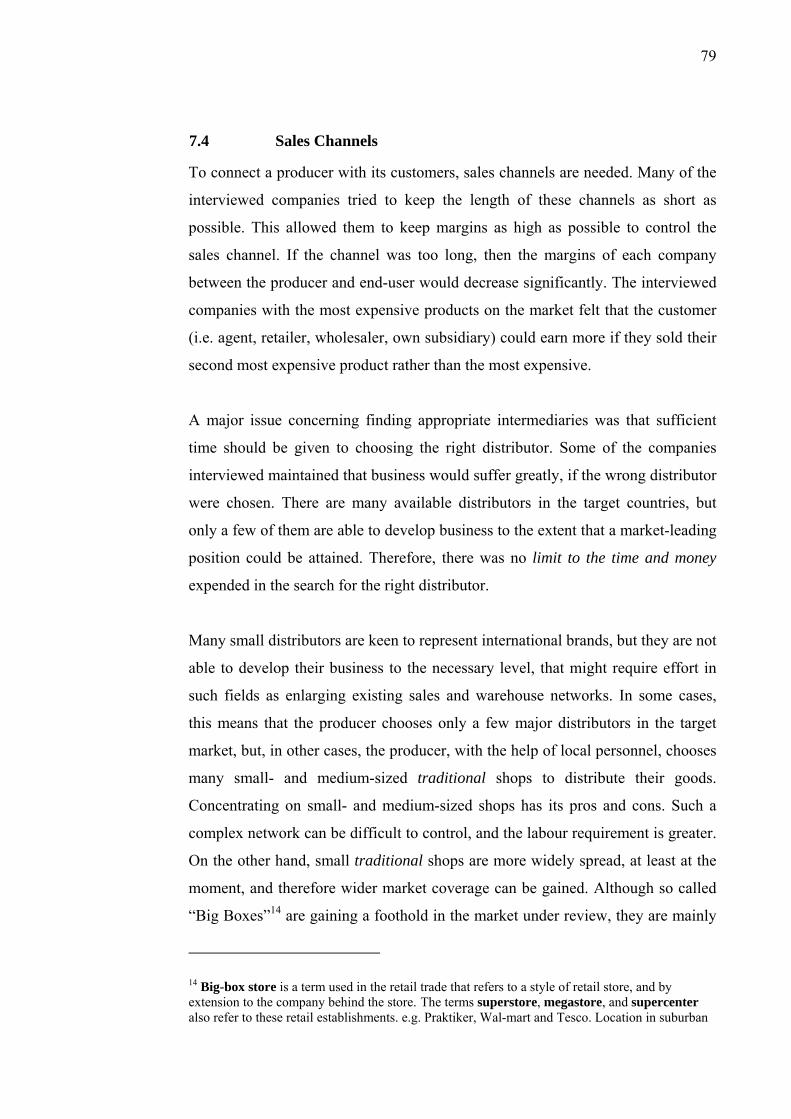
79
7.4 Sales Channels
To connect a producer with its customers, sales channels are needed. Many of the
interviewed companies tried to keep the length of these channels as short as
possible. This allowed them to keep margins as high as possible to control the
sales channel. If the channel was too long, then the margins of each company
between the producer and end-user would decrease significantly. The interviewed
companies with the most expensive products on the market felt that the customer
(i.e. agent, retailer, wholesaler, own subsidiary) could earn more if they sold their
second most expensive product rather than the most expensive.
A major issue concerning finding appropriate intermediaries was that sufficient
time should be given to choosing the right distributor. Some of the companies
interviewed maintained that business would suffer greatly, if the wrong distributor
were chosen. There are many available distributors in the target countries, but
only a few of them are able to develop business to the extent that a market-leading
position could be attained. Therefore, there was no limit to the time and money
expended in the search for the right distributor.
Many small distributors are keen to represent international brands, but they are not
able to develop their business to the necessary level, that might require effort in
such fields as enlarging existing sales and warehouse networks. In some cases,
this means that the producer chooses only a few major distributors in the target
market, but, in other cases, the producer, with the help of local personnel, chooses
many small- and medium-sized traditional shops to distribute their goods.
Concentrating on small- and medium-sized shops has its pros and cons. Such a
complex network can be difficult to control, and the labour requirement is greater.
On the other hand, small traditional shops are more widely spread, at least at the
moment, and therefore wider market coverage can be gained. Although so called
“Big Boxes”14 are gaining a foothold in the market under review, they are mainly
14 Big-box store is a term used in the retail trade that refers to a style of retail store, and by extension to the company behind the store. The terms superstore, megastore, and supercenter also refer to these retail establishments. e.g. Praktiker, Wal-mart and Tesco. Location in suburban

80
representing cheap categories of products, located only in big cities. This is
something that merits further study for Tikkurila - how to find suitable products
and concepts covering both traditional paint shops and larger retail stores?
According to the interviewed persons, managing both channels effectively is the
key to success. Historical factors and the economic boom have given much power
and possibilities for entrepreneurship and small traditional hardware shops. Brand
equity and the resultant higher margins can be built more easily around these
shops, as they have very good in-shop service, visibility, a local flavour and
additional services like designers, architects and installation service. Of course,
many such shops are needed if the producer wishes to attain a market-leading
position. Therefore, adding large retail shops to the sales channel strategy is, if not
crucial, at least important for product volume in the market. The problem is that
margins are very low and competition fierce. It is also assumed that producers
themselves will supply the necessary marketing materials.
7.5 Customer-based Structure
According to interviewed persons, the companies that used an entry mode
approach also had a clear willingness to understand the customer. As mentioned
earlier, partnership and consultative selling were key words for those companies.
This was basically organised on two levels: the organisational stage (structure and
motivation) and the psychological stage. Organisation was built so that
salespersons were as close to the market as possible. This made both local
knowledge and local image available to the producer. Salespersons’ and
managers’ willingness to understand the customer was also supported from the
organisation side, which gave more money, in the form of salary, if good sales
figures were reached. Incentives are discussed more carefully in the ‘Additional
Findings’ section. The psychological stage can be described as sales teams being
trained to adopt a more consultative selling and partnership style then before.
or rural areas, often in proximity to freeways, as opposed to downtown shopping districts. (Big Boxes 2007)

81
According to interviewees, salespersons no longer sell, but solve customers’
problems.
Interviewed companies also pointed out that finding the right sales personnel is
crucial for success. Many of them have had to change or dismiss personnel in
order to reach new sales targets. The salespersons who were hired or stayed in the
company had two things in common. First, they had good communication and
listening skills, and, secondly, they were eager to learn and had a willingness to
help customers.
According to interviewed companies, Customer Relationship Management (CRM)
programmes were undoubtedly seen as important when managing customer
relationships and especially customer touch points. Some of the interviewed
managers revealed, however, that CRM was not used as much as it could have
been. In some cases, CRM was also seen as a bureaucratic procedure that did not
help salespersons in the field to gain more sales and success. Generally speaking,
the idea of CRM - to treat each customer individually - was carried out and
accepted better in the firms that used the entry mode approach for their target
markets.
7.6 Leadership and Management
The goal of this research was not to go too deeply into leadership and
management as successful sales factors, although, in reality, it might have had a
great impact on the subject. It was clearly evident that the companies, which had
more ambitious targets, also had more charismatic leaders. Ambitious targets also
demand much from the personnel. Can the workers who today make 5 million, in
future make 100 million? Quite simply, those who cannot will be dismissed. Some
of the leaders interviewed said that they have worked hard to get the managers
and personnel that they want. This has also meant dismissing those who fall short.
Dismissing staff is never easy and need guts and personality. The question
remains, however, whether the chosen managers and personnel are good learners,
82
exceptionally talented and future leaders, or are they just in accordance with the
leader’s leadership style?
The companies that used a sales approach and only exported occasionally had
more manager-style leadership. They also had a more family-centred corporate
culture. Companies which had an open, reliable, genuine, even naïve and
transparent corporate culture from their customer’s point of view, located most of
their managers and leaders in the mother country. Their strategically important
operations were also concentrated geographically close to the domestic market.
They also had a really low personnel turnover. From a customer point of view,
these companies were not seen as admirable partners in the beginning, but once
the business relationship began, the qualities described above were considered
beneficial.
7.7 Premium Price
A strong brand was definitely seen as the key factor when charging premium
price. The economic situation in the target countries was also seen as a factor
affecting premium products. Although branding is a powerful marketing tool and
creates extra profit, when compared to other similar products, it cannot be
developed without understanding customer needs. As Laakso (2004, 46) stated,
brand is not created unless a customer sees the added value. This has been one of
the key factors for successful companies. They know how to build a brand that
adds value for the customer and is sustainable over the years.
One difference between the interviewed companies was that those who had
double-digit or at least higher yearly growth, also had a clear understanding of
how customers see the brand in different markets, countries and cultures. The
companies that were growing by less than 10% per year in the target markets
undoubtedly had a strong and superior product, but a true understanding of
culture-related consumer brand equity was missing. All interviewed managers saw
branding as important, because it affected so many different relationships. In some
cases, however, corporate branding as a form of advertising was hard to explain at

83
a local level, because it did not necessarily sell anything. Companies that had
well-known brands at local or international level commented that this had helped
them to build good relationships between different stakeholder groups.
Brand loyalty among companies was seen as a double-edged sword. Being market
leader, strong brand gave them an advantage over their competitors, but, on the
other hand, all their operations and decisions were under a magnifying glass.
Companies with less well-known brands, like local producers, were able to
differentiate their products more easily. Strong brands also created market
attraction, but that was of course after understanding what customers really
needed and wanted. So in other words, market attraction is self-evident if a
product fulfils customer need.
Companies that were first on the market, or at least in its early stages, found that
gave them an advantage in two ways over late arrivals. First, it gave them a
chance to build a strong brand image in consumers’ minds with something that
was new to the market, and, secondly, it gave them opportunity to charge
premium price all the time. All the interviewed companies had the same pricing
strategy - be the most expensive all the time. Of course some products in some
categories were cheaper than those of their competitors, but general price image
was higher.
Some of the interviewed companies were able to charge premium price by
offering short delivery times. Operating in South-East Europe, a region where
delivery times are not always the shortest, international companies can cost-
efficiently meet their promised delivery dates through their international logistic
channels.
Keeping up premium price needs local control and a common pricelist.
Interviewed companies mentioned that customers tended to sell the goods at under
recommended prices, if there was no local market control. Selling the most
expensive products is not easy. Therefore local distributors had a tendency to

84
lower the prices so that they would be able to sell all the products that they had
promised. This is not a favourable situation for the producer, because, if one
distributor or one shop lowers its prices, all will follow suite. That will create a
snowball effect that is hard to stop without local control. A common pricelist is
needed so that local and domestic managers can control the price level at national
or regional level. Each customer, depending on their sales and relationship with
the producer, would get a certain discount from the common pricelist. The prices
on this list would be retail prices that the end-customer would pay at the shop.
Local control and a common pricelist were seen one of crucial factors in keeping
prices high.
Salespersons need concrete things to sell. A producer’s product may be superior to
that of a competitor, but it will not sell if salesperson or marketer cannot convey
that superiority to the customer in the right way. All the interviewed companies
had clear selling arguments and selling points for their products. Companies that
used an entry mode approach also used a more cultural and behavioural approach.
They knew their sales arguments and they were also able to adapt them to suit
local conditions. Finding and marketing proper selling arguments were seen as a
crucial factor in keeping prices high.
7.8 Additional Findings
This final section presents several other interesting findings outside Ingram’s sales
strategy framework that came to light during the research. Some of the issues
were dealt casually in previous chapters, if they were related to some other subject
under discussion, but, in this chapter, they are studied more carefully.
An international organisational structure has been one the major factors positively
affecting sales in the target markets under review. Of course, all the companies
had different structures, which best suited their industrial sector and products.
However, common features were found between companies adopting a sales
approach and those with an entry mode approach. Sales approach companies had
their business centred in domestic bases. All their leaders and managers were
85
based in the mother country. This gave them some additional cost savings and
decision-making was faster in some cases. They also had some international
departments that supported international business, but full advantage was not
taken of them. Companies with an entry mode approach had more clearly defined
international organisation. Although the domestic market was important in some
cases such as R&D, sales were totally international and supporting elements were
built according to their requirements. Just because a company was international,
however, this did not mean that all operations or departments were located locally.
Locating operations at local level was done only if it would bring some additional
value or cost savings for the company.
The role of expatriates in the companies interviewed was mostly seen as minor or
insignificant. When starting some operations or building a factory, expatriates
were used more often, but, even then, the duration of assignments varied from just
one to six months. Usually, the export manager, or equivalent, hired local staff to
deal with business at the local level, as soon as business had reached that stage.
Incentives for workers were mainly financial. As mentioned earlier, bonuses on
top of salary ranged from 20% to 40%. This motivated salespersons and leaders
actively to develop their business. This development process was based on a true
understanding of customer needs and desires. For the dealers, distributors and
agents, the incentive system was also financial. The need for and spending of
money is different to the Nordic welfare countries. Therefore, customers were not
generally interested in having around-the-world trips as a reward for being the
best distributor of the year. Money was given to the customers either in the form
of monthly or yearly discounts, monthly marketing support or a year-end lump
sum for marketing and business development. Of course amount and frequency
depended greatly on how important the customer was and how much the customer
had bought or would buy. An incentive system was not seen as crucial to success,
but rather a normal part of channel management and international business.
86
Opinions about corruption varied quite a lot. Most of the business experts said that
it exists, but companies interviewed had little or no exposure to it. Business
experts at local level, who were working with the issue, felt that it had diminished
greatly in recent years, and, although it existed, it did not affect international
companies that much. According to them, corruption is more endemic in the
world of politics. Interviewed companies were of the same opinion. Although they
knew that it existed, they were able to stay out of it. But of course, knowing the
right people from the local authorities did no harm. Companies also commented
that, although they had not personally dealt with the corruption, they were sure
that their clients at local level were making the most of it. It seems that
international companies have been in the region for some time already, and people
at local level know that corruption is not possible within those companies. At this
point, it should perhaps be asked what corruption actually is. Is it corruption if
local authorities offer you dinner, and then give you the stamp you need for your
document, or is it corruption if you take your clients to Lapland to see the
beautiful nature of Finland? Generally speaking, corruption was not seen as a big
obstacle to starting international business operations in the target countries.
Although it exists, international companies have not been confronted with it on a
large scale, if at all. It was also seen as part of international business culture and
therefore accepted without question.
Interviewed companies basically faced their biggest difficulties in three areas:
personnel, finding the right distributors and cultural diversity. In successful
companies, personnel issues were mainly concentrated in replacing incompetent
workers and finding motivated workers with the necessary skills, and, at the same
time, trying to maintain a positive working and corporate atmosphere. For
companies, finding the right distributor is crucial in the long term. A short-term
distributor can be found quite easily, but most likely are not able to develop
business far enough. They might also cause problems in branding, if, for example
the facilities of the distributor are not in accordance with the producer’s brand
qualifications. Negotiations with good distributors might take from two months up
to even 1½ years. Interviewed companies said that if such negations continue for

87
more than six months, it might be hard to convince management to invest more
resources in the negotiations, if the future remains open. But at the same time,
they said that each case must be evaluated separately and common sense must be
used. South-East Europe has several different languages, cultures and political
tendencies that affect consumer behaviour. Interviewed companies and
professional experts stated that this cultural diversity has caused problems with
managing product and language versions. For example, the Balkan area itself
contains two different alphabet systems, several languages and many political
groups that cannot stand each other, and therefore will not buy a product that has
two “competitive” languages on the same label or advertisement. According to
professional experts, the only way to survive in this region, is to listen to the
customer, understand the markets and accept history. If this is handled
professionally, like one interviewed company has done, it can turn into a
competitive advantage. They were the first company in the market to have all the
necessary languages on their products. Consumers still remember this although
even though it happened several years ago.
Interviewed persons considered both customer and in-house training highly
important and part of their success. Of course the level and amount of training
varied between companies, but, generally speaking, training sessions were held
frequently, either because of fast-changing product information or the technical
specification for the product. Training was mainly held as close to the customer as
possible. This gave some additional savings and the possibility to arrange courses
at short notice. In some cases, training was held in some other European country,
e.g. Hungary, if bigger or specialised facilities were needed. This was seen as
positive in two ways; first, it gave a positive and international training
atmosphere, and, secondly, it was seen as cost-effective for courses to be
concentrated in one place with all the necessary equipment available. If longer or
more specified training was needed, it was held at home. For example, one of the
interviewed companies invited 40 decision-makers from its target market to their
factory for 2+2 days of training, of which the first two days were for product and
sales argumentation training and the second two days for a free programme. One

88
of the interviewed companies had their own training programme, which trained
their customers (distributors, shop keepers, agents) on a quarterly basis. In
conclusion, the more international the company is, the more training it holds at
local or regional level.
7.9 Synthesis of the Findings
Success can be said to be a double-edged sword. On one side lies an aggressive
entry mode, clear strategies and the right personnel, but, at the same time, a
family-centred atmosphere and job security are missing. On the other side, small
growth and willingness to take risks are missing, but openness, transparency and
long-term relationships with clients are gained. It seems that certain workers seek
to work with certain leaders and companies, and vice-versa. Those leaders and
companies that are not willing or not able to achieve double-digit growth, will
also have managers, workers, partners, distributors and eventually end-users, who
are satisfied with the existing speed. It also seems that those companies, although
having excellent products and services, do not have a long-term competitive
advantage in global markets, for three reasons: firstly, their organisation is not
built to support international business, secondly, they cannot change as fast as
international markets are changing, and thirdly, their leaders and managers are not
sales- and growth-orientated.
The following table 17 shows characteristics of successful and small growth
companies. Because examples are presented only in one sentence, small
exaggerations might occur. But this has been done deliberately to deliver the
message more clearly to the reader. For example, under the position Sales Culture,
Small Growth Companies, selling style is describes as “Selling without actually
knowing why customers are buying”. This should be interpreted as the companies
selling the product with the same kind of sales argumentation in the target country
as they are in their domestic market. This kind of selling style will give results, if
the product is unique in both countries, but bigger growths would be achieved by
understanding customers as Successful Companies are doing.

89
Table 17. Characteristics of Successful and Small Growth Companies
Successful Companies Small Growth Companies
Organisation Supports international
business
Supports export and domestic
business
Leaders and
managers
Charismatic leaders with
sales- and customer-
orientated managers
Social leaders that are
satisfied with smaller growth
and more stress is on
developing managers’
workings skills in the long
term
Incentive On top of salary. 20%-40%,
depending on the sales
figures
On top of salary, but do not
concretely motivate people to
sell more
Entry Strategy Entry mode approach. Sales approach
Personnel Local salesperson and
managers
Domestic managers and
possible local sales persons
Sales Culture Consultative and partnership
style
Selling without actually
knowing why customers are
buying
Distributors Find the best one Choose the first one
Corporate
culture
Aggressive, sales- and
customer-orientated,
eagerness to achieve more
than has been promised
Open, reliable, family-centred,
genuine, even naïve,
transparent
Prices are kept
high
Understanding the selling
points, which vary from
country to country
Depending on the same selling
points that are selling in
domestic market or markets
nearby
Differentiation Adapting their products and
marketing to local culture
Adapting marketing to local
culture

90
8 CONCLUSIONS
The purpose of this research was to find successful sales factors by benchmarking
other international companies operating in Romania, Bulgaria, Serbia and
Slovenia. The methods used to acquire the desired knowledge were in-depth
interviews and quantitative analysis. Quantitative analysis resulted in information
which can be used as background data when choosing future strategical growth
areas for Tikkurila. In-depth interviews opened the operational field from both
successful and unsuccessful points of view. Based on the findings of the
quantitative analysis and in-depth interviews, the study resulted in the following
conclusions.
Conclusion 1. Romania is the most desirable destination for company’s
operations. Bulgaria is second and Slovenia third. Serbia, although
currently undergoing a massive programme of reform, is fourth.
Conclusion 2. Companies that have a sales approach will grow, but not at the
same speed as the markets. Companies that have an entry mode
approach are willing to take more risks, are more customer-
orientated, and are more likely to achieve a market-leading
position.
Conclusion 3. Successful companies have an international organisation.
Conclusion 4. Successful companies are investing money in training. Training
should happen as close to the customer as possible.
Conclusion 5. Successful companies have partnerships, and a consultative
attitude towards sales and towards their customers.

91
Conclusion 6. Prices can be kept high by acting as follows:
• Always being the most expensive on the market.
• Short delivery time and good quality.
• A pricelist that is common to whole market area. It should
contain end-user retail prices. Discounts to dealers should be
given according to their yearly or monthly performance. Price
control by local manager.
• Truly understanding customers’ needs and desires. Creating a
premium without understanding why a customer would pay
extra does not work.
• Creating effective selling and marketing arguments e.g.
comparing to competitors products.
Conclusion 7. Traditional ‘Paint shop’ concept and ‘Big Box’ concept combined
with an entry strategy should be created.
8.1 Evaluating Results
The results and conclusions of this research are only suggestive, for three reasons.
First, the academic research frame for sales strategy created by Prof. Ingram and
his colleagues has no empirical evidence, or at least none that the author has heard
of. Secondly, the academic frame may be outdated in certain areas, due to the fast-
changing world of business. Thirdly, due to lack of available resources, the
number of interviewed companies was quite low. If time had allowed, more
companies could have been interviewed and the validity of the research would
have been higher.
Although conclusions are suggestive for the reasons mentioned above, generally
speaking, in-depth interviews revealed enough data for the benefit of Tikkurila
managers when making decisions on the internationalisation process. When
interpreting the results of this research, common sense should be used and the
limitations of the market area of the companies interviewed borne in mind.
92
8.2 Suggestions for Future Research
This thesis gives several ideas for future research. Fundamentally, the largest
research area would be the sales strategies of international or global companies.
Many studies place the sales function as part of something else, not as an
individual and strategically important function of the whole company. Secondly,
more empirical data would be needed to verify the validity of the research frame
created by Prof. Ingram et al.. Thirdly, more sales-related research is needed for
South-East Europe. As the area is growing faster than the EU average, more and
more western companies are setting up operations there. Objective and academic
first-hand and benchmarking experiences are desperately needed.
8.3 Concluding Remarks
Conducting the present thesis has been a valuable learning process during which I
have learned a lot about South-East Europe, international business and entry mode
strategies. Moreover, I have learned a lot about the importance of sales in a
company. Profitable sales keep the company running and give the necessary
financial resources to other critical functions of the company. Based on the
observations made while interviewing companies and reviewing theoretical
material, the sales function seems to be more valued in Finland nowadays than it
was a few years ago. It seems that the subject under investigation has many
interesting and unexplored areas with high managerial relevance, and it has been
inspiring to find that there is still much research to be done in this area. Now the
journey will actually begin.

93
REFERENCES
APQC (2006), American Productivity & Quality Centre, Professional
Development: Benchmarking. Available from internet, [cited 15.04.2007],
http://www.apqc.org/PDF/services/professionaldeve
lopment/benchmarking_courses.pdf.
Basescu, T. (2006), Romania: An Energy Gateway to Western Europe. Speech by
Romanian President Basescu at the conference “Caspian Energy Exports & the
Black Sea Corridor”, Available from internet, [cited 22.04.2007],
http://www.jamestown.org/docs/BasescuSpeech.pdf.
Bennett, R., Rundle-Thiele, S. (2005), The Brand Loyalty Life Cycle: Implications
for Marketers. Journal of Brand Management, Vol 12, No. 4, April 2005.
ABI/INFORM Global.
Big Boxes (2007), Wikipedia – Big-Box Store, Available from Internet, [cited
28.04.2007], http://en.wikipedia.org/wiki/Big-box
Blumethal, D. (2004), Why Branding as We Know it, is About to Collapse. Journal
of Brand Management, Feb 2005 Vol. 12 No. 3, ABI/INFORM Global.
Bulgaria (2007), Wikipedia – Bulgaria, Available from Internet, [cited
02.04.2007], http://en.wikipedia.org/wiki/Bulgaria.
Camp, R. (1995), Business Process Benchmarking. Finding and Implementing
Best Practices. ASQC Quality Press, Milwaukee, Wisconsin.
Chisnall, P. (1992), Marketing Research. 4th edition. The McGraw-Hill Marketing
series. McGraw-Hill Book Company Europe, England.
94
Coatings COMET (2005), Looking East, Looking West: The East European
Market Nexus. Available through Tikkurila’s Information Centre, [cited
03.01.2007].
Cooper, D., Schindler, P. (2006), Marketing research. McGraw-Hill/Irwin
Marketing series. McGraw-Hill Companies, Inc., New York.
Corporate Structure (2007), Tikkurila Presentation 2007. Available from
Tikkurila’s intranet, [cited 03.01.2007].
Czinkota, M., Ronkainen, I. (2004), International Marketing, Seventh Edition.
Mason, Ohio: Thomson-South Western.
Dionne, L. (2001), Leader-Member Exchange (LMX): Level of Negotiating
Latitude and Job Satisfaction. Available from internet, [cited 05.05.2007],
www.onepine.info/lmxpaper.doc
Enlargement of EU (2007), Wikipedia – European Union, Available from internet,
[cited 02.04.2007],
http://en.wikipedia.org/wiki/Enlargement_of_the_European_Union#Serbia.
Ford, D., Gadde, L-E., Håkansson, H., Lundgren, A., Snehota, I., Turnbull, P.,
Wilson, D. (1998), Managing Business Relationships. John Wiley & Sons Ltd.,
Chichester, England.
Freedom House (2007), Non-profit organisation supporting democracy and
freedom. Available from internet, [cited 02.05.2007],
http://freedomhouse.org/template.cfm?page=1
Goleman, D., Boyatzis, R., McKee, A. (2002), Primal Leadership, Realizing the
power of the emotional intelligence. Harvard Business School Press, Boston,
Massachusetts.

95
GPF – ranking (2007), Global Press Freedom Rankings, Available from internet,
[cited 02.05.2007], http://www.freedomhouse.org/uploads/fop/2007/pfscharts.pdf
Havila, V., Johanson, J., Thilenius, P. (2004), International Business-Relationship
Triads. Editor David, F. The Industrial Marketing and Purchasing Group and
International Marketing. International Marketing Review Vol.21 No.2 pp172-186.
Emerald Group Publishing Limited.
Herzen, P. (2006), Brändi yritysmarkkinoinnissa. Talentum media Oy, Economica
series No. 36. Karisto Oy, Hämeenlinna.
Hitt, M., Ireland, D., Hoskisson, R. (2001), Strategic Management,
Competitiveness and Globalization. 4th edition, South-Western College
Publishing, Cincinnati, Ohio, USA.
Huczynski, A., Buchanan, D. (2001), Organizational Behaviour, An introductory
text. Fourth edition, Prentice Hall, Financial Times, Essex, England.
IBRD – Bulgaria, Romania, Serbia, Slovenia (2007), Ease of Doing Business –
How to Reform. Available from internet, [cited 02.04.2007],
http://www.doingbusiness.org/documents/
Doing_Business_2007_Country_pages.pdf
IBRD – Rank Method (2007), Ease of doing business – How to Reform. Available
from internet, [cited 02.04.2007], http://www.doingbusiness.org/Documents/
DB07Easeofdoingbusinessrankmethod.pdf
IBRD – Economy Rankings (2007), Ease of Doing Business – How to Reform.
Available from internet, [cited 02.04.2007], http://www.doingbusiness.org/
EconomyRankings/

96
Ingram, T., LaForge, R. and Leigh, T. (2001), Selling in the new millennium, A
joint agenda. Industrial Marketing Management Journal, Vol. 31. Pp.559-567.
Investors (2007), Investing Glossary – Del Credere. Available from internet,
[cited 27.04.2007],
http://www.investorwords.com/1382/del_credere_agency.html.
IRL (2006), The Top 50 Paint Companies in Eastern Europe. IRL – Information
Research, 2nd edition. CP House, Ealing, London.
Jackson, N., Lund, H. (2000), Benchmarking for Higher Education. SRHE and
University Press, Philadelphia, USA.
Jones, R. (2005), Finding sources of brand value: Developing a stakeholder
model of brand equity. Journal of Brand Management, Vol 13, No 1.
ABI/INFORM Global.
Junttila, M. (1995), Benchmarking – menetelmän suunnittelun tehostaminen.
Final Thesis, Department of Industrial Engineering and Management,
Lappeenranta Technical University.
Juran, J.M., Godfrey, A.B. (1999), Juran’s Quality Handbook. Fifth Edition.
McGraw-Hill, USA.
Kemira (2006), Annual Report. Available from internet, [cited 27.04.2007],
http://www.kemira.com/NR/rdonlyres/C89B6E02-26D6-46E5-850E-
9D079691640F/0/Kemira_Annual_Report_2006.pdf
Kosovo (2007), Wikipedia – Kosovo. Available from internet, [cited 22.04.2007],
http://en.wikipedia.org/wiki/Kosovo#Demographics

97
Kotler, P. (1999), Principles of Marketing. Second European Edition. Prentice
Hall Europe. Upper Saddle River, New Jersey.
Kotler, P. (2000), Marketing Management, The Millennium Edition. Prentice Hall
International, Inc. Upper Saddle River, New Jersey.
Kotler, P., Armstrong, G. (2006), Principles of Marketing. Eleventh Edition,
Pearson Education, Inc., Upper Saddle River, New Jersey.
Laakso, H. (2004), Brändit kilpailuetuna. Miten rakennan ja kehitän
tuotemerkkiä. 6th edition. Enterprise Adviser – series No. 9. Talentum Media Oy,
Helsinki.
Lecklin, O. (1999), Laatu yrityksen menestystekijänä. 3rd edition. Gummerus
Kirjapaino Oy, Jyväskylä.
Lipiäinen, T. (2001), Liiketoiminnan Kehittäminen Uudella Vuosituhannella.
Kaupunkitohtori Oy, Gummerus Kirjapaino Oy, Jyväskylä.
McShane, S., Von Glinow, M. (2000), Organizational Behavior. McGraw-Hill
Companies, Inc. Unites States of America.
Montenegro (2007), Wikipedia – Montenegro. Available from Internet, [cited
24.04.2007] http://en.wikipedia.org/wiki/Montenegro.
Moore, D. and McCabe, G. (1999), Introduction to the Practice of Statistics. 3rd
edition, New York: W. H. Freeman.
Noble, J. (2006), Branding from Commercial Perspective. Journal of Brand
Management, Vol 13, No 3. ABI/INFORM Global.

98
Onepine (2007), Organisational theories and management history. Available
from internet, [cited 12.04.2007], http://www.onepine.info/lead1.htm.
Coatings Europe (2005), Paints, Adhesives & Inks – July 2005 issue. Available
through Tikkurila’s information centre, [cited 04.01.2007], http://www.pra-
world.com/cgi-bin/comet/ sgml2html.pl?abs=2005-7.028&words=serbia.
Porter, M. (1985), Competitive Advantage, Creating and Sustaining Superior
Performance. The Free Press, a division of Macmillan, Inc., New York.
Romania. (2007), Wikipedia – Romania. Available from internet, [cited
02.04.2007], http://en.wikipedia.org/wiki/Romania.
Root, F. (1994), Entry Strategies for International Markets. Revised and
expanded edition. Lexington Books, New York.
Rugman, A., D’Cruz, J. (2000), Multinationals as flagship firms, Regional
business networks. Oxford University Press Inc. New York.
Schadewitz, A., (2006), Tikkurila – a major paint producer with well-known
brands. Available from Tikkurila’s intranet, [cited 03.05.2007].
South-East Europe (2007), Wikipedia – Southeast European countries. Available
from internet, [cited 02.05.2007], http://en.wikipedia.org/wiki/Southeast_Europe
Solomon, M., Marshall, G., Stuart, E. (2006), Marketing, Real People, Real
Choices. 5th edition, Pearson Prentice Hall, Inc., Upper Saddle River, New Jersey.
Tikkurila (2007), Tikkurila home-page. Available from internet, [cited
27.04.2007], www.tikkurila.com

99
Transition Economy (2007), Wikipedia – Transition Economy, Available from
internet, [cited 02.04.2007], http://en.wikipedia.org/wiki/Transition_economy.
Transparency International (2006), Global Corruption Report. Available from
internet, [cited 02.04.2007], http://www.transparency.org/publications/
gcr/download_gcr.
UNCTAD – World Investment Report (2006), FDI from Developing and
Transition Economies: Implications for Development. Available from internet,
[cited 02.04.2007], http://www.unctad.org/en/docs/wir2006_en.pdf
Verkholantsev, V. (2006), Successor states: Prof. Vladimir V. Verkholantsev
discusses the paint markets in the Balkan States of Slovenia, Croatia and Serbia.
DMG World Media Ltd. Available through Tikkurila’s information centre, [cited
03.01.2007].
World factbook (2007), The World factbook by CIA. Available from Internet,
[cited 22.04.2007], https://www.cia.gov/cia/publications/factbook/
World factbook – Serbia-Montenegro (2007), The World factbook by CIA.
Available from Internet, [cited 22.04.2007], https://www.cia.gov/cia/publications/
factbook/geos/yi.html
Zairi, M. (1998), Benchmarking for Best Practise, Continuous Learning Through
Sustainable Innovation. Butterworth-Heinemann, Great Britain.

100
PERSONS INTERVIEWED
Bugarcic, Dragan. Sales and Marketing Manager for Czech Airlines, Serbia,
Belgrade. 22.02.2007
Dragovic, Dejan. Expert-associate, Belgrade Chamber of Economy, Belgrade,
Serbia. 23.02.2007
Hirviniemi, Jukka. Vice President CEE, Ruukki Construction. Vantaa, Finland.
09.02.2007
Inkari, Antero. Counsellor, Embassy of Finland, Bucharest, Romania. 19.02.2007
Korpi, Anna-Maija. Ambassador, Embassy of Finland, Belgrade, Serbia.
22.02.2007
Kortelainen, Aila. Export Manager, Oras, Rauma, Finland. 05.02.2007
Krulj, Vladimir. Doctor, General Manager Pristop, Belgrade, Serbia. 22.02.2007
Lindblom, A. D.Sc (econ.), Professor at Helsinki School of Economics. Phone
interview. Helsinki, Finland 22.03.2007
Leinonen, Harri. Area Manager, Nokia Mobile Phones, Salo, Finland. 26.02.2007
Nikodijevic, Vladimir. Territory Manager, Ecolab, Belgrade, Serbia. 22.02.2007
Paschalis, Ioannis. Minister Counsellor Economic and Commercial Affairs,
Embassy of Greece in Romania, Bucharest, Romania. 21.02.2007.

101
Pejoski, Dragoljub. Zamenik Direktora, Tim Talenata, Belgrade, Serbia.
22.02.2007
Prohaska, Obrad Bob. Commercial and Technical Assistant in Embassy of
Finland, Belgrade, Serbia. 22.02.2007
Radisic, Jelena. Account Manager, Buzz Advertising, Belgrade, Serbia.
22.02.2007
Salokangas, Janne. Export Manager, Abloy, Joensuu, Suomi. 05.03.2007 and
phone interview 09.03.2007
Söderholm, Thomas. Business Manager, Tikkurila Paints, Deco International,
Finland. 08.01.2007
Savic, Radomir. Account Planner / Manager, Buzz Advertising, Belgrade, Serbia.
22.02.2007
Tamas-Hermelin, Fredrike. First Secretary, Embassy of Sweden in Romania,
Bucharest, Romania. 21.02.2007
Tosic, Vera. Head of Centre for Foreign Economic Relations, Belgrade Chamber
of Economy, Belgrade, Serbia. 23.02.2007
Tunea, Maria. Head of Finpro Romania, Bucharest, Romania. 19.02.2007
Vesic, Gordana. Consultant, Hauska and Partners, Belgrade, Serbia. 23.02.2007

102
APPENDICES
APPENDIX 1/10 Ease of Doing Business, Business Environment Summary, Romania
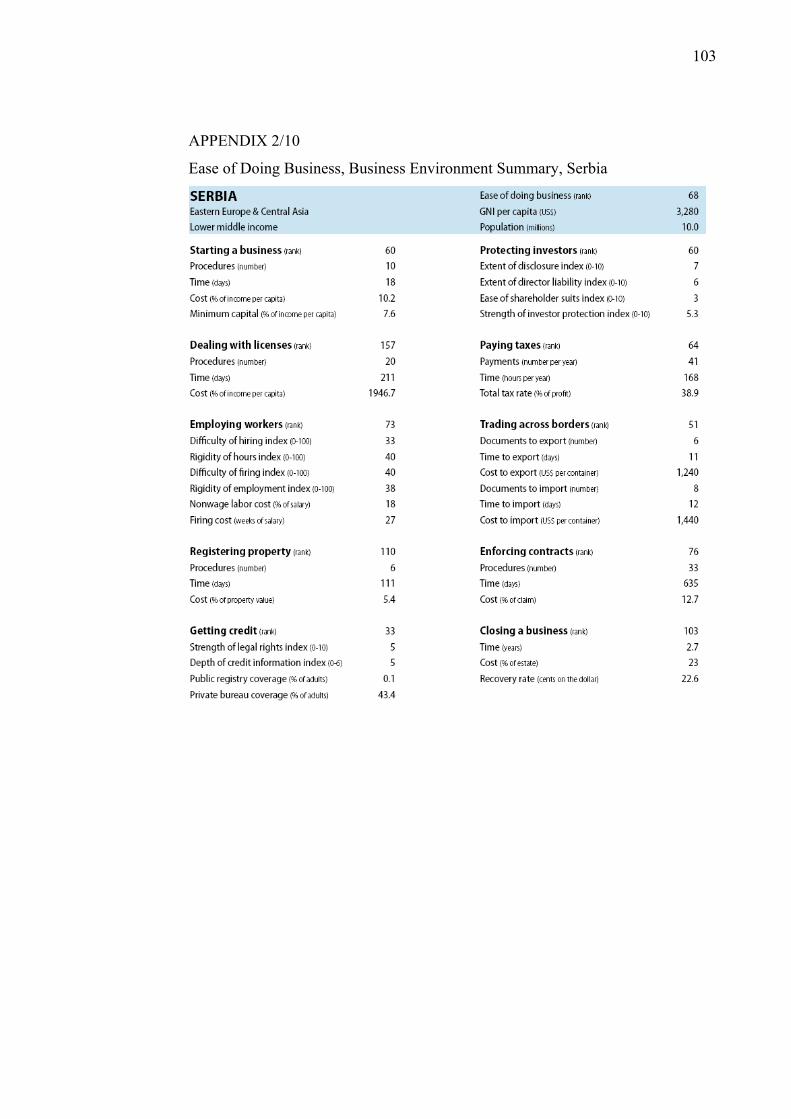
103
APPENDIX 2/10
Ease of Doing Business, Business Environment Summary, Serbia
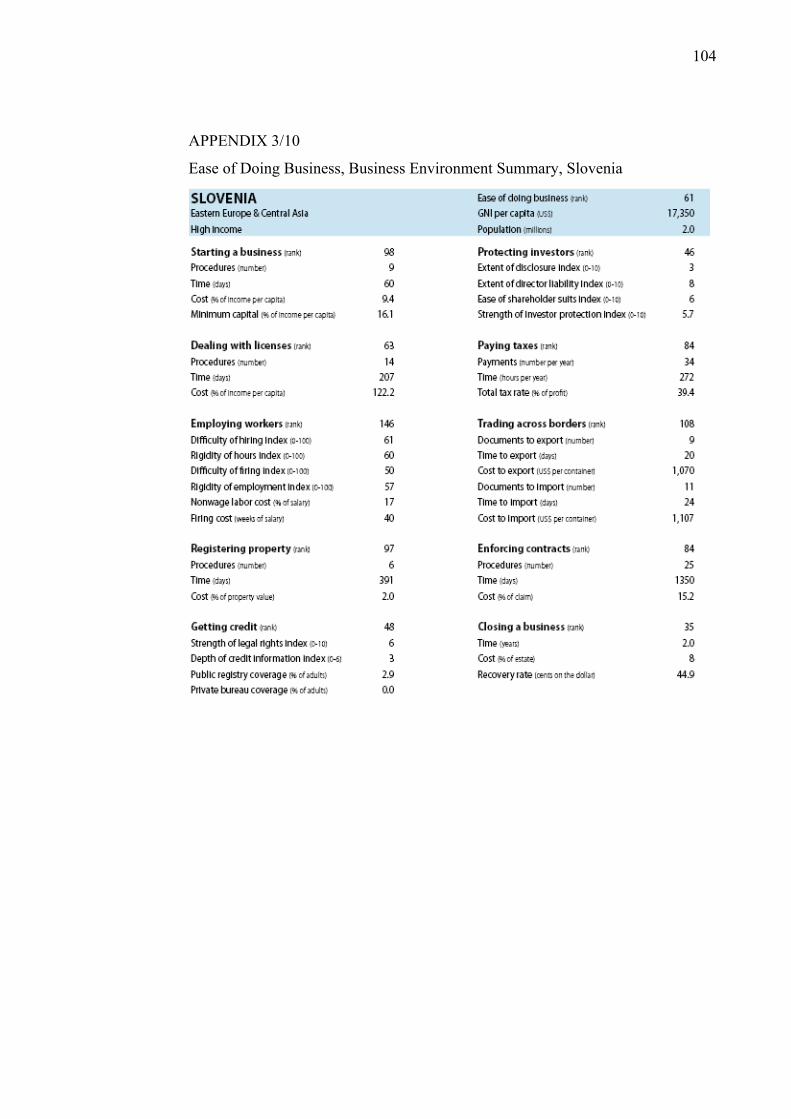
104
APPENDIX 3/10
Ease of Doing Business, Business Environment Summary, Slovenia

105
APPENDIX 4/10 Ease of Doing Business, Business Environment Summary, Bulgaria
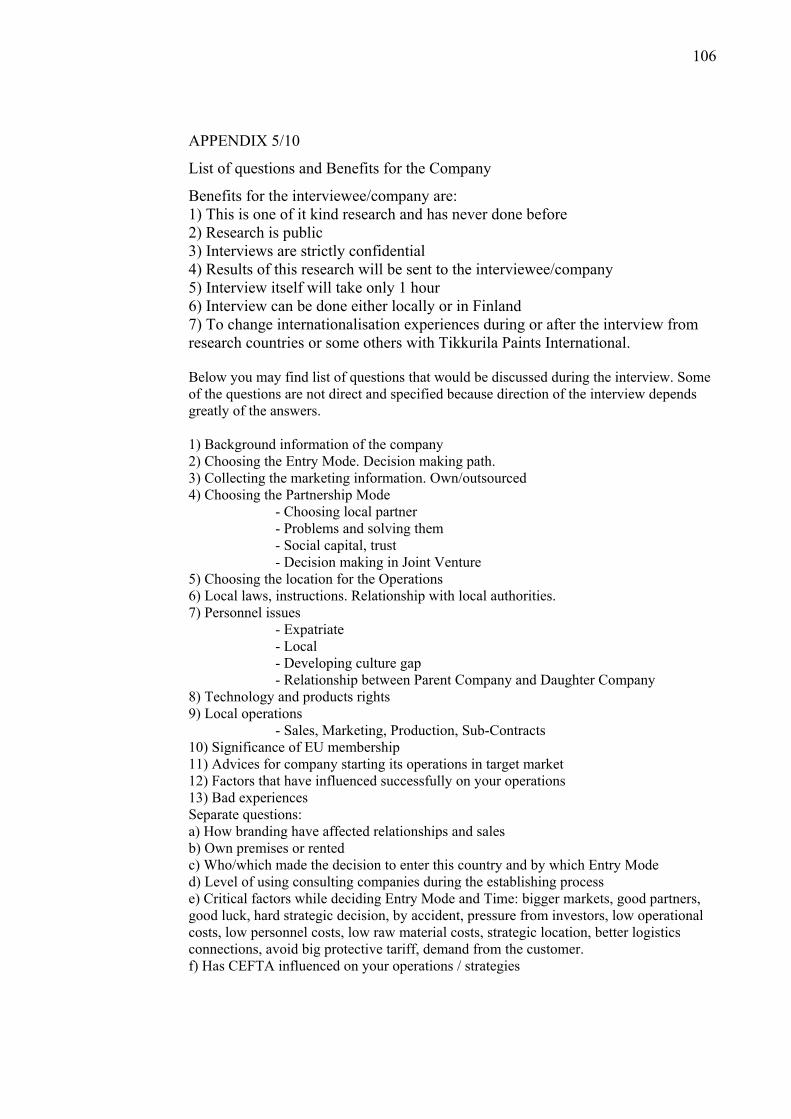
106
APPENDIX 5/10
List of questions and Benefits for the Company
Benefits for the interviewee/company are: 1) This is one of it kind research and has never done before 2) Research is public 3) Interviews are strictly confidential 4) Results of this research will be sent to the interviewee/company 5) Interview itself will take only 1 hour 6) Interview can be done either locally or in Finland 7) To change internationalisation experiences during or after the interview from research countries or some others with Tikkurila Paints International. Below you may find list of questions that would be discussed during the interview. Some of the questions are not direct and specified because direction of the interview depends greatly of the answers. 1) Background information of the company 2) Choosing the Entry Mode. Decision making path. 3) Collecting the marketing information. Own/outsourced 4) Choosing the Partnership Mode - Choosing local partner - Problems and solving them - Social capital, trust - Decision making in Joint Venture 5) Choosing the location for the Operations 6) Local laws, instructions. Relationship with local authorities. 7) Personnel issues - Expatriate - Local - Developing culture gap - Relationship between Parent Company and Daughter Company 8) Technology and products rights 9) Local operations - Sales, Marketing, Production, Sub-Contracts 10) Significance of EU membership 11) Advices for company starting its operations in target market 12) Factors that have influenced successfully on your operations 13) Bad experiences Separate questions: a) How branding have affected relationships and sales b) Own premises or rented c) Who/which made the decision to enter this country and by which Entry Mode d) Level of using consulting companies during the establishing process e) Critical factors while deciding Entry Mode and Time: bigger markets, good partners, good luck, hard strategic decision, by accident, pressure from investors, low operational costs, low personnel costs, low raw material costs, strategic location, better logistics connections, avoid big protective tariff, demand from the customer. f) Has CEFTA influenced on your operations / strategies

107
APPENDIX 6/10 Recoding permission
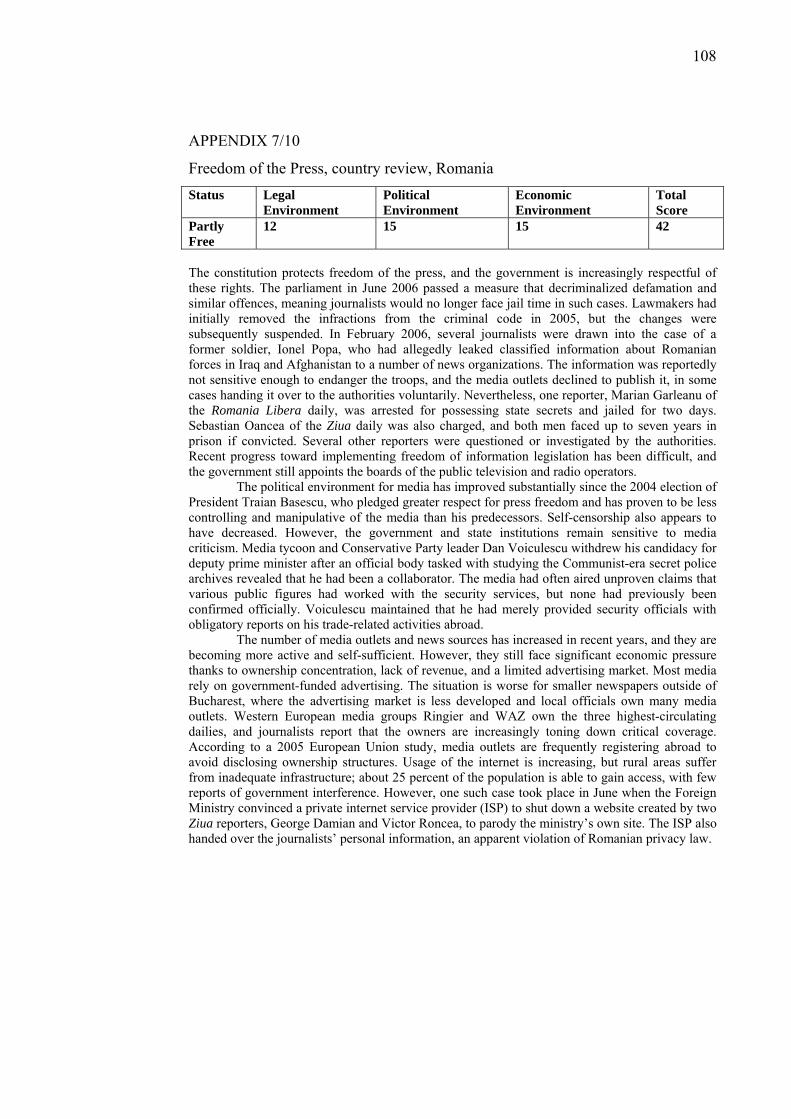
108
APPENDIX 7/10
Freedom of the Press, country review, Romania Status Legal
Environment Political Environment
Economic Environment
Total Score
Partly Free
12 15 15 42
The constitution protects freedom of the press, and the government is increasingly respectful of these rights. The parliament in June 2006 passed a measure that decriminalized defamation and similar offences, meaning journalists would no longer face jail time in such cases. Lawmakers had initially removed the infractions from the criminal code in 2005, but the changes were subsequently suspended. In February 2006, several journalists were drawn into the case of a former soldier, Ionel Popa, who had allegedly leaked classified information about Romanian forces in Iraq and Afghanistan to a number of news organizations. The information was reportedly not sensitive enough to endanger the troops, and the media outlets declined to publish it, in some cases handing it over to the authorities voluntarily. Nevertheless, one reporter, Marian Garleanu of the Romania Libera daily, was arrested for possessing state secrets and jailed for two days. Sebastian Oancea of the Ziua daily was also charged, and both men faced up to seven years in prison if convicted. Several other reporters were questioned or investigated by the authorities. Recent progress toward implementing freedom of information legislation has been difficult, and the government still appoints the boards of the public television and radio operators.
The political environment for media has improved substantially since the 2004 election of President Traian Basescu, who pledged greater respect for press freedom and has proven to be less controlling and manipulative of the media than his predecessors. Self-censorship also appears to have decreased. However, the government and state institutions remain sensitive to media criticism. Media tycoon and Conservative Party leader Dan Voiculescu withdrew his candidacy for deputy prime minister after an official body tasked with studying the Communist-era secret police archives revealed that he had been a collaborator. The media had often aired unproven claims that various public figures had worked with the security services, but none had previously been confirmed officially. Voiculescu maintained that he had merely provided security officials with obligatory reports on his trade-related activities abroad.
The number of media outlets and news sources has increased in recent years, and they are becoming more active and self-sufficient. However, they still face significant economic pressure thanks to ownership concentration, lack of revenue, and a limited advertising market. Most media rely on government-funded advertising. The situation is worse for smaller newspapers outside of Bucharest, where the advertising market is less developed and local officials own many media outlets. Western European media groups Ringier and WAZ own the three highest-circulating dailies, and journalists report that the owners are increasingly toning down critical coverage. According to a 2005 European Union study, media outlets are frequently registering abroad to avoid disclosing ownership structures. Usage of the internet is increasing, but rural areas suffer from inadequate infrastructure; about 25 percent of the population is able to gain access, with few reports of government interference. However, one such case took place in June when the Foreign Ministry convinced a private internet service provider (ISP) to shut down a website created by two Ziua reporters, George Damian and Victor Roncea, to parody the ministry’s own site. The ISP also handed over the journalists’ personal information, an apparent violation of Romanian privacy law.
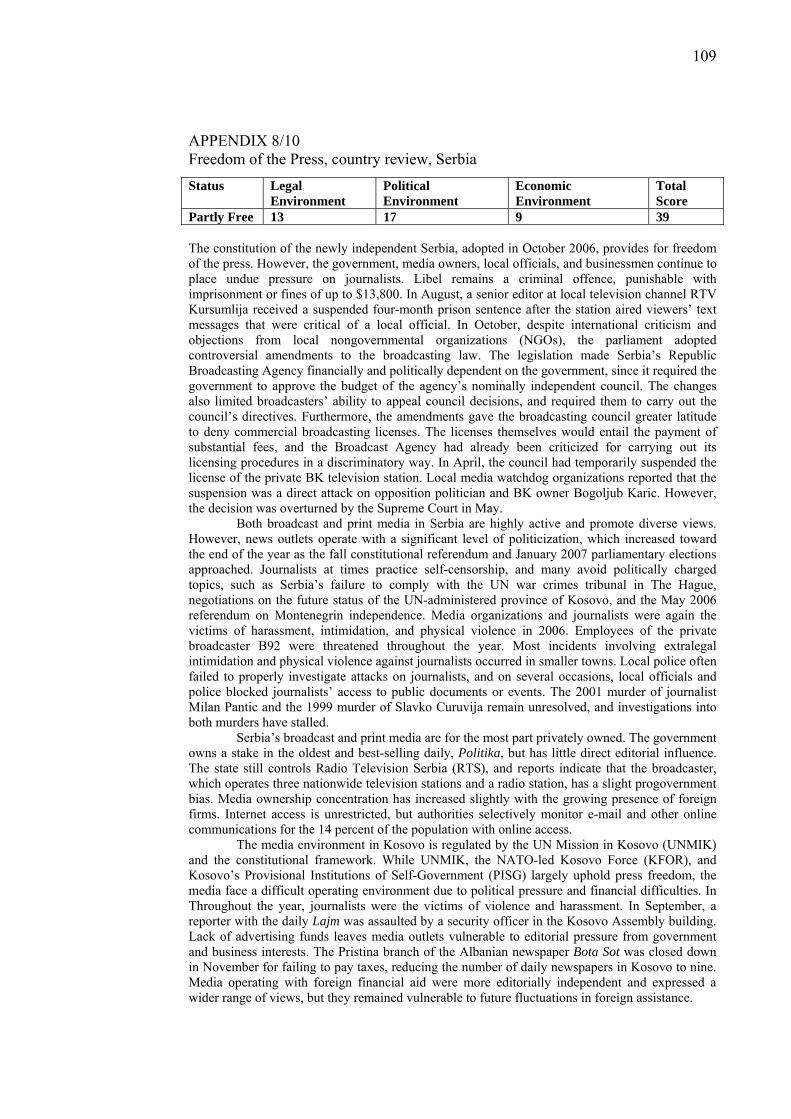
109
APPENDIX 8/10 Freedom of the Press, country review, Serbia Status Legal
Environment Political Environment
Economic Environment
Total Score
Partly Free 13 17 9 39 The constitution of the newly independent Serbia, adopted in October 2006, provides for freedom of the press. However, the government, media owners, local officials, and businessmen continue to place undue pressure on journalists. Libel remains a criminal offence, punishable with imprisonment or fines of up to $13,800. In August, a senior editor at local television channel RTV Kursumlija received a suspended four-month prison sentence after the station aired viewers’ text messages that were critical of a local official. In October, despite international criticism and objections from local nongovernmental organizations (NGOs), the parliament adopted controversial amendments to the broadcasting law. The legislation made Serbia’s Republic Broadcasting Agency financially and politically dependent on the government, since it required the government to approve the budget of the agency’s nominally independent council. The changes also limited broadcasters’ ability to appeal council decisions, and required them to carry out the council’s directives. Furthermore, the amendments gave the broadcasting council greater latitude to deny commercial broadcasting licenses. The licenses themselves would entail the payment of substantial fees, and the Broadcast Agency had already been criticized for carrying out its licensing procedures in a discriminatory way. In April, the council had temporarily suspended the license of the private BK television station. Local media watchdog organizations reported that the suspension was a direct attack on opposition politician and BK owner Bogoljub Karic. However, the decision was overturned by the Supreme Court in May.
Both broadcast and print media in Serbia are highly active and promote diverse views. However, news outlets operate with a significant level of politicization, which increased toward the end of the year as the fall constitutional referendum and January 2007 parliamentary elections approached. Journalists at times practice self-censorship, and many avoid politically charged topics, such as Serbia’s failure to comply with the UN war crimes tribunal in The Hague, negotiations on the future status of the UN-administered province of Kosovo, and the May 2006 referendum on Montenegrin independence. Media organizations and journalists were again the victims of harassment, intimidation, and physical violence in 2006. Employees of the private broadcaster B92 were threatened throughout the year. Most incidents involving extralegal intimidation and physical violence against journalists occurred in smaller towns. Local police often failed to properly investigate attacks on journalists, and on several occasions, local officials and police blocked journalists’ access to public documents or events. The 2001 murder of journalist Milan Pantic and the 1999 murder of Slavko Curuvija remain unresolved, and investigations into both murders have stalled.
Serbia’s broadcast and print media are for the most part privately owned. The government owns a stake in the oldest and best-selling daily, Politika, but has little direct editorial influence. The state still controls Radio Television Serbia (RTS), and reports indicate that the broadcaster, which operates three nationwide television stations and a radio station, has a slight progovernment bias. Media ownership concentration has increased slightly with the growing presence of foreign firms. Internet access is unrestricted, but authorities selectively monitor e-mail and other online communications for the 14 percent of the population with online access.
The media environment in Kosovo is regulated by the UN Mission in Kosovo (UNMIK) and the constitutional framework. While UNMIK, the NATO-led Kosovo Force (KFOR), and Kosovo’s Provisional Institutions of Self-Government (PISG) largely uphold press freedom, the media face a difficult operating environment due to political pressure and financial difficulties. In Throughout the year, journalists were the victims of violence and harassment. In September, a reporter with the daily Lajm was assaulted by a security officer in the Kosovo Assembly building. Lack of advertising funds leaves media outlets vulnerable to editorial pressure from government and business interests. The Pristina branch of the Albanian newspaper Bota Sot was closed down in November for failing to pay taxes, reducing the number of daily newspapers in Kosovo to nine. Media operating with foreign financial aid were more editorially independent and expressed a wider range of views, but they remained vulnerable to future fluctuations in foreign assistance.

110
APPENDIX 9/10 Freedom of the Press, country review, Slovenia Status Legal
Environment Political Environment
Economic Environment
Total Score
Partly Free 5 9 7 21
The Slovenian constitution and legal system guarantee freedom of the press, and the government typically upholds it in practice. However, reports of government pressure and interference in the media are a growing cause for concern. Although libel is not punishable with prison terms, it remains a criminal offence. A controversial law that took effect in late 2005 served to increase government influence on public media outlets, establishing a programming council and a supervisory board to oversee the public television and radio network. Of the 29 members of the programming council, the parliament appoints 21 members; 3 members are elected by national radio and television employees; 2 members are appointed by the president based on nominations from religious groups; the Italian and Hungarian minorities each appoint one member; and the Slovenian Academy of Arts and Sciences also appoints a member. Parliament appoints five members of the 11-member supervisory board, the government appoints four members, and employees appoint two members.
Media are able to freely report on government activities and express a diversity of viewpoints. However, there were several reports of police using unnecessary force against journalists in 2006, and news outlets faced indirect political and economic pressure from the government and business interests. On occasion, government officials have openly criticized members of the media, treating them as a political opposition. Major print outlets are adequately financed through advertising sales and private investment, but the government owns stakes in companies that hold shares in major media firms. The public broadcaster’s television and radio channels compete with a handful of commercial stations. Freelance journalists do not fall under the current labour legislation, leaving them vulnerable to pressure from media owners, who are themselves strongly influenced by investors and public officials. Internet access is unrestricted and widely available with more than 50 percent of the population reportedly using the internet in 2006.
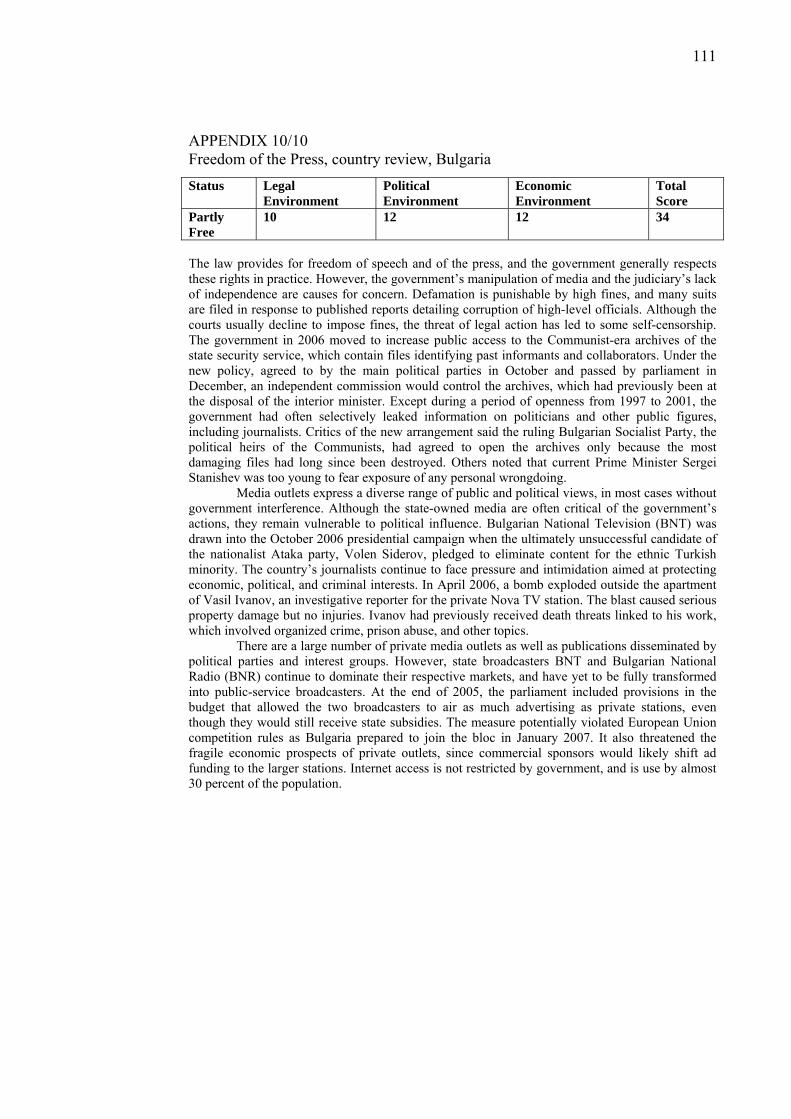
111
APPENDIX 10/10 Freedom of the Press, country review, Bulgaria Status Legal
Environment Political Environment
Economic Environment
Total Score
Partly Free
10 12 12 34
The law provides for freedom of speech and of the press, and the government generally respects these rights in practice. However, the government’s manipulation of media and the judiciary’s lack of independence are causes for concern. Defamation is punishable by high fines, and many suits are filed in response to published reports detailing corruption of high-level officials. Although the courts usually decline to impose fines, the threat of legal action has led to some self-censorship. The government in 2006 moved to increase public access to the Communist-era archives of the state security service, which contain files identifying past informants and collaborators. Under the new policy, agreed to by the main political parties in October and passed by parliament in December, an independent commission would control the archives, which had previously been at the disposal of the interior minister. Except during a period of openness from 1997 to 2001, the government had often selectively leaked information on politicians and other public figures, including journalists. Critics of the new arrangement said the ruling Bulgarian Socialist Party, the political heirs of the Communists, had agreed to open the archives only because the most damaging files had long since been destroyed. Others noted that current Prime Minister Sergei Stanishev was too young to fear exposure of any personal wrongdoing.
Media outlets express a diverse range of public and political views, in most cases without government interference. Although the state-owned media are often critical of the government’s actions, they remain vulnerable to political influence. Bulgarian National Television (BNT) was drawn into the October 2006 presidential campaign when the ultimately unsuccessful candidate of the nationalist Ataka party, Volen Siderov, pledged to eliminate content for the ethnic Turkish minority. The country’s journalists continue to face pressure and intimidation aimed at protecting economic, political, and criminal interests. In April 2006, a bomb exploded outside the apartment of Vasil Ivanov, an investigative reporter for the private Nova TV station. The blast caused serious property damage but no injuries. Ivanov had previously received death threats linked to his work, which involved organized crime, prison abuse, and other topics.
There are a large number of private media outlets as well as publications disseminated by political parties and interest groups. However, state broadcasters BNT and Bulgarian National Radio (BNR) continue to dominate their respective markets, and have yet to be fully transformed into public-service broadcasters. At the end of 2005, the parliament included provisions in the budget that allowed the two broadcasters to air as much advertising as private stations, even though they would still receive state subsidies. The measure potentially violated European Union competition rules as Bulgaria prepared to join the bloc in January 2007. It also threatened the fragile economic prospects of private outlets, since commercial sponsors would likely shift ad funding to the larger stations. Internet access is not restricted by government, and is use by almost 30 percent of the population.