growth, survival, and cannibalism rates of alligator gar
TRANSCRIPT
GROWTH, SURVIVAL, AND CANNIBALISM RATES OF ALLIGATOR GAR
Atractosteus spatula IN RECIRCULATING AQUACULTURE SYSTEMS
A Thesis
Submitted to the Graduate Faculty
of Nicholls State University
in Partial Fulfillment
of the Requirements for the Degree
Master of Science in Marine and Environmental Biology
By
Timothy Allen Clay
B. S., University of Maryland Baltimore County, 2004
Fall 2009

i
CERTIFICATE
This is to certify that the thesis entitled “Growth, survival, and cannibalism rates
of alligator gar Atractosteus spatula in recirculating aquaculture systems” submitted for
the award of Master of Science to Nicholls State University is a record of authentic,
original research conducted by Mr. Timothy Allen Clay under our supervision and
guidance and that no part of this thesis has been submitted for the award of any other
degree, diploma, fellowship, or other similar titles.
APPROVED: SIGNATURE: DATE:
Quenton Fontenot, Ph.D.
Associate Professor of
Biological Sciences _______________________ ____________
Committee Chair
Allyse Ferrara, Ph.D.
Associate Professor of
Biological Sciences _______________________ ____________
Committee Member
Gary LaFleur, Ph.D.
Associate Professor of
Biological Sciences _______________________ ____________
Committee Member
Wendell Lorio, Ph.D.
Biologist
Golden Ranch Plantation _______________________ ____________
Committee Member

ii
ABSTRACT
Alligator gar Atractosteus spatula aquaculture methods are currently being
developed to restore native populations and to potentially create a new commercial
market. The goal of this project was to determine optimal levels of temperature
regulation, feeding ration, and rearing density of larval and juvenile alligator gar based on
growth, survival, and cannibalism rates. To determine the importance of live feed at first
feeding, larval alligator gar fed floating feed were reared with or without an Artemia spp.
supplement for the first 7 days of feeding. Fish supplemented with Artemia had higher
growth rates, higher survival and lower cannibalism rates than fish not supplemented
with Artemia spp. To determine the effect of stocking density and feed ration on culture
of juvenile alligator gar, fish 15 days after hatching (DAH) were stocked at densities of
2.5, 5, 7.5, or 10 fish/L and fed 4 or 8% body weight daily. Fish stocked at 10 fish/L had
higher condition than those stocked at 5 fish/L and individuals fed 8% had higher
survival than fish fed 4% body weight. Juvenile alligator gar (52 DAH) were exposed to
three experiments: (1) regulated and non-regulated temperatures; (2) fed 4% body weight
daily split among 2 feedings or 3 feedings; (3) fed 1, 2, 4, 6, 8, 10, or 12% body weight
daily split among 3 feedings. There was no effect detected for the regulated temperature
trials. Juvenile alligator gar fed 3 times daily had a lower feed conversion ratio (FCR)
than those fed 2 times daily. Highest growth rates occurred when fed 6% or higher feed
rates and fish fed 4% had a lower FCR than those fed 1, 8, 10 or 12%. Alligator gar
should be supplemented with Artemia spp. for the first 7 days of feeding, temperature
does not need to be regulated, and juveniles should be fed 7.4% body weight divided
equally 3 times per day.
iii
ACKNOWLEDGEMENTS
First, I would like to thank my advisor, Dr. Quenton Fontenot, for helping me
through my time at Nicholls State University. Dr. Fontenot has been an incredible
mentor and friend who has taught me more than how to be a professional biologist. I
would like to thank Dr. Allyse Ferrara for opening up my eyes to the wonderful world of
gar. I would like to thank Dr. Gary LaFleur for the interesting conversations and
activities we’ve shared outside of the world of gar. I would also like to thank Dr.
Wendell Lorio for his assistance at Golden Ranch Plantation and his sense of humor
while out in the field.
I would also like to thank the Bayousphere Research Laboratory at Nicholls State
University for providing equipment and space for conducting my research. Thanks are
also extended to Golden Ranch Plantation for providing funding, space, and alligator gar,
all of which were vital to my research. I would like to thank Ricky Campbell from the
Private John Allen Fish Hatchery for providing us with larval alligator gar when
spawning was unsuccessful for us. I would like to thank the graduate students who
helped me with my research, especially those who worked inside the greenhouse and
enjoyed a dip at Golden Ranch Plantation. I would sincerely like to thank Mark Suchy
for his help with my thesis and for his assistance in the care and routine maintenance of
the countless number of gar we have reared.
Lastly I would like to thank my mom, Karen Clay, and the rest of my family. My
mom has supported me through every decision I have made, good or bad, and I could not
be here without her. A special thanks goes out to my dog, Charlie, who has been a
constant companion.

iv
TABLE OF CONTENTS
Certificate .........................................................................................................................i
Abstract .......................................................................................................................... ii
Acknowledgements ....................................................................................................... iii
Table of Contents ........................................................................................................... iv
List of Figures ................................................................................................................. v
List of Tables.................................................................................................................iix
List of Scientific Names ................................................................................................. ix
List of Abbreviations ....................................................................................................... x
Introduction ..................................................................................................................... 1
Methods ........................................................................................................................ 12
Results ........................................................................................................................... 27
Discussion ..................................................................................................................... 65
Recommendations ......................................................................................................... 71
Literature Cited ............................................................................................................. 72
Appendices I-X ............................................................................................................. 78
Biographical Sketch ....................................................................................................... 96
Curriculum Vitae ........................................................................................................... 97

v
LIST OF FIGURES
Figure 1. Relationship between feed level, fish growth rate (SGR; solid line), and feed
conversion ratios (FCR; dashed line). .......................................................... 9
Figure 2. Schematic of single tank system. ............................................................... 13
Figure 3. Schematic of the 4 tank system. ................................................................. 14
Figure 4. Schematic of the modified 4 and 8 tank systems. ....................................... 15
Figure 5. Schematic of larval rearing tank. ............................................................... 19
Figure 6. Mean (± SE) dry weight (a) and TL (b) at 12 DAH (end of Artemia
supplement) and 20 DAH (end of experiment) for larval alligator gar fed a
commercially available floating feed with (solid line) or without (dashed
line) a live Artemia nauplii supplement for the first 7 days of exogenous
feeding. ..................................................................................................... 28
Figure 7. Mean (± SE) condition factor at 12 and 20 DAH for larval alligator gar fed a
commercially available floating feed with (empty boxes) or without (solid
boxes) a live Artemia nauplii supplement for the first 7 days of exogenous
feeding. ..................................................................................................... 29
Figure 8. Mean (± SE) SGR at 12 and 20 DAH for larval alligator gar fed a
commercially available floating feed with (empty boxes) or without (solid
boxes) a live Artemia nauplii supplement for the first 7 days of exogenous
feeding. ..................................................................................................... 30
Figure 9. Mean (± SE) percent total mortalities (open boxes) and observed mortalities
(solid boxes) at 20 DAH for larval alligator gar fed a commercially available
floating feed with (A-S) or without (F-F) a live Artemia nauplii supplement
for the first 7 days of exogenous feeding. .................................................. 31
Figure 10. Final mean (± SE) wet weight and TL of juvenile alligator initially stocked
at different densities (a,b) and fed either 4 to 8 percent body weight split
among three daily feedings (c,d) for 16 days.............................................. 33
Figure 11. Final mean (± SE) condition factor of juvenile alligator initially stocked at
different densities (a) and fed either 4 or 8 percent body mass evenly split
among three daily feedings (b) for 16 days. ............................................... 34
Figure 12. Final mean (± SE) SGR for juvenile alligator initially stocked at different
densities (a) and fed either 4 or 8 percent body mass evenly split among
three daily feedings (b) for 16 days. ........................................................... 35
Figure 13. Final mean (± SE) percent cannibalism (empty boxes) and natural mortality
(solid boxes) of juvenile alligator initially stocked at different densities (a)
and fed either 4 or 8 percent body mass evenly split among three daily
feedings (b) for 16 days. ............................................................................ 36

vi
Figure 14. Mean (± SE) wet weight for subsamples (N = 10) of juvenile alligator gar
exposed to regulated temperatures (solid line) and fluctuating temperatures
(dashed line) for 21 days. .......................................................................... 38
Figure 15. Final mean (± SE) TL of juvenile alligator gar exposed to regulated or
unregulated temperatures for 21 days. ....................................................... 39
Figure 16. Final mean (± SE) condition factor of juvenile alligator gar exposed to
regulated or unregulated temperatures for 21 days. .................................... 40
Figure 17. Final mean (± SE) FCR of juvenile alligator gar exposed to regulated or
unregulated temperatures for 21 days. ....................................................... 41
Figure 18. Final mean (± SE) SGR of juvenile alligator gar exposed to regulated or
unregulated temperatures for 21 days. ....................................................... 42
Figure 19. Final mean (± SE) percent survival of juvenile alligator gar exposed to
regulated or unregulated temperatures for 21 days. .................................... 44
Figure 20. Hourly temperatures for regulated temperature (solid line) and unregulated
temperature (dashed line) treatments for the duration of the experiment. ... 45
Figure 21. Mean (± SE) wet weight for subsamples (N = 10) of juvenile alligator gar
fed 4% body weight split between 2 feedings per day (dashed line) or
among 3 feedings per day (solid line) for 21 days. ..................................... 47
Figure 22. Final mean (± SE) TL of juvenile alligator gar fed 4% body weight split into
2 feedings per day or 3 feedings per day for 21 days. ................................. 48
Figure 23. Final mean (± SE) condition factor of juvenile alligator gar fed 4% body
weight split into 2 feedings per day or 3 feedings per day for 21 days. ....... 49
Figure 24. Final mean (± SE) FCR of juvenile alligator gar fed 4% body weight split
into 2 feedings per day or 3 feedings per day for 21 days. .......................... 50
Figure 25. Final mean (± SE) SGR of juvenile alligator gar fed 4% body weight split
into 2 feedings per day or 3 feedings per day for 21 days. .......................... 51
Figure 26. Final mean (± SE) percent survival of juvenile alligator gar fed 4% body
weight split into 2 feedings per day or 3 feedings per day for 21 days. ....... 52
Figure 27. Mean (± SE) wet weight for subsamples (N = 10) of juvenile alligator gar
fed different rations based on body weight split among three daily feedings
for 21 days. ............................................................................................... 55
Figure 28. Final mean (± SE) wet weight of juvenile alligator gar fed different rations
based on body weight split among three daily feedings for 21 days. .......... 56
Figure 29. Final mean (± SE) TL of juvenile alligator gar fed different feed rations
based on body weight split among three daily feedings for 21 days. .......... 57

vii
Figure 30. Final mean (± SE) condition factor at the conclusion of the experiment for
juvenile alligator gar fed different feed rations based on body weight split
among three daily feedings for 21 days. ..................................................... 58
Figure 31. Final mean (± SE) FCR of juvenile alligator gar fed different feed rations
based on body weight split among three daily feedings for 21 days. .......... 59
Figure 32. Final mean (± SE) SGR of juvenile alligator gar fed different feed rations
based on body weight split among three daily feedings for 21 days. .......... 60
Figure 33. Regression curves of SGR and FCR for juvenile alligator gar fed 1, 2, 4, 6,
8, 10, or 12% body weight daily split among 3 feedings. ........................... 61
Figure 34. Final mean (± SE) percent survival of juvenile alligator gar fed different
feed rations split among three feedings daily for 21 days. .......................... 63

viii
LIST OF TABLES
Table 1. Injection dates with estimated sexes, mean wt (kg ± SE), mean TL (mm ±
SE) and estimated larvae produced in 2008 and 2009. ............................... 17
Table 2. Feeding schedule for larval alligator gar from the 15 May 2008 spawning
reared from hatching to 17 days after hatching (DAH). .............................. 20
Table 3. Feeding schedule for larval alligator gar from the 10 April 2009 injection
reared from hatching to 20 days after hatching (DAH). .............................. 22
Table 4. Mean (±SE) temperature, salinity, DO, pH, TAN, and nitrite for each system
used in the juvenile alligator gar density and feed amount experiment. ...... 37
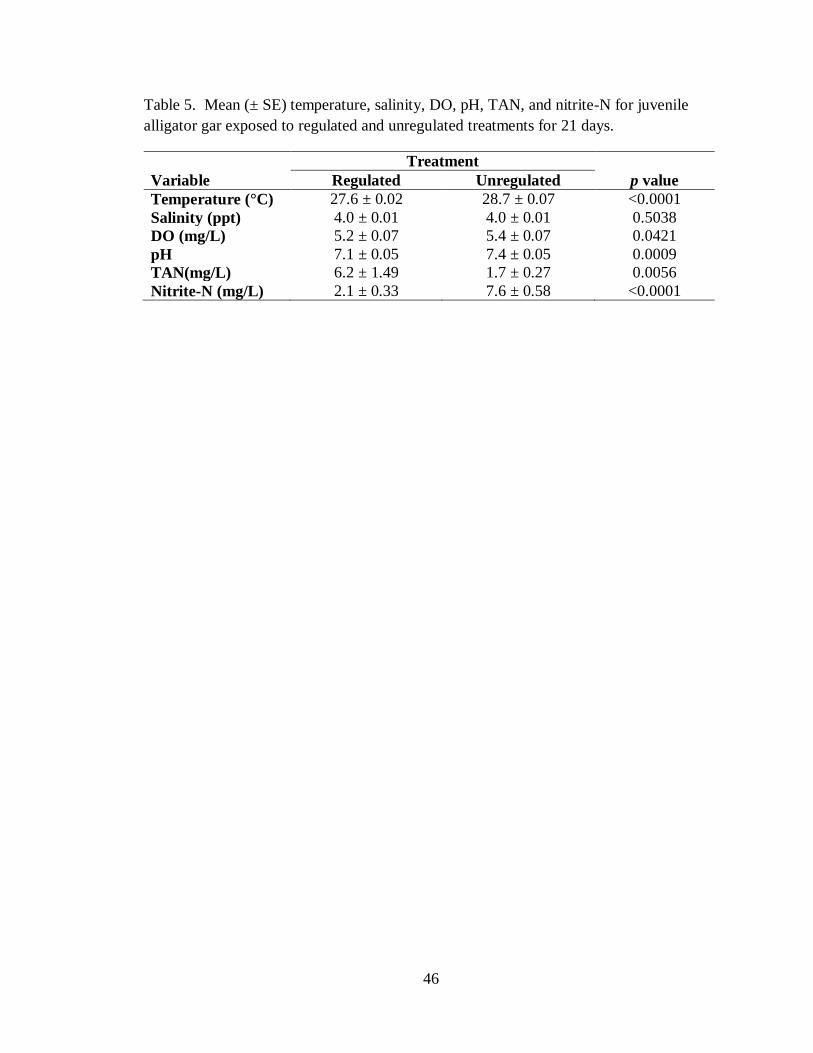
Table 5. Mean (± SE) temperature, salinity, DO, pH, TAN, and nitrite for juvenile
alligator gar exposed to regulated and unregulated treatments for 21 days. 46
Table 6. Mean (± SE) temperature, salinity, DO, pH, TAN, and nitrite-N for juvenile
alligator gar fed 4% body weight split into 2 feedings or 3 feedings for 21
days. .......................................................................................................... 54
Table 7. Mean (± SE) temperature, salinity, DO, pH, TAN, and nitrite for juvenile
alligator gar fed different feed percentages split among three feedings daily
for 21 days. ............................................................................................... 64

ix
LIST OF SCIENTIFIC NAMES
Alligator gar Atractosteus spatula
Atlantic sturgeon Acipenser oxyrinchus
Bastard halibut Paralichthys olivaceus
Bighead carp Hypophthalmichthys nobilis
Bowfin Amia calva
Brook trout Salvelinus fontinalis
Brown trout Salmo trutta
Channel catfish Ictalarus punctatus
European sea bass Dicentrarchus labrax
Fat snook Centropomus parellelus
Gilthead sea bream Sparus aurata
Longnose gar Lepisosteus osseus
Nile tilapia Oreochromis niloticus
Northern snakehead Channa striatus
Orange-spotted grouper Epinephelus coioides
Paddlefish Polyodon spathula
Palmetto bass Morone saxatilis X M. chrysops
Rabbitfish Siganus rivulatus
Rainbow trout Onchorhynchus mykiss
Senegalensis sole Solea senegalensis
Silver perch Bidyanus bidyanus
Spotted gar Lepisosteus oculatus
Summer flounder Paralichthys dentatus
Sunshine bass Morone chrysops X M. saxatilis
Winter flounder Pseudopleuronectes arnericanus
x
LIST OF ABBREVIATIONS
Analysis of covariance ANCOVA
Analysis of variance ANOVA
Centimeters cm
Days after hatching DAH
Dissolved oxygen DO
Feed conversion rate FCR
Gonadotropin releasing hormone GnRH
Lutenizing hormone releasing hormone LHRHa
Killigram kg
Millimeters mm
Milligram mg
Parts per thousand ppt
Specific growth rate SGR
Total length TL
Total ammonia-nitrogen TAN

1
INTRODUCTION
Natural History
Alligator gar Atractosteus spatula are the largest species of lepisosteids, which are
comprised of seven extant species belonging to two genera; Atractosteus and Lepisosteus.
Atractosteus species differ in physical appearance from Lepisosteus species by having a
double row of teeth in their upper jaw and large, ornate gill rakers (Suttkus 1963). All
lepisosteids have armor-like ganoid scales, a characteristic they share with the family
Polypteridae. Lepisosteidae belongs to the infraclass Holostei, which they share with the
bowfin Amia calva in the family Amiidae. Holosteans possess a highly vascularized,
physostomous swim bladder that allows them to derive oxygen from aerial respiration
and survive in waters with low dissolved oxygen (DO; Landolt and Hill 1975).
Alligator gar usually spawn between April and June (Suttkus 1963). The
spawning habitat of wild alligator gar is poorly documented but thought to occur
primarily in seasonally inundated river floodplains (Simon and Wallus 1989). The
spotted gar Lepisosteus oculatus and longnose gar L. osseus have been observed
spawning in littoral zones among submerged vegetation (Echelle and Riggs 1972).
Spawning behavior of alligator gar is similar to that of other lepisosteids and involves
courtship with several males pursuing a female. Once courtship has been completed a
single male and female broadcast eggs and sperm simultaneously with a final rush when
genital regions are thrust together (personal observation).
Gar have large eggs (L. oculatus 2.5 ± 0.3 mm, A. spatula 2.0 ± 0.7 mm)
comparable to that of bowfin Amia calva (2.0 ± 0.3 mm), paddlefish Polyodon spathula

2
(2.1-3.1 mm), and sturgeon Acipenser spp. (2.0-4.7 mm; Reed et al. 1992; Ferrara 2001;
Davis 2006; Chapman 2007; Smith 2008). Lepisosteid eggs are adhesive (Simon and
Wallus 1989) and are toxic to mammals, reptiles, and crustaceans (Brooks 1856;
Fuhrman 1969; Goodger and Burns 1980; Burns 1981; Broussard 2009). Newly hatched
alligator gar are approximately 7 mm long (total length; TL), have a terminal suctorial
disk on the snout, and a visible yolk-sac (Simon and Wallus 1989; Mendoza et al. 2002a,
Mendoza et al. 2002b). Larval alligator gar use the suctorial disk to adhere to vegetation
or other substrate during their lecithotrophic stage, which lasts until they are
approximately 13.5 mm TL (Mendoza et al. 2002b). Larval alligator gar lose the
suctorial disk and begin exogenous feeding between 12.5 and 22.5 mm TL (Simon and
Wallus 1989) during the transitional lecitho-exotrophic feeding stage where they
simultaneously obtain nourishment from yolk reserves and active predation (Mendoza et
al. 2002b). Complete exogenous feeding occurs at 22 mm TL based on experiments
using fed and unfed alligator gar larvae (Mendoza et al. 2002b). Simon and Wallus
(1989) noted the development of teeth in juvenile alligator gar between 32.5 and 65.0 mm
TL. Larval alligator gar have the fastest growth rate of all lepisosteids, with rates of 1.5
mm/day until 10 days after hatching (DAH) and 5.6 mm/day after 10 DAH when reared
at 28 °C (Mendoza et al. 2002b). Mendoza et al. (2002a) produced 300 mm alligator gar
in 4 months fed only artificial diets.
All gar are carnivorous, but their diet varies with age, location, season, and prey
availability (Goodyear 1967; Seidensticker 1987). Larval gar are opportunistic feeders
with an increasing tendency towards piscivory with increasing body size (Echelle and
Riggs 1972). Prey size is often determined by snout size, with adult snout proportions

3
reached when juvenile alligator gar are between 23 and 37 mm TL (Mendoza et al.
2002b). Cannibalism is common in cultured alligator gar because of a lack of appropriate
sized feed and artificial rearing densities (Aguilera et al. 2002; Mendoza et al. 2002a;
Mendoza et al. 2002b). Cannibalistic alligator gar quickly outgrow their culture cohorts
and identified because of their larger sizes and faster growth rates (Aguilera et al. 2002;
Mendoza et al. 2002a; Mendoza et al. 2002b). Stomach analyses of adult alligator gar
usually contain greater quantities of benthic species than other lepisosteids (Goodyear
1967; Seidensticker 1987). Suttkus (1963) suggests that alligator gar scavenge more than
other lepisosteids, which was supported by subsequent research (Goodyear 1967;
Seidensticker 1987).
Lepisosteids are restricted to the Gulf of Mexico and Atlantic drainages of North
and Central America. The native range of alligator gar is the Gulf of Mexico coast from
Florida to central Mexico and as far north as southern Illinois (Weed 1923; Mendoza et
al. 2002a). Alligator gar inhabit slow moving, large bodies of water (Goodyear 1966)
and typical freshwater habitats include bayous, swamps, canals, reservoirs, rivers and
oxbow lakes (Goodyear 1966, Mendoza et al. 2002a). Along the Gulf of Mexico coast,
alligator gar inhabit saline bays and estuaries. Alligator gar have been found at salinities
of 31ppt and may have the widest salinity tolerance among lepisosteids (Goodyear 1966;
Suchy 2009).
Aquaculture
During the last century, habitat loss and fishing pressure have contributed to the
decline of alligator gar populations throughout the species’ historical range (Ferrara

4
2001; Aguilera et al. 2002; Mendoza et al. 2002a). Aquaculture can be a useful option to
both reestablish natural populations and to commercially produce food fish, and can be a
viable short-term method to restore natural populations of alligator gar (Aguilera et al.
2002; Mendoza et al. 2002a; Kelly and Kohler 2006). The establishment of efficient
aquaculture practices that can produce market-size alligator gar may reduce fishing
pressure on wild populations.
Alligator gar have several traits that are advantageous for aquaculture. Brood
stock are easily maintained, are highly fecund, can be spawned in captivity and can
tolerate poor water quality (Aguilera et al. 2002; Mendoza et al. 2002a, Mendoza et al.
2002b). Juvenile alligator gar can also tolerate poor water quality and can be reared
completely on artificial feed (Mendoza et al. 2002a; Boudreaux et al. 2007a, 2007b).
However, juvenile alligator gar larvae are highly cannibalistic and most studies end with
release of individuals at 15 DAH to minimize cannibalism in captivity (Mendoza et al.
2002a). In order to develop successful culture of alligator gar, methods are needed to
maximize larval and juvenile growth rates while minimizing cannibalism.
Induced Spawning
Development of any finfish aquaculture requires the ability to produce and rear
larvae. Artificially spawning brood stock allows for controlled production of fertilized
eggs. Spawning can be induced in spotted gar during their spawning season by
intramuscular injections of the gonadotropin releasing hormone (GnRH; Boudreaux et al.
2007a). GnRH injections allow for coordination of spawning of many individuals by
advancing synchronous maturation of gonads. To ensure good water quality when

5
rearing fish at high densities, a rapid turnover of culture tank water is often necessary.
Larval alligator gar are sedentary and techniques used to rear larvae should maximize
water quality with minimal water current.
Larval Feed
Newly hatched Artemia spp. nauplii (Artemia hereafter) are a common feed for
many fish larvae (Wedemeyer 2001). Live feed is costly and requires intensive labor to
produce and some fish can quickly outgrow the size of Artemia (Mendoza et al. 2008).
Not all larvae require live feed to begin exogenous feeding. For example, larval alligator
gar can be reared completely on artificial feed without a reduced survival rate compared
to larvae fed only Artemia (Mendoza et al. 2002; Mendoza et al. 2008). Additionally, at
20 DAH larval alligator gar fed only Artemia were smaller than larval alligator gar fed
exclusively floating pellets (Mendoza et al. 2008).
Quantification of optimal growing conditions is important for any new
aquaculture candidate. Larval mortality can influence final production and is usually
high during the transition from endogenous to exogenous feeding. Different larval
feeding strategies have been developed to wean larvae from live feed, and results have
depended on digestive tract development, feeding behavior, and mouth size (Dabrowski
1984). Atlantic sturgeon Acipenser oxyrinchus have a functional stomach and a well
developed digestive tract at the beginning of exogenous feeding (Mohler et al. 2000).
Atlantic sturgeon fed Artemia until minimum conversion size can easily be converted to
artificial feed without weaning (Mohler et al. 2000). At 5 DAH (approximately 18 mm
TL) larval alligator gar begin exogenous feeding and are capable of digesting artificial

6
feed (Mendoza et al. 2002a). However, supplementing an artificial diet with live feed
may enhance nutritional condition, and pre-condition larvae to accepting artificial feed
(Rosenlund et al. 1997).
Rearing Density
Optimum rearing density is important in aquaculture as both understocking and
overstocking result in inefficient production (Leatherland and Cho 1985). Determination
of optimum rearing density can optimize space use, feed consumption, growth, and
survival (Leatherland and Cho 1985). Increasing rearing density may result in no effect
(Rowland et al. 2004; Corrêa and Cerqueira 2007; Saoud et al. 2008) or a decrease in
growth rate (Leatherland and Cho 1985; Siddiqui et al. 1989; Hengsawat et al. 1997;
Rahman et al. 2006). Vijayan and Leatherland (1988) found that an increase in stocking
density of juvenile brook trout leads to a decrease in growth, feed consumption, and feed
efficiency. Correa and Cerqueira (2007) found that cannibalism was positively related to
rearing density for juvenile fat snook Centropomus parrellelus. Water quality often
deteriorates with increased rearing density because of increases in nitrogen from excreted
wastes, which decrease DO levels. To increase culture efficiency of alligator gar
production methods should optimize rearing density to minimize cannibalism and feed
conversion rates, and maximize growth rates while efficiently using available space.
Temperature
Temperature influences fish growth rates, and determination of the optimum
temperature for growth is important for efficient aquaculture practices. However,
maintaining constant temperatures that are optimal for growth in a greenhouse or

7
outdoors can be costly and impractical. The effects of fluctuating temperature on growth
rates vary among species. Brown trout Salmo trutta exposed to constant temperatures
had increased growth (Flodmark et al. 2004) compared to trout exposed to fluctuating
temperatures. However, Spigarelli et al. (1982) found that brown trout had decreased
growth when reared at constant temperatures compared to fluctuating temperatures. Both
brown trout and palmetto bass Morone saxatilis X M. chrysops had no differences in
growth when reared at constant temperatures compared to fluctuating temperatures
(Woiwode and Adelman 1991; Jobling 1997). To increase culture efficiency of alligator
gar production methods should rear fish at temperatures that do not effect growth or
survival.
Optimal Feeding Regime
The optimal amount of feed used in efficient aquaculture practices is determined
by maximizing fish growth rate, reducing feed conversion rates, minimizing costs, and
maintaining water quality. Overfeeding can lead to poor water quality and wasted feed;
underfeeding can result in reduced growth rates. Amount of daily feed is either based
upon a percentage of body weight or feeding to satiation (Kelly and Kohler 2006). Feed
conversion ratio (FCR) is defined as the ratio of amount of feed given to the amount of
weight gained, and is used to determine the efficiency of feeding practices.
Fish fed to satiation may experience higher growth rates as compared to fish fed a
lesser amount, but feeding to satiation may also lead to a higher FCR (Figure 1; Barrows
and Hardy 2001; Silverstein 2006). The minimal FCR occurs when feed is assimilated
into body mass most efficiently. Fish fed at their minimal FCR use feed more efficiently,

8
resulting in improved water quality and cost savings; however at the lowest FCR, growth
rates may not be the fastest (Figure 1; Barrows and Hardy 2001). FCR levels will
increase from the minimal FCR with increasing and decreasing feed rations. Decreased
feed levels allow less feed for body mass assimilation because energy for basic
maintenance takes priority and increased feed levels waste feed because of inefficiency in
digestion (Figure 1; Barrows and Hardy 2001). Specific growth rate (SGR) is an
aquaculture standard for measuring weight gained daily over a specific time. Maximal
SGR and minimal FCR do not occur at a single feed rate, but compromises can be made
to maximize SGR while still minimizing FCR by determining the greatest difference
between curves (Figure 1). In addition to the total amount of feed provided per day, the
number of feedings per day may affect growth rates. Bolivar et al. (2006) found that
reduced feeding frequency improves feed conversion rates in Nile tilapia Oreochromis
niloticus. Minimal feeding frequency can reduce costs associated with labor. To
increase culture efficiency for alligator gar production methods should maximize growth
rates and minimize feed conversion rates while maintaining water quality.
Water Quality
The water quality of aquaculture systems can directly affect the growth and
survival of fish being reared. Total ammonia-nitrogen (TAN) levels can build up in
aquaculture systems from excreted wastes and decomposition of uneaten food. High
levels of TAN cause toxicity at the cellular level and can reduce growth and decrease
survival (Tomasso 1994). Based on results obtained from several species, TAN will not
inhibit growth if maintained below 9% of each species’ 96hr median lethal concentration
of TAN (Tomasso 1994). Safe TAN levels for alligator gar aquaculture should remain

9
Figure 1. Relationship between feed level, fish growth rate (SGR; solid line), and feed
conversion ratios (FCR; dashed line). Double pointed arrow represents feeding level
where a minimal FCR and maximal SGR are optimized. Adapted and modified from
Barrows and Hardy 2001.
0
1
2
3
4
5
6
0
0.1
0.2
0.3
0.4
0.5
0.6
0.7
0 2 4 6 8 10 12
FC
R
SG
R
Feed Amount (g)
Maintenance
Feeding
Level
Minimal
FCR
Level
Satiated
Feeding
Level

10
below 12.15 mg/L (Boudreaux et al. 2007a). Through bacterial nitrification, ammonia is
oxidized into nitrite, which can be further oxidized into nitrate. Nitrite is toxic to fish and
actively enters through the chloride uptake mechanism of the gills (Tomasso 1994;
Boudreaux et al. 2007b). Once in the blood, nitrite oxidizes hemoglobin to
methemoglobin, reducing the ability of the blood to bind and carry oxygen (Tomasso
1994; Wedemeyer 2001). Nitrate, however, is not toxic to fish at levels found in most
aquaculture systems; however, in high density recirculating aquaculture systems, the rate
of ammonia nitrification can exceed the rate of nitrite nitrification (Wedemeyer 2001).
The pH of water can adversely affect the physiology of fish, with a pH range of 6.5-9.0
preferred by most aquacultured fish (Wedemeyer 2001). Below 6.0, nitrite becomes
nitrous acid and increasing pH beyond 7.0 increases the amount of un-ionized ammonia.
Both nitrous acid and un-ionized ammonia freely diffuse across the gill membrane
(Wedemeyer 2001) and can cause physiological problems (Tomasso 1994). While DO
levels can limit production of most teleost fish, DO levels are less problematic for gar
which are facultative air breathers. Low DO can reduce the number of nitrifying bacteria
and hinder the nitrification of nitrite to nitrate. To increase the culture efficiency of
alligator gar production methods should minimize ammonia and nitrite levels while
maintaining appropriate pH and DO levels.
The goal of this project was to determine the effect of regulated temperatures,
feeding regimes, and rearing density, on growth, survival, and cannibalism rates of larval
and juvenile alligator gar reared in recirculating systems and fed commercially available
artificial diets so that optimal culture conditions could be determined. The objectives
included the following:

11
1. Compare growth, survival and cannibalism rates of larval alligator gar fed
artificial feed or artificial feed supplemented with Artemia;
2. Compare growth, survival, and cannibalism rates for 15 DAH juvenile alligator
gar fed 4 or 8 % body weight per day and reared at 2.5, 5, 7.5, or 10 fish/L;
3. Compare growth and survival rates for 52 DAH juvenile alligator gar reared at
regulated or non-regulated temperatures;
4. Compare growth and survival rates for 52 DAH juvenile alligator gar fed a total
of 4 % body weight per day divided into either 2 feedings/day or 3 feedings/day;
5. Compare growth and survival rates of juvenile alligator gar fed 1, 2, 4, 6, 8, 10 or
12% body weight of feed per day divided into 3 feedings/day;
6. Compare the water quality from the different treatment regimes.

12
METHODS
Experimental Systems
All experiments were conducted in 95 L circular, plastic tanks fitted with a center
overflow drain in a greenhouse equipped with a misting system, shade cloth, and fans to
reduce maximum daily temperatures. Each tank was either fitted with an individual
filtration system or grouped with three or seven other tanks on a common filter system.
Twelve individual systems were constructed with a single tank connected to a 20 L sump
and a 946 L/hr pump (Figure 2). Four tank systems initially had a common 265.5 L sump
(0.90 x 0.75 x 0.38 m) and a 3,085 L/hr pump (Figure 3) for the 2008 trials. Three eight-
tank systems were constructed from a four tank system and 4 individual systems. A
second sump with equal dimensions as the original sump was added to the eight tank
system in 2009 to increase system volume and filtration capabilities (Figure 4). Eight
tank systems were modular and could be reassembled into the starting systems with the
caveat that the four tank systems contained two sumps (Figure 4). Ultra-violet sterilizers
(4W; Lifegard Aquatics, Cerritos, California) were installed on the four and eight tank
systems prior to water returning to the tanks. All systems contained Bio-Spheres
(Clearwater Inc., Apopka, Florida) in the sumps to facilitate filtration and flow was
controlled by use of valves. Water salinity was maintained at 4 ppt and water was
maintained by adding water from one of two reservoirs containing carbon filtered-
chlorine free water at either 0 or 4 ppt.
Water Quality
Total ammonia-N (TAN; mg/L) was measured using the direct Nesslerization

13
Figure 2. Schematic of single tank system. Systems consisted of a 95 L plastic tank
containing 60 L of water. Tanks drained from a center mounted overflow into a 20 L
sump containing bio-spheres. Water was returned with a 946 L/h pump regulated with a
valve.

14
Figure 3. Schematic of the 4 tank system. Systems consisted of four 95 L plastic tanks
containing 60 L of water. Tanks drained from a center mounted overflow to a common
sump containing bioballs. A 3,085 L/h pump supplied water to the tanks and a 4W UV
sterilizer. Water flow was controlled to the tanks and UV sterilizer with individual
valves.

15
Figure 4. Schematic of the modified 4 and 8 tank systems. Systems consisted of 4 or 8-
95 L plastic tanks containing 60 L of water. Tanks drained from a center mounted
overflow to one of two common sumps containing bio-spheres. A 3,085 L/h pump
supplied water to the tanks and a 4W UV sterilizer. Water flow was controlled to the
tanks and UV sterilizer with individual valves.

16
method, nitrite-N (mg/L) was measured using the AZO dye method, and pH was
measured using a Hannah Instruments pH meter. Dissolved oxygen (DO; mg/L),
temperature (°C), and salinity (ppt) were measured with a Yellow Springs Instrument
model #85 handheld temperature-oxygen-conductivity-salinity meter (Yellow Springs,
Ohio). Temperature, DO, and salinity were measured and recorded each morning and
evening for each treatment. TAN, nitrite-N, and pH were measured daily for each
treatment. Temperature was also recorded hourly with continuous data loggers (Hobo;
Bourne, Massachusetts) placed in the sumps of the four-tank systems. Water was added
and exchanged as needed to maintain acceptable water quality (TAN 12.15 mg/L) for
alligator gar (Boudreaux et al. 2007a; Boudreaux et al. 2007b).
Spawning and Rearing
Adult alligator gar were collected with multifilament gill nets (bar mesh of 7.6,
12.7, or 15.2 cm) from Golden Ranch Plantation (N=32) and Bayou Chevreuil (N=3) in
southern Louisiana. Adult alligator gar were kept in an outdoor pond in pens either 48.4
m3 or 96.7 m
2. Each alligator gar was injected intramuscularly with 0.1mg/kg luteinizing
hormone releasing hormone (LHRHa) and immediately transferred to a 3.7 m diameter
tank (Table 1). Sex of brood stock alligator gar was differentiated based on size and
weight, with females being larger then males (Table 1). For the successful 12 May 2008
injection (Table 1) the tank was maintained at ambient temperature (26.4 ± 1.0 °C) and
exposed to the natural photoperiod (approximately 14L:10D). Bundles of raffia, artificial
material, were attached to 25.4 x 1219 mm PVC pipe and anchored to bricks and used as
spawning substrate. Approximate date of spawn (15 May 2008) was determined based
on presence of eggs. Spawning substrate with adhered eggs was transferred to four 454 L

17
Table 1. Injection dates with designated sexes, mean wt (kg ± SE), mean TL (mm ± SE)
and estimated # of larvae produced in 2008 and 2009.
Male Female #
Date N Wt TL N Wt TL Larvae
12 May 2008 7 9 ± 0.6 1247 ± 23.4 3 12 ± 0.7 1388 ± 40.9 20,000
6 June 2008 5 17 ± 1.8 1391 ± 67.6 6 10 ± 1.0 1154 ± 56.9 0
16 June 2008 5 10 ± 1.0 1154 ± 56.9 1 20 1310 0
10 April 2009 6 11 ± 0.4 1260 ± 30.5 4 14 ± 1.7 1278 ± 52.0 1,000
1 May 2009 5 11 ± 1.2 1276 ± 46.7 1 27 1746 10
11 May 2009* 5 11 ± 1.2 1276 ± 46.7 1 27 1746 0
27 May 2009 7 10 ± 1.3 1179 ± 50.0 4 22 ± 0.9 1479 ± 59.6 100
*Fish from the previous spawning group were re-injected.

18
recirculating fiberglass raceways. The substrate was removed from PVC pipes and
transferred to two 1.9 m diameter, aerated tanks. Temperature (23.0 ± 0.41 °C; mean ±
SE), pH (7.8 ± 0.41), DO (7.2 ± 0.97 mg/L), TAN (0.8 ± 0.78 mg/L), and nitrite-N (0.03
± 0.04 mg/L) were measured daily. Hatching occurred approximately five days after
LHRHa injection of adults, and larval alligator gar were transferred to a static, aerated
raceway (2.1 x 0.7 x 0.1 m) supplied with raffia for larval attachment. The raceway was
partitioned to increase the density of larval alligator gar, which allowed for more
effective feeding. The partition was moved daily to increase holding area during
development to accommodate growth (Figure 5). Larval alligator gar were fed to
satiation three times daily and feed size increased with fish size (Table 2). Dead
individuals were recorded and removed daily. Temperature (22.8 ± 0.73 °C), pH (7.7 ±
0.18), DO (5.6 ± 1.85 mg/L), TAN (4.4 ± 2.54 mg/L), nitrite-N (0.04 ± 0.03 mg/L), and
water exchanges (34.2 ± 8.5 L/day) were recorded daily.
Artemia Supplemented Larvae
To determine the effect of supplementing Artemia spp. at first feeding for larval
alligator gar, fertilized eggs were obtained from the 10 April 2009 injection of captive
alligator gar and were transferred to and incubated in three 8-tank recirculating systems
containing 30 L of water per tank (flow approximately 1 L/min; Figure 4). Water quality
was measured daily and maintained at predetermined acceptable levels; temperature =
23.7 ± 0.07 °C, pH = 8.1 ± 0.03, DO = 8.0 ± 0.13 mg/L, TAN = 0.5 ± 0.09 mg/L, and
nitrite-N = 0.3 ± 0.04 mg/L.
Eggs hatched eight days after injection (18 April 2009) and larval gar were reared

19
Figure 5. Schematic of larval rearing tank.

20
Table 2. Feeding schedule for larval alligator gar from the 15 May 2008 spawning reared
from hatching to 17 days after hatching (DAH).
Feed Size
(mm)
%Protein/
%Lipid
Duration
(DAH)
Artemia nauplii (newly hatched) 5-17
Zeigler AP100 floating larval fish feed 0.25-0.45 50/12 5-12
Silver Cup Trout fry artificial granulated crumble 0.59-0.84 48/14 9-17
Silver Cup Trout fry artificial granulated crumble 0.84-1.38 48/14 15-17

21
until 4 DAH without feed. Water quality was measured daily and maintained at:
temperature = 23.6 ± 0.06 °C, TAN = 0.5 ± 0.09 mg/L, nitrite-N = 0.3 ± 0.04 mg/L, DO =
8.0 ± 0.13 mg/L, and pH = 8.1 ± 0.03. At 5 DAH a subsample of 25 larvae was
sacrificed to determine initial wet weight (3.39 ± 0.08 x 10⁻²
g), and total length (TL; 15.4
± 0.79 mm).
Five DAH alligator gar were stocked at 100 fish per tank in a single 8-tank system
(Figure 4). Fish were fed to satiation three times daily with feed size increasing with fish
size (Table 3). Four tanks received only floating feed (F-F) and four tanks were fed
floating feed supplemented with Artemia (A-S; Table 3). Artemia (2.5 g cysts/L of
hatching water) were hatched under constant light and aeration and were fed to the larval
alligator gar 24 hr after being placed in the hatching jar. Larval mortalities were recorded
daily and total # of surviving individuals were recorded at the end of the trial. Mortalities
due to cannibalism were calculated as the difference between total (based on total
survival) and observed (number removed during experiment) mortality. Water quality
was maintained at predetermined acceptable levels (Boudreaux et al. 2007a, 2007b;
temperature = 26.6 ± 0.04 °C, TAN = 0.8 ± 0.15 mg/L, nitrite-N = 0.6 ± 0.06 mg/L, DO
= 6.8 ± 0.25 mg/L, pH = 7.8 ± 0.06, and salinity = 4.0 ± 0.17 ppt).
For the A-S treatment, larval alligator gar received Artemia and floating feed from
5 DAH to 12 DAH, then only floating feed to 20 DAH. For the F-F treatment, larval
alligator gar received only floating feed from 5 DAH to 20 DAH. Subsamples of five
individuals per tank were sacrificed at 12 DAH (end of Artemia supplement) and 20
DAH (end of experiment) to measure weight (g) and TL (mm). Analysis of variance
(ANOVA; α = 0.05) was used to compare condition factor, SGR, wet weight, TL,

22
Table 3. Feeding schedule for larval alligator gar from the 10 April 2009 injection reared
from hatching to 20 days after hatching (DAH).
Feed Size
(mm)
%Protein/
%Lipid
Duration
(DAH)
Artemia nauplii (newly hatched)* 5-12
Ziegler AP100 floating larval fish feed 0.25-0.45 50/12 5-12
Silver Cup Trout fry artificial starter 0.44-0.59 48/14 9-15
Silver Cup Trout fry artificial granulated crumble 0.59-0.84 48/14 12-20
*Only for the Artemia supplemented treatment.

23
survival and percent cannibalism between treatments.
Stocking Density and Feeding Amount
To determine the effect of stocking density and feed amount on growth, a 16 day
4x2 factorial trial was conducted with 15 DAH alligator gar. Alligator gar were obtained
from the Private John Allen National Fish Hatchery in Tupelo, Mississippi. Fish were
stocked at densities of 2.5, 5, 7.5, or 10 fish per liter and fed a 1 mm granulated crumble
(48% protein, 14% lipid; Silver Cup, Murray, Utah) at either 4 or 8% body weight daily
divided among three feedings. Three eight-tank systems were used to allow for
replication of all treatments (Figure 4). Initial wet weights (0.0901 ± 0.0047 g) and
lengths (26.4 ± 0.60 mm) were measured from a subsample of individuals (N = 25). Feed
amount was adjusted based on subsample wet weights (g) obtained every other day. At
the conclusion of the trial individual wet weights (g) and lengths (mm) were measured for
all individuals. Dead fish were counted, recorded and removed daily. ANOVA was used
to compare condition factor, SGR, wet weight, TL, and survival among treatments.
Temperature Regime
To compare the effects of regulated and unregulated temperature on juvenile
alligator gar growth, a 21 day trial was conducted in the single sump four-tank systems
(Figure 3). Juvenile alligator gar were obtained from the 12 May 2008 spawning and
stocked at 0.5 fish / L per tank (Table 1). Initial wet weight (8.8 ± 2.4 g) and total length
(127.5 ± 10.2 mm) were measured for all individuals. One system was exposed to
unregulated temperatures (28.7 ± 1.5 °C) inside the greenhouse. A heater and chiller
were used to regulate the other system and maintain temperatures at 27.5 ± 0.5 °C. The

24
fixed temperature was based on the average temperature for 30 days prior to the start of
the experiment. Alligator gar in both systems were fed a 2.4 mm extruded floating pellet
(#4 Aquamax; 45% protein, 16% lipid, Purina Mills, Gray Summit, Missouri) at 4% body
weight daily split evenly among three feedings. To adjust feed amounts, wet weights (g)
were measured and recorded every other day for a subsample of randomly selected
individuals (N=10) from each tank. Upon conclusion of the trial wet weight (g) and TL
(mm) were measured for all individuals. Dead fish were counted, recorded and removed
daily. ANOVA was used to compare condition factor, SGR, FCR, wet weight, TL,
survival and water quality between treatments.
Feeding Frequency
To determine the effect of feeding frequency on juvenile alligator gar growth, a
21 day trial was conducted in 2-4 tank systems (Figure 3). Juvenile alligator gar were
obtained from the 12 May 2008 spawning and stocked at 0.5 fish / L (Table 1). Initial
wet weight (9.1 ± 2.4 g) and total length (128.5 ± 11.0 mm) were measured for all
individuals. One system was fed a 2.4 mm extruded floating pellet (#4 Aquamax, 45%
protein; 16% lipid) at 4% body weight daily split between two feedings. The other system
was fed extruded pellet #4 at 4% body mass daily split among three feedings. To adjust
feed amounts, wet weights (g) were measured every other day for a subsample of
randomly selected individuals (N=10) from each tank. Upon conclusion of the trial wet
weights (g) and total lengths (mm) were determined for all individuals. Dead fish were
counted, recorded and removed daily. ANOVA was used to compare condition factor,
SGR, FCR, wet weight, TL, and survival between treatments.

25
Feed Ration
Two 21 day trials were conducted to determine the effect of feed amount on
growth of juvenile alligator gar. For the first trial, juvenile alligator gar were obtained
from the 12 May 2008 spawning and stocked at 0.5 fish / L in single tank systems (Table
1; Figure 2). Initial wet weight (5.5 ± 1.3 g) and total length (111.4 ± 9.9 mm) were
measured for all individuals. Fish were fed an extruded floating pellet (#4 Aquamax,
45% protein; 16% lipid) at rates of 1, 2, 4, or 8% body weight daily split among 3
feedings. Twelve individual tanks were used to provide three replications per feed rate.
To adjust feed amounts, wet weights (g) were measured and recorded every other day for
a subsample of randomly selected individuals (N=10) from each tank. Upon conclusion
of the trial wet weights (g) and total lengths (mm) were determined for all individuals.
Dead fish were counted, recorded and removed daily. ANOVA was used to compare
condition factor, SGR, FCR, wet weight, TL, survival, and water quality among
treatments.
For the second 21 day growth trial alligator gar were obtained from the Private
John Allen National Fish Hatchery. Fish were stocked in the dual sump four tank
systems at 0.5 fish/L (Figure 4). Initial wet weight (5.32 ± 0.03 g) and total length (103.6
± 0.29 mm) were measured for all individuals. Initial dry weights were obtained from a
subsample of 25 fish. Fish were fed an extruded floating pellet (#4 Aquamax, 45%
protein; 16% lipid) at rates of 6, 8, 10, or 12% body mass daily split among three
feedings. Three, four tank systems were used to provide three replications per feed rate.
To adjust feed amounts, wet weights (g) were measured and recorded every other day for
a subsample of randomly selected individuals (N=10) from each tank. Upon conclusion

26
of the trial wet weights (g) and total lengths (mm) were determined for all individuals.
Final dry weights were obtained from a subsample (N=5) from each tank. Dead fish were
counted, recorded and removed daily. ANOVA was used to compare condition factor,
SGR, FCR, wet weight, TL, survival, and water quality among treatments.
Statistical Analyses
Dry weights were obtained by drying fish for 7 d at approximately 65 °C and were
recorded to the nearest 0.0001 g. Total length was measured from the tip of the snout to
the end of the caudal fin. Condition factor was determined as:
100,000*[wet weight / (TL)3]
SGR was determined as:
[Ln(final wet weight ) - Ln(initial wet weight) / (final day – initial)*100].
FCR was determined as:
[dry weight of feed/dry weight of fish].
ANOVA was used followed by Tukeys post hoc analysis to compare condition
factor, FCR, SGR, TL, wet weight, survival, temperature, DO, nitrite, ammonia, pH, and
salinity among treatments. Analysis of covariance was used to determine the relationship
between density and feed amount in the density and feed amount trials. ANOVA was
used to determine the relationship between feed amounts and wet weight, TL, condition
factor, and survival. ANOVA and regression analysis were used for FCR and SGR in the
feed amount trials to determine the relationship between FCR and SGR.

27
RESULTS
Artemia Supplemented Larvae
Larval alligator gar for both the Artemia supplemented (A-S) and the floating feed
only treatments (F-F) gained weight during the experiment (Figure 6). Alligator gar from
the A-S treatment were heavier (0.030 ± 0.0016 g; p = 0.0001; Figure 6a) and longer
(35.2 ± 0.59 mm; p = 0.0001; Figure 6b) by 12 DAH than were fish from the F-F
treatment (0.012 ± 0.0010 g; 26.4 ± 0.47 mm). Although weights and lengths were
different, condition factor was not different at 12 DAH (0.67 ± 0.007; p = 0.7598; Figure
7) or 20 DAH (0.80 ± 0.006; p = 0.1797; Figure 7). SGR was higher at both 12 (0.36 ±
0.024; p = 0.0019) and 20 DAH (1.21 ± 0.049; p = 0.0297) for alligator gar in the A-S
than for alligator gar in the F-F treatment (0.12 ± 0.014; 0.58 ± 0.131; Figure 8).
Although SGR increased between 12 and 20 DAH for the F-F treatment, the A-S
treatment continued to outgrow the F-F treatment by 20 DAH (Figures 6 and 8).
Total mortality was lower (p = 0.0066) in the A-S treatment (29%) than in the F-F
treatment (57%; Figure 9). Cannibalism was the primary cause of mortality for both
treatments, and was higher (p = 0.0091) in the F-F treatment (44%) than the A-S
treatment (19%; Figure 9). However, there was no difference (p = 0.0863) between
treatments for mortalities not attributed to cannibalism (Figure 9).
Stocking Density and Feed Amount
There was no interaction between density (2.5, 5, 7.5, 10 fish/L) and feed ration
(4 or 8%) for this experiment, allowing for separate analyses for densities and feed

28
Figure 6. Mean (± SE) wet weight (a) and TL (b) at 12 DAH (end of Artemia
supplement) and 20 DAH (end of experiment) for larval alligator gar fed a commercially
available floating feed with (solid line) or without (dashed line) a live Artemia nauplii
supplement for the first 7 days of exogenous feeding.
0
0.04
0.08
0.12
0.16
4 6 8 10 12 14 16 18 20
Wet
Wei
gh
t (g
)
Age (DAH)
(a)
0
10
20
30
40
50
60
4 6 8 10 12 14 16 18 20
TL
(m
m)
Age (DAH)
(b)

29
Figure 7. Mean (± SE) condition factor at 12 and 20 DAH for larval alligator gar fed a
commercially available floating feed with (empty boxes) or without (solid boxes) a live
Artemia nauplii supplement for the first 7 days of exogenous feeding.
0
0.2
0.4
0.6
0.8
1
12 DAH 20 DAH
Con
dit
ion
Fact
or
Age

30
Figure 8. Mean (± SE) SGR at 12 and 20 DAH for larval alligator gar fed a
commercially available floating feed with (empty boxes) or without (solid boxes) a live
Artemia nauplii supplement for the first 7 days of exogenous feeding. Letters above
samples represent Tukey groupings based on ANOVA results and denote differences
among samples.
0
0.2
0.4
0.6
0.8
1
1.2
1.4
12 DAH 20 DAH
SG
R
Age
A
A
B
B

31
Figure 9. Mean (± SE) percent total mortalities (open boxes) and observed mortalities
(solid boxes) at 20 DAH for larval alligator gar fed a commercially available floating
feed with (A-S) or without (F-F) a live Artemia nauplii supplement for the first 7 days of
exogenous feeding.
0
10
20
30
40
50
60
70
F-F A-S
Per
cen
t M
ort
ali
ty
Treatment

32
percentages for comparisons. Final weights (p = 0.6256) and TL (p = 0.6975) were not
different among the density treatments (Figure 10). Final weights (p = 0.1367) and TL (p
= 0.6878) were not different between feed rations (Figure 10). Fish stocked at 10 fish/L
(0.45 ± 0.0 09) had higher condition factor than fish stocked at 5 fish/L (0.42 ± 0.005; p =
0.0067; Figure 11a). Condition factor was not different between feed rations (p = 0.4299;
Figure 11b). SGR was not different among density treatments (p = 0.6089; Figure 12a)
or between feed percentage treatments (p = 0.8804; Figure 12b). Total survival was not
different among density treatments (p = 0.1829; Figure 13a). Fish fed 8% body mass
(24%) had a higher survival rate than fish fed 4% body mass (17%; p = 0.0491; Figure
13b). Mortality not attributed to cannibalism was lowest for fish at densities of 5 and
7.5% fish/L (p = 0.0132; Figure 13a). However, mortality was not different among feed
rations (p = 0.8172; Figure 13b). Cannibalism was not different among density
treatments (p = 0.0797; Figure 13a) and between feed rations (p = 0.0555; Figure 13b).
Temperature (p = 0.7070), DO (p = 0.4170), and salinity (p = 0.4980) did not
differ among experimental systems (Table 4). TAN (p = 0.0003), pH (p= 0.0058), and
nitrite-N (p = 0.0001) were higher in system three than in the other two systems (Table
4).
Temperature Regime
Alligator gar in both the regulated and unregulated temperature treatments
increased in size during the experiment (Figure 14) and did not differ in weight (p =
0.4090; Figure 14), TL (p = 0.4111; Figure 15) or final condition factor (p = 0.6886;
Figure 16). FCR (p = 0.1790; Figure 17) and SGR (p = 0.0729; Figure 18) were not

33
Figure 10. Final mean (± SE) wet weight and TL of juvenile alligator initially stocked at
different densities (a,b) and fed either 4 to 8 percent body weight split among three daily
feedings (c,d) for 16 days.
0
1
2
3
2.5 5 7.5 10
Wet
Weig
ht
(g)
Density (fish / L)
(a)
0
1
2
3
4% 8%
Wet
Weig
ht
(g)
Feed Ration
(c)
0
15
30
45
60
75
90
2.5 5 7.5 10
TL
(m
m)
Density (fish / L)
(b)
0
15
30
45
60
75
90
4% 8%
TL
(m
m)
Feed Ration
(d)

34
Figure 11. Final mean (± SE) condition factor at of juvenile alligator initially stocked at
different densities (a) and fed either 4 or 8 percent body weight split among three daily
feedings (b) for 16 days. Letters above samples represent Tukey groupings based on
ANOVA results and denote differences between samples.
0
0.1
0.2
0.3
0.4
0.5
2.5 5 7.5 10
Co
nd
itio
n F
act
or
Density (fish/L)
AB BAB A(a)
0
0.1
0.2
0.3
0.4
0.5
4% 8%
Con
dit
ion
Fact
or
Feed Ration
(b)

35
Figure 12. Final mean (± SE) SGR of juvenile alligator initially stocked at different
densities (a) and fed either 4 or 8 percent body weight split among three daily feedings
(b) for 16 days.
0
0.5
1
1.5
2.5 5 7.5 10
SG
R
Density (fish/L)
(a)
0
0.5
1
1.5
4% 8%
SG
R
Feed Ration
(b)

36
Figure 13. Final mean (± SE) percent cannibalism (empty boxes) and natural mortality
(solid boxes) of juvenile alligator initially stocked at different densities (a) and fed either
4 or 8 percent body weight split among three daily feedings (b) for 16 days.
0
10
20
30
40
50
60
70
80
90
100
2.5 5 7.5 10
Per
cen
t M
ort
ali
ty (
%)
Density (fish/L)
(a)
0
10
20
30
40
50
60
70
80
90
100
4% 8%
Per
cen
t M
ort
ali
ty (
%)
Feed Amount
(b)

37
Table 4. Mean (±SE) temperature, salinity, DO, pH, TAN, and nitrite-N for each system
used in the juvenile alligator gar density and feed ration experiments. Different lower
case letters denote Tukey groupings.
System
Variable 1 2 3 p value
Temperature (°C) 26.7 ± 0.35 26.6 ± 0.32 26.3 ± 0.34 0.7070
Salinity (ppt) 4.1 ± 0.02 4.2 ± 0.02 4.1 ± 0.03 0.4980
DO (mg/L) 6.3 ± 0.21 6.5 ± 0.23 6.8 ± 0.25 0.4170
pH 7.7 ± 0.03b 7.8 ± 0.04
ab 7.9 ± 0.05
a 0.0058
TAN(mg/L) 0.7 ± 0.07b 0.7 ± 0.08
b 1.6 ± 0.26
a 0.0003
Nitrite-N (mg/L) 0.5 ± 0.08b 0.2 ± 0.03
b 1.6 ± 0.14
a <0.0001

38
Figure 14. Mean (± SE) wet weight for subsamples (N = 10) of juvenile alligator gar
exposed to regulated temperatures (solid line) and fluctuating temperatures (dashed line)
for 21 days.
0
10
20
30
40
0 2 4 6 8 10 12 14 16 18 20
Wet
Wei
gh
t (g
)
Day of Experiment

39
Figure 15. Final mean (± SE) TL of juvenile alligator gar exposed to regulated or
unregulated temperatures for 21 days.
0
50
100
150
200
Regulated Unregulated
TL
(m
m)
Treatment

40
Figure 16. Final mean (± SE) condition factor of juvenile alligator gar exposed to
regulated or unregulated temperatures for 21 days.
0
0.1
0.2
0.3
0.4
0.5
0.6
Regulated Unregulated
Con
dit
ion
Fact
or
Treatment

41
Figure 17. Final mean (± SE) FCR of juvenile alligator gar exposed to regulated or
unregulated temperatures for 21 days.
0.00
0.50
1.00
1.50
2.00
2.50
Regulated Unregulated
FC
R
Treatment

42
Figure 18. Final mean (± SE) SGR of juvenile alligator gar exposed to regulated or
unregulated temperatures for 21 days.
0
0.025
0.05
0.075
Regulated Unregulated
SG
R
Treatment

43
different between regulated and unregulated treatments. Survival was similar between
regulated and unregulated treatments with no mortalities associated with cannibalism (p =
0.2148, Figure 19).
Mean temperature was higher in the unregulated treatment than the regulated
treatment (p = 0.0001; Figure 20, Table 5). DO, pH, and nitrite-N were all higher in the
unregulated temperature treatment than the regulated treatment (Table 5). TAN was
higher in the regulated treatment then the unregulated treatment (Table 5.)
Feeding Frequency
Alligator gar in both treatments increased in size during the experiment (Figure
21). Final weights were similar between the two treatments (p = 0.0800; Figure 21).
Final TL was longer in the 2 feedings per day treatment (204.7 ± 1.97 mm) than the 3
feedings daily treatment (196.2 ± 2.05 mm; p = 0.0010; Figure 22), although the
difference was 8.5 mm. Final condition factor was similar between the two treatments (p
= 0.7457; Figure 23). FCR was higher in alligator gar exposed to 2 feedings daily (2.3 ±
0.04) then those exposed to 3 feedings daily (2.2 ± 0.02; p = 0.0110; Figure 24). SGR
was similar between the two treatments (p = 0.8394; Figure 25). Survival was not
different between the two treatments and there were no mortalities associated with
cannibalism (p = 0.2599; Figure 26).
Temperature and salinity were not different between treatments (Table 6). DO,
pH, and TAN were higher in the 2 feedings per day treatment than the 3 feedings per day
treatment (Table 6). Nitrite-N levels were higher in the 3 feedings per day treatment than
the 2 feedings per day treatment (Table 6).

44
Figure 19. Final mean (± SE) percent survival of juvenile alligator gar exposed to
regulated or unregulated temperatures for 21 days.
0
25
50
75
100
Regulated Unregulated
Per
cen
t S
urv
ival
(%)
Treatment

45
Figure 20. Hourly temperatures for regulated temperature (solid line) and unregulated
temperature (dashed line) treatments for the duration of the experiment.
25
27
29
31
33
0 1 2 3 4 5 6 7 8 9 10 11 12 13 14 15 16 17 18 19 20 21
Tem
pera
ture
(°C
)
Day of Experiment
46
Table 5. Mean (± SE) temperature, salinity, DO, pH, TAN, and nitrite-N for juvenile
alligator gar exposed to regulated and unregulated treatments for 21 days.
Treatment
Variable Regulated Unregulated p value
Temperature (°C) 27.6 ± 0.02 28.7 ± 0.07 <0.0001
Salinity (ppt) 4.0 ± 0.01 4.0 ± 0.01 0.5038
DO (mg/L) 5.2 ± 0.07 5.4 ± 0.07 0.0421
pH 7.1 ± 0.05 7.4 ± 0.05 0.0009
TAN(mg/L) 6.2 ± 1.49 1.7 ± 0.27 0.0056
Nitrite-N (mg/L) 2.1 ± 0.33 7.6 ± 0.58 <0.0001

47
Figure 21. Mean (± SE) wet weight for subsamples (N = 10) of juvenile alligator gar fed
4% body weight split between 2 feedings per day (dashed line) or among 3 feedings per
day (solid line) for 21 days.
0
15
30
45
0 2 4 6 8 10 12 14 16 18 20
Wet
Wei
gh
t (g
)
Day of Experiment

48
Figure 22. Final mean (± SE) TL of juvenile alligator gar fed 4% body weight split into 2
feedings per day or 3 feedings per day for 21 days. Letters above samples represent
Tukey groupings based on ANOVA results and denote differences between samples.
0
25
50
75
100
125
150
175
200
225
2 Feedings 3 Feedings
TL
(m
m)
Treatment
AB

49
Figure 23. Final mean (± SE) condition factor of juvenile alligator gar fed 4% body
weight split into 2 feedings per day or 3 feedings per day for 21 days.
0
0.1
0.2
0.3
0.4
0.5
0.6
2 Feedings 3 Feedings
Con
dit
ion
Fact
or
Treatment

50
Figure 24. Final mean (± SE) FCR of juvenile alligator gar fed 4% body weight split into
2 feedings per day or 3 feedings per day for 21 days. Letters above samples represent
Tukey groupings based on ANOVA results and denote differences between samples.
0.0
0.5
1.0
1.5
2.0
2.5
2 Feedings 3 Feedings
FC
R
Treatment
A
B

51
Figure 25. Final mean (± SE) SGR of juvenile alligator gar fed 4% body weight split into
2 feedings per day or 3 feedings per day for 21 days.
0
0.03
0.06
0.09
2 Feedings 3 Feedings
SG
R
Treatment

52
Figure 26. Final mean (± SE) percent survival of juvenile alligator gar fed 4% body
weight split into 2 feedings per day or 3 feedings per day for 21 days.
0
25
50
75
100
2 Feedings 3 Feedings
Per
cen
t S
urv
ival
(%)
Treatment

53
Feed Ration
Alligator gar in all treatments (1, 2, 4, 6, 8, 10, and 12% feed based on body
mass) increased in size during both the 2008 and 2009 feed ration experiments (Figure
27). Alligator gar weight was heavier in the 12% treatment (37.1 ± 1.69 g) compared to
1% (9.3 ± 0.45 g), 2% (15.4 ± 1.10 g), and 4% treatments (26.7 ± 1.08 g) but was not
different from the 6% (28.7 ± 0.89 g), 8% (32.4 ± 2.10 g), and 10% treatments (32.6 ±
1.94 g; p = 0.0001; Figure 28). Final TL was longer for alligator gar in the 4% (173.4 ±
1.38 mm), 6% (179.0 ± 0.63 mm), 8% (184.5 ± 4.42 mm), 10% (184.2 ± 3.90 mm), 12%
treatments (189.7 ± 2.61 mm) compared to the 1% (131.0 ± 2.49 mm) and 2% treatments
(149.0 ± 2.49 mm; p = 0.0001; Figure 29). Condition factor was higher for alligator gar
in the 4% (0.50 ± 0.018), 6% (0.50 ± 0.009), 8% (0.51 ± 0.020), 10% (0.50 ± 0.001), and
12% treatments (0.51 ± 0.011) compared to the 1% treatment (0.41 ± 0.01) but was not
different from the 2% treatment (0.46 ± 0.014; p = 0.0052; Figure 30). FCR was lowest
for alligator gar in the 4% treatment (2.6 ± 0.24) compared to the 1% (3.3 ± 0.33), 8%
(3.6 ± 0.10), 10% (4.9 ± 0.07), and 12% (5.5 ± 0.26) treatments but was not different
from the 2% (2.2 ± 0.44) and 6% treatments (3.3 ± 0.34; p = 0.0001; Figure 31). SGR
was higher for alligator gar in the 12% treatment (0.09 ± 0.003) compared to the 1%
(0.03 ± 0.003), 2% (0.05 ± 0.004), and 4% treatments (0.07 ± 0.002) but was not different
from the 6% (0.08 ± 0.0003), 8% (0.08 ± 0.002), or 10% treatments (0.09 ± 0.003; p =
0.0001; Figure 32). SGR [0.0256ln(feed) + 0.1493; R2 = 0.92673; Figure 33] and FCR
[392.84(feed)2 - 23.561(feed) + 2.9799; R
2 = 0.8040; Figure 33] were regressed on feed
rations. Lowest estimate for FCR was 3% feed and greatest difference between FCR and
SGR was at 7.4% feed. Survival (83%) was not effected by feed percentages

54
Table 6. Mean (± SE) temperature, salinity, DO, pH, TAN, and nitrite-N for juvenile
alligator gar fed 4% body weight split into 2 feedings or 3 feedings for 21 days.
Treatment
Variable 2 Feedings 3 Feedings p value
Temperature (°C) 28.1 ± 0.06 28.7 ± 0.07 <0.0001
Salinity (ppt) 4.0 ± 0.01 3.9 ± 0.01 <0.0001
DO (mg/L) 5.3 ± 0.08 5.4 ± 0.07 0.5026
pH 7.5 ± 0.04 7.4 ± 0.05 0.1211
TAN (mg/L) 2.9 ± 0.57 1.7 ± 0.27 0.0718
Nitrite-N (mg/L) 5.3 ± 0.66 7.6 ± 0.58 0.0139

55
Figure 27. Mean (± SE) wet weight for subsamples (N = 10) of juvenile alligator gar fed
different rations based on body weight split among three daily feedings for 21 days.
5
10
15
20
25
30
35
40
45
0 2 4 6 8 10 12 14 16 18 20
Wet
Wei
gh
t (g
)
Day of Experiment
1%
2%
4%
6%
8%
10%
12%
1%
12%

56
Figure 28. Final mean (± SE) wet weight of juvenile alligator gar fed different rations
based on body weight split among three daily feedings for 21 days. Letters above
samples represent Tukey groupings based on ANOVA results and denote differences
between samples.
0
5
10
15
20
25
30
35
40
45
1 2 4 6 8 10 12
Wet
Wei
gh
t (g
)
Feed Ration (% body weight)
C
C
BAB
AB AB
A

57
Figure 29. Final mean (± SE) TL of juvenile alligator gar fed different feed rations based
on body weight split among three daily feedings for 21 days. Letters above samples
represent Tukey groupings based on ANOVA results and denote differences between
samples.
0
50
100
150
200
1 2 4 6 8 10 12
TL
(m
m)
Feed Ration (% body weight)
B
B
A AA A A

58
Figure 30. Final mean (± SE) condition factor at the conclusion of the experiment for
juvenile alligator gar fed different feed rations based on body weight split among three
daily feedings for 21 days. Letters above samples represent Tukey groupings based on
ANOVA results and denote differences between samples.
0
0.1
0.2
0.3
0.4
0.5
0.6
1 2 4 6 8 10 12
Con
dit
ion
Fact
or
Feed Ration (% body weight)
B
AB
AA
AA
A

59
Figure 31. Final mean (± SE) FCR of juvenile alligator gar fed different feed rations
based on body weight split among three daily feedings for 21 days. Letters above
samples represent Tukey groupings based on ANOVA results and denote differences
between samples.
0
1
2
3
4
5
6
1 2 4 6 8 10 12
FC
R
Feed Ration (% body weight)
BC BCD
CD
D
B
A
A

60
Figure 32. Final mean (± SE) SGR of juvenile alligator gar fed different feed rations
based on body weight split among three daily feedings for 21 days. Letters above
samples represent Tukey groupings based on ANOVA results and denote differences
between samples.
0
0.02
0.04
0.06
0.08
0.1
1 2 4 6 8 10 12
SG
R
Feed Ration (% body weight)
D
C
BAB
ABAB
A

61
Figure 33. Regression curves of SGR and FCR for juvenile alligator gar fed 1, 2, 4, 6, 8,
10, or 12% body weight daily split among 3 feedings. Single point arrow indicates
minimum FCR (3% feed) and double arrow indicates greatest difference between SGR
and FCR (7.4% feed).
0
1
2
3
4
5
6
7
0
0.02
0.04
0.06
0.08
0.1
0.12
0 2 4 6 8 10 12 14
FC
R
SG
R
Feed Ration (% body weight)
FCR = 392.84(feed)2 - 23.561(feed) + 2.9799
R2 = 0.8040
SGR = 0.0256ln(feed) + 0.1493
R2 = 0.92673

62
during this experiment and there were no mortalities associated with cannibalism (p =
0.3141; Figure 34).
Temperature and TAN were not different between 2008 and 2009 (Table 7). DO,
salinity, pH, and nitrite-N were different between 2008 and 2009 (Table 7).

63
Figure 34. Final mean (± SE) percent survival of juvenile alligator gar fed different feed
rations split among three feedings daily for 21 days.
0
20
40
60
80
100
120
1 2 4 6 8 10 12
Per
cen
t S
urv
ival
Feed Ration (% body weight)

64
Table 7. Mean (± SE) temperature, salinity, DO, pH, TAN, and nitrite-N for juvenile
alligator gar fed different feed rations split among three daily feedings for 21 days.
Year
Variable 2008 2009 p value
Temperature (°C) 29.3 ± 0.32 29.2 ± 0.16 0.9291
Salinity (ppt) 4.0 ± 0.00 3.9 ± 0.06 <0.0001
DO (mg/L) 5.3 ± 0.05 3.1 ± 0.10 <0.0001
pH 7.6 ± 0.03 7.3 ± 0.02 <0.0001
TAN (mg/L) 3.6 ± 0.68 7.3 ± 1.20 0.0054
Nitrite-N (mg/L) 5.1 ± 0.46 0.5 ± 0.02 <0.0001

65
DISCUSSION
Artemia Supplemented Larvae
Five DAH larval alligator gar supplemented with Artemia had faster growth rates
than did larvae not supplemented with Artemia. Visual cues are important in the first
feeding of larval fish, followed by size, texture, and taste (Dabrowski 1984; Person-Le
Ruyet 1989). The presence of Artemia may elicit a stronger feeding response and
acceptance of artificial feed than only floating feed. Larval gar supplemented with
Artemia had higher growth rates after the Artemia supplement ceased than did fish not
supplemented with Artemia. Senegalensis sole Solea senegalensis fed Artemia and
artificial feed during first feeding had higher growth rates after weaning from live feed
than Senegalensis sole fed only Artemia prior to weaning (Cañavate and Fernãndez-Diaz
1991). Supplementing larval alligator gar with Artemia for the first seven days of
exogenous feeding increased growth rates.
Survival by 20 DAH averaged 71% for individuals supplemented with Artemia
compared to 43% for individuals not supplemented with Artemia (Figure 10). This
contrasts with results from Mendoza et al. (2008) which had survival rates of near 60%
for alligator gar larvae fed either artificial feed or Artemia, and Mendoza et al. (2002a)
which had survival rates near 95% for alligator gar larvae fed Artemia and survival rates
near 80% for alligator gar larvae fed only floating artificial feed. Senegalese sole had
higher survival after weaning when co-fed live feed (rotifers and Artemia) with pelleted
feed when compared to Senegalese sole fed only live feed (Cañavate and Fernãndez-Diaz
1999). Artemia supplement for the first seven days of exogenous feeding increased
survival rates in larval alligator gar.

66
Dead fish were counted and removed daily during the trials, which allowed for
precise determination of total number of individuals cannibalized. Cannibalism was the
main cause of mortalities within both treatments. Cannibalistic rates were not different
for larval summer flounder Paralichthys dentatus fed either Artemia or artificial feed
(Francis and Bengston 1999). However, cannibalism was higher for larval alligator gar
that were not supplemented with Artemia. Feed size was increased and overlapped
during the trial to accommodate for variation in size and increasing body size, which
allowed the larval gar to maximize energy gain while minimizing the chances of
cannibalism (Echelle and Riggs 1972; Mendoza et al. 2008). The gar exposed to Artemia
may have been stimulated to begin exogenous feeding earlier and were thus able to
consume larger feed sizes.
Stocking Density and Feed Amount
Stocking densities did not affect the growth of juvenile alligator gar. Growth
rates in other aquaculture species are unaffected by density; for example, juvenile winter
flounder Pseudopleuronectes arnericanus, bighead carp Hypophthalmichthys nobilis, fat
snook Centropomus parrellelus, silver perch Bidyanus bidyanus, and rabbitfish Siganus
rivulatus growth rates were unaffected when reared at different densities (Engle and
Brown 1999; Fairchild and Howell 2001; Rowland et al. 2004; Corrêa and Cerqueira
2007; Saoud et al. 2008). However, increasing stocking density inversely affects growth
rates in brook trout (Vijayan and Leatherland 1988) and rainbow trout Onchorhynchus
mykiss (Leatherland and Cho 1985). King et al. (2000) found no differences in growth of
summer flounder reared at 10, 20, and 30 fish/L but growth was lower for fish reared at

67
60 fish/L. Stocking densities in this experiment may have been too low to result in
differences in growth rates and overall survival.
Cannibalism was the main cause of mortality (77%). Juvenile alligator gar were
15 DAH at the start of this experiment, the stage in their development where Mendoza et
al. (2002a) noted an increase in cannibalism rates. The lack of a difference in growth
rates between the two feed percentages and high level of cannibalism suggest that any
deficiencies in feed may have been made up through cannibalism. This theory is further
supported by the feed percentage trial were there was no cannibalism and juvenile
alligator gar fed 8% body mass had higher SGR than juvenile alligator gar fed 4% body
mass.
Temperature Regime
Outdoor culture of alligator gar involves exposure to natural fluctuations in daily
temperatures. There were no differences in weight, TL, SGR, FCR, condition factor, and
survival between fish reared at a regulated temperature and fish reared at unregulated
temperatures. This result is similar to Woiwode and Adelman (1991) where palmetto
bass Morone saxatilis X M. chrysops exposed to a constant 21 °C or diel oscillations of ±
4, ± 6, or ± 8 °C resulted in no differences in SGR and FCR. Adaption to temperature
fluctuations would be advantageous for juvenile alligator gar, which may inhabit shallow
floodplains that can have rapid changes in daily temperatures. Adaptation to fluctuating
temperatures is also advantageous for aquaculture. Developing aquaculture with fish that
can tolerate fluctuating temperatures, such as alligator gar, would reduce expenses by
avoiding manipulation of temperatures through the use of heaters and chillers.

68
Feed Frequency
Alligator gar fed twice daily had a final TL longer than alligator gar fed 3 times a
day; however, final weight and SGR were not different between treatments. Feeding
frequency does not affect channel catfish Ictalarus punctatus weight gain and SGR
(Jarboe and Grant 1996). FCR was lower for alligator gar fed three times daily when
compared to alligator gar fed twice daily. The relationship between FCR and feeding
frequency varies among aquaculture species. In channel catfish fed once daily 3% body
weight or 3 times daily 1% body weight the FCR was unaffected (Jarboe and Grant
1996). With channel catfish and sunshine bass M. chrysops X M. saxatilis fed to satiation,
FCR increased with increased feeding frequency (Webster et al. 2001; Peterson and
Small 2006). However, feeding to satiation can result in a FCR higher then if fed a
lower amount (Barrows and Hardy 2001; Mihelakakis et al. 2002; Luo et al. 2006).
Rainbow trout fed to satiation have a higher FCR then fish fed less feed (Silverstein
2006). As with channel catfish and sunshine bass fed at different frequencies (Jarboe and
Grant 1996; Webster et al. 2001), feeding frequency did not affect alligator gar FCR.
Feed Ration
Different feed rations produced differences in weight, TL, condition factor, FCR,
and SGR. Feed ration is an important factor in fish culture and governs the amount of
growth. Feed ration and growth rate are positively correlated until plateauing at a
satiation feeding level (Métailler et al. 1980; Clark et al. 1990; Mihelakakus et al. 2002;
Luo et al. 2006; Kim et al. 2007). Growth rate increased with increasing feed amounts
with maximum growth attained at 6% body weight, which was not different from 8, 10,

69
or 12% body weight. Alligator gar in the 10 and 12% body weight treatments were
overfed with noticeable amounts of uneaten feed remaining between feedings, suggesting
that juvenile alligator gar fed 10 % body weight were satiated. FCR values for the 10 and
12% treatments were high and were probably a result of the combination of the uneaten
feed and inefficiency in digestion. FCR can be decreased by reducing feed rations below
satiation levels without a reduction in growth rates. Juvenile alligator gar fed 6, 8, and
10% body weight had similar SGRs, however, alligator gar fed 6 and 8% had lower FCRs
than alligator gar fed 10% body weight. The lowest FCRs in this study (2.1, 2.2, and 3.3)
were higher than the lowest FCRs reported for rabbitfish (0.87; El-Sayed et al. 1995),
snakehead Channa striatus (0.99; Qin and Fast 1996), orange-spotted grouper
Epinephelus coioides (1.3; Luo et al. 2006), and channel catfish (1.6; Robinson and Li
1999). However, FCRs in the previously cited studies were calculated using wet weights,
which results in lower FCRs because of moisture content, as compared to this study
which used dry weights, which more accurately reflect feed conversion efficiency.
SGR and FCR are important tools for determining optimum feed amounts,
minimizing waste production, and preventing water quality deterioration. Maximum
SGR and minimal FCR cannot be attained simultaneously. Depending on culture goals, a
level of feed that maximizes SGR or minimizes FCR can be pursued individually or an
optimal compromise between SGR and FCR can be pursued. The minimal FCR for
juvenile alligator gar was estimated to be 3% body weight. However, based on SGR
regression this feed ration will result in a sub-optimal specific growth rate of 0.06. Based
on ANOVA and regression analysis of SGR, optimum growth can be attained when fed
between 6-12% body mass. Combining SGR and FCR regression curves, the optimal

70
compromise between FCR and SGR was determined to be 7.4% body weight. At 7.4%
body weight juvenile alligator gar would be expected to have a FCR of 3.4 and a SGR of
0.08. Juvenile alligator gar fed 1% body weight gained mass, but had reduced SGR,
increased FCR, and no reduction in survival compared to other treatments suggesting that
the maintenance feeding level is below 1% body weight.

71
FUTURE RECOMMENDATIONS
Aquaculture of alligator gar in recirculating systems can be a practical and
efficient method for producing individuals for market and re-stocking. According to the
previous experiments the follow recommendations should be followed to maximize
efficiency of alligator gar production: Mature alligator gar should be spawned in the
spring using LHRHa at 0.1mg/kg during the natural spawning period. Larval alligator
gar should be fed floating feed supplemented with Artemia at first feeding to increase
growth and survival. Juvenile alligator gar (15 DAH) should be reared at 10 fish/L,
however more studies should be conducted at higher densities to determine at what
density growth and survival is hindered. For maximal survival juvenile alligator gar
should be fed floating pelleted feed at a rate of 8% body weight daily. To reduce
expenses associated with regulating temperatures juvenile alligator gar may be reared
without temperature regulation. To minimize FCR, juvenile alligator gar should be fed
floating pelleted feed at 3% body weight split among three daily feedings. To maximize
growth while maintaining minimal FCR, juvenile alligator gar should be fed floating
pelleted feed at 7.4% body weight split among three daily feedings. In each individual
situation, cost benefit analysis should be conducted and integrated with FCR and SGR for
juvenile to more accurately determine the optimal feed rate for production.

72
LITERATURE CITED
Aguilera, C., R. Mendoza, G. Rodríguez, and G. Márquez. 2002. Morphological
description of alligator gar and tropical gar larvae, with an emphasis on growth
indicators. Transactions of the American Fisheries Society 131:899-909.
Barrows, F. T. and R. W. Hardy. 2001. Nutrition and Feeding. G. A. Wedemeyer, editor.
Fish hatchery management, second edition. American Fisheries Society,
Bethesda, Maryland. 483-558
Bolivar, R. B., E. B. T. Jimenez, and C. L. Brown. 2006. Alternate-day feeding strategy
for tilapia grow out in the Philippines: marginal cost-revenue analyses. North
American Journal of Aquaculture 68:192-197.
Boudreaux, P. J., A. M. Ferrara, and Q. C. Fontenot. 2007a. Acute toxicity of ammonia to
spotted gar, Lepisosteus oculatus, Alligator gar, Atractosteus spatula, and
paddlefish, Polyodon spathula. Journal of the World Aquaculture Society
38(2):322-325.
Boudreaux, P. J., A. M. Ferrara, and Q. C. Fontenot. 2007b. Chloride inhibition of nitrite
uptake for non-teleost Actinopterygiian fishes. Comparative Biochemistry and
Physiology 147:420-423.
Brooks, W. 1850. A family poisoned by eating a gar. Northwest Medical and Surgical
Journal 7:437-439.
Broussard, N. 2009. Stage specific toxicity of gar Master’s thesis, Nicholls State
University, Thibodaux, Louisiana.
Burns, T. A., D. T. Stalling, and W. Goodger. 1981. Gar ichthyotoxin – Its effect on
crayfish, with notes on bluegill sunfish. The Southwestern Naturalist 25(4):513-
515.
Cañavate, J. P. and C. Fernãndez-Diaz. 1991. Influence of co-feeding larvae with live
and inert diets on weaning the sole Solea senegalensis onto commercial dry feeds.
Aquaculture 174(3-4):255-263.
Chapman, F. A. and J. P. Van Eenennaam. 2007. Sturgeon aquaculture - Specialized
techniques: Determining the stage of sexual maturity in female sturgeon for
artificial spawning: The egg polarization index or PI. Fisheries and Aquatic
Sciences Department, Florida Cooperative Extension Service, Institute of Food
and Agricultural Sciences, University of Florida.

73
Clark, J. H., W. O. Watanabe, D. H. Ernst, and R. I. Wicklund, B. L. Olla. 1990. Effect of
feeding rate on growth and feed conversion of Florida red tilapia reared in
floating marine cages. Journal of the World Aquaculture Society 21(1):16-24.
Corrêa, C. F. and V. R. Cerqueira. 2007. Effects of stocking density and size distribution
on growth, survival and cannibalism in juvenile fat snook (Centropomus
parrallelus Poey). Aquaculture Research 38:1627-1634.
Dabrowski, K. 1984. The feeding of fish larvae: present <state of the art> and
perspectives. Reproduction Nutrition Development 24:807-833.
Davis, J. G. 2006. Reproductive biology, life history, and population structure of a
bowfin Amia calva in southeastern Louisiana. Master’s thesis. Nicholls State
University, Thibodaux, Louisiana.
Echelle, A. A. and C. D. Riggs. 1972. Aspects of the early life history of gars
(Lepisosteus) in lake Texoma. Transactions of the American Fisheries Society
101(1):106-112.
El-Sayed, A. M., K. A. Mostafa, and J. S. Mohammadi, A. El-Dehaimi, and M. Kayid.
1995. Effects of stocking density and feeding levels on growth rates and feed
utilization of rabbitfish Siganus canaliculatus. Journal of the World Aquaculture
Society 26(2):212-216.
Engle, C. R.and D. Brown. 1999. Growth, yield, dressout, and net returns of bighead carp
Hypophthalmichthys nobilis stocked at three densities in fertilized earthen ponds.
The Journal of the World Aquaculture Society 30(3):371-379.
Fairchild, E. A. and W. H. Howell. 2001. Optimal stocking density for juvenile winter
flounder Pseudoplueronectes americanus. Journal of the World Aquaculture
Society 32(3):300-308.
Ferrara, A.M. 2001. Life-history strategy of Lepisosteidae: Implications for the
conservation and management of alligator gar. Doctoral dissertation, Auburn
University, Auburn, Alabama. 141 pp.
Francis Jr, A. W. and D. D. Bengston. 1999. Partitioning fish and diet selection as
methods for the reduction of cannibalism in Paralichthys dentatus larviculture.
Journal of the World Aquaculture Society 30(3):302-310.
Flodmark, L. E. W., L. A. Vollestad, and A. Forseth. 2004. Performance of juvenile
brown trout exposed to fluctuating water level and temperature. Journal of Fish
Biology 65:460-470

74
Fuhrman, F. A., G. J. Fuhrman, D. L. Dull, and H.S. Mosher. 1969. Toxins from eggs of
fishes and amphibia. Journal of Agriculture and Food Chemistry 17(3):417-424.
Goodger,W. P. and T. A. Burns. 1980. The cardiotoxic effects of alligator gar
(Lepisosteus spatula) roe on the isolated turtle heart. Toxicon 18:489-494.
Goodyear, C. P. 1966. Distribution of gars on the Mississippi gulf coast. Journal of the
Mississippi Academy of Sciences 12:188-192.
Goodyear, C. P. 1967. Feeding habits of three species of gars, Lepisosteus, along the
Mississippi gulf coast. Transactions of the American Fisheries Society 96:297-
300.
Hengsawat, K., F. J. Ward, and P. Jaruratjamorn. 1997. The effect of stocking density on
yield, growth and mortality of African catfish (Clarius gariepinus Burchell 1822)
cultured in cages. Aquaculture 152:67-76.
Jarboe, H. H. and W. J. Grant. 1996. Effects of feeding time and frequency on growth of
channel catfish Ictalarus punctatus in closed recirculating raceway systems.
Journal of the World Aquaculture Society 27(2):235-239.
Jobling, M. 1997. Temperature and growth: modulation of growth rate via temperature
change. In Global Warming - Implications for Freshwater and Marine Fish pages
225–253 (McDonald, D. G. & Wood, C. M., eds). Cambridge: Cambridge
University Press.
Kelly, A. M. and C. C. Kohler. 2006. Nutritional and physiological strategies for
sustainable aquaculture. North American Journal of Aquaculture 68:113-115.
Kim, K. D., Y. J. Kang, K. W. Kim, and K. M. Kim. 2007. Effects of feeding rate on
growth and body composition of juvenile flounder Paralichthys olivaceus. Journal
of the World Aquaculture Society 38(1):169-173.
King, N. J., W. H. Howell, M. Huber, and D. A. Bengtson. 2000. Effects of larval
stocking density on laboratory scale and commercial scale production of summer
flounder Paralichthys dentatus. Journal of the World Aquaculture Society
31(3)436-445.
Landolt, J. C. and L. G. Hill. 1975. Observation of the gross structure and dimensions of
the gills of three species of gar (Lepisosteidae). Copeia 3:470-475.
Leatherland, J. F. and C. Y. Cho. 1985. Effect of rearing density on thyroid and
interregnal gland activity and plasma hepatic metabolite levels in rainbow trout,
Salmo gairneri Richardson. Journal of Fish Biology 27:583-592.

75
Luo, Z., Y. J. Liu, K. S. Mai, L. X. Tian, X. Y. Tan, and J. F. Shi. 2006. Effects of
feeding levels on growth performance, feed utilization, body composition, and
apparent digestibility coefficients of nutrients for grouper Epinephelus coioides
juveniles. Journal of the World Aquaculture Society 37(1):32-40.
Mendoza, R., C. Aquilera, G. Rodríguez, M. González, and R. Castro. 2002a.
Morphophysiological studies on alligator gar (Atractosteus spatula) larval
development as a basis for their culture and repopulation of their natural habitat.
Reviews in Fish Biology and Fisheries 12:133-142.
Mendoza, R., C. Aguilera, J. Montemayor, A. Revol, and J. Holt. 2002b. Studies on the
physiology of Atractosteus spatula larval development and its implications to
early weaning on to artificial diets. In: Cruz-Suárez, L. E., Ricque-Marie, D.,
Tapia-Salazar, M., Gaxiola-Cortés, M. G. Simoes, N. (Eds.). Avances en
Nutrición Acuícola VI. Memorias del VI Simposium Internacional de Nutrición
Acuícola. 3 al 6 Septiembre del 2002. Cancún, Quintana Roo, México.
Mendoza, R., C. Aguilera, L. Carreón, J. Montemayor, and M. González. 2008. Weaning
of alligator gar (Atractostues spatula) larvae to artificial diets. Aquaculture
Nutrition 14:223-231.
Métailler, R., T. Dehapiot, C. Huelvan, and J. E. Vendeville. 1980. Influence of the
feeding level on growth, feed conversion, protein efficiency, and chemical
composition of juvenile European sea-bass (Dicentrarchus labrax). Proceedings
of the World Mariculture Society 11:436-444.
Mihelakakus, A., C. Tsolkas, and T. Yoshimatsu. 2002. Optimization of feeding rate for
hatchery produced juvenile gilthead sea bream Sparus aurata. The Journal of the
World Aquaculture Society 33(2):169-175.
Mohler, J. W., M. K. King, and P. R. Farrell. 2000. Growth and survival of first feeding
and fingerling Atlantic sturgeon under culture conditions. North American
Journal of Aquaculture 62:174-183.
Person-Le-Ruyet, J. 1989. Early weaning of marine fish larvae on to microdiets:
constraints and perspectives. J. Barret, editor. Advances in Tropical Aquaculture.
IFREMER, Actes de colloques, Tahiti, French Polynesia. Pages 625-642.
Peterson B.C. and B. C. Small. 2006. Effect of feeding frequency on feed consumption,
growth, and feed efficiency in aquarium reared Norris and NWAC103 channel
catfish Ictalarus punctatus. Journal of the World Aquaculture Society 37(4):490-
495.

76
Qin, J. and A. W. Fast. 1996. Effects of feed application rates on growth, survival, and
feed conversion of juvenile snakehead Channa striatus. Journal of the World
Aquaculture Society 27(1):52-56.
Rahman, M. M., Md. S. Islam, G. C. Halder, and M. Tanaka. 2006. Cage culture of sutchi
catfish, Pangasius sutchi (Fowler 1937): effects of stocking density on growth,
survival, yield and farm profitability. Aquaculture Research 37:33-39.
Reed, B. C., W. E. Kelso, and D. A. Rutherford. 1992. Growth, fecundity, and mortality
of paddlefish in Louisiana. Transactions of the American Fisheries Society
121(3)378-384.
Robinson, E. H. and M. H. Li. 1999. Effect of dietary protein concentration and feeding
rate on weight gain, feed efficiency, and body composition of pond raised channel
catfish Ictalarus punctatus. Journal of the World Aquaculture Society 30(3):311-
318.
Rosenlund, G., J. Stoss, and C. Talbot. 1997. Co-feeding marine fish larvae with inert
and live diets. Aquaculture 155(1-4):183-191.
Rowland, S. J., G. L. Allan, M. Hollis, and T. Pontifex. 2004. Production of silver perch
(Bidyanus bidyanus) fingerlings at three stocking densities in cages and tanks.
Aquaculture 229:193-202.
Saoud, I. P., J. Ghanawi, and N. Lebbos. 2008. Effects of stocking density on the
survival, growth, size variation and condition index of juvenile rabbitfish, Siganus
rivulatus. Aquaculture International 16:109-116.
Seidensticker, E. P. 1987. Food selection of alligator gar and longnose gar in a Texas
reservoir. Proceedings of the Annual Conference of Southeast Association Fish
and Wildlife Agencies 41:100-104.
Siddiqui, A. Q., M. S. Howlader, and A. B. Adam. 1989. Culture of nile tilapia,
Oreochromis niloticus (L.), at three stocking densities in outdoor concrete tanks
using drainage water. Aquaculture and Fisheries Management 20: 49-57.
Simon, T. P. and R. Wallus. 1989. Contributions to the early life histories of gar
(Actinopterygii: lepisosteidae) in the Ohio and Tennessee river basins with
emphasis on larval development. Transactions Kentucky Academy of Science
50(1-2):59-74.
Silverstein, J. T. 2006. Relationships among feed intake, feed efficiency, and growth in
juvenile rainbow trout. North American Journal of Aquaculture 68:168-175.
77
Smith, O. A. 2008. Reproductive potential and life history of spotted gar Lepisosteus
oculatus in the upper Barataria estuary, Louisiana. Master’s thesis, Nicholls State
University, Thibodaux, Louisiana.
Spigarelli, S. A., Thommes, M. M. & Prepejchal, W. 1982. Feeding, growth, and fat
deposition by brown trout in constant and fluctuating temperatures. Transactions
of the American Fisheries Society 111:199–209.
Suchy, M. 2009. Effects of salinity on growth and survival of larval and juvenile alligator
gar Atractosteus spatula and on plasma osmolality of non-teleost actinopterygiian
fishes. Master’s thesis, Nicholls State University, Thibodaux, Louisiana.
Suttkus, R. D. 1963. Fishes of the western North Atlantic. Family Lepisosteidae. Sears
Foundation for Marine Research 1: 61-68.
Tomasso, J. R. 1994. Toxicity of nitrogenous wastes to aquaculture animals. Reviews in
Fisheries Sciences 2:291-314.
Vijayan, M. M., and J. F. Leatherland. 1988. Effect of stocking density on the growth and
stress-response in brook charr, Salvelinus fontinalis. Aquaculture 75:159-170.
Webster C. D., K. R. Thompson, A. M. Morgan, E. J. Grisby, and S. Dasgupta. 2001.
Feeding frequency effects growth, not fillet composition, of juvenile sunshine
bass Morone chrysops X M. saxatilis grown in cages. Journal of the World
Aquaculture Society 32(1):79-88
Wedemeyer, Gary A., editor. 2001. Fish hatchery management, second edition.
American Fisheries Society, Bethesda, Maryland. 751 pp.
Weed, A. C. 1923. The alligator gar. Field Museum of Natural History, Department of
Zoology, Chicago 5:57-72
Woiwode, J. G. and I. R. Adelman. 1991. Effects of temperature, photoperiod, and ration
size on growth of hybrid striped bass X white bass. Transactions of the American
Fisheries Society 120:217-229.

78
Appendix I. Initial replicates, TL (mm), wet weight (g), and dry weight (g) for 5 DAH
larval alligator gar exposed to the Artemia supplement experiment.
Replicate TL Wet Weight Dry Weight
1 13.4 0.0337 0.0039
2 15.1 0.0281 0.0043
3 14.7 0.0336 0.0050
4 15.7 0.0311 0.0040
5 14.8 0.0316 0.0038
6 15.3 0.0349 0.0041
7 15.8 0.0333 0.0043
8 16.5 0.0443 0.0044
9 15.7 0.0367 0.0045
10 15.5 0.0349 0.0042
11 15.0 0.0347 0.0044
12 14.4 0.0317 0.0044
13 15.7 0.0342 0.0041
14 16.3 0.0333 0.0044
15 14.7 0.0296 0.0045
16 16.5 0.0363 0.0044
17 16.0 0.0397 0.0048
18 13.9 0.0267 0.0049
19 15.0 0.0290 0.0047
20 15.6 0.0315 0.0050
21 14.9 0.0328 0.0047
22 15.7 0.0343 0.0051
23 15.9 0.0377 0.0037
24 16.6 0.0395 0.0048
25 15.1 0.0364 0.0052

79
Appendix II. Treatment, tank, replicate, TL (mm), wet weight (g), and dry weight (g)
for 12 DAH and 20 DAH larval alligator gar fed floating feed supplemented with Artemia
for 7 days (A-S) or fed only floating feed (F-F).
Treatment Tank DAH Replicate TL Wet Weight Dry Weight
A-S A1 12 1 22.5 0.0527 0.0061
A-S A1 12 2 26.8 0.0944 0.0135
A-S A1 12 3 22.4 0.0543 0.0068
A-S A1 12 4 28.0 0.1124 0.0171
A-S A1 12 5 24.3 0.0572 0.0076
A-S A2 12 1 21.8 0.0532 0.0070
A-S A2 12 2 27.4 0.1013 0.0161
A-S A2 12 3 27.0 0.0840 0.0112
A-S A2 12 4 25.3 0.0993 0.0144
A-S A2 12 5 25.7 0.0834 0.0115
A-S A3 12 1 27.2 0.1143 0.0182
A-S A3 12 2 26.3 0.0728 0.0096
A-S A3 12 3 26.1 0.0757 0.0107
A-S A3 12 4 25.3 0.0611 0.0072
A-S A3 12 5 31.3 0.1468 0.0255
A-S A4 12 1 27.7 0.0797 0.0107
A-S A4 12 2 27.6 0.0895 0.0129
A-S A4 12 3 27.6 0.1041 0.0146
A-S A4 12 4 28.4 0.1174 0.0193
A-S A4 12 5 28.8 0.1019 0.0145
F-F B1 12 1 36.8 0.2318 0.0368
F-F B1 12 2 33.8 0.1504 0.0222
F-F B1 12 3 38.0 0.2223 0.0346
F-F B1 12 4 33.2 0.1348 0.0196
F-F B1 12 5 32.4 0.1322 0.0195
F-F B2 12 1 22.5 0.0527 0.0061
F-F B2 12 2 26.8 0.0944 0.0135
F-F B2 12 3 22.4 0.0543 0.0068
F-F B2 12 4 28.0 0.1124 0.0171
F-F B2 12 5 24.3 0.0572 0.0076
F-F B3 12 1 26.6 0.1022 0.0141
F-F B3 12 2 33.7 0.1911 0.0302
F-F B3 12 3 36.2 0.1976 0.0289
F-F B3 12 4 35.6 0.2224 0.0353
F-F B3 12 5 36.9 0.2186 0.0344
F-F B4 12 1 35.3 0.1781 0.0272
F-F B4 12 2 35.7 0.2045 0.0317
F-F B4 12 3 35.8 0.2088 0.0330
F-F B4 12 4 39.2 0.2578 0.0441
F-F B4 12 5 39.1 0.2376 0.0376

80
Treatment Tank DAH Replicate TL Wet Weight Dry Weight
A-S A1 20 1 47.8 0.4325 0.0649
A-S A1 20 2 39.1 0.2569 0.0392
A-S A1 20 3 46.9 0.6994 0.1063
A-S A1 20 4 48.3 0.5658 0.0823
A-S A1 20 5 37.1 0.2531 0.0400
A-S A2 20 1 47.8 0.6477 0.0939
A-S A2 20 2 43.9 0.4550 0.0771
A-S A2 20 3 52.4 0.6124 0.1057
A-S A2 20 4 58.3 0.8763 0.1332
A-S A2 20 5 33.9 0.2005 0.0301
A-S A3 20 1 38.8 0.2949 0.0493
A-S A3 20 2 36.5 0.2000 0.0307
A-S A3 20 3 37.3 0.2442 0.0387
A-S A3 20 4 38.1 0.3034 0.0517
A-S A3 20 5 32.8 0.1660 0.0254
A-S A4 20 1 36.4 0.2165 0.0343
A-S A4 20 2 32.7 0.1835 0.0270
A-S A4 20 3 38.1 0.3426 0.0527
A-S A4 20 4 36.9 0.2572 0.0392
A-S A4 20 5 50.0 0.5937 0.1034
F-F B1 20 1 53.4 0.7217 0.1316
F-F B1 20 2 54.8 0.7734 0.1371
F-F B1 20 3 59.7 0.8068 0.1445
F-F B1 20 4 51.1 0.6494 0.1155
F-F B1 20 5 47.1 0.4339 0.0727
F-F B2 20 1 47.8 0.4325 0.0649
F-F B2 20 2 39.1 0.2569 0.0392
F-F B2 20 3 46.9 0.6994 0.1063
F-F B2 20 4 48.3 0.5658 0.0823
F-F B2 20 5 37.1 0.2531 0.0400
F-F B3 20 1 45.6 0.4729 0.0783
F-F B3 20 2 56.9 0.7947 0.1407
F-F B3 20 3 55.9 0.7598 0.1347
F-F B3 20 4 59.5 0.8722 0.1583
F-F B3 20 5 60.7 0.9671 0.1797
F-F B4 20 1 47.9 0.5994 0.1060
F-F B4 20 2 56.1 0.8088 0.1522
F-F B4 20 3 55.0 0.7174 0.1298
F-F B4 20 4 51.5 0.6294 0.1100
F-F B4 20 5 62.0 1.0734 0.1881

81
Appendix III. Treatment, replicate, total dead, observed mortalities, and cannibalized
mortalities for larval alligator gar fed floating feed supplemented Artemia (A-S) or fed
only floating feed (F-F) for 15 days.
Treatment Replicate Total Dead Natural Dead Cannibalized
A-S 1 70 15 55
A-S 2 52 10 42
A-S 3 39 13 26
A-S 4 55 12 43
F-F 1 25 11 14
F-F 2 29 10 19
F-F 3 24 5 19
F-F 4 31 10 21

82
Appendix IV. Initial replicates, TL (mm), wet weights (g), and dry weights (g) for
juvenile alligator gar fed 4 or 8% feed based on body mass split evenly among 3 daily
feedings and reared at 2.5, 5, 7.5, or 10 fish/L for 16 days.
Replicate TL Wet Weight Dry Weight
1 22.0 0.0702 0.0082
2 29.3 0.1180 0.0174
3 23.8 0.0559 0.0076
4 25.6 0.0826 0.0123
5 22.7 0.0597 0.0079
6 23.0 0.0810 0.0120
7 27.7 0.0959 0.0137
8 22.9 0.0681 0.0104
9 30.6 0.1312 0.0212
10 29.7 0.1072 0.0173
11 32.4 0.1310 0.0200
12 30.6 0.1182 0.0179
13 21.8 0.0589 0.0087
14 26.7 0.1055 0.0170
15 29.8 0.1012 0.0159
16 25.9 0.0790 0.0116
17 25.7 0.0884 0.0134
18 25.5 0.0800 0.0131
19 24.9 0.0630 0.0096
20 29.9 0.1370 0.0204
21 24.7 0.0840 0.0125
22 26.3 0.0840 0.0135
23 24.7 0.0811 0.0128
24 25.5 0.0799 0.0127
25 27.3 0.0926 0.0136

83
Appendix V. Feed amount (%), density (fish/L), replicate, TL (mm; ± SE), wet weight
(mm), and total dead for juvenile alligator gar fed 4 or 8% feed based on body mass split
evenly among 3 daily feedings and reared at 2.5, 5, 7.5, or 10 fish/L after 16 days.
Feed Amount Density Replicate TL Wet Weight Dead
4 2.5 1 64.48 ± 3.83 1.52 117
4 2.5 2 77.64 ± 5.42 2.48 129
4 2.5 3 65.20 ± 4.72 1.28 100
4 5 1 75.58 ± 3.39 2.65 269
4 5 2 75.86 ± 4.83 2.44 264
4 5 3 70.90 ± 5.68 1.52 237
4 7.5 1 74.12 ± 4.33 2.59 409
4 7.5 2 74.06 ± 4.30 3.25 410
4 7.5 3 70.44 ± 5.31 1.48 354
4 10 1 76.46 ± 2.15 2.14 527
4 10 2 72.96 ± 1.41 3.31 565
4 10 3 68.76 ± 4.58 1.23 428
8 2.5 1 80.54 ± 7.98 2.10 111
8 2.5 2 80.62 ± 6.74 2.26 111
8 2.5 3 73.16 ± 7.53 1.80 90
8 5 1 72.84 ± 2.12 2.77 261
8 5 2 73.68 ± 2.59 1.98 218
8 5 3 70.20 ± 6.58 1.80 211
8 7.5 1 65.42 ± 0.91 2.35 388
8 7.5 2 84.38 ± 2.85 2.47 390
8 7.5 3 59.40 ± 1.33 1.82 339
8 10 1 64.00 ± 6.79 1.54 444
8 10 2 70.26 ± 2.76 2.30 519
8 10 3 68.20 ± 3.40 1.57 390

84
Appendix VI. Day, replicate, temperature regime, feed frequency, TL (mm; ± SE), and
wet weights (g; ± SE) for juvenile alligator gar fed 4% feed based on body mass split
evenly among 2 or 3 feedings daily for 21 days.
Day Replicate Temperature Feed Frequency TL Wet Weights
0 1 Regulated 3 132.6 ± 1.85 10.3 ± 0.53
0 2 Regulated 3 129.6 ± 1.71 9.3 ± 0.36
0 3 Regulated 3 125.2 ± 1.59 8.5 ± 0.38
0 4 Regulated 3 131.9 ± 1.72 8.1 ± 0.32
0 1 Fluctuating 3 124.3 ± 1.61 8.6 ± 0.35
0 2 Fluctuating 3 125.0 ± 2.27 8.8 ± 0.54
0 3 Fluctuating 3 125.1 ± 1.61 8.6 ± 0.37
0 4 Fluctuating 3 126.2 ± 1.87 8.6 ± 0.38
0 1 Fluctuating 2 128.0 ± 1.85 11.0 ± 2.08
0 2 Fluctuating 2 126.0 ± 1.86 8.6 ± 0.37
0 3 Fluctuating 2 129.3 ± 2.35 9.1 ± 0.59
0 4 Fluctuating 2 130.7 ± 1.93 9.6 ± 0.39
2 1 Regulated 3 - 11.3 ± 1.48
2 2 Regulated 3 - 11.1 ± 0.66
2 3 Regulated 3 - 10.4 ± 0.84
2 4 Regulated 3 - 9.7 ± 0.48
2 1 Fluctuating 3 - 9.6 ± 0.59
2 2 Fluctuating 3 - 9.6 ± 0.72
2 3 Fluctuating 3 - 10.3 ± 0.82
2 4 Fluctuating 3 - 10.8 ± 1.11
2 1 Fluctuating 2 - 11.1 ± 0.75
2 2 Fluctuating 2 - 10.2 ± 0.80
2 3 Fluctuating 2 - 10.7 ± 1.40
2 4 Fluctuating 2 - 10.8 ± 0.67
4 1 Regulated 3 - 14.3 ± 1.25
4 2 Regulated 3 - 12.2 ± 0.87
4 3 Regulated 3 - 10.3 ± 0.60
4 4 Regulated 3 - 10.8 ± 0.80
4 1 Fluctuating 3 - 11.2 ± 0.68
4 2 Fluctuating 3 - 12.9 ± 1.42
4 3 Fluctuating 3 - 10.7 ± 0.63
4 4 Fluctuating 3 - 12.7 ± 0.93
4 1 Fluctuating 2 - 12.1 ± 0.54
4 2 Fluctuating 2 - 13.4 ± 0.83
4 3 Fluctuating 2 - 14.5 ± 1.92
4 4 Fluctuating 2 - 13.1 ± 1.06
6 1 Regulated 3 - 16.3 ± 1.25
6 2 Regulated 3 - 14.5 ± 0.81
6 3 Regulated 3 - 12.5 ± 1.09
6 4 Regulated 3 - 11.9 ± 0.98
6 1 Fluctuating 3 - 13.4 ± 1.27
6 2 Fluctuating 3 - 14.0 ± 1.57

85
Day Replicate Temperature Feed Frequency TL Wet Weights
6 3 Fluctuating 3 - 12.6 ± 0.82
6 4 Fluctuating 3 - 13.5 ± 1.67
6 1 Fluctuating 2 - 13.3 ± 0.73
6 2 Fluctuating 2 - 15.8 ± 1.28
6 3 Fluctuating 2 - 13.4 ± 0.56
6 4 Fluctuating 2 - 15.2 ± 1.02
8 1 Regulated 3 - 19.1 ± 1.19
8 2 Regulated 3 - 17.3 ± 0.93
8 3 Regulated 3 - 16.6 ± 1.45
8 4 Regulated 3 - 15.2 ± 1.65
8 1 Fluctuating 3 - 15.9 ± 1.15
8 2 Fluctuating 3 - 15.4 ± 1.86
8 3 Fluctuating 3 - 15.6 ± 1.00
8 4 Fluctuating 3 - 15.7 ± 1.09
8 1 Fluctuating 2 - 15.9 ± 0.87
8 2 Fluctuating 2 - 19.4 ± 1.22
8 3 Fluctuating 2 - 15.2 ± 1.28
8 4 Fluctuating 2 - 15.0 ± 2.00
10 1 Regulated 3 - 20.4 ± 1.86
10 2 Regulated 3 - 18.3 ± 1.32
10 3 Regulated 3 - 17.7 ± 0.74
10 4 Regulated 3 - 17.6 ± 1.81
10 1 Fluctuating 3 - 18.5 ± 1.49
10 2 Fluctuating 3 - 20.0 ± 2.51
10 3 Fluctuating 3 - 17.1 ± 1.51
10 4 Fluctuating 3 - 17.6 ± 1.72
10 1 Fluctuating 2 - 19.8 ± 1.76
10 2 Fluctuating 2 - 19.7 ± 1.53
10 3 Fluctuating 2 - 21.1 ± 3.20
10 4 Fluctuating 2 - 19.4 ± 1.31
12 1 Regulated 3 - 24.1 ± 2.16
12 2 Regulated 3 - 22.2 ± 1.82
12 3 Regulated 3 - 18.1 ± 0.89
12 4 Regulated 3 - 21.3 ± 1.71
12 1 Fluctuating 3 - 21.3 ± 1.69
12 2 Fluctuating 3 - 21.2 ± 2.36
12 3 Fluctuating 3 - 22.5 ± 1.62
12 4 Fluctuating 3 - 19.6 ± 1.33
12 1 Fluctuating 2 - 25.8 ± 2.78
12 2 Fluctuating 2 - 20.7 ± 2.13
12 3 Fluctuating 2 - 25.4 ± 3.88
12 4 Fluctuating 2 - 23.3 ± 1.90
14 1 Regulated 3 - 27.8 ± 2.51
14 2 Regulated 3 - 23.1 ± 1.40
14 3 Regulated 3 - 22.4 ± 1.93

86
Day Replicate Temperature Feed Frequency TL Wet Weights
14 4 Regulated 3 - 21.4 ± 1.92
14 1 Fluctuating 3 - 20.6 ± 0.96
14 2 Fluctuating 3 - 22.9 ± 1.87
14 3 Fluctuating 3 - 26.7 ± 1.98
14 4 Fluctuating 3 - 24.5 ± 2.14
14 1 Fluctuating 2 - 24.4 ± 2.59
14 2 Fluctuating 2 - 27.8 ± 2.84
14 3 Fluctuating 2 - 35.1 ± 3.91
14 4 Fluctuating 2 - 27.4 ± 1.91
16 1 Regulated 3 - 31.0 ± 2.15
16 2 Regulated 3 - 27.9 ± 2.00
16 3 Regulated 3 - 26.9 ± 3.27
16 4 Regulated 3 - 23.5 ± 2.10
16 1 Fluctuating 3 - 25.1 ± 1.98
16 2 Fluctuating 3 - 27.0 ± 2.61
16 3 Fluctuating 3 - 30.3 ± 2.13
16 4 Fluctuating 3 - 22.7 ± 1.90
16 1 Fluctuating 2 - 29.5 ± 1.73
16 2 Fluctuating 2 - 26.4 ± 2.25
16 3 Fluctuating 2 - 36.0 ± 3.90
16 4 Fluctuating 2 - 31.1 ± 2.21
18 1 Regulated 3 - 36.0 ± 2.68
18 2 Regulated 3 - 30.8 ± 2.82
18 3 Regulated 3 - 28.7 ± 2.31
18 4 Regulated 3 - 28.6 ± 1.89
18 1 Fluctuating 3 - 27.1 ± 2.09
18 2 Fluctuating 3 - 32.1 ± 2.27
18 3 Fluctuating 3 - 33.3 ± 3.04
18 4 Fluctuating 3 - 27.1 ± 2.65
18 1 Fluctuating 2 - 31.3 ± 1.97
18 2 Fluctuating 2 - 36.8 ± 3.87
18 3 Fluctuating 2 - 39.9 ± 4.35
18 4 Fluctuating 2 - 33.6 ± 3.01
20 1 Regulated 3 200.8 ± 2.78 40.7 ± 1.83
20 2 Regulated 3 194.3 ± 2.50 37.4 ± 1.41
20 3 Regulated 3 189.8 ± 2.60 35.2 ± 1.55
20 4 Regulated 3 186.7 ± 2.91 31.3 ± 1.53
20 1 Fluctuating 3 192.0 ± 3.34 34.2 ± 1.51
20 2 Fluctuating 3 201.8 ± 4.13 40.8 ± 2.58
20 3 Fluctuating 3 195.3 ± 3.04 39.0 ± 1.84
20 4 Fluctuating 3 195.5 ± 2.94 36.5 ± 1.68
20 1 Fluctuating 2 201.0 ± 3.58 39.6 ± 1.96
20 2 Fluctuating 2 204.5 ± 4.35 43.2 ± 2.62
20 3 Fluctuating 2 210.2 ± 4.31 47.5 ± 3.21
20 4 Fluctuating 2 203.0 ± 3.19 39.9 ± 1.79

87
Appendix VII. Day, replicate, feed percentage, TL (mm; ± SE), and wet weights (g; ±
SE) for juvenile alligator gar fed 1, 2, 4, or 8% feed based on body mass split evenly
among 3 feedings daily for 21 days.
Day Replicate Feed Percentage TL Wet Weight
0 1 8 118.7 ± 1.52 5.4 ± 0.25
0 2 8 110.1 ± 1.50 5.8 ± 0.24
0 3 8 108.5 ± 1.51 5.5 ± 0.23
0 1 4 118.5 ± 1.46 5.5 ± 0.19
0 2 4 108.6 ± 1.36 5.3 ± 0.21
0 3 4 111.3 ± 1.66 5.8 ± 0.25
0 1 2 119.3 ± 1.58 5.6 ± 0.25
0 2 2 108.8 ± 1.47 5.7 ± 0.23
0 3 2 105.2 ± 2.34 5.2 ± 0.31
0 1 1 111.0 ± 1.67 5.0 ± 0.22
0 2 1 108.9 ± 1.40 5.5 ± 0.20
0 3 1 107.9 ± 1.88 5.4 ± 0.28
2 1 8 - 7.1 ± 0.45
2 2 8 - 7.2 ± 0.45
2 3 8 - 7.1 ± 0.57
2 1 4 - 6.1 ± 0.39
2 2 4 - 5.6 ± 0.23
2 3 4 - 7.0 ± 0.51
2 1 2 - 5.4 ± 0.48
2 2 2 - 7.2 ± 0.39
2 3 2 - 7.0 ± 0.81
2 1 1 - 5.4 ± 0.22
2 2 1 - 5.9 ± 0.38
2 3 1 - 6.1 ± 0.46
4 1 8 - 8.1 ± 0.65
4 2 8 - 9.1 ± 0.62
4 3 8 - 8.3 ± 0.58
4 1 4 - 6.9 ± 0.49
4 2 4 - 7.8 ± 0.67
4 3 4 - 8.3 ± 0.68
4 1 2 - 6.5 ± 0.50
4 2 2 - 6.9 ± 0.45
4 3 2 - 8.9 ± 0.78
4 1 1 - 5.5 ± 0.36
4 2 1 - 5.7 ± 0.32
4 3 1 - 6.5 ± 0.56
6 1 8 - 11.7 ± 1.24
6 2 8 - 12.3 ± 1.11
6 3 8 - 11.7 ± 0.81
6 1 4 - 7.9 ± 0.54
6 2 4 - 11.0 ± 0.78
6 3 4 - 8.8 ± 0.58

88
Day Replicate Feed Percentage TL Wet Weight
6 1 2 - 7.7 ± 0.42
6 2 2 - 7.9 ± 0.68
6 3 2 - 7.8 ± 0.71
6 1 1 - 4.9 ± 0.25
6 2 1 - 6.1 ± 0.42
6 3 1 - 5.9 ± 0.40
8 1 8 - 12.9 ± 1.02
8 2 8 - 16.4 ± 1.38
8 3 8 - 14.3 ± 0.77
8 1 4 - 9.2 ± 0.80
8 2 4 - 11.4 ± 0.96
8 3 4 - 10.9 ± 0.94
8 1 2 - 8.5 ± 0.48
8 2 2 - 9.0 ± 0.51
8 3 2 - 8.3 ± 0.68
8 1 1 - 5.9 ± 0.50
8 2 1 - 7.9 ± 0.47
8 3 1 - 6.3 ± 0.49
10 1 8 - 18.5 ± 1.64
10 2 8 - 18.9 ± 1.09
10 3 8 - 18.1 ± 1.41
10 1 4 - 12.0 ± 1.06
10 2 4 - 12.7 ± 1.00
10 3 4 - 12.9 ± 1.00
10 1 2 - 9.4 ± 0.58
10 2 2 - 9.9 ± 1.21
10 3 2 - 8.5 ± 0.31
10 1 1 - 6.1 ± 0.41
10 2 1 - 8.1 ± 0.45
10 3 1 - 5.5 ± 0.42
12 1 8 - 20.3 ± 1.66
12 2 8 - 20.7 ± 1.55
12 3 8 - 24.1 ± 1.03
12 1 4 - 13.1 ± 1.21
12 2 4 - 14.1 ± 1.21
12 3 4 - 14.6 ± 1.23
12 1 2 - 8.8 ± 0.54
12 2 2 - 10.7 ± 0.50
12 3 2 - 11.5 ± 1.22
12 1 1 - 6.1 ± 0.32
12 2 1 - 7.9 ± 0.42
12 3 1 - 6.3 ± 0.29
14 1 8 - 25.4 ± 2.45
14 2 8 - 25.5 ± 1.43
14 3 8 - 26.8 ± 1.84
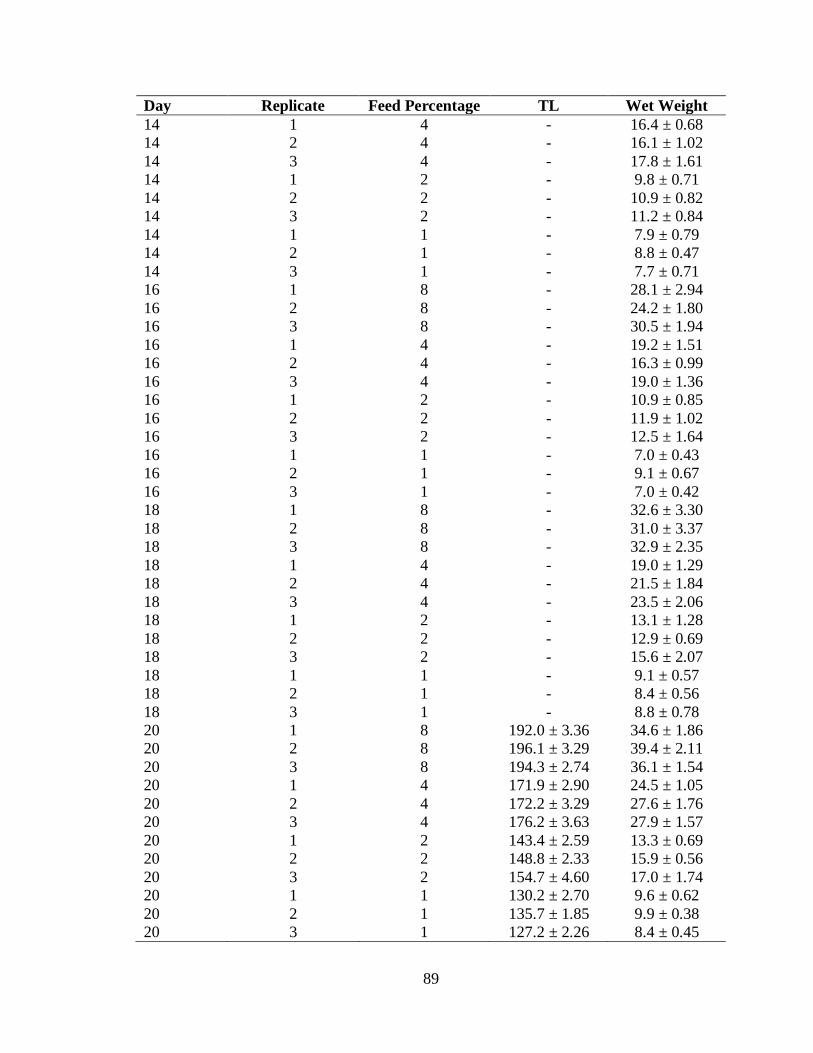
89
Day Replicate Feed Percentage TL Wet Weight
14 1 4 - 16.4 ± 0.68
14 2 4 - 16.1 ± 1.02
14 3 4 - 17.8 ± 1.61
14 1 2 - 9.8 ± 0.71
14 2 2 - 10.9 ± 0.82
14 3 2 - 11.2 ± 0.84
14 1 1 - 7.9 ± 0.79
14 2 1 - 8.8 ± 0.47
14 3 1 - 7.7 ± 0.71
16 1 8 - 28.1 ± 2.94
16 2 8 - 24.2 ± 1.80
16 3 8 - 30.5 ± 1.94
16 1 4 - 19.2 ± 1.51
16 2 4 - 16.3 ± 0.99
16 3 4 - 19.0 ± 1.36
16 1 2 - 10.9 ± 0.85
16 2 2 - 11.9 ± 1.02
16 3 2 - 12.5 ± 1.64
16 1 1 - 7.0 ± 0.43
16 2 1 - 9.1 ± 0.67
16 3 1 - 7.0 ± 0.42
18 1 8 - 32.6 ± 3.30
18 2 8 - 31.0 ± 3.37
18 3 8 - 32.9 ± 2.35
18 1 4 - 19.0 ± 1.29
18 2 4 - 21.5 ± 1.84
18 3 4 - 23.5 ± 2.06
18 1 2 - 13.1 ± 1.28
18 2 2 - 12.9 ± 0.69
18 3 2 - 15.6 ± 2.07
18 1 1 - 9.1 ± 0.57
18 2 1 - 8.4 ± 0.56
18 3 1 - 8.8 ± 0.78
20 1 8 192.0 ± 3.36 34.6 ± 1.86
20 2 8 196.1 ± 3.29 39.4 ± 2.11
20 3 8 194.3 ± 2.74 36.1 ± 1.54
20 1 4 171.9 ± 2.90 24.5 ± 1.05
20 2 4 172.2 ± 3.29 27.6 ± 1.76
20 3 4 176.2 ± 3.63 27.9 ± 1.57
20 1 2 143.4 ± 2.59 13.3 ± 0.69
20 2 2 148.8 ± 2.33 15.9 ± 0.56
20 3 2 154.7 ± 4.60 17.0 ± 1.74
20 1 1 130.2 ± 2.70 9.6 ± 0.62
20 2 1 135.7 ± 1.85 9.9 ± 0.38
20 3 1 127.2 ± 2.26 8.4 ± 0.45

90
Appendix VIII. Initial replicates, TL (mm), wet weights (g), and dry weights (g) for
juvenile alligator gar fed 6, 8, 10 or 12% feed based on body mass split evenly among 3
daily feedings 21 days.
Replicate TL Wet Weight Dry Weight
1 98.0 4.2658 0.7842
2 115.5 6.5520 1.1948
3 82.7 2.6787 0.4771
4 105.9 5.6632 1.0196
5 116.1 6.6961 1.2780
6 98.1 3.6015 0.6436
7 123.1 8.1044 1.4761
8 89.2 2.7986 0.5127
9 88.3 3.1412 0.5740
10 106.8 5.4777 1.0472
11 112.5 5.9304 1.1359
12 128.6 8.9364 1.7707
13 103.2 5.6149 1.0392
14 82.7 2.8717 0.5105
15 97.9 3.2395 0.5779
16 93.7 3.5976 0.6715
17 86.8 2.8984 0.5076
18 82.0 2.4970 0.4427
19 88.6 3.2773 0.5865
20 89.4 2.9279 0.5142
21 113.4 6.2608 1.1235
22 93.6 3.5347 0.5252
23 99.0 3.3120 0.5762
24 90.8 3.0097 0.5303
25 90.7 2.4976 0.4476

91
Appendix IV. Day, replicate, feed percentage, TL (mm; ± SE), and wet weights (g; ±
SE) for juvenile alligator gar fed 6, 8, 10 or 12% feed based on body mass split evenly
among 3 feedings daily for 21 days.
Day Replicate Feed Percentage TL Wet Weight
2 1 6 - 6.7 ± 0.56
2 2 6 - 6.5 ± 0.29 2 3 6 - 2.4 ± 0.37
2 1 8 - 6.4 ± 0.29 2 2 8 - 6.0 ± 0.37 2 3 8 - 6.5 ± 0.34
2 1 10 - 6.0 ± 0.26 2 2 10 - 6.9 ± 0.27
2 3 10 - 6.6 ± 0.33 2 1 12 - 6.7 ± 0.33
2 2 12 - 7.0 ± 0.23 2 3 12 - 7.1 ± 0.50
4 1 6 - 7.4 ± 0.79 4 2 6 - 7.2 ± 0.36
4 3 6 - 8.0 ± 0.57 4 1 8 - 6.9 ± 0.51
4 2 8 - 7.0 ± 0.45 4 3 8 - 7.9 ± 0.40
4 1 10 - 7.7 ± 0.34 4 2 10 - 8.7 ± 0.47
4 3 10 - 8.6 ± 0.75 4 1 12 - 8.2 ± 0.71
4 2 12 - 9.4 ± 0.44 4 3 12 - 8.4 ± 0.62
6 1 6 - 9.3 ± 0.87 6 2 6 - 10.1 ± 0.71
6 3 6 - 10.0 ± 0.96 6 1 8 - 8.9 ± 0.75
6 2 8 - 8.3 ± 0.54 6 3 8 - 9.9 ± 0.46
6 1 10 - 9.2 ± 0.56 6 2 10 - 9.6 ± 0.86
6 3 10 - 10.2 ± 1.10 6 1 12 - 9.1 ± 0.86
6 2 12 - 12.0 ± 0.48 6 3 12 - 10.4 ± 1.27
8 1 6 - 10.9 ± 0.88 8 2 6 - 11.4 ± 1.22
8 3 6 - 13.4 ± 1.05 8 1 8 - 12.0 ± 0.86
8 2 8 - 10.6 ± 1.03 8 3 8 - 12.2 ± 0.85

92
Day Replicate Feed Percentage TL Wet Weight
8 1 10 - 13.0 ± 0.90 8 2 10 - 12.9 ± 1.24
8 3 10 - 13.3 ± 1.75 8 1 12 - 14.5 ± 1.28
8 2 12 - 14.8 ± 1.29 8 3 12 - 15.7 ± 1.23
10 1 6 - 12.8 ± 1.07 10 2 6 - 12.6 ± 1.16
10 3 6 - 13.1 ± 1.08 10 1 8 - 13.3 ± 1.37
10 2 8 - 11.2 ± 0.68 10 3 8 - 15.6 ± 1.26
10 1 10 - 14.9 ± 0.94 10 2 10 - 16.5 ± 1.36
10 3 10 - 18.4 ± 1.49 10 1 12 - 16.4 ± 1.41
10 2 12 - 19.2 ± 1.12 10 3 12 - 21.4 ± 2.03
12 1 6 - 19.1 ± 2.16 12 2 6 - 17.8 ± 1.89
12 3 6 - 18.3 ± 1.83 12 1 8 - 15.9 ± 1.00
12 2 8 - 14.2 ± 0.81 12 3 8 - 17.6 ± 1.45
12 1 10 - 19.9 ± 1.31 12 2 10 - 20.8 ± 1.81
12 3 10 - 22.0 ± 2.62 12 1 12 - 22.0 ± 2.49
12 2 12 - 21.8 ± 1.29 12 3 12 - 21.8 ± 1.86
14 1 6 - 22.8 ± 2.61 14 2 6 - 23.1 ± 1.88
14 3 6 - 19.3 ± 1.17 14 1 8 - 22.4 ± 1.54 14 2 8 - 19.1 ± 2.32
14 3 8 - 20.5 ± 0.90 14 1 10 - 24.3 ± 1.49
14 2 10 - 25.4 ± 1.91 14 3 10 - 27.0 ± 2.75
14 1 12 - 28.5 ± 2.12 14 2 12 - 25.1 ± 2.18
14 3 12 - 29.2 ± 2.77 16 1 6 - 21.0 ± 1.89
16 2 6 - 26.0 ± 2.23 16 3 6 - 30.2 ± 2.56

93
Day Replicate Feed Percentage TL Wet Weight
16 1 8 - 27.0 ± 1.91 16 2 8 - 26.5 ± 2.31
16 3 8 - 20.4 ± 1.63 16 1 10 - 26.8 ± 1.85
16 2 10 - 30.9 ± 2.27 16 3 10 - 28.7 ± 1.29
16 1 12 - 31.2 ± 2.85 16 2 12 - 32.9 ± 2.79
16 3 12 - 36.5 ± 3.18 18 1 6 - 31.7 ± 2.30
18 2 6 - 30.6 ± 2.59 18 3 6 - 26.0 ± 2.31
18 1 8 - 29.6 ± 2.27 18 2 8 - 31.3 ± 2.81
18 3 8 - 24.6 ± 1.60 18 1 10 - 29.5 ± 2.92
18 2 10 - 38.2 ± 3.61 18 3 10 - 31.3 ± 2.84
18 1 12 - 36.4 ± 2.93 18 2 12 - 35.5 ± 3.09
18 3 12 - 36.0 ± 3.27 20 1 6 177.8 ± 4.27 30.4 ± 2.68
20 2 6 175.6 ± 3.84 28.1 ± 2.28 20 3 6 177.2 ± 3.24 27.5 ± 1.60
20 1 8 171.2 ± 4.40 28.7 ± 2.03 20 2 8 176.0 ± 3.08 27.8 ± 1.51
20 3 8 177.8 ± 2.53 27.2 ± 1.63 20 1 10 177.0 ± 2.90 28.8 ± 1.67
20 2 10 190.5 ± 3.10 35.3 ± 1.93 20 3 10 185.8 ± 4.13 33.7 ± 2.16
20 1 12 191.3 ± 3.24 37.7 ± 2.32 20 2 12 189.1 ± 2.69 34.0 ± 1.59
20 3 12 195.3 ± 3.87 39.8 ± 2.44

94
Appendix X. Final replicates, treatment, TL (mm), wet weights (g), and dry weights (g)
for juvenile alligator gar fed 6, 8, 10 or 12% feed based on body mass split evenly among
3 feedings daily for 21 days.
Replicate Feed Percentage TL Wet Weight Dry Weight
1 6 184 29.93 6.66
2 6 166 19.82 4.39
3 6 195 39.56 9.37
4 6 191 36.86 8.46
5 6 172 21.61 4.96
6 6 201 38.15 8.75
7 6 179 26.35 5.90
8 6 156 13.32 2.92
9 6 175 24.87 5.88
10 6 159 19.93 4.41
11 6 202 39.88 8.76
12 6 187 32.40 6.99
13 6 174 23.61 5.12
14 6 194 33.73 7.43
15 6 181 28.45 6.24
1 8 162 18.60 4.06
2 8 171 25.12 5.63
3 8 179 30.22 6.97
4 8 167 18.70 4.00
5 8 166 21.27 4.63
6 8 178 25.70 6.05
7 8 198 43.71 10.05
8 8 151 16.17 3.34
9 8 168 25.39 5.70
10 8 158 19.23 4.08
11 8 185 29.88 6.31
12 8 184 31.20 6.79
13 8 192 36.66 7.95
14 8 174 26.04 5.34
15 8 172 28.32 5.95
1 10 199 40.35 9.63
2 10 181 35.48 8.37
3 10 196 36.69 8.55
4 10 165 21.89 4.98
5 10 181 29.48 6.68
6 10 193 36.94 8.40
7 10 201 46.67 10.91
8 10 175 25.48 5.82
9 10 209 47.11 10.74
10 10 216 53.40 12.61
11 10 205 40.39 8.94
12 10 221 59.46 13.09

95
Replicate Feed Percentage TL Wet Weight Dry Weight
13 10 192 38.57 8.78
14 10 183 31.54 7.09
15 10 195 37.42 7.90
1 12 214 54.77 12.93
2 12 181 32.23 7.45
3 12 168 22.18 4.84
4 12 175 27.92 6.17
5 12 175 26.66 6.20
6 12 195 32.51 7.42
7 12 202 42.09 9.81
8 12 176 25.43 5.92
9 12 179 26.22 5.98
10 12 178 23.86 5.38
11 12 193 37.19 8.12
12 12 201 41.6 9.08
13 12 184 32.37 7.02
14 12 194 35.41 7.72
15 12 208 34.08 10.00

96
BIOGRAPHICAL SKETCH
Timothy Allen Clay was born on 4 July 1982, in the District of Columbia. Tim
graduated from Long Reach High School in May of 2000. Tim furthered his education at
the University of Maryland Baltimore County by earning a Bachelors of Science degree
in Biology in December of 2004. Upon graduating from UMBC Tim worked a multitude
of different wildlife jobs. In the winter of 2008 Tim enrolled in the graduate program in
Marine and Environmental Biology at Nicholls State University. Tim conducted research
through the Bayousphere towards the aquaculture of alligator gar Atractosteus spatula.
At Nicholls State University Tim was a research assistant and manager for the
Bayousphere laboratory. After graduation in December 2009, Tim plans to pursue
further research and education through a Ph.D. position.

97
CURRICULUM VITAE
Timothy Allen Clay
Graduate Student
Nicholls State University
105 Victory St.
Thibodaux, LA 70301
443-996-9683
EDUCATION
M.S. Candidate, Marine and Environmental Biology, Nicholls State University,
Thibodaux, LA, 2008. Thesis – Growth, survival, and cannibalism rates of
alligator gar Atractosteus spatula in recirculating aquaculture systems. Expected
completion in December 2009.
Non-Degree seeking graduate student, Towson University, Towson, MD, 2006
B.S., Biology, University of Maryland Baltimore County, Catonsville, MD, 2004
TEACHING EXPERIENCE
Teaching Assistant for 404-Ecology, Fall of 2009
Teaching Assistant for 480-Honors Humanities – Studies Abroad II in Costa Rica,
December 2008
EXPERIENCE
Masters Student, Nicholls State University, January 2008 – Present
Conducted research focused on developing culture techniques for all life stages of
alligator gar. Thesis focused on maximizing efficiency of spawning alligator gar
and the rearing of larvae and juveniles. Research assistantship involved helping
fellow graduate students in their research in the areas of sturgeon plasma
osmolality, oyster recruitment, yellow bass and zebra mussel population
assessment, and spotted gar ageing. Maintained juvenile lake sturgeon,
paddlefish, spotted gar and alligator gar in recirculating systems.

98
Intern, National Wetlands Research Center, USGS, February 2009 – April 2009
Participated for 80hrs in the Amphibian Research and Monitoring Initiative
(ARMI). Through this internship I learned how to recognize the native frogs of
southern Louisiana by call and by sight. We sampled sites at night with a
presence/absence approach throughout the Atchafalaya River basin.
Fisheries Technician, University of Georgia, February 2007 – December 2007
Conducted research on shortnose and atlantic sturgeon in the both the Altamaha
and Ogeechee river systems. Typical duties included the use of gill and drift nets,
radio telemetry, data entry, maintaining boats and repairing fishing equipment.
Developed new methods in the field of sturgeon research to find spawning
grounds of Atlantic and shortnose sturgeon. This job required good physical
condition as well as working in adverse conditions at potentially all hours of the
day. The ability to work on your own or with peers without direct supervision is a
key part of this job.
Animal Keeper, Catoctin Wildlife Preserve and Zoo, March 2006 – August 2006
General care and maintenance of a variety of mammals, large birds and fish.
Duties included preparation of diets, feeding of animals, cleaning of enclosures,
setting up and breaking down of enclosures, administering of medications. Also
provided assistance to a fish hatchery working with koi and goldfish.
Seasonal Fisheries Technician, USGS and USFWS, June 2005 – September 2005
Conducted research on shortnose sturgeon and yellow perch in the Chesapeake
bay. Duties included setting and retrieving gill nets, deploying and retrieving drift
nets, and testing and recording water quality. This job required good physical
condition as well as working in adverse conditions.
Volunteer, National Zoo, September 2002 – August 2004
General care and maintenance of a variety of tropical animals of the Amazon.
Responsibilities included cleaning of enclosures and aquariums, setup and

99
breakdown of enclosures and aquariums, preparation of diets, feeding of animals,
maintaining live food cultures, maintaining breeding populations of amphibians.
PUBLICATIONS
Early Growth and Survival of Larval Alligator Gar Atractosteus spatula Reared on
Artifical Floating Feed With or Without a Live Artemia spp. Supplement. Current status:
Submitted and waiting review to The Journal of the World Aquaculture Society
PROFESSIONAL PRESENTATIONS
2009 Southern Division American Fisheries Society, Oral presentation.
Title – Aquaculture of alligator gar Atractosteus spatula in recirculating systems
Timothy Clay, Mark Suchy, Wendell Lorio, Allyse Ferrara, Quenton Fontenot
and Gary LaFleur
2009 Southern Division American Fisheries Society Annual Spring Meeting, Oral
Presentation.
Title – Effects of salinity on growth and plasma osmolality of juvenile alligator
gar Atractosteus spatula. Mark Suchy, Timothy Clay, Wendell Lorio, Allyse
Ferrara, and Quenton Fontenot
2009 Aquaculture America, Annual Meeting, Poster Presentation.
Title – Aquaculture of alligator gar Atractosteus spatula in recirculating systems.
Timothy Clay, Mark Suchy, Wendell Lorio, Allyse Ferrara, Quenton Fontenot
and Gary LaFleur
2009 Aquaculture America, Annual Meeting, Poster Presentation.
Title – Effects of salinity on growth and plasma osmolality of juvenile alligator
gar Atractosteus spatula. Mark Suchy, Timothy Clay, Wendell Lorio, Allyse
Ferrara, and Quenton Fontenot
2009 Louisiana Academy of Sciences, Oral Presentation.
Title – Aquaculture of alligator gar Atractosteus spatula in recirculating systems.
Timothy Clay, Mark Suchy, Wendell Lorio, Allyse Ferrara, Quenton Fontenot
and Gary LaFleur
2009 Louisiana Academy of Sciences, Oral Presentation.
Title – Effects of salinity on growth and plasma osmolality of juvenile alligator
gar Atractosteus spatula. Mark Suchy, Timothy Clay, Wendell Lorio, Allyse
Ferrara, and Quenton Fontenot
2009 Nicholls State Research Week, Poster Presentation, 2nd
Place in Graduate Student
Competition.

100
Title – Aquaculture of alligator gar Atractosteus spatula in recirculating systems
Timothy Clay, Mark Suchy, Wendell Lorio, Allyse Ferrara, Quenton Fontenot
and Gary LaFleur
2009 Nicholls State Research Week, Poster Presentation.
Title – Effects of salinity on growth and plasma osmolality of juvenile alligator
gar Atractosteus spatula. Mark Suchy, Timothy Clay, Wendell Lorio, Allyse
Ferrara, and Quenton Fontenot