growth trajectory of the early developing brain derived
TRANSCRIPT

Growth trajectory of the early
developing brain derived from
longitudinal MRI/DTI data
Guido Gerig
University of Utah
Scientific Computing and
Imaging (SCI) Institute
Understanding early Development …
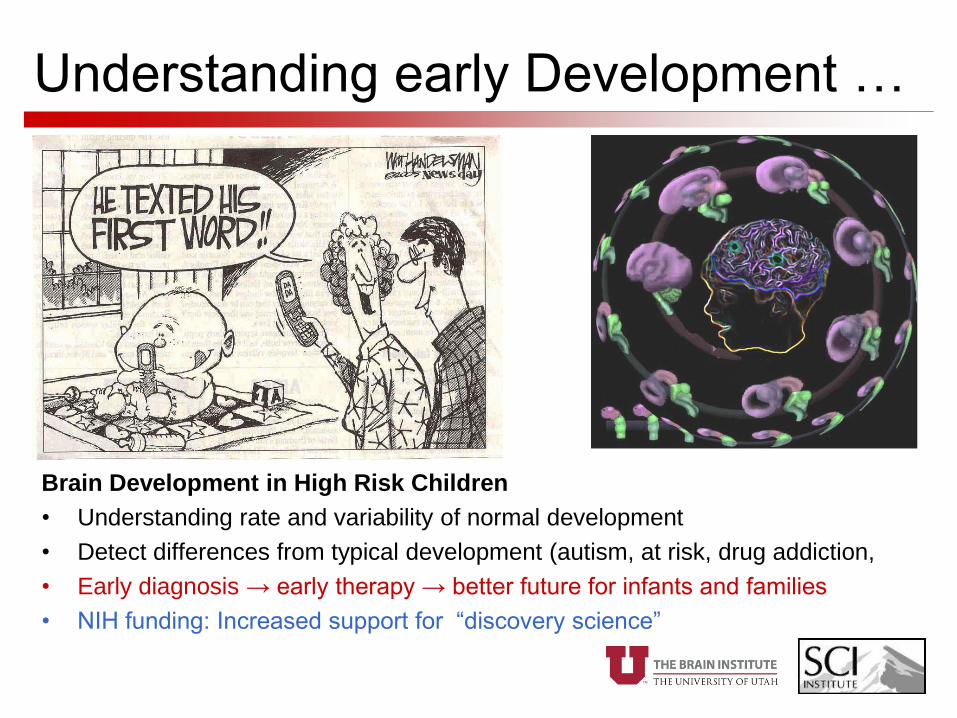
Brain Development in High Risk Children
• Understanding rate and variability of normal development
• Detect differences from typical development (autism, at risk, drug addiction,
• Early diagnosis → early therapy → better future for infants and families
• NIH funding: Increased support for “discovery science”

Neonatal Brain Development in
High Risk Children (J. H.
Gilmore, MD)
• Understanding rate and
variability of normal
development
• Detect differences from typical
development
• Early diagnosis → early
therapy → help familiesOffsprings of cocaine-addicted
mothers
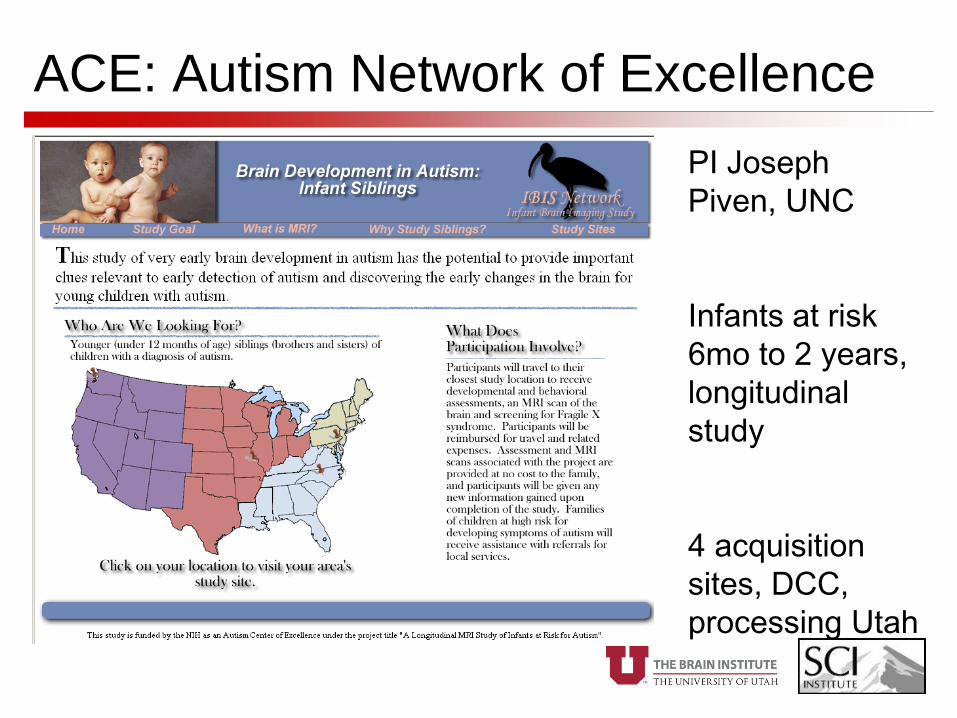
ACE: Autism Network of Excellence
PI Joseph
Piven, UNC
Infants at risk
6mo to 2 years,
longitudinal
study
4 acquisition
sites, DCC,
processing Utah
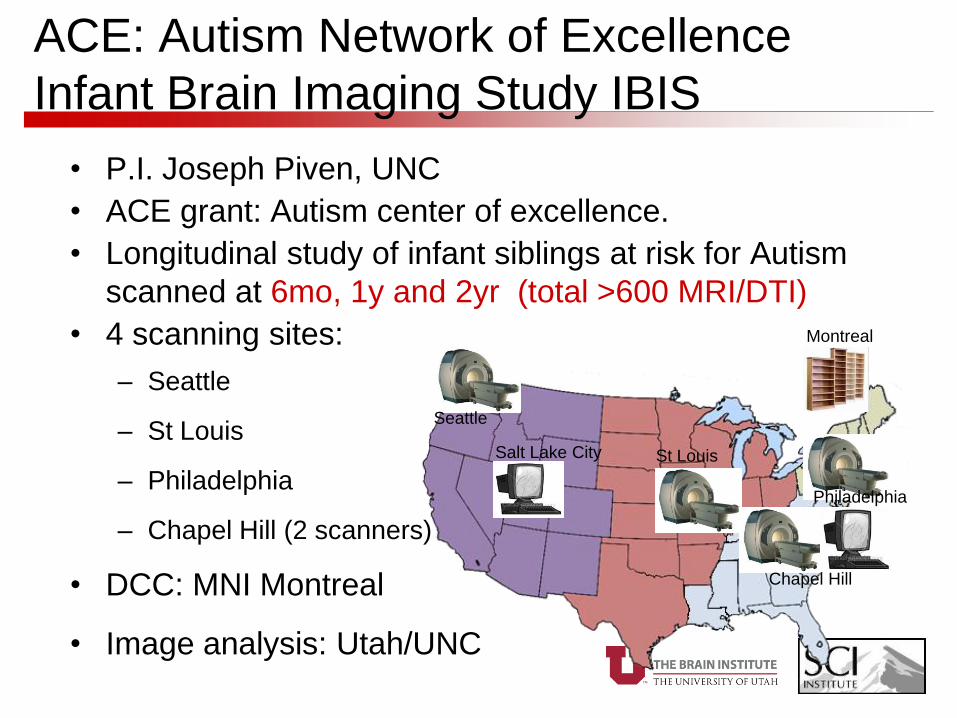
ACE: Autism Network of Excellence
Infant Brain Imaging Study IBIS
• P.I. Joseph Piven, UNC
• ACE grant: Autism center of excellence.
• Longitudinal study of infant siblings at risk for Autism
scanned at 6mo, 1y and 2yr (total >600 MRI/DTI)
• 4 scanning sites:
– Seattle
– St Louis
– Philadelphia
– Chapel Hill (2 scanners)
• DCC: MNI Montreal
• Image analysis: Utah/UNC
Chapel Hill
Philadelphia
Montreal
St LouisSalt Lake City
Seattle
Outline
1. Imaging Technology for Pediatric Imaging
2. Analysis of structural MRI
3. Image Registration
4. Population Studies of DTI
5. Results
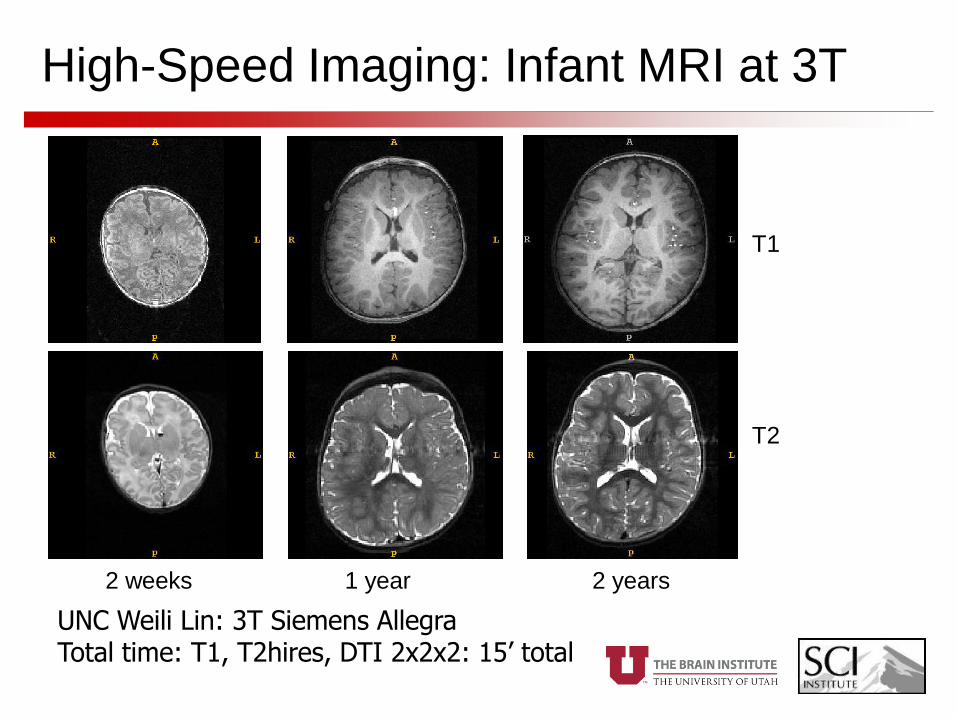
High-Speed Imaging: Infant MRI at 3T
UNC Weili Lin: 3T Siemens AllegraTotal time: T1, T2hires, DTI 2x2x2: 15’ total
2 weeks 1 year 2 years
T1
T2
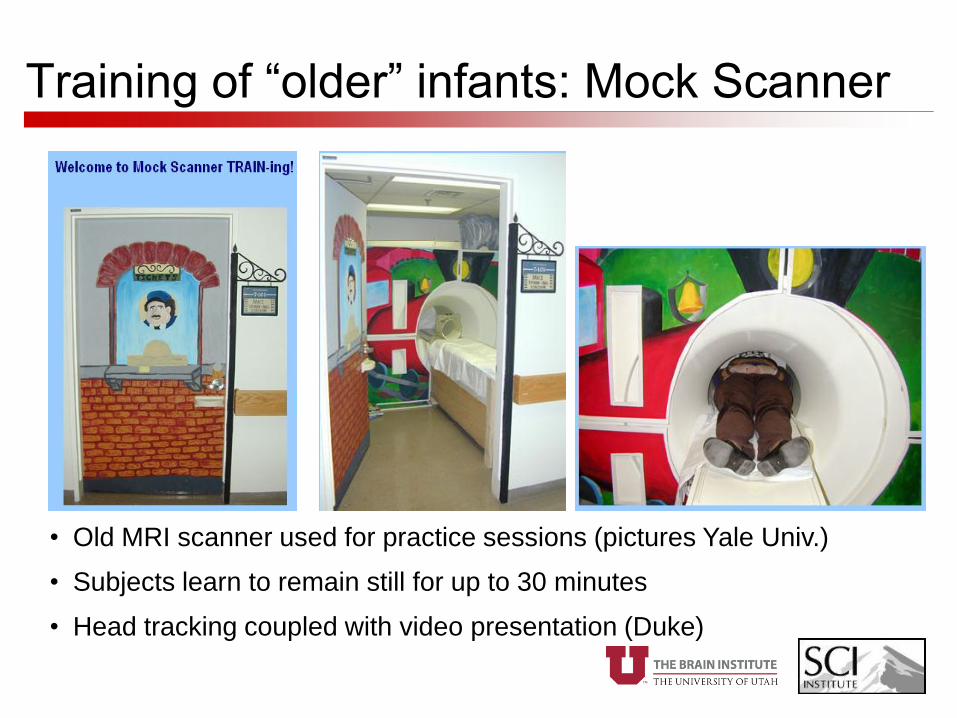
Training of “older” infants: Mock Scanner
• Old MRI scanner used for practice sessions (pictures Yale Univ.)
• Subjects learn to remain still for up to 30 minutes
• Head tracking coupled with video presentation (Duke)
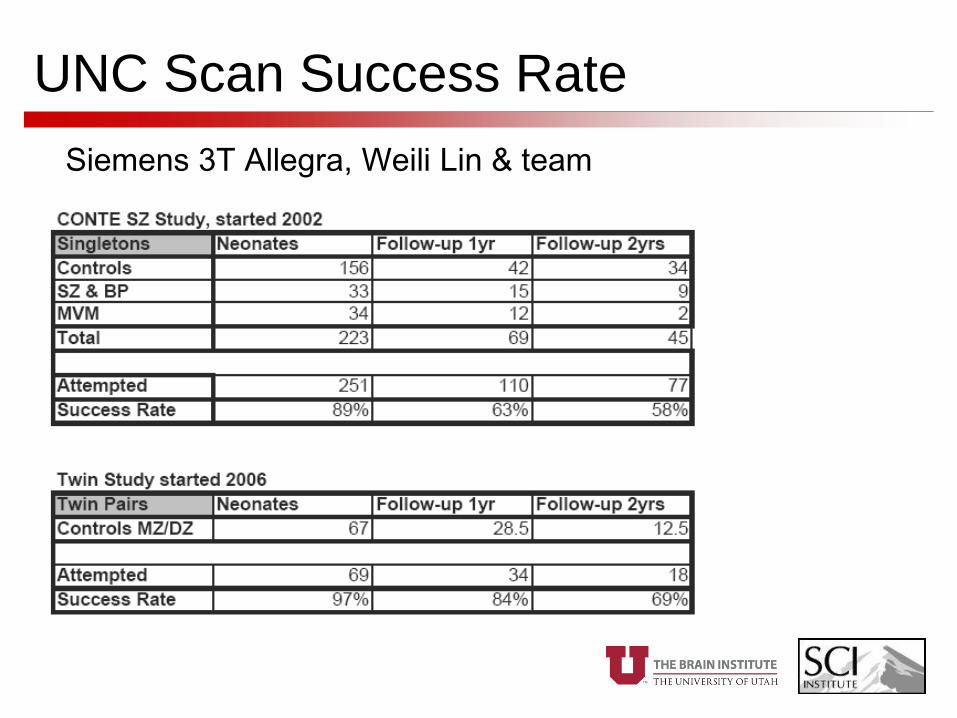
UNC Scan Success Rate
Siemens 3T Allegra, Weili Lin & team
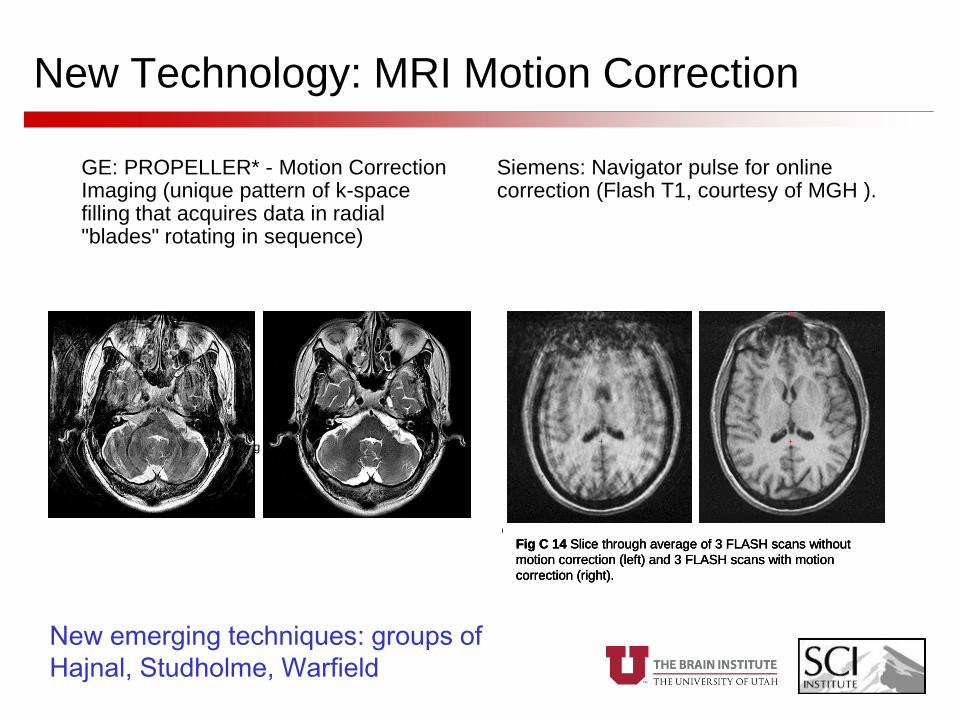
New Technology: MRI Motion Correction
GE: PROPELLER* - Motion Correction Imaging (unique pattern of k-space filling that acquires data in radial "blades" rotating in sequence)
*Periodically Rotated Overlapping Parallel Lines with Enhanced Reconstruction
Siemens: Navigator pulse for online correction (Flash T1, courtesy of MGH ).
Fig. C. 13 Example slice through uncorrected (left) and corrected (right)
FLASH scans collected while subject performed comparable head
movements during both scans.
Fig C 14 Slice through average of 3 FLASH scans without
motion correction (left) and 3 FLASH scans with motion
correction (right).
Fig. C. 13 Example slice through uncorrected (left) and corrected (right)
FLASH scans collected while subject performed comparable head
movements during both scans.
Fig. C. 13 Example slice through uncorrected (left) and corrected (right)
FLASH scans collected while subject performed comparable head
movements during both scans.
Fig C 14 Slice through average of 3 FLASH scans without
motion correction (left) and 3 FLASH scans with motion
correction (right).
Fig C 14 Slice through average of 3 FLASH scans without
motion correction (left) and 3 FLASH scans with motion
correction (right).
New emerging techniques: groups of
Hajnal, Studholme, Warfield
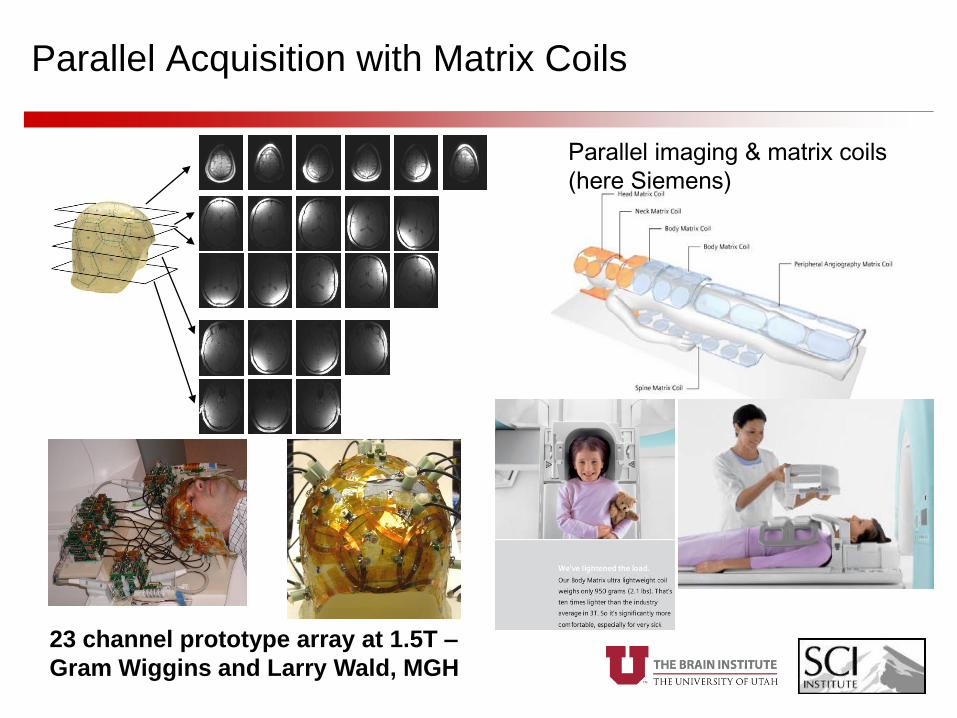
Parallel Acquisition with Matrix Coils
23 channel prototype array at 1.5T –
Gram Wiggins and Larry Wald, MGH
Parallel imaging & matrix coils
(here Siemens)
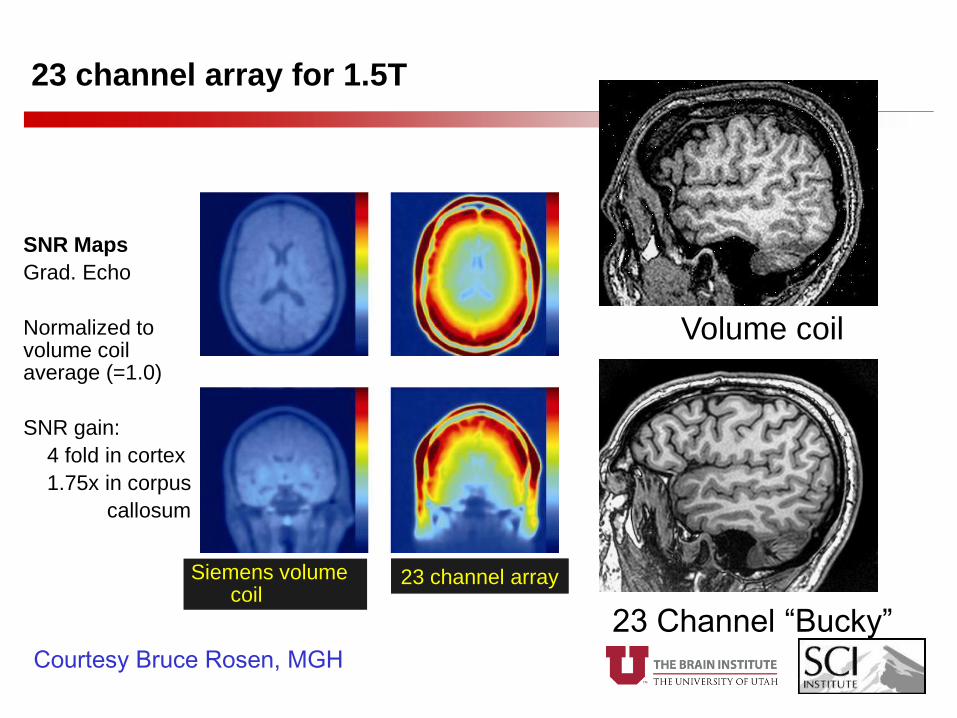
Siemens volume coil
23 channel array
SNR Maps
Grad. Echo
Normalized to volume coil average (=1.0)
SNR gain:
4 fold in cortex
1.75x in corpus
callosum
23 channel array for 1.5T
Volume coil
23 Channel “Bucky”Courtesy Bruce Rosen, MGH
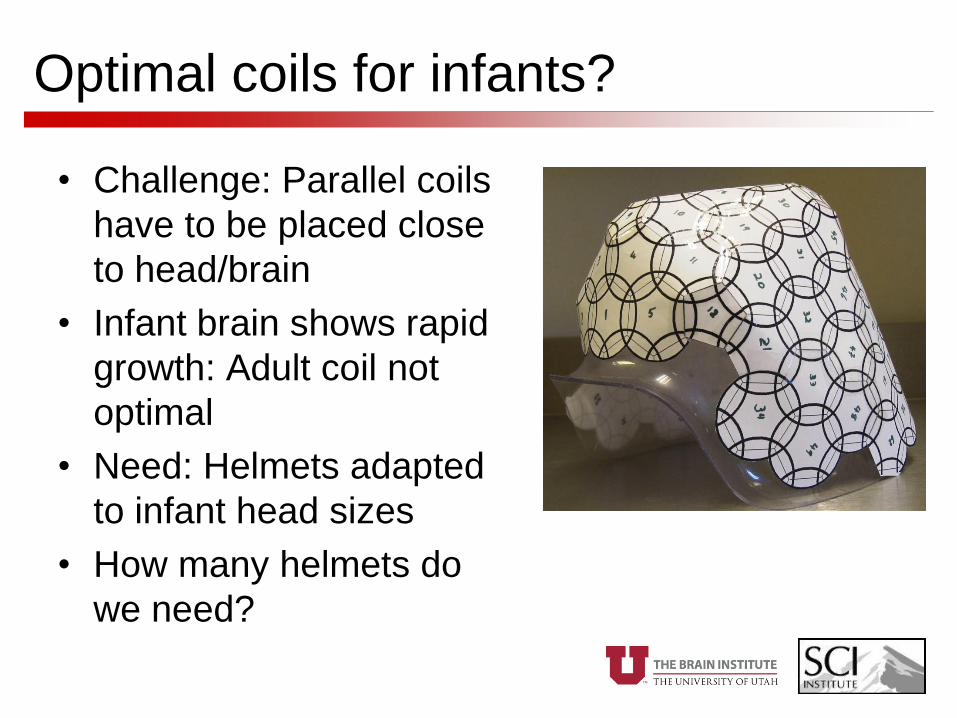
Optimal coils for infants?
• Challenge: Parallel coils
have to be placed close
to head/brain
• Infant brain shows rapid
growth: Adult coil not
optimal
• Need: Helmets adapted
to infant head sizes
• How many helmets do
we need?
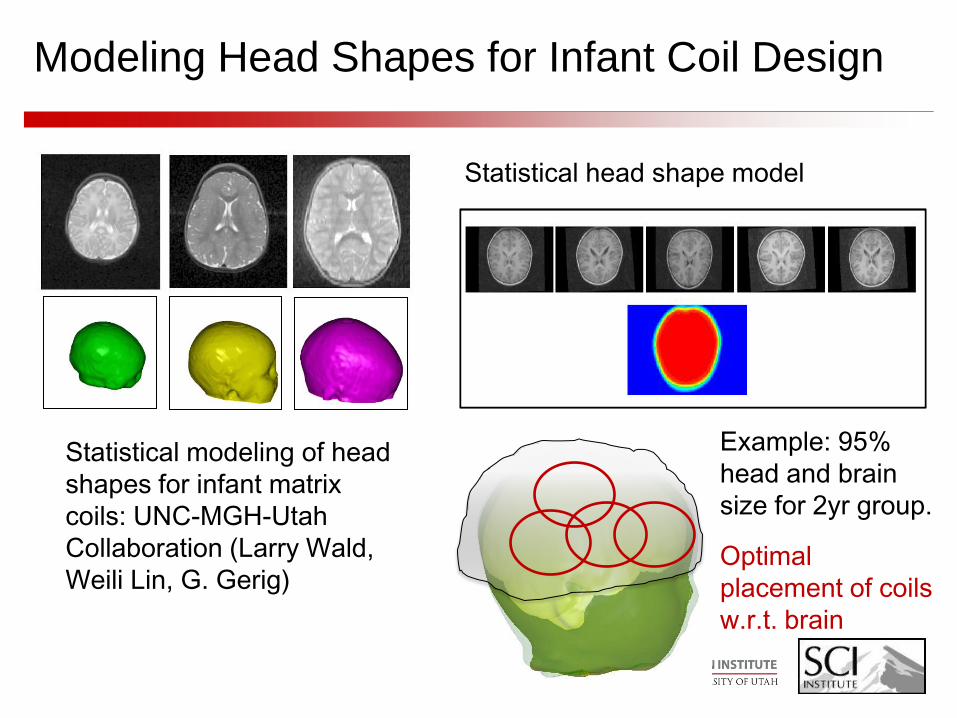
Modeling Head Shapes for Infant Coil Design
Fig. C10: Concept of generation of statistical head shape models:
The left figure shows a selection of MRIs of 2years old children
aligned by rigid body registration and the integrated volumetric
head shape model. 10 images of 2yrs and 4yrs old children were
used in this preliminary test. The right figure shows the head
model as the 90% percentile, with the head model for the 2years
old group (green) overlaid with the model for the 4yrs old group
(gray shadow). The brain structure of the 2yrs old group is
embedded to illustrate the use of the combined head and brain
models.
Fig. C11: Head growth illustrated by axial MRI and
3D head models obtained from individual subjects.
The images show a neonate, its 1yr follow-up and
a 2yrs old subject. Please note that all 2D and 3D
images are showing at the correct scale. Please
note the significant growth between neonate and
1yr but also up to 2yrs.
Fig. C10: Concept of generation of statistical head shape models:
The left figure shows a selection of MRIs of 2years old children
aligned by rigid body registration and the integrated volumetric
head shape model. 10 images of 2yrs and 4yrs old children were
used in this preliminary test. The right figure shows the head
model as the 90% percentile, with the head model for the 2years
old group (green) overlaid with the model for the 4yrs old group
(gray shadow). The brain structure of the 2yrs old group is
embedded to illustrate the use of the combined head and brain
models.
Fig. C11: Head growth illustrated by axial MRI and
3D head models obtained from individual subjects.
The images show a neonate, its 1yr follow-up and
a 2yrs old subject. Please note that all 2D and 3D
images are showing at the correct scale. Please
note the significant growth between neonate and
1yr but also up to 2yrs.
Statistical modeling of head
shapes for infant matrix
coils: UNC-MGH-Utah
Collaboration (Larry Wald,
Weili Lin, G. Gerig)
Fig. C10: Concept of generation of statistical head shape models:
The left figure shows a selection of MRIs of 2years old children
aligned by rigid body registration and the integrated volumetric
head shape model. 10 images of 2yrs and 4yrs old children were
used in this preliminary test. The right figure shows the head
model as the 90% percentile, with the head model for the 2years
old group (green) overlaid with the model for the 4yrs old group
(gray shadow). The brain structure of the 2yrs old group is
embedded to illustrate the use of the combined head and brain
models.
Fig. C11: Head growth illustrated by axial MRI and
3D head models obtained from individual subjects.
The images show a neonate, its 1yr follow-up and
a 2yrs old subject. Please note that all 2D and 3D
images are showing at the correct scale. Please
note the significant growth between neonate and
1yr but also up to 2yrs.
Fig. C10: Concept of generation of statistical head shape models:
The left figure shows a selection of MRIs of 2years old children
aligned by rigid body registration and the integrated volumetric
head shape model. 10 images of 2yrs and 4yrs old children were
used in this preliminary test. The right figure shows the head
model as the 90% percentile, with the head model for the 2years
old group (green) overlaid with the model for the 4yrs old group
(gray shadow). The brain structure of the 2yrs old group is
embedded to illustrate the use of the combined head and brain
models.
Fig. C11: Head growth illustrated by axial MRI and
3D head models obtained from individual subjects.
The images show a neonate, its 1yr follow-up and
a 2yrs old subject. Please note that all 2D and 3D
images are showing at the correct scale. Please
note the significant growth between neonate and
1yr but also up to 2yrs.
Fig. C10: Concept of generation of statistical head shape models:
The left figure shows a selection of MRIs of 2years old children
aligned by rigid body registration and the integrated volumetric
head shape model. 10 images of 2yrs and 4yrs old children were
used in this preliminary test. The right figure shows the head
model as the 90% percentile, with the head model for the 2years
old group (green) overlaid with the model for the 4yrs old group
(gray shadow). The brain structure of the 2yrs old group is
embedded to illustrate the use of the combined head and brain
models.
Fig. C11: Head growth illustrated by axial MRI and
3D head models obtained from individual subjects.
The images show a neonate, its 1yr follow-up and
a 2yrs old subject. Please note that all 2D and 3D
images are showing at the correct scale. Please
note the significant growth between neonate and
1yr but also up to 2yrs.
Example: 95%
head and brain
size for 2yr group.
Statistical head shape model
Optimal
placement of coils
w.r.t. brain
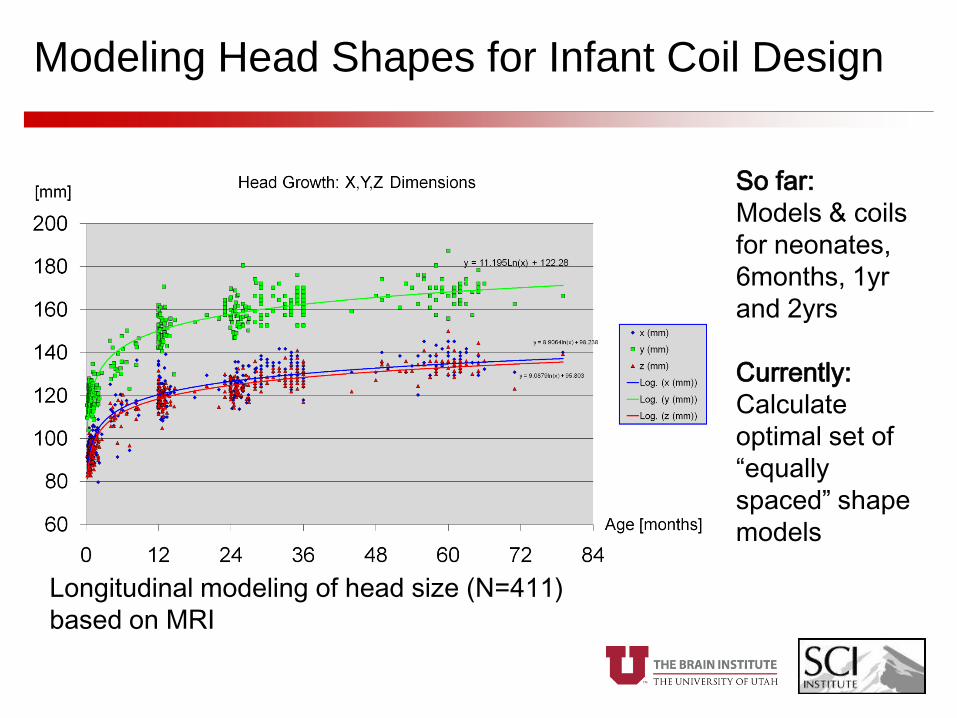
Modeling Head Shapes for Infant Coil Design
So far:
Models & coils
for neonates,
6months, 1yr
and 2yrs
Currently:
Calculate
optimal set of
“equally
spaced” shape
models
Longitudinal modeling of head size (N=411)
based on MRI
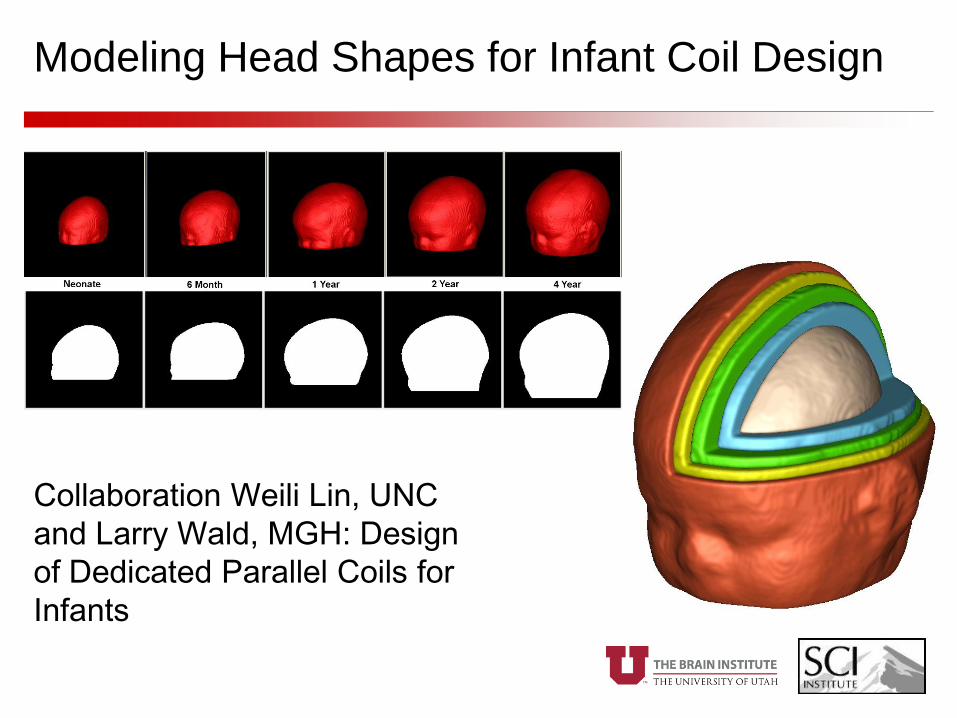
Modeling Head Shapes for Infant Coil Design
Collaboration Weili Lin, UNC
and Larry Wald, MGH: Design
of Dedicated Parallel Coils for
Infants
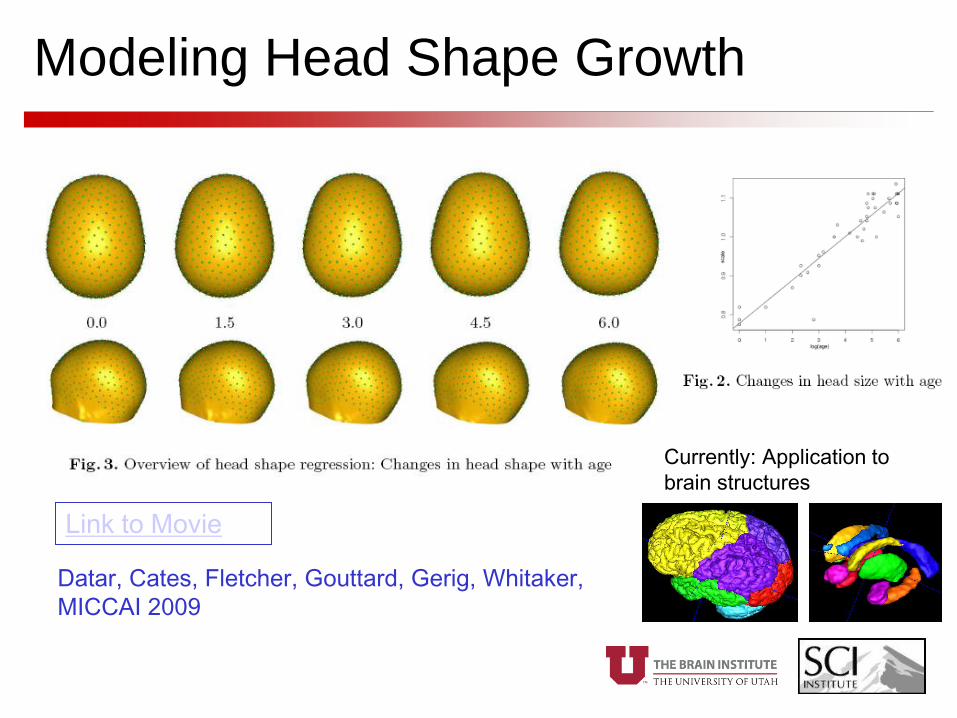
Modeling Head Shape Growth
Link to Movie
Datar, Cates, Fletcher, Gouttard, Gerig, Whitaker,
MICCAI 2009
Currently: Application to
brain structures
Outline
1. Imaging Technology for Pediatric Imaging
2. Analysis of structural MRI
3. Image Registration
4. Population Studies of DTI
5. Results
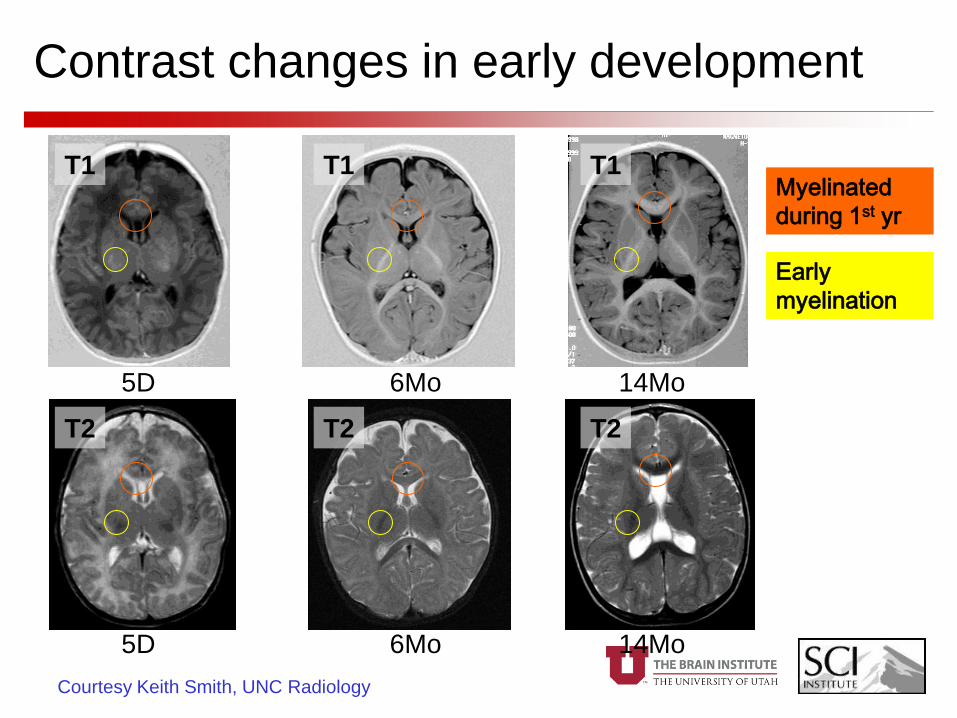
Contrast changes in early development
5D 6Mo 14Mo
Courtesy Keith Smith, UNC Radiology
T1 T1 T1
T2 T2 T2
5D 6Mo 14Mo
Early
myelination
Myelinated
during 1st yr
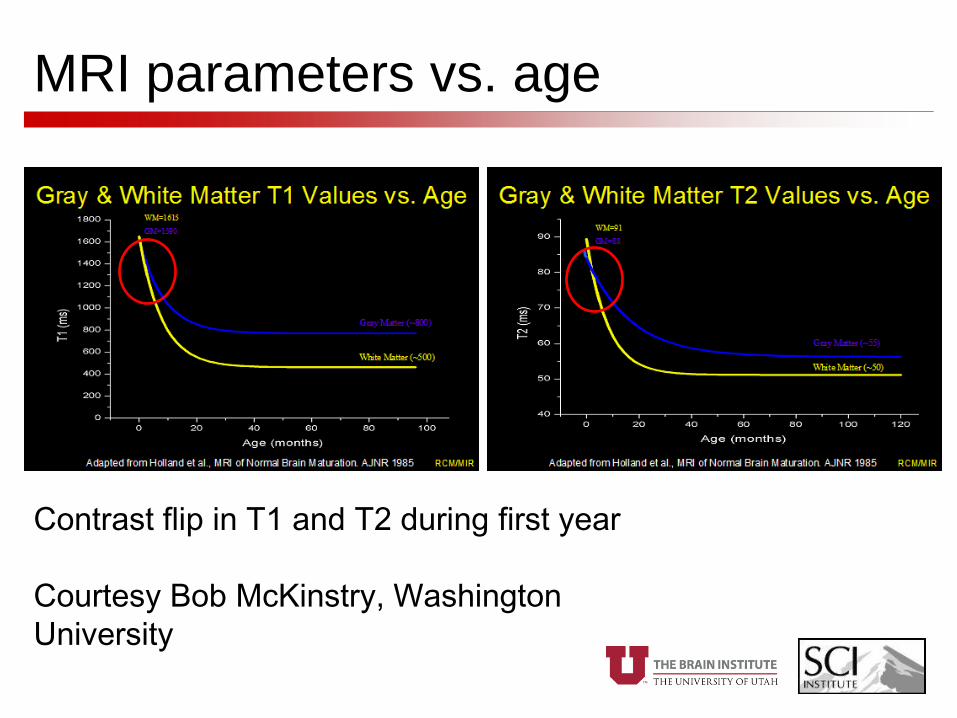
MRI parameters vs. age
Contrast flip in T1 and T2 during first year
Courtesy Bob McKinstry, Washington
University
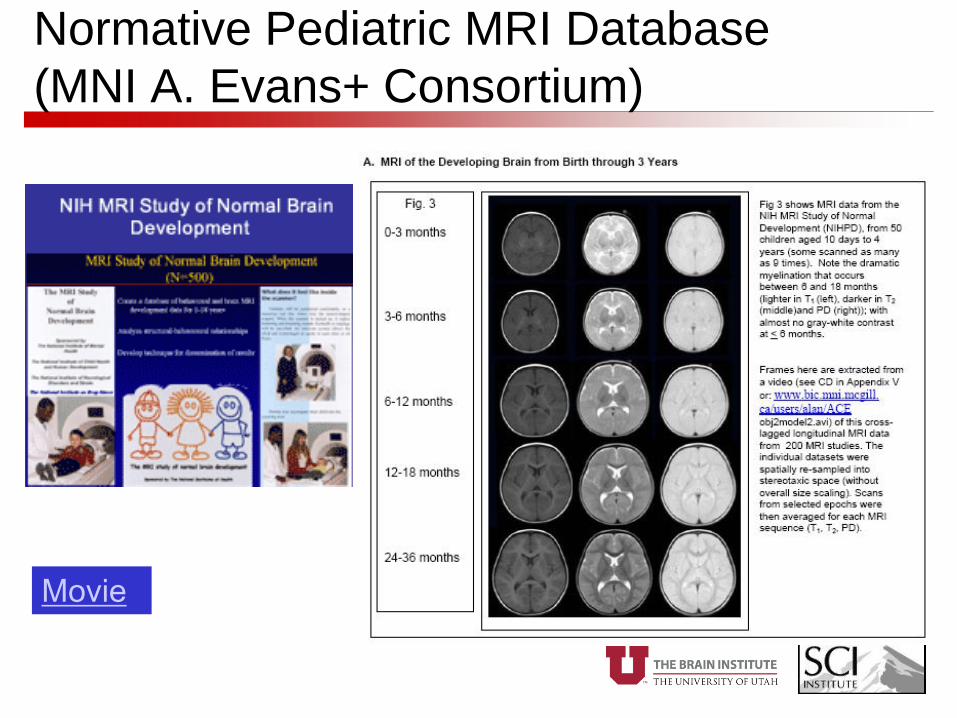
Normative Pediatric MRI Database
(MNI A. Evans+ Consortium)
Movie
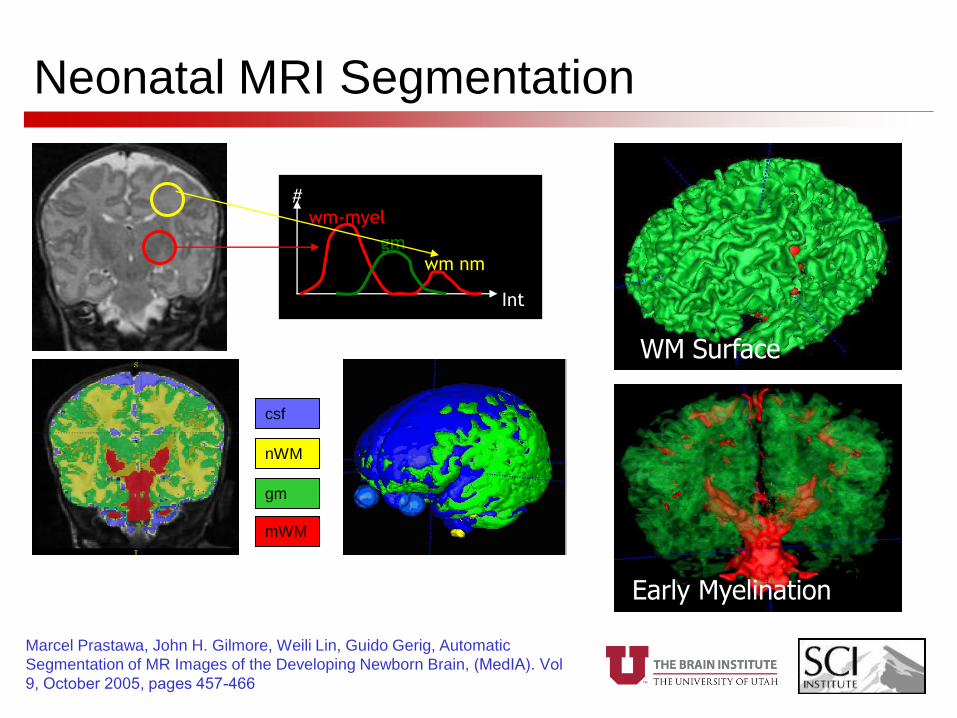
Neonatal MRI Segmentation
Marcel Prastawa, John H. Gilmore, Weili Lin, Guido Gerig, Automatic
Segmentation of MR Images of the Developing Newborn Brain, (MedIA). Vol
9, October 2005, pages 457-466
Early Myelination
gm
mWM
nWM
csf
WM Surface
gm
wm-myel
wm nm
Int
#

4 and 6 month old subjects
Intermediate stage
of contrast flip
between white and
gray, with no
differentiation in
T1w at 4-6 mt and
in T2 at 6-8 mt.
T1 and T2 are not
in sync w.r.t. tissue
contrast
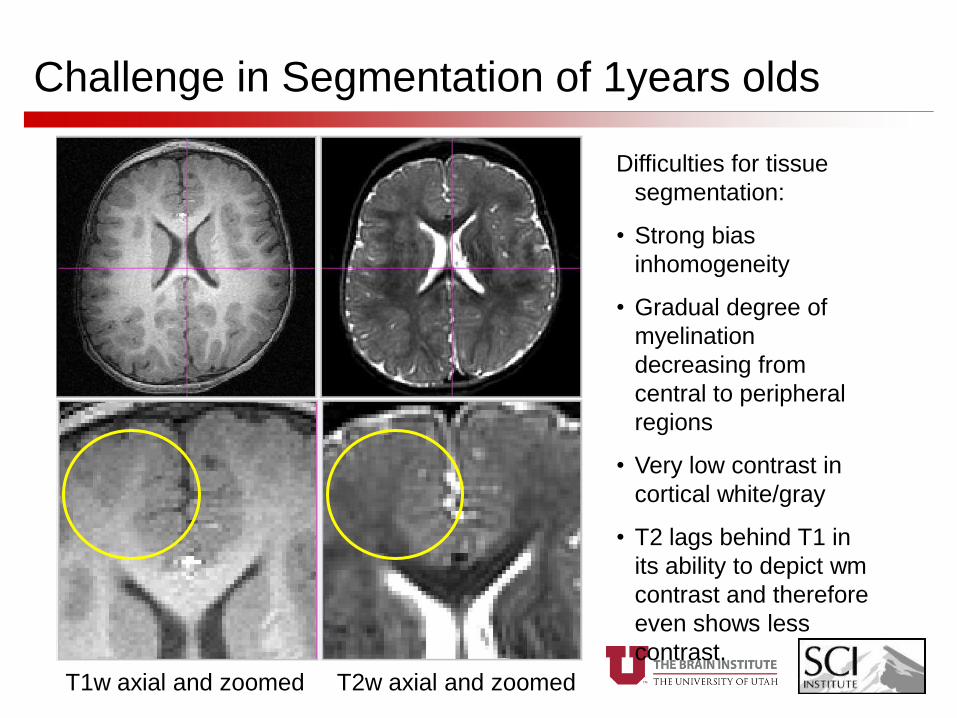
Challenge in Segmentation of 1years olds
Difficulties for tissue
segmentation:
• Strong bias
inhomogeneity
• Gradual degree of
myelination
decreasing from
central to peripheral
regions
• Very low contrast in
cortical white/gray
• T2 lags behind T1 in
its ability to depict wm
contrast and therefore
even shows less
contrast.
T1w axial and zoomed T2w axial and zoomed
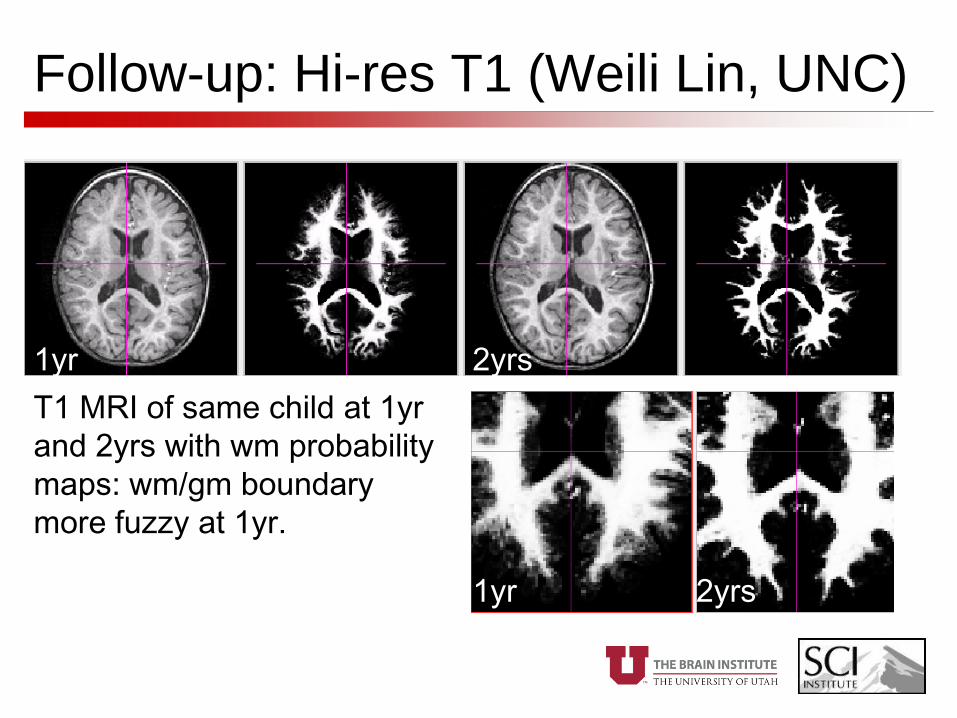
Follow-up: Hi-res T1 (Weili Lin, UNC)
T1 MRI of same child at 1yr
and 2yrs with wm probability
maps: wm/gm boundary
more fuzzy at 1yr.
1yr 2yrs
1yr 2yrs
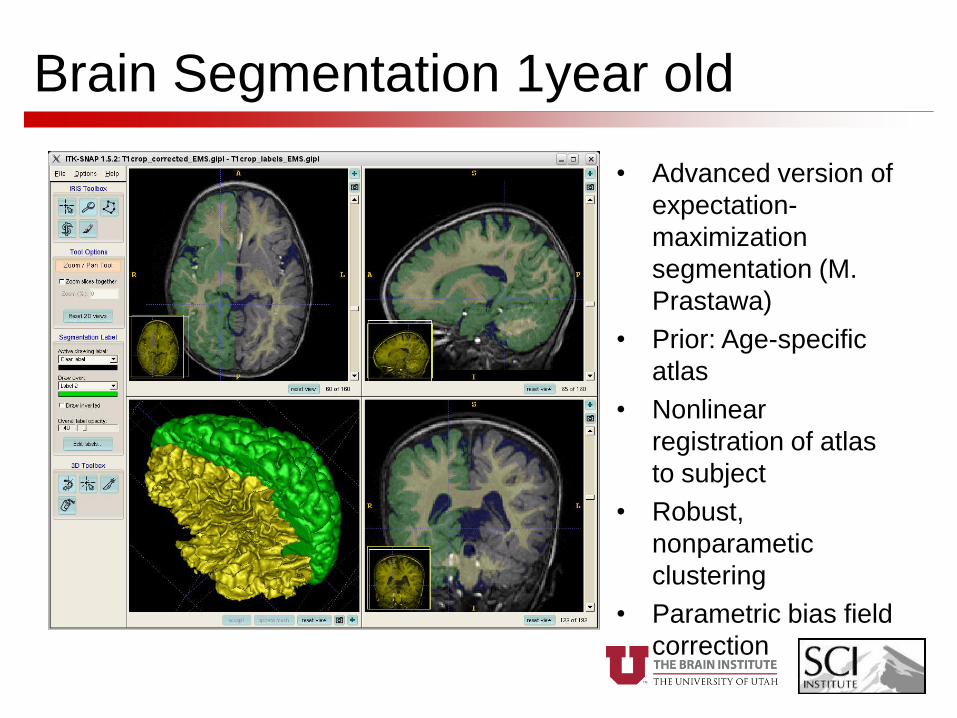
Brain Segmentation 1year old
• Advanced version of
expectation-
maximization
segmentation (M.
Prastawa)
• Prior: Age-specific
atlas
• Nonlinear
registration of atlas
to subject
• Robust,
nonparametic
clustering
• Parametric bias field
correction
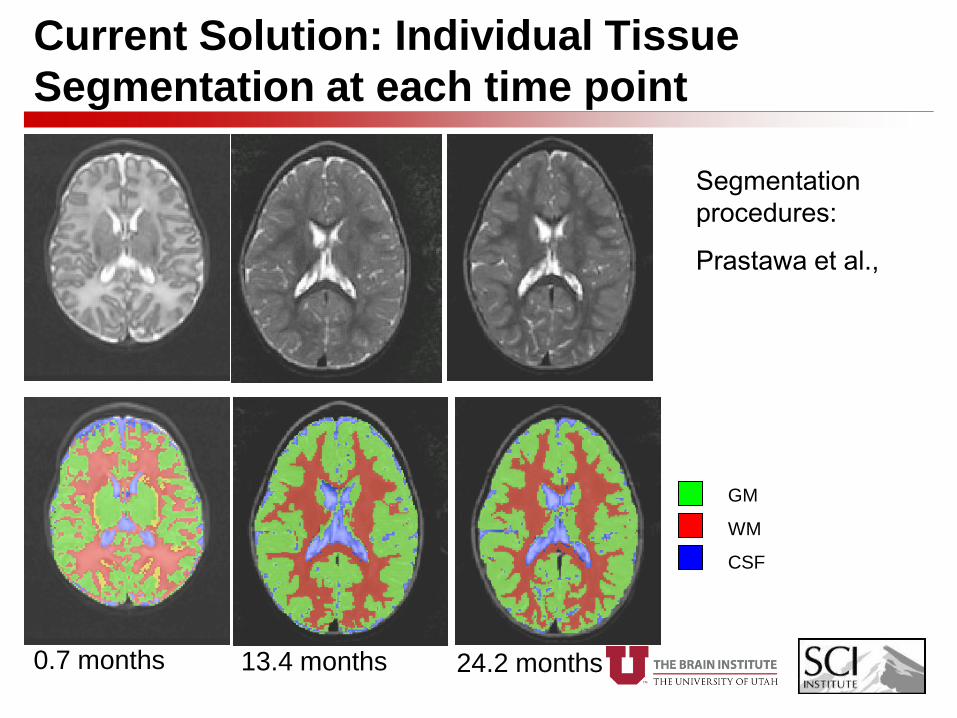
Current Solution: Individual Tissue
Segmentation at each time point
GM
WM
CSF
0.7 months 13.4 months 24.2 months
Segmentation
procedures:
Prastawa et al.,
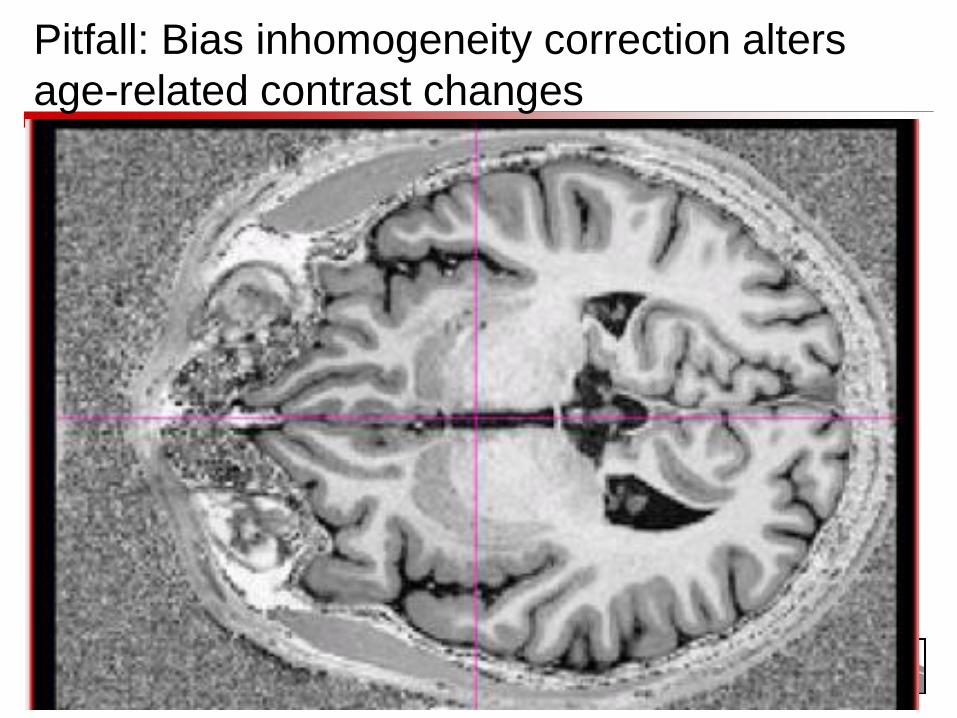
Pitfall: Bias inhomogeneity correction alters
age-related contrast changes
Best Solution: Correction on the scanner, e.g. M2PRAGE (CHUV, Lausanne)
Typical EM segmentation with interleaved tissue segmentation/bias correction.
Outline
1. Imaging Technology for Pediatric Imaging
2. Analysis of structural MRI
3. Image Registration
4. Population Studies of DTI
5. Results

Goal: Analysis of Growth Trajectory
• Stabilize geometry via
nonlinear deformation
• Analyze Contrast Change
neo
1yr
2yr
PD T2 T1
neo
1yr
2yr
PD T2 T1
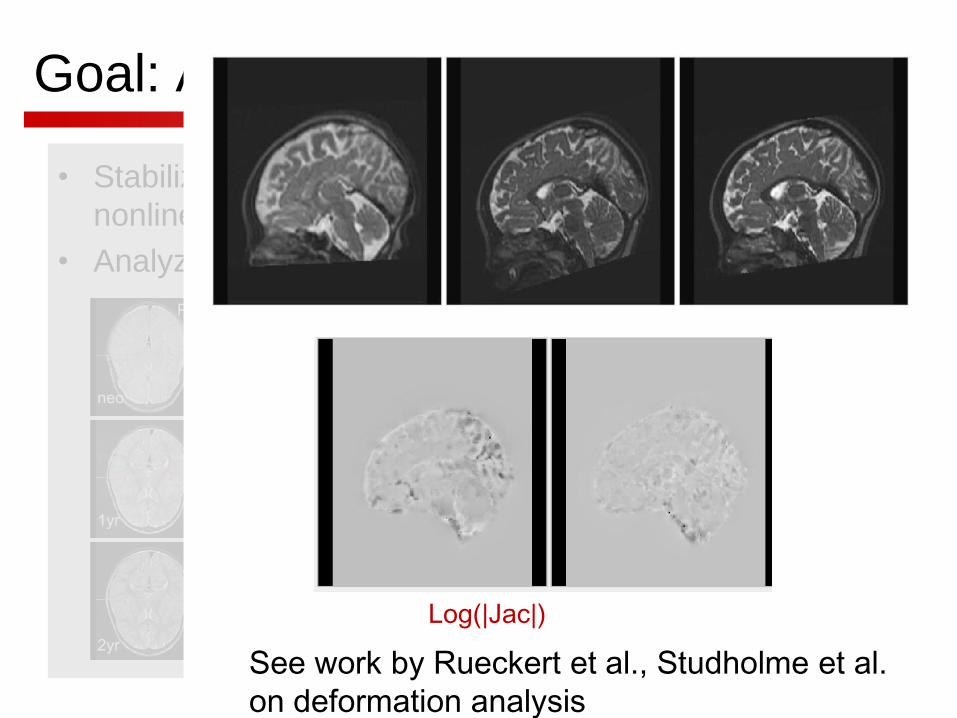
Goal: Analysis of Growth Trajectory
• Stabilize geometry via
nonlinear deformation
• Analyze Contrast Change
• Calculate nonlinear def.
• Analysis of deformation
field
neo
1yr
2yr
PD T2 T1
Log(|Jac|)Log(|Jac|)
See work by Rueckert et al., Studholme et al.
on deformation analysis
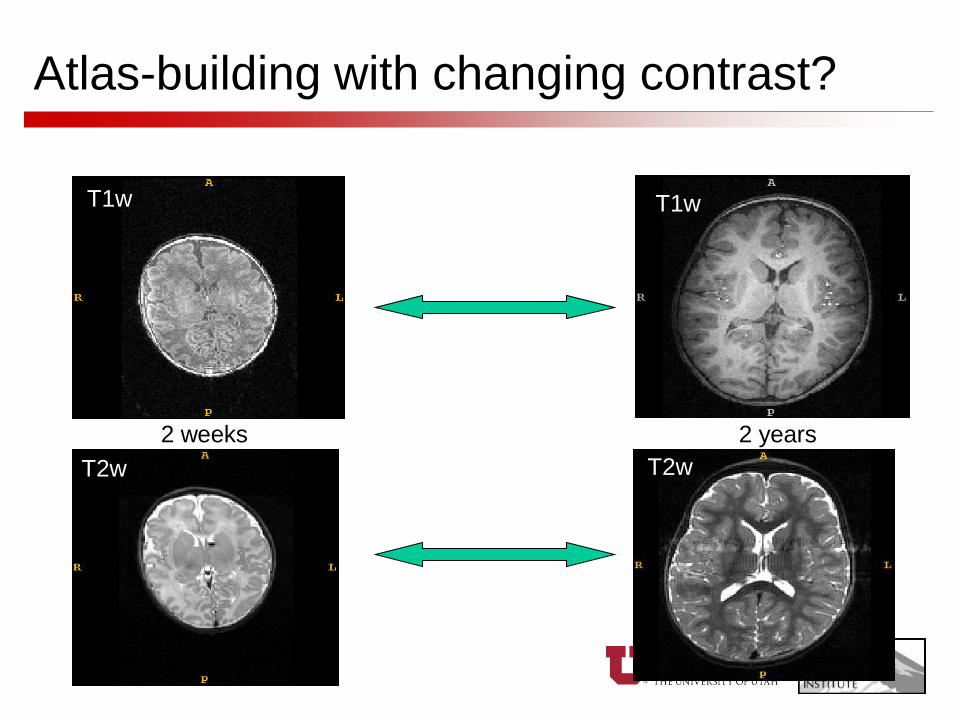
Atlas-building with changing contrast?
2 weeks 2 years
T1w
T2w
T1w
T2w

Image registration with changing
contrast and structures
Direct registration
of multi-channel
MRI: Difficult

Image registration with changing
contrast and structures
Direct registration
of multi-channel
MRI: Difficult
•Registration via sets of tissue probabilities
•Kullback-Leibler Divergence

T1-FLASH
T2
MRA
T1-FLASH
T2
p(wm|I1,…,IN)
p(gm|I1,…,IN)
p(csf|I1,…,IN)
I4
I1
INI2
I3
MRA
T1-FLASH
T2
T1-MPRAGE
MRA
T2
T1-MPRAGE
T2
T1-FLASH
Template Estimation Framework
The template image requires the smallest amount of
transformation energy
T1-FLASH
T2
MRA
T1-FLASHT1-FLASH
T2T2
MRAMRA
T1-FLASH
T2
T1-FLASHT1-FLASH
T2T2
p(wm|I1,…,IN)
p(gm|I1,…,IN)
p(csf|I1,…,IN)
I4
I1
INI2
I3
MRA
T1-FLASH
T2
T1-MPRAGE
MRAMRA
T1-FLASHT1-FLASH
T2T2
T1-MPRAGET1-MPRAGE
MRA
T2
MRAMRA
T2T2
T1-MPRAGE
T2
T1-FLASH
T1-MPRAGET1-MPRAGE
T2T2
T1-FLASHT1-FLASH
Template Estimation Framework
The template image requires the smallest amount of
transformation energy
Five class posteriors each with four class structures
Template Estimation
FinalInitial
•3D class posteriors taken from five
different subject image sets.
•Class posteriors are aligned via affine
transformations.
•Large inter-subject anatomical
variability, especially in the ventricular
system.
•A sharp template estimate is produced
(far right).
Results
Five class posteriors each with four class structures
Template Estimation
FinalInitialFive class posteriors each with four class structuresFive class posteriors each with four class structures
Template Estimation
FinalInitial
Template Estimation
FinalInitial
•3D class posteriors taken from five
different subject image sets.
•Class posteriors are aligned via affine
transformations.
•Large inter-subject anatomical
variability, especially in the ventricular
system.
•A sharp template estimate is produced
(far right).
Results
Peter Lorenzen, Marcel Prastawa, Brad Davis, Guido Gerig, Elizabeth Bullitt, and Sarang
Joshi, Multi-Modal Image Set Registration and Atlas Formation, Medical Image Analysis
MEDIA, Elsevier, 2006
Atlas-building for multi-modality MRI and
images of changing contrast:
Multi-class Posterior Atlas Formation (Lorenzen PhD)
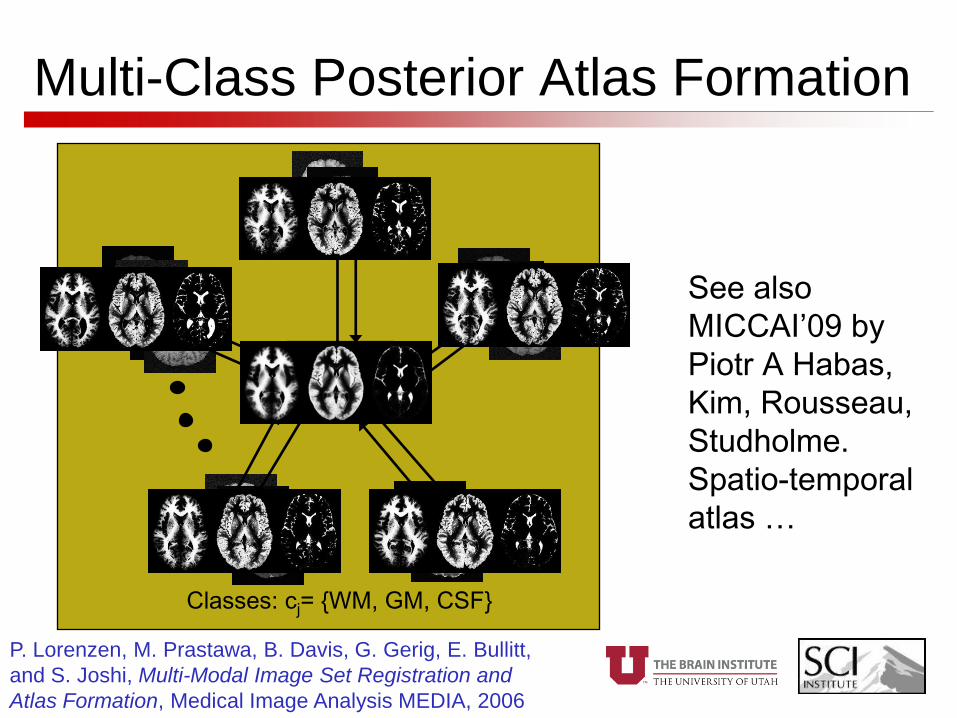
Multi-Class Posterior Atlas Formation
Atlas
p(cj(x)|I1,…,IN)
p(cj(x)|IN)
p(cj(x)|I1)
p(cj(x)|I2)
p(cj(x)|I3)p(cj(x)|I4)
Classes: cj= {WM, GM, CSF}
P. Lorenzen, M. Prastawa, B. Davis, G. Gerig, E. Bullitt,
and S. Joshi, Multi-Modal Image Set Registration and
Atlas Formation, Medical Image Analysis MEDIA, 2006
See also
MICCAI’09 by
Piotr A Habas,
Kim, Rousseau,
Studholme.
Spatio-temporal
atlas …

Outline
1. Imaging Technology for Pediatric Imaging
2. Analysis of structural MRI
3. Image Registration
4. Population Studies of DTI
5. Results

Population-based analysis of fiber tracts
Example: 150 neonate DTI mapped to unbiased atlas
Casey
Goodlett,
Sarang Joshi,
Sylvain
Gouttard,
Guido Gerig,
SCI Utah
(MICCAI’06,
MICCAI’08,
NeuroImage
(in press)
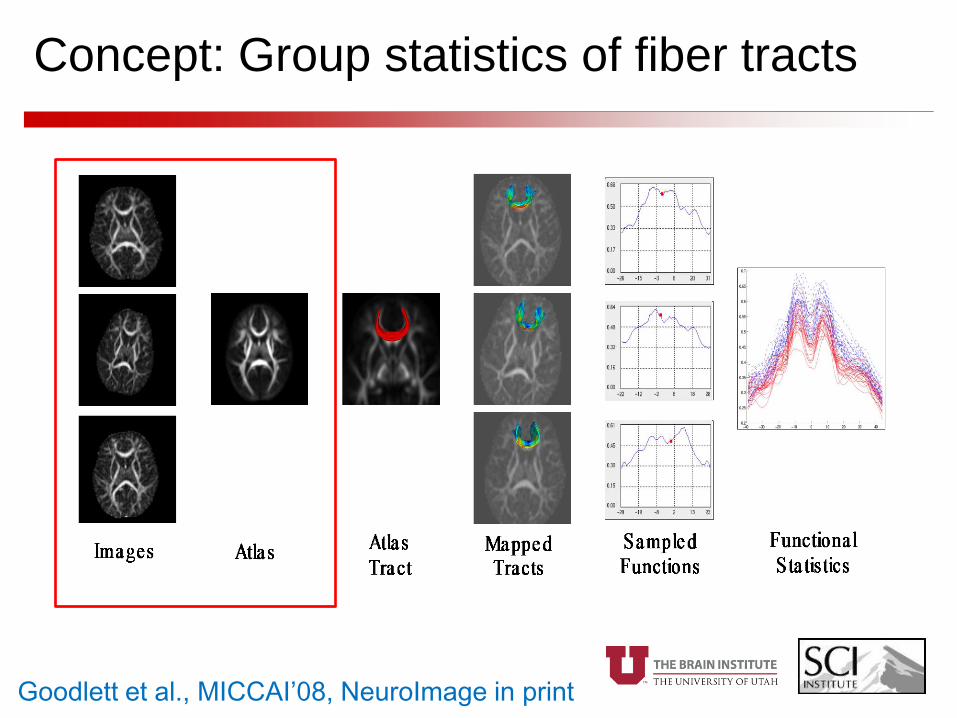
Concept: Group statistics of fiber tracts
Goodlett et al., MICCAI’08, NeuroImage in print
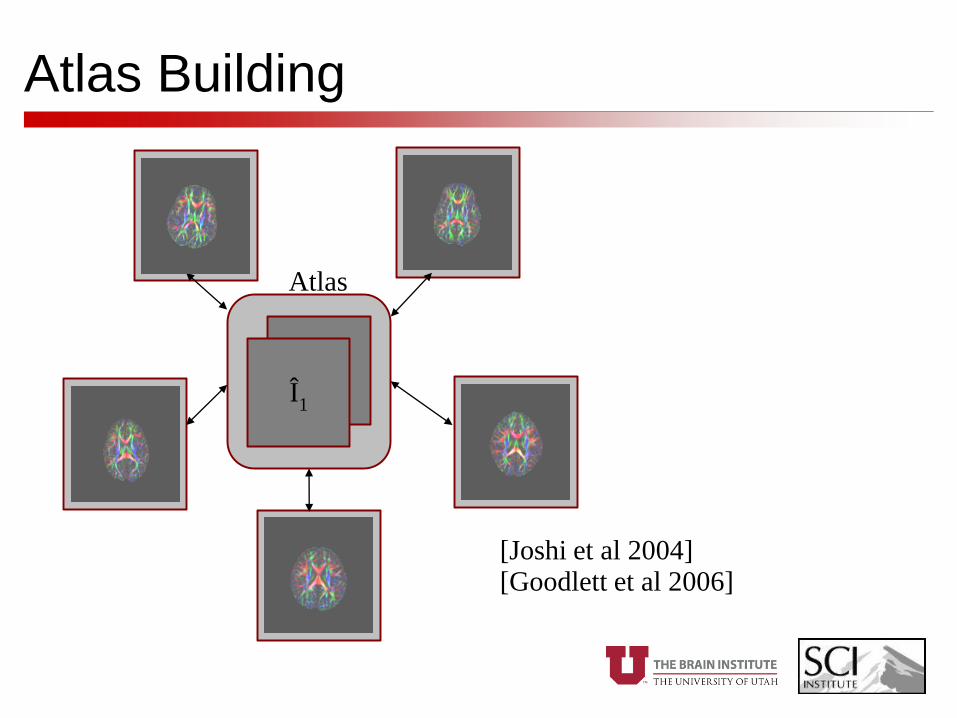
Atlas Building
I1
I5
I2
I3
I4
Î1
Atlas
[Joshi et al 2004] [Goodlett et al 2006]
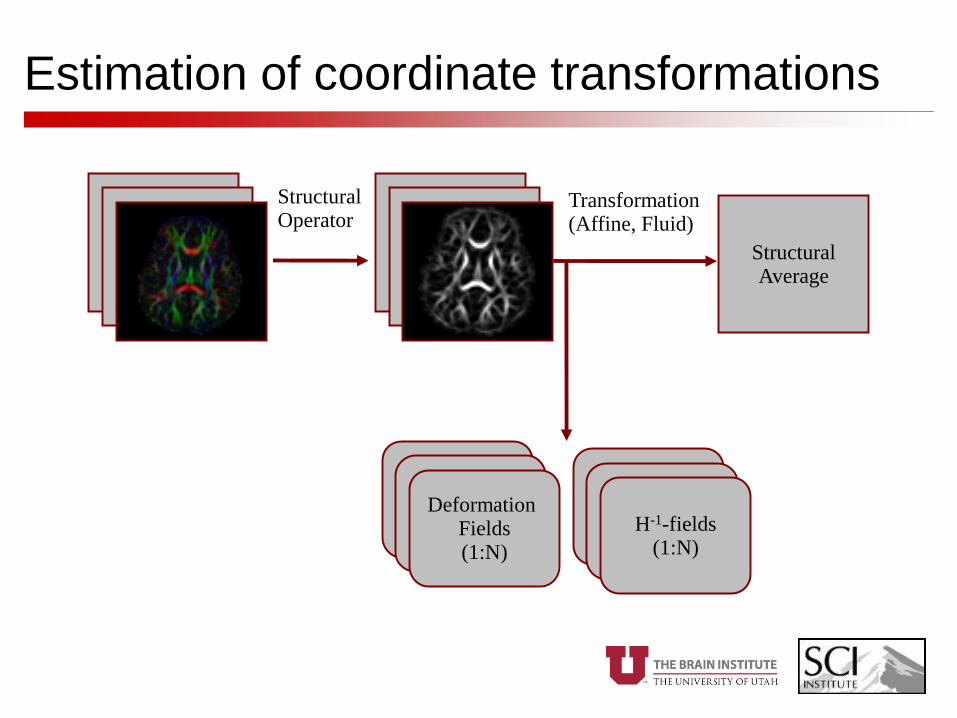
Estimation of coordinate transformations
StructuralAverage
Deformation Fields(1:N)
StructuralOperator
Transformation(Affine, Fluid)
H-1-fields(1:N)

Computation of mean tensor images
DTI Images
TensorAveraging
DTI Atlas
Rotate Tensors based on JH
-1
H-fields(1:N) Riemannian
Symmetric Space
• Reorientation of tensors (Alexander, Jones)
• Interpolation of DWI or tensors (Fletcher, Arsigny, Westin&Kindlman)

Co-registration: From linear to nonlinear
Linear registration (affine) Nonlinear registration (fluid)
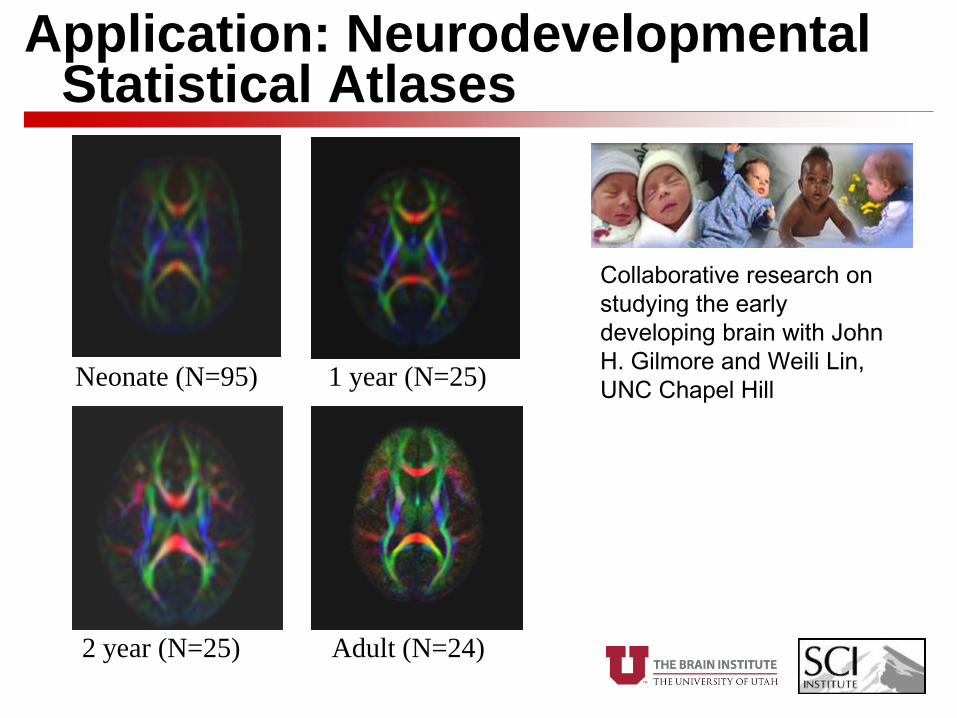
Application: Neurodevelopmental Statistical Atlases
Neonate (N=95) 1 year (N=25)
2 year (N=25) Adult (N=24)
Collaborative research on
studying the early
developing brain with John
H. Gilmore and Weili Lin,
UNC Chapel Hill
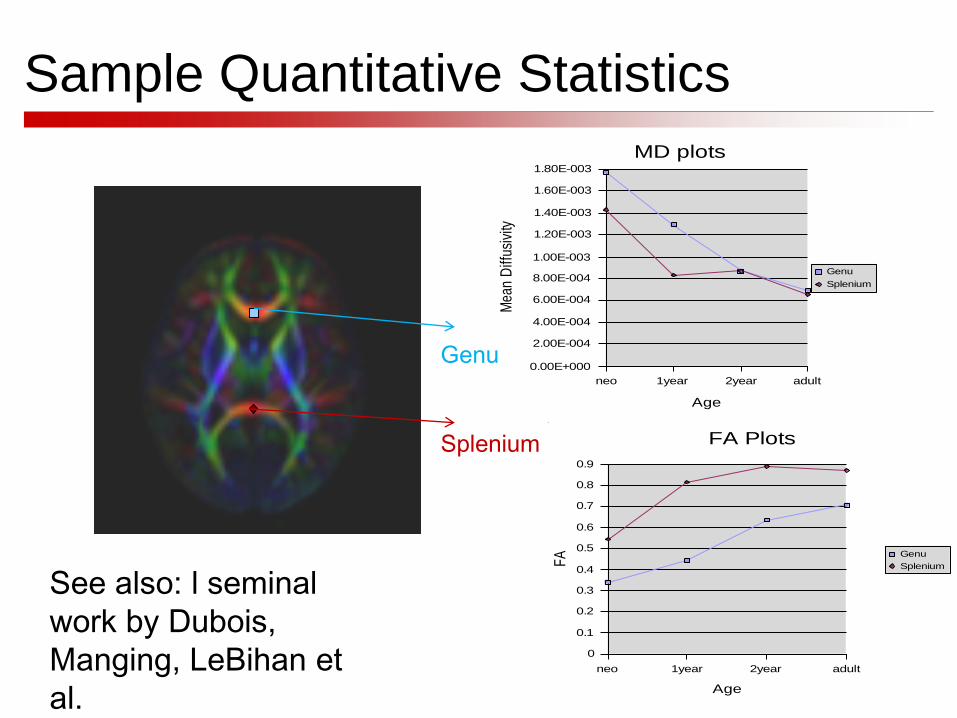
Sample Quantitative Statistics
neo 1year 2year adult
0.00E+000
2.00E-004
4.00E-004
6.00E-004
8.00E-004
1.00E-003
1.20E-003
1.40E-003
1.60E-003
1.80E-003
MD plots
Genu
Splenium
Age
Mea
n D
iffus
ivity
neo 1year 2year adult
0
0.1
0.2
0.3
0.4
0.5
0.6
0.7
0.8
0.9
FA Plots
Genu
Splenium
Age
FA
Genu
Splenium
See also: l seminal
work by Dubois,
Manging, LeBihan et
al.
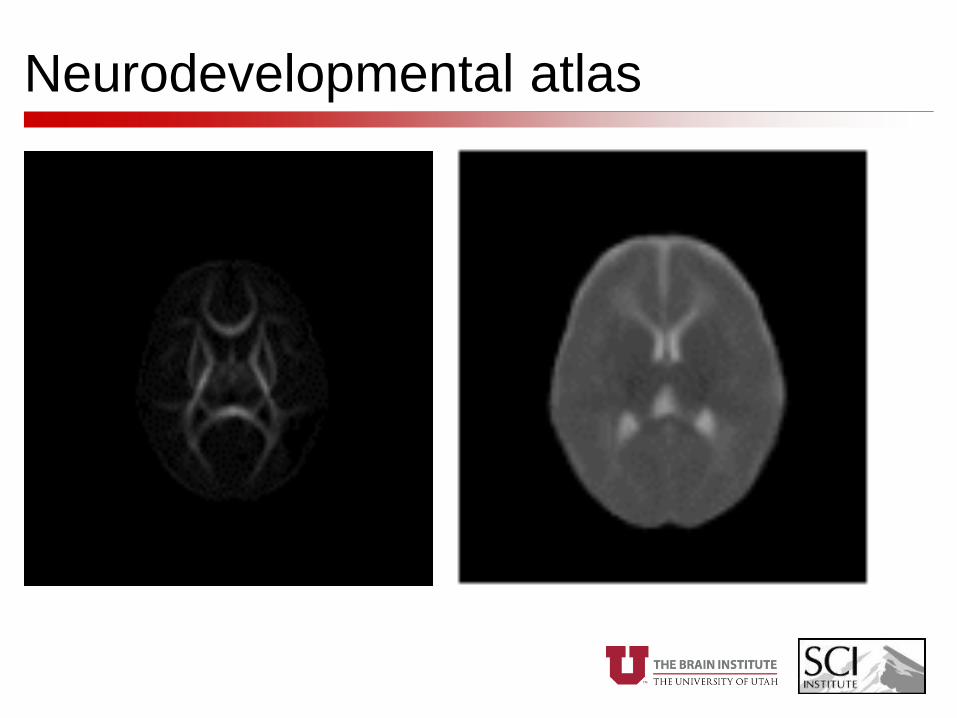
Neurodevelopmental atlas

Neurodevelopment in sMRI and DTI
neonate 1 year 2 years
Structural
MRI shows
contrast flip
due to wm
structuring.
DTI shows
a type of
continuous
maturation
process.
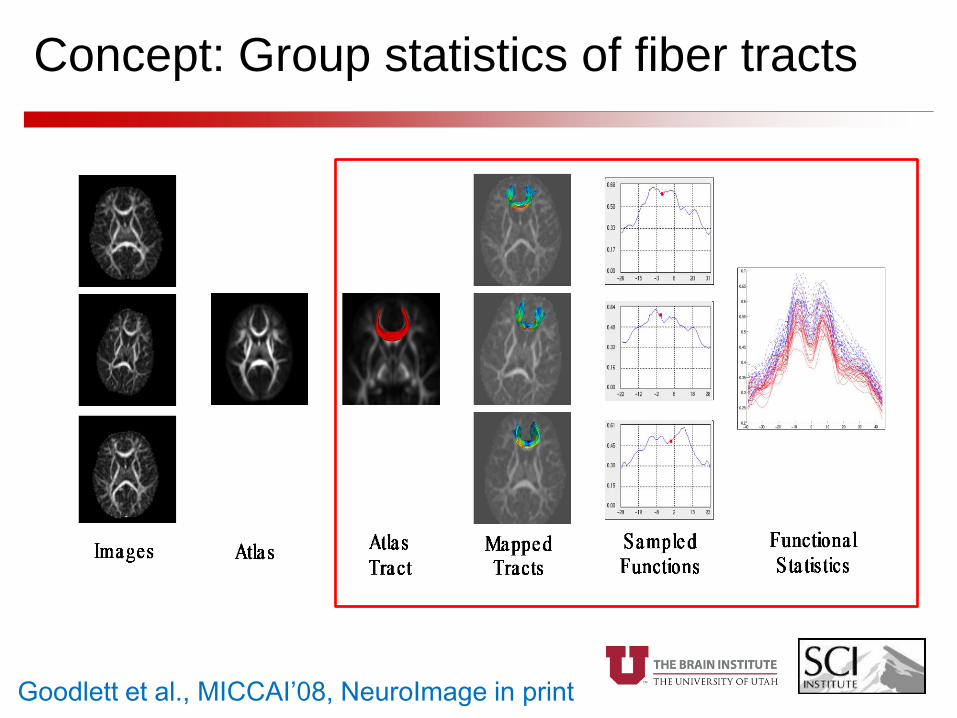
Concept: Group statistics of fiber tracts
Goodlett et al., MICCAI’08, NeuroImage in print
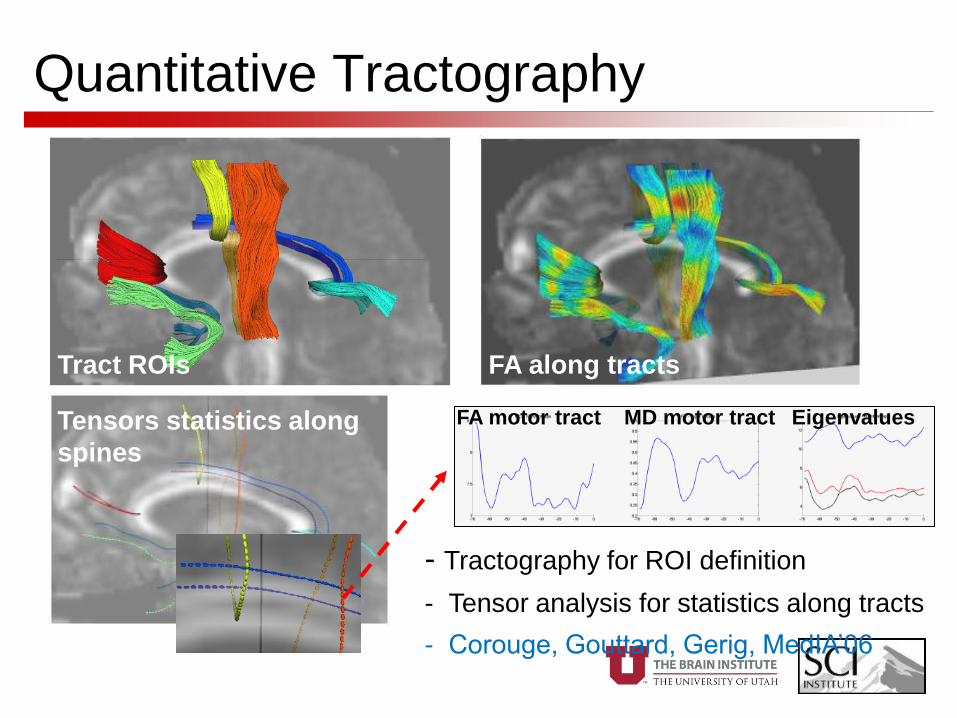
Quantitative Tractography
- Tractography for ROI definition
- Tensor analysis for statistics along tracts
- Corouge, Gouttard, Gerig, MedIA’06
FA along tractsTract ROIs
Tensors statistics along
spines
FA motor tract MD motor tract Eigenvalues

Example Uncinate Fasciculus
Corouge et al. Fiber tract-oriented statistics for quantitative diffusion tensor MRI analysis. Medical Image Analysis 2006.
FiberViewer software - http://www.ia.unc.edu/dev/

Fiber Tractography via Atlases
Neonate atlas DTI 1yr atlas DTI
fornix and uncinate
genu, splenium, motor
uncinate
cingulate
motor tracts
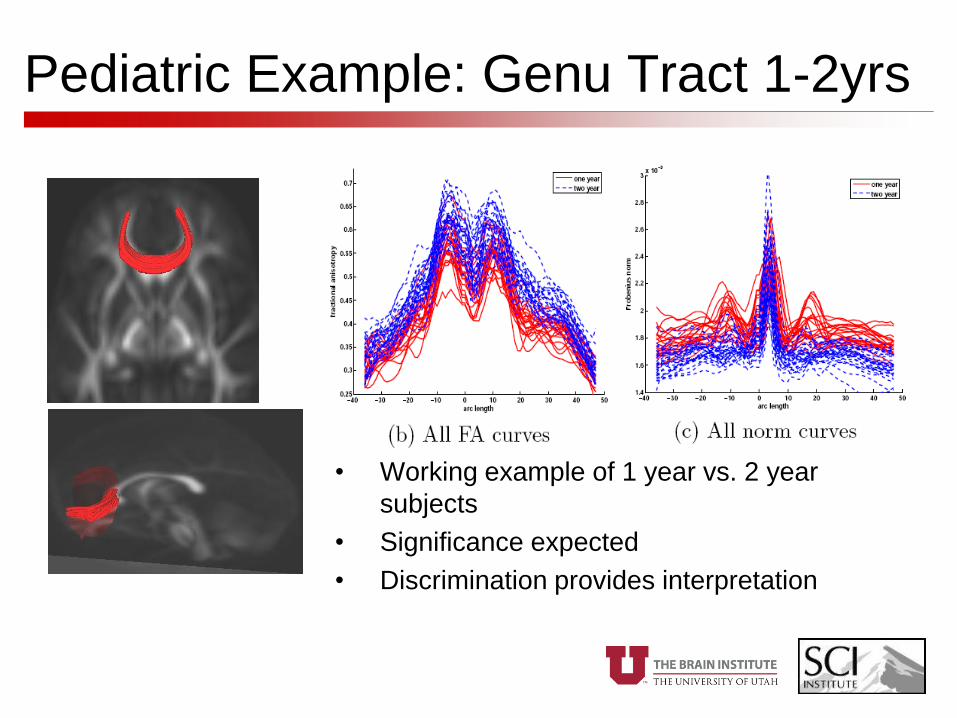
Pediatric Example: Genu Tract 1-2yrs
• Working example of 1 year vs. 2 year
subjects
• Significance expected
• Discrimination provides interpretation

Functional Data Analysis
• Underlying biology of measurements is continuous
• Tract analysis samples from the continuous biology
• Global vs. point-wise statistics
– Smoothing
– Dimensionality Reduction
• Ramsay and Silverman 2002
• Functional Statistics:
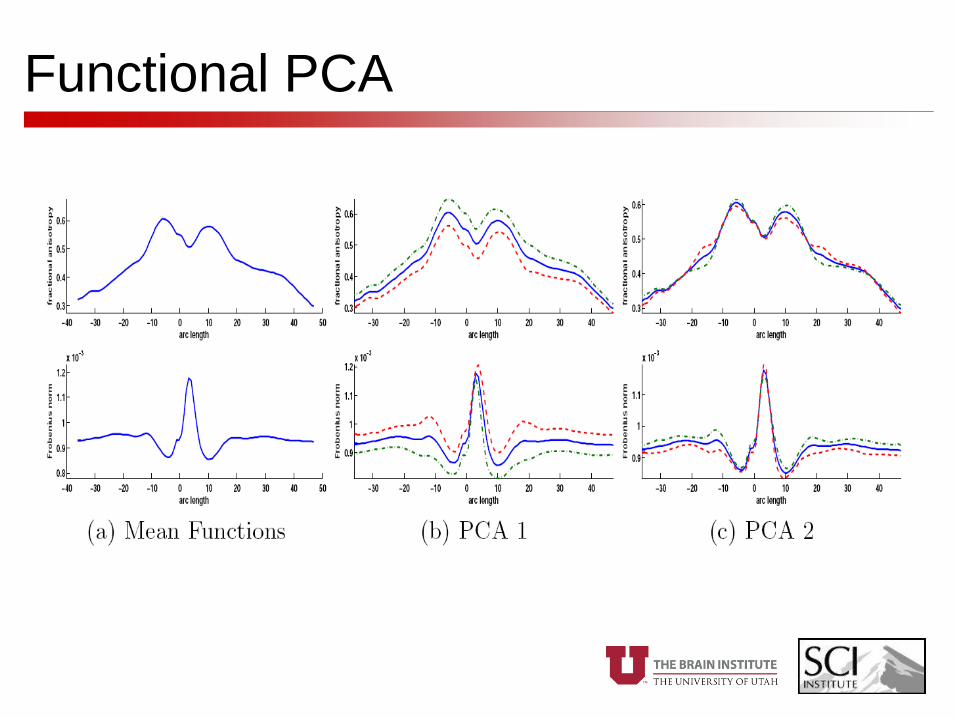
Functional PCA

Hypothesis testing and discrimination
• Permutation test using T2 statistics
Linear discriminant embedded in T2

Pediatric Example – Left motor tract
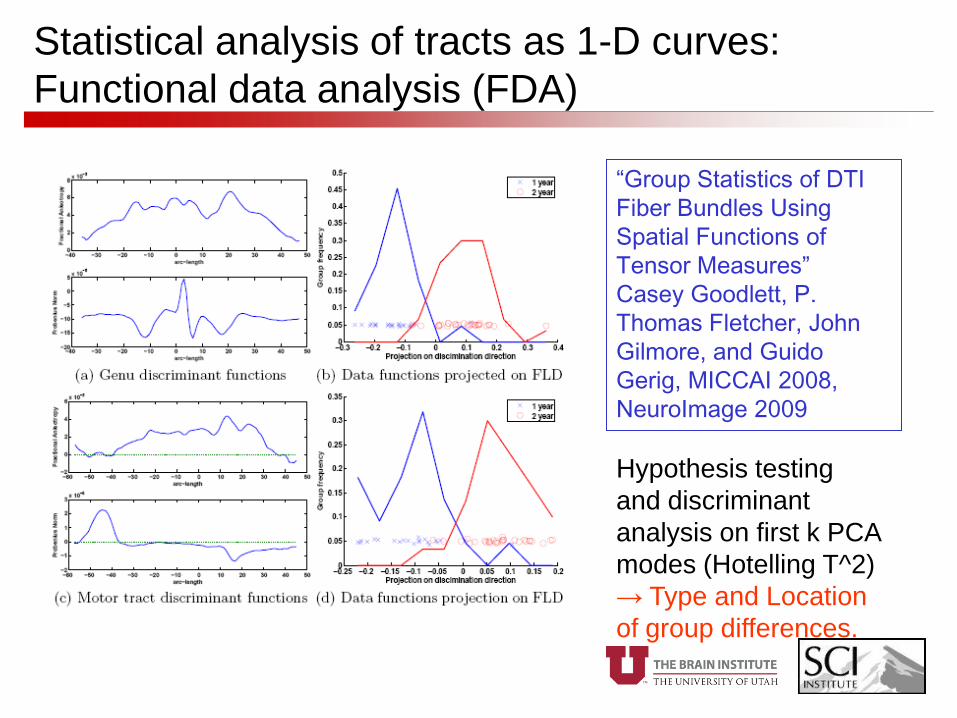
Statistical analysis of tracts as 1-D curves:
Functional data analysis (FDA)
“Group Statistics of DTI
Fiber Bundles Using
Spatial Functions of
Tensor Measures”
Casey Goodlett, P.
Thomas Fletcher, John
Gilmore, and Guido
Gerig, MICCAI 2008,
NeuroImage 2009
Hypothesis testing
and discriminant
analysis on first k PCA
modes (Hotelling T^2)
→ Type and Location
of group differences.
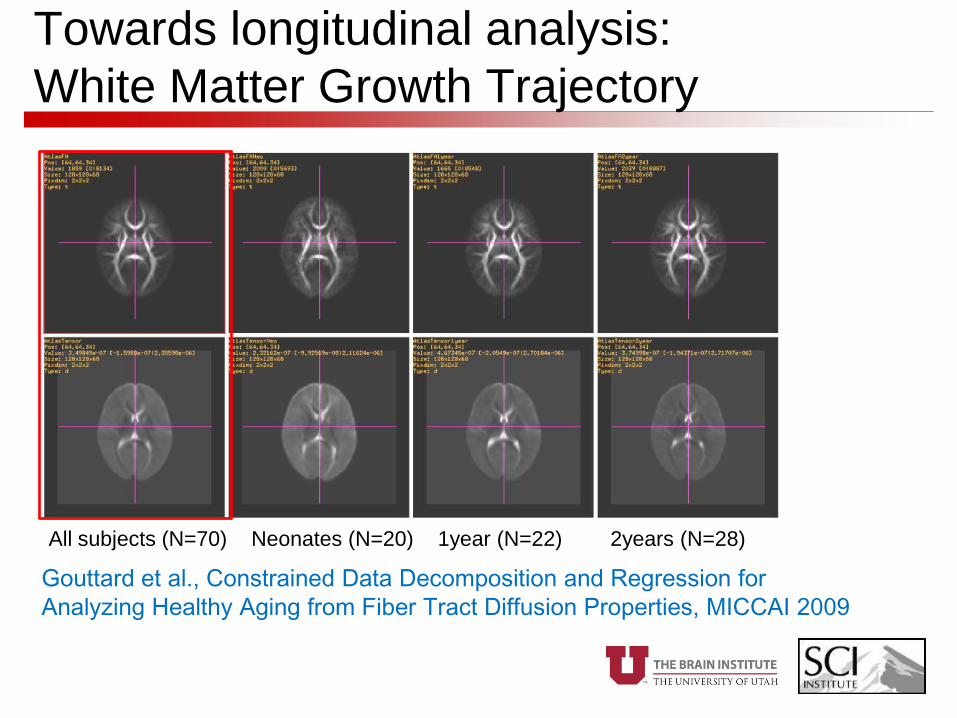
Towards longitudinal analysis:
White Matter Growth Trajectory
Gouttard et al., Constrained Data Decomposition and Regression for
Analyzing Healthy Aging from Fiber Tract Diffusion Properties, MICCAI 2009
All subjects (N=70) Neonates (N=20) 1year (N=22) 2years (N=28)
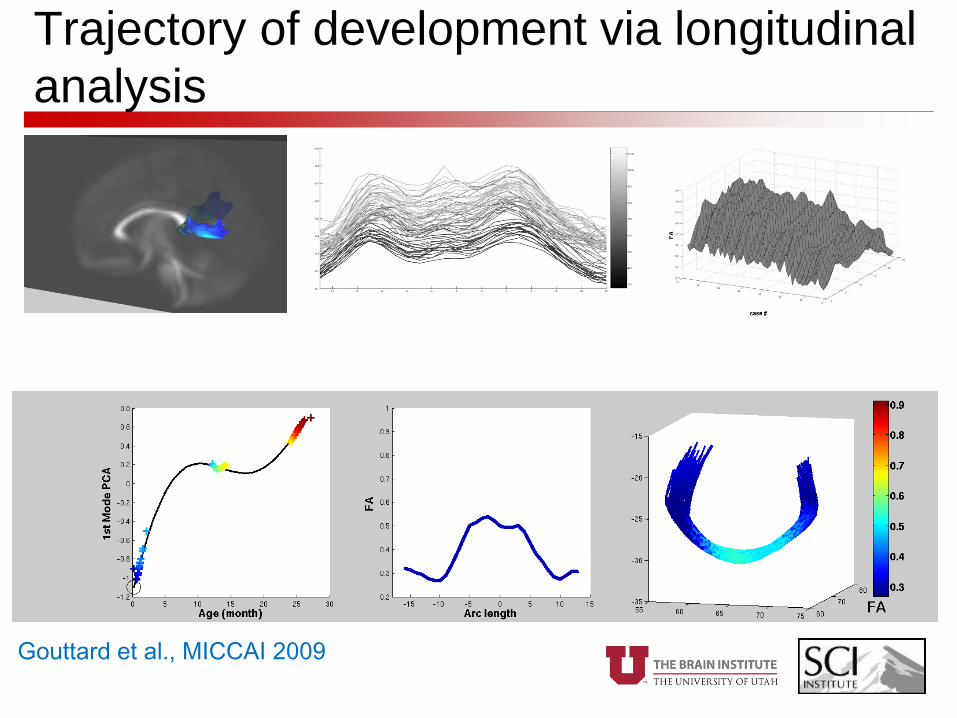
Trajectory of development via longitudinal
analysis
Gouttard et al., MICCAI 2009
Gerig 07-2008
DWI does only partially explain
white matter development

Neurodevelopment in sMRI and DTI
neonate 1 year 2 years
Structural
MRI shows
contrast flip
due to wm
structuring.
DTI shows
a type of
continuous
maturation
process.

DTI is part of multi-modal MRI protocol
T1 MPRage. T2 3D TSE, MD, FA (2yrs old. Weili Lin, UNC)
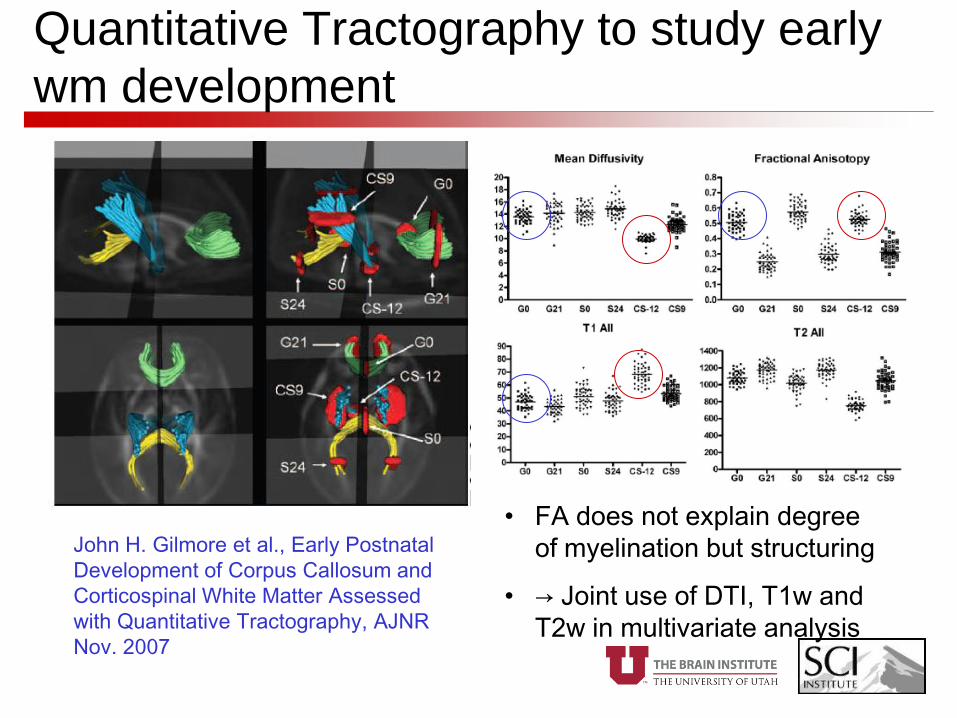
Quantitative Tractography to study early
wm development
John H. Gilmore et al., Early Postnatal
Development of Corpus Callosum and
Corticospinal White Matter Assessed
with Quantitative Tractography, AJNR
Nov. 2007
• FA does not explain degree
of myelination but structuring
• → Joint use of DTI, T1w and
T2w in multivariate analysis
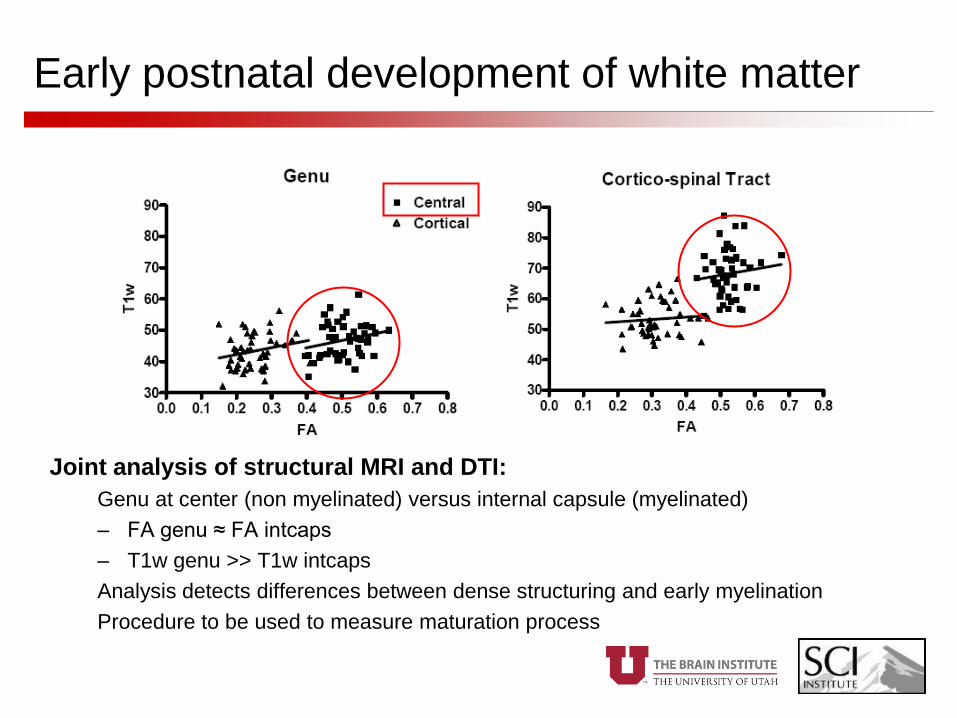
Early postnatal development of white matter
Joint analysis of structural MRI and DTI:
Genu at center (non myelinated) versus internal capsule (myelinated)
– FA genu ≈ FA intcaps
– T1w genu >> T1w intcaps
Analysis detects differences between dense structuring and early myelination
Procedure to be used to measure maturation process

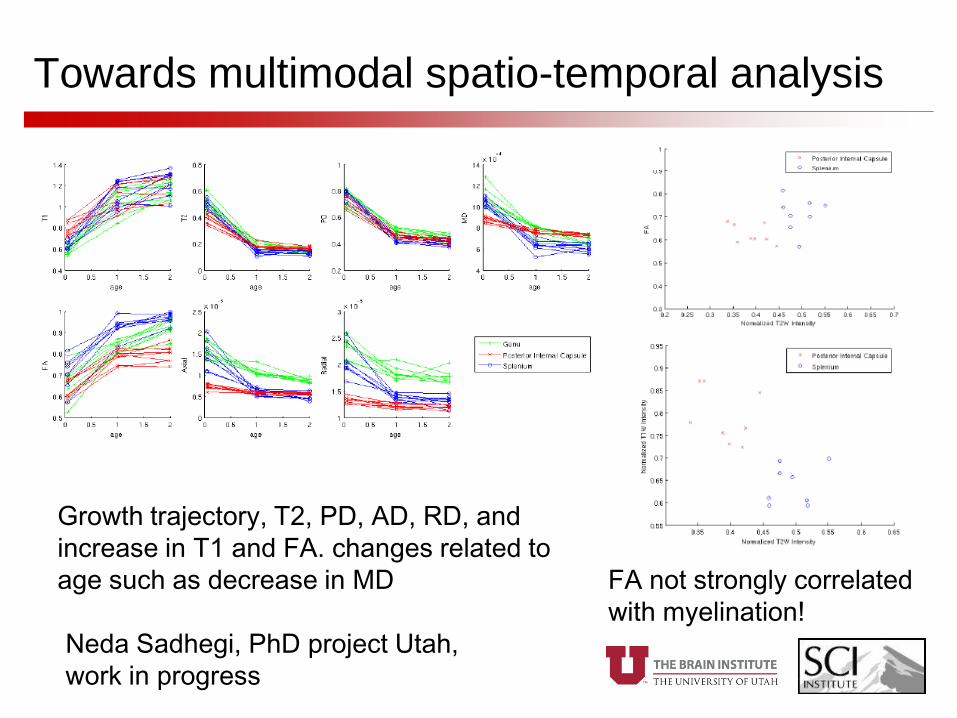
Towards multimodal spatio-temporal analysis
Neda Sadhegi, PhD project Utah,
work in progress
Towards multimodal spatio-temporal analysis
Neda Sadhegi, PhD project Utah,
work in progress
Growth trajectory, T2, PD, AD, RD, and
increase in T1 and FA. changes related to
age such as decrease in MD FA not strongly correlated
with myelination!
Outline
1. Imaging Technology for Pediatric Imaging
2. Analysis of structural MRI
3. Image Registration
4. Population Studies of DTI
5. Outlook and Conclusions

Gerig 07-2008
Towards Longitudinal Analysis
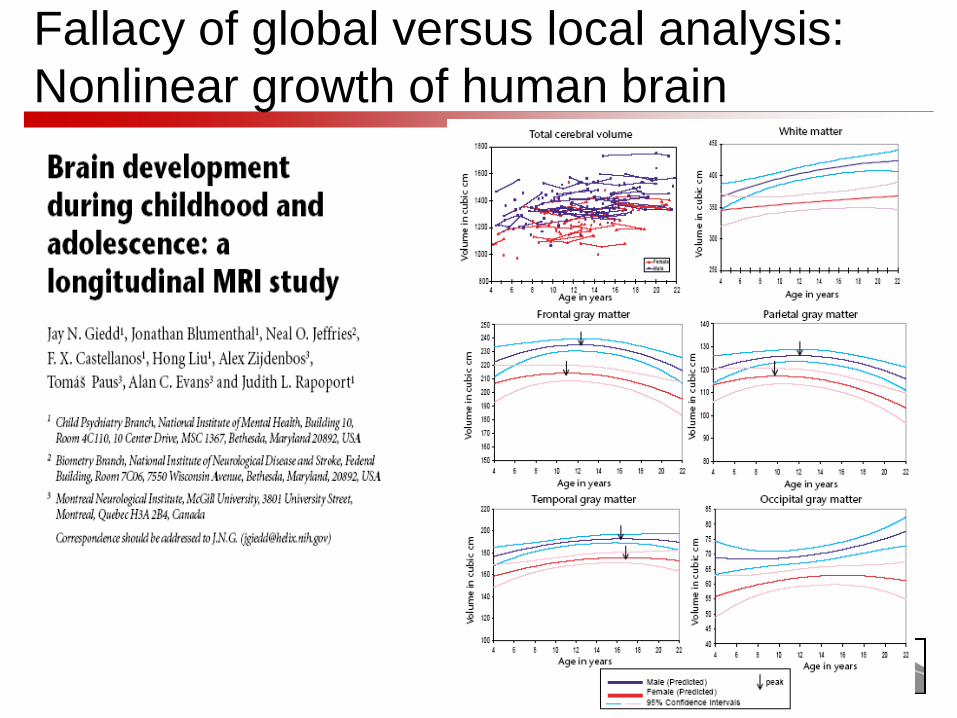
Fallacy of global versus local analysis:
Nonlinear growth of human brain
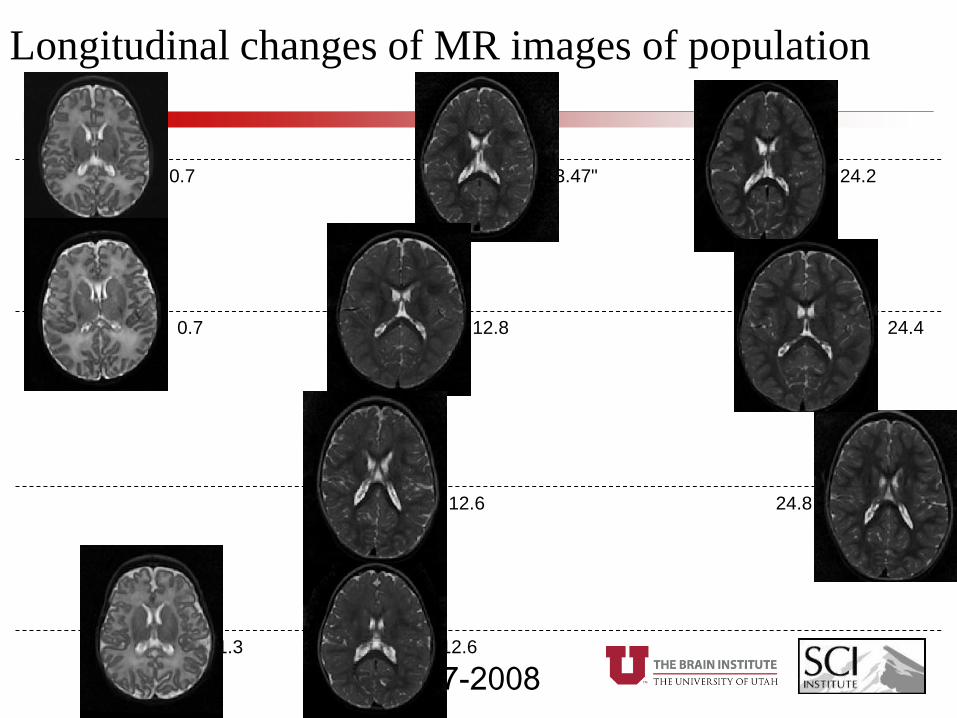
Gerig 07-2008
Longitudinal changes of MR images of population
0.7 13.47" 24.2
0.7 12.8 24.4
1.3
12.6 24.8
12.6
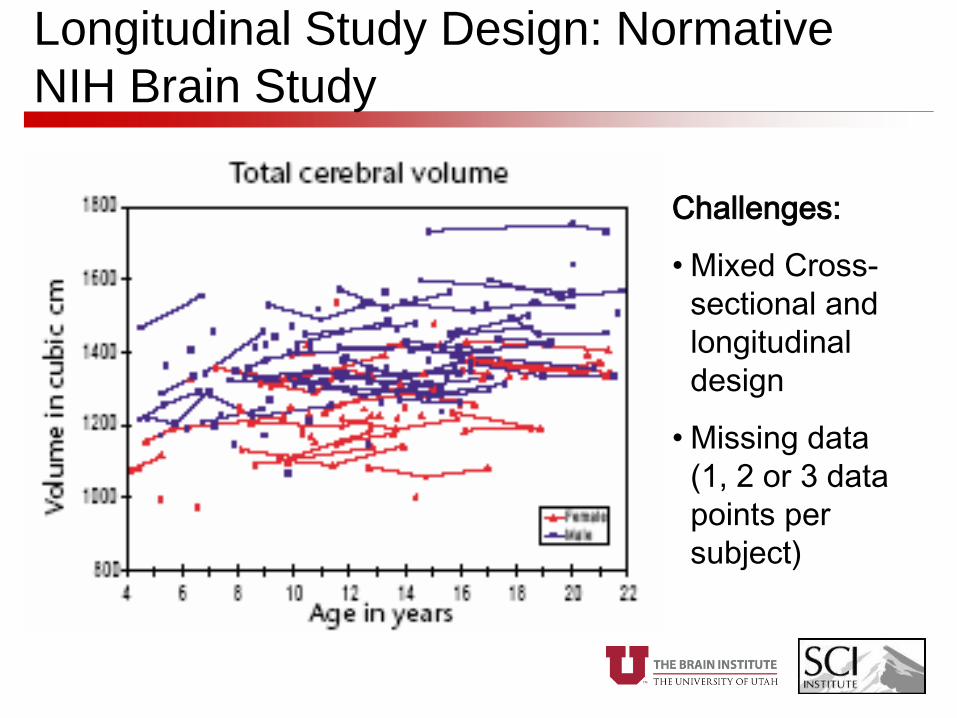
Longitudinal Study Design: Normative
NIH Brain Study
Challenges:
• Mixed Cross-
sectional and
longitudinal
design
• Missing data
(1, 2 or 3 data
points per
subject)

Aging Brain via Population Shape
Spatio-temporal 4D modeling:
Regression over image deformations
S. Joshi, T. Fletcher et al., Marr Prize,
ICCV’07 best paper award
Age
Properties of data
• Correlation, similarity between repeated MR
scans
• Missing Data
• Unbalanced spacing, different time points
• Correlation between tissues, inter-subject
variance, etc.
• Multivariate features: Dimensionality
• Regression not suitable

Challenge: Multivariate Longitudinal data
analysis
Multivariate Longitudinal Statistics for
Neonatal-Pediatric Brain Tissue
Development, Sh. Xu, M. Styner, J.H.
Gilmore, G. Gerig, SPIE 2008
Multivariate Nonlinear Mixed Model to
Analyze Longitudinal Image Data: MRI
Study of Early Brain Development, Shu
Xu et al., MMBIA 2008
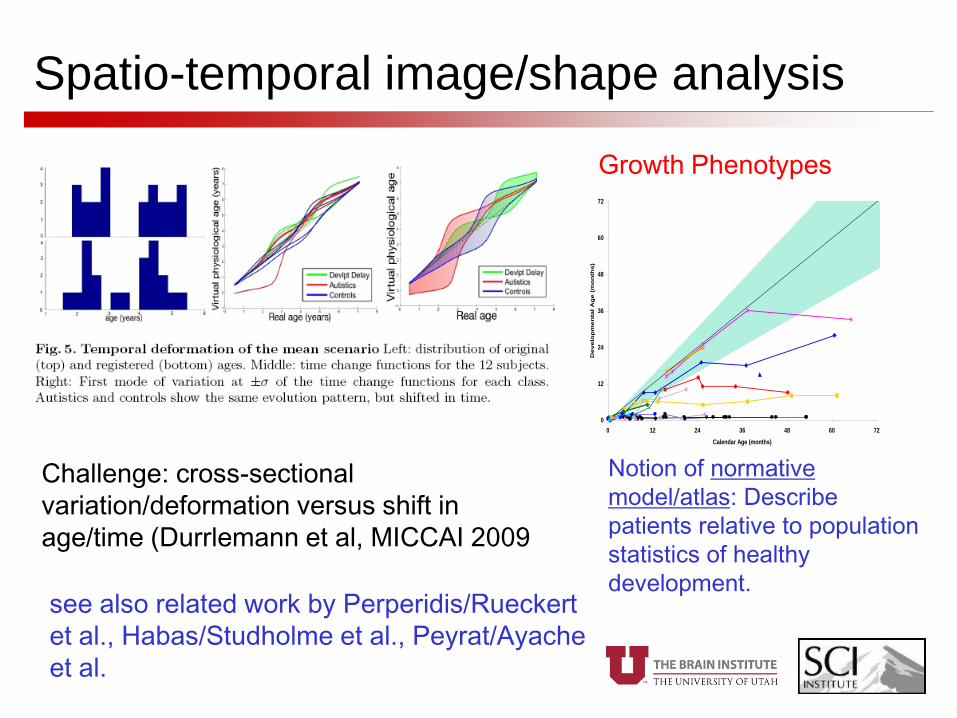
Spatio-temporal image/shape analysis
Challenge: cross-sectional
variation/deformation versus shift in
age/time (Durrlemann et al, MICCAI 2009
see also related work by Perperidis/Rueckert
et al., Habas/Studholme et al., Peyrat/Ayache
et al.
0
12
24
36
48
60
72
0 12 24 36 48 60 72
Calendar Age (months)
De
ve
lop
me
nta
l A
ge
(m
on
ths
)
Growth Phenotypes
Notion of normative
model/atlas: Describe
patients relative to population
statistics of healthy
development.
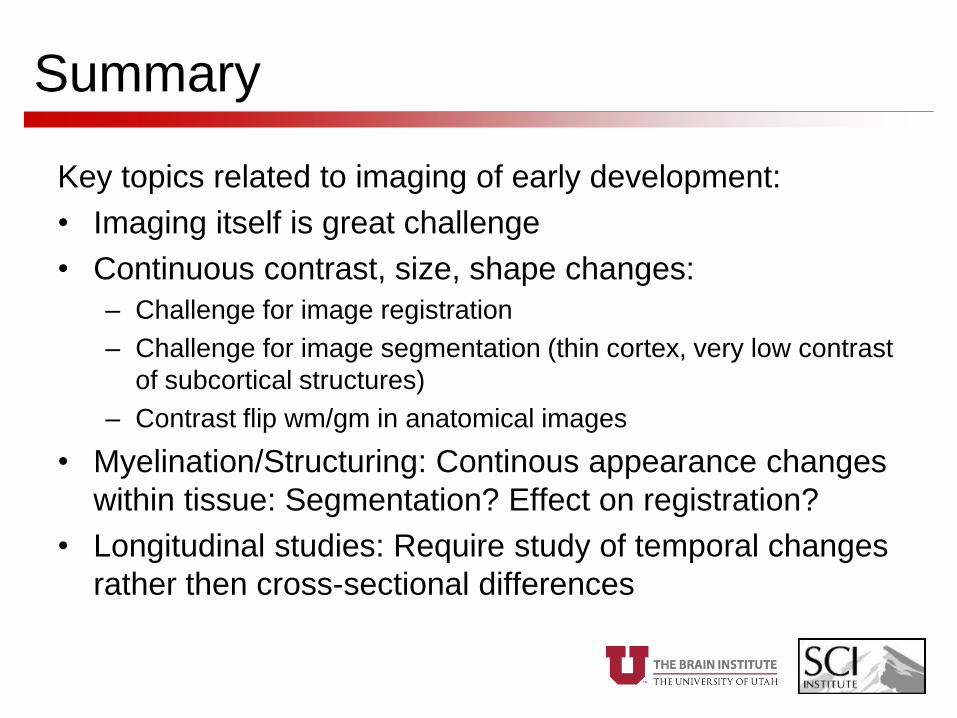
Summary
Key topics related to imaging of early development:
• Imaging itself is great challenge
• Continuous contrast, size, shape changes:
– Challenge for image registration
– Challenge for image segmentation (thin cortex, very low contrast
of subcortical structures)
– Contrast flip wm/gm in anatomical images
• Myelination/Structuring: Continous appearance changes
within tissue: Segmentation? Effect on registration?
• Longitudinal studies: Require study of temporal changes
rather then cross-sectional differences
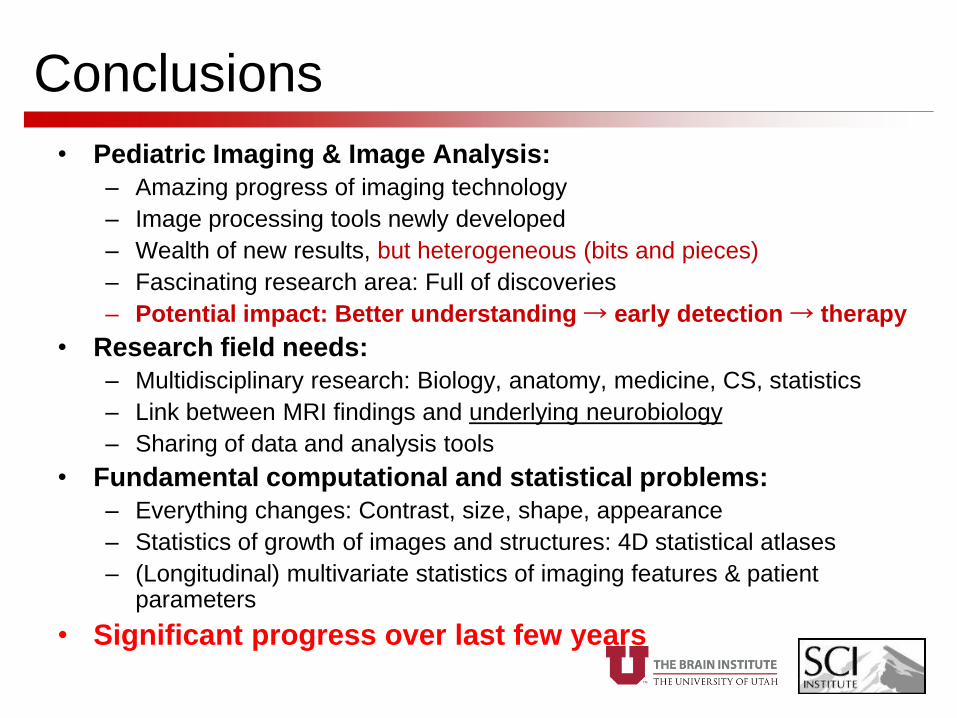
Conclusions
• Pediatric Imaging & Image Analysis:
– Amazing progress of imaging technology
– Image processing tools newly developed
– Wealth of new results, but heterogeneous (bits and pieces)
– Fascinating research area: Full of discoveries
– Potential impact: Better understanding → early detection → therapy
• Research field needs:
– Multidisciplinary research: Biology, anatomy, medicine, CS, statistics
– Link between MRI findings and underlying neurobiology
– Sharing of data and analysis tools
• Fundamental computational and statistical problems:
– Everything changes: Contrast, size, shape, appearance
– Statistics of growth of images and structures: 4D statistical atlases
– (Longitudinal) multivariate statistics of imaging features & patient parameters
• Significant progress over last few years

Acknowledgements
Clinical Research Partners:
• Joseph Piven (UNC)
• John H. Gilmore (UNC)
• Janet Lainhart (Utah)
• Weili Lin (UNC)
• Larry Wald (MGH)
Computer Science Partners:
• Sarang Joshi (Utah)
• Tom Fletcher (Utah)
• Marcel Prastawa (Utah)
• Sylvain Gouttard (Utah)
• Casey Goodlett (Utah)
• Shu Xun (UNC)
• Martin Styner (UNC)
• Ron Kikinis (SPL Harvard)
Funding:
• NIH MH070890 (JHG)
• NAMIC U54 EB005149 (GG)
• NIMH Silvio Conte Center
(JHG)