grupo nutresa s. a. (bvc:nutresa) third quarter 2014 ... · outsanding growth in colombian sales...
TRANSCRIPT

NUTRESA at a Glance GRUPO NUTRESA S. A. (BVC:NUTRESA)
Third quarter 2014 results
October 31st, 2014

2
Highlights 3Q 2014
Outsanding growth in colombian sales Quarterly growth is the highest for the group in more than 5 years
DSJI: For the fourth time, Grupo Nutresa was recognized as a leader company in the
Dow Jones Sustainability World Index -DJSI- ratifying its leadership in
suatainability in the food industry.
MERCO Empresas: Grupo Nutresa is the third most reputed company in Coombia

65,0
198,9
118,7 97,9
43,0
291,9
0
50
100
150
200
250
300
350
Cold cuts Biscuits Chocolates Coffee Ice cream TMLUC
Mill
ion
International sales US$815,6 +18,0%
1.043,6
507,3 538,9
373,8 318,3
176,8
0
200
400
600
800
1.000
1.200
Cold cuts Biscuits Chocolates Coffee Ice cream PastaB
illio
n p
eso
s
Colombia sales COP $3.058,7 +8,9%
3
Accumulated sales - Colombia and International
Sales per
business unit
3Q 2014
Percentage variation in volume (Q) and prices (P)
International sales organic growth Ex-Venezuela: -1.7%
% chg. YoY
Billion pesos
% chg. YoY
Million dollars
+11,0%
+7,7%
-1,6%
+2,4%
-66,8%
+12,1%
+2,7%
+5,2%
-16,1%
+1,9%
Q:+9,0P:+1,9
Q: +7,3 P: +1,4
Q:+9,7 P:+0,5
Q:+5,0 P:+2,6
Q:0,0 P:-1,6
Q:+14,4 P:-2,0
Q:-0,0 P:+2,7
+10,2%
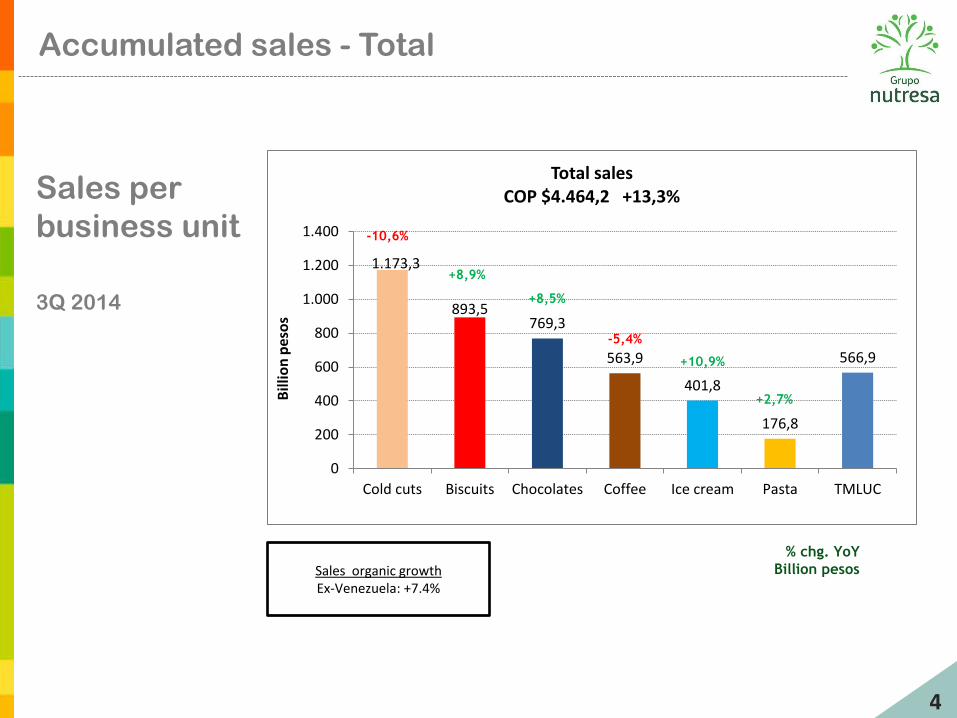
1.173,3
893,5 769,3
563,9
401,8
176,8
566,9
0
200
400
600
800
1.000
1.200
1.400
Cold cuts Biscuits Chocolates Coffee Ice cream Pasta TMLUC
Bill
ion
pes
os
Total sales COP $4.464,2 +13,3%
4
Accumulated sales - Total
Sales per
business unit
3Q 2014
Sales organic growth Ex-Venezuela: +7.4%
% chg. YoY
Billion pesos
+2,7%
-10,6%
+8,9%
+8,5%
+10,9%
-5,4%

361,9
187,7 198,0
128,2 111,7
62,1
-
50,0
100,0
150,0
200,0
250,0
300,0
350,0
400,0
Cold cuts Biscuits Chocolates Coffee Ice Cream Pasta
Bill
ion
Pe
sos
Colombia sales COP $1.086,3 +11,0%
26,6
68,9
47,0
32,3
14,5
99,4
-
20,0
40,0
60,0
80,0
100,0
120,0
Cold cuts Biscuits Chocolates Coffee Ice Cream TMLUC
US$
mill
ion
International sales US$288,8 +7,4%
5
3Q sales - Colombia and International
Sales per
business unit
3Q 2014
Percentage variation in volume (Q) and prices (P)
International sales organic growth Ex – Venezuela -0,3%
% chg. YoY
Billion pesos
% chg. YoY
Million dollars
+12,2%
+10,5%
+2,1% +12,6%
+6,7%
+8,3%
-15,5%
+0,8%
Q:+10,0 P:+2,0
Q: +8,3 P: +2,5
Q:+9,7 P:+1,9
Q:+5,0 P:+5,3
Q:+1,1 P:+1,0
Q:+16,4 P:-3,3
Q:+3,1 P:+3,5
+11,8%
-65,5%
+3,9%

418,0
319,5 288,1
189,9
139,4
62,1
189,8
0
50
100
150
200
250
300
350
400
450
Cold cuts Biscuits Chocolates Coffee Ice Cream Pasta TMLUC
Bill
ion
Pes
os
Total sales COP $1.643,8 +10,4%
6
3Q sales - Total
Sales per
business unit
3Q 2014
% chg. YoY
Billion pesos
Sales organic growth Ex-Venezuela +8,2%
+6,7%
-10,8%
+8,5% +10,2%
+10,1%
-4,4%

7
Sales by region – 3Q 14
7.0% USA
1.4% Dominican Rep. & Caribbean
1.8% Venezuela
7.8% Chile
3.9% Mexico
7.3% Central America
65.8% Colombia
1.1% Ecuador
1.8% Peru
2.1% Other countries
34.2% International
sales
Production & distribution
Distribution

8
Market share Colombia + TMLUC
55,1% +1,0%
Biscuits
Chocolate confectionary 66,8% (A) +0,5% Hot chocolate 63,2% (B) +0,7% Milk modifiers 25,3% (C) -2,8% Nuts 48,4% +0,6% (D)
Chocolates
Roast and ground
coffee (A)
55,9% -0,2%
Soluble coffee (B)
41,7% +0.2%
Coffee
ICE CREAM
ND
Ice cream
51,9% +1,1%
Pasta
73,2% +0,5%
Cold cuts
#2 Private labels 6,9% #3 Friko 0,7%
#2 Nestlé 12,1% #3 Mondelez 10,6%
#2 La Muñeca 30,1% (A) #2 Colombina 7,6% (B) #2 Casa Lúker 25,2% (C) #1 Nestlé 68,8% (D) Frito Lay 26,1%
(A) #2 Águila Roja 23,4% (B) #1 Nestlé 44,4%
TMLUC
Chile ICB* 63,4% (A) Pasta
29.1% (B)
Coffee
16.5% (C)
Mexico ICB *
31.0% (D)
(A) #2 Carozzi 35,3% (B) #1 Carozzi 45,0% (C) #1 Nestlé 71,4% (D) #1 Mondelez 51.2%
*ICB= Instant Cold Beverages Source: Nielsen twelve month as of september 2014. (% share as in value and change vs. same period last year)
Market share Colombia: 60.5% (+0,6%)

9
Commodities index (GNCI) B
ase
10
0, D
ecem
ber
20
12
The technical specifications of the GNCI may be obtained at: www.gruponutresa.com/webfm_send/398
92 86
107
144
113 95
112
70
80
90
100
110
120
130
140
150
160
2008 2009 2010 2011 2012 2013 2014
GNCI – September 2014

10
Raw material diversification
Pro forma information of the raw material costs including TMLUC.
* Includes direct labor costs, indirect costs and minor raw materials
Pack. Mat. 11,0%
Pork 8,6%
Coffee 7,7%
Wheat 6,2%
Beef 4,7%
Cocoa 4,6%
Oils&Fats 3,8%
Sugar 3,6%
Poultry 1,7%
Milk 1,8%
Other* 46,4%
% COGS

157,4
121,5
98,0 110,9
67,4
18,5
67,2
0
20
40
60
80
100
120
140
160
180
Cárnicos Galletas Chocolates Café Helados Pastas TMLUC
Mile
s d
e m
illo
ne
s
EBITDA $642,1 +11,6% margen 13,8%
11
EBITDA by business unit – September 2014
EBITDA margin % chg. Billion pesos
13,4%
13,6%
12,7%
19,7%
16,8%
10,5%
-15,1%
+7,8%
-10,4%
+16,3% +12,3%
-5,4%
11,9%
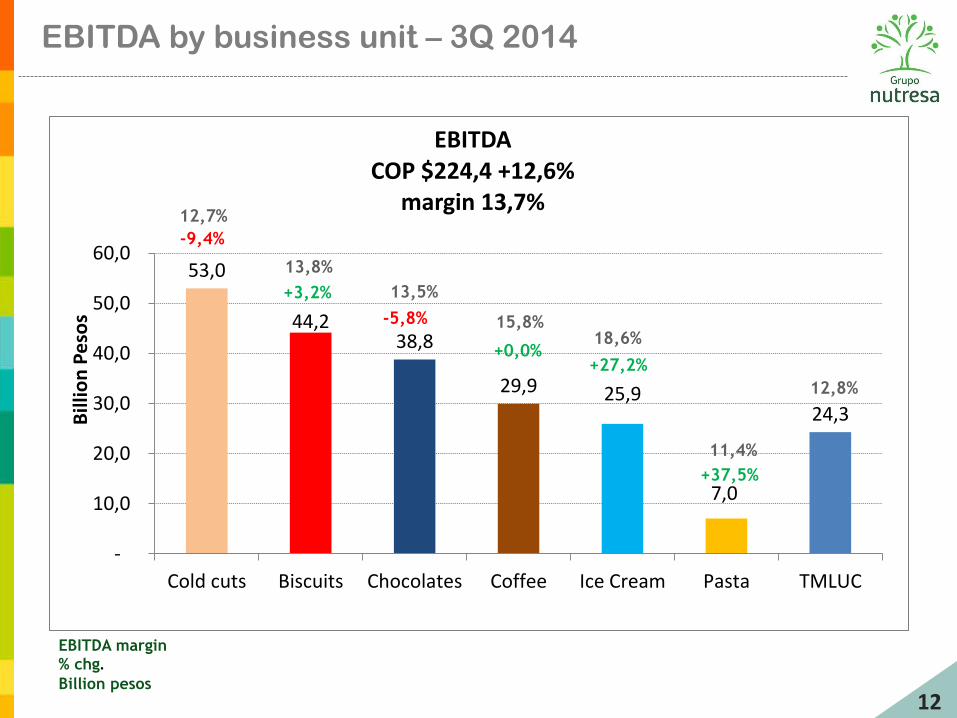
53,0
44,2 38,8
29,9 25,9
7,0
24,3
-
10,0
20,0
30,0
40,0
50,0
60,0
Cold cuts Biscuits Chocolates Coffee Ice Cream Pasta TMLUC
Bill
ion
Pe
sos
EBITDA COP $224,4 +12,6%
margin 13,7%
12
EBITDA by business unit – 3Q 2014
EBITDA margin % chg. Billion pesos
12,7%
13,8%
13,5%
15,8% 18,6%
11,4%
-5,8%
+27,2%
-9,4%
+3,2%
+0,0%
+37,5%
12,8%

13
Consolidated income statement – September 2014
Figures in COP$ MM sep-14 % sep-13 % % var.
Total operating revenues 4,646,154 100.0% 4,101,472 100.0% 13.3%
Cost of goods sold -2,563,460 -55.2% -2,257,250 -55.0% 13.6%
Gross income 2,082,694 44.8% 1,844,222 45.0% 12.9%
Administrative expenses -297,884 -6.4% -242,240 -5.9% 23.0%
Sales expenses -1,224,985 -26.4% -1,056,595 -25.8% 15.9%
Production expenses -82,124 -1.8% -93,517 -2.3% -12.2%
Total operating expenses -1,604,993 -34.5% -1,392,352 -33.9% 15.3%
Operating income 477,701 10.3% 451,870 11.0% 5.7%
Financial revenues 10,909 0.2% 8,211 0.2% 32.9%
Financial expenses -116,958 -2.5% -61,386 -1.5% 90.5%
Foreign currency exposure 4,361 0.1% 12,836 0.3% -66.0%
Other revenues (expenditures), net -31,941 -0.7% -25,620 -0.6% 24.7%
Dividends (non-food) 31,511 0.7% 29,867 0.7% 5.5%
Non-recurring capital gains - - 107 0.0% N.C.
Non-operating, net -102,118 -2.2% -35,985 -0.9% 183.8%
Income before tax 375,583 8.1% 415,885 10.1% -9.7%
Income tax -113,479 -2.4% -135,657 -3.3% -16.3%
Minority interest -1,919 0.0% -73 0.0% 2528.8%
Net Income 260,185 5.6% 280,155 6.8% -7.1%
Consolidated EBITDA 642,085 13.8% 575,154 14.0% 11.6%
14
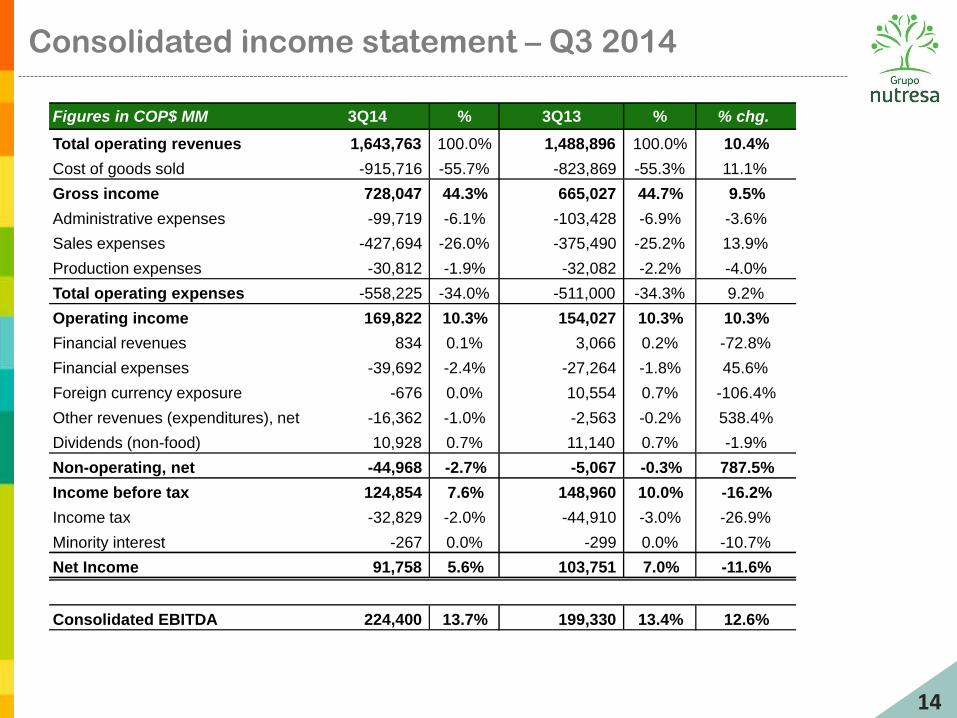
Consolidated income statement – Q3 2014
Figures in COP$ MM 3Q14 % 3Q13 % % chg.
Total operating revenues 1,643,763 100.0% 1,488,896 100.0% 10.4%
Cost of goods sold -915,716 -55.7% -823,869 -55.3% 11.1%
Gross income 728,047 44.3% 665,027 44.7% 9.5%
Administrative expenses -99,719 -6.1% -103,428 -6.9% -3.6%
Sales expenses -427,694 -26.0% -375,490 -25.2% 13.9%
Production expenses -30,812 -1.9% -32,082 -2.2% -4.0%
Total operating expenses -558,225 -34.0% -511,000 -34.3% 9.2%
Operating income 169,822 10.3% 154,027 10.3% 10.3%
Financial revenues 834 0.1% 3,066 0.2% -72.8%
Financial expenses -39,692 -2.4% -27,264 -1.8% 45.6%
Foreign currency exposure -676 0.0% 10,554 0.7% -106.4%
Other revenues (expenditures), net -16,362 -1.0% -2,563 -0.2% 538.4%
Dividends (non-food) 10,928 0.7% 11,140 0.7% -1.9%
Non-operating, net -44,968 -2.7% -5,067 -0.3% 787.5%
Income before tax 124,854 7.6% 148,960 10.0% -16.2%
Income tax -32,829 -2.0% -44,910 -3.0% -26.9%
Minority interest -267 0.0% -299 0.0% -10.7%
Net Income 91,758 5.6% 103,751 7.0% -11.6%
Consolidated EBITDA 224,400 13.7% 199,330 13.4% 12.6%

15
Consolidated net debt
Note: Sales, EBITDA and interest of the last 12 months
863 978
486 399
1.581 1.637
1.780 1.807
0
200
400
600
800
1.000
1.200
1.400
1.600
1.800
2.000
dic/09 dic/10 dic/11 dic/12 dic/13 mar/14 jun/14 sep/14
Bil
ion
pe
so
s
Indicador dec-09 dec-10 dec-11 dec-12 dec-13 mar-14 jun-14 sep-14
Net debt / EBITDA 1.57 1.82 0.86 0.59 1.90 1.88 2.04 2.01
EBITDA / Interest 6.86 8.60 8.85 12.74 10.38 8.62 7.11 6.64
Interest / Sales 1.75% 1.40% 1.27% 0.99% 1.36% 1.62% 1.96% 2.10%
16
Contact information
Alejandro Jiménez Moreno Santiago Escobar Roldán
Investor relations director Corporate finance director
Tel: (+574) 325-8698 Tel: (+574) 325-8680
email: [email protected] email: [email protected]
For more information regarding Grupo Nutresa's level 1 ADR, please call The Bank of New York Mellon marketing desks:
New York New York New York London
BNYM-Latin America BNYM-Sell-Side BNYM-Buy-Side BNYM-Sell-Side/Buy-Side
Gloria Mata Kristen Resch Angelo Fazio Mark Lewis
[email protected] [email protected] [email protected] [email protected]
Telephone 212 815 5822 Telephone 212 815 2213 Telephone 212 815 2892 Telephone 44 207 964 6419
For futher information, please visit Grupo Nutresa Valuation Kit (GNVK): http://www.gruponutresa.com/es/content/grupo-nutresa-valuation-kit-gnvk

17
Annex – consolidated balance sheet
September 2014 Figures in COP$ MM sep-14 sep-13 % var.
ASSETS
Cash and temporary investments 206,875 345,435 -40.1%
Investments 382,341 357,305 7.0%
Receivables 939,344 931,013 0.9%
Inventories 830,981 751,151 10.6%
Property, plant and equipment 1,428,263 1,379,531 3.5%
Intangibles 1,879,364 2,118,695 -11.3%
Deferred assets 78,501 103,310 -24.0%
Other assets 24,188 14,047 72.2%
Appreciation 5,296,045 4,989,555 6.1%
Total Assets 11,065,902 10,990,042 0.7%
LIABILITIES
Financial liabilities 2,013,963 2,021,108 -0.4%
Suppliers 219,468 206,620 6.2%
Accounts payable 333,371 358,785 -7.1%
Taxes, duties and tariffs 47,144 69,570 -32.2%
Labor liabilities 49,171 56,114 -12.4%
Estimated liabilities and provisions 296,239 384,377 -22.9%
Deferred liabilities 203,513 162,220 25.5%
Other liabilities 6,432 22,494 -71.4%
Total Liabilities 3,169,301 3,281,288 -3.4%
Minority interest 19,558 20,353 -3.9%
EQUITY 7,877,043 7,688,401 2.5%
TOTAL LIABILITIES AND EQUITY 11,065,902 10,990,042 0.7%
18
Exoneration of responsibility
This document can contain forward looking statements related to Grupo Nutresa S.A. and its
subordinated companies, under assumptions and estimations made by company management.
For better illustration and decision making purposes Grupo Nutresa’s figures are consolidated;
for this reason they can differ from the ones presented to official entities. Grupo Nutresa S.A.
does not assume any obligation to update or correct the information contained in this
document.