grupo nutresa s. a. · merco talento confirmed grupo nutresa as the second best company to work in...
TRANSCRIPT

03 August 2016
A future together
Grupo Nutresa S. A.Corporate Presentation

38OF SALES
8
2
5X
ONE OF THE LARGEST FOOD COMPANIES IN AMERICA
MARKET CAP OF
2015 EBITDA MARGIN 12,3%
OUTSIDE
COLOMBIA
BUSINESS
MODEL PILLARS
PEOPLE 1Q16
BRANDS
45,3KEMPLOYEES
12,4KOUTSIDE COLOMBIA
17BRANDS SELL
MORE THAN
50 USD MM
CONSOLIDATED
MARKET SHARE
IN COLOMBIA
61%
DISTRIBUTION
SUSTAINABILITYDIVERSIFICATION
PRESENCE
COUNTRIES
MANUFACTURINGPLANTS
COUNTRIES
IN 5 CONTINENTS
PRODUCTS SOLD IN
No single commodity accounts
for more than 10% of COGS
~ 3,6
YEARS OF HISTORY100
14
4572
8 BUSINESS UNITS
SCALE
2015 SALES
KNOWLEDGE CLOSE TO
USD billion1,1USD billion
%
1,2CLIENTS SERVED
MILLION 11,7KWITH MORE THAN
SELLERS
COP trillion
11,5COP trillion
~ 2,9USD billion
Includes Grupo El Corral
2 X $5,9 = $11,8 COP trillion
~10.41% CAGR
EBITDA MARGIN12% - 14%

International sales and distributionnetwork
Biscuits Chocolates Coffee PastaCold Cuts TMLUC* Ice Cream
3
* T
MLU
C =
Tre
sm
onte
s L
ucchetti
CorporateStructure
Retail
Food
4
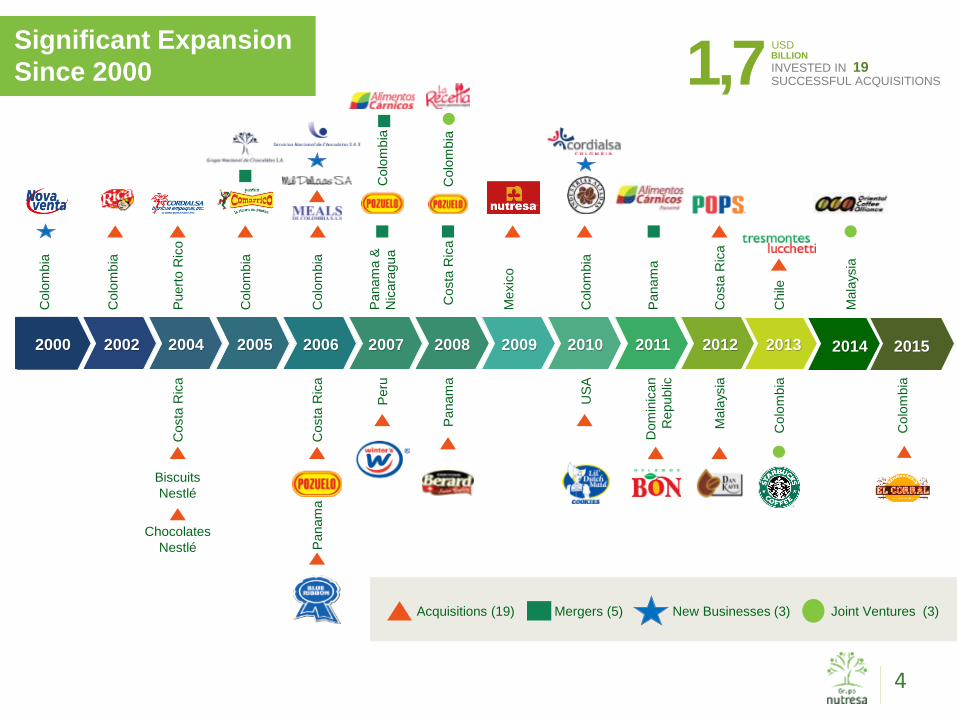
Acquisitions (19) Mergers (5) New Businesses (3)
Costa
Ric
a
Colo
mbia
Colo
mbia
Colo
mbia
Puert
o R
ico
Chile
Costa
Ric
a
Panam
a
Colo
mbia
Mexic
o
Panam
a
Panam
a&
Nic
ara
gua
Colo
mbia
Colo
mbia
Colo
mbia
Colo
mbia
Costa
Ric
a
Costa
Ric
a
Peru
Panam
a
US
A
Dom
inic
an
Republic
Mala
ysia
Biscuits
Nestlé
2000 2002 2004 2005 2006 2007 2008 2009 2010 2011 2012 2013 2014
Mala
ysia
Colo
mbia
Chocolates
Nestlé
Joint Ventures (3)
USD
1,7 BILLION
INVESTED IN 19SUCCESSFUL ACQUISITIONS
Significant Expansion
Since 2000
2015

Sales by
Region, 1H 2016
INTERNATIONAL SALES
39,3%
5
USA
8,3%
DOMINICAN REP. & CARIBBEAN
1,7%
CHILE
8,4%
VENEZUELA
3,0%
MEXICO
3,5%
CENTRAL AMERICA
9,8%
COLOMBIA
60,7%
ECUADOR
1,4%
PERU
1,7%
60,7%COLOMBIANSALES
OTHER COUNTRIES1,5%

Market shareColombia + TMLUC
Consolidated market share in Colombia: 61,2% +0,3%
Biscuits Chocolates CoffeeCold Cuts
#2 Private labels 7,1% #2 Nestlé 11,3%#3 Mondelez 10,2%
#2 La Muñeca 30,2%(A) #2 Ferrero 7,4%(B) #2 Casa Lúker 26,5%(C) #1 Nestlé 69,9%(D) Frito Lay 25,3%
(A) #2 Águila Roja 24,9%(B) #1 Nestlé 42,9%
TMLUC
(A) #2 Carozzi 34,0%(B) #1 Carozzi 46,4%(C) #1 Nestlé 70,2%(D) #1 Frito Lay 62,9%(D) #1 Mondelez 55.5%
*ICB= Instant Cold BeveragesSource: Nielsen twelve month as of may 2016. (% share as in value and change vs. same period last year)
Ice Cream Pasta
6
56,0%+0.6%
Chocolate confectionery
67,7% (A)
+0,8%
Hot chocolate62,3% (B)
-0,3%
Milk modifiers24,7% (C)
-0,3%
Nuts56,1%
+3,7% (D)
Roast and ground
coffee (A)
53,7%-1,3%
Soluble coffee (B)
42,1%+0.5%
73,7%+0.4%
ICB*63,7% (A)
+1,0%
Pastas
27,3% (B)-1,2%
Coffee
16,3% (C)-0,2%
Potato Chips
13,2% (D)-0,3%
México ICB*
31,6% (E)+1,0%
ICE CREAM
ND 51,9%-0.4%
Retail Food
# 1 in Hamburguers
and Steakhouses categories in
Colombia
# 1 in Ice cream shops –Rep. Dom. &
CR

24%Supermarket Chains9%
Alternative
52%Traditional
(Mom-and-pop Stores)
/ Independent
Retail Stores
Business Model:Distribution
+11.700VENDORSSales by channel Grupo Nutresa
6%Retail food
5%Industrial
7
4% Institutional
+1,2MMPOINTS OF SALE

30%
26%15%
12%
11%
6%
23%
19%
16%13%
10%
10%
6%
3%
24%
20%
16%11%
11%
7%
6%
3%
2015 sales by
business units
• ** TMLUC : Tresmontes Lucchetti
• *This information includes El Corral pro-forma sales and EBITDA for 2014
• The Retail Food business unit consolidates the result of Grupo El Corral
(since 1st of march 2015) and the ice cream shops in Central America and
Dominican Republic. The results of the ice cream shops were included in
the Ice Cream business units in the previous reports.
INTERNATIONAL SALES
BY BUSINESS UNIT
EBITDA BY
BUSINESS UNIT
TOTAL SALES BY
BUSINESS UNIT
12,3%$12,9%
38% OF TOTAL SALES
35%
PASTA
ICE CREAM
COLD CUTS
BISCUITS
COFFEE
TMLUC**
CHOCOLATES
RETAIL FOOD
$7.945$6.462
$836$976
$1.098$1.145
USD mm
8
COP mm 2015COP mm 2014

OUR TARGET STRATEGY• Current or new categories with a promising strategic fit• Acquisition processes respectful of existing culture and people• We prefer control• Excellent management teams• Leader brands• High value added and differentiated products• Solid and sustainable business models – No turnarounds.• Way to market/distribution• Highly innovative companies • Preference for businesses with a sound strategy towards healthy and
nutritional products
M&A Strategy
STRATEGIC REGION
9
HEALTH AND NUTRITIONSupport the growth of our healthy and nutritional products portfolio with acquisitions:• "Good for you" products, dairy, veggies, supplements, natural
juices and nectars, nuts, oats, soy products, dried fruits, aromatics, sugar free, fat free reduced sugar/fats/salt , cereals & grains, enriched or functional products, healthy claim products.
Interested +
Interested
Not interested
Not interested –not in our region
SOUTHEASTASIA

STRATEGY FOR OUR FIRST CENTURY 1920-2020
Our Centennial strategy aims to double our 2013 sales by 2020; with sustained profitability between 12% and 14% of the EBITDA margin. To achieve this, we offer our consumers foods and experiences of recognized and beloved brands, that nourish, generate wellness and pleasure, that are distinguished by the best price/value relation; widely available in our strategic region, managed by talented, innovative, committed and responsible people, who contribute to sustainable development
Main Strategic Goal
10
2x $5,9 = $11,8 COP trillion10.41% CAGR
““
Double 2013 sales

Business Risk
Commercial Risk
AggressiveFinancial and Operating Risks
ModerateReputation Risk
NonePRINCIPAL RISKS MITIGATING FACTORS
Volatility in prices of raw
materials
• Hedging policies, with levels of risk clearly defined and administered by a
specialized committee
• A highly trained team dedicated to monitoring and negotiating supplies and
the exchange rate
• Permanent search for new opportunities and schemes for efficient,
competitive global sourcing of raw materials
Involvement of business
due to a highly
competitive environment
• Significant distribution capabilities with a differentiated strategy to address
different segments
• Commercial management supported by the deep, integrated understanding
of the market
• Attractive proposals with a good price/value relation
• Recognized, beloved brands
• Portfolio innovation and differentiation
• Search for entry into new markets
Regulations in nutrition
and health matters in the
countries where Grupo
Nutresa is present
• Vidarium: Nutrition Research Center
• Active participation with governments to discuss regulations
• Monitoring and strict compliance of the regulations of each country
• Innovation to develop new products and improve existing ones
• Support for and participation in programs that promote healthy living
• Responsible management of marketing and advertising
11

Corporate Governance
BOARD OF DIRECTORS
Antonio Mario Celia Martínez – Aparicio
Mauricio Reina Echeverri
Jaime Alberto Palacio Botero
Cipriano López González
David Emilio Bojanini García
Gonzalo Alberto Pérez Rojas
María Clara Aristizábal Restrepo
FINANCE, AUDIT AND
RISK COMMITTEE
APPOINTMENT AND COMPENSATION COMMITTEE
CORPORATE GOVERNANCE AND
BOARD ISSUES COMMITTEE
STRATEGIC PLANNING AND
SUSTAINABILITY COMMITTEE
Independent Members Non - Independent Members
1
1 2 3 5
2 5 711
2 3
2
3
5
6
7
12
1 7
52
4
4

35,0%
10,0%
7,0%
15,9%
32,1%
Shareholder Base
460.123.458Ordinary shares listed in Colombia | ADR level 1TickerBVC: NUTRESAADR: GCHOY
$3.872 COP mmLast 12 months ADTV
+14K SHAREHOLDERSOther
Other funds
Foreign Investors 13

Annexes
15
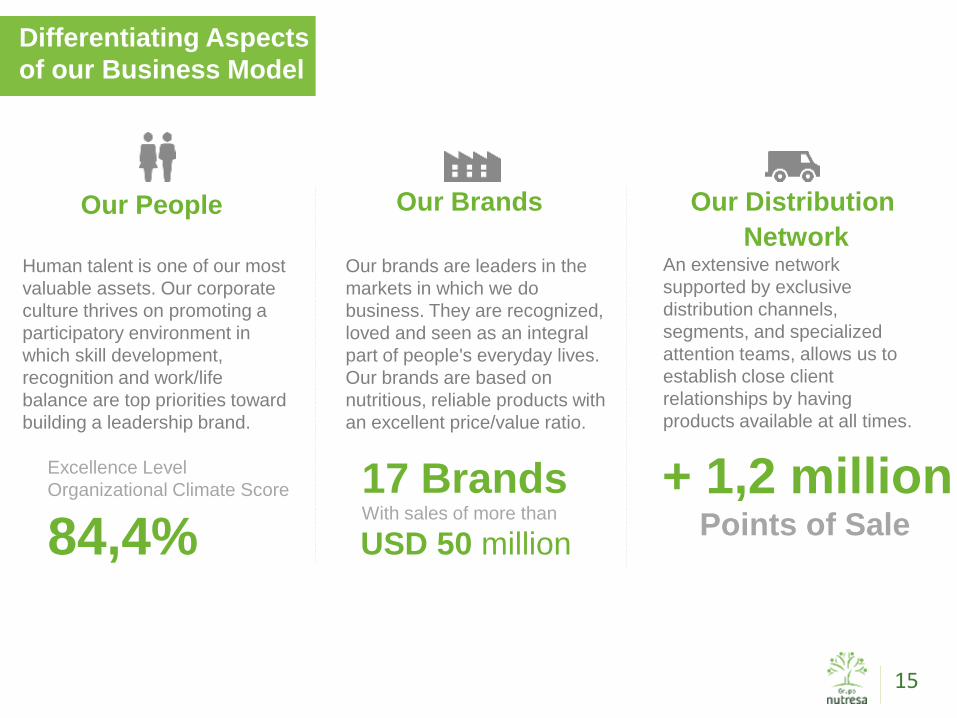
Our People
Human talent is one of our most
valuable assets. Our corporate
culture thrives on promoting a
participatory environment in
which skill development,
recognition and work/life
balance are top priorities toward
building a leadership brand.
Our Brands
Our brands are leaders in the
markets in which we do
business. They are recognized,
loved and seen as an integral
part of people's everyday lives.
Our brands are based on
nutritious, reliable products with
an excellent price/value ratio.
Our Distribution
NetworkAn extensive network
supported by exclusive
distribution channels,
segments, and specialized
attention teams, allows us to
establish close client
relationships by having
products available at all times.
Excellence Level
Organizational Climate Score
84,4%17 BrandsWith sales of more than
USD 50 million
+ 1,2 millionPoints of Sale
Differentiating Aspects
of our Business Model
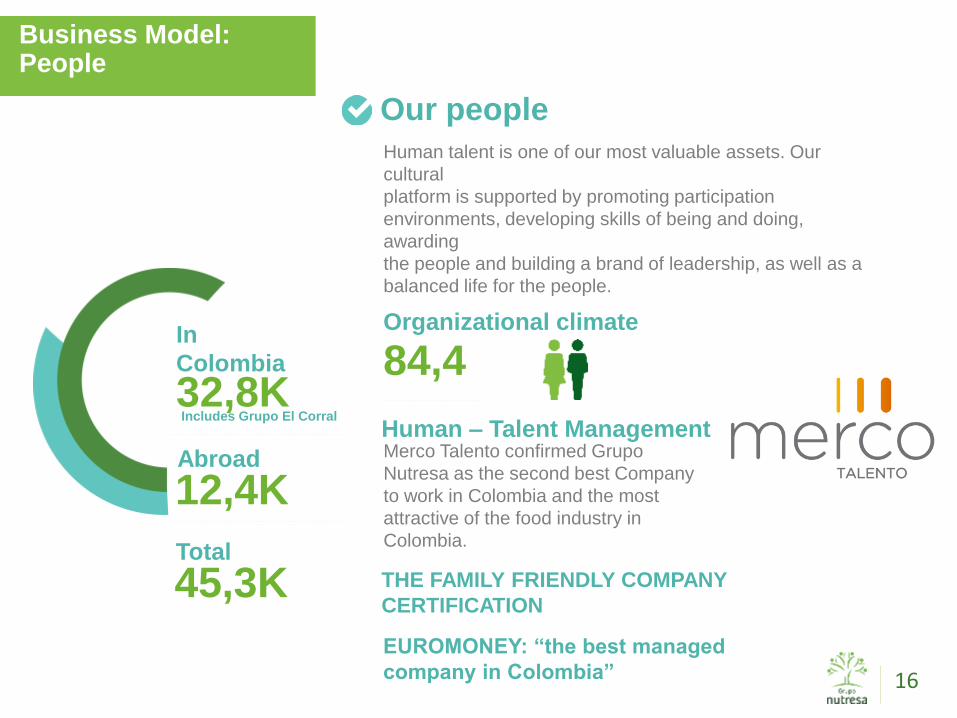
Business Model:People
Our people
Human – Talent ManagementMerco Talento confirmed Grupo
Nutresa as the second best Company
to work in Colombia and the most
attractive of the food industry in
Colombia.
THE FAMILY FRIENDLY COMPANY
CERTIFICATION
In
Colombia
32,8K
Total
45,3K
Abroad
12,4K
84,4Organizational climate
Includes Grupo El Corral
16
EUROMONEY: “the best managed
company in Colombia”
Human talent is one of our most valuable assets. Our
cultural
platform is supported by promoting participation
environments, developing skills of being and doing,
awarding
the people and building a brand of leadership, as well as a
balanced life for the people.

Business Model:Brands
17
Biscuits
Chocolates
Cold cuts
Coffee
TMLUC
Ice Cream
Pasta
Retail Food

Business Model:Brands
Portfolio of
17 brands
22 brands
44 brands
28
157 brands
selling over
USD$50 MM
market share in key markets
with #1
with over years of existence 20
present in more
than one marketbrands
18

InternationalExpansion Model
Vision
• Market expansion in the strategic
region – diversification of
destinations
• Long–term objectives
• Autonomy and strategic coherence
Internationalization strategies
• Our own international distribution
• Creation of the brand
• Acquisitions–productive platforms
Our own model -
Developed in house
Consistency in implementationPersistence in the face of difficulties
Humility and a learning attitude Suitable teams
Human quality and basic competencies
Skill-specific people development
19

International Phases
Exportablesurpluses
First steps
Sales bydistributors
Knowledgeof new markets
Lack of knowledge of the markets
Trainingqualified teams
By orderContinuous, more
profitable operation
Marginal profitability
Temporary alliances Value creation
Definion of the strategicregion based on“competitiveness”
Acquisitions inthe strategic region
Creation of CordialsasFree – tradeagreements
Our exclusivedistribution
Companies withbrands and distribution
Brand developmentVehicle to exchange
platforms
Knowledgeof consumers
Synergies
Value networks
Appropriate portfolio Talent / cultures
Talent / cultures Value creation
PartnershipOur OwnDistribution
ProductivePlatformExports
20

Corporate Philosophyand Performance
21

El Reconocimiento Emisores – IR otorgado por la Bolsa de Valores de Colombia S.A.no es una certificación sobre la bondad de los valores inscritos ni sobre la solvencia del emisor
Sustainable Growth
22

1.843 2.243 2.578 2.893 3.092 3.233 3.496 3.795 3.872 4.2044.916
454629
8711.116
1.496 1.2261.561
1.5112.026
2.258
3.030
0
1.000
2.000
3.000
4.000
5.000
6.000
7.000
8.000
9.000
Increasing ValueGeneration
23
• 2/3 organic (aprox. 1/3 price & 2/3 volume)• 1/3 inorganic
Growth
LAST 10 YR
11,6%CAGR
20,9% CAGR
10,3%CAGR
13,2%CAGR
Local Market (Colombia)
MIL
LIO
N P
ES
OS
MIL
LIO
N P
ES
OS
326 383529 570 551 538 568
671833 864
976
14,2%13,3%
15,3%14,2%
12,0% 12,1%11,2%
12,6%14,1%
13,4%12,3%
0%
2%
4%
6%
8%
10%
12%
14%
16%
18%
0
200
400
600
800
1.000
1.200
2005 2006 2007 2008 2009 2010 2011 2012 2013 2014 2015
EBITDA
Margin
Sales evolution
Ebitda evolution
International
LAST 10 YR
Total

Adjusted Multiple
24
TRM jun-30/2016 2.916,15$
Share price (US$) 8,61$ Precio (COP$) 25.100$
Shares outstanding (MM) 460 Acciones en circulación (MM) 460
Market cap (US billions) 3,96$ Capitalización de mercado (COP Billones) 11,55$
3 Mo. ADTV (US millions) 1,62$ 3 Meses volumen promedio transado (COPmm) $ 4.717
12 Mo. ADTV (US millions) 1,33$ 12 Meses volumen promedio transado (COPmm) 3.873$
Value of Investments (US billions) 1,34$ Valor de las Inversiones (COP Billones) 3,92$
12.7% of Grupo Sura 0,51$ 12.7% de Grupo Sura (COP Billones) 1,48$
12.4% of Grupo Argos 0,78$ 12.4% de Inversiones Argos (COP Billones) 2,27$
Other investments 0,06$ Otras inversiones 0,17$
Implied Market Cap (Ex. Investments) 2,62$ Capitalización de Mercado (Ex. Inversiones) 7,63$
EBITDA 12M (1) 0,36$ Ebitda 12 meses (1) 1,05$
Net Debt (1) 1,02$ Deuda Neta (COP Billones) (1) 2,97$
Cash 0,07$ Caja 0,21$
Adjusted Enterprise Value (US billions) 3,63$ Valor de Mercado Ajustado (COP Billones) 10,60$
Enterprise Value / EBITDA 10,1 Valor de mercado ajustado / EBITDA 10,1 Deuda Neta / EBITDA 2,82 Net Debt / EBITDA(1) 2,82
(1) Food companies, ex cluding inv estments
in unconsolidated companies / 12 months
(1) Grupo de alimentos ex cluy endo inv ersiones en
sociedades que no consolidan/12 meses

25
Multiples as of June 30, 2016
Closing price 25.100 Dividend yield (2) 1,9%
Closing price 12 months prior 22.900 Price change (2) 9,6%
Max. 52 Weeks 26.260 Total return (2) 11,7%
Min. 52 Weeks 18.800 Change in COLCAP (2) 0,0%
Market cap. (COPMM) 11.549.099
Return on assets (1) 9,2%
Book value 17.775 Return on equity (1) 9,1%
PE (1) 20,2 Return on invested capital (1) 8,7%
P/BV (1) 1,8
EV / EBITDA (1) 10,1 Outstanding shares 460.123.458
EPS (COP) 932 Number of shareholders 13.768
Bursatility High
Dividend per share/month 41,5
(1) Food companies, ex cluding inv estments
(2) last 12 months
10,0
14,2
10,2 10,112,6
16,7
12,9 12,0 12,1 12,5
9,8 10,1
17,0
20,3
14,713,1
18,1
23,8
18,5 18,016,5 17,3
13,4 13,8
0
5
10
15
20
25
2.005 2.006 2.007 2.008 2.009 2.010 2.011 2.012 2.013 2.014 2.015 2.016
EV/EBITDA
EV/EBITDA Alimentos - food EV/EBITDA Total

Consolidated net debt
26
RATIO dic-11 dic-12 dic-13 dic-14 mar-15 jun-15 sep-15 dic-15 mar-16 jun-16
Net debt / EBITDA 0,86 0,59 1,90 2,02 3,21 3,29 3,08 2,88 2,86 2,82
EBITDA / Interest 8,85 12,74 10,38 6,36 5,80 5,01 4,93 4,70 4,54 4,25
Interest / Sales 1,27% 0,99% 1,36% 2,10% 2,20% 2,49% 2,53% 2,61% 2,71% 2,89%
486 399
1.5811.749
2.7142.863 2.872 2.808
2.923 2.966
0
500
1.000
1.500
2.000
2.500
3.000
3.500
dic/11 dic/12 dic/13 dic/14 mar/15 jun/15 sep/15 dic/15 mar/16 jun/16
CO
P B
ILL
ION

Debt Profile as 2Q16
27
Debt by Currency (5) Current Debt by Interest Rate (5) Current
COP 82,9% IBR 35,1%
CLP 12,6% DTF 26,6%
PEN 3,3% IPC 19,5%
USD 1,1% TAB Nominal 9,2%
MXN 0,1% Tasa Fija > 1 Año 5,1%
VEF 0,0% Tasa Fija < 1 Año 4,0%
LIBOR 0,6%
Currency Risk (6) Current
COP 82,9% Intetest Rate Risk (6) Current
CLP 12,6% IBR 35,1%
PEN 3,3% DTF 26,6%
USD 1,1% IPC 19,5%
MXN 0,1% TAB Nominal 9,2%
VEF 0,0% Tasa Fija > 1 Año 5,1%
Tasa Fija < 1 Año 4,0%
LIBOR 0,6%
Cost of Debt Amount (Millions) Av. Int. rate (4) Maturity (2) (According Amort)
Bilateral COP $ 1.891.410 9,05% (4) Long-term (>5 years) 18,3%
Fideicomiso GN Bonds $ 401.459 13,20% Medium-term (1-5 years) 55,3%
Bilateral other currencies (3) $ 417.092 5,15% (7) Short-term (<1 year) 26,4%
Finagro $ 291.676 7,71% Average Life 2,89
Peru Bonds $ 104.544 8,84%
Letters of Credit $ 11.748 1,57%
Leasing $ 16.455 9,09%
Tasa promedio sin Impuestos 8,91%
Value of Debt (1) Amount (Millions)
Debt (does not include interests payable and others) 3.134.385
Total Debt 3.172.212
Net Debt 2.965.569
Notas:
(6) Currency and interest rate risk incurred after hedge.
(7) This interest rate includes foreign currency loans (not hedged) as in it original terms, but not currency variance costs.
FINANCIAL OBLIGATIONS - JUNE 2016
(1) All calculations are based on "Debt (does not include interests payable and others)".
(2) Maturity according to loans capital amortization.
(3) Total of all foreing currency loans, even if they are hedged.
(4) Interest rate includes the cost of the hedge.
(5) Original terms (interest rates and currencies) of the loans. The hedges are not included.

44,1%
13,3%8,0%
6,7%
7,0%
5,5%
4,1%
3,4%
4,1% 1,8%
2,3%
Raw materials
COGS BREAKDOWNGRUPO NUTRESA
COMMODITIES INDEX (1H16)
28
Packaging mat.Coffee
Pork
Wheat
Cocoa
Beef
Oils & fats
Sugar Milk
Other
Poultry
92
86
107
144
113
95
112
8782
75
90
105
120
135
150
165
2008 2009 2010 2011 2012 2013 2014 20152016
GNCI

Highlights
DJSI 2015
5X
World’s Highest Scores in Food industry in:Economic dimension:
• Risk and crisis management• Codes of conduct
Environmental dimension:• Hydric resources management• Packaging material
Social dimension:• Labor practices and human rights• Corporate citizenship• Social report.

Contact Details
This presentation and further detailed
information can be found in the following link in
our section "Grupo Nutresa Valuation Kit":
http://www.gruponutresa.com/es/content/grupo-
nutresa-valuation-kit-gnvk
Alejandro Jiménez MorenoInvestor Relations DirectorTel: (+574) 3258731email: [email protected]
For more information regarding Grupo Nutresa´s level 1ADR, please call
The Bank of New York Mellon marketing desk
NEW YORK
BNYM – Latin America
Gloria Mata
Telephone 212 815 5822
BNYM – Sell-Side
Kristen Resch
Telephone 212 815 2213
BNYM – Buy-Side
Angelo Fazio
Telephone 212 815 2892
BNYM – Sell-Side/Buy-Side
Mark Lewis
Telephone 44 207 964 6415
NEW YORK NEW YORK LONDON
31

Disclaimer
This document can contain forward looking statements related
to Grupo Nutresa S.A. and its subordinated companies, under
assumptions and estimations made by company management.
For better illustration and decision making purposes Grupo
Nutresa’s figures are consolidated; for this reason they can
differ from the ones presented to official entities. Grupo
Nutresa S.A. does not assume any obligation to update or
correct the information contained in this document.
“The Issuers Recognition – IR granted by the Colombian Stock Exchange is not a certification
about the quality of the securities listed at the BVC nor the solvency of the issuer”
32

2Q16 RESULTS

SALES PERBUSINESS UNIT
2Q - 2016
Colombia salesCOP 1.297,7 mm +9,5%Cop billion
34
International SalesUSD 268,7 mm -0,1%
COP 803,4 +19,5%Cop billion
2Q16 Sales
Colombia and international
Percentage variation in
volume (Q) and prices (P)
International sales
Ex-Venezuela: -3,5%
% chg. YoY Million dollars
% chg. YoY Billion pesos
* Tresmontes Lucchetti
** Previously reported as Ice Cream
Retail Food
Cold cuts Biscuits Chocolates Coffee
Cold Cuts Biscuits Chocolates CoffeeTMLUC*
RetailFood
PastaIce cream
* Variation doesn’t include
el Corral
401,9
201,3 216,7
139,2109,9 104,4
73,2
050
100150200250300350400450
CO
P B
ILLIO
N
+8,6%
+14,4%
+6,0%-0,6%
+15,4%
Q: +0,2P: +9,6*
+11,2%
+5,5%
Q:+1,2
P:+7,3
Q:-2,2
P:+13,8
Q:+4,6
P:+9,4
Q:+2,3
P:+3,6
Q:-5,1
P:+4,7
Q:+8,8
P:+6,0
28,1
69,1
39,8
83,5
29,5
17,5
0
10
20
30
40
50
60
70
80
90
US
D M
ILLIO
N
-2,2%
+44,6%
+8,3%
-7,8%
+1,7%
-13,7%
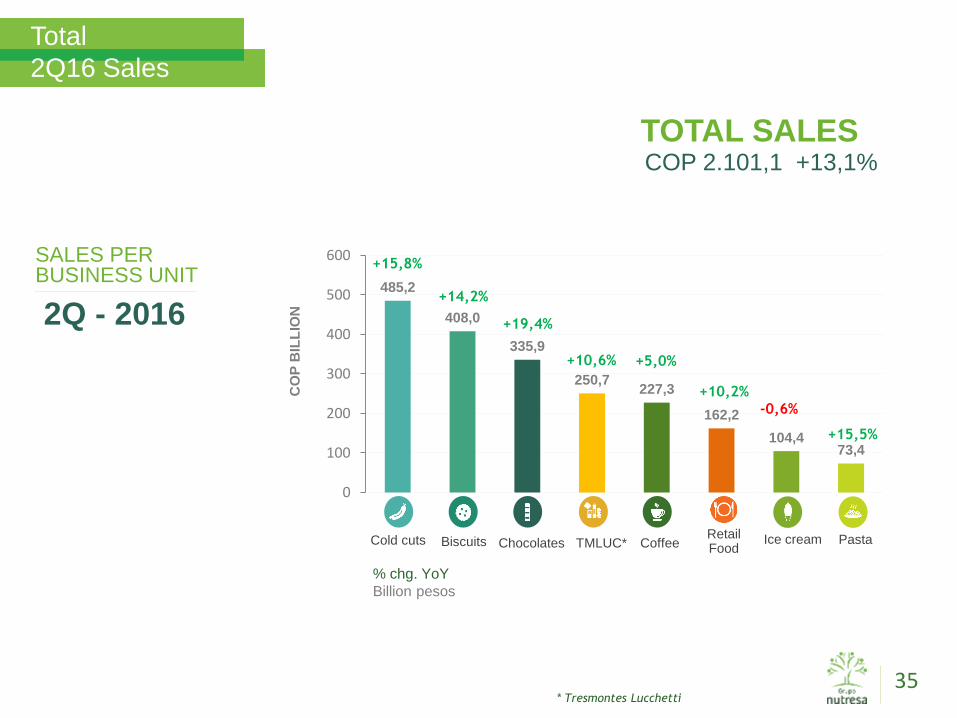
COP 2.101,1 +13,1%
35
Total
2Q16 Sales
* Tresmontes Lucchetti
% chg. YoY
Billion pesos
SALES PERBUSINESS UNIT
2Q - 2016
TOTAL SALES
Cold cuts Biscuits Chocolates CoffeeTMLUC* PastaRetailFood
Ice cream
485,2
408,0
335,9
250,7227,3
162,2
104,473,4
0
100
200
300
400
500
600
CO
P B
ILL
ION
+15,8%
+14,2%
+19,4%
-0,6%
+10,6% +5,0%
+15,5%
+10,2%

EBITDA
1Q16
EBITDA
COP 281,0 +19,6%Billion pesos
MARGIN 13,4%
36* Tresmontes Lucchetti
Convention:
Cold cuts Biscuits Chocolates CoffeeTMLUC* PastaRetail Food
Ice cream
73,4
53,7
29,426,3
50,6
22,918,6
4,9
0
10
20
30
40
50
60
70
80
CO
P B
ILL
ION
9,4%
-3,8% 14,1%
N/A
14,9%
+31,3%
13,0%
+10,5%
10,7%
+15,9%15,7%
+26,4%
20,4%
+12,3%
7,5%
-34,9%

Organic growth: +15,4%
COP 4.205,3 +17,4%
37
Total
1H16 Sales
* Tresmontes Lucchetti
% chg. YoY
Billion pesos
SALES PERBUSINESS UNIT
1H - 2016
TOTAL SALES
Cold cuts Biscuits Chocolates CoffeeTMLUC* PastaRetailFood
Ice cream
976,6
822,5
647,1
495,7 475,1
324,3
223,4
138,9
0
200
400
600
800
1.000
1.200
CO
P B
ILL
ION
+16,5%
+18,6%
+16,0%
+5,4%
+14,1% +11,9%
+11,4%

EBITDA
2Q16
EBITDA
COP 253,2 +13,1%Billion pesos
MARGIN 12,1%
38* Tresmontes Lucchetti
Convention:
Cold cuts Biscuits Chocolates CoffeeTMLUC* PastaRetail Food
Ice cream
74,8
46,4
26,8 26,5
38,7
21,9
8,2 8,1
0
10
20
30
40
50
60
70
80
CO
P B
ILL
ION
8,0%
+10,1%13,5%
-15,3%
15,4%
+38,6%
11,4%
+20,3%
10,6%
+8,7%
7,8%
-26,8%
17,0%
+15,4%
11,1%
+8,8%

EBITDA
1H16
EBITDA
COP 534,2 +16,4%Billion pesos
MARGIN 12,7%
39* Tresmontes Lucchetti
Convention:
Cold cuts Biscuits Chocolates CoffeeTMLUC* PastaRetail Food
Ice cream
148,2
100,1
56,2 52,8
89,3
44,8
26,8
13,0
0
20
40
60
80
100
120
140
160
CO
P B
ILL
ION
8,7%
+2,3% 13,8%
N/A
15,2%+34,9%
12,2%
+14,9%
10,7%
+12,2%
12,0%
+3,5%
18,8%
+13,6%
9,4%
-13,1%

Consolidated
Income statement 1H16
40
Operating revenue 4.205.283 3.583.401 17,4%
Cost of goods sold (2.399.295) -57,1% (2.017.246) -56,3% 18,9%
Gross profit 1.805.988 42,9% 1.566.155 43,7% 15,3%
Administrative expenses (193.987) -4,6% (183.084) -5,1% 6,0%
Sales expenses (1.128.655) -26,8% (956.200) -26,7% 18,0%
Production expenses (69.304) -1,6% (64.634) -1,8% 7,2%
Exchange differences on operating assets and liabilities 15.786 0,4% 7.880 0,2% 100,3%
Other operating expenses, net 8.556 0,2% 2.091 0,1% 309,2%
Operating profit 438.384 10,4% 372.208 10,4% 17,8%
Financial income 4.647 0,1% 4.956 0,1% -6,2%
Financial expenses (152.953) -3,6% (110.270) -3,1% 38,7%
Portfolio dividends 50.494 1,2% 46.962 1,3% 7,5%
Exchange differences on non-operating assets and liabilities (12.353) -0,3% 12.914 0,4% -195,7%
Loss on net monetary position (18.527) -0,4% (7.366) -0,2% 151,5%
Share of profit of associates and joint ventures 804 0,0% 1.148 0,0% -30,0%
Other income, net - 0,0% 62 0,0% -100,0%
Income before tax and non-controlling interest 310.496 7,4% 320.614 8,9% -3,2%
Current income tax (98.207) -2,3% (89.863) -2,5% 9,3%
Deferred income tax 20.959 0,5% 4.815 0,1% 335,3%
Profit after taxes from continuous operations 233.248 5,5% 235.566 6,6% -1,0%
Discontinued operations, after income tax (247) 0,0% (4.314) -0,1% -94,3%
Net profit for the year 233.001 5,5% 231.252 6,5% 0,8%
Non-controlling interest 1.917 0,0% 968 0,0% 98,0%
Profit for the period attributable to controlling interest 231.084 5,5% 230.284 6,4% 0,3%
EBITDA 534.203 12,7% 458.883 12,8% 16,4%
% Revenues % Var2016-Acum % Revenues 2015-Acum
For further details please check the notes of the financial statements on the following link:http://www.gruponutresa.com/inversionistas/resultados-y-publicaciones/resultados-trimestrales/?lang=en#2016-2

Balance sheet1H 2016
41
June 2016 Var.December
2015
ASSETS
Current assets
Cash and cash equivalents 206.643 -27,8% 286.064
Trade and other receivables 819.646 -6,7% 878.280
Inventories 1.083.821 4,9% 1.032.969
Biological assets 59.385 11,8% 53.119
Other current assets 279.691 26,7% 220.762
Non-current assets held for sale 65.702 -8,3% 71.679
Total current assets 2.514.888 -1,1% 2.542.873
Non-current assets - -
Trade and other receivables 26.190 -2,0% 26.729
Non-current, biological assets 6.491 13,9% 5.699
Investments in associated and joint ventures 161.255 47,9% 109.021
Other financial non-current assets 3.756.035 9,9% 3.418.149
Property, plant and equipment, net 3.312.068 -2,1% 3.383.722
Investment properties 77.368 -6,1% 82.393
Goodwill 2.018.384 -0,7% 2.033.403
Other intangible assets 1.155.162 -2,1% 1.179.957
Deferred tax assets 365.896 2,9% 355.461
Other assets 44.171 8,7% 40.645
Total non-current assets 10.923.020 2,7% 10.635.179
TOTAL ASSETS 13.437.908 2,0% 13.178.052
June 2016 Var.December
2015
LIABILITIES
Current liabilities
Financial obligations 862.246 -18,6% 1.059.660
Trade and other payables 861.844 4,4% 825.435
Tax charges 205.184 19,1% 172.323
Employee benefits l iabilities 129.825 -19,2% 160.628
Current provisions 2.901 -34,3% 4.415
Other l iabilities 22.619 -15,1% 26.641
Total current liabilities 2.084.619 -7,3% 2.249.102
Non-current liabilities
Financial obligations 2.309.966 13,5% 2.034.604
Trade and other payables 159 0,0% 159
Employee benefits l iabilities 226.813 7,2% 211.533
Deferred tax liabilities 636.888 -0,5% 639.810
Other l iabilities 801 0,0% -
Total non-current liabilities 3.174.627 10,0% 2.886.106
TOTAL LIABILITIES 5.259.246 2,4% 5.135.208
SHAREHOLDER EQUITY
Equity attributable to the controlling interest 8.143.026 1,7% 8.008.485
Non-controlling interest 35.636 3,7% 34.359
TOTAL SHAREHOLDER EQUITY 8.178.662 1,7% 8.042.844
TOTAL LIABILITIES AND EQUITY 13.437.908 2,0% 13.178.052
For further details please check the notes of the financial statements on the following link:http://www.gruponutresa.com/inversionistas/resultados-y-publicaciones/resultados-trimestrales/?lang=en#2016-2

GRUPO EL CORRAL
Acquisition
93%OWN BRANDS GLOBAL BRANDS
FINAL PRICE
743,4 COP billion (USD ~ 313 mm)
COMBINED SALES
mm407,600(USD~171 mm)
EBITDA STORES
345 17
MAIN PRO-FORMA FIGURES 2014
Employees
COP73,500(USD~31 mm)
STORES ABROAD
FINANCING
685 COP billion
Bank loans
(USD~288 mm)
Cash
(USD~25 mm)
EBITDA MARGIN
18%Franchised
OF SALES7%OF SALES
COPmm
Colombia
5.000
42
58,4 COP billion

Channel Evolution: Colombia
43
6,2% 6,8% 7,0% 8,0% 6,7% 7,7% 7,6% 8,6% 6,8% 7,6% 7,9% 8,3% 6,9% 7,4% 8,1% 8,9% 7,0% 7,9% 8,3% 9,4% 8,5% 8,1%
18,2% 18,5% 17,6% 19,0% 18,1% 17,9% 17,5% 19,1%18,8% 17,8% 18,1% 19,0% 18,8% 18,7% 18,7% 19,4%
19,5% 19,2% 18,6% 19,5% 18,6% 19,2%
1,4% 1,6% 1,8%1,4%
1,4% 1,4% 1,4%1,3%
1,3% 1,4% 1,3% 1,4% 1,6% 1,5% 1,5% 1,6% 1,6% 1,5% 1,6%1,5% 1,8% 1,7%4,3% 4,3% 4,2%
4,2% 6,4% 7,1% 6,8%6,2%
6,7% 6,9% 6,8% 4,0% 3,8% 4,1% 3,9% 4,0%3,9% 4,0% 4,1%
4,4% 3,9% 3,8%
70,0% 68,7% 69,4% 67,5% 67,4% 66,0% 66,6% 64,8% 66,5% 66,2% 65,8% 67,3% 68,9% 68,3% 67,7% 66,0% 68,0% 67,3% 67,4% 65,1% 67,2% 67,3%
0%
10%
20%
30%
40%
50%
60%
70%
80%
90%
100%
Trim 1- 11
Trim 2- 11
Trim 3- 11
Trim 4- 11
Trim 1- 12
Trim 2- 12
Trim 3- 12
Trim 4- 12
Trim 1- 13
Trim 2- 13
Trim 3- 13
Trim 4- 13
Trim 1- 14
Trim 2- 14
Trim 3- 14
Trim 4- 14
Trim 1- 15
Trim 2- 15
Trim 3- 15
Trim 4- 15
Trim 2- 16
Trim 1- 16
2011 2012 2013 2014 2015 2016
Alternative Supermarkets Chains Industrial Food Service Traditional(Mom-and-pop stores)/independentRetail Stores