gs 1321 issuane 4 omprehensive monitoring report
TRANSCRIPT

GS 1321
ISSUANCE 4
COMPREHENSIVE
MONITORING REPORT
Monitoring Period: April 1st, 2016 to March 31st, 2018

DOC REV 15/10/18.1
Page 1
Table of Contents
FOREWORD ...........................................................................................................................4
Continuous Monitoring.................................................................................................................. 5
DEVIATION FROM GOLD STANDARD .......................................................................................7
SUMMARY PROJECT DESCRIPTION ....................................................................................... 10
Project Partners ........................................................................................................................... 10
Key Development Milestones ...................................................................................................... 11
Project Technologies ................................................................................................................... 11
Summary in Sustainable development indicators ....................................................................... 12
Reduction in Ecoestufa clean cookstove production .................................................................. 16
Baseline & Project Scenarios Defined in the PDD ....................................................................... 16
Manufacturing & Distribution ..................................................................................................... 17
FORWARD ACTIONS REQUESTS ............................................................................................ 19
FAR 1: Neutral and unbiased survey. .......................................................................................... 19
PROJECT RECORD KEEPING & DATABASES ............................................................................ 19
SALES RECORDS & CARBON RIGHTS WAIVERS ............................................................................ 19
MONITORING PLAN DESCRIPTION ........................................................................................ 24
SUMMARY OF MONITORING REQUIRED & conducted ............................................................... 24
SAMPLING METHOD .................................................................................................................... 25
DATA collection, analysis and QAQC ........................................................................................... 26
SURVEY EQUIPMENT CALIBRATION............................................................................................. 28
Procedures for Minimizing Non-Sampling Errors & Internal QAQC ............................................ 28
Outlier Removal ........................................................................................................................... 29
KEY FIXED (EX-ANTE) DATA & PARAMETERS ......................................................................... 29
DATA/PARAMETERS DERIVED FROM IPCC defaults .................................................................... 29
DATA/PARAMETERS DERIVED FROM BASELINE MONITORING................................................... 32
KEY MONITORED (EX-POST) DATA & PARAMETERS ............................................................... 34
EFFICIENT STOVE TECHNOLOGIES ............................................................................................... 34
WATER TREATEMENT TECHNOLOGIES ........................................................................................ 37

DOC REV 15/10/18.1
Page 2
HOUSEHOLD DEMOGRAPHICS: ALL MONITORING ................................................................. 41
KPT MONITORING RESULTS: HH-DUAL EFFICIENT STOVES ..................................................... 42
Overview of Surveys Conducted .................................................................................................. 42
Project Fuel Consumption and Savings ....................................................................................... 43
MS/US MONITORING RESULTS: HH-DUAL EFFICIENT STOVES ................................................ 45
Overview of Surveys Conducted .................................................................................................. 45
Usage rate & person meals.......................................................................................................... 46
Frequency of Use ......................................................................................................................... 47
Baseline Fuel & Stove practices ................................................................................................... 48
Heating Practices ......................................................................................................................... 49
Sustainable Development Indicators ........................................................................................... 49
Customer Satisfaction .............................................................................................................. 51
WCFT MONITORING RESULTS: HH-WT & HH-DUAL WATER FILTERS ....................................... 53
Overview of Surveys Conducted .................................................................................................. 53
water Consumption and boiling .................................................................................................. 54
MS/US MONITORING RESULTS: HH-WT & HH-DUAL WATER FILTERS ..................................... 56
Overview of Surveys Conducted .................................................................................................. 56
Usage rate & users per filter ........................................................................................................ 56
baseline stove & fuel type ........................................................................................................... 59
Sustainable Development Indicators ........................................................................................... 59
Customer Satisfaction .............................................................................................................. 61
WATER QUALITY MONITORING ............................................................................................ 62
PROJECT LEAKAGE ASSESSMENT........................................................................................... 63
Leakage Source 1 ......................................................................................................................... 63
Leakage Source 2 ......................................................................................................................... 63
Leakage Source 3 ......................................................................................................................... 63
Leakage Source 4 ......................................................................................................................... 66
Leakage Source 5 ......................................................................................................................... 66
NEXT MONITORING PERIOD: ................................................................................................ 67
FAR for next issuance .................................................................................................................. 67
EMISSIONS REDUCTIONS EQUATIONS & CALCULATIONS ....................................................... 68
Emission Reductions .................................................................................................................... 70
SUMMARY SALES & DISTRIBUTION USED FOR ER CALCULATIONS .......................................... 72
TOTAL CALCULATED ERS: MONITORING PERIOD 4 ................................................................. 73

DOC REV 15/10/18.1
Page 3
LIST OF SUPPORTING DOCUMENTS PROVIDED WITH THIS REPORT ........................................ 75

DOC REV 15/10/18.1
Page 4
FOREWORD
This Comprehensive Monitoring Report documents the implementation activity, monitoring, and emissions
reductions of GS1321 Ecofiltro Guatemala Improved Stove and Water Purification Project (“the Project”) during
the Issuance 4 Monitoring Period of April 1st, 2016 to March 31, 2018, including all sales of Ecofiltro water filters
and Ecoestufa efficient cookstoves to rural households in Guatemala from the Project’s inception through the end
of the current monitoring period. It is designed to deliver all of the relevant data and descriptions required for
complete review and verification of the Project and includes the following reports in their entirety:
• Kitchen Performance Test Report
• Water Consumption Field Test Report
• Water Quality Test Report
• NRB Leakage Report
• Monitoring and Usage Report
Rather than producing separate reports for each of the major areas of monitoring and then summarizing those
reports in this document, Natural Capital Partners has elected to include full report content for all monitored
parameters in one document, thereby reducing unnecessary duplication of information across various reports and
decreasing the likelihood of errors caused by reporting data that is subject to change during the audit process and
which must be tracked and edited across multiple documents through each successive round of review.
Similarly, the collection and analysis of data from field monitoring has been simplified by combining raw and
analyzed data into a select few Microsoft Excel spreadsheets. Rather than presenting separate spread sheets for
each of the above mentioned reports (many of which use data from the others in calculating key parameters) all
required data for review and verification has been included in 2 key spreadsheets:
• ER Calculations Spreadsheet
• MS_US_WCFT_KPT_WQT Data Spreadsheet
As with the intent of the Comprehensive Monitoring Report, this reduction of source documents simplifies the
review process and reduces possible errors by drawing all raw data into one place and pulling all analysis directly
from raw data sources rather than manually transferring key data points from one spreadsheet to another when
the outputs from one analysis are needed to complete another.
Where individual reference documents or spreadsheets from outside sources or from prior issuance periods are
required to support outcomes presented in this issuance, those documents are presented in their original form,
typically as distinct documents provided along with this report and the above key current issuance spreadsheets.

DOC REV 15/10/18.1
Page 5
CONTINUOUS MONITORING
For Issuance 4, Natural Capital Partners continues the monitoring process called Continuous Monitoring
implemented by The Paradigm Project for Issuance 3. In February of 2015, The Paradigm Project (a previous
Project Participant) created a concept to monitor household activities within each of its programs continuously
throughout the year rather than in a concentrated period of weeks each year. Although the Gold Standard (“GS”)
Methodology - Technologies and Practices to Displace Decentralized Thermal Energy Consumption (“TPDDTEC”) -
11/04/2011 does not specify the mode of collecting monitoring data (annual, periodic or continuous), for the sake
of clarity, Paradigm requested an opinion from GS on the continuous monitoring concept and received clarification
that it was indeed allowed by the methodology in an email dated 11 Feb 2015 and subsequently in an face to face
meeting between Vikash Talyan (GS) and Neil Bellefeuille (The Paradigm Project) on Friday, June 5th 2015, in
Minneapolis, Minnesota. Continuous Monitoring follows the TPDDTEC methodology exactly, but seeks to monitor
households at various times throughout the monitoring period, capturing data that is more representative of
actual usage patterns rather than relying on respondents to recall activities that may have happened far in the
past.
Continuous Monitoring offers the following benefits:
• Greater depth of consumer insight.
• Improved data accuracy and consistency.
• Reduced disruption of ongoing field activities.
• Reduced risk via real-time refinement of activities derived through continuous field input.
Specifically, Continuous Monitoring offers improved data accuracy and consistency over traditional, short-term
monitoring by replacing questions that previously relied on the respondent’s memory of past events with actual
observation and collection of that data during the monitoring period. For instance, the TPDDTEC methodology
seeks to ascertain the number of people each household cooks for through a Monitoring Survey. GS has historically
required that the Project Proponent include questions within the monitoring survey to determine whether the
number of meals cooked or the number of people cooked for fluctuates between the harvest, rainy and dry
seasons. This logic clearly assumes monitoring that is conducted in a concentrated period of time annually (for
instance within a 4-week period that may fall in any one season, but is unlikely to extend over several seasons) as
it requires the surveyor to ask the respondent to recall whether those numbers have fluctuated historically. Within
this mode of working, survey outcomes rely on the respondent’s recollection of the number of people cooked for
in seasons and at times that could be 6 or more months removed. Self-reported data relying on the accuracy of
human memory is dubious at best and thus Natural Capital Partners has continued this more accurate way to
monitor the Project.
Continuous Monitoring reduces the possibility of error by eliminating such questions in favor of monitoring
households across all seasons and all conditions, collecting data in real time that accurately reflects the activities
of the household in those seasons. As such, some of the traditional seasonally-comparative data points are
eliminated in favor of data that has been collected and averaged over the complete range of seasons,

DOC REV 15/10/18.1
Page 6
circumstances and households represented in the project. Where such changes have been implemented, the data
is noted as being Continuous Monitoring data that incorporates seasonality.
Additionally, surveys such as KPTs and WCFTs which are required to be conducted biennially are incorporated into
the flow of the continuous, annual monitoring program. Doing so provides several benefits:
1. It increases the frequency and therefore accuracy of the data by incorporating recent changes into key
parameters and calculations used to determine VER volumes.
2. It doubles the sampling size by achieving the minimum required sample annually instead of biennially.
Here again, we believe this increases accuracy and robustness of the data.
The tables below summarize required and targeted survey output per project scenario:
Project Scenario 1: hh-wt Ann Min Req Ann Target
Water Consumption Field Test (WCFT) 30 (biennially) 30
Water Quality Test (WQT) 90/10 rule 20
Filter Monitoring & Usage Survey (MS/US) 100: 30/tech age 1001
Project Scenario 2: hh-dual Ann Min Req Ann Target
Kitchen Performance Test (KPT) 30 (biennially) 30
Stove Monitoring & Usage Survey (MS/US) 100: 30/tech age 1002
Water Consumption Field Test (WCFT) 30 (biennially) 30
Water Quality Test (WQT) 90/10 rule 203
Filter Monitoring & Usage Survey (MS/US) 100: 30/tech age 100
In every case throughout monitoring, as presented in this document, the PP assumed a minimum 1000
technologies in the field and thus elected to monitor at the highest minimum sample size requirements outlined
by the methodology.
For Monitoring Period 4, the PP was able to cover a full 12 months of project activity. Monitoring took place over
both dry and wet seasons, as well as during harvest and non-harvest seasons. While seasonal representation was
1 Water filters older than 2 years of age are removed from crediting, thus annual sampling minimum is 100 units with at least 30 of each age. 2 Currently the project has stoves ranging in age from 1 to 3 years of age, thus the minimum usage survey number is 100 (90 x 3 + 10). In the future this number will grow with the age range of stoves in the field. 3 Water Quality test results are combined across Project Scenario 1 and 2 as while usage may vary by Project Scenario, product performance is consistent.

DOC REV 15/10/18.1
Page 7
stated with 11% of surveys being done during harvest, and 44% during rainy season, as reported by survey
respondents in answer to the questions, “Is it currently the harvest season?” and “Is it currently the rainy or dry
season?”, 1% and 3% or fewer of respondents reported that the number of people served changes for them by
season when asked the question, “Does the number of people you serve daily change in the harvest/rainy/dry
season?”. Thus the data presented within is fully representative of the project scenario throughout all of the
varying seasons users’ experience.
DEVIATION FROM GOLD STANDARD
The PP proposed a deviation due to the lack of number of surveys for year 2017. The explanation of the deviation
proposed was the following:
“The project began its fourth monitoring period in April 2016. The annual monitoring continued its normal course
until May of 2017. At that point, the project participant The Paradigm Project elected to stop managing the project
and related activities.
As project participant, The Paradigm Project was in charge of carrying out the monitoring and documentation
necessary to maintain it as a Gold Standard carbon project, leaving the local partners without trained personnel
or qualified people to carry out the management of the project or the monitoring activities.
As project owner, Ecofiltro undertook the search for a highly qualified company to carry out and manage the Gold
Standard carbon project, taking many months to make the appropriate decision. An agreement was reached with
Natural Capital Partners at the end of December 2017 to begin work on the project in 2018.
During almost all of 2017 it was impossible to monitor due to the lack of resources not only economic, but also of
qualified personnel. Because of this the minimum number of Monitoring and Usage surveys couldn’t be reached
(TPDDTEC V.2011 Section III.1.C.a),b). The required number is at least 100 surveys per year.
The results of the percentage of use of the technology in the 4th monitoring period, despite a slightly lower total
number of surveys, is similar to previous monitoring periods and is statistically acceptable in the range of the
results (% Usage) obtained during the past verifications, showing that the project has not undergone major
changes over time. Current data also it demonstrate consistency in the use of filters and stoves by end-users.
An analysis of confidence limits (95%) for small samples was made to statistically study the difference between
the results of the percentage of use, which is one of the most important data variables and the main purpose of
the usage and monitoring survey.
The results for Issuance 4 are within the range of the limits, showing that there have been no substantial changes
in the drop off rates of the technologies in the 4th monitoring period, and the project remains steady and the
trends noted in previous monitoring periods are continuing.

DOC REV 15/10/18.1
Page 8
It is proposed to adopt the values obtained from data from the 4th monitoring period despite the slightly fewer
number of surveys. Using less than 100 surveys per year. The data is still within the necessary confidence interval
despite the difficulty involved in carrying out surveys in the period from May 2017 to January 2018.”
The Deviation was accepted with some modifications, Gold Standard response was the following:
Approved with Modification
PD shall use the measured usage values for 1st year and an adjusted usage value for 2nd year for this issuance
(MP4).
The adjusted usage value can be either:
• PD’s proposal of a justifiably conservative value; or
• the value applied in the PDD (if the 1st year measured usage value matches or is less than the PDD’s
value for the same year).
•
Because of this, it is proposed to use conservative values for calculations for Year 2. The variables affected by
surveys are:
• Persons per filter
• % LPG Users
• % Usage
Lower Limit 92.106379
Arithmetic Av 95.040813
Upper Limit 97.9752471
Lower Limit 96.9556499
Arithmetic Av 98.3886958
Upper Limit 99.8217417
Lower Limit 89.5941832
Arithmetic Av 94.579003
Upper Limit 99.5638227
Statistical Analysis
% Usage
Stoves
% Usage Filters
(Dual Scenario)
% Usage Filters
(Water T Scenario)
Issuance Stoves
1 92.39
2 97.13
3 97.29
4 93.55
Filters
1 97.44
2 97.27
3 99.26
4 99.63
Filters
1 97.44
2 88.42
3 96.17
4 96.88
Water Technologies
Dual
Scenario
% Usage

DOC REV 15/10/18.1
Page 9
It is proposed to use the lowest value in every issuance or the proposed in the PDD for the variables: Persons per
filter & % Usage, and the highest value for % LPG Users.
Variable Scenario
Persons Per filter Dual Water Technologies
5.18 (Iss 3) 5.03 (Iss 4 Year 1)
% LPG Users 1.00% (Iss 3) 6.06% (Iss 3)
% Usage Stoves Filters
88.42% (Iss 2) 92.39 (Iss 1) 95 (PDD)

DOC REV 15/10/18.1
Page 10
SUMMARY PROJECT DESCRIPTION
The Project promotes the use of improved stoves and water treatment technologies, and in turn generates carbon
credits in the voluntary market based on the greenhouse gas emissions reductions of these technologies. The
Project works through local organizations, NGOs and distributors to provide healthy and efficient cooking
technologies and greater access to safe drinking water. The revenues from carbon finance are invested into
subsidies, social marketing, and the development of robust distribution channels to further support the growth
and impact of the Project.
PROJECT PARTNERS
• Natural Capital Partners With 20 years’ experience and a global network of project partners, Natural Capital
Partners works with corporate clients to deliver high quality solutions that ensure immediate, positive
impact on carbon emission reductions, renewable energy, low carbon sustainable development and the
world’s natural capital. Natural Capital Partners has partnered with Ecofiltro to finance the ongoing carbon
asset development of this water filtration and improved cookstove project in Guatemala to ensure it meets
its goals for emission reductions and the provision of clean water. Natural Capital Partners is responsible
for the processes for tracking and monitoring the project’s results.
• Socorro Maya (SM) is a non-profit Guatemalan organization with the goal of serving the humanitarian needs
of the poor. Socorro Maya focuses on helping the “living Maya” with their greatest needs for health and
well-being, including replacing open cooking fires with highly efficient cooking stoves and introducing water
treatment technologies that significantly reduce water borne disease. Socorro Maya distributes the
Ecoestufa and Ecofiltro to Guatemalan communities and provides training and follow-up to ensure
technologies are used correctly. Socorro Maya distributes primarily under Project Scenario 2, wherein every
household receives both an efficient stove and a water filter as part of a package, but will occasionally sell
filters without an accompanying stove under Project Scenario 1.
• Ecofiltro (EF) is a Guatemalan business created to manufacture and market the locally designed Ecofiltro
water purification device. Ecofiltro believes that business practices and sustainable markets can effectively
address the lack of access to clean drinking water in Guatemala. Ecofiltro manufactures and distributes the
Ecofiltro technology under Project Scenario 1 wherein households receive only a water filter. EcoFiltro
conducts both bulk sales to non-profit and other organizations working in target communities, and direct
sales to households and provides training and follow-up through both channels.

DOC REV 15/10/18.1
Page 11
KEY DEVELOPMENT MILESTONES
• Local Stakeholder Consultation: September 4th, 2012
• Passport & LSC Report Submission: October 10th, 2012
• Official Registry Listing: November 13th, 2012
• Project Start Date as Described in PDD: January 1st, 2013
• Project Registration: June 28th, 2013
• Initial Crediting Period: January 1st, 2013 to December 31st, 2019
The Project was developed under the GS Methodology - Technologies and Practices to Displace Decentralized
Thermal Energy Consumption - 11/04/2011, and includes a 7-year crediting period with an option to renew.
PROJECT TECHNOLOGIES
The Project provides clean cooking and safe water treatment technologies throughout Guatemala. The Project
Design Document (“PDD”) includes descriptions of the two technologies included in the project activity, each of
which is summarized below.
Ecoestufa Clean Cookstove
The EcoStove was designed by international efficient cook stove
expert, Peter Scott, founder of Burn Design Lab, with the support of
Cementos de Mexico (CEMEX), Stove Capital (Leon Reinhart) and local
partner in Guatemala, Socorro Maya. Manufacturing has been carried
out by CEMEX. The efficient wood burning stove continues to be
produced in Guatemala with a manufacturer that has more than 10
years’ experience producing concrete cook stoves. The EcoStove has
a large metal cooking surface (a griddle) with two long cast concrete
pieces underneath (processing the heat), a unique clay combustion
chamber and a concrete firewood support. The EcoStove sits on 9 cinder blocks. A flue is attached to extract
any noxious gases and smoke from the home. The thermal efficiency of the stove is 15.4% and the stove has a
power output of 8.95kW. The stove is very acceptable for all rural Guatemalan family cooking needs. The great
majority are indigenous Maya who traditionally cook on the floor with open fires in their smoke filled homes.
The EcoStove provides beneficiary families with ample suface space to cook traditional tortillas, beans and large
meals. The stove has an estimated life of 10 years.

DOC REV 15/10/18.1
Page 12
Ecofiltro Water Filter
The Ecofiltro is manufactured locally by Ecofiltro S.A. The filter
purifies through a gravity-fed ceramic filtration element. The
ceramic element has a porous surface size of 0.6 to 0.3 microns
and is lined with colloidal silver to remove particles and
disinfect the filtered water. The filter has a flow rate of 1-2 liters
per hour, a maximum capacity of 20 liters, and meets drinking
water standards set by the World Health Organization and
Coguanor of Guatemala. The ceramic element has a lifespan of
2 to 3 years.
SUMMARY IN SUSTAINABLE DEVELOPMENT INDICATORS
The Guatemala Cookstoves and Water filters project aims to contribute to reach the UN Sustainable Development
Goals and targets.
The specific information about the Sustainable Development indicators per each scenario of the project can be
found later in this Report, a Summary is presented as Follows:
Air Quality
Target 3.9
“By 2030, substantially reduce the number of deaths and illnesses from hazardous chemicals and air, water
and soil pollution and contamination”
Using the EcoStove the reported incidence of air quality show overwhelmingly positive changes in the household
in comparison to the baseline. Respondents were first asked if they noticed any difference in the indicator being
monitored. If they responded “yes”, then they were asked to quantify the degree of perceived difference from
the baseline.
DEGREE OF PERCIEVED CHANGE IN AMOUNT OF SMOKE IN KITCHEN (FOR THOSE INDICATIING A CHANGE)
Change in Smoke? N %
Yes 141 99%
No 1 1%
Total 142 100%
Much Less 135 96%
Less 6 4%
No difference 0 0%
More 0 0%
Much More 0 0%
Don’t Know 0 0%
Total 141 100%

DOC REV 15/10/18.1
Page 13
Livelihood of The Poor & Access to Energy Services
Target 1.2
“By 2030, reduce at least by half the proportion of men, women and children of all ages living in poverty in all
its dimensions according to national definitions”
Fuel sourcing and its impact on livelihood and access to energy were recorded by asking respondents to indicate
how they sourced fuel prior to the introduction of the EcoStove efficient stove. As Project Scenario 2 combines
the stove and filter, making it impossible for respondents to delineate between stove and filter savings, the
following data includes outcomes for the combination of products, not just stoves. Data indicates little change in
mode of sourcing fuel with extremely low variance between baseline and project behaviors. Financial and time
savings measured as a percentage of money or time spent in the baseline, was significant.
FUEL SOURCING
Fuel Source Baseline % Project % Varience %
Buy 112 79% 107 75% -3.52%
Collect 22 15% 27 19% 3.52%
Both, Mostly Buy 4 3% 4 3% 0.00%
Both, Mostly Collect 4 3% 4 3% 0.00%
Total 142 100% 142 100% 0.00%
FUEL SAVINGS IN TIME AND MONEY
Savings/Week Baseline Project Savings %
Money (Q) 100.23 27.77 72.46 72%
Time (H) 12.81 6.43 6.38 50%
FUEL SAVINGS COMPARISON
Savings/Week Week Month Annual
Money (USD, FX=$0.13) $9.47 $37.88 $454.61
Time (H) 6.38 25.50 306.00
Fuel sourcing and its impact on livelihood were recorded by asking respondents to indicate how they sourced
fuel prior to the introduction of the Ecofiltro. The following results are recorded from the use of the water filter:

DOC REV 15/10/18.1
Page 14
FUEL SOURCING
Fuel Source Baseline % Project % Varience %
Buy 62 53% 62 53% -0.46%
Collect 47 41% 50 43% 2.22%
Both, Mostly Buy 3 3% 3 3% -0.02%
Both, Mostly Collect 4 3% 2 2% -1.74%
Total 112 100% 113 100% 0.00%
FUEL SAVINGS IN TIME AND MONEY
Savings/Week Baseline Project Savings %
Money (Q) 46.57 40.47 6.10 13%
Time (H) 6.99 5.53 1.46 21%
FUEL SAVINGS COMPARISON
Savings/Week Week Month Annual
Money (USD, FX=$0.13) $0.80 $3.19 $38.25
Time (H) 1.46 5.83 69.94
An overall evaluation for both scenarios is presented bellow:
FUEL SOURCING
Fuel Source Baseline % Project % Varience %
Buy 174 67% 169 66% -1.94%
Collect 69 27% 77 30% 3.10%
Both, Most Buy 7 3% 7 3% 0.00%
Both, Most Collect 8 3% 6 2% -0.78%
Total 258 100% 259 100% 0.00%
FUEL SAVINGS COMPARISON
Savings/Week Week Month Annual
Money (USD, FX=$0.13) $10.27 $41.07 $492.86
Time (H) 7.84 31.33 375.94

DOC REV 15/10/18.1
Page 15
Water Quality
Target 3.3
“By 2030, end the epidemics of AIDS, tuberculosis, malaria and neglected tropical diseases and combat
hepatitis, water-borne diseases and other communicable diseases”
Self-reported indicators of water quality show positive changes in comparison to the baseline. Respondents were
asked if they noticed a reduction in stomach illnesses with the Ecofiltro vs the baseline.
PERCIEVED CHANGES IN FREQUENCY OF STOMACH ILLNESSES
Incidence of Stomach Illness HH-WT % HH-DUAL %
Much Less 107 92% 123 87%
Less 2 2% 12 8%
No difference 7 6% 7 5%
More 0 0% 0 0%
Much More 0 0% 0 0%
Don’t Know 0 0% 0 0%
Total 116 100% 142 100%
Safe drinking water access
Target 6.1
“By 2030, achieve universal and equitable access to safe and affordable drinking water for all”
Self-reported indicators of water quantity and access show positive changes in comparison to the baseline.
Respondents were asked about the taste and access to clean drinking water in comparison to baseline.
PERCIEVED TASTE OF WATER IN COMPARISON TO BASELINE
Taste of Water HH-WT % HH-DUAL %
Better than before 116 99% 142 100%
Same as before 1 1% 0 0%
Worse than before 0 0% 0 0%
Total 117 100% 142 100%

DOC REV 15/10/18.1
Page 16
PERCIEVED ACCESS TO WATER IN COMPARISON TO BASELINE
Access to Water HH-WT % HH-DUAL %
Better than before 116 99% 142 100%
Same as before 1 1% 0 0%
Worse than before 0 0% 0 0%
Don’t know 0 0% 0 0%
Total 117 100% 142 100%
REDUCTION IN ECOESTUFA CLEAN COOKSTOVE PRODUCTION
For the last 24 months, 110 stoves have been produced and delivered. This reduction in stove production and
delivery is due mainly to the following:
• Agreement changes for stove production with CEMEX: CEMEX was responsible for the EcoStove
production for over 3 years. Manufacturing in Guatemala was supervised from CEMEX Monterrey,
Mexico. This substantially increased the cost of production, putting the financial self-sufficiency of the
EcoStove business at risk. That’s why local partner Socorro Maya decided to move the production to an
independent manufacturer in Guatemala. The company has more than 10 years of experience producing
concrete stoves for NGOs. The efficient EcoStove design remains the same that’s why it will use same
materials and it will have the same lifespan and specifications for production so there will not be changes
in efficiency. However, the cost will be substantially reduced, more in line with the financial capabilities
of poor urban families to purchase the stove.
• Monitoring & Evaluation of stoves installed: Socorro Maya actively assisted families in 2017 with stove
use and maintenance. Global Positioning Systems were also expanded to facilitate locating family homes
in the mountainous environment. This has improved time and stove maintenance, enabling proper
functioning of the EcoStoves.
• Creation and Sale of EcoStove carbon credits: Local partner Socorro Maya needed time for increased
generation of carbon credits, where multiple years of stoves in place result in more carbon credits. This
would financially benefit Socorro Maya to increase production, provide for more human resources,
monitoring of stoves, and the expensive marketing, sales and delivery process of new stoves.
BASELINE & PROJECT SCENARIOS DEFINED IN THE PDD
The PDD states that the baseline scenario includes “household biomass users” a stakeholder group that consists
of users of unimproved stoves or open fires fueled with biomass and used for domestic purposes.
PROJECT SCENARIO 1 (hh-wt): Water Treatment Only
Project Scenario 1 includes all filter distributions that are not disseminated along with an improved stove
technology. This project scenario consists of household water treatment technologies that displace the use of
biomass for water purification.

DOC REV 15/10/18.1
Page 17
PROJECT SCENARIO 2 (dh-dual): Improved Cookstove & Water Treatment
Project Scenario 2 consists of the dual implementation of household improved wood stoves and water treatment
technologies, which replace biomass for water purification and allow for the efficient use of biomass for cooking.
The emission reductions equation and target population for water treatment technologies in both Project
Scenarios are identical. Thus, despite being monitored individually, water treatment monitoring data and analysis
is presented together within this document for the sake of consistency and comparison.
PROJECT SCENARIO 3 (hh-Ics): Improved Cookstove Only
Project Scenario 3 consists of households using project improved cookstove technologies that allow for the
efficient use of biomass for cooking, but not using water treatment technologies. Currently, Project Scenario 3 is
not being implemented and is therefore not noted in additional sections of this Monitoring Report.
Below is a description of implementing partner roles related to the Project Scenarios above.
Organization Role
Socorro Maya
Primarily distributes technologies under Project Scenario 2, occasionally under Project
Scenario 1. Manages the manufacturing of, and is the sole distributor of, Ecoestufas.
Sources filters from Ecofiltro.
Ecofiltro Distributes exclusively under Project Scenario 1. Manufactures and distributes the
Ecofiltro directly and through NGO/CBO partners.
Partner NGO/CBOs Purchase filters from Ecofiltro in bulk and distribute them to end-users representative of
the target population under Project Scenario 1.
MANUFACTURING & DISTRIBUTION
All product technologies implemented through the Project are manufactured locally. Various distribution
channels are used in order to make products accessible to the target population. As the Project grows, the project
partners plan to invest revenues generated by carbon finance to help further expand manufacturing and
distribution and thereby increase the impact of the Project.
Socorro Maya is both a stove manufacturer and distributor of stoves and water filters. SM distributes improved
stoves and water treatment technologies directly to consumers, often working with local banks to provide loans
and payment plans which allow households to pay for the technologies over time. Socorro Maya began
distribution in the Departments of Alta Verapaz, Baja Verapaz, and San Marcos, as these departments have the
most need and demand, but will expand to other regions as resources allow.

DOC REV 15/10/18.1
Page 18
Ecofiltro is both a filter manufacturer and distributor. Ecofiltro distributes filters directly to end consumers,
through school programs, and through local NGOs/CBOs who provide filters to the target population free of charge
or at a subsidized rate. Working with schools and NGOs/CBOs enables Ecofiltro to expand their reach and target
end-users who otherwise may not be able to afford the technology. When working directly with end users,
Ecofiltro often offers financing to make the filter more accessible for low-income families. Ecofiltro is currently
distributing filters to all departments of Guatemala. Only direct filter sales to rural communities or bulk sales to
NGOs/CBOs working in rural communities where the target population for the Project is located are included in
the sales record. Filters sold to for-profit companies for resale to urban markets or for populations not
representative of the Project target population are excluded from the Project sales database.
Within its school program, Ecofiltro sells and donates filters to schools in rural and peri-urban areas where the
boiling of water is a common practice. Ecofiltro identifies schools in communities comprised of students from the
same geographies and BOP socio-economic groups as the households targeted for direct stove and filter
distribution to offer a donated filter for every classroom and school kitchen. These filters provide clean water for
students, teachers and administrators and replace the boiling of water and/or the consumption of unclean water.
To be part of the program, school directors and teachers must agree to take responsibility for the care and usage
of the filters. Ecofiltro also asks that the teachers involve the students in a clean water education program before
the day of delivery to communicate the importance of clean drinking water so students understand the
importance of Ecofiltros in their schools. Then, with the help of the director of the schools, on the day of the
donation, all of the parents of the students are gathered together in order to explain the importance of clean
water in the schools and at home and Ecofiltro offers each household the ability to participate in Ecofiltro’s “Water
for Life” program, where they can purchase filters through a low-interest monthly payment plan. On average, for
every filter placed in a classroom, Ecofiltro reaches 10 rural families who purchase the filters for their homes.
Sales to, and use of filters within, schools are not included for crediting in this issuance. The sales process
description is simply included for reference.

DOC REV 15/10/18.1
Page 19
FORWARD ACTIONS REQUESTS
The following Forward Action Requests are documented in the ERMCVS Final Verification Report dated
September 16th, 2016.
FAR 1: NEUTRAL AND UNBIASED SURVEY.
Issued: Verification Issuance 3
By: DOE
Description: During the site visit, whilst observing the monitoring team carrying out usage and monitoring surveys,
ERM CVS observed some questions being asked in a slightly non-neutral manner. Whilst it is unlikely, in the opinion
of the verifier, that this would have actually influenced the results of the surveys observed (which were in any
case used for the DOE’s cross check and where not the source of the results used for crediting), nevertheless it is
important that surveyors ask questions in as neutral and unbiased way as possible, whilst still ensuring that the
respondent understands the question.
Comment: The PP conducted additional training with the monitoring team via skype on Tuesday, May 17th 2016,
and has reinforced the importance of asking questions exactly as written within the surveys. To maintain
consistency the team has been instructed to contact the PP if they find any questions which are causing confusion
when asked as written during surveying so that such questions can be revised properly to retain an unbiased
format.
PROJECT RECORD KEEPING & DATABASES
SALES RECORDS & CARBON RIGHTS WAIVERS
Careful attention has been paid to the accuracy of all records within both Project Scenarios. The PP works closely
with the local partners to assure that all data is complete and conservative. Three types of records are kept in
differing formats for each project scenario:
1. Total Sales Record (TSR): A detailed record of individual and/or bulk sales.
2. Detailed Customer Database (DCD): A secondary record of resale or distribution transactions
implemented when the TSR record lacks end-user data.
3. Carbon Rights Waiver (CRW): An individual release of rights to any VERs derived from the use of
technologies sold within the program. Implemented as a document requiring signature, or a prominent
product label when the former is not possible.

DOC REV 15/10/18.1
Page 20
Organization Summary Record Keeping Roles
Natural Capital
Partners
Management of partner organizations data collection and analysis. Reviews and cleans all
datasets. Stores and maintains database records provided by project partners electronically.
Calculates Emission Reductions and writes all reports for carbon crediting purposes.
Socorro Maya
Collection and entry of end-user data and records via sales receipts and CRWs. Responsible for
collection, updating and storage of hard copies of sales receipts and CRWs along with the
transcribing of data into excel spreadsheets.
Ecofiltro
Collection and entry of bulk sales records used to populate TSR via sales invoices. Collection
and compilation of Delivery Notes and end-user data collected by partner resellers used to
populate DCD. Responsible for collection and storage of hard copies of Sales Invoices and
Delivery Notes as well and transcription of data into excel spreadsheets.
PROJECT SCENARIO 1: HH-WT (Filters Only)
The TSR for filters sold under Project Scenario 1 (hh-wt) is compiled from sales invoices and later complimented
by a Detailed Customer Database (DCD) compiled from registrations completed by resale partners. The TSR for
filter sales under Project Scenario 1 includes the number of technology units sold, date of sale, and contact
information for the wholesale purchaser. For transparency and ease of reporting, sales to subsidiaries and closely
held organizations such as Ecofiltro S.A., are treated as any other sale and recorded within the TSR. All internal
sales to subsidiary organizations are issued invoices and reconciled through Ecofiltro’s accounting system which
complies with Guatemalan regulations and is audited annually. All sales of filters to Socorro Maya are recorded
in the TSR, but removed from crediting under Project Scenario 1 as these filters are credited under Project Scenario
2.
Like many stove and water projects around the world, Ecofiltro’s primary mode of distribution is through bulk
sales to distributors who then sell to end users. As a result, Ecofiltro’s ability to collect end-user information is
severely limited. While the TSR reflects a complete record of sales volumes eligible for crediting within the current
monitoring period, it does not accurately reflect the specific date in which the individual technologies were
distributed to end users, nor the detailed end-user information required for monitoring ongoing use. The Project
Scenario 1 TSR is therefore complemented by a Detailed Customer Database (DCD), which seeks to collect
individual product serial numbers, end-user information and specific date of delivery/sale to end users from
distribution partners. Although Ecofiltro solicits end-user information from all resellers, including all NGOs/CBOs,
most partners do not have sufficient time (or willingness) to register end-user details. In most instances, the
collection of such data is additional to the resellers other duties and is often left neglected. Even when financial
compensation to the reseller is offered, data collection is spotty at best.
The TPDDTEC requires that the PP collect end-user information that shall be “no less than 10 times the required
survey and field-test sample size”. In an effort to exceed this requirement, the PP seeks to collect end user
information from as many end users as possible, targeting a minimum of 10% of total sales. The DCD is a
compilation of all direct sales and end-user information successfully retrieved from distributors and partner

DOC REV 15/10/18.1
Page 21
NGOs/CBOs, and contains well over 4000 entries, far exceeding the Gold Standard minimum of 1000 (10 times
the minimum sample size).
In an effort to make all transactions fully transparent and accurate, Ecofiltro also tracks the date of delivery for
bulk sales through the use of a Delivery Note, which corresponds to the sales invoice and indicates the date the
filters were delivered to end users. Individual registrations in the DCD and Delivery Notes are used to conduct a
lag analysis to determine the time differential between the date of sale and the receipt of the filters by end users.
The lag analysis offering an accurate way to measure the average number of days each technology is actually in
use for each crediting period.
For carbon rights waivers within Project Scenario 1, the PP, in line with guidance from the GS during Issuance 2,
opted to apply carbon rights waiver stickers to the products in order to consistently and clearly communicate the
carbon program to all participants. The PP has used similar stickers in other GS projects and believes the stickers
are the clearest and surest way to communicate carbon rights across the entire supply chain. Stickers enable
everyone who has contact with the product to have access to information regarding carbon rights, ensuring
ownership of carbon rights is transparent to all end users. Ecofiltro also explains the CRW and guarantee to
wholesale purchasers (including informing large-scale NGO purchasers in writing) at the time of purchase to
ensure that they understand that all benefits of emission reductions associated with project technologies belong
to the Project.
The CRW has been updated to reflect the updated project participants, you can see the actual one below in the
figure:

DOC REV 15/10/18.1
Page 22
PROJECT SCENARIO 2: HH-DUAL (Stoves & Filters)
Socorro Maya distributes all Ecoestufa technologies with an Ecofiltro as part of a package provided directly to
end users. As Socorro Maya does not sell in bulk to wholesalers, their Total Sales Record and Detailed Customer
Database are one in the same sales record (labeled as a TSR).
The TSR for stoves and filters sold under Project Scenario 2 is compiled from sales invoices executed directly
with end-users, and includes a complete record of each individual stove and filter sold. The database includes
the date of installation, end-user’s name and contact information (when possible), product serial numbers, and
the geographic location (community and department) of the household. Data is recorded on paper forms in the
field then transcribed into an excel customer database. Socorro Maya’s comprehensive record keeping ensures
that all sales are accounted for, and allows for follow up with beneficiaries to ensure technologies are working
properly.
Socorro Maya clearly communicates the transfer of carbon rights and the need to dismantle traditional stoves
both verbally at the point of sale, and in writing on each sales contract signed by the end-user. Carbon rights
waivers are signed by all end-users at the point of sale. A component of warranty registration informs the
consumer that the warranty is invalid if they continue to utilize their baseline stove.

DOC REV 15/10/18.1
Page 23
The TSRs and/or DCDs for both Project Scenarios are included in their entirety within the Excel spreadsheet, ER
Calculations GS1321 Iss 4 Year1 07022018 & ER Calculations GS1321 Iss 4 Year 2 07022018.

DOC REV 15/10/18.1
Page 24
MONITORING PLAN DESCRIPTION
All surveys required by the TPDDTEC Methodology were conducted simultaneously in randomly selected
communities in order to simplify the process and reduce the costs associated with monitoring.
SUMMARY OF MONITORING REQUIRED & CONDUCTED
The TPDDTEC Methodology maintains the following sample size requirements for ex-post monitoring:
• Usage Survey - minimum total sample size of 100 per project scenario, with at least 30 samples of each
technology age.
• Monitoring Survey - minimum sample size of 100 per project scenario for a group size > 1000. May be
conducted in tandem with US Survey.
• Biennial KPT Test - min sample size of 30, if 90/10 confidence/precision not met, apply upper bound.
• Biennial WCFT Test - min sample size of 30, if 90/10 confidence/precision not met, apply upper bound.
• Water Quality Test - Follow 90/10 confidence/precision rule to determine sample size.
The PP conducted Usage Surveys, Monitoring Surveys, Water Consumption Field Tests, Kitchen Performance Tests
and Water Quality Tests as required by the methodology. As Kitchen Performance and Water Consumption Field
Test data is required to be monitored biennially, the PP conducts these surveys at a rate that allows for collection
of data over the 2-year operating span.
The tables below summarize the number of households monitored and utilized for Issuance 4:
Type & Number of Surveys Conducted hh-wt hh-dual TOTAL
Water Consumption Field Test (WCFT) 53 55 108
Water Quality Test (WQT) 79 79
Filter Monitoring & Usage Survey (MS/US) 120 149 265
Stove Monitoring & Usage Survey (MS/US) N/A 149 149
Kitchen Performance Test (KPT) N/A 50 50
Type & Number of Surveys Used hh-wt hh-dual TOTAL
Water Consumption Field Test (WCFT) 51 49 100
Water Quality Test (WQT) 75 75
Filter Monitoring & Usage Survey (MS/US) 118 142 256
Stove Monitoring & Usage Survey (MS/US) N/A 142 142
Kitchen Performance Test (KPT) N/A 49 49

DOC REV 15/10/18.1
Page 25
SAMPLING METHOD
The PP elected to use a simple random sampling approach for all monitoring conducted during this monitoring
period. A detailed description of the sampling plan used for all surveys and tests is below:
1. The Total Sales Record (TRS) and/or Detailed Customer Database (DCD) for the entire project period
(from 2013 to the date at the start of monitoring) is used to determine the total sales for each
technology. In each case, sales exceeded 1000, and thus sampling requirements defaulted to the largest
minimum sizes for each survey as required by the methodology.
2. For stoves, the Total Sales Record was used and stoves younger than 6 months at the time of monitoring
were excluded from consideration.
3. For filters, the Detailed Customer Database was used and filters younger than 6 months and older than
24 months at the time of monitoring were excluded from consideration.
4. Relevant household and technology data from the TSR and DCD (respectively) was copied into a new
Xcel sheet (Sampling Database) in order to work with the data without disturbing the formal database.
5. Research Randomizer (https://www.randomizer.org/) was then used to generate a list of random
numbers matching the number of registrations in each database. A sample screen shot of inputs for
10,000 entries is included below for reference.
6. A new column “A” is inserted in the Sampling Database and the randomized list of numbers generated
by Research Randomizer is pasted into this new column A.
7. All of the data in the Sampling Database is then sorted numerically by column A (from 1 to 10,000 in the
example above). This has the effect of randomizing the original data.

DOC REV 15/10/18.1
Page 26
8. The data is then reduced to a more manageable size (Working Database) by selecting the first 1000
entries from the newly randomized list.
9. Those 1000 entries are then sorted by date of sale and the data is reviewed to confirm that it includes at
least 60 registrations (double the required number) for each age of the applicable technology.
10. If the Working Database does not include at least 60 units of each technology age, the next 1000 entries
(1001 to 2000) are pulled from the Sampling Database and added to the Working Database.
11. Step 7 and 8 are repeated as necessary, increasing the number of households selected from the
Sampling Database until the Working Database includes at least 60 of each age of the monitored
technology.
12. The Working Database is then color coded by technology age. And the data is sorted by Department
with the data from each Department being placed on a unique tab.
13. On each Department tab, the data is then sorted by Community. This provides a reasonable geographic
planning tool for monitoring, randomly clustering households by location to allow for monitoring
multiple households simultaneously as KPTs and WCFTs require 4 days in a single location to complete
the tests.
14. Starting with the first tab, the M&E team then work their way down the randomized lists contacting
households to request a date for monitoring, clustering visit dates and times geographically as they go. If
the team cannot successfully reach a household on the list or the household refuses to participate, they
skip to the next person on the list.
15. The M&E team tracks the number of each technology age being monitored so that any shortfalls
resulting toward the end of the monitoring period can be adjusted as needed by selecting more
technologies of a certain age from the random Working Database lists.
16. The M&E Team travels to a location and stays locally for 4 consecutive days allowing for KPT and WCFT
tests to be completed. At the same location, the team may complete varying numbers of tests based on
available time and difficult. For instance, the team may conduct 10 KPTs or WCFTs over the course of the
week while also conducting 20 MS/US and 5 WQTs, depending on household availability.
17. WQT samples are collected from the last 5 to 7 homes monitored in each area on the final day of
monitoring (usually a Thursday) and transported back to Guatemala City for testing in a lab.
DATA COLLECTION, ANALYSIS AND QAQC
Natural Capital Partners oversees all monitoring of the project and coordinates activities for Monitoring &
Evaluation, distribution partners and communities. Before Natural Capital Partners took part in the project, The
Paradigm Project worked with a full-time Monitoring & Evaluation (M&E) associate, Gabriel Jerez who was hired
to conduct Continuous Monitoring of efficient stoves and water treatment technologies. This employee was
formerly employed by CO2 Management, a local environmental consultancy firm specializing in environmental
impact reporting, carbon footprint analysis, and carbon monitoring, that was contracted to conduct all
monitoring for the Project in the Issuance 2 monitoring period. He was in charge of Monitoring and Evaluation
from the beginning of this Issuance period until to 2017, when Natural Capital Partners assumed the
responsibility for the project. To lead the technical monitoring and verification activities for the Project, Natural

DOC REV 15/10/18.1
Page 27
Capital Partners hired Eddy Meléndez Mendizabal, a former employee of The Paradigm Project and CO2
Management, who also was in charge of Monitoring & Evaluation for Issuance 2 and 3. He’s deeply experienced
in Gold Standard TPDDTEC Methodology and all of the required monitoring activities, having completed all
project, and some baseline, monitoring activities in the priors monitoring periods. Eddy Meléndez is in charge of
calculating Emission Reductions and authors all reports for carbon crediting purposes.
Surveys utilized in the previous monitoring period were refined by the former M&E team (Eddy Meléndez &
Gabriel Jerez) and the PP in line with their experience with similar projects. The surveys were then piloted and
further refined by the PP and the former M&E team to assure functionality and ease of use in the field. Where
possible, US, MS, KPTs, WCFTs and WQTs were conducted in tandem on the same households for consistency
and validation of data.
M&E team; Gabriel (Paradigm), and Eddy (Natural Capital Partners) completed 100% of surveys conducted. No
additional enumerators were used to collect data for this monitoring period. Data entry was completed and
synched to the cloud real-time using ODK digital data collection software on Android phones. If cellular service
was unavailable in the field, data was stored locally on the phone and synched at the end of each day via wifi.
Incoming raw data was exported to the “MS_US_WCFT_KPT_WQT Data” spreadsheet for review and analysis.
The PP reviewed the data and conducted completeness checks to ensure that household responses were
internally consistent. The PP then worked with the M&E Team to clean the data by clarifying and correcting data
entry mistakes as appropriate.
Ivan Hernandez former GS Regional Manager was contracted to complete a QA/QC check on the data and
processes to confirm the validity of the M&E approach and outcomes.
With more than a decade of experience in the Climate Change and Sustainability industry, Ivan Hernandez has
participated in the audit and certification of more than 350 projects of Renewable Energy, Energy Efficiency, Waste
Management and Forestry activities. With real international experience, he has developed professional duties in
more than 25 countries in 4 continents. Ivan has worked closely with Governments, NGOs and Private companies
to develop strategic plans to reduce GHG emissions and he has dedicated efforts to create capacities in developing
countries to contribute in the fight against climate change.

DOC REV 15/10/18.1
Page 28
Below is a description of entities participating in monitoring and their respective responsibilities.
Organization Responsibilities
Natural Capital Partners
Development of surveys, training, data analysis, QAQC and reporting. Report writing,
Emission Reduction Calculation, GS and DOE communications. Refinement of surveys for
local context, conducting all monitoring, entering raw data from surveys via ODK. Works with
local project partners to schedule household visits and manage M&E process.
Socorro Maya & Ecofiltro Logistical support for M&E.
Ivan Hernandez, Senior
Consultant Sustainability
and Climate Change4
QAQC analysis of monitoring plan and systems.
SURVEY EQUIPMENT CALIBRATION
Calibration Procedure for Scales:
According to the manual of the Scales SR-Series, “Adjustment is performed professionally at the factory. Only
advanced users should perform calibration using the required weight if the scale is not weighing properly”5
Our trained and expert field personnel has done the monitoring continuously, and have not noticed any unusual
reading for the equipment, or anything that could make us think that the scale is not weighing properly to make
an adjustment.
Calibration Procedure for Moisture Meters:
The moisture meters do not have specification for calibration.
PROCEDURES FOR MINIMIZING NON-SAMPLING ERRORS & INTERNAL QAQC
The following internal QAQC checks were utilized by the PP to assure quality and consistency of data:
4 Ivan Hernandez has plenty experience in auditing and certification of carbon project (participation in more than 350 worldwide) in his former positions Standard Certification Officer/Regional Manager Americas at Gold Standard Foundation (2009-2017) and GHG Lead Auditor accredited by the UNFCCC at TUV SUD (2005-2009). 5 American Weigh Scales Users Manual, model SR-Series.

DOC REV 15/10/18.1
Page 29
• Survey questions were coded, multiple choice and/or list-generated where possible to facilitate data entry
and minimize enumerator error.
• A quality check on all data was conducted weekly by The Natural Capital Partners to ensure accuracy of
entries.
• Basic analysis was conducted to check for any abnormalities in the data.
OUTLIER REMOVAL
During the detailed data review, the PP removed surveys as outliers if one or more of the following occurred:
• Households refused to participate in the survey or were not able to provide access or responses for one
or more days in a multi-day test.
• Survey was incomplete/missing data for a significant number of questions.
• Information was inconsistent or did not make sense (negative data values, for example).
• Data value(s) was outside of two standard deviations above or below the mean.
• Households reported using the stove or filter for commercial or institutional uses, as such households
would skew key data points such as person-meals.
KEY FIXED (EX-ANTE) DATA & PARAMETERS
DATA/PARAMETERS DERI VED FROM IPCC DEFAULTS
Data/parameter EFb,wood,CO2
Unit kg CO2/TJ
Description The CO2 emission factor arising from use of fuels in baseline scenario
Source of data 2006 IPCC guidelines for national greenhouse gas inventories
Value(s) applied 112,000
Choice of data or measurement methods and procedures
Purpose of data
Additional comments
Data/parameter EFb,wood,CH4
Unit kg CH4/TJ
Description The CH4 emission factor arising from use of fuels in baseline scenario

DOC REV 15/10/18.1
Page 30
Source of data 2006 IPCC guidelines for national greenhouse gas inventories
Value(s) applied 300
Choice of data or measurement methods and procedures
Purpose of data
Additional comments
Data/parameter EFb,wood,N2O
Unit kg N2O/TJ
Description The N2O emission factor arising from use of fuels in baseline scenario
Source of data 2006 IPCC guidelines for national greenhouse gas inventories
Value(s) applied 4
Choice of data or measurement methods and procedures
Purpose of data
Additional comments
Data/parameter EFp,wood,CO2
Unit kg CO2/TJ
Description The CO2 emission factor arising from use of fuels in project scenario
Source of data 2006 IPCC guidelines for national greenhouse gas inventories
Value(s) applied 112,000
Choice of data or measurement methods and procedures
Purpose of data
Additional comments
Data/parameter EFp,wood,CH4
Unit kg CH4/TJ
Description The CH4 emission factor arising from use of fuels in project scenario
Source of data 2006 IPCC guidelines for national greenhouse gas inventories
Value(s) applied 300
Choice of data or measurement methods and procedures
Purpose of data
Additional comments

DOC REV 15/10/18.1
Page 31
Data/parameter EFp,wood,N2O
Unit kg N2O/TJ
Description The N2O emission factor arising from use of fuels in project scenario
Source of data 2006 IPCC guidelines for national greenhouse gas inventories
Value(s) applied 4
Choice of data or measurement methods and procedures
Purpose of data
Additional comments
Data/parameter NCVb, wood
Unit TJ/tonne
Description Net calorific value for fuel used in the baseline scenario
Source of data 2006 IPCC guidelines for national greenhouse gas inventories
Value(s) applied 0.0156/Gg
Choice of data or measurement methods and procedures
Purpose of data
Additional comments
Data/parameter NCVp, wood
Unit TJ/tonne
Description Net calorific value for fuel used in the project scenario
Source of data 2006 IPCC guidelines for national greenhouse gas inventories
Value(s) applied 0.0156/Gg
Choice of data or measurement methods and procedures
Purpose of data
Additional comments

DOC REV 15/10/18.1
Page 32
DATA/PARAMETERS DERI VED FROM BASELINE MONITORING
Data/parameter Wb,y
Unit tonne/liter
Description Quantity of fuel in tonnes required to treat 1 liter of water using technologies representative of baseline scenario during project year y, as per BWBT.
Source of data BWBT Field Report GS1321 Iss 2 dated 9/3/2015
Value(s) applied 0.00072
Choice of data or measurement methods and procedures
Purpose of data
Additional comments
Data/parameter Wp,i,y
Unit tonne/liter
Description Quantity of fuel required to treat 1 liter of water using unimproved stove technologies during project year y, as per BWBT.
Source of data BWBT Field Report GS1321 Iss 2 dated 9/3/2015
Value(s) applied 0.00072
Choice of data or measurement methods and procedures
Purpose of data
Additional comments
Data/parameter Cj
Unit Percentage
Description Portion of users of project safe water supply who were already in baseline using a non-boiling safe water supply.
Source of data MS_US Filter (hh-wt, hh-dual) Report GS1321 Iss 2 dated 9/3/2015
Value(s) applied hh-wt: 9.32 hh-dual: 9.17
Choice of data or measurement methods and procedures
Purpose of data
Additional comments

DOC REV 15/10/18.1
Page 33
Data/parameter fNRB,y,ics-nb
Unit Percentage
Description Non-renewability status of woody biomass fuel in scenario i during year y
Source of data NRB Assessment. Fixed in PDD by baseline study for a given crediting period, updated if necessary as specified in Methodology section III.1.
Value(s) applied 95.74
Choice of data or measurement methods and procedures
Purpose of data
Additional comments

DOC REV 15/10/18.1
Page 34
KEY MONITORED (EX-POST) DATA & PARAMETERS
EFFICIENT STOVE TECHNOLOGIES
Data/parameter Np,1,ics-nb
Unit technology-days
Description Cumulative number of days of technology use for project scenario p against baseline scenario b, in year 1.
Measured/calculated/ default Calculated
Source of data ER Calculations GS1321 Iss 4Year1 070218
Value(s) 1,263,145
Monitoring equipment
Measuring/recording frequency
Calc. method (if applicable) Technology-days = sum of (recorded sale date of each technology –closing date of the monitoring period), in days.
QA/QC procedures
Purpose of data
Additional comments The PP has revised the units of measure from project technologies credited as specified in the parameter box in the PDD to technology-days (as specified in the equations in the PDD and methodology) in order to be in line with definition of the parameter in the ER equation.
Data/parameter Np,2,ics-nb
Unit technology-days
Description Cumulative number of days of technology use for project scenario p against baseline scenario b, in year 2.
Measured/calculated/ default Calculated
Source of data ER Calculations GS1321 Iss 4Year2 070218
Value(s) 1,275,754
Monitoring equipment
Measuring/recording frequency
Calc. method (if applicable) Technology-days = sum of (recorded sale date of each technology –closing date of the monitoring period), in days.
QA/QC procedures
Purpose of data
Additional comments The PP has revised the units of measure from project technologies credited as specified in the parameter box in the PDD to technology-days (as specified in the equations in the PDD and methodology) in order to be in line with definition of the parameter in the ER equation.

DOC REV 15/10/18.1
Page 35
Data/parameter P,p,b,y,ics-nb
Unit tonnes/technology-day
Description Specific fuel savings for an individual technology in the project scenario against an individual technology in baseline scenario in year y.
Measured/calculated/ default Calculated
Source of data MS_US_WCFT_KPT_WQT Data GS1321 Iss4.
Value(s) 0.02068
Monitoring equipment
Measuring/recording frequency
Calc. method (if applicable) Person Meals (MS/KPT) * Fuel savings per meal (KPT).
QA/QC procedures
Purpose of data
Additional comments The PP has revised the units of measure from kg/household-day as specified in the parameter box in the PDD to tonnes/technology-day (as specified in the equations in the PDD and methodology) in order to be in line with definition of the parameter in the ER equation. This parameter was not included in the parameter section of the methodology and the PDD, but was included in the ER equations of both. Thus the PP has included the parameter in the monitoring report, in line with the information noted in the PDD under P,b,y and P,p,y. P,p,b,y,ics-nb is equivalent to the difference in the specific fuel consumption for an individual technology in baseline scenario b (P,b,y) and the specific fuel consumption for an individual technology in project scenario p (P,p,y), Since as by definition P,p,b,y is the difference between P,p,y and P,b,y the PP has adopted the similar parameter descriptions for P,p,b,y as those used for P,p,y and P,b,y in the PDD.
Data/parameter Up,1,ics-nb
Unit Percentage
Description Cumulative, weighted usage rate in project scenario, for technology during year 1
Measured/calculated/ default Calculated
Source of data MS_US_WCFT_KPT_WQT Data GS1321 Iss4. Usage Survey.
Value(s) 93.55
Monitoring equipment
Measuring/recording frequency
Calc. method (if applicable) Sum of (Binary reported usage frequency by technology age * % of total sales by technology age)
QA/QC procedures
Purpose of data

DOC REV 15/10/18.1
Page 36
Additional comments The usage rate accounts for non-usage of the Ecoestufa as well as continued use of baseline stoves, and usage frequency weighted by sales per age of stove.
Data/parameter Up,2,ics-nb
Unit Percentage
Description Cumulative, weighted usage rate in project scenario, for technology during year 1
Measured/calculated/ default Selected
Source of data Conservative approach (lowest value from every issuance, Iss1)
Value(s) 92.39
Monitoring equipment
Measuring/recording frequency
Calc. method (if applicable) Sum of (Binary reported usage frequency by technology age * % of total sales by technology age)
QA/QC procedures
Purpose of data
Additional comments The usage rate accounts for non-usage of the Ecoestufa as well as continued use of baseline stoves, and usage frequency weighted by sales per age of stove.
Data/parameter LEp,y,ics-nb
Unit tCO2e/yr
Description Leakage in project scenario for technology in year y
Measured/calculated/ default Measured
Source of data MS_US_WCFT_KPT_WQT Data GS1321 Iss4.
Value(s) 0.00
Monitoring equipment
Measuring/recording frequency
Calc. method (if applicable) Biennial Survey and Desk Review
QA/QC procedures
Purpose of data
Additional comments All leakage sources noted in the PDD were determined to be negligible

DOC REV 15/10/18.1
Page 37
WATER TREATEMENT TEC HNOLOGIES
Data/parameter Np,1,wt
Unit person-days
Description Cumulative number of person-days of water consumed in project scenario p through year 1.
Measured/calculated/ default Calculated
Source of data ER Calculations GS1321 Iss 4Year 1 070218
Value(s) hh-wt: 22,200,433 hh-dual: 3,961,230
Monitoring equipment
Measuring/recording frequency
Calc. method (if applicable) Person-days = sum of ((recorded sale date of each technology – closing date of the monitoring period – lag adjustment factor), in days * number of persons utilizing the filter per HH).
QA/QC procedures
Purpose of data
Additional comments Adjusted to account for households who use LPG and other appropriate HWT technologies.
Data/parameter Np,2,wt
Unit person-days
Description Cumulative number of person-days of water consumed in project scenario p through year 2.
Measured/calculated/ default Calculated
Source of data ER Calculations GS1321 Iss 4Year 2 070218
Value(s) hh-wt: 50,690,548 hh-dual: 859,558
Monitoring equipment
Measuring/recording frequency
Calc. method (if applicable) Person-days = sum of ((recorded sale date of each technology – closing date of the monitoring period – lag adjustment factor), in days * number of persons utilizing the filter per HH).
QA/QC procedures
Purpose of data
Additional comments Adjusted to account for households who use LPG and other appropriate HWT technologies.

DOC REV 15/10/18.1
Page 38
Data/parameter Up,1,wt
Unit Percentage
Description Cumulative, weighted usage rate in project scenario, for technology during year 1
Measured/calculated/ default Calculated
Source of data MS_US_WCFT_KPT_WQT Data GS1321 Iss4
Value(s) hh-wt: 96.88 hh-dual: 99.63
Monitoring equipment
Measuring/recording frequency
Calc. method (if applicable) Sum of (percent of respondents that meet all criteria in the “Guidelines for carrying out usage survey for projects implementing household water filtration technologies”, by technology age * % of total sales by technology age * % of technologies passing Water Quality Test by technology age)
QA/QC procedures
Purpose of data
Additional comments The usage rate accounts for non-usage of the Ecofiltro. Filters over 2 years of age are considered past performing age range and thus are removed from crediting.
Data/parameter Up,2,wt
Unit Percentage
Description Cumulative, weighted usage rate in project scenario, for technology during year 2
Measured/calculated/ default Selected
Source of data Conservative approach (lowest value of every issuance or PDD)
Value(s) hh-wt: 88.42 (Iss2) hh-dual: 95 (PDD)
Monitoring equipment
Measuring/recording frequency
Calc. method (if applicable) Sum of (percent of respondents that meet all criteria in the “Guidelines for carrying out usage survey for projects implementing household water filtration technologies”, by technology age * % of total sales by technology age * % of technologies passing Water Quality Test by technology age)
QA/QC procedures
Purpose of data
Additional comments The usage rate accounts for non-usage of the Ecofiltro. Filters over 2 years of age are considered past performing age range and thus are removed from crediting.

DOC REV 15/10/18.1
Page 39
Data/parameter Qp,y
Unit Liters per person per day (L/p/d)
Description Quantity of raw water treated with water treatment technology and used for hygienic purposes in the project scenario p and supplied by project technology per person per day
Measured/calculated/ default Calculated
Source of data MS_US_WCFT_KPT_WQT Data GS1321 Iss4
Value(s) hh-wt: 2.66 hh-dual: 2.44
Monitoring equipment
Measuring/recording frequency
Calc. method (if applicable) Average hygienic water consumption per day per hh — average non- hygienic water consumption per day per hh / average persons consuming treated water per day per hh
QA/QC procedures
Purpose of data
Additional comments
Data/parameter Qp,cleanboil,y
Unit Liters per person per day (L/p/d)
Description Quantity of treated water still boiled in project scenario after installation of project technology, per person per day
Measured/calculated/ default Calculated
Source of data MS_US_WCFT_KPT_WQT Data GS1321 Iss4
Value(s) hh-wt: 0.00 hh-dual: 0.00
Monitoring equipment
Measuring/recording frequency
Calc. method (if applicable) Average liters boiled for purification after filtering per HH / average persons consuming treated water per day per hh
QA/QC procedures
Purpose of data
Additional comments
Data/parameter LEp,i,y
Unit tCO2e/yr
Description Leakage in project scenario 2 for technology i in year y
Measured/calculated/ default Measured
Source of data MS_US_WCFT_KPT_WQT Data GS1321 Iss4.
Value(s) 0.00

DOC REV 15/10/18.1
Page 40
Monitoring equipment
Measuring/recording frequency
Calc. method (if applicable) Biennial Survey and Desk Review
QA/QC procedures
Purpose of data
Additional comments All leakage sources noted in the PDD were determined to be negligible
Data/parameter Water Quality (WQT)
Unit Percentage
Description Performance of the treatment technology
Measured/calculated/ default Measured
Source of data MS_US_WCFT_KPT_WQT Data GS1321 Iss4.
Value(s) hh-wt: 96.97 hh-dual: 95.12
Monitoring equipment
Measuring/recording frequency Quarterly
Calc. method (if applicable) Number of passing filters divided by total number of filters tested
QA/QC procedures
Purpose of data
Additional comments 3rd party lab tests were conducted on randomly selected filter units. Two WQT percentage were measured in each project scenario, even if the product is identical in both scenarios and the performance characteristics of the product is identical across both project scenarios, the PP decides to separate two different values for a more accurate value in ER’s calculations.

DOC REV 15/10/18.1
Page 41
HOUSEHOLD DEMOGRAPHICS: ALL MONITORING
Continuous monitoring allows the PP to conduct all required surveys—KPT, WCFT, MS/US and WQT tests—in
large number of common households. While more MS/US surveys were done than other survey types, all
surveys types were conducted in all communities surveyed. The below demographics represent the average
demographic characteristics of the monitored households by Project Scenario (rather than by survey type)
across all surveys performed. Because ERs for GS-1321 are calculated on a person-meal basis, household size
does not affect ER volumes directly and changes in household size relative to the baseline are accounted for
through person-meal values as household size changes. Household demographics shown below are reported for
informational purposes only.
AVERAGE HH SIZE
HH Size hh-wt hh-dual
Average Persons Total 4.85 5.04
Gender hh-wt hh-dual
Female 89 124
Male 29 18
Total 118 142
RESPONDANT GENDER

DOC REV 15/10/18.1
Page 42
KPT MONITORING RESULTS: HH-DUAL EFFICIENT STOVES
OVERVIEW OF KPT’S CONDUCTED
50 project KPT surveys were conducted in-person by the local M&E Team across 3 Departments representing
more than 65% of efficient stove sales to date. 1 outlier was identified and removed from the raw data during
analysis. The results for the main quantitative parameters determined in the KPTs are used in Emissions
Reductions (ER) calculations for the Issuance 4 Monitoring Period.
KPT SURVEYS CONDUCTED AND OUTLIERS REMOVED
Surveys Conducted Outliers Removed Surveys Used
50 1 49
KPT HOUSEHOLDS BY DEPARTMENT
Department N % Department N %
Alta Verapaz 10 20% Peten 0 0%
Baja Verapaz 29 59% Quetzaltenango 0 0%
Chimaltenango 0 0% Quiche 0 0%
Chiquimula 0 0% Retalhuleu 0 0%
El Progreso 0 0% Sacatepequez 0 0%
Escuintla 0 0% San Marcos 0 0%
Guatemala 10 20% Santa Rosa 0 0%
Huehuetenango 0 0% Solola 0 0%
Izabal 0 0% Suchitepequez 0 0%
Jalapa 0 0% Totonicapan 0 0%
Jutiapa 0 0% Zacapa 0 0%
Within the Continuous Monitoring framework, a full MS/US is conducted within every KPT household. MS/US
surveys are also conducted on households that do not participate in KPTs as the sampling requirement for
MS/US surveys is much higher than for KPTs. Including a MS/US survey in every KPT household allows the PP to
replace many of the redundant qualitative questions normally included with the KPT with the more
comprehensive MS/US survey questions. This has two benefits:
1. Every household surveyed receives the most comprehensive monitoring available, producing more
robust and complete data.
2. MS/US results between KPT and non-KPT households can be compared and analyzed to identify trends
or anomalies.

DOC REV 15/10/18.1
Page 43
PROJECT FUEL CONSUMPTION AND SAVINGS
On each day of the test, KPT households were asked how many people ate at each meal, the age and gender of
those eating, type of food that was prepared, and stove(s) used. Enumerators measured the quantity of fuel
consumed by taking daily measurements in kilograms (kg) of the fuel supply. The KPT is a subsumed KPT and
measures wood consumed from all stoves present and in use in the home during the test period. The tables
below present the average fuel consumption per day, average person meals per day, and average fuel per
person meal per day for both the baseline, project, and the calculated savings between the two.
AVERAGE DAILY MOISTURE ADJUSTED FUEL CONSUMPTION & SAVINGS PER HH (CONTINUOUS MONITORING SEASONALITY-INCORPORATED DATA)
HH Consumption Avg. (kg) SDEV 90% CI Precision 90/10? N
Baseline 19.77 4.35 1.24 6.30% Yes 35
Project 5.15 1.97 0.47 9.16% Yes 49
Savings 14.62
AVERAGE PERSON-MEALS PER DAY, MEAL ADJUSTED (CONTINUOUS MONITORING SEASONALITY-INCORPORATED DATA)
Parameter Avg. (kg) SDEV 90% CI Precision 90/30? N
Person Meals 14.15 5.46 1.31 9.26% Yes 49
AVERAGE DAILY PER-PERSON-MEAL FUEL CONSUMPTION & SAVINGS (CONTINUOUS MONITORING SEASONALITY-INCORPORATED DATA)
PM Consumption Avg. (kg) SDEV 90% CI Precision 90/30 or
90/10?
If Upper
bound N
Baseline 1.40 0.77 0.22 15.81% Yes N/A 35
Project 0.40 0.18 0.04 10.43% No 0.45 49
Savings 1.00
AVERAGE DAILY PER-PERSON-MEAL FUEL CONSUMPTION & SAVINGS
Parameter Value Definition
Fuel Savings (t) 0.001462 Specific fuel savings for an individual technology of project p against an individual technology of baseline b in year y, in tonnes/meal/day, as derived from the statistical analysis of the data collected from the field tests.

DOC REV 15/10/18.1
Page 44
The project field KPT data confirms fuel savings of 0.001462 tonnes of fuelwood/person meal/day. Consistent
with the previous monitoring periods, the PP elected to quantify fuel savings on a per-person meal basis due to
the Guatemalan context of cooking an entire meal on a single stove. Fuel consumption savings were calculated
by comparing baseline fuel consumption to project fuel consumption. Meals cooked per day included two snack
meals weighted at 0.25 of a regular meal. To determine the fuel savings per household per day the PP multiplied
the fuel savings per meal value by the number of person meals cooked per day reported in the KPT. Person Meal
data is also collected in the MS/US report, even for households participating in the KPT. Conducting MS/US on
KPT households allows comparison of outcomes based on self-reported use over time (MS/US) and self-reported
use immediately following a monitored cooking test. Not surprisingly, MS/US reported person-meals trended
slightly higher (17.23) than KPT reported person-meals (14.15). For the sake of conservatism, the PP has elected
to utilize the KPT person-meal figure for all ER calculations.

DOC REV 15/10/18.1
Page 45
MS/US MONITORING RESULTS: HH-DUAL EFFICIENT STOVES
OVERVIEW OF SURVEYS CONDUCTED
149 project Monitoring & Usage surveys were conducted across 4 Departments representing more than 99% of
Project Scenario 2 sales to date. If the stated household usage was “none”, the MS/US was halted, but the survey
was utilized in the calculation of the final usage parameter. Seven outliers were identified and removed from the
raw data during analysis. From the 142 surveys used, 10 were done for Year 2, deciding to get a conservative
approach for this year.
Project Scenario 2 MS/US monitoring covers both efficient stoves and water filters, however, for the sake of
consistency and comparison, all MS/US data related to water filters from Project Scenario 2 is presented within
this report in section “MS/US MONITORING: HH-WT & HH-DUAL WATER FILTERS”. This allows for direct
comparison of filter use between households that receive only and filter and those that receive both a filter and
a stove. Only parameters related to efficient stoves are presented in this section.
As per methodological allowance, all MS and US Surveys were conducted on the same sample population and in-
person by the local M&E Team. This includes only households with dual technologies distributed by Socorro Maya
in tandem with each other within Project Scenario 2 (hh-dual). The data collected through MS/US monitoring
provides the average value of person-meals prepared per household per day used for ER calculations as well as
critical information on year-to year trends in end user characteristics such a stove use, cooking practices, baseline
stove/fuel type, leakage and sustainable development Indicators, along with demographic information. The main
monitored parameters results are reviewed below.
MS/US HOUSEHOLDS BY COMMUNITY
Department N % Department N %
Alta Verapaz 64 45% Peten 0 0%
Baja Verapaz 44 31% Quetzaltenango 0 0%
Chimaltenango 0 0% Quiche 0 0%
Chiquimula 0 0% Retalhuleu 0 0%
El Progreso 0 0% Sacatepequez 0 0%
Escuintla 0 0% San Marcos 12 8%
Guatemala 22 15% Santa Rosa 0 0%
Huehuetenango 0 0% Solola 0 0%
Izabal 0 0% Suchitepequez 0 0%
Jalapa 0 0% Totonicapan 0 0%
Jutiapa 0 0% Zacapa 0 0%
Stove MS US Surveys Conducted & Outliers Removed
Surveys Conducted Outliers Removed Surveys Used
149 7 142

DOC REV 15/10/18.1
Page 46
USAGE RATE & PERSON MEALS
The GS methodology requires that “a usage parameter be established to account for drop off rates as project
technologies age and are replaced”. The survey used a combination of self-reported usage questions and
enumerator assessment of the improved stove to determine both the binary usage parameter (Yes/No) and the
frequency of use. For enumerator assessment, the enumerator commented on whether the stove showed signs
of being in recent use: signs of partially burned wood/ash and lack of spider webs in the fire chamber, stove warm
or in use. The frequency of improved stove use was estimated by asking respondents how many days per week
they use the stove, and which stoves were typically used to cook each meal of the day. This final set of questions
allowed for clarity on stove types in use and the specific frequency of use of the project technology.
Per the GS methodology TPDDTEC, a single usage parameter that is weighted based on drop off rates that are
representative of the age distribution for project technologies in the total sales record is used to calculate ERs.
The total usage rate is determined by dividing the households that meet all usage criteria by the total number of
households surveyed, and takes into account continued use of baseline stoves for certain cooking practices.
The monitoring results are used for year 1 and a conservative approach is used for year 2 as it’s explained in
Section “Deviation from Gold Standard” in page 6.
TOTAL CUMULATIVE WEIGHTED USAGE RATE (Up,i,y)
Parameter Value Definition
Up,i,y 93.55% Cumulative usage rate for technologies in project scenario p, for technology i, in year y, based on cumulative frequency of use rate weighted by technology age.
SALES-WEIGHTED USAGE BY AGE
Technology Age Active Units % of Sales % In Use Weighted Usage
Age 0 - 1 118 3% 100% 3.37%
Age 1 - 2 342 10% 100% 9.76%
Age 2 - 3 1,673 48% 100% 47.75%
Age 3-4 1,202 34% 100% 34.30%
Age 4-5 169 5% 100% 4.82%
Total 3,504 100% 100% 100%
Continuous Monitoring allows for a direct comparison of measured vs. reported responses to key parameters
such as person-meals. Within the MS/US respondents are asked how many people, on average, they cook for on
a typical day and then asked which stove they use to cook each meal during the day, giving the PP data on both

DOC REV 15/10/18.1
Page 47
the number of meals cooked and the use of the improved stove per meal. Thus the MS/US allows the PP to
determine an average number of people served at each meal. Although the KPT also relies on self-reported data,
such data is recorded by the respondent on a meal-by-meal basis for a 24-hour period. In addition, breakfast,
lunch, and dinner are weighted equally, but snacks and teas are weighted as a quarter of a meal, as less cooking
is conducted to prepare these meals. KPT data is therefore much more specific and accurate, recording the
exact number of people served at each individual meal over the course of 3 days. Not surprisingly, the MS/US
person-meal data is slightly higher than the person-meal data derived from the KPT. For the sake of
conservatism, the PP has elected to use the KPT person-meal figure for all ER calculations.
COMPARISON OF PERSON MEALS FROM KPT AND MS/US
Parameter Value Definition
KPT Person Meals 14.15 Average number of people per household per day served across all meals and adjusted with snacks and tea as 0.25 of a meal, as determined by KPT analysis.
MS/US Person Meals
17.23 Average number of people per household per day served across all meals, as determined by MS/US analysis.
FREQUENCY OF USE
Households were asked to report the frequency with which they use their stove (in days) and to clarify which
stove(s) were typically used to cook which meals in order to calculate an accurate frequency measurement. The
results of frequency of use questions are shown below.
WEEKLY FREQUENCY OF USE
Frequency: Weekly N %
Every day 137 96.48%
4 to 6 days per week 3 2.11%
2 to 3 days per week 2 1.41%
1 day per week 0 0%
Never 0 0%
Total 142 100%
MEAL FREQUENCY OF USE
Meal Use Ecoestufa Other %
Breakfast 137 4 97.16%

DOC REV 15/10/18.1
Page 48
Morning Tea 119 3 97.54%
Lunch 139 3 97.89%
Afternoon Tea 115 1 99.14%
Dinner 142 0 100.00%
Total Meals/Use 652 11 98.34%
BASELINE FUEL & STOVE PRACTICES
To calculate accurate emission reductions and understand leakage from fuel switching and/or heating practices,
the survey asked household respondents about baseline fuel and stove type as well as heating practices.
The overwhelming majority of households used only wood fuel in the baseline. A small minority of users
switched from LPG to firewood as their primary fuel source after receiving the Ecoestufa. Specifically, in
reviewing the data from Monitoring Period 4, 2 survey respondents reported LPG as their primary baseline
stove. Of those 2, both of them report that they still have their LPG stove and are still using it. The PP would
submit that the reported ownership of the stove may be a more accurate indicator of actual usage as historically
respondents have tended to answer the question of use of an old stove with what they believe the surveyor may
want to hear. Additional questions in the MS/US asking about stoves and fuels used to cook specific meals
support this position showing that about 1.36% of respondents reported cooking at least one meal per day on
LPG. In comparison, the 2 respondents that reported still owning an LPG stove would equate to just over 1% of
the surveyed sample. At 1% fuel switching, the PP would suggest that leakage from fuel switching is negligible.
Before receiving the Ecoestufa, the vast majority of the population reported using a biomass stove of some type.
These include open fires and plancha-style stoves like those measured in the additional KPT tests conducted for
Issuance 2, which performed on par with, or below the level of a 3-stone fire and thus have been classified by
the PP as unimproved stoves within the baseline for the purposes of calculating ER reductions.
BASELINE FUEL TYPE
Baseline Fuel Type N %
Wood 140 98.59%
Charcoal 0 0%
Gas 2 1.41%
Other 0 0%
Total 142 100%
BASELINE STOVE TYPE
Baseline Stove Type N %
Open Fire 135 92%

DOC REV 15/10/18.1
Page 49
Plancha 1 1%
Charcoal 1 1%
Gas 4 3%
Block 6 4%
Total 147 100%
HEATING PRACTICES
For leakage associated with heating, respondents were asked (a) whether they use their stove to heat their
home and (b) how they fuel the stove for heating purposes (i.e. do they specifically light a fire in the stove for
heating or simply allow cooking fuel to burn out). While about half of all users indicate that they use the stove
for heating, the majority also indicate that they tend to use only the fuel burning for cooking purposes and that
they use the same amount or less fuel for heating relative to their old stove. Furthermore, KPTs are subsumed,
and include any changes in increased use of the new stove for heating purposes. Thus it can be concluded that
there are negligible changes in the amount of fuel used for heating after the introduction of the Ecoestufa.
BASELINE STOVE TYPE
Home Heating N %
Yes 39 27%
No 103 73%
Total 142 100%
If yes, no fuel added? 35 90%
If yes, fuel added? 4 10%
Total 39 100%
SUSTAINABLE DEVELOPMENT INDICATORS
Air Quality & Health Effects
Self-reported incidence of air quality and health indicators show overwhelmingly positive changes in the
household in comparison to the baseline. In each case, respondents were first asked if they noticed any difference
in the indicator being monitored. If they responded “yes”, then they were asked to quantify the degree of
perceived difference from the baseline.
DEGREE OF PERCIEVED CHANGE IN AMOUNT OF SMOKE IN KITCHEN (FOR THOSE INDICATIING A CHANGE)
Change in Smoke? N %
Yes 141 99%
No 1 1%
Total 142 100%

DOC REV 15/10/18.1
Page 50
Much Less 135 96%
Less 6 4%
No difference 0 0%
More 0 0%
Much More 0 0%
Don’t Know 0 0%
Total 141 100%
DEGREE OF CHANGE IN AMOUNT OF EYE IRRITATION (FOR THOSE INDICATIING A CHANGE)
Change in Eye Irritation N %
Yes 141 99%
No 1 1%
Total 142 100%
Much Less 139 99%
Less 2 1%
No difference 0 0%
More 0 0%
Much More 0 0%
Don’t Know 0 0%
Total 141 100%
DEGREE OF CHANGE IN FREQUENCY OF COUGHING (FOR THOSE INDICATIING A CHANGE)
Change in Coughing N %
Yes 139 98%
No 3 2%
Total 142 100%
Much Less 136 98%
Less 2 1%
No difference 0 0%
More 0 0%
Much More 1 1%
Don’t Know 0 0%
Total 139 100%
Livelihood of The Poor & Access to Energy Services
Fuel sourcing and its impact on livelihood and access to energy were recorded by asking respondents to indicate
how they sourced fuel prior to the introduction of the Ecoestufa efficient stove. As Project Scenario 2 combines
the stove and filter, making it impossible for respondents to delineate between stove and filter savings, the

DOC REV 15/10/18.1
Page 51
following data includes outcomes for the combination of products, not just stoves. Data indicates little change in
mode of sourcing fuel with extremely low variance between baseline and project behaviors. Financial and time
savings measured as a percentage of money or time spent in the baseline, was significant.
FUEL SOURCING
Fuel Source Baseline % Project % Varience %
Buy 112 79% 107 75% -3.52%
Collect 22 15% 27 19% 3.52%
Both, Mostly Buy 4 3% 4 3% 0.00%
Both, Mostly Collect 4 3% 4 3% 0.00%
Total 142 100% 142 100% 0.00%
FUEL SAVINGS IN TIME AND MONEY
Savings/Week Baseline Project Savings %
Money (Q) 100.23 27.77 72.46 72%
Time (H) 12.81 6.43 6.38 50%
FUEL SAVINGS COMPARISON
Savings/Week Week Month Annual
Money (USD, FX=$0.13) $9.47 $37.88 $454.61
Time (H) 6.38 25.50 306.00
Customer Satisfaction
2 key customer satisfaction indicators are monitored: A gross satisfaction scale wherein respondents are asked
to rate their happiness with the stove on a scale of 1 to 100%, and a Net Promoter Score which measures the
number of people strongly predisposed to recommending the product to a friend. Both indicate very high
degrees of user satisfaction.
User Satisfaction Net Promoter Score
99.73% 10.0

DOC REV 15/10/18.1
Page 52

DOC REV 15/10/18.1
Page 53
WCFT MONITORING RESULTS: HH-WT & HH-DUAL WATER FILTERS
OVERVIEW OF SURVEYS CONDUCTED
WCFT monitoring of the water filter component of Project Scenarios 1 and Scenario 2 was conducted separately,
but results are presented together for the sake of easy comparison since both Project Scenarios use the same
water filter technology, have the same target population, use the same water Emission Reduction equation, and
utilize identical water-related survey questions. This allows for easier analysis of reported filter use between
households that receive only a filter and those that receive both a filter and a stove.
For WCFT Monitoring, 51 surveys were conducted under Project Scenario 1 and 49 surveys were conducted
under Project Scenario 2. All surveys were conducted in-person by the local M&E Team. 6 outliers were
identified removed from the Project Scenario 2, and 2 outliers were found from Project Scenario 1. The results
for the main quantitative parameters determined in the WCFTs are used in Emissions Reductions (ER)
calculations for the Issuance 4 Monitoring Period. The purpose of this monitoring is to investigate and report on
the following:
• Filtered water consumption for hygienic purposes (Qp,y)
• Continued boiling of filtered water (Qp,cleanboil)
• Seasonal variation in water treatment and consumption (incorporated into Continuous Monitoring)
• Baseline treatment mechanisms
WCFT HOUSEHOLDS BY DEPARTMENT
Department HH-DUAL % HH-WT %
Alta Verapaz 10 20% 10 19%
Baja Verapaz 29 59% 0 0%
Guatemala 10 20% 0 0%
Chimaltenango 0 0% 12 23%
Escuintla 0 0% 29 55%
Total 49 100% 51 100%
Within the Continuous Monitoring framework, a full MS/US is conducted within every WCFT household. MS/US
surveys are also conducted on households that do not participate in WCFTs as the sampling requirement for
MS/US surveys is much higher than for WCFTs. Including an MS/US survey in every WCFT household allows the
PP to replace many of the redundant qualitative questions normally included with the WCFT with the more
comprehensive MS/US survey questions. This has two benefits:
1. Every household surveyed receives the most comprehensive monitoring available, producing more
robust and complete data.

DOC REV 15/10/18.1
Page 54
2. MS/US results between WCFT and non-WCFT households can be compared and analyzed to identify
trends or anomalies.
WATER CONSUMPTION AND BOILING
On each day of the test, WCFT households were asked to quantify the number of people using treated water
over the previous 24 hours and to list the various uses for treated water. Each respondent was then asked pour
the amount of water utilized over the previous 24 hours for drinking, washing hands and washing fruits and
vegetables into a measuring container to ascertain the amount of treated water used for hygienic purposes, and
then to pour the amount of water utilized over the previous 24 hours for cooking, washing dishes and bathing
into a measuring container to ascertain the amount of treated water used for non-hygienic purposes. Finally,
respondents were asked whether (other than for the purposes of cooking already quantified) they had boiled
any treated water over the previous 24 hours, and if so, for what purposes.
Enumerators measured the total quantity of water consumed by measuring the amount of water in liters (L) in
the household prior to the 24-hour use period and then measuring the amount of water remaining after that
period. Enumerators measured various uses of water by taking daily measurements of each specific use. The
tables below present the average hygienic water consumption per person per day (L) and the average quantity
of treated water that is still boiled for both Project Scenarios.
QUANTITY OF SAFE WATER CONSUMED & BOILED, PER PERSON, PER DAY (L) (CONTINUOUS MONITORING SEASONALITY-INCORPORATED DATA)
Parameter HH-WT HH-DUAL Definition
Qp,y 2.66 2.44 Quantity of safe water supplied by project technology (in Liters) and consumed for hygienic purposes in the project scenario p per person per day.
Qp,cleanboil 0.00 0.00 Quantity of treated water supplied by project technology (in Liters) and still boiled in the project scenario p per person per day
Qp,y STATISTICAL ANALYSIS (CONTINUOUS MONITORING SEASONALITY-INCORPORATED DATA)
Qp,y Avg. (L) SDEV 90% CI Precision 90/10? N
hh-wt 2.66 1.10 0.25 9.56% Yes 51
hh-dual 2.44 0.99 0.24 9.73% Yes 49

DOC REV 15/10/18.1
Page 55
Qp,cleanboil STATISTICAL ANALYSIS (CONTINUOUS MONITORING SEASONALITY-INCORPORATED DATA)
Qp,cleanboil Avg. (L) SDEV 90% CI Precision 90/10? N
hh-wt 0.00 0.00 0.00 0.00% Yes 51
hh-dual 0.00 0.00 0.00 0.00% Yes 49
Qp,cleanboil measured zero for both Project Scenarios. While in previous issuances Qp,cleanboil was
measurable, it was extremely small. In this issuance the PP sought to clarify whether respondents previously
understood the question regarding Qp,cleanboil clearly. In reviewing previous surveys it became clear that some
respondents considered the cooking of soup or tea as having boiled treated water. However all cooking activity
is already captured in non-hygienic uses which include cooking, and therefore Qp,cleanboil was, in essence,
double counting some water use. For issuance 4, the PP refined the WCFT question on boiling to read, “Other
than for cooking soups or hot beverages like coffee or tea, did you boil any of the water you filtered in the last 24
hours in order to purify it?”. If the respondent answered “yes”, they were then asked why they chose to boil the
water and to list the purposes for which the water was boiled. This refined line of questioning clarified the issue
for respondents and resulted in a more accurate outcome for the parameter.
A breakdown of water consumption by Project Scenario, day and use is presented below:
HH-WT CONSUMPTION BY DAY AND TYPE (CONTINUOUS MONITORING SEASONALITY-INCORPORATED DATA)
HH-WT Day 1 Day 2 Day 3 AVG
TOT Water Consumed/HH 12.90 11.16 14.09 12.72
TOT Non-Hygienic Use/HH 1.08 1.22 0.98 1.09
Avg # of Users/HH 4.86 4.49 4.48 4.86
HH-DUAL CONSUMPTION BY DAY AND TYPE (CONTINUOUS MONITORING SEASONALITY-INCORPORATED DATA)
HH-DUAL Day 1 Day 2 Day 3 AVG
TOT Water Consumed/HH 13.52 12.82 13.16 13.17
TOT Non-Hygienic Use/HH 2.14 2.52 3.12 2.59
Avg # of Users/HH 4.80 4.92 4.92 4.80

DOC REV 15/10/18.1
Page 56
MS/US MONITORING RESULTS: HH-WT & HH-DUAL WATER FILTERS
OVERVIEW OF SURVEYS CONDUCTED
As with WCFTs, MS/US monitoring is conducted for both Project Scenario 1 & 2 separately. However, as the
demographics for both groups are similar, all MS/US data related to both project scenarios is presented side by
side below for the sake of easy comparison.
For MS/US Monitoring, 120 surveys were conducted under Project Scenario 1 and 149 surveys were conducted
under Project Scenario 2. From the 118 surveys used, 16 were done for Year 2, deciding to get a conservative
approach for this year. As per methodological allowance, all MS and US Surveys were conducted on the same
sample population and in-person by the local M&E Team. Two outliers were identified and were removed from
the Project Scenario 1 raw data during analysis. Seven outliers were identified and removed from the Project
Scenario 2 raw data during analysis. The results for the key quantitative and qualitative parameters determined
in the MS/US Surveys are used in Emissions Reductions (ER) calculations for the Issuance 4 Monitoring Period
and presented below. The purpose of this monitoring is to investigate and report on the following:
• Cumulative sales-weighted usage rate (Up,i,y)
• Number of persons consuming treated water per household
• Seasonal variation in water treatment and consumption (incorporated into Continuous Monitoring)
• Baseline treatment methods & technologies
• Sustainable development indicators
MS/US HOUSEHOLDS BY DEPARTMENT
Department HH-WT % HH-DUAL %
Alta Verapaz 21 18% 64 46%
Baja Verapaz 8 7% 44 31%
Chimaltenango 12 10% 0 0%
Escuintla 61 52% 0 0%
San Marcos 0 0% 12 8%
Jalapa 12 10% 0 0%
Guatemala 0 0% 22 15%
Sacatepequez 4 3% 0 0%
Total 118 100% 142 100%
USAGE RATE & USERS PER FILTER
The GS methodology requires that “a usage parameter be established to account for drop off rates as project
technologies age and are replaced”. The survey used a combination of questions to determine the weighted usage
parameter based on several factors. For enumerator assessment, the enumerator commented on whether the

DOC REV 15/10/18.1
Page 57
filter was filled or wet, in working condition and whether the respondent was using it properly. To determine
binary and rate of usage, the enumerator requested a cup of water to drink and observed whether the respondent
used the filter to provide it. The enumerator then asked how often the respondent used the filter (pre-determined
list of options) and if there was ever a time when the respondent did not use the filter.
Per the GS methodology TPDDTEC, a single usage parameter that is weighted based on drop off rates that are
representative of the age distribution for project technologies in the total sales record is used to calculate ERs.
Although the PP has strong evidence of filters working effectively in the field as long as 4 years, for the sake of
conservatism the PP has elected to include only filters 2 years of age or less for crediting purposes and thus only
two age groups of filters are considered in the surveys. As filters reach 25 months of age they are automatically
excluded from crediting. The total usage rate is determined by dividing the households that meet all usage
criteria by the total number of households surveyed, and takes into account continued use of baseline stoves for
certain cooking practices.
The monitoring results are used for year 1 and a conservative approach is used for year 2 as it’s explained in
Section “Deviation from Gold Standard” in page 6.
ACTIVE FILTER UNITS BY AGE
Project Scenario Age 0-1 % Age 1-2 %
hh-wt 16,569 50% 16,220 50%
hh-dual 227 22% 806 78%
KEY USAGE PARAMETERS USED IN THE CALCULATION OF ERS (CONTINUOUS MONITORING SEASONALITY-INCORPORATED DATA)
Parameter HH-WT HH-DUAL Definition
Up,y 96.88% 99.63% Cumulative usage rate for technologies in project scenario p, for technology i, during year y, based on cumulative installation rate and drop off rate.
Persons per filter
5.03 5.24 Number of persons consuming water supplied by project scenario per technology per day.
LPG Users who Boil
3.57% 1.01% Portion of users of project safe water supply who were boiling water using LPG
PERSONS PER FILTER (CONTINUOUS MONITORING SEASONALITY-INCORPORATED DATA)
Persons per filter Avg. (L) SDEV 90% CI Precision 90/10? N
hh-wt 5.03 1.95 0.30 5.91% Yes 118
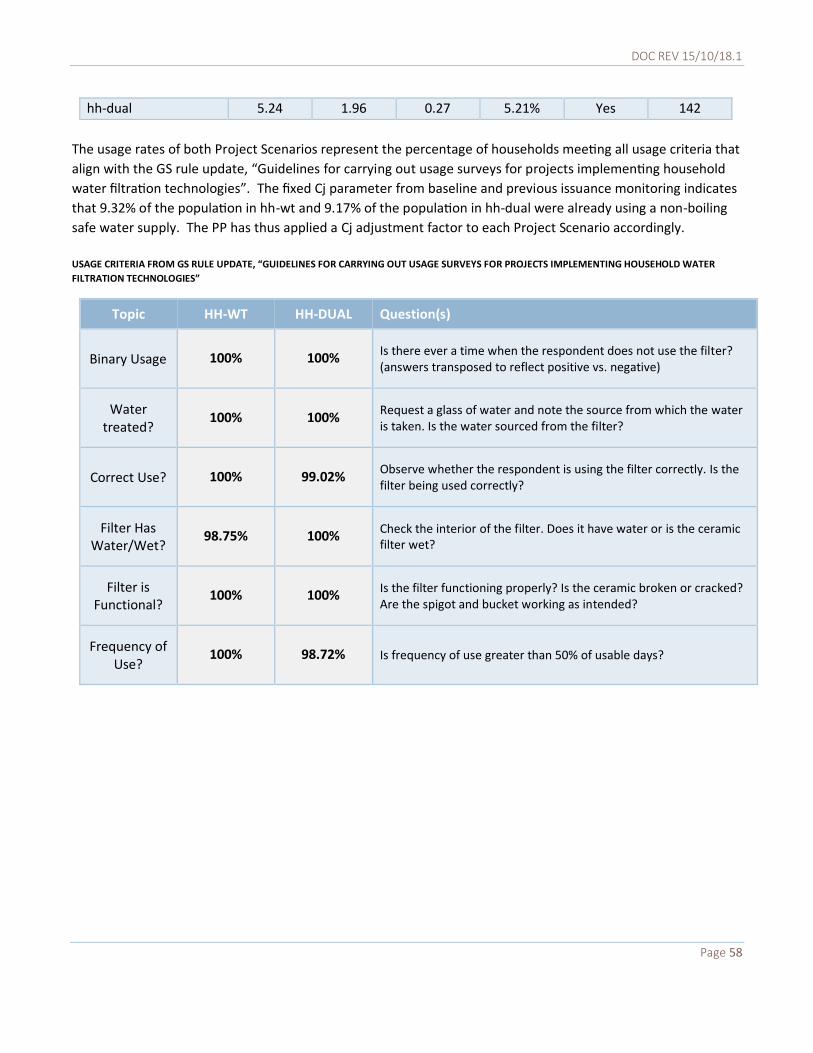
DOC REV 15/10/18.1
Page 58
hh-dual 5.24 1.96 0.27 5.21% Yes 142
The usage rates of both Project Scenarios represent the percentage of households meeting all usage criteria that
align with the GS rule update, “Guidelines for carrying out usage surveys for projects implementing household
water filtration technologies”. The fixed Cj parameter from baseline and previous issuance monitoring indicates
that 9.32% of the population in hh-wt and 9.17% of the population in hh-dual were already using a non-boiling
safe water supply. The PP has thus applied a Cj adjustment factor to each Project Scenario accordingly.
USAGE CRITERIA FROM GS RULE UPDATE, “GUIDELINES FOR CARRYING OUT USAGE SURVEYS FOR PROJECTS IMPLEMENTING HOUSEHOLD WATER
FILTRATION TECHNOLOGIES”
Topic HH-WT HH-DUAL Question(s)
Binary Usage 100% 100% Is there ever a time when the respondent does not use the filter? (answers transposed to reflect positive vs. negative)
Water treated?
100% 100% Request a glass of water and note the source from which the water is taken. Is the water sourced from the filter?
Correct Use? 100% 99.02% Observe whether the respondent is using the filter correctly. Is the filter being used correctly?
Filter Has Water/Wet?
98.75% 100% Check the interior of the filter. Does it have water or is the ceramic filter wet?
Filter is Functional?
100% 100% Is the filter functioning properly? Is the ceramic broken or cracked? Are the spigot and bucket working as intended?
Frequency of Use?
100% 98.72% Is frequency of use greater than 50% of usable days?

DOC REV 15/10/18.1
Page 59
BASELINE STOVE & FUEL TYPE
The MS/US also sought to confirm baseline stove and fuel used for boiling water for the purpose of ER
calculations. The majority of households used only wood fuel in the baseline as their main fuel for boiling water.
BASELINE FUEL USED FOR BOILING
Baseline Fuel for Boiling HH-WT % HH-DUAL %
Wood 48 87% 97 98%
Coal 0 0% 0 0%
Gas 2 4% 2 2%
Biogas 0 0% 0 0%
Other 5 9% 0 0%
TOTAL 55 100% 99 100%
Users who boiled with LPG 2 4% 1 1%
Of those households who boiled water in the baseline, only a small minority used gas (LPG) to complete the
task. The % of LPG users who treated water by boiling in the baseline have been deducted from ER calculations
by adjusting the parameter Np,y as applicable.
BASELINE STOVE USED FOR BOILING
Baseline Stove for Boiling HH-WT % HH-DUAL %
Open Fire 48 87% 97 98%
Plancha 5 9% 0 0%
Unimproved Charcoal 0 0% 0 0%
Gas 2 4% 2 2%
Other 0 0% 0 0%
TOTAL 55 100% 99 100%
Similarly, before receiving the filter, the vast majority of the population used a wood burning stove (either open
fire or plancha-style stove) to boil water.
SUSTAINABLE DEVELOPMENT INDICATORS
Water Quality & Quantity
Self-reported indicators of water quality and quantity show positive changes in comparison to the baseline.
Respondents were asked about the taste of treated water, if they felt like they had more or less access to clean
water and whether they noticed a reduction in stomach illnesses with the Ecofiltro vs the baseline.
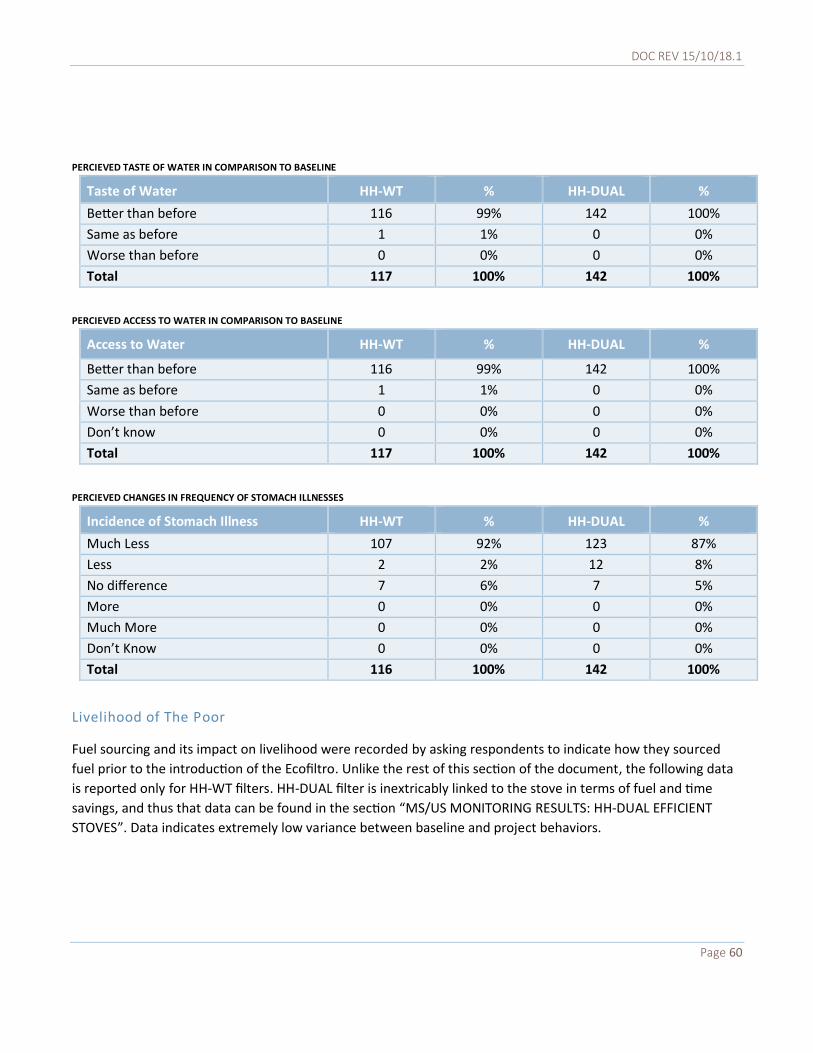
DOC REV 15/10/18.1
Page 60
PERCIEVED TASTE OF WATER IN COMPARISON TO BASELINE
Taste of Water HH-WT % HH-DUAL %
Better than before 116 99% 142 100%
Same as before 1 1% 0 0%
Worse than before 0 0% 0 0%
Total 117 100% 142 100%
PERCIEVED ACCESS TO WATER IN COMPARISON TO BASELINE
Access to Water HH-WT % HH-DUAL %
Better than before 116 99% 142 100%
Same as before 1 1% 0 0%
Worse than before 0 0% 0 0%
Don’t know 0 0% 0 0%
Total 117 100% 142 100%
PERCIEVED CHANGES IN FREQUENCY OF STOMACH ILLNESSES
Incidence of Stomach Illness HH-WT % HH-DUAL %
Much Less 107 92% 123 87%
Less 2 2% 12 8%
No difference 7 6% 7 5%
More 0 0% 0 0%
Much More 0 0% 0 0%
Don’t Know 0 0% 0 0%
Total 116 100% 142 100%
Livelihood of The Poor
Fuel sourcing and its impact on livelihood were recorded by asking respondents to indicate how they sourced
fuel prior to the introduction of the Ecofiltro. Unlike the rest of this section of the document, the following data
is reported only for HH-WT filters. HH-DUAL filter is inextricably linked to the stove in terms of fuel and time
savings, and thus that data can be found in the section “MS/US MONITORING RESULTS: HH-DUAL EFFICIENT
STOVES”. Data indicates extremely low variance between baseline and project behaviors.

DOC REV 15/10/18.1
Page 61
FUEL SOURCING
Fuel Source Baseline % Project % Varience %
Buy 62 53% 62 53% -0.46%
Collect 47 41% 50 43% 2.22%
Both, Mostly Buy 3 3% 3 3% -0.02%
Both, Mostly Collect 4 3% 2 2% -1.74%
Total 112 100% 113 100% 0.00%
FUEL SAVINGS IN TIME AND MONEY
Savings/Week Baseline Project Savings %
Money (Q) 46.57 40.47 6.10 13%
Time (H) 6.99 5.53 1.46 21%
FUEL SAVINGS COMPARISON
Savings/Week Week Month Annual
Money (USD, FX=$0.13) $0.80 $3.19 $38.25
Time (H) 1.46 5.83 69.94
Customer Satisfaction
2 key customer satisfaction indicators are monitored: A gross satisfaction scale wherein respondents are asked
to rate their happiness with the technology on a scale of 1 to 100%, and a Net Promoter Score which measures
the number of people strongly predisposed to recommending the product to a friend. Both indicate very high
degrees of user satisfaction.
USER SATISFACTION
Satisfaction Net Promoter Score
HH-WT 99.66% 9.98
HH-DUAL 98.85% 10.0

DOC REV 15/10/18.1
Page 62
WATER QUALITY MONITORING
The PP conducted microbiological Presence/Absence (P/A) tests to determine the effectiveness of the project
technologies as they age. Ecofiltro’s manufacturer’s specifications state that the filter has a minimum lifespan of
2 years, and has been shown to last for more than 4 years when used and maintained correctly. For the sake of
conservatism, the PP has elected to include only filters 2 years of age or younger for crediting, and thus testing.
The last 5 to 7 households monitored in each region from the randomly selected monitoring list were used for
water quality testing, assuring the selection of households was unbiased and representative of the population.
Surveyors collected 100ml samples of water directly from the filter using a sterilized beaker and latex gloves.
The samples were then sealed and placed in a protective box for transport to laboratories for testing.
Independent, 3rd party laboratories were selected to conduct testing based on geographic proximity to the field
sample collection point to minimize possible contamination during travel and to assure that all samples were
delivered within 8 hours of sampling.
WHO and Guatemalan standards consider safe drinking water as containing less than 1 Colony Forming Unit
(CFU) of E.Coli/100 ml of water. The labs used for testing conducted a controlled analysis of water samples to
measure for the levels of Ecoli in the water samples. As per Guatemalan and World Health Organization
Standards, and as consistent with the methodology and PDD, any filter samples exceeding 1 CFU of Ecoli per 100
ml were considered to have failed the test.
WQT HOUSEHOLDS BY DEPARTMENT
Department N % Department N %
Alta Verapaz 10 14% Peten 0 0%
Baja Verapaz 29 41% Quetzaltenango 0 0%
Chimaltenango 0 0% Quiche 0 0%
Chiquimula 0 0% Retalhuleu 0 0%
El Progreso 0 0% Sacatepequez 0 0%
Escuintla 21 30% San Marcos 0 0%
Guatemala 10 15% Santa Rosa 0 0%
Huehuetenango 0 0% Solola 0 0%
Izabal 0 0% Suchitepequez 0 0%
Jalapa 0 0% Totonicapan 0 0%
Jutiapa 0 0% Zacapa 0 0%
WQT LAB TESTING PASS RESULTS
Passing Filter % HH-DUAL HH-WT
Age 0-1 95.00% 89.00%
Age 1-2 95.24% 100.00%

DOC REV 15/10/18.1
Page 63
PROJECT LEAKAGE ASSESSMENT
Below is the leakage assessment for each potential source of leakage as defined in the GS TPDDTEC
methodology and PDD:
LEAKAGE SOURCE 1
The displaced baseline technologies are reused outside the project boundary in place of lower emitting
technology or in a manner suggesting more usage than would have occurred in the absence of the project.
Assessment: No leakage.
Justification: There is no evidence that the project increases the use of higher emitting technologies outside the
project boundary where lower emitting technologies are in place (i.e. 3 stones fires). Wood fuels remain a
valuable and declining resource and this trend is not reversed by the project activity. The baseline technology
used in Guatemala is three stone cook stoves, which are the same type of technology that is used outside the
project boundary (Guatemala) i.e. Honduras, El Salvador, etc. Given that the leakage assessment does not
expect an increase in fuel consumption by the non-project households/users attributable to the project activity,
calculations do not need to be adjusted to account for this leakage.
LEAKAGE SOURCE 2
The non-renewable biomass or fossil fuels saved under the project activity are used by non-project users who
previously used lower emitting energy sources.
Assessment: No leakage.
Justification: There is no evidence that the project increases the use of higher emission fuels outside the project
boundary where lower emitting energy sources were formerly used. Wood fuels remain a valuable and
declining resource and this trend is not reversed by the project activity. Given that the leakage assessment does
not expect an increase in fuel consumption by the non-project households/users attributable to the project
activity, calculations do not need to be adjusted to account for this leakage.
LEAKAGE SOURCE 3
The project significantly impacts the NRB fraction within an area where other CDM or VER project activities
account for NRB fraction in their baseline scenario.
Assessment: No leakage.
Justification: The Project Proponent has determined that total number of people reached by all activities of
GS1321 is less than 1.4% of the total Guatemalan population, and thus its effects on the national NRB value are
currently negligible.
In addition to GS 1321, there are currently two registered efficient stove projects in Guatemala that account for
NRB in their baseline:

DOC REV 15/10/18.1
Page 64
- GS 1377 Utsil Naj —Casa saludable para todos, located in Sacatepaquez, Guatemala, is a Gold Standard
project activity registered under a Latin American PoA.
- CDM 8480 Distribution of Onil Stoves, Guatemala, a CDM PoA with project activities managed by Helps
International country-wide in Guatemala.
Despite each having been registered for several years, neither the Utsil Naj, nor the Onil project have requested
issuance, suggesting that neither has been successful implementing meaningful numbers of stoves. The Utsil Naj
project was initially projected as a small scale project that would produce fewer than 10,000 tonnes of VERs per
year, and thus even at full-scale implementation, would have a negligible impact on NRB. The Onil PDD projects
the sale of up to 50,000 stoves per year from a base of 4,500 in the first year of the project (2008). Richard
Grinnell, former President of Helps International, estimates that the organization has distributed approximately
10,000 stoves per year since 2009, but has not been able to exceed that level of annual sales to date.
Conservative estimates of technology distribution through these two projects are placed at 15,000 per annum.
Adding GS 1321 sales figures for 2014 to this base amount, total annual stove distribution volumes are
estimated to be below 20,000 units per year. Annual water filter volumes are estimated at 30,000 per year.
Third party baseline analysis completed for GS 1321 placed annual NRB at 15,006,365 tonnes per year in
Guatemala. With a population of approximately 15,000,000, this equates roughly to one tonne per person per
year, or 5.66 tonnes per household per year. Guatemala’s annual growth rate is estimated to be 2.5% by the
Population Reference Bureau6. That growth rate equates to 66,000 additional households per year, and a
corresponding increase of approximately 375,000 tonnes in annual NRB. Conservatively assuming a 70%
reduction in fuel use per technology-household, project interventions would need to achieve a distribution rate
of 94,000 units per year to offset the current annual rate of increase in NRB.
Using a simpler point of comparison, total annual technology distribution from GS1321 and other projects
currently impacts only 1.4% of the population, approximately 1.1% below the annual growth rate, rendering the
effects on NRB negligible in that they merely slow the increase in annual NRB rather than reducing it.
Given all of these factors, the Project Proponent has determined that GS1321 does not significantly affect the
national NRB value and is unlikely to within its projected crediting period.
See detailed values used for calculating NRB leakage assessments on the following page.
6 http://www.prb.org/Publications/Datasheets/2011/world-population-data-sheet/guatemala.aspx

DOC REV 15/10/18.1
Page 65
NRB Leakage Analysis Value Unit Source
Current NRB in Guatemala 15,006,365 t/year 3rd party baseline analysis
Population of Guatemala 15,073,375 persons http://www.ine.gob.gt/sistema/uploads/2014/02/
26/5eTCcFlHErnaNVeUmm3iabXHaKgXtw0C.pdf
Average HH Size 5.69 persons Annex 6 GS1321 Iss 1 HH WCFT MS US Report
Population of Guatemala
(households) 2,649,099 HHs Calculated
Approximate NRB allocation/HH 5.66 t/year Calculated
Annual Population Growth Rate 2.50% % http://www.prb.org/Publications/Datasheets/201
1/world-population-data-sheet/guatemala.aspx
Annual HH Growth Rate Equivalent
(HHs) 66,227 HHs Calculated
Annual NRB Contribution from Pop.
Growth 375,159 t/year Calculated
Households Receiving Technologies
(GS 1321) 30,000 units/year ISS 2 Total Sales Record Average
Households Receiving Technologies
(other) 15,000 units/year Conservatively Estimated
Average Fuel Savings/Technology 70% % ISS 3 ER Calculations rounded up
Annual NRB Reduction from
Technology Dist. 178,438 t/year Calculated
% of population represented by
current sales 1.70% % Calculated
Annual Distribution Required to Offset
NRB Growth Rate 94,611 units/year Calculated

DOC REV 15/10/18.1
Page 66
LEAKAGE SOURCE 4
The project population compensates for loss of the space heating effect of inefficient technology by adopting
some other form of heating or by retaining some use of inefficient technology.
Assessment: No leakage.
Justification: MS/US monitoring determined that more than 27% of stove users use the Ecoestufa to heat their
home. However, the overwhelming majority of these households indicated that they achieve heating by letting
the fire from cooking die out (i.e. they do not specifically light a fire in the stove for this purpose), also indicating
that they use the same or a lesser amount of fuel for heating relative to the amount they used on their old
stove. Further, the large majority of users have removed their old stove technology from the home in
consideration of warranty requirements that stipulate that the warranty is only valid if the old technology is
removed from the home. Thus it can be concluded that there are negligible changes in the amount of fuel used
for heating after the introduction of the Ecoestufa.
LEAKAGE SOURCE 5
By virtue of promotion and marketing of a new technology with high efficiency, the project stimulates
substitution within households who commonly used a technology with relatively lower emissions, in cases
where such a trend is not eligible as an evolving baseline.
Assessment: No leakage.
Justification: MS/US monitoring shows that a small percentage (<5%) of users have switched from using fuels
and technologies considered higher efficiency in the baseline to only using firewood after receiving the
Ecoestufa. The overwhelming majority of respondents reported using fuelwood on a stove with lower efficiency
than the Ecoestufa in the baseline. Since the percentage of respondents using technologies with lower emissions
than the Ecoestufa in the baseline (LPG and biogas stoves) is so small (<5%), leakage from fuel switching is
considered negligible.

DOC REV 15/10/18.1
Page 67
NEXT MONITORING PERIOD:
FAR FOR NEXT ISSUANCE
Issued: Deviation Request The Gold Standard.
By: The Gold Standard
Description: PD shall reassess the ERs obtained from the adjusted value using a measured value for the same age-
groups at the time of next issuance request (MP5). If the issued ERs for 2nd year (MP4) using the adjusted value
are more than those using the reassessed, measured value (MP5), PD will be asked to compensate the emission
reductions from MP5. If less, no extra emission reductions can be claimed. PP shall note that the Usage Survey
requirements will apply for MP5, however, for the purposes of comparing the adjusted value, the cap will not
apply.

DOC REV 15/10/18.1
Page 68
EMISSIONS REDUCTIONS EQUATIONS & CALCULATIONS
IMPROVED COOKSTOVES
ERy = (Np,y,ics * Up,I,y * Pp,b,y,ics * NCVb,fuel * ((fNRB,b,y* EFwood,CO2 + EFwood,nonCO2) – Σ LEp,y )7
Where:
Parameter Value Unit Definition
fnrb,y,ics-nb 96% Percentage Non-renewable fraction of the woody biomass harvested in the project collection area in year y
Pp,b,y,ics-nb 0.02068 tons/technology-day
Specific fuel savings for an individual technology of project scenario 2 against an individual technology of baseline scenario in year y, in tons/technology-day, as derived from the statistical analysis of the data collected from the field tests
Up,1,ics-nb 93.55% Percentage Usage rate in project scenario p, for technology ics-nb, during year 1
Up,2,ics-nb 92.39% Percentage Usage rate in project scenario p, for technology ics-nb, during year 2
NCVwood 0.0156 TJ/ton Net calorific value of wood (TJ/Gg)
EFb,wood,CO2 112,000 kg CO2/TJ IPCC default value for wood fuel CO2 emission factor
EFb,wood,CH4 300 kg CH4/TJ CH4 emission for wood fuel
EFb,wood,N2O 4 kg N2O/TJ N2O emission factor for wood fuel
GWPCO2 1 kg CO2/kg CO2 Global warming potential of CO2
GWPCH4 21 kg CO2/kg CH4 Global warming potential of CH4
GWP N2O 310 kg CO2/kg N2O Global warming potential of N20
Np1,ics-nb 1,263,145 technology-days Cumulative number of project technology-days included in the project database for project scenario p for technology ics-nb against baseline scenario b in year 1
Np2,ics-nb 1,275,754 technology-days Cumulative number of project technology-days included in the project database for project scenario p for technology ics-nb against baseline scenario b in year 2
7 Note to convert EF EFfuel,nonCO2 to CO2 equivalents the following formula is used: Ffuel,nonCO2 =( EFwood,CH4 * GWPCH4)+(EFwood,N2O *GWPN2O)
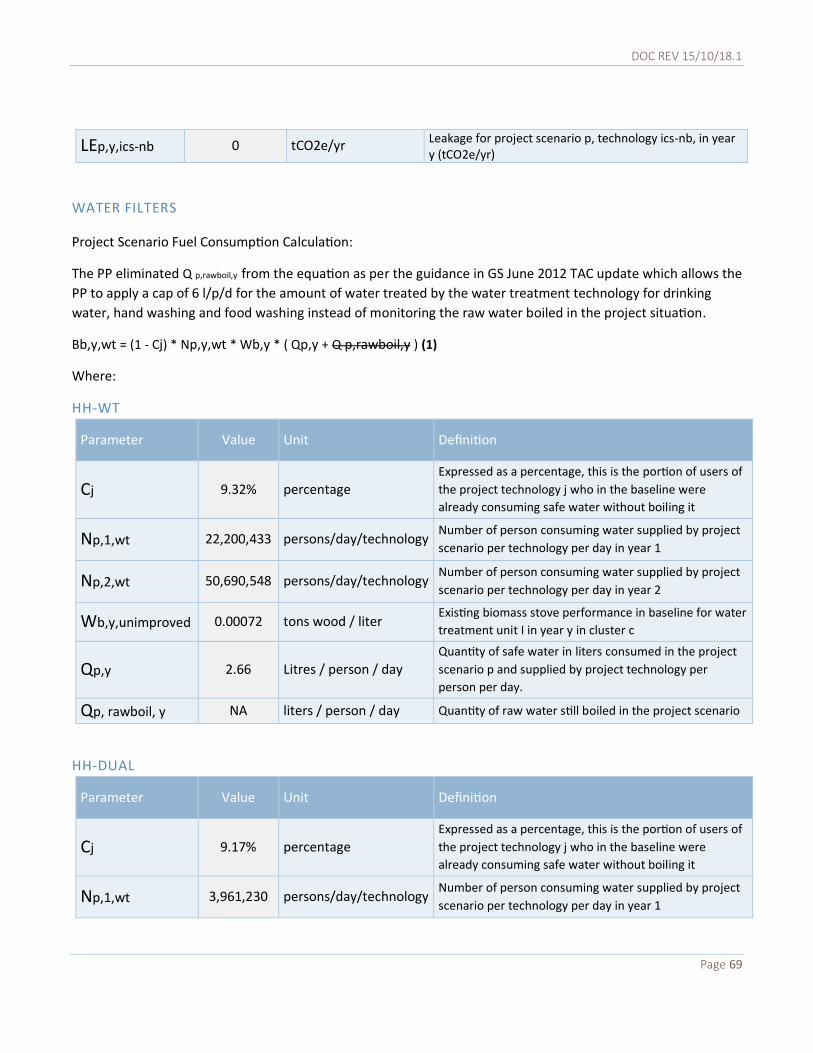
DOC REV 15/10/18.1
Page 69
LEp,y,ics-nb 0 tCO2e/yr Leakage for project scenario p, technology ics-nb, in year y (tCO2e/yr)
WATER FILTERS
Project Scenario Fuel Consumption Calculation:
The PP eliminated Q p,rawboil,y from the equation as per the guidance in GS June 2012 TAC update which allows the
PP to apply a cap of 6 l/p/d for the amount of water treated by the water treatment technology for drinking
water, hand washing and food washing instead of monitoring the raw water boiled in the project situation.
Bb,y,wt = (1 - Cj) * Np,y,wt * Wb,y * ( Qp,y + Q p,rawboil,y ) (1)
Where:
HH-WT
Parameter Value Unit Definition
Cj 9.32% percentage
Expressed as a percentage, this is the portion of users of
the project technology j who in the baseline were
already consuming safe water without boiling it
Np,1,wt 22,200,433 persons/day/technology Number of person consuming water supplied by project
scenario per technology per day in year 1
Np,2,wt 50,690,548 persons/day/technology Number of person consuming water supplied by project
scenario per technology per day in year 2
Wb,y,unimproved 0.00072 tons wood / liter Existing biomass stove performance in baseline for water
treatment unit I in year y in cluster c
Qp,y 2.66 Litres / person / day Quantity of safe water in liters consumed in the project
scenario p and supplied by project technology per
person per day.
Qp, rawboil, y NA liters / person / day Quantity of raw water still boiled in the project scenario
HH-DUAL
Parameter Value Unit Definition
Cj 9.17% percentage Expressed as a percentage, this is the portion of users of
the project technology j who in the baseline were
already consuming safe water without boiling it
Np,1,wt 3,961,230 persons/day/technology Number of person consuming water supplied by project
scenario per technology per day in year 1

DOC REV 15/10/18.1
Page 70
Np,2,wt 859,558 persons/day/technology Number of person consuming water supplied by project
scenario per technology per day in year 2
Wb,y,unimproved 0.00072 tons wood / liter Existing biomass stove performance in baseline for water
treatment unit I in year y in cluster c
Qp,y 2.44 Litres / person / day Quantity of safe water in liters consumed in the project
scenario p and supplied by project technology per
person per day.
Qp, rawboil, y NA liters / person / day Quantity of raw water still boiled in the project scenario
EMISSION REDUCTIONS
BEb,y,wt = Bb,y,wt * ((f NRB,b, y,wt * EFb,fuel, CO2) + EFb,fuel, nonCO2) *NCVb fuel (3) 8
PEp,y,wt = Bp,y,wt * ((f NRB,p, y,wt * EFp,fuel, CO2) + EFp,fuel, nonCO2) * NCVp, fuel (4) 9
Where:
DEFAULT VALUES
Parameter Value Unit Definition
fnrb,b,y,wt 95.74% Percentage Non-renewable fraction of the woody biomass harvested in the project collection area in year y
NCVwood 0.0156 TJ/ton Net calorific value of wood (TJ/Gg)
EFb,wood,CO2 112,000 kg CO2/TJ IPCC default value for wood fuel CO2 emission factor
EFb,wood,CH4 300 kg CH4/TJ CH4 emission for wood fuel
EFb,wood,N2O 4 kg N2O/TJ N2O emission factor for wood fuel
EFp,wood,CO2 112,000 kg CO2/TJ IPCC default value for wood fuel CO2 emission factor
EFp,wood,CH4 300 kg CH4/TJ CH4 emission for wood fuel
EFp,wood,N2O 4 kg N2O/TJ N2O emission factor for wood fuel
8 Note to convert EF EFb,fuel,nonCO2 to CO2 equivalents the following formula is used: EF b,fuel,nonCO2 =( EF b,wood,CH4 * GWPCH4)+(EF b,wood,N2O *GWPN2O) 9 Note to convert EF EF p,fuel,nonCO2 to CO2 equivalents the following formula is used: EF p,fuel,nonCO2 =( EF p,wood,CH4 * GWPCH4)+(EF p,wood,N2O *GWPN2O)

DOC REV 15/10/18.1
Page 71
GWPCO2 1 kg CO2/kg CO2 Global warming potential of CO2
GWPCH4 21 kg CO2/kg CH4 Global warming potential of CH4
GWPN2O 310 kg CO2/kg N2O Global warming potential of N20
HH-WT
Parameter Value Unit Definition
Bb,y,wt 124,203.99 Tonnes Quantity of fuel consumed in baseline scenario b during year y in
tonnes
Bp,y,wt 0.00 Tonnes Quantity of fuel consumed in project scenario b during year y in
tonnes
HH-DUAL
Parameter Value Unit Definition
Bb,y,wt 14,094.75 Tonnes Quantity of fuel consumed in baseline scenario b during year y in
tonnes
Bp,y,wt 0.00 Tonnes Quantity of fuel consumed in project scenario b during year y in
tonnes
Overall Water Filter GHG reductions are calculated as follows:
ERy,hh-wt = ( Σ BEb,y,wt – Σ PEp,y,wt ) * Up,y,wt - Σ LEp,y,wt (5)
Where:
BEb,y,wt and PEp,y,wt are calculated from the parameters above and:
HH-WT
Parameter Value Unit Definition
Up,1,wt 96.88% Percentage Usage rate in project scenario p, for technology wt, during year 1
Up,2,wt 88.42% Percentage Usage rate in project scenario p, for technology wt, during year 2
LEp,y,wt 0 tCO2e/yr Leakage for project scenario p, technology wt, in year y

DOC REV 15/10/18.1
Page 72
HH-DUAL
Parameter Value Unit Definition
Up,1,wt 99.63% Percentage Usage rate in project scenario p, for technology wt, during year 1
Up,2,wt 95%% Percentage Usage rate in project scenario p, for technology wt, during year 2
LEp,y,wt 0 tCO2e/yr Leakage for project scenario p, technology wt, in year y
SUMMARY SALES & DISTRIBUTION USED FOR ER CALCULATIONS
The total sales on which ER Calculations are based for each technology are presented below by Department.
Cumulative sales include all sales of stoves from the inception of the program to date as well as all filters 2 years
of age and younger. ER Calculations start with these gross sales figures and apply the myriad of parameters derived
from monitoring and presented above in order to arrive at a final VER volume for issuance.
The table below indicates cumulative sales by department and Project Scenario.
DEPARTMENT HH-DUAL HH-WT DEPARTMENT HH-DUAL HH-WT
Alta Verapaz 1,259 1,324 El Progresso 0 0
Baja Verapaz 1,161 2,164 Quetzaltenango 0 604
Chimaltenango 0 5,663 Quiche 0 5,238
Chiquimula 0 1,740 Retalhuleu 0 576
Escuintla 9 4,683 Sacatepequez 0 1,579
Guatemala 155 2,867 San Marcos 890 286
Huehuetenango 3 1,987 Santa Rosa 0 1,595
Izabal 2 948 Solola 5 2,060
Jalapa 0 1,973 Suchitepequez 20 1,838
Jutiapa 0 1577 Totonicapan 0 115
Peten 0 884 Zacapa 0 1,792
TOTAL 3504 41,492
DOC REV 15/10/18.1
Page 73
TOTAL CALCULATED ERs: MONITORING PERIOD 4
Xcel Document ER Calculations GS1321 Iss 4Year1 070218 & ER Calculations GS1321 Iss 4Year2 070218 contains
all Emissions Reductions (ER) calculations for each of the technologies described in this report. There are two
tabs for each Project Scenario:
1. “Project Scenario” ER Eqs.
a. Provides calculation of the ERs based equations listed above and project monitoring conducted
to date and default values (as listed in the Parameter boxes in this report).
b. Follows ER equations as listed in the TPDDTEC Methodology.
2. “Project Scenario” Calcs.
a. Technology days accrued during this monitoring period are calculated using total sales database.
b. Stock turnover rate or inventory lag days are accounted for (where applicable) by the calculation
of an inventory lag date (sales date + inventory lag days) which is used to determine the
technology years accrued during this MP. The analysis used to determine the number of
inventory lag days is found in the Excel file DCD Iss4 Lag Analysis. Where a weighted average
was done separating Ecofiltro Sales and NGO’s. The result for year 1, was +19 days and it was
chosen also for Year 2 in order to get a conservative approach (Real value +1).

DOC REV 15/10/18.1
Page 74
The tables below show total CO2e emissions reductions achieved by the Project during the Monitoring Period by
product type and by project scenario, each with Vintage breakdowns.
Cumulative ERs by Project Scenario & Vintage Year 1 2016 2017
hh-dual 54,911 tCO2e 41,251 13,660
hh-wt 66,876 tCO2e 40,667 26,209
Total 121,787 tCO2e 81,917 39,869
Cumulative ERs by Project Scenario & Vintage Year 2 2017 2018
hh-dual 45,858 tCO2e 34,537 11,321
hh-wt 139,364 tCO2e 95,155 44,209
Total 185,222 tCO2e 129,692 55,530
Cumulative ERs by Project Scenario & Vintage Totals
2016
2017 2018
hh-dual 100,769 tCO2e 41,251 48,197 11,321
hh-wt 206,240 tCO2e 40,667 121,364 44,209
Total 307,009 tCO2e 81,917 169,561 55,530
Emission reductions or GHG removals by sinks (t CO2e)
HH-WT HH-DUAL
Actual values achieved during this monitoring period
206,240 100,769
Values estimated in ex ante calculation of registered PDD
3,707,981 448,129

DOC REV 15/10/18.1
Page 75
LIST OF SUPPORTING DOCUMENTS PROVIDED WITH THIS REPORT
• ER Calculations GS 1321 Iss 4Year1 070218
• ER Calculations GS 1321 Iss 4Year2 070218
• MS_US_WCFT_KPT_WQT Data GS1321 Iss4 20180411. xlsx
• Reference Docs [Folder]
o Guatemala PDD V5_2013-09-20.pdf
o GS 1321_3-Week Review_II MP_Round II_23092015.pdf
o Paradigm_GS 1321_FVR 28Sep1015_signed.pdf
o Ecofiltro_Operations_Manual_V3_20150518.pdf
o Socorro Maya_Operations_Manual20150518.pdf
o Sales Data [Folder]
o FAR Documentation [Folder]
o Meter Calibration [Folder]
o WQT Lab Reports [Folder]
o Continuous GS Monitoring Concept.docx
o Continuous Monitoring Approval.pdf
o Annex 5 GS1321 Iss 1 KPT Data v3.xlsx
o Eko-Stove Manual.pdf
o Monitoring Report GS1321 Iss 2 20150928FIN
o NRB Leakage Analysis GS1321 Iss 3 _20160429.xlsx
o Photos of HH Training [Folder]