gsa data repository 2011111 bots et al.gsa data repository 2011111 bots et al. phreeqc evaporation...
TRANSCRIPT

GSA Data Repository 2011111 Bots et al.
PHREEQC evaporation simulations
PHREEQC (Parkhurst and Appelo, 1999) evaporation simulations using the Pitzer equation were carried out to evaluate the minerals formed from evaporating seawater with varying Mg and SO4 concentrations as would have occurred during the Phanerozoic (Hardie, 1996). The composition of the input solutions in the evaporation models solutions (2-20mM Mg, 5-15mM SO4, 10.5mM Ca 10.4mM K, 558mM Cl and Na was adjusted to charge balance the solutions, Table DR1) were within the chemical range of the experimental solutions (Table 1). In addition, the Phanerozoic seawater composition from both calcite and aragonite seas, including compositions between these end members (8mM SO4, 30mM Ca and 29mM Mg to 29mM SO4, 10mM Ca and 54mM Mg, Horita et al., 2002; Table DR2) were also used as input solutions in the evaporation simulations. The simulations were run by removing increasing amounts of H2O from the solutions and allowing precipitation (Table DR3). All simulated solutions contained Ca, Mg, SO4, Na, Cl, CO3 and K to allow precipitation of all major evaporite minerals, listed in Table DR4, during the simulations (Hardie, 1996).
A summary of results from the PHREEQC modeling are presented in Table DR1 and DR2. Fig. DR1-DR4 and DR9 show the evolution of the solution composition as a function of the remaining water as modeled by PHREEQC and Fig. DR5-DR8 and Fig. DR10 show the occurrence of the evaporite minerals in equilibrium with the evaporated solutions (Fig. DR1-DR4 and DR9). The evaporite type (Hardie, 1996) was determined by examining the evaporite mineral sequence (Table DR1, DR2, DR4 and Figure DR5-DR8 and DR10). When sylvite, and/or CaCl2 minerals (Table DR4) were present during the evaporation of the modeled solutions in the absence of MgSO4 minerals the evaporite type was determined to be KCl, and the evaporite type was determined to be MgSO4 when polyhalite, and/or kieserite were present during the evaporation of the modeled solutions (Hardie, 1996). For the purpose of this publication we included the MgSO4 + KCl evaporite type in the MgSO4 type because both of these evaporite types were coincident with the aragonite seas (Hardie, 1996). The sea type (e.g. Lowenstein et al., 2003) was determined from the composition of the final invariant solution (Table DR1 and DR2); when the Ca concentration exceeded the SO4 concentration the sea type was determined to be CaCl2 and when the SO4 concentration exceeded the Ca concentration the sea type was determined to be MgSO4. Using the chemical divide that e.g. Lowenstein et al. (2003) used does not result in the same sea type that the final invariant solution suggest. According to Lowenstein et al. (2003) the CaSO4 chemical divide, when the calcium and sulphate concentrations are equal in seawater, is the chemical boundary condition between different evaporite types i.e. when the calcium concentrations is less than the sulfate concentration sulfate is left in the evaporating solution and magnesium sulfate evaporites (e.g. kieserite, Table DR4) are able to precipitate resulting in a MgSO4 evaporite sequence originating from a MgSO4 sea. However, this does not take into account the precipitation of CaCl2 minerals like antarcticite and tachyhydrite (Table DR1 and DR2 and Fig. DR1 to DR10), which form in addition to CaSO4 minerals. This removes additional Ca from solution, therefore the Ca/SO4 ratio at which additional SO4 remains in solution to form MgSO4 evaporites is >1.(e.g. in a seawater solution with initial [Ca] =10.5mM, the calculated chemical divide, separating between MgSO2 and KCl evaporite types occurred at ~9mM SO4, Table DR1 ).

Tab
le D
R1.
Tab
le w
ith
inp
ut a
nd o
utpu
t so
luti
ons
from
th
e ev
apor
atio
n si
mu
lati
ons
on s
olu
tion
s in
th
e co
nce
ntra
tion
ran
ge f
rom
the
exp
erim
enta
l set
-up
, inc
lud
ing
the
sea
typ
e (L
owen
stei
n e
t al
., 20
03),
th
e ev
apor
ite
type
(H
ard
ie, 1
996)
an
d th
e ev
apor
ite
min
eral
seq
uen
ce a
s th
ey o
ccur
in t
he s
imul
atio
ns
Eva
pori
te m
iner
al s
eque
nce§
Cc,
G, A
, H, S
yl, C
ar, A
nt
Cc,
G, A
, H, S
yl, C
ar, A
nt
Cc,
G, A
, H, S
yl, P
ol, C
ar
Cc,
G, A
, H, G
l, P
ol, S
yl
Cc,
G, A
, H, S
yl, C
ar, A
nt
Cc,
G, A
, H, S
yl, C
ar, A
nt
Cc,
G, A
, H, S
yl, P
ol, C
ar
Cc,
G, A
, H, G
l, P
ol, S
yl, C
ar
Cc,
G, A
, H, S
yl, C
ar, A
nt
Cc,
G, A
, H, S
yl, C
ar, A
nt
Cc,
G, A
, H, S
yl, P
ol, C
ar
Cc,
G, A
, H, G
l, P
ol, S
yl, C
ar, K
i
Cc,
G, A
, H, S
yl, C
ar, B
i, T
ac
Cc,
G, A
, H, S
yl, C
ar, B
i, T
ac
Cc,
G, A
, H, S
yl, C
ar, B
i, K
i
Cc,
G, A
, H, P
ol, S
yl, C
ar, K
i, B
i
* T
he s
ea ty
pe w
as d
eter
min
ed f
rom
the
inva
rian
t sol
utio
ns w
here
Ca>
SO4
repr
esen
ts a
CaC
l2 ty
pe s
ea a
nd C
a<S
O4
repr
esen
ts a
MgS
O4
type
sea
. #
The
eva
pori
te ty
pe is
det
erm
ined
fro
m th
e ev
apor
ite m
iner
al s
eque
nce;
whe
n sy
lvit
e is
pre
sent
with
out a
ny M
gSO
4 m
iner
al th
e ev
apor
ite
type
is K
Cl a
nd w
hen
poly
hali
te a
nd/o
r ki
eser
ite
is p
rese
nt th
e ev
apor
ite
ty
pe is
MgS
O4
(Har
die,
199
6)
§ T
he e
vapo
rite
min
eral
seq
uenc
es a
re d
eter
min
ed f
rom
Fig
. DR
5-8;
the
abbr
evia
tions
of
the
min
eral
pha
ses
and
thei
r ch
emic
al f
orm
ula
are
liste
d in
Tab
le D
R4.
Tab
le D
R2.
Tab
le w
ith
inp
ut a
nd o
utpu
t so
luti
ons
from
th
e ev
apor
atio
n si
mu
lati
ons
on s
olu
tion
s be
twee
n t
he
cret
aceo
us a
nd
the
pre
sen
t d
ay c
hem
istr
y as
pro
pose
d b
y fo
r ex
amp
le H
orit
a et
al.
(200
3),
incl
udin
g th
e se
a ty
pe (
Low
enst
ein
et
al.,
2003
), t
he e
vapo
rite
typ
e (H
ardi
e, 1
996)
an
d t
he e
vapo
rite
min
eral
seq
uen
ce a
s th
ey o
ccur
in t
he s
imu
lati
ons
Eva
pori
te m
iner
al s
eque
nce§
Cc,
G, A
, H, G
l, P
ol, E
, Hx,
Ki,
Car
, Bi
Cc,
G, A
, H, P
ol, C
ar, K
i, B
i
Cc,
G, A
, H, S
yl, C
ar, B
i, K
i
Cc,
G, A
, H, S
yl, C
ar, B
i, T
ac
Cc,
G, A
, H, S
yl, C
ar, B
i, T
ac
Cc,
G, A
, H, S
yl, C
ar, B
i, T
ac, A
nt
* T
he s
ea ty
pe w
as d
eter
min
ed f
rom
the
inva
rian
t sol
utio
ns w
here
Ca>
SO4
repr
esen
ts a
CaC
l2 ty
pe s
ea a
nd C
a<S
O4
repr
esen
ts a
MgS
O4
type
sea
. #
The
eva
pori
te ty
pe is
det
erm
ined
fro
m th
e ev
apor
ite m
iner
al s
eque
nce;
whe
n sy
lvit
e is
pre
sent
with
out a
ny M
gSO
4 m
iner
al th
e ev
apor
ite
type
is K
Cl a
nd w
hen
poly
hali
te a
nd/o
r ki
eser
ite
is p
rese
nt th
e ev
apor
ite
ty
pe is
MgS
O4
(Har
die,
199
6)
§ T
he e
vapo
rite
min
eral
seq
uenc
es a
re d
eter
min
ed f
rom
Fig
. DR
10; t
he a
bbre
viat
ions
of
the
min
eral
pha
ses
and
thei
r ch
emic
al f
orm
ula
are
list
ed in
Tab
le D
R4.
Eva
pori
te
type
#
KC
l
KC
l
MgS
O4
MgS
O4
KC
l K
Cl
MgS
O4
MgS
O4
KC
l
KC
l
MgS
O4
MgS
O4
KC
l K
Cl
MgS
O4
MgS
O4
Eva
pori
te
type
#
MgS
O4
MgS
O4
MgS
O4
KC
l
KC
l
KC
l
Sea
type
*
CaC
l 2
CaC
l 2
MgS
O4
MgS
O4
CaC
l 2
CaC
l 2
MgS
O4
MgS
O4
CaC
l 2
CaC
l 2
MgS
O4
MgS
O4
CaC
l 2
CaC
l 2
MgS
O4
MgS
O4
Sea
type
*
MgS
O4
MgS
O4
MgS
O4
CaC
l2
CaC
l2
CaC
l2
Com
posi
tion
of
the
fina
l inv
aria
nt s
olut
ions
(m
ol/k
g)
DIC
9.81
E-0
5
9.81
E-0
5
0.36
7
0.00
715
9.81
E-0
5 9.
81E
-05
0.36
7 0.
367
9.81
E-0
5
9.81
E-0
5
0.36
7 1.
978
0.00
0233
0.
0002
33
2.80
2
2.80
2
Com
posi
tion
of
the
fina
l inv
aria
nt s
olut
ions
(m
ol/k
g)
DIC
2.8
2.8
2.8
0.00
0233
0.00
0233
0.00
0178
K
0.31
2
0.31
2
0.49
2
2.01
1
0.31
2 0.
312
0.49
2 0.
492
0.31
2
0.31
2
0.49
2 0.
174
0.02
21
0.02
21
0.01
84
0.01
84
K
0.01
84
0.01
84
0.01
84
0.02
21
0.02
21
0.03
06
Cl
15.1
15.1
8.93
6.87
15.1
15
.1
8.93
8.
93
15.1
15.1
8.93
9.
4
15.6
15
.6
11.7
11.7
Cl
11.7
11
.7
11.7
15.6
15.6
16
Na
0.03
1
0.03
1
0.46
4.9
0.03
1 0.
031
0.46
0.
46
0.03
1
0.03
1
0.46
0.
253
0.01
9 0.
019
0.07
44
0.07
44
Na
0.07
44
0.07
44
0.07
44
0.01
9
0.01
9
0.01
64
SO4
1.19
E-0
5
1.19
E-0
5
0.15
4
0.33
1.19
E-0
5 1.
19E
-05
0.15
4 0.
154
1.19
E-0
5
1.19
E-0
5
0.15
4 0.
319
3.94
E-0
6 3.
94E
-06
0.04
67
0.04
67
SO
4
0.04
67
0.04
67
0.04
67
3.94
E-0
6
3.94
E-0
6
3.72
E-0
6
Mg
0.55
1
0.55
1
4.52
0.30
5
0.55
1 0.
551
4.52
4.
52
0.55
1
0.55
1
4.52
6.
81
2.54
2.
54
8.72
8.72
Mg
8.72
8.
72
8.72
2.54
2.54
2.06
Ca
6.84
6.84
0.00
268
0.00
817
6.84
6.
84
0.00
268
0.00
268
6.84
6.84
0.00
268
0.00
0784
5.22
5.
22
0.00
113
0.00
113
Ca
0.00
113
0.00
113
0.00
113
5.22
5.22
5.9
Sta
rtin
g co
mpo
sitio
n of
mod
eled
sol
utio
ns (
mM
)
DIC
2.47
2.47
2.47
2.47
2.46
2.
46
2.46
2.
46
2.45
2.45
2.45
2.
45
2.43
2.
43
2.43
2.43
Sta
rtin
g co
mpo
sitio
n of
mod
eled
sol
utio
ns (
mM
)
DIC
2.37
2.
37
2.36
2.36
2.35
2.18
K
10.4
10.4
10.4
10.4
10.4
10
.4
10.4
10
.4
10.4
10.4
10.4
10
.4
10.4
10
.4
10.4
10.4
K
10.4
10
.4
10.4
10.4
10.4
10.4
Cl
558
558
558
558
558
558
558
558
558
558
558
558
558
558
558
558 Cl
558
558
558
558
558
558
Na
535
541
545
555
529
535
539
549
519
525
529
539
499
505
509
519
Na
478
473
465
462
455
448
SO4
5 8 10
15
5 8 10
15
5 8 10
15
5 8 10
15
SO
4
28.9
25
.3
19.6
17.9
13
8
Mg 2 2 2 2 5 5 5 5 10
10
10
10
20
20
20
20
Mg
54.3
50
43
41
35
29
Ca
10.5
10.5
10.5
10.5
10.5
10
.5
10.5
10
.5
10.5
10.5
10.5
10
.5
10.5
10
.5
10.5
10.5
Ca
10.5
13
.8
19.2
20.8
25.4
29.9
Sim
ulat
ion
run
1 2 3 4 5 6 7 8 9 10
11
12
13
14
15
16
Sim
ulat
ion
run
17
18
19
20
21
22

Table DR3. The first 77 lines of one input file for the PHREEQC evaporation calculations; additional lines were added to continuously removing water from the solutions saved in the previous part from the model. phases Tachyhydrite CaMg2Cl6:12H2O = Ca+2 + 2Mg+2 + 6Cl- + 12H2O log_k 17.1439 Antarcticite CaCl2:6H2O = Ca+2 + 2Cl- + 6H2O log_k 4.0933 selected_output -water true -distance false -time false -file Z:\Min-Gro\experiments\constant addition\PHREEQC-evaporation\m2-15.xls -totals S(6) Ca Mg K Na Cl C(4) -equilibrium_phases halite sylvite antarcticite bischofite tachyhydrite carnallite gypsum anhydrite epsomite hexahydrite kieserite polyhalite glauberite calcite -saturation_indices halite sylvite antarcticite bischofite tachyhydrite carnallite gypsum anhydrite epsomite hexahydrite kieserite polyhalite glauberite calcite solution 1 -pH 7 -Temp 21 -water 1 reaction 1 MgCl2 2.0 Na2SO4 15.0 NaCl 522.6 CaCl2 10.5 KCl 10.4 NaHCO3 2 Na2CO3 0.3 0.001 equilibrium_phases 1 halite 0 0 sylvite 0 0 antarcticite 0 0 bischofite 0 0 tachyhydrite 0 0 carnallite 0 0 gypsum 0 0 anhydrite 0 0 epsomite 0 0 hexahydrite 0 0 kieserite 0 0 polyhalite 0 0 glauberite 0 0 calcite 1 0 CO2(g) -3.412 10000 save solution 1 save equilibrium_phases 1 end solution 2 save solution 2 end mix 1 1 1 2 -0.1 use equilibrium_phases 1 save solution 1 save equilibrium_phases 1 end mix 2 1 1 2 -0.09 use equilibrium_phases 1 save solution 1 save equilibrium_phases 1 end mix 3 1 1 2 -0.0405 use equilibrium_phases 1 save solution 1 save equilibrium_phases 1 end

Table DR4. List with possible evaporite minerals, their abbreviation as used in Table DR1 and DR2 and their chemical formula. Mineral Abbreviation Chemical formula calcite Cc CaCO3 gypsum G CaSO4•2H2O anhydrite A CaSO4 halite H NaCl sylvite Syl KCl carnallite Car KMgCl3•6H2O antarcticite Ant CaCl2•6H2O tachyhydrite Tac CaMg2Cl6•12H2O bischofite Bi MgCl2•6H2O glauberite Gl Na2Ca(SO4)2 polyhalite Pol K2Ca2Mg(SO4)4•2H2O epsomite E MgSO4•7H2O hexahydrite Hx MgSO4•6H2O kieserite Ki MgSO4•H2O
Figure DR1. The evolution of the solution from simulation runs 1-4; 2mM Mg and a. 15mM SO4, b. 10mM SO4, c. 8mM SO4 and d. 5mM SO4 (table DR1).

Figure DR2. The evolution of the solution from simulation runs 2-8; 5mM Mg and a. 15mM SO4, b. 10mM SO4, c. 8mM SO4 and d. 5mM SO4 (table DR1).

Figure DR3. The evolution of the solution from simulation runs 9-12; 10mM Mg and a. 15mM SO4, b. 10mM SO4, c. 8mM SO4 and d. 5mM SO4 (table DR1).

Figure DR4. The evolution of the solution from simulation runs 13-16; 20mM Mg and a. 15mM SO4, b. 10mM SO4, c. 8mM SO4 and d. 5mM SO4 (table DR1).

Figure DR5. The evaporite sequence from simulation runs 1-4; 2mM Mg and a. 15mM SO4, b. 10mM SO4, c. 8mM SO4 and d. 5mM SO4 (table DR1); note that the color coding for the mineral phases is not the same in each graph it is dependent on the evaporite sequence.
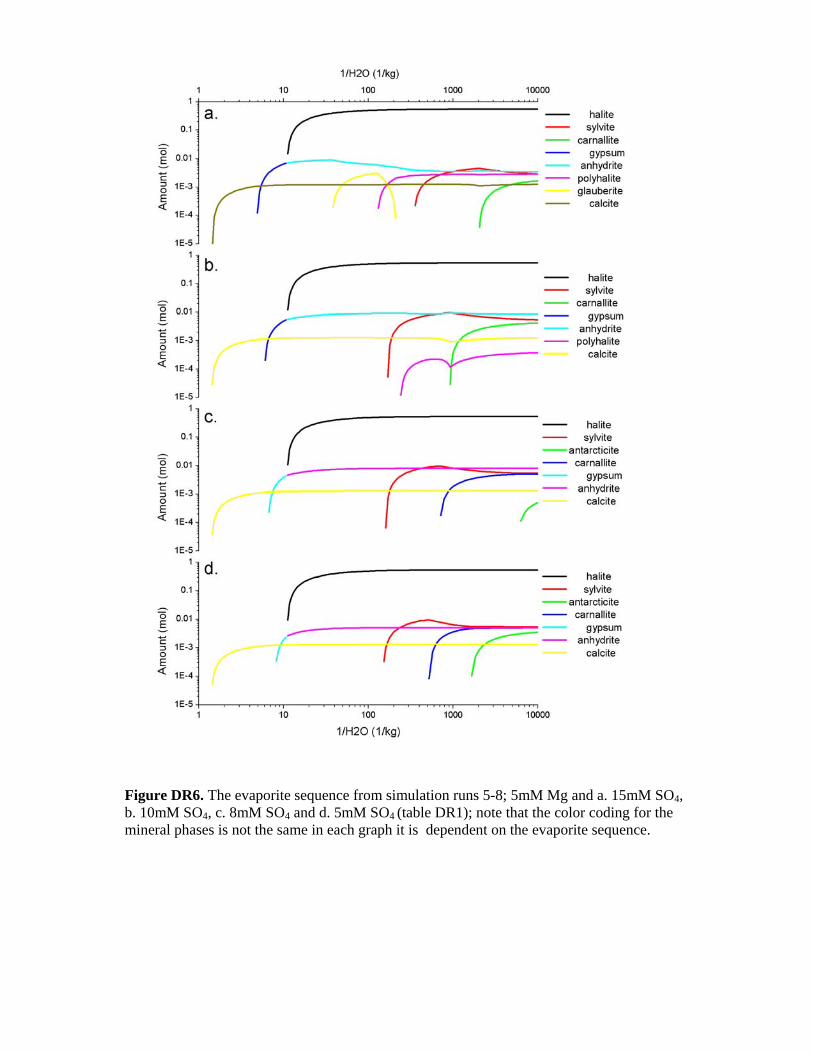
Figure DR6. The evaporite sequence from simulation runs 5-8; 5mM Mg and a. 15mM SO4, b. 10mM SO4, c. 8mM SO4 and d. 5mM SO4 (table DR1); note that the color coding for the mineral phases is not the same in each graph it is dependent on the evaporite sequence.
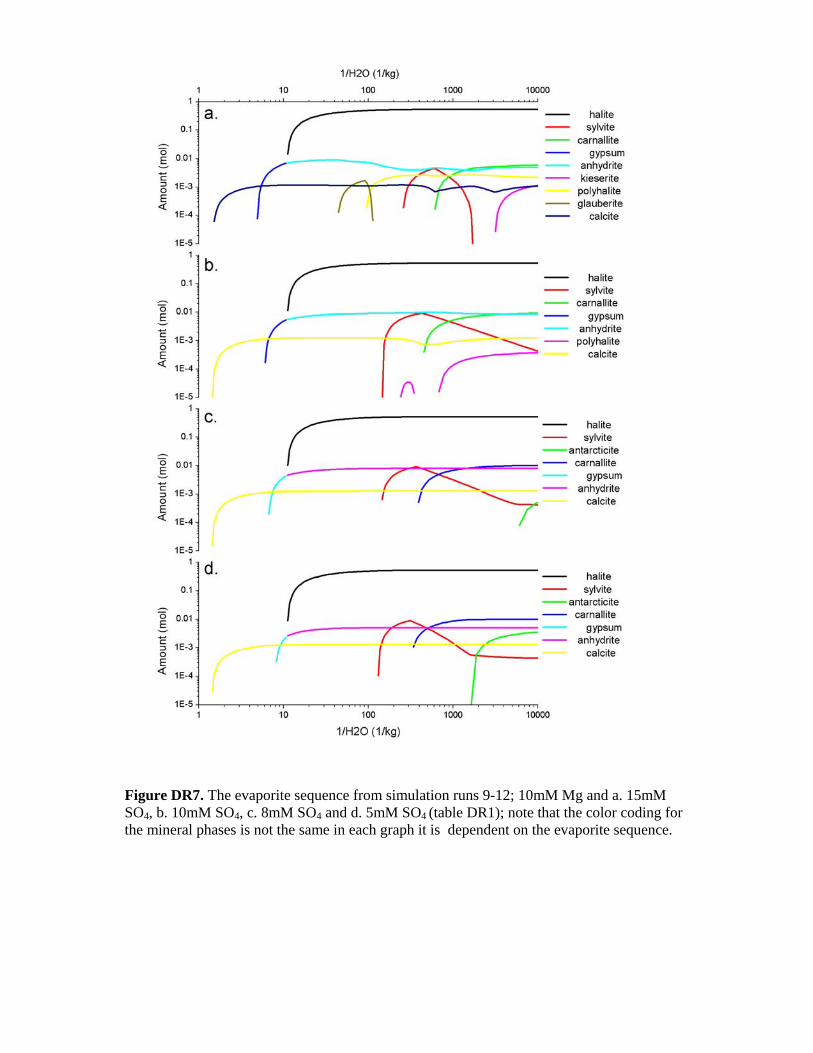
Figure DR7. The evaporite sequence from simulation runs 9-12; 10mM Mg and a. 15mM SO4, b. 10mM SO4, c. 8mM SO4 and d. 5mM SO4 (table DR1); note that the color coding for the mineral phases is not the same in each graph it is dependent on the evaporite sequence.

Figure DR8. The evaporite sequence from simulation runs 13-16; 20mM Mg and a. 15mM SO4, b. 10mM SO4, c. 8mM SO4 and d. 5mM SO4 (table DR1); note that the color coding for the mineral phases is not the same in each graph it is dependent on the evaporite sequence.
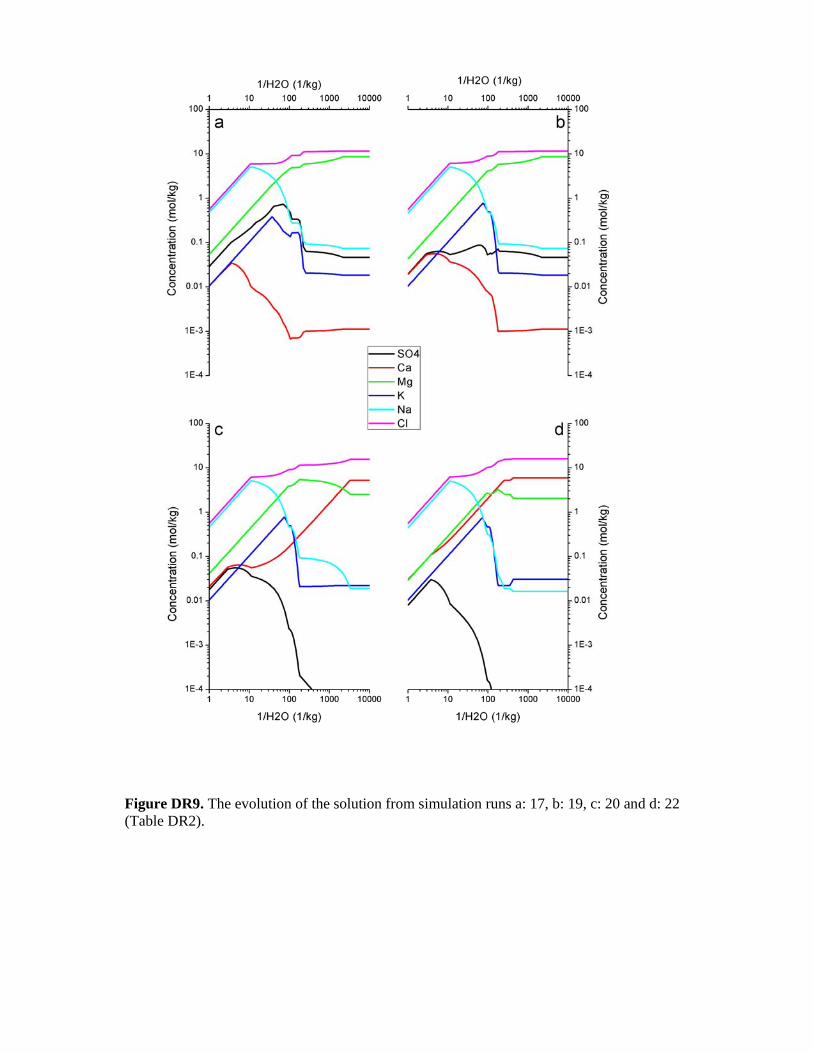
Figure DR9. The evolution of the solution from simulation runs a: 17, b: 19, c: 20 and d: 22 (Table DR2).

Figure DR10. The evaporite sequence from simulation runs a: 17, b: 19, c: 20 and d: 22 (Table DR2); note that the color coding for the mineral phases is not the same in each graph it is dependent on the evaporite sequence.
Validation of the experimental method
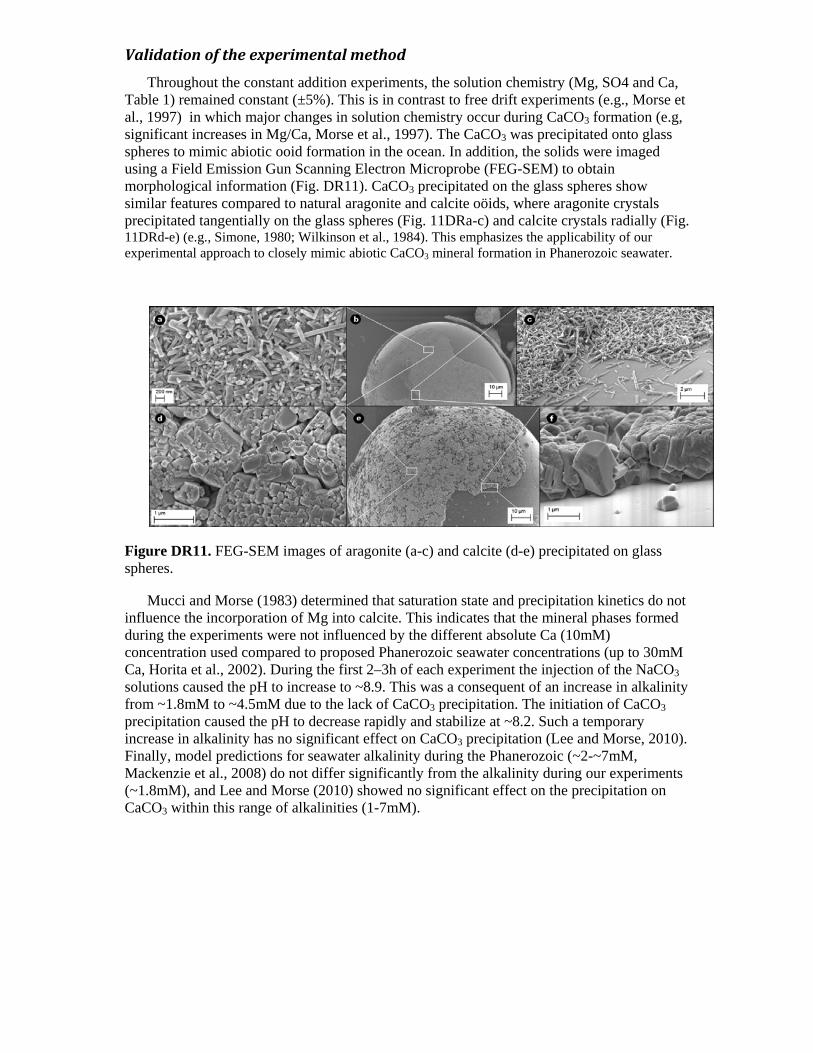
Throughout the constant addition experiments, the solution chemistry (Mg, SO4 and Ca, Table 1) remained constant (±5%). This is in contrast to free drift experiments (e.g., Morse et al., 1997) in which major changes in solution chemistry occur during CaCO3 formation (e.g, significant increases in Mg/Ca, Morse et al., 1997). The CaCO3 was precipitated onto glass spheres to mimic abiotic ooid formation in the ocean. In addition, the solids were imaged using a Field Emission Gun Scanning Electron Microprobe (FEG-SEM) to obtain morphological information (Fig. DR11). CaCO3 precipitated on the glass spheres show similar features compared to natural aragonite and calcite oöids, where aragonite crystals precipitated tangentially on the glass spheres (Fig. 11DRa-c) and calcite crystals radially (Fig. 11DRd-e) (e.g., Simone, 1980; Wilkinson et al., 1984). This emphasizes the applicability of our experimental approach to closely mimic abiotic CaCO3 mineral formation in Phanerozoic seawater.
Figure DR11. FEG-SEM images of aragonite (a-c) and calcite (d-e) precipitated on glass spheres.
Mucci and Morse (1983) determined that saturation state and precipitation kinetics do not influence the incorporation of Mg into calcite. This indicates that the mineral phases formed during the experiments were not influenced by the different absolute Ca (10mM) concentration used compared to proposed Phanerozoic seawater concentrations (up to 30mM Ca, Horita et al., 2002). During the first 2–3h of each experiment the injection of the NaCO3 solutions caused the pH to increase to ~8.9. This was a consequent of an increase in alkalinity from ~1.8mM to ~4.5mM due to the lack of CaCO3 precipitation. The initiation of CaCO3 precipitation caused the pH to decrease rapidly and stabilize at ~8.2. Such a temporary increase in alkalinity has no significant effect on CaCO3 precipitation (Lee and Morse, 2010). Finally, model predictions for seawater alkalinity during the Phanerozoic (~2-~7mM, Mackenzie et al., 2008) do not differ significantly from the alkalinity during our experiments (~1.8mM), and Lee and Morse (2010) showed no significant effect on the precipitation on CaCO3 within this range of alkalinities (1-7mM).

References
Hardie, L.A., 1996, Secular variation in seawater chemistry: An explanation for the coupled secular variation in the mineralogies of marine limestones and potash evaporites over the past 600 my: Geology, v. 24, p. 279-283.
Horita, J., Zimmermann, H., and Holland, H.D., 2002, Chemical evolution of seawater during the Phanerozoic: Implications from the record of marine evaporites: Geochimica et Cosmochimica Acta, v. 66, p. 3733-3756.
Lee, J., and Morse, J.W., 2010, Influences of alkalinity and pCO2 on CaCO3 nucleation from estimated Cretaceous composition seawater representative of "calcite seas": Geology, v. 38, p. 115-118.
Lowenstein, T.K., Hardie, L.A., Timofeeff, M.N., and Demicco, R.V., 2003, Secular variation in seawater chemistry and the origin of calcium chloride basinal brines: Geology, v. 31, p. 857-860.
Mackenzie, F.T., Arvidson, R.S., and Guidry, M., 2008, Phaerozoic time chemostatic modes of the ocean-atmosphere-sediment system through Phanerozoic time: Mineralogical Magazine, v. 72, p. 333-335.
Morse, J.W., Wang, Q.W., and Tsio, M.Y., 1997, Influences of temperature and Mg:Ca ratio on CaCO3 precipitates from seawater: Geology, v. 25, p. 85-87.
Mucci, A., and Morse, J.W., 1983, The incorporation of Mg2+ and Sr2+ into calcite overgrowths: influences of growth rate and solution composition: Geochimica et Cosmochimica Acta, v. 47, p. 217-233.
Parkhurst, D.L., and Appelo, C.A.J., 1999, User's guide to PHREEQC (version 2) — a computer program for speciation, batch-reaction, one-dimensional transport, and inverse geochemical calculations: Denver, Colorado, U.S. Geological Survey p. 312.
Simone, L., 1980, Ooids: A review: Earth-Science Reviews, v. 16, p. 319-355. Walter, L.M., 1986, Relative Efficiency of Carbonate Dissolution and Precipitation During
Diagenesis: A Progress Report on the Role of Solution Chemistry, in Gautier, D.L., ed., Roles of Organic Matter in Sediment Diagenesis, Volume 38, Society of Economic Paleontologists and Mineralogists Special Publication p. 1-11.
Wilkinson, B.H., Buczynski, C., and Owen, R.M., 1984, Chemical control of carbonate phases; implications from Upper Pennsylvanian calcite-aragonite ooids of southeastern Kansas: Journal of Sedimentary Research, v. 54, p. 932-947.