gse is a maternal factor involved in active dna ... · gse is a maternal factor involved in active...
TRANSCRIPT
GSE Is a Maternal Factor Involved in Active DNADemethylation in ZygotesYuki Hatanaka1, Natsumi Shimizu1, Satoshi Nishikawa1, Mikiko Tokoro1¤a, Seung-Wook Shin1¤b,
Takuji Nishihara1, Tomoko Amano1, Masayuki Anzai2, Hiromi Kato2, Tasuku Mitani2, Yoshihiko Hosoi1,
Satoshi Kishigami1, Kazuya Matsumoto1*
1 Division of Biological Science, Kinki University Graduate School of Biology-Oriented Science and Technology, Kinokawa, Wakayama, Japan, 2 Institute of Advanced
Technology, Kinki University, Kainan, Wakayama, Japan
Abstract
After fertilization, the sperm and oocyte genomes undergo extensive epigenetic reprogramming to form a totipotentzygote. The dynamic epigenetic changes during early embryo development primarily involve DNA methylation anddemethylation. We have previously identified Gse (gonad-specific expression gene) to be expressed specifically in germcells and early embryos. Its encoded protein GSE is predominantly localized in the nuclei of cells from the zygote toblastocyst stages, suggesting possible roles in the epigenetic changes occurring during early embryo development.Here, we report the involvement of GSE in epigenetic reprogramming of the paternal genome during mouse zygotedevelopment. Preferential binding of GSE to the paternal chromatin was observed from pronuclear stage 2 (PN2)onward. A knockdown of GSE by antisense RNA in oocytes produced no apparent effect on the first and second cellcycles in preimplantation embryos, but caused a significant reduction in the loss of 5-methylcytosine (5 mC) and theaccumulation of 5-hydroxymethylcytosine (5 hmC) in the paternal pronucleus. Furthermore, DNA methylation levels inCpG sites of LINE1 transposable elements, Lemd1, Nanog and the upstream regulatory region of the Oct4 (also knownas Pou5f1) gene were clearly increased in GSE-knockdown zygotes at mid-pronuclear stages (PN3-4), but the imprintedH19-differential methylated region was not affected. Importantly, DNA immunoprecipitation of 5 mC and 5 hmC alsoindicates that knockdown of GSE in zygotes resulted in a significant reduction of the conversion of 5 mC to 5 hmC onLINE1. Therefore, our results suggest an important role of maternal GSE for mediating active DNA demethylation in thezygote.
Citation: Hatanaka Y, Shimizu N, Nishikawa S, Tokoro M, Shin S-W, et al. (2013) GSE Is a Maternal Factor Involved in Active DNA Demethylation in Zygotes. PLoSONE 8(4): e60205. doi:10.1371/journal.pone.0060205
Editor: Wendy Dean, The Babraham Institute, United Kingdom
Received October 18, 2012; Accepted February 21, 2013; Published April 1, 2013
Copyright: � 2013 HATANAKA et al. This is an open-access article distributed under the terms of the Creative Commons Attribution License, which permitsunrestricted use, distribution, and reproduction in any medium, provided the original author and source are credited.
Funding: This study was supported in part by a Grant-in-Aid for the 21st Century COE Program of the Japan MEXT to MT SWS SN, a Grant-in-Aid for ScientificResearch from the Japan Society for the Promotion of Science 23658292 and 23380164 to KM, and a grant from the INAMORI Foundation to KM. The funders hadno role in study design, data collection and analysis, decision to publish, or preparation of the manuscript.
Competing Interests: The authors have declared that no competing interests exist.
* E-mail: [email protected]
¤a Current address: The Asada Institute for Reproductive Medicin, Asada Ladies Clinic, Kasugai, Aichi, Japan¤b Current address: Laboratory of Cellular and Developmental Biology, NIDDK, National Institutes of Health, Bethesda, Maryland, United States of America
Introduction
Resetting and modification of epigenetic marks as a part of
epigenetic reprogramming occur in the genomes of early embryos
and primordial germ cells (PGCs) [1–5]. The genome-wide
reprogramming of DNA methylation/demethylation and histone
modification works in concert to establish each cell lineage during
embryogenesis. Unraveling the mechanism of epigenetic repro-
gramming will provide important information on the character-
ization of germ cells, comprising totipotent and unipotent cells
possessing an underlying genomic plasticity [6,7].
Both sperm and oocyte genomes undergo epigenetic repro-
gramming under the control of maternal factors immediately after
fertilization. The rapid reduction of 5-methylcytosine (5 mC)
content in the paternal genome before first DNA replication is the
reset of epigenetic memory, classified as active DNA demethyla-
tion [1,3,8]. This DNA demethylation of the paternal genome is
linked to global conversion of 5 mC to 5-hydroxymethylcytosine
(5 hmC) catalyzed by the maternally encoded enzyme Tet
methylcytosine dioxygenase 3 (Tet3), which is intensely expressed
in oocytes and zygotes [9–11]. By contrast, the maternal genome is
protected from the fast genome-wide DNA demethylation at the
zygote stage and is slowly demethylated in a passive (replication-
dependent) manner [12]. Maternal factor PGC7/Dppa3/Stella
protein is also required for protecting the conversion from 5 mC to
5 hmC by strongly associating with maternal chromatin regions
marked with dimethylated histone H3 lysine 9 (H3K9me2)
[10,11]. Interestingly, the PGC7/Dppa3/Stella protein is suggest-
ed to inhibit recruitment of Tet3 to the chromatin of the maternal
pronucleus by altering chromatin configuration [12,13]. However,
the mechanisms underlying DNA demethylation in early embryo-
genesis are not well understood [14].
We have previously identified Gse (gonad-specific expression
gene) as expressed specifically in the germ cells of adult ovaries and
testes, although it has not yet been characterized functionally [15].
The GSE protein shows a distinctive subcellular localization
PLOS ONE | www.plosone.org 1 April 2013 | Volume 8 | Issue 4 | e60205
pattern in oocytes and early embryos. After fertilization, GSE,
which diffuses into the cytoplasm of MII oocytes, clearly
accumulates in both pronuclei. A predominant localization of
GSE in the nucleus is observed throughout the subsequent
cleavage stages. At the blastocyst stage, a strong signal of GSE is
observed in the nuclei of the inner cell mass cells, whereas only a
very weak signal is detected in the trophectoderm cells. This
appears to correlate with the site of action of GSE and led us to
investigate the possible role of GSE in DNA demethylation in
early mouse embryos.
In this study, we identified a strong association of GSE with
nucleosome architecture in the paternal pronucleus of the zygote
and related this to a dramatic loss of 5 mC and an accompanying
conversion of 5 mC to 5 hmC. We also confirmed the presence of
GSE-mediated DNA demethylation by bisulphite sequencing and
the conversion of 5 mC to 5 hmC by methylated and hydro-
xymethylated DNA immunoprecipitation (MeDIP and hMeDIP).
These results suggest an important function of GSE in active DNA
demethylation during zygote development.
Materials and Methods
AnimalsAll mice (ICR strain) were purchased from Kiwa Experimental
Animals (Wakayama, Japan) and maintained in light-controlled,
air-conditioned rooms. This study was carried out in strict
accordance with the recommendations in the Guidelines of Kinki
University for the Care and Use of Laboratory Animals. The
protocol was approved by the Committee on the Ethics of Animal
experiments of Kinki University (Permit Number: KABT-19-003).
All mice were killed by cervical dislocation, and all efforts were
made to minimize suffering and to reduce the number of animals
used in the present study.
Collection of Oocytes, in vitro Fertilization and EmbryoCulture
Collection of spermatozoa, oocytes and fertilized embryos was
performed as described [15]. In brief, spermatozoa were collected
from the cauda epididymidis of male mice. The sperm suspension
was incubated in HTF medium for 1.5 h to allow for capacitation
at 37uC under 5% CO2 in air. Oocytes were collected from the
excised oviducts of female mice (2–3 months old) that had been
superovulated with pregnant mare serum gonadotropin (PMSG;
Serotropin, Teikoku Zoki, Tokyo, Japan) followed 48 h later with
human chorionic gonadotropin (hCG; Puberogen, Sankyo, Tokyo,
Japan). Cumulus-oocyte complexes were recovered into pre-
equilibrated HTF medium. The sperm suspension was added to
the oocyte cultures, and morphologically normal fertilized oocytes
were collected 2 h after insemination. The fertilized embryos were
cultured in KSOM medium [16] at 37uC under 5% CO2 in air.
Western Blot AnalysisThe procedures were essentially performed as described [15,17–
19]. In brief, the samples (30 cells of each embryonic stage) were
subjected to sodium dodecyl sulfate (SDS) polyacrylamide gel
electrophoresis. The proteins were resolved in 15% running gels
and electrophoretically transferred to polyvinylidene difluoride
(PVDF) membranes (GE Healthcare, Little Chalfont, UK). The
membranes were incubated in Block Ace (Dainippon-Pharm,
Osaka, Japan) at room temperature (RT) for 1 h. They were
washed with phosphate-buffered saline containing 0.2% Tween 20
(PBST) and incubated at 4uC overnight with anti-GSE antiserum
(1:2,000), and with anti-actin antibody (Santa Cruz Biotechnology,
Heidelberg, Germany; sc-1616) as a loading control. The
membranes were washed in PBST, incubated with donkey anti-
rabbit IgG-horseradish peroxidase (HRP) conjugate (1:50,000;
Millipore Corp., Billerica, MA, USA; AP182P) and donkey anti-
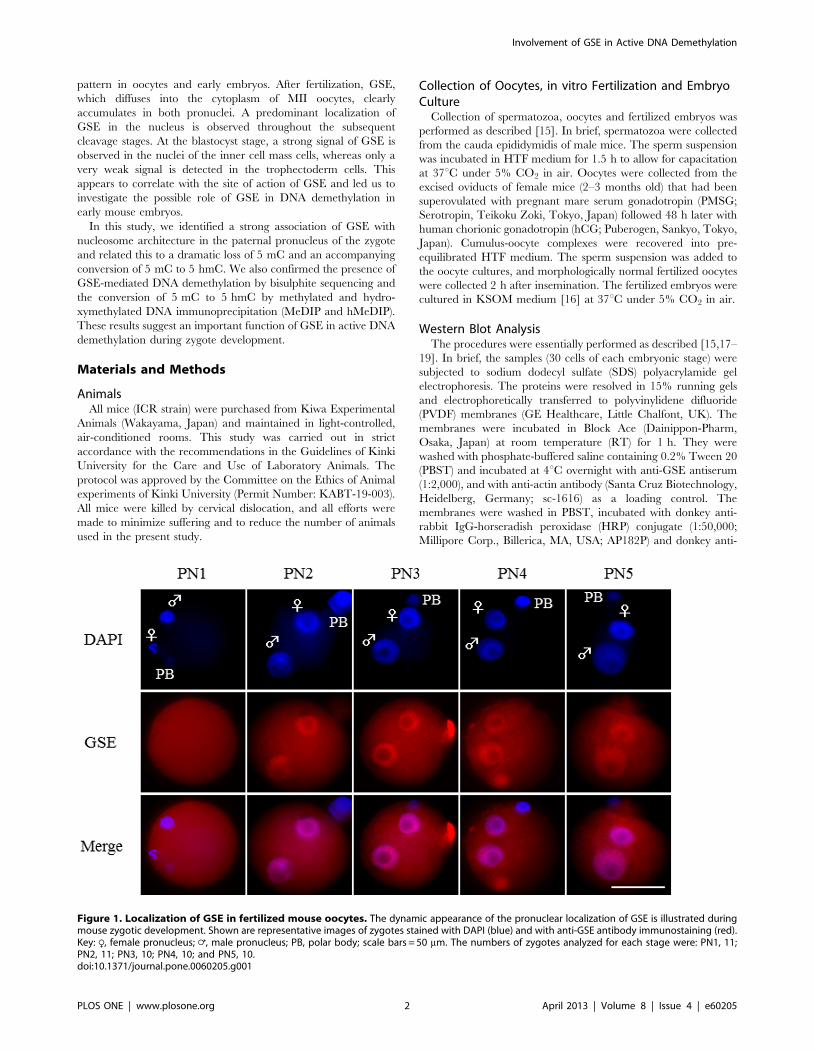
Figure 1. Localization of GSE in fertilized mouse oocytes. The dynamic appearance of the pronuclear localization of GSE is illustrated duringmouse zygotic development. Shown are representative images of zygotes stained with DAPI (blue) and with anti-GSE antibody immunostaining (red).Key: R, female pronucleus; =, male pronucleus; PB, polar body; scale bars = 50 mm. The numbers of zygotes analyzed for each stage were: PN1, 11;PN2, 11; PN3, 10; PN4, 10; and PN5, 10.doi:10.1371/journal.pone.0060205.g001
Involvement of GSE in Active DNA Demethylation
PLOS ONE | www.plosone.org 2 April 2013 | Volume 8 | Issue 4 | e60205

Involvement of GSE in Active DNA Demethylation
PLOS ONE | www.plosone.org 3 April 2013 | Volume 8 | Issue 4 | e60205

goat IgG HRP conjugate (1:50,000; Millipore Corp.; AP180P) at
RT for 1 h, washed with PBST and developed using ECL Prime
Western Blotting detection reagent (GE Healthcare).
Immunocytochemistry and MicroscopyThe classification of pronuclear stages (PN) stages was
performed according to previous study [8,11], where the
pronuclear morphology and hours post-insemination was taken
into consideration. Subcellular localizations of GSE, H3, 5 mC
and 5 hmC were determined by immunocytochemical analysis of
oocytes and early embryos, as described [20]. Embryos were fixed
in 4% paraformaldehyde (PFA; Nacalai Tesque, Kyoto, Japan) in
phosphate-buffered saline (PBS) at RT for 10 min, and the fixed
samples were then incubated in PBS containing 0.1–0.2% Triton
X-100 (Nacalai Tesque) at RT for 1 h. For 5 mC and 5 hmC, the
specimens were incubated in 4 N HCl at RT for 30 min and then
incubated in 0.1 M EDTA at RT for 30 min. They were then
incubated with anti-GSE antiserum (final dilution, 1:2000), anti-
H3 antibody (final dilution, 1:1000; MAB, Sapporo, Hokkaido,
Japan; MA301B), anti-5 mC antibody (final dilution, 1:2000;
Calbiochem, Darmstadt, Germany; NA81) or anti-5 hmC anti-
body (final dilution, 1:2000; Active Motif, Carlsbad, CA, USA;
39769) in PBS containing 30 mg/ml bovine serum albumin at 4uCovernight (Table S1). After incubation, the cells were reacted with
an Alexa Fluor 594-labeled donkey anti-rabbit IgG secondary
antibody for anti-GSE and 5 hmC (final dilution, 1:4000;
Invitrogen, Carlsbad, CA, USA; A-21207), with an Alexa Fluor
488-labeled donkey anti-mouse IgG secondary antibody (final
dilution, 1:4000; Invitrogen; A21202) for anti-H3, and with an
Alexa Fluor 350-labeled goat anti-mouse IgG secondary antibody
(final dilution, 1:4000; Invitrogen; A-11045) for 5 mC, all at RT
for 1 h. Specimens were mounted on glass slides in Vectashield
mounting medium (Vector Laboratories, Burlingame, CA, USA)
containing 2–5 mg/ml DAPI (Invitrogen; D1306) (Table S1).
Finally, the slides were imaged using an Olympus BX51
microscope (OLYMPUS, Tokyo, Japan) equipped with an
Olympus DP 70 digital camera (OLYMPUS). ImageJ software
(NIH, Bethesda, MD, USA; http://rsbweb.nih.gov/ij/) was used
to quantify DAPI staining and antibody signals in the center
section of each pronucleus. At least two or three independent
experiments were performed.
Triton Treatment of Zygotes before PFA FixationTriton treatment of zygotes was performed as described [13].
Zygotes were treated with 0.2% Triton X-100 in PBS for 30 s.
They were then washed with PBS three times and then fixed in
4% PFA. After washing with PBS, immunostaining was performed
as described above.
CoimmunoprecipitationCoimmunoprecipitation was performed as described [21]. We
used antibodies against GSE, H3 (1 mg; MAB; MA301B) and H4
(2 mg, Santa Cruz Biotechnology Inc., Santa Cruz, CA, USA; sc-
10810). For immunoblot analysis, we used a donkey anti-rabbit
IgG–HRP conjugate (1:50,000; Millipore Corp.; AP182P) for anti-
GSE and anti-H4, and a donkey anti-mouse IgG HRP conjugate
(1:50,000; Millipore Corp.; AP192P) for anti-H3, as secondary
antibodies (Table S1).
Recombinant Protein Expression and PurificationGSE cDNA was cloned into the pIRES2-EGFP (Clontech, Palo
Alto, CA, USA) vector containing an N-terminal His tag. The His-
tagged GSE expression vector was transfected into HEK293 cells
using Lipofectamine 2000 Reagent (Invitrogen). The protein
solution was extracted from the HEK293 cell with 0.3% NP40
containing 150 mM NaCl and 20 mM Tris-HCl. The recombi-
nant protein was purified with a 100 mM phosphate buffer
containing 500 mM NaCl using TALON Metal Affinity Resin
(Clontech) and eluted by His TALON Gravity Column (Clon-
tech).
In vitro Binding Assay of Recombinant His-tagged GSE toH3 or H4 Peptides
N-terminal (residues 1–100) of human H3 or H4 peptides
(Abcam, Cambridge, UK) and His-tagged GSE protein were
incubated with Dynabeads Protein G (Invitrogen) in a binding
buffer containing 0.3% NP40, 150 mM NaCl and 20 mM Tris-
HCl at 4uC for 1 h with rotation. Coimmunoprecipitation was
performed as described above. Three independent experiments
were performed.
In vitro mRNA SynthesisGSE antisense RNA and enhanced green fluorescence protein
(EGFP) mRNA amplification was performed using Ampliscribe
T7 Transcription kits (Epicentre Technologies, Madison, WI,
USA) from pcDNA3.1/antisense GSE and pcDNA3.1/EGFP
vectors. For efficient translation of the proteins in oocytes or
embryos, the 59 end of each RNA was capped using RNA Cap
Analog kits (Epicentre Technologies), according to the manufac-
turer’s protocol.
Comicroinjection of GSE Antisense RNA and EGFP mRNAM II oocytes coinjected with GSE antisense RNA and EGFP
RNA for knockdown were cultured in KSOM medium, selected
by detection of EGFP fluorescence and then cultured until use, as
described [17,22]. To determine the knockdown efficiency,
proteins isolated from 30 EGFP-positive oocytes were used for
immunoblotting. The EGFP-positive oocytes were also used for
in vitro fertilization (IVF) after laser perforation of the zona
pellucida as shown as below.
Laser Perforation of the Zona PellucidaThe MII oocytes injected with the RNAs (above) were
perforated using laser equipment (XYClone, Nikko Hansen Co.,
Ltd, Osaka, Japan). Laser perforation was performed as described
Figure 2. Preferential binding of GSE to the paternal chromatin. (A) Brief scheme of two pretreatment procedures beforeimmunocytochemical staining: pretreatment with Triton X-100 before PFA fixation (TP condition) versus conventional PFA fixation (PT condition).(B) Immunocytochemical analysis of GSE (red) in zygotes at PN2 and PN3 after pretreatment under the PT or TP conditions. Histone H3 is shown ingreen as a control for chromatin-bound factors under the TP condition. Numbers of zygotes analyzed for each group were: PN2 (PT condition), 20;PN2 (TP condition), 25; PN3 (PT condition), 20; PN3 (TP condition), 30. DNA was stained with DAPI (blue). Key: R, female pronucleus; =, malepronucleus; PB, polar body; scale bars = 50 mm. (C) Immunocytochemical analysis of GSE in parthenogenetic embryos after pretreatment under the PTor TP conditions. H3 is shown in green as a control for chromatin-bound factor under the TP condition. Numbers of zygotes analyzed for each group:PT condition, 15; TP condition, 15. DNA was stained with DAPI (blue). Key: R, female pronucleus; PB, polar body; scale bars = 50 mm. (D)Immunoprecipitation with an anti-GSE antibody followed by immunoblotting using anti-H3 or -H4 antibodies in zygotes at PN2 and PN3. Normalrabbit IgG was used as a negative control. Arrows indicate each respective band. Three independent experiments were performed.doi:10.1371/journal.pone.0060205.g002
Involvement of GSE in Active DNA Demethylation
PLOS ONE | www.plosone.org 4 April 2013 | Volume 8 | Issue 4 | e60205

Figure 3. Maternal GSE-knockdown (GSE-KD) zygotes obtained from antisense RNA injection and in vitro fertilization (IVF). (A)Scheme of the experimental procedures. In immunocytochemistory, bisulphite sequencing, and MeDIP and hMeDIP (methylated andhydroxymethylated DNA immunoprecipitation) analyses, EGFP RNA-uninjected MII oocytes, incubated under similar conditions, were used as
Involvement of GSE in Active DNA Demethylation
PLOS ONE | www.plosone.org 5 April 2013 | Volume 8 | Issue 4 | e60205

previously [23]. In brief, the laser was applied to the point on the
zona pellucida that showed the widest perivitelline space, and a
hole (6 mm) was perforated in each (wave length 1,480 nm; output
300 mW; pulse width 120 ms).
Densitometric Quantification AnalysisDensitometric quantification analysis of the immunoblot bands
was performed using a Molecular Imager FX with Quantity One
software (BioRad, Hercules, CA, USA).
Quantitative Real-time RT-PCR AnalysesQuantitative RT-PCR analyses were performed as described
[24]. Total RNA was isolated from 30 pooled oocytes or embryos
by using RNAqueous micro kits (Ambion, Austin, TX, USA). In
brief, cDNA was synthesized from total RNA using High Capacity
cDNA Reverse Transcription kits (Applied Biosystems, Foster
City, CA, USA). Prepared cDNA samples were amplified and
analyzed by quantitative RT-PCR. The primers used are
described in Table S2. Amplifications were run in a 7300 ABI
Prism Sequence Detector (Applied Biosystems).
Bisulphite Genomic SequencingGenomic DNA from 60 pooled embryos was extracted by using
EZ DNA Methylation-Direct kits (Zymo Research Corp., Irvine,
CA, USA) according to the manufacturer’s instructions and our
previous report [25]. In brief, the samples made up to 20 ml were
treated with 26M-digestion buffer and proteinase K at 50uC for
20 min. The reaction samples were incubated with 130 ml of CT
conversion reagent solution at 98uC for 8 min and at 64uC for
3.5 h. After incubation, bisulphite-modified samples were trans-
ferred directly to Zymo-Spin IC columns pre-loaded with 600 ml
M-binding buffer and inverted several times. Columns were
centrifuged at 10,0006g for 30 s, the flow-through was discarded
and the column was washed with 100 ml M-wash buffer and
centrifuged at 10,0006g for 30 s; 200 ml M-desulphonation buffer
was added to the column and allowed to stand at RT for 25 min.
The column was washed with 200 ml M-wash buffer and
centrifuged at 10,0006g for 30 s twice. Genomic DNA was eluted
with 10 ml M-elution buffer by centrifuging at 10,0006g for
30 min. PCR reactions were performed using TaKaRa Taq
Polymerase Hot Start Version DNA (TaKaRa Bio Inc., Shiga,
Japan). The specific primers are shown in Table S2 and were
based on previous reports [9,26]. Sequence analysis of the PCR
product was performed after ligating the amplicon into the
plasmid vector, pGEM-T Easy (Promega), and cloning. Three
independent experiments were performed.
DNA Immunoprecipitation with Anti-5 mC and Anti-5 hmC Antibodies
The procedures were essentially performed according to a
previous report [9]. In brief, in order to extract the DNA, samples
were incubated in a proteinase K (Roche, CH-4070, Basel,
Switzerland) solution including 16SSC, proteinase K (50 ng) and
10% SDS for 1 h at 37uC. Each sample was incubated with RNase
for 1 h at 37uC to remove total RNA. The samples were purified
by phenol-chloroform treatment and ethanol precipitation with
glycogen. The samples were fragmented by AluI digestion for
overnight at 37uC and purified by phenol-chloroform treatment
and ethanol precipitation with glycogen. After being heat-
denatured for 10 min at 95uC, the immunoprecipitation of
prepared DNA samples was performed as described above using
1mg of anti-5 mC or anti-5 hmC antibodies and 10 ml Dynabeads.
Quantitative RT-PCR analyses were performed as described
above. The primers used in this study are described in Table S2.
Three independent experiments were performed.
Statistical AnalysisFor statistical analysis, we used StatView version 5.0 (SAS
Institute, Cary, NC, USA) and Microsoft Excel and performed
analysis of variance (ANOVA) with an a level of 0.05 to determine
possible statistically significant differences between group means.
Results
We have shown previously that mouse GSE is expressed
specifically in germ cells and early embryos [15]. Using the Basic
untreated controls. (B) Knockdown of GSE expression by an antisense RNA was confirmed by quantitative RT-PCR analysis. The relative ratios wereobtained by dividing the expression level of the Gse gene by the expression level of the G3PDH gene. More than 90 oocytes from three independentexperiments were analyzed. Shown are statistically significant differences between untreated and GSE-KD oocytes (*p,0.05). Bars represent thestandard error of the mean. (C) Knockdown of GSE protein expression was confirmed by immunoblot analysis of MII oocytes just before IVF or in 2-cell embryos. Ninety oocytes from three independent experiments were analyzed. Actin was used as a loading control. (D) Densitometricquantification of the immunoblot bands of Figure 3C showing statistically significant differences between untreated and GSE-KD oocytes or embryos(*p,0.05). Bars represent the standard error of the mean.doi:10.1371/journal.pone.0060205.g003
Table 1. Effect of GSE knockdown on the development of early mouse embryos.
Injected RNAs No. (%) of oocytes
No. (%) offertilizedoocytes
No. (%) of 2-cellembryosexpressing EGFP No. (%) of embryos developing to:
Injected Survived 4-cell (48 hpi)8-cell(60 hpi)
Morulae(72 hpi)
Blastocysts(96 hpi)
Untreated – – 51 (64)* – 47 (92) 43 (84) 34 (67) 23 (45)
EGFP RNA 170 60 (35) 36 (60) 34 (57) 29 (85) 26 (76) 18 (53) 13 (38)
EGFP RNA+GSE antisenseRNA (GSE-KD)
162 61 (38) 36 (59) 33 (54) 27 (82) 23 (70) 18 (55) 13 (39)
*In the untreated group, M II oocytes were cultured for 8.25 h and fertilized in vitro.Key: EGFP, enhanced green fluorescent protein; hpi, hours postinsemination; GSE-KD, GSE knockdown.doi:10.1371/journal.pone.0060205.t001
Involvement of GSE in Active DNA Demethylation
PLOS ONE | www.plosone.org 6 April 2013 | Volume 8 | Issue 4 | e60205

Involvement of GSE in Active DNA Demethylation
PLOS ONE | www.plosone.org 7 April 2013 | Volume 8 | Issue 4 | e60205

Local Alignment Search Tool (BLAST), GSE proteins in different
species were searched from the GenBank database (http://www.
ncbi.nlm.nih.gov). Alignment of the mouse GSE protein with rat,
human, pig and bovine GSE proteins showed 86, 70, 68 and 60%
identity at the amino acid level over the entire polypeptide,
respectively (Figure S1A). The mouse GSE protein had clear
orthologs in other vertebrates such as Xenopus (38% identity) and
zebrafish (30% identity) and the ascidian Ciona intestinalis (30%
identity) (Figure S1B). Higher conserved amino acid sequences
were not found except for the N-terminal of GSE, although no
domain or motif specific to these amino acids was predicted in the
database. Thus, this analysis showed a conserved role of GSE
among various vertebrate species, including mice and humans.
Next, we examined the expression profile of the GSE protein in
preimplantation mouse embryos by western blot analysis. Consis-
tent with previous immunocytochemical analysis [15], GSE
protein was constitutively expressed in germinal vesicle (GV) stage
and stage 2 meiosis (MII) oocytes and pre-implantation embryos
until blastocyst stage, although the abundance of this protein was
decreased at the blastocyst stage (Figure S1C). In our previous
study, we also showed that the predominant localization of GSE in
the nucleus was observed throughout preimplantation cleavage
stages. To assess the pronuclear localization of GSE in mouse
zygotes, we examined its subcellular localization during PN1–5
[8,11]. In zygotes, the GSE protein showed a unique pronuclear
localization profile, in which its signal was clearly observed from
PN2 onward (Figure 1).
We then examined whether GSE was associated with pronu-
clear chromatin architecture during zygote development. Fertil-
ized oocytes were subjected to immunocytochemical analysis using
the pre-extraction method [13,27], involving pretreatment with
Triton X-100 before PFA fixation (TP condition), in contrast with
the conventional PFA fixation (PT condition) (Figure 2A). This
showed that the localization pattern of GSE in zygotes was clearly
different under the two conditions. Under the TP condition, a
faint signal was visible in only the paternal pronucleus at PN2
(Figure 2B left) and the signal became stronger in the paternal
pronucleus at PN3 (Figure 2B right), indicating that chromatin-
bound GSE was present in the paternal pronucleus and that GSE
in the maternal pronucleus had been eluted by the detergent
(Figure 2B). Interestingly, signals of GSE and PGC7/Dppa3/
Stella proteins, the latter which has already been shown to
dominantly bind to the maternal genome [13], were oppositely
observed in the paternal and maternal pronuclei at PN2 under the
condition of TP, respectively (Figure 2B and S2) although our
observations were not performed on single zygotes. Furthermore,
GSE was not detected in two maternally derived pronuclei in
parthenogenetic embryos at PN2 under the TP condition,
although GSE was detectable in them under the conventional
PT condition (Figure 2C). These results indicated that GSE was
preferentially bound to the paternal rather than the maternal
chromatin. The observation that GSE was able to associate with
chromatin architecture in zygotes was also confirmed in reciprocal
coimmunoprecipitation experiments using anti-GSE and anti-H3
or -H4 antibodies (Figure 2D). We also confirmed by in vitro assay
that recombinant GSE was directly bound to the N-terminal (1–
100 amino acids) of unmodified H3 or H4 peptides (Figure S3).
These results showed that GSE was partially associated with H3 or
H4 in the pronuclei at PN2.
Our finding that GSE was preferentially bound to the paternal
chromatin architecture during zygote development prompted us to
investigate the involvement of GSE in paternal genome demeth-
ylation during epigenetic reprogramming after fertilization. To
clarify the role of GSE during early embryo development, GSE-
knockdown (GSE-KD) zygotes were generated by cytoplasmic
injection of GSE antisense RNA together with EGFP RNA as a
marker of successful injection (Figure 3A and S4). In MII oocytes,
60% and 79% losses of GSE mRNA and proteins in the coinjected
EGFP-expressing oocytes were detected by quantitative RT-PCR
and immunoblot analysis, respectively (Figure 3B, 3C left and 3D
left). At the 2-cell stage, 68% loss of GSE proteins in the EGFP-
positive embryos was detected by immunoblot analysis (Figure 3C
right and 3D right). Most of the EGFP-positive oocytes were
fertilized and developed to blastocysts normally, as well as the
control embryos injected with EGFP RNA alone and showing
EGFP expression (Table 1). This result suggested that the loss of
GSE had no evident effect on at least the first and second cell
cycles of preimplantation mouse embryos.
To uncover the function of GSE in the paternal genome
demethylation during zygote development, GSE-KD zygotes were
subjected to immunocytochemical analysis for 5 mC and 5 hmC
along with untreated control zygotes. In untreated zygotes, the loss
of 5 mC and the appearance of 5 hmC clearly occurred in the
paternal pronucleus from PN2 to PN3 but not in the maternal
pronucleus at PN1–5, consistent with previous reports [1,8,11].
However, compared with untreated zygotes, the dynamic loss of
5 mC signals and the coincident accumulation of 5 hmC signals in
the paternal pronucleus could not be detected in GSE-KD zygotes
at any pronuclear stages (Figures 4A and S5). We could also not
observe any obvious effects of GSE knockdown on 5 mC and
5 hmC signals in the maternal pronucleus. Furthermore, the ratio
(paternal to maternal) of 5 mC intensity in pronuclei was
significantly higher in the GSE-KD zygotes than in untreated
controls (Figure 4B), whereas the level of 5 hmC intensity in the
paternal pronucleus relative to the maternal one was significantly
decreased by knockdown of GSE expression (Figure 4C). Thus,
our findings suggest that maternal GSE is involved in the
molecular mechanisms of the conversion of 5 mC to 5 hmC
during zygote development.
To obtain evidence that GSE knockdown indeed affects DNA
demethylation, we evaluated DNA methylation status in specific
sequences by bisulphite sequencing. The CpG sites of LINE1
transposable elements, the testis-specific gene Lemd1, and the
pluripotent related genes Nanog and Oct4 are demethylated by
active DNA demethylation in zygotes at the pronuclear stage
[9,26,27]. Therefore, we first performed bisulphite sequencing
analysis of the CpG sites within LINE1, Lemd1, Nanog and the
upstream regulatory region of Oct4, including the distal enhancer
(DE), proximal enhancer (PE) and promoter regions [25], in
untreated and GSE-KD zygotes at mid-pronuclear stages (PN3–4)
(Figure 5). Importantly, there were no critical differences in the
DNA methylation status of the examined genes between untreated
Figure 4. Effect of GSE knockdown on paternal DNA demethylation during zygote development. (A) Immunofluorescent images of5 mC (green) and 5 hmC (red) in untreated and GSE-KD zygotes. Green fluorescence images of anti-5 mC are shown in false-color. The respectivenumbers of untreated and GSE-KD zygotes analyzed for each stage were: PN1, 15 and 10; PN2, 15 and 10; PN3, 15 and 15; PN4, 10 and 10; PN5, 10 and10, respectively. Key: R, female pronucleus; =, male pronucleus; PB, polar body; scale bars = 25 mm. (B) Quantification of the ratio (male to female) of5 mC intensity in untreated and GSE-KD zygotes at PN3. Each dot plot represents a single zygote. Red bars represent the mean ratio of each zygote.(C) Quantification of the ratio (male to female) of 5 hmC intensity in untreated and GSE-KD zygotes at PN3. Each dot plot represents a zygote. Redbars represent the mean ratio for each zygote.doi:10.1371/journal.pone.0060205.g004
Involvement of GSE in Active DNA Demethylation
PLOS ONE | www.plosone.org 8 April 2013 | Volume 8 | Issue 4 | e60205
Involvement of GSE in Active DNA Demethylation
PLOS ONE | www.plosone.org 9 April 2013 | Volume 8 | Issue 4 | e60205

and GSE-KD oocytes, indicating that maternal GSE was not
involved in maintaining the DNA methylation status in MII
oocytes. For a comparison, we also examined DNA methylation
status in mouse spermatozoa and MII oocytes. The DNA
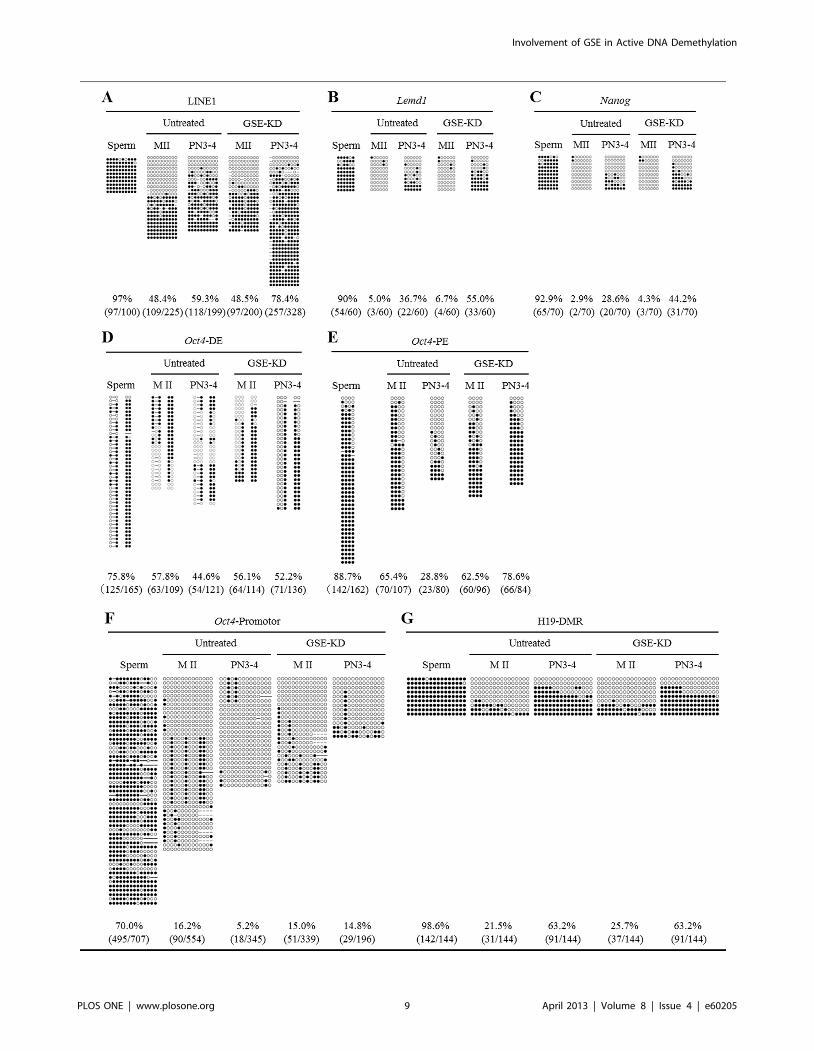
methylation levels in CpG sites of LINE1, Lemd1, Nanog, and the
DE, PE and promoter regions of Oct4 in untreated zygotes at
PN3–4 were 59.3%, 36.7%, 28.6%, 44.6%, 28.8% and 5.2%,
respectively, markedly lower than the mean methylation levels
calculated for spermatozoa and untreated MII oocytes (72.8%,
47.5%, 47.9%, 66.8%, 77.1% and 43.1%, respectively). Thus,
DNA demethylation had occurred at mid-pronuclear stages (PN3–
4), consistent with previous findings [9,26,27]. However, in GSE-
KD zygotes at PN3–4, DNA demethylation levels in the CpG sites
of LINE1, Lemd1, Nanog, and the DE, PE and promoter regions of
Oct4 were 78.4%, 55.0%, 44.2%, 52.2%, 78.6% and 14.8%,
respectively, almost corresponding to the mean levels observed for
spermatozoa and GSE-KD oocytes (72.8%, 48.4%, 48.6%,
66.0%, 75.6% and 42.5%, respectively), although DNA demeth-
ylation in the promoter regions of Oct4 was hampered but not
completely impeded by knockdown of GSE. Thus, knockdown of
GSE resulted in an impairment of DNA demethylation in zygotes,
but the significance of GSE in the genomic region-dependent
DNA demethylation mechanism remains to be elucidated.
We next examined whether knockdown of GSE would impair
DNA methylation status in the CpG sites of the paternally
imprinted, differentially methylated H19 region (H19-DMR). In
agreement with previous studies in which H19-DMR was
demethylated in PGCs but not it zygotes [28,29], bisulphite
sequencing analysis showed that H19-DMR was methylated at a
level of 63.2% in untreated zygotes at PN3–4, close to the mean
methylation level calculated for spermatozoa and untreated
oocytes (60.1%; Figure 5). GSE-KD zygotes at PN3–4 had a
mean methylation level of 63.2%, very similar to the mean level
observed for spermatozoa and GSE-KD zygotes (62.2%). Thus,
these results indicate that the DNA methylation status in LINE1,
Lemd1, Nanog, and the upstream regulatory regions of Oct4 was
specifically affected by GSE knockdown.
Bisulphite sequencing analysis cannot distinguish between 5 mC
and 5hmC [30,31]. Therefore, to examine whether GSE is indeed
involved in the conversion of 5 mC to 5 hmC, we subjected the
genomic DNA from spermatozoa, untreated MII oocytes and
zygotes at PN3–4, and GSE-KD MII oocytes and zygotes at PN3–
4 to methylated and hydroxymethylated DNA immunoprecipita-
tion (MeDIP and hMeDIP) at LINE1. The 5 mC level in
untreated zygotes at PN3–4 was significantly lower than those of
both spermatozoa and untreated MII oocytes, whereas the 5 hmC
level in untreated zygotes at PN3–4 was significantly lower than
those of both spermatozoa and untreated MII oocytes (Figure 6A
and B). These are consistent with a previous observation by
MeDIP and hMeDIP analyses that the conversion of 5 mC to
5 hmC occurs after fertilization [9]. In this experiment, we also
observed that knockdown of GSE caused a significant increase of
Figure 5. Bisulphite sequencing analysis of LINE1, Lemd1, Nanog, Oct4 and H19-DMR in GSE-KD oocytes and zygotes. (A) Bisulphitesequencing of CpG sites within LINE1 genomic regions in spermatozoa and in untreated and GSE-KD oocytes and zygotes at PN3–4. (B) Bisulphitesequencing of CpG sites within Lemd1 genomic regions in spermatozoa and in untreated and GSE-KD oocytes and zygotes at PN3–4. (C) Bisulphitesequencing of CpG sites within Nanog genomic regions in spermatozoa and in untreated and GSE-KD oocytes and zygotes at PN3–4. The methylationprofile of the CpG sites in detail is indicated in Figure S8. (D, E, F) Bisulphite sequencing of CpG sites within the upstream distal enhancer (DE) (D),proximal enhancer (PE) (E) and promoter regions (F) of the Oct4 gene in spermatozoa and untreated and GSE-KD oocytes and zygotes at PN3–4. (G)Bisulphite sequencing of CpG sites within the H19-DMR in sperm and untreated and GSE-KD oocytes and zygotes at PN3–4.doi:10.1371/journal.pone.0060205.g005
Figure 6. DNA immunoprecipitation on LINE1 genomic regions in GSE-KD oocytes and zygotes. (A) Quantitative PCR analysis of LINE1genomic regions on immunoprecipitation using anti-5 mC antibody (for MeDIP). 30 PN3–4 embryos and 30 MII oocytes were collected to extractgenomic DNA. Different letters indicate statistical significance (p,0.05). Bars represent the standard error of the mean. (B) Quantitative PCR analysisof LINE1 genomic regions on immunoprecipitation using anti-5 hmC antibody (for hMeDIP). 30 PN3–4 embryos and 30 MII oocytes were collected toextract genomic DNA. Different letters indicate statistical significance (p,0.05). Bars represent the standard error of the mean.doi:10.1371/journal.pone.0060205.g006
Involvement of GSE in Active DNA Demethylation
PLOS ONE | www.plosone.org 10 April 2013 | Volume 8 | Issue 4 | e60205
5 mC level and concurrently a significant reduction of 5 hmC
level in zygotes at PN3–4, while the 5 mC and 5 hmC levels in
untreated MII oocytes were not different from those in GSE-KD
MII oocytes (Figure 6A and B). These results indicate that the
conversion of 5 mC to 5 hmC at LINE1 is impeded by GSE
knockdown.
These data collectively indicate that maternal GSE binds
preferentially to the paternal chromatin before or just at the
beginning of active demethylation at PN2–3 [32] and suggest that
maternal GSE plays a role in DNA demethylation during zygote
development independently of the first round of DNA replication.
Discussion
We demonstrated here that although GSE was present in both
pronuclei, the protein was associated tightly and predominantly
with the paternal chromatin architecture from PN2 onward, at
which point active DNA demethylation commenced. GSE
proteins, whose amino acid sequences lack any known enzymatic
domains, are highly conserved among mammalian species. GSE is
a relatively small protein (,27 kDa), compared with a complete
histone octamer (approximately 100 kDa). Interestingly, the
chromatin-bound PGC7/Dppa3/Stella is also a small protein
(,17 kDa) and is predominantly confined to the maternal
pronucleus during zygote development, resulting in a change in
chromatin configuration [12,13]. These above findings lead us to
propose that GSE and PGC7/Dppa3/Stella might act in a
competitive fashion to block one another’s association with
chromatin. Indeed, we observed that GSE was not involved in
DNA demethylation of the paternally methylated H19 locus,
which is protected by the binding of PGC7/Dppa3/Stella to
H3K9me2-marked chromatin in the paternal pronucleus [12,13].
Although H3K9me2 allows tight PGC7/Dppa3/Stella association
with chromatin, further studies will need to address how GSE
could be tightly attached to chromatin. It also remains to be
clarified why GSE is more strongly associated with the paternal
pronucleus. Protamines that help pack the paternal sperm DNA
are replaced by the H3.3 histone variant soon after fertilization
[33,34]. As preferential localization of H3.3 in the paternal
pronucleus occurs at PN2 [26], it seems important to investigate
whether GSE could be associated with this process.
We also observed that GSE knockdown impaired active DNA
demethylation as assessed by five independent assays (5 mC
staining, 5 hmC staining, bisulphite sequencing, MeDIP and
hMeDIP). How GSE mediates active DNA demethylation in
zygotes has yet to be determined. However, as the molecular
mechanism of DNA demethylation in the paternal pronucleus
involves the conversion of 5 mC to 5 hmC catalyzed by the
maternal Tet3 enzyme [9–11], we speculate that GSE might be
involved in the active DNA demethylation process associated with
Tet3. Indeed, GSE-knockdown led to the impairment of DNA
demethylation status in the CpG sites within LINE1, Lemd1 and
Nanog, in which DNA demethylation status is also shown to be
impeded in Tet3-null zygotes [9]. Furthermore, in MeDIP and
hMeDIP analyses using the same primers as reported by Gu
et al.(2011) [9], we also observed the impairment of the conversion
of 5 mC to 5 hmC at LINE1 in GSE-KD zygotes as well as in
Tet3-null zygotes. Interestingly, we found here that the pronuclear
localization of GSE occurs at PN2, which seems to be consistent
with the observation of the concentration of Tet3 protein in the
male pronucleus of PN3 zygotes [9]. Further studies are needed to
confirm our hypothesis. In this study, we investigated the possible
function of GSE in GSE-KD zygotes achieved by treating them
with antisense RNA before fertilization. Knockout model mice are
under construction to test whether chromatin-bound GSE is
involved in the active DNA demethylation associated with Tet3.
In conclusion, understanding the function of GSE in gametic
DNA demethylation in cooperation with Tet3 and PGC7/
Dppa3/Stella during zygote development will help elucidate the
molecular mechanisms of epigenetic reprogramming of the male
and female germ cells to generate a totipotent zygote.
Supporting Information
Figure S1 Alignment of GSE orthologs and expression ofGSE in oocytes and preimplantation embryos. (A) Amino
acid sequence alignment of mouse, rat, human, pig and bovine
GSE. To maximize the quality of the alignment, gaps (shown as
dashes) were introduced in the sequences. The multiple sequence
alignment obtained by ClustalW2 program (http://www.ebi.ac.
uk/Tools/clustalw2/index.html) is shown. Completely conserved
residues are shaded in black; residues that are conserved in three
and four of the sequences are shaded in gray. The amino acid
sequences of the GSE orthologs have the following NCBI
accession numbers: mouse GSE, NP_083574; rat GSE,
NP_001157034; human GSE, NP_001157033; pig GSE,
XP_003481269; bovine GSE, XP_003582826. (B) Amino acid
sequence alignment of mouse, Xenopus, zebrafish and Ciona intestinalis
GSE. To maximize the quality of the alignment, gaps (shown as
dashes) were introduced in the sequences. The multiple sequence
alignment obtained by ClustalW2 program is shown. Completely
conserved residues are shaded in black; residues that are conserved
in three and four of the sequences are shaded in gray. The amino
acid sequences of the GSE orthologs have the following NCBI
accession numbers: Xenopus GSE, XP_002932431; zebrafish GSE,
XP_002664166; Ciona intestinalis GSE, XP_002126241. (C)
Immunoblot analyses for protein expressions of GSE in mouse
oocytes and early mouse embryos. Actin was used as a loading
control in immunoblot analyses.
(TIF)
Figure S2 Preferential binding of PGC7/Dppa3/Stellato the maternal chromatin. Immunocytochemical analysis of
PGC7/Dppa3/Stella (red) in zygotes at PN3 after pretreatment
under the PT or TP conditions. Histone H3 is shown in green as a
control for chromatin-bound factor under the TP condition.
Numbers of zygotes analyzed for each group: PT condition, 15;
TP condition, 15. DNA was stained with DAPI (blue). Key: R,
female pronucleus; PB, polar body; scale bars = 50 mm.
(TIF)
Figure S3 In vitro assay of the binding of His-taggedrecombinant GSE to H3 and H4 peptides. (A) Expression of
His-tagged recombinant GSE protein in transfected HEK293
cells. His-tagged recombinant GSE protein purified from lysates of
transfected HEK293 cells was detected by Coomassie Brilliant
Blue (CBB) staining of the SDS gels. Arrow indicates each
respective band. Asterisks indicate nonspecific bands. (B) Immu-
noblot analysis of expressed His-tagged recombinant GSE in
transfected HEK293 cells. Actin was used as a loading control. (C)
His-tagged recombinant GSE and the N-terminal (1–100 amino
acids) of histone H3 peptide was used in immunoprecipitation
analysis. Lysates of transfected cells were used for the immuno-
precipitation with anti-His antibody, followed by immunoblotting
using anti-H3 antibodies. Normal mouse IgG was used as a
negative control. Arrows indicate each respective band. Three
independent experiments were performed. (D) His-tagged recom-
binant GSE and the N-terminal (1–100 amino acids) of histone H4
peptides were used in immunoprecipitation analysis. Lysates of
Involvement of GSE in Active DNA Demethylation
PLOS ONE | www.plosone.org 11 April 2013 | Volume 8 | Issue 4 | e60205
transfected cells were used for the immunoprecipitation with anti-
His antibody, followed by immunoblotting using anti-H4 anti-
bodies. Normal mouse and rabbit IgG were used as a negative
control. Arrows indicate each respective band.
(TIF)
Figure S4 Selection of EGFP-expressing oocytes orembryos. (A) Laser perforation of RNAs-injected M II oocytes.
Arrows represent the perforation of zona pellucida of each oocyte.
Scale bars = 50 mm. (B) Selection of oocytes or embryos expressing
EGFP gene. The RNAs coinjected oocytes or 2-cell embryos
showing EGFP fluorescence were selected as GSE-KD cells. Scale
bars = 100 mm.
(TIF)
Figure S5 Representative images of 5 mC and 5 hmCstaining in untreated and GSE-KD zygotes at PN3. Shown
are representative images of each zygote stained with anti-5 mC
(green) and anti-5 hmC (red) antibodies. Green fluorescence
images of anti-5 mC are shown in false-color. Key: R, female
pronucleus; =, male pronucleus; PB, polar body; scale
bars = 50 mm. Numbers of zygotes analyzed for each group:
untreated, 14; GSE-KD, 14.
(TIF)
Table S1 Information of antibodies.(XLS)
Table S2 Information of primers.(XLS)
Acknowledgments
We thank K. Yamagata for providing plasmid, pcDNA3.1 poly (A83) and
gratefully acknowledge Ms. N Backes Kamimura and Ms. J Walhelm
Kimura for English editing.
Author Contributions
Discussion: TA MA HK TM Y. Hosoi SK KM. Conceived and designed
the experiments: Y. Hatanaka KM. Performed the experiments: Y.
Hatanaka NS. Analyzed the data: Y. Hatanaka. Contributed reagents/
materials/analysis tools: SN MT SWS TN. Wrote the paper: Y. Hatanaka
KM.
References
1. Hemberger M, Dean W, Reik W (2009) Epigenetic dynamics of stem cells andcell lineage commitment: digging Waddington’s canal. Nat Rev Mol Cell Biol
10: 526–537.2. Probst AV, Almouzni G (2011) Heterochromatin establishment in the context of
genome-wide epigenetic reprogramming. Trends Genet 27: 177–185.3. Saitou M, Kagiwada S, Kurimoto K (2012) Epigenetic reprogramming in mouse
pre-implantation development and primordial germ cells. Development 139:
15–31.4. Sasaki H, Matsui Y (2008) Epigenetic events in mammalian germ-cell
development: reprogramming and beyond. Nat Rev Genet 9: 129–140.5. Surani A, Tischler J (2012) Stem cells: a sporadic super state. Nature 487: 43–45.
6. Hackett JA, Zylicz JJ, Surani MA (2012) Parallel mechanisms of epigenetic
reprogramming in the germline. Trends Genet 28: 164–174.7. Smith ZD, Chan MM, Mikkelsen TS, Gu H, Gnirke A, et al. (2012) A unique
regulatory phase of DNA methylation in the early mammalian embryo. Nature484: 339–344.
8. Santos F, Hendrich B, Reik W, Dean W (2002) Dynamic reprogramming of
DNA methylation in the early mouse embryo. Dev Biol 241: 172–182.9. Gu TP, Guo F, Yang H, Wu HP, Xu GF, et al. (2011) The role of Tet3 DNA
dioxygenase in epigenetic reprogramming by oocytes. Nature 477: 606–610.10. Iqbal K, Jin SG, Pfeifer GP, Szabo PE (2011) Reprogramming of the paternal
genome upon fertilization involves genome-wide oxidation of 5-methylcytosine.Proc Natl Acad Sci U S A 108: 3642–3647.
11. Wossidlo M, Nakamura T, Lepikhov K, Marques CJ, Zakhartchenko V, et al.
(2011) 5-Hydroxymethylcytosine in the mammalian zygote is linked withepigenetic reprogramming. Nat Commun 2: 241.
12. Nakamura T, Arai Y, Umehara H, Masuhara M, Kimura T, et al. (2007)PGC7/Stella protects against DNA demethylation in early embryogenesis. Nat
Cell Biol 9: 64–71.
13. Nakamura T, Liu YJ, Nakashima H, Umehara H, Inoue K, et al. (2012) PGC7binds histone H3K9me2 to protect against conversion of 5mC to 5hmC in early
embryos. Nature 486: 415–419.14. Kang J, Kalantry S, Rao A (2012) PGC7, H3K9me2 and Tet3: regulators of
DNA methylation in zygotes. Cell Res advance online publication 7 August2012; doi: 10.1038/cr.2012.117.
15. Mizuno S, Sono Y, Matsuoka T, Matsumoto K, Saeki K, et al. (2006)
Expression and subcellular localization of GSE protein in germ cells andpreimplantation embryos. J Reprod Dev 52: 429–438.
16. Lawitts JA, Biggers JD (1993) Culture of preimplantation embryos. MethodsEnzymol 225: 153–164.
17. Matsuoka T, Sato M, Tokoro M, Shin SW, Uenoyama A, et al. (2008)
Identification of ZAG1, a novel protein expressed in mouse preimplantation,and its putative roles in zygotic genome activation. J Reprod Dev 54: 192–197.
18. Satoh M, Tokoro M, Ikegami H, Nagai K, Sono Y, et al. (2009) Proteomicanalysis of the mouse ovary in response to two gonadotropins, follicle-stimulating
hormone and luteinizing hormone. J Reprod Dev 55: 316–326.19. Shin SW, Tokoro M, Nishikawa S, Lee HH, Hatanaka Y, et al. (2010) Inhibition
of the ubiquitin-proteasome system leads to delay of the onset of ZGA gene
expression. J Reprod Dev 56: 655–663.
20. Tokoro M, Shin SW, Nishikawa S, Lee HH, Hatanaka Y, et al. (2010)
Deposition of acetylated histones by RNAP II promoter clearance may occur at
onset of zygotic gene activation in preimplantation mouse embryos. J Reprod
Dev 56: 607–615.
21. Hirano Y, Hayashi H, Iemura S, Hendil KB, Niwa S, et al. (2006) Cooperation
of multiple chaperones required for the assembly of mammalian 20S
proteasomes. Mol Cell 24: 977–984.
22. Tsunemoto K, Anzai M, Matsuoka T, Tokoro M, Shin SW, et al. (2008) Cis-
acting elements (E-box and NBE) in the promoter region of three maternal genes
(Histone H1oo, Nucleoplasmin 2, and Zygote Arrest 1) are required for oocyte-specific
gene expression in the mouse. Mol Reprod Dev 75: 1104–1108.
23. Anzai M, Nishiwaki M, Yanagi M, Nakashima T, Kaneko T, et al. (2006)
Application of laser-assisted zona drilling to in vitro fertilization of cryopreserved
mouse oocytes with spermatozoa from a subfertile transgenic mouse. J Reprod
Dev 52: 601–606.
24. Amano T, Matsushita A, Hatanaka Y, Watanabe T, Oishi K, et al. (2009)
Expression and functional analyses of circadian genes in mouse oocytes and
preimplantation embryos: Cry1 is involved in the meiotic process independently
of circadian clock regulation. Biol Reprod 80: 473–483.
25. Kawasumi M, Unno Y, Matsuoka T, Nishiwaki M, Anzai M, et al. (2009)
Abnormal DNA methylation of the Oct-4 enhancer region in cloned mouse
embryos. Mol Reprod Dev 76: 342–350.
26. Okada Y, Yamagata K, Hong K, Wakayama T, Zhang Y (2010) A role for the
elongator complex in zygotic paternal genome demethylation. Nature 463: 554–
558.
27. Hajkova P, Jeffries SJ, Lee C, Miller N, Jackson SP, et al. (2010) Genome-wide
reprogramming in the mouse germ line entails the base excision repair pathway.
Science 329: 78–82.
28. Morgan HD, Santos F, Green K, Dean W, Reik W (2005) Epigenetic
reprogramming in mammals. Hum Mol Genet 14 Spec No1: R47–58.
29. Tremblay KD, Saam JR, Ingram RS, Tilghman SM, Bartolomei MS (1995) A
paternal-specific methylation imprint marks the alleles of the mouse H19 gene.
Nat Genet 9: 407–413.
30. Huang Y, Pastor WA, Shen Y, Tahiliani M, Liu DR, et al. (2010) The behaviour
of 5-hydroxymethylcytosine in bisulfite sequencing. PLoS One 5: e8888.
31. Jin SG, Kadam S, Pfeifer GP (2010) Examination of the specificity of DNA
methylation profiling techniques towards 5-methylcytosine and 5-hydroxy-
methylcytosine. Nucleic Acids Res 38: e125.
32. Wossidlo M, Arand J, Sebastiano V, Lepikhov K, Boiani M, et al. (2010)
Dynamic link of DNA demethylation, DNA strand breaks and repair in mouse
zygotes. EMBO J 29: 1877–1888.
33. Torres-Padilla ME, Bannister AJ, Hurd PJ, Kouzarides T, Zernicka-Goetz M
(2006) Dynamic distribution of the replacement histone variant H3.3 in the
mouse oocyte and preimplantation embryos. Int J Dev Biol 50: 455–461.
34. van der Heijden GW, Dieker JW, Derijck AA, Muller S, Berden JH, et al. (2005)
Asymmetry in histone H3 variants and lysine methylation between paternal and
maternal chromatin of the early mouse zygote. Mech Dev 122: 1008–1022.
Involvement of GSE in Active DNA Demethylation
PLOS ONE | www.plosone.org 12 April 2013 | Volume 8 | Issue 4 | e60205