gt2014-26824
TRANSCRIPT
1
Proceedings of ASME Turbo Expo 2014: Power for Land, Sea and Air
GT2014-26824
June 16-20, 2014, Düsseldorf, Germany
EXPERIMENTAL INVESTIGATION OF NONPERIODIC ENDWALL FILM COOLING IN NEIGHBORING PASSAGES
WITH UPSTREAM ROTATING FLOW
Yang Zhang, Xin Yuan*
Key Laboratory for Thermal Science and Power Engineering of Ministry of Education
Tsinghua University
Beijing 100084, P.R. China
*Email: [email protected]
ABSTRACT
The distribution of film-cooling holes is considered to be the same between neighbouring high pressure turbine passages in most cascade experiments. Because of the difference in accounts of combustors and vanes, however, the flow fields of neighbouring passages are completely different. The secondary flow, especially the passage vortex, is dominated by the upstream inlet rotating flow whose relative flow direction is the reverse between the neighbouring vane passages. Specific rotating directions introduce new challenges in film-cooling design. The present experiment compares three groups of endwall film-cooling with anticlockwise rotating flow inlets at different clocking positions, and the film-cooling effect is analysed to investigate the effects of inlet rotating flow. The inlet flow condition of neighbouring passages is simulated by switching the position of the swirler by means of which rotating inlet flow conditions in different positions are achieved.
The GE-E3 airfoil is used in the cascades, with a scaled-
up factor of 2.2. The inlet Reynolds number is 3.5×10⁵ and the Mach number is 0.1. The effects of the blowing ratio and relative positions of the swirler are investigated in the experiment. Adiabatic film-cooling effectiveness is probed by using pressure-sensitive painting (PSP). The coolant is simulated by nitrogen by which a density ratio of around 1.0 can be achieved. Fan-shaped film-cooling holes are introduced into the endwall surface as well as trailing edge discharge holes. The cooling performance of the combustor-turbine gap leakage flow is also considered simultaneously.
Conclusions are as follows: (1) the anticlockwise
direction of rotating flow influences the endwall film-cooling effectiveness, especially for the upstream part of the endwall which is mainly covered by the leakage flow; (2) the film-cooling effectiveness in the neighbouring passages differs depending on the position of the inlet rotating flow core; (3) the film-cooling performance at the downstream part of the endwall is partly influenced by the upstream rotating flow inlet as well.
INTRODUCTION As the inlet temperature in modern gas turbines increases,
higher thermal loading on the high-pressure turbine makes heavy demands on guide-vane cooling. The introduction of the film-cooling technique for nozzle guide vanes (NGV) of advanced industrial gas turbines makes further improvement in performance possible. With regard to the upstream combustor outlet flow condition, research is necessary about the effects of inlets' non-uniform boundary condition induced by the swirler in the combustor. Given that the current research in the primary stage concerns the basic mechanism, an anticlockwise swirler embedded in a movable plate is used to simulate the rotating flow with different core positions at the turbine inlet.
In research on rotating flow inlet conditions, Khanal [1] conducted a numerical investigation of transonic high-pressure turbine behaviour under the combined influence of swirl and hot-streak. The cases considered included both the effects of the combustor-NGV clocking and the direction of the swirl. The CFD result indicated that the swirl directions strongly influenced the blade heat transfer characteristics and their dependence on the clocking position. Qureshi [2] investigated the influence of upstream swirling flow on high pressure (HP) vane heat transfer and aerodynamics. The vortex centre was aligned with the vane leading edge. This paper presented measurements of HP vane surface and endwall heat transfer for two vane positions. Qureshi [3] compared the experimental measurements with and without inlet swirl upstream the HP turbine stage. This paper presented time-averaged experimental heat transfer measurements performed on the rotor casing surface and on the rotor blade surface at different span positions, as well as time-averaged rotor casing static pressure measurements. Khanal [4] compared two non-uniform inlet conditions of practical interest using numerical simulation: a hot-streak typical of a rich-burn combustion environment and a combined swirl and hot-streak typical of a lean-burn combustion environment. The results indicated that the swirl/hot-streak combination gave much larger unsteady fluctuations on both the rotor blade forcing and the heat load.

2
In film-cooling research using pressure-sensitive painting (PSP), Zhang and Jaiswal [5] measured film-cooling effectiveness on a turbine vane endwall surface using the PSP technique. It was clear that the film-cooling effectiveness on the blade platform is strongly influenced by the platform’s secondary flow through the passage. Zhang and Moon [6] used the back-facing step to simulate the discontinuity of the nozzle inlet with regard to the combustor exit cone. Nitrogen gas was used to simulate cooling flow and a tracer gas to indicate oxygen concentration so that the film’s effectiveness could be obtained by mass transfer analogy. An experimental study was performed by Wright and colleagues [7] to investigate film-cooling effectiveness measurements of three different steady-state techniques: pressure-sensitive paint, temperature-sensitive paint, and infrared thermography. They found that detailed distributions could be obtained in the critical area around the holes, and the true jet separation and re-attachment behaviour captured with the PSP. Wright and colleagues [8] used the PSP technique to measure the film-cooling effectiveness on a turbine blade platform with three different stator-rotor seals. Three slot configurations placed upstream of the blades were used to model advanced seals between the stator and rotor. Therefore, PSP was proven to be a valuable tool for obtaining detailed film-cooling effectiveness distributions. Gao and colleagues [9] studied turbine blade platform film-cooling with typical stator-rotor purge flow and discrete-hole film-cooling. The shaped holes presented higher film-cooling effectiveness and wider film coverage than the cylindrical holes, particularly at higher blowing ratios. Detailed film-cooling effectiveness distributions on the platform were also obtained with the PSP technique. The results showed that the combined cooling scheme (slot purge-flow cooling combined with discrete-hole film-cooling) was able to provide full film coverage on the platform. Charbonnier and colleagues [10] applied the PSP technique to measure coolant gas concentration. An engine representative density ratio between the coolant and the external hot gas flow was achieved by the injection of CO2. Studies of the incidence angle effect on the flow field and heat transfer have also been performed by researchers. Gao and colleagues [11] studied the influence of the incidence angle on the film-cooling effectiveness for a cutback squealer blade tip. Three incidence angles were investigated: zero in the design condition and ±5 in the off-design conditions. Based on mass transfer analogy, film-cooling effectiveness was measured with PSP techniques. It was observed that the incidence angle affected the coolant jet direction on the pressure side near tip region and the blade tip. The film-cooling effectiveness distribution was also altered.
As regards blade endwall platform film-cooling research,
Yang and colleagues [12] used numerical simulation to predict the film-cooling effectiveness and heat transfer coefficient distributions on a rotating blade platform with stator-rotor purge flow and downstream discrete film-hole flows in a 1–1/2 turbine stage. The effect of the turbine work process on the film-cooling effectiveness and the associated heat transfer coefficients were reported. Research by Kost and Mullaert [13] indicates that both the leakage flow of endwall upstream slots and film-cooling ejection are strongly
influenced by the endwall pressure distribution. The leakage flow and film-cooling ejection move towards the low pressure region where high film-cooling effectiveness is captured. The influence of the pressure distribution could also explain why the suction side is cooled better than the pressure side. Another important factor is the passage vortex moved by the pressure gradient in the cascade. It could lead the coolant to move towards the suction side. Similar results were found in the research report by Papa and colleagues [14]. They captured the phantom cooling phenomenon on the rotor blade suction side and the coolant was ejected from an upstream slot. The paper indicates that the coolant from the endwall moved towards the suction side and then formed a triangular cooled area.
The effects of rotation on platform film-cooling were
investigated by Suryanarayanan and colleagues [15] who found that secondary flow from the blade pressure surface to the suction surface was strongly affected by the rotational motion, causing the coolant traces from the holes to flow clearly towards the suction side surface. As regards investigations into combustor-turbine leakage flow, Thole’s group made significant contributions: the influences of slot shape and position as well as width were studied in a series of researches [16-18].
Oke and Simon [19] investigated the film-cooling flow
introduced through two successive rows of slots, a single row of slots and slots with particular area distributions in the pitchwise direction. Wright and colleagues [20] used a 30 ° inclined slot upstream of the blades to model the seal between a stator and a rotor. Twelve discrete film holes were located on the downstream half of the platform for additional cooling. Rehder and Dannhauer [21] experimentally investigated the influence of turbine leakage flows on the three-dimensional flow field and endwall heat transfer. In the experiment, pressure distribution measurements provided information about the endwall and vane surface pressure field and their variation with leakage flow. Additionally, streamline patterns (local shear stress directions) on the walls were detected by oil flow visualisation. Piggush and Simon [22] investigated the leakage flow and misalignment effects on endwall heat transfer coefficients within a passage which had one axially contoured and one straight endwall. The paper documented that leakage flows through such gaps within the passage can affect endwall boundary layers and induce additional secondary flows and vortex structures in the passage near the endwall.
Past research has shown that strong secondary flow can result in changes to the local heat transfer on the endwall and platform. Many studies have investigated the effects of the blowing ratio or geometry on endwall film-cooling, indicating that the flow field parameter can change the injection flow trace. Few studies, however, have considered the combined effect of inlet rotating flow and endwall film-cooling. To help fill this gap, the current paper discusses the effect of anticlockwise inlet rotating flow clocking positions on the film-cooling of a nozzle guide vane endwall. The blowing ratio is also considered.

3
EXPERIMENTAL METHODOLOGY Pressure-sensitive paint (PSP) techniques are based on a
physical process called oxygen-quenched photoluminescence. This process first involves excitation by a suitable light source so that the active part of PSP emits light, a process that can be interrupted by collisions of the PSP surface with oxygen molecules. The result is that the PSP molecules may relax back to their unexcited state without emitting visible light if the local oxygen partial pressure is too high. Given that the local oxygen partial pressure is related to the local pressure of gas which contains oxygen, such as air, the emitted light intensity is directly related to the local pressure of surrounding air. A Charge-coupled Device (CCD) camera with high spectral sensitivity and light-emitting diode (LED) lights are used in the present study to receive the emitted light and to excite the Ruthenium-based paint respectively. The paint is excited at 450 nm and the camera is fitted with a 600 nm band pass filter. The paint used returns 600 nm light in the energized state. In the current study, the main stream is air, which contains approximately 21% oxygen, and the cooling flow is pure nitrogen in which the partial pressure of oxygen is 0%. The film effectiveness is then expressed in terms of oxygen concentration, which is detected and measured using the PSP. The resulting effectiveness equation is then given by
2
mix aw
N c
C C T T
C C T T
(1)
where C and mixCrepresent the oxygen concentration of the
main stream and the air/nitrogen mixture (0% and 21%), respectively. This approach gives film effectiveness values between 0% (for far upstream and downstream locations) and 100% (inside film-cooling holes). The resulting equivalent adiabatic effectiveness is then expressed using
2 2
2
O Oair mix air mix
air O air
P PC C
C P
(2)
To measure the film-cooling effectiveness, four images
are taken at the same main stream temperature value for each PSP film-cooling test. First, a dark image is taken without LED light and the main stream flow. A reference image is then taken without the main stream, but with the LED light on. An air injection image and a nitrogen injection image are subsequently obtained, both with the main stream flow and LED light on, and the coolant gas is air and nitrogen, respectively. The reference image distribution, divided by the nitrogen-injection image and the air-injection image, is then obtained from the four images for each test sequence. The resulting distribution of reference ratio data (derived from the air-injection image) then provides information on the change in oxygen concentration owed to the change in pressure, which does not contribute to the magnitude of local film-cooling effectiveness. The other distribution of reference ratio data, derived from the nitrogen-injection image, then yields contributions to effectiveness values from absolute oxygen
concentrations. With these two groups of reference ratio distributions, the local adiabatic film-cooling effectiveness distributions are obtained in appropriate fashion by means of mass transfer/heat transfer analogy.
Figure 1. CALIBRATION SYSTEM.AND CALIBRATION CURVES FOR PSP.
Before each experimental measurement, the PSP,
employed along a test surface, is calibrated to obtain the relationships between light intensities and local partial pressures of oxygen. Figure 1 shows a schematic diagram of the calibration system employed for this purpose. Here, a PSP-coated copper coupon is used to simulate the experimental surface, and three thermocouples are installed underneath the front surface to measure the time variation of surface temperature as the calibration process is underway. The sample coupon is located inside a sealed chamber, where a partial or total vacuum is created. The temperature of the sample is first increased by a heater located at the back of the coupon, which maintains the sample at a desired temperature with accuracy better than ±0.5 K. The camera faces the sample coupon through a transparent window. Because surface temperatures between 298 K and 308 K are possible with this system, the PSP is subsequently calibrated for surface temperatures of 276.5 K, 298 K, and 308 K, and for pressures from vacuum (approximately 1/3 of an atmosphere) to one atmosphere. The calibration is undertaken at these three temperatures to provide complete information on the influence of temperature. Examples of resulting calibration data are presented in Figure 1, which shows the
4
interdependence between light intensity ratio and pressure ratio. Note that quantitative variations between the data sets for the three temperature levels are quite small, and evidences only weak dependence of calibration data on surface temperature level.
The dimensionless temperature downstream of the cooling holes is also determined from light intensity distributions, and is defined using Eq. (3), which is expressed using an equation of the form
c
T T
T T
(3)
Variations of surface adiabatic wall temperature are
presented using dimensionless film-cooling effectiveness, which is defined for low speed and constant property flows using Eq. (4), which is given by
aw
c
T T
T T
(4)
For the calibration case, based on a 95% confidence
level, the experimental uncertainties of the dimensionless temperature and the adiabatic film-cooling effectiveness are both approximately 3%, for an effectiveness representative value of 0.5. These uncertainty values increase as the effectiveness approaches zero, resulting in an uncertainty of approximately 20%. EXPERIMENTAL FACILITY
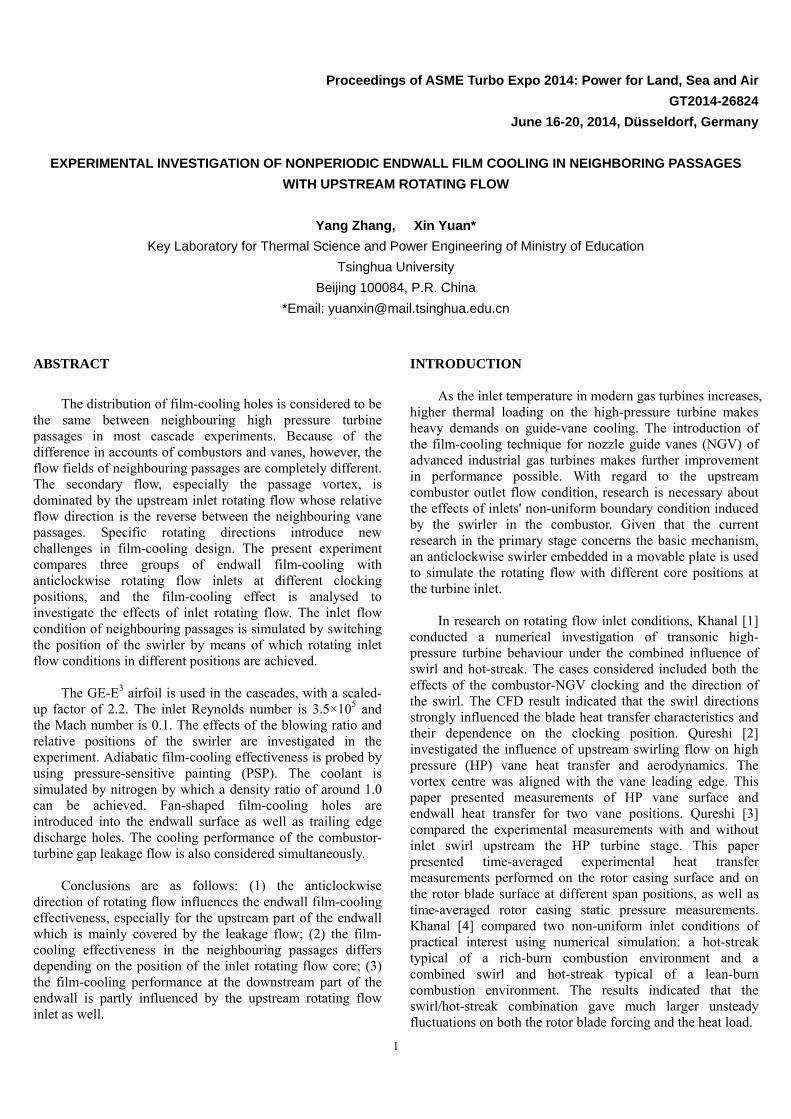
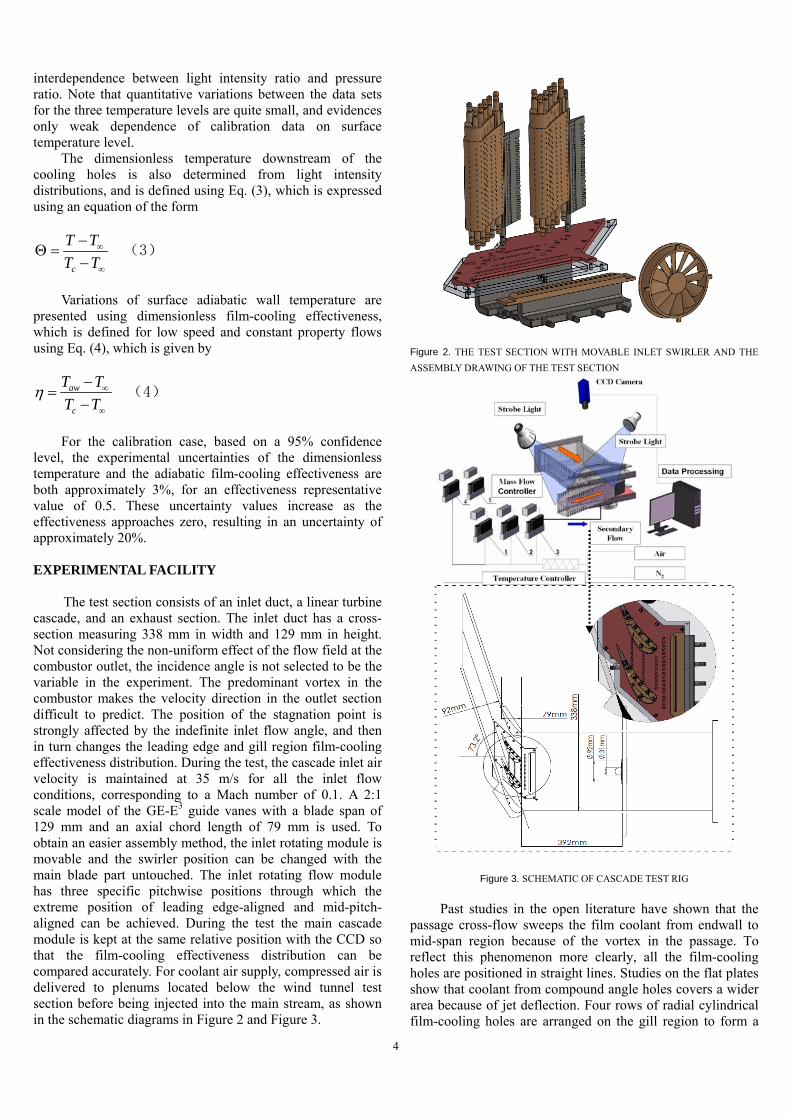
The test section consists of an inlet duct, a linear turbine cascade, and an exhaust section. The inlet duct has a cross-section measuring 338 mm in width and 129 mm in height. Not considering the non-uniform effect of the flow field at the combustor outlet, the incidence angle is not selected to be the variable in the experiment. The predominant vortex in the combustor makes the velocity direction in the outlet section difficult to predict. The position of the stagnation point is strongly affected by the indefinite inlet flow angle, and then in turn changes the leading edge and gill region film-cooling effectiveness distribution. During the test, the cascade inlet air velocity is maintained at 35 m/s for all the inlet flow conditions, corresponding to a Mach number of 0.1. A 2:1 scale model of the GE-E3 guide vanes with a blade span of 129 mm and an axial chord length of 79 mm is used. To obtain an easier assembly method, the inlet rotating module is movable and the swirler position can be changed with the main blade part untouched. The inlet rotating flow module has three specific pitchwise positions through which the extreme position of leading edge-aligned and mid-pitch-aligned can be achieved. During the test the main cascade module is kept at the same relative position with the CCD so that the film-cooling effectiveness distribution can be compared accurately. For coolant air supply, compressed air is delivered to plenums located below the wind tunnel test section before being injected into the main stream, as shown in the schematic diagrams in Figure 2 and Figure 3.
Figure 2. THE TEST SECTION WITH MOVABLE INLET SWIRLER AND THE
ASSEMBLY DRAWING OF THE TEST SECTION
Figure 3. SCHEMATIC OF CASCADE TEST RIG
Past studies in the open literature have shown that the passage cross-flow sweeps the film coolant from endwall to mid-span region because of the vortex in the passage. To reflect this phenomenon more clearly, all the film-cooling holes are positioned in straight lines. Studies on the flat plates show that coolant from compound angle holes covers a wider area because of jet deflection. Four rows of radial cylindrical film-cooling holes are arranged on the gill region to form a

5
fully covered coolant film. Figures 4 to 8 show the hole configurations and the geometric parameters of the blade.
Four rows of compound angle laidback fan-shaped holes are arranged on the endwall to form a fully covered coolant film. Figure 4 shows the hole configurations and the blade’s geometric parameters. The first row is located upstream of the leading edge plane. The following three rows are evenly positioned inside the vane channel, with the last one located at 65% of the axial chord, downstream of the leading edge plane. The four rows of fan-shaped holes are inclined 30 ° to the platform surface and held at an angle of 0, 30, 45 and 60 ° respectively in the axial direction. The laidback fan-shaped holes are featured with a lateral expansion of 10 ° from the hole-axis and forward expansion of 10 ° into the endwall surface, as shown in Figure 4. The diameter in the metering part (cylindrical part) of the shaped holes is 1 mm, and the expansion starts at 3D. Four coolant cavities are used for the four rows of holes respectively, as shown in Figure 5. (The extra coolant plenum chamber is designed to simulate the purge flow which is used as leakage flow supply in this experiment.) The coolant supplied to each cavity is independently controlled by a rotameter dedicated to that cavity.
Figure 4. DETAILS OF THE FAN-SHAPED ENDWALL FILM-COOLING HOLES
The fixed fan upstream of the cascades is used to simulate the real combustor swirler bringing a rotating flow to the NGV inlet. The swirler is located 392mm upstream of the cascade inlets to allow the rotating flow to fully develop in the test section. The swirler is fixed on a movable plate which makes position migration possible. The extreme position of the swirler is limited by the left and right side of the plate. The corresponding position of the swirler related to left side is Vane A-aligned. The corresponding position of the middle pitch and right side is middle-pitch aligned and Vane A/B-
aligned respectively. The Vane A-aligned and Vane B-aligned positions are not technically the same condition when the number of combustor cambers and nozzle guide vanes differ. The Vane A-aligned and Vane B-aligned positions can simulate the flow condition of ‘neighbouring’ passages. As shown in Figure 5, the outer diameter of the swirler is 92mm and its inner diameter is 31mm. The guide vanes of the swirler turn the inlet flow into an anticlockwise rotating flow boundary condition. The clockwise rotating flow condition is not considered in the test because the rotating direction effect is included in the following experiments. A slot is located at the cascade inlet to simulate the combustor-turbine leakage gap with a slot width of 2mm and an inclined angle of 30 ° to the endwall surface. The leakage flow is supplied by an individual coolant plenum where the blowing ratio can be controlled independently.
Figure 5. THE POSITIONS OF SWIRLER AND THE CONFIGURATION OF
ENDWALL INLET SLOT (WITH INNER STUCTURE OF COOLANT SUPPLY
CHANNEL)
The uncertainties of the dimensionless temperature and
the film-cooling effectiveness are estimated as 3% at a typical value of 0.5 based on a 95% confidence interval. When the value is approaching zero, the uncertainty rises. For instance, the uncertainty is approximately 20% at the value of 0.05. This uncertainty is the cumulative result of uncertainties in calibration, 4%, and image capture, 1%. The absolute uncertainty for effectiveness varies from 0.01 to 0.02 units. Thus, relative uncertainties for very low effectiveness can be very high, 100% at a magnitude of 0.01.
Table 1 Discrete film hole location and orientation Hole Name
PositionX/Cax
Number D (mm)
Radial/ Compound
Angle to Surface
ROW1 -0.19 27 1/Fan 90 30
ROW2 0.02 13 1/Fan 60 30
ROW3 0.32 11 1/Fan 45 30
ROW4 0.59 11 1/Fan 30 30
Table 2 Experimental conditions considered in the test
Cases Slot Film-cooling Endwall Film-cooling M
Air (L/min)
N2
(L/min) Air
(L/min) N2
(L/min)
Film-cooling Without Endwall Holes Injection (Vane A-aligned)

6
1 77 80 0 0 1.0 Film-cooling Without Endwall Holes Injection (Mid-pitch-aligned)
2 77 80 0 0 1.0 Film-cooling Without Endwall Holes Injection (Vane B-aligned)
3 77 80 0 0 1.0 Combination of Slot and Endwall Holes Film-cooling
4 77 80 102 106 1.0 Film-cooling Without Endwall Holes Injection (Mid-pitch-aligned)
5 77 80 102 106 1.0 Film-cooling Without Endwall Holes Injection (Vane B-aligned)
6 77 80 102 106 1.0
Table 3 Geometric and flow conditions
Scaling factor 2.20
Scaled up chord length 135.50 mm
Scaled up axial chord length 79.00 mm
Pitch/chord 0.80
Span/chord 0.95
Reynolds number at inlet 3.5×10⁵
Inlet and exit angles 0 & 72 °
Inlet Mach number 0.1 & 0.25
Inlet mainstream velocity 35 m/s
Mainstream flow temperature 305.5 K
Injection flow temperature 305.0 K
Figure 6. FIVE-HOLE PROBE AND ITS TWO DIMENSIONAL DISPLACEMENT
WORKTABLE
Though the phantom cooling effects have been investigated through PSP measurements, the aerodynamic performance is also an important factor for the NGVs. The five-hole probe total pressure measurement section is added to the cascades to probe the total pressure loss. A two dimensional displacement worktable is used to make the measurement on a single plain possible. The vanes with film cooling holes are replaced by the pressure test vanes to measure the static pressure distribution on airfoil surface. The diameter of static pressure hole is 1mm with individual cavity made through Stereolithography (SLA) fast prototype technology. The static pressure is tested on the vane top where some pressure sensors are located.
Pitch
Sp
an
0 0.5 1 1.5 2
0
0.25
0.5
0.75
1 0.965
0.97
0.975
0.98
0.985
0.99
0.995
1
Figure 7. SPATIALLY RESOLVED MAP OF NON-DIMENSIONAL TOTAL
PRESSURE LOSS WITHOUT FILM COOLING
The pressure coefficient at outlet was measured by the five-hole probe and the airfoil surface pressure distribution was measured by the Kulite sensor. The aerodynamic results show the periodicity of the cascades and structure of secondary flow, as shown in Figure 7. The simple case without any film cooling injection was measured as the baseline condition. The test range covers two pitches and the near endwall area where non-dimensional span height is between 0.75 and 1.0, as shown in the black rectangular. The test time is 5 seconds at every point for the five-hole probe, and the measurement frequency is 100HZ. The airfoil surface pressure was probed at 23 points on PS and SS respectively.
0 0.2 0.4 0.6 0.8
0.96
0.97
0.98
0.99
1
X/Cax
Pre
ssure
Coeffi
cient
VaneA PS
VaneB PS
VaneA SS
VaneB SS
Figure 8. NON-DIMENSIONAL PRESSURE COEFFICIENT DISTRIBUTIONS ON
AIRFOILS
The figure shows the pressure coefficient distribution at the outlet plain with a distance of 0.5 axial chord length from trailing edge. The high pressure loss area could be captured in the map which demonstrates the position of wake and corner vortex core. The low pressure coefficient area along the spanwise direction shows the position and strength of the trailing edge wake. The shape of wakes and vortex show that the cascades have a reasonable vane to vane periodicity quality. The secondary flow can be captured in the map obviously According to the airfoil surface pressure coefficient distribution shown in Figure 8, Vane-to-vane comparisons of the experimental measurement points demonstrate that a good level of periodicity, too.
7
RESULTS AND DISCUSSION Though the cascade is 2-D linear, the relative ejection
direction of the coolant is different at the different positions on the endwall. The strong secondary flow causes the ejection direction to differ from the endwall main flow direction. The interaction between the endwall film-cooling coolant and the secondary flow, especially the passage vortex, hardly cools the endwall near PS and the stagnation line, and the different flow direction near the suction side avoids this adverse interaction. According to the contours, with endwall film-cooling hole ejection the passage vortex pushes the coolant to the suction side, leaving an apparently uncooled area near the pressure side, especially near the stagnation line.
In the current study, five coolant cavities are used for the
slot leakage flow and four rows of fan-shaped endwall holes respectively. The coolant supplied to each cavity is controlled by a shared rotameter. During the test, the optical window, and the CCD camera are fixed in the same position so that the different inlet rotating flow conditions can be compared precisely. In this study, three different inlet rotating flow positions were chosen for the typical design condition, Vane A-aligned, mid-pitch-aligned and Vane B-aligned. The blowing ratio of the coolant is fixed, so the film-cooling effectiveness can be measured at a steady blowing ratio of M=1.0, based on the mainstream flow inlet velocity.
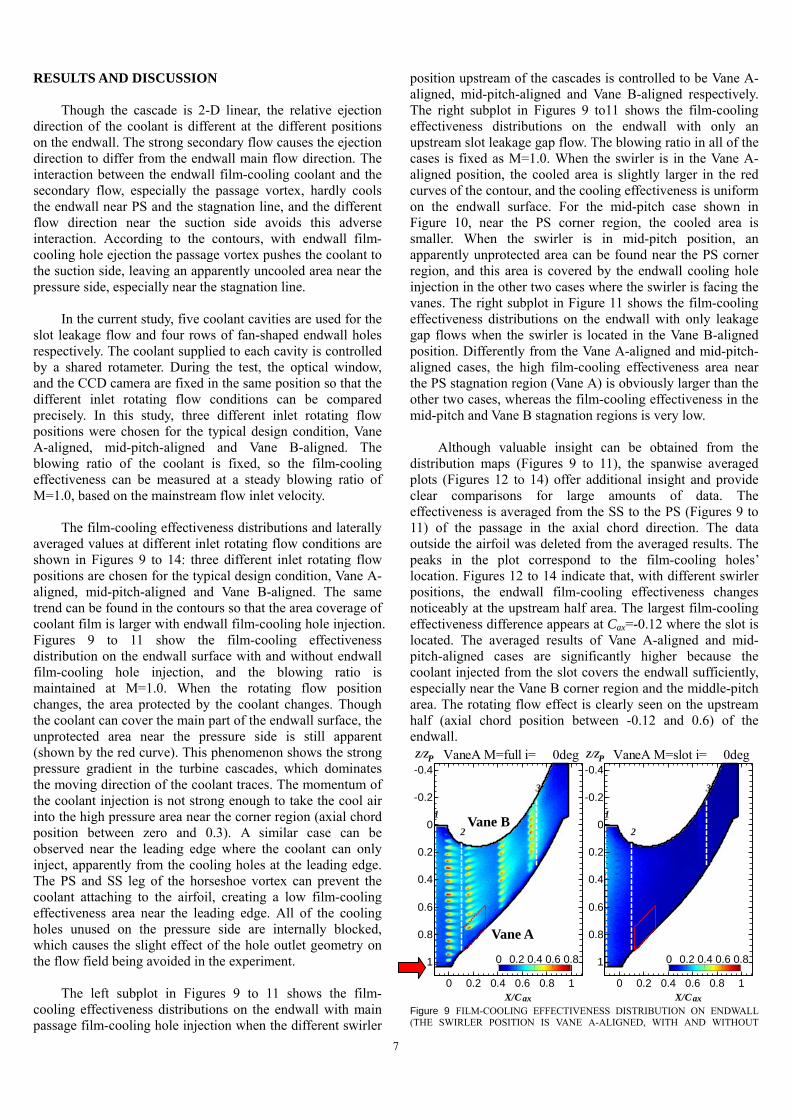
The film-cooling effectiveness distributions and laterally averaged values at different inlet rotating flow conditions are shown in Figures 9 to 14: three different inlet rotating flow positions are chosen for the typical design condition, Vane A-aligned, mid-pitch-aligned and Vane B-aligned. The same trend can be found in the contours so that the area coverage of coolant film is larger with endwall film-cooling hole injection. Figures 9 to 11 show the film-cooling effectiveness distribution on the endwall surface with and without endwall film-cooling hole injection, and the blowing ratio is maintained at M=1.0. When the rotating flow position changes, the area protected by the coolant changes. Though the coolant can cover the main part of the endwall surface, the unprotected area near the pressure side is still apparent (shown by the red curve). This phenomenon shows the strong pressure gradient in the turbine cascades, which dominates the moving direction of the coolant traces. The momentum of the coolant injection is not strong enough to take the cool air into the high pressure area near the corner region (axial chord position between zero and 0.3). A similar case can be observed near the leading edge where the coolant can only inject, apparently from the cooling holes at the leading edge. The PS and SS leg of the horseshoe vortex can prevent the coolant attaching to the airfoil, creating a low film-cooling effectiveness area near the leading edge. All of the cooling holes unused on the pressure side are internally blocked, which causes the slight effect of the hole outlet geometry on the flow field being avoided in the experiment.
The left subplot in Figures 9 to 11 shows the film-
cooling effectiveness distributions on the endwall with main passage film-cooling hole injection when the different swirler
position upstream of the cascades is controlled to be Vane A-aligned, mid-pitch-aligned and Vane B-aligned respectively. The right subplot in Figures 9 to11 shows the film-cooling effectiveness distributions on the endwall with only an upstream slot leakage gap flow. The blowing ratio in all of the cases is fixed as M=1.0. When the swirler is in the Vane A-aligned position, the cooled area is slightly larger in the red curves of the contour, and the cooling effectiveness is uniform on the endwall surface. For the mid-pitch case shown in Figure 10, near the PS corner region, the cooled area is smaller. When the swirler is in mid-pitch position, an apparently unprotected area can be found near the PS corner region, and this area is covered by the endwall cooling hole injection in the other two cases where the swirler is facing the vanes. The right subplot in Figure 11 shows the film-cooling effectiveness distributions on the endwall with only leakage gap flows when the swirler is located in the Vane B-aligned position. Differently from the Vane A-aligned and mid-pitch-aligned cases, the high film-cooling effectiveness area near the PS stagnation region (Vane A) is obviously larger than the other two cases, whereas the film-cooling effectiveness in the mid-pitch and Vane B stagnation regions is very low.
Although valuable insight can be obtained from the
distribution maps (Figures 9 to 11), the spanwise averaged plots (Figures 12 to 14) offer additional insight and provide clear comparisons for large amounts of data. The effectiveness is averaged from the SS to the PS (Figures 9 to 11) of the passage in the axial chord direction. The data outside the airfoil was deleted from the averaged results. The peaks in the plot correspond to the film-cooling holes’ location. Figures 12 to 14 indicate that, with different swirler positions, the endwall film-cooling effectiveness changes noticeably at the upstream half area. The largest film-cooling effectiveness difference appears at Cax=-0.12 where the slot is located. The averaged results of Vane A-aligned and mid-pitch-aligned cases are significantly higher because the coolant injected from the slot covers the endwall sufficiently, especially near the Vane B corner region and the middle-pitch area. The rotating flow effect is clearly seen on the upstream half (axial chord position between -0.12 and 0.6) of the endwall.
VaneA M=full i= 0deg
Z/Z P
X/C ax
1
2
3
0 0.2 0.4 0.6 0.8 1
-0.4
-0.2
0
0.2
0.4
0.6
0.8
1 0 0.2 0.4 0.6 0.8
VaneA M=slot i= 0deg
Z/Z P
X/C ax
1
2
3
0 0.2 0.4 0.6 0.8 1
-0.4
-0.2
0
0.2
0.4
0.6
0.8
1 0 0.2 0.4 0.6 0.8
Figure 9 FILM-COOLING EFFECTIVENESS DISTRIBUTION ON ENDWALL (THE SWIRLER POSITION IS VANE A-ALIGNED, WITH AND WITHOUT
Vane B
Vane A

8
ENDWALL FILM-COOLING HOLE INJECTION, VANE A AND VANE B ARE MARKED IN FIGURE 9)
MidPitch M=full i= 0deg
Z/Z P
X/C ax
1
2
3
0 0.2 0.4 0.6 0.8 1
-0.4
-0.2
0
0.2
0.4
0.6
0.8
1 0 0.2 0.4 0.6 0.8
MidPitch M=slot i= 0deg
Z/Z P
X/C ax
1
2
3
0 0.2 0.4 0.6 0.8 1
-0.4
-0.2
0
0.2
0.4
0.6
0.8
1 0 0.2 0.4 0.6 0.8
Figure 10 FILM-COOLING EFFECTIVENESS DISTRIBUTION ON ENDWALL (THE SWIRLER POSITION IS MID PITCH ALIGNED, WITH AND WITHOUT ENDWALL FILM COOLING HOLES INJECTION)
VaneB M=full i= 0deg
Z/Z P
X/C ax
1
2
3
0 0.2 0.4 0.6 0.8 1
-0.4
-0.2
0
0.2
0.4
0.6
0.8
1 0 0.2 0.4 0.6 0.8
VaneB M=slot i= 0deg
Z/Z P
X/C ax
1
2
3
0 0.2 0.4 0.6 0.8 1
-0.4
-0.2
0
0.2
0.4
0.6
0.8
1 0 0.2 0.4 0.6 0.8
Figure 11 FILM-COOLING EFFECTIVENESS DISTRIBUTION ON ENDWALL (THE SWIRLER POSITION IS VANE B-ALIGNED, WITH AND WITHOUT ENDWALL FILM-COOLING HOLE INJECTION)
Baseline M=full i= 0deg
Z/Z P
X/C ax
1
2
3
0 0.2 0.4 0.6 0.8 1
-0.4
-0.2
0
0.2
0.4
0.6
0.8
1 0 0.2 0.4 0.6 0.8
Baseline M=slot i= 0deg
Z/Z P
X/C ax
1
2
3
0 0.2 0.4 0.6 0.8 1
-0.4
-0.2
0
0.2
0.4
0.6
0.8
1 0 0.2 0.4 0.6 0.8
Figure 12 FILM-COOLING EFFECTIVENESS DISTRIBUTION ON ENDWALL (BASELINE CASE WITHOUT SWIRLER, WITH AND WITHOUT ENDWALL FILM COOLING HOLES INJECTION)
-0.2 0 0.2 0.4 0.6 0.8 1 1.20
0.1
0.2
0.3
0.4
0.5
0.6
0.7
0.8
e
ndw
all
X/C ax
i= 0deg M=full VaneAi= 0deg M=full MidPitchi= 0deg M=full VaneBi= 0deg M=full Baseline
Figure 13 LATERALLY AVERAGED FILM-COOLING EFFECTIVENESS ON THE ENDWALL WITH FILM COOLING HOLE INJECTION(THE BLOWING RATIO IS 1.0, WITH ROTATING FLOW AT THREE RELATIVE POSITIONS, VANE A AND VANE B ARE MARKED IN FIGURE 9)
-0.2 0 0.2 0.4 0.6 0.8 1 1.20
0.1
0.2
0.3
0.4
0.5
0.6
0.7
0.8
e
ndw
all
X/C ax
i= 0deg M=slot VaneAi= 0deg M=slot MidPitchi= 0deg M=slot VaneBi= 0deg M=slot Baseline
Figure 14 LATERALLY AVERAGED FILM-COOLING EFFECTIVENESS ON THE ENDWALL WITHOUT FILM COOLING HOLE INJECTION (THE BLOWING RATIO IS 1.0, WITH ROTATING FLOW AT THREE RELATIVE POSITIONS)
VaneA M=full i= 0deg
Z/Z P
X/C ax0.1 0.2 0.3
0.6
0.7
0.8
0.9
10 0.1 0.2 0.3 0.4
Figure 15 FILM-COOLING EFFECTIVENESS DISTRIBUTION NEAR THE PRESSURE SIDE GILL REGION WITH ENDWALL FILM-COOLING HOLE INJECTION (THE BLOWING RATIO IS 1.0, WITH THE ROTATING FLOW POSITION VANE A-ALIGNED)

9
MidPitch M=full i= 0deg
Z/Z P
X/C ax0.1 0.2 0.3
0.6
0.7
0.8
0.9
10 0.1 0.2 0.3 0.4
Figure 16 FILM-COOLING EFFECTIVENESS DISTRIBUTION NEAR THE PRESSURE SIDE GILL REGION WITH ENDWALL FILM-COOLING HOLE INJECTION (THE BLOWING RATIO IS 1.0, WITH THE ROTATING FLOW POSITION MID PITCH-ALIGNED)
VaneB M=full i= 0deg
Z/Z P
X/C ax0.1 0.2 0.3
0.6
0.7
0.8
0.9
10 0.1 0.2 0.3 0.4
Figure 17 FILM-COOLING EFFECTIVENESS DISTRIBUTION NEAR THE PRESSURE SIDE GILL REGION WITH ENDWALL FILM-COOLING HOLE INJECTION (THE BLOWING RATIO IS 1.0, WITH THE ROTATING FLOW POSITION VANE B-ALIGNED)
0 0.1 0.2 0.3 0.4 0.5 0.6 0.7 0.8 0.9 10
0.2
0.4
0.6
0.8
1
1.2
1.4
1.6
1.8
2
SS
PS
S
treL
ocat
ion
1
Z/Pitch
i= 0deg M=full VaneAi= 0deg M=full MidPitchi= 0deg M=full VaneBi= 0deg M=full Baseline
0 0.05 0.10
0.2
0.4
near SS0.9 0.95 10
0.1
0.2
0.3
near PS
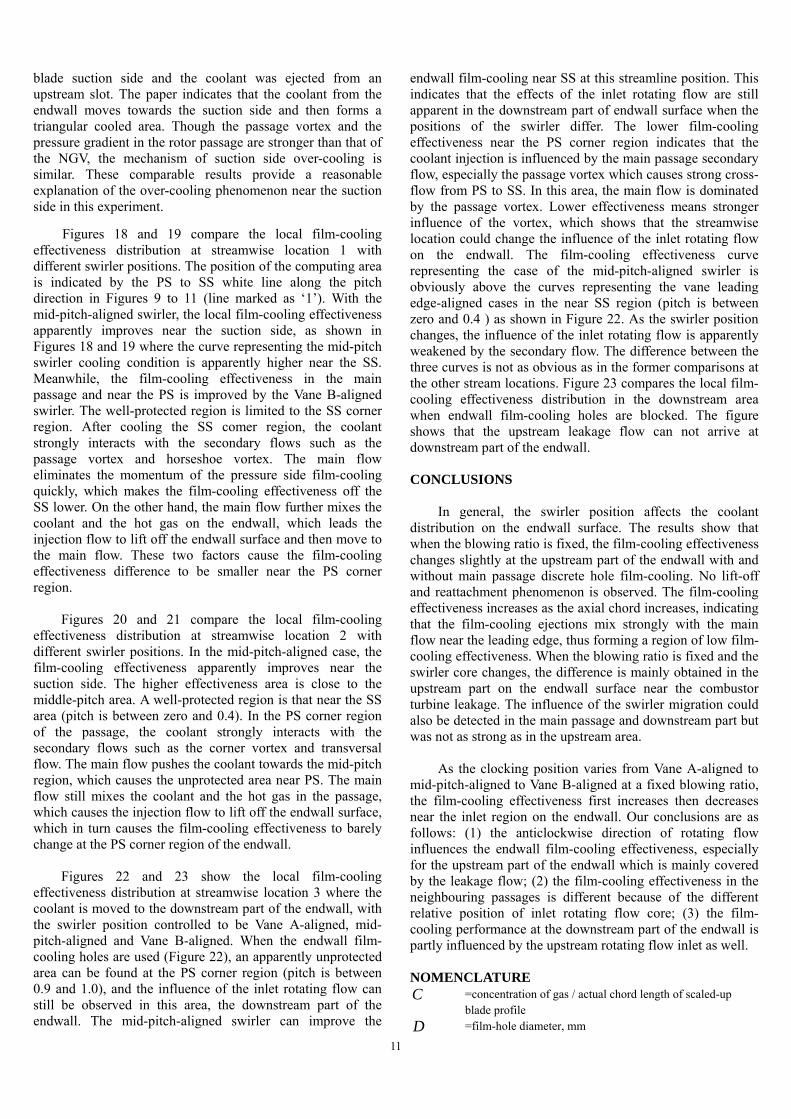
Figure 18 LOCAL FILM-COOLING EFFECTIVENESS DISTRIBUTION ON THE ENDWALL WITH ENDWALL FILM COOLING HOLE INJECTION AT STREAMWISE LOCATION 1 (THE BLOWING RATIO IS 1.0, WITH ROTATING FLOW AT THREE RELATIVE POSITIONS , Cax=-0.12, LOCATION 1 IS IN FIGURES 9-11, VANE A AND VANE B ARE MARKED IN FIGURE 9)
0 0.1 0.2 0.3 0.4 0.5 0.6 0.7 0.8 0.9 10
0.2
0.4
0.6
0.8
1
1.2
1.4
1.6
1.8
2
SS
PS
S
treL
ocat
ion
1
Z/Pitch
i= 0deg M=slot VaneAi= 0deg M=slot MidPitchi= 0deg M=slot VaneBi= 0deg M=slot Baseline
0 0.05 0.10
0.2
0.4
near SS0.9 0.95 10
0.1
0.2
0.3
near PS
Figure 19 LOCAL FILM-COOLING EFFECTIVENESS DISTRIBUTION ON THE ENDWALL WITHOUT ENDWALL FILM COOLING HOLE INJECTION AT STREAMWISE LOCATION 1 (THE BLOWING RATIO IS 1.0, WITH ROTATING FLOW AT THREE RELATIVE POSITIONS , Cax=-0.12, LOCATION 1 IS IN FIGURES 9-11)
With the endwall film-cooling, the momentum of the
coolant is high enough to cover the endwall surface though the cooled area near PS is limited to a small region as shown by the red curves. The inlet rotating flow position, however, can significantly influence the passage vortex then influence the local blowing ratio of near PS film-cooling hole. In the Vane A-aligned and Vane B-aligned cases a higher local blowing ratio leads to more coolant being injected from the endwall cooling holes near the PS corner region such that the cooled area becomes wider on the endwall (represented by red curves in Figures 15 to 17; one film-cooling hole is located near the pressure side). As the coolant leaves the cooling holes, the trace of the injection flow is led by the corner vortex developing near the leading-edge pressure side. The vortex is strong at the junction region, which causes the boundary of the coolant to move along the corner vortex towards the main passage. The film-cooling effectiveness distributions indicate that the cooling performance of near the PS hole is enough to cool the high pressure area. With a proper swirler position such as leading edge-aligned (Vane A or B), the injection can cover the area near the pressure side combined with the leakage flow from the upstream slot, whereas the corner region is still exposed to the hot environment when the blowing ratio swirler is facing the middle-pitch area. Vane A- or Vane B-aligned swirler positions could obviously improve the cooling effectiveness near PS, so the performance near the corner region is satisfied by the proper design of the swirler position.
Figures 9 to 11 and Figures 12 to 14 indicate the difference in film-cooling effectiveness distribution in the upstream and downstream areas of the endwall. When the swirler position is Vane A-aligned, as shown in Figures 9 and 15, the injection is uniform and can sufficiently cover the endwall surface, especially at the inlet and near pressure side region. Yet in the Vane B-aligned case, shown in Figures 11 and 17, the coolant can hardly inject near the Vane B

10
stagnation line and middle-pitch region (pitch between 0.0 and 0.6, axial chord between -0.12 and zero; the leakage gap is located upstream of the cascades). This phenomenon shows that in the Vane B-aligned case, the leakage flow cannot overcome the rotating inlet flow factor in this area where the corner vortex and secondary flow weaken the Vane B stagnation line and middle-pitch area film-cooling. This condition obviously changes in the mid-pitch-aligned case, as shown in Figures 10 and 16. When the swirler position is mid-pitch, the coolant can inject near the Vane B leading edge and cooling holes near the middle-pitch area, whereas the film-cooling effectiveness is low near the Vane A pressure side, especially at the leading edge. This indicates that the endwall film-cooling is sensitive to the swirler position. Figure 14 shows the behaviour of the injection flow near the Vane A pressure side is apparently influenced by the inlet rotating flow condition. The coolant from the near pressure side cooling hole moves along the passage vortex and then is mixed with the main passage cooling flow which causes the film-cooling effectiveness near the pressure side to be lower, especially in the mid-pitch-aligned case.
0 0.1 0.2 0.3 0.4 0.5 0.6 0.7 0.8 0.9 10
0.2
0.4
0.6
0.8
1
1.2
1.4
1.6
1.8
2
SS
PS
S
treL
ocat
ion
2
Z/Pitch
i= 0deg M=full VaneAi= 0deg M=full MidPitchi= 0deg M=full VaneBi= 0deg M=full Baseline
0 0.05 0.10
0.2
0.4
near SS0.9 0.95 10
0.1
0.2
0.3
near PS
Figure 20 LOCAL FILM-COOLING EFFECTIVENESS DISTRIBUTION ON THE ENDWALL WITH ENDWALL FILM COOLING HOLE INJECTION AT STREAMWISE LOCATION 2 (THE BLOWING RATIO IS 1.0, WITH ROTATING FLOW AT THREE RELATIVE POSITIONS , Cax=0.13, LOCATION 2 IS IN FIGURES 9-11, VANE A AND VANE B ARE MARKED IN FIGURE 9)
0 0.1 0.2 0.3 0.4 0.5 0.6 0.7 0.8 0.9 10
0.2
0.4
0.6
0.8
1
1.2
1.4
1.6
1.8
2
SS
PS
S
treL
ocat
ion
2
Z/Pitch
i= 0deg M=slot VaneAi= 0deg M=slot MidPitchi= 0deg M=slot VaneBi= 0deg M=slot Baseline
0 0.05 0.10
0.2
0.4
near SS0.9 0.95 10
0.1
0.2
0.3
near PS
Figure 21 LOCAL FILM-COOLING EFFECTIVENESS DISTRIBUTION ON THE
ENDWALL WITHOUT ENDWALL FILM COOLING HOLE INJECTION AT STREAMWISE LOCATION 2 (THE BLOWING RATIO IS 1.0, WITH ROTATING FLOW AT THREE RELATIVE POSITIONS , Cax=0.13, LOCATION 2 IS IN FIGURES 9-11)
0 0.1 0.2 0.3 0.4 0.5 0.6 0.7 0.8 0.9 10
0.2
0.4
0.6
0.8
1
1.2
1.4
1.6
1.8
2
SS
PS
S
treL
ocat
ion
3
Z/Pitch
i= 0deg M=full VaneAi= 0deg M=full MidPitchi= 0deg M=full VaneBi= 0deg M=full Baseline
0 0.05 0.10
0.2
0.4
near SS0.9 0.95 10
0.1
0.2
0.3
near PS
Figure 22 LOCAL FILM-COOLING EFFECTIVENESS DISTRIBUTION ON THE ENDWALL WITH ENDWALL FILM COOLING HOLE INJECTION AT STREAMWISE LOCATION 3 (THE BLOWING RATIO IS 1.0, WITH ROTATING FLOW AT THREE RELATIVE POSITIONS , Cax=0.71, LOCATION 3 IS IN FIGURES 9-11, VANE A AND VANE B ARE MARKED IN FIGURE 9)
0 0.1 0.2 0.3 0.4 0.5 0.6 0.7 0.8 0.9 10
0.2
0.4
0.6
0.8
1
1.2
1.4
1.6
1.8
2 S
S
PS
S
treL
ocat
ion
3
Z/Pitch
i= 0deg M=slot VaneAi= 0deg M=slot MidPitchi= 0deg M=slot VaneBi= 0deg M=slot Baseline
0 0.05 0.10
0.2
0.4
near SS0.9 0.95 10
0.1
0.2
0.3
near PS
Figure 23 LOCAL FILM-COOLING EFFECTIVENESS DISTRIBUTION ON THE ENDWALL WITHOUT ENDWALL FILM COOLING HOLE INJECTION AT STREAMWISE LOCATION 3 (THE BLOWING RATIO IS 1.0, WITH ROTATING FLOW AT THREE RELATIVE POSITIONS , Cax=0.71, LOCATION 3 IS IN FIGURES 9-11)
The phenomenon captured in this experiment has a close
relationship with the secondary flow field in the turbine cascade. Previous literature provide important supporting material. The research by Rehder and Dannhauer [18] indicates that the coolant flow has an apparent influence on the three-dimensional flow field of the turbine passage. The flow visualisation experiment shows that the moving trace of the passage vortex is from the pressure side to the suction side. The passage vortex, as well as the pressure gradient in the cascade, can simultaneously force the coolant on the endwall to move onto the airfoil suction side. Similar results were found in the research report by Papa and colleagues [10]. They captured the phantom cooling phenomenon on the rotor
11
blade suction side and the coolant was ejected from an upstream slot. The paper indicates that the coolant from the endwall moves towards the suction side and then forms a triangular cooled area. Though the passage vortex and the pressure gradient in the rotor passage are stronger than that of the NGV, the mechanism of suction side over-cooling is similar. These comparable results provide a reasonable explanation of the over-cooling phenomenon near the suction side in this experiment.
Figures 18 and 19 compare the local film-cooling effectiveness distribution at streamwise location 1 with different swirler positions. The position of the computing area is indicated by the PS to SS white line along the pitch direction in Figures 9 to 11 (line marked as ‘1’). With the mid-pitch-aligned swirler, the local film-cooling effectiveness apparently improves near the suction side, as shown in Figures 18 and 19 where the curve representing the mid-pitch swirler cooling condition is apparently higher near the SS. Meanwhile, the film-cooling effectiveness in the main passage and near the PS is improved by the Vane B-aligned swirler. The well-protected region is limited to the SS corner region. After cooling the SS comer region, the coolant strongly interacts with the secondary flows such as the passage vortex and horseshoe vortex. The main flow eliminates the momentum of the pressure side film-cooling quickly, which makes the film-cooling effectiveness off the SS lower. On the other hand, the main flow further mixes the coolant and the hot gas on the endwall, which leads the injection flow to lift off the endwall surface and then move to the main flow. These two factors cause the film-cooling effectiveness difference to be smaller near the PS corner region.
Figures 20 and 21 compare the local film-cooling
effectiveness distribution at streamwise location 2 with different swirler positions. In the mid-pitch-aligned case, the film-cooling effectiveness apparently improves near the suction side. The higher effectiveness area is close to the middle-pitch area. A well-protected region is that near the SS area (pitch is between zero and 0.4). In the PS corner region of the passage, the coolant strongly interacts with the secondary flows such as the corner vortex and transversal flow. The main flow pushes the coolant towards the mid-pitch region, which causes the unprotected area near PS. The main flow still mixes the coolant and the hot gas in the passage, which causes the injection flow to lift off the endwall surface, which in turn causes the film-cooling effectiveness to barely change at the PS corner region of the endwall.
Figures 22 and 23 show the local film-cooling effectiveness distribution at streamwise location 3 where the coolant is moved to the downstream part of the endwall, with the swirler position controlled to be Vane A-aligned, mid-pitch-aligned and Vane B-aligned. When the endwall film-cooling holes are used (Figure 22), an apparently unprotected area can be found at the PS corner region (pitch is between 0.9 and 1.0), and the influence of the inlet rotating flow can still be observed in this area, the downstream part of the endwall. The mid-pitch-aligned swirler can improve the
endwall film-cooling near SS at this streamline position. This indicates that the effects of the inlet rotating flow are still apparent in the downstream part of endwall surface when the positions of the swirler differ. The lower film-cooling effectiveness near the PS corner region indicates that the coolant injection is influenced by the main passage secondary flow, especially the passage vortex which causes strong cross-flow from PS to SS. In this area, the main flow is dominated by the passage vortex. Lower effectiveness means stronger influence of the vortex, which shows that the streamwise location could change the influence of the inlet rotating flow on the endwall. The film-cooling effectiveness curve representing the case of the mid-pitch-aligned swirler is obviously above the curves representing the vane leading edge-aligned cases in the near SS region (pitch is between zero and 0.4 ) as shown in Figure 22. As the swirler position changes, the influence of the inlet rotating flow is apparently weakened by the secondary flow. The difference between the three curves is not as obvious as in the former comparisons at the other stream locations. Figure 23 compares the local film-cooling effectiveness distribution in the downstream area when endwall film-cooling holes are blocked. The figure shows that the upstream leakage flow can not arrive at downstream part of the endwall. CONCLUSIONS
In general, the swirler position affects the coolant
distribution on the endwall surface. The results show that when the blowing ratio is fixed, the film-cooling effectiveness changes slightly at the upstream part of the endwall with and without main passage discrete hole film-cooling. No lift-off and reattachment phenomenon is observed. The film-cooling effectiveness increases as the axial chord increases, indicating that the film-cooling ejections mix strongly with the main flow near the leading edge, thus forming a region of low film-cooling effectiveness. When the blowing ratio is fixed and the swirler core changes, the difference is mainly obtained in the upstream part on the endwall surface near the combustor turbine leakage. The influence of the swirler migration could also be detected in the main passage and downstream part but was not as strong as in the upstream area.
As the clocking position varies from Vane A-aligned to mid-pitch-aligned to Vane B-aligned at a fixed blowing ratio, the film-cooling effectiveness first increases then decreases near the inlet region on the endwall. Our conclusions are as follows: (1) the anticlockwise direction of rotating flow influences the endwall film-cooling effectiveness, especially for the upstream part of the endwall which is mainly covered by the leakage flow; (2) the film-cooling effectiveness in the neighbouring passages is different because of the different relative position of inlet rotating flow core; (3) the film-cooling performance at the downstream part of the endwall is partly influenced by the upstream rotating flow inlet as well.
NOMENCLATURE C =concentration of gas / actual chord length of scaled-up
blade profile
D =film-hole diameter, mm

12
i =incidence angle
I =light intensity
L =length of film hole, mm
M =blowing ratio, ρcVc/ρ∞V∞ & Measurement Condition
Ma =Mach number
PS =pressure side
P =partial pressure
PSP =pressure-sensitive paint Re =Reynolds number
SS =suction side
TE =Trailing edge
V =velocity, m/s
X , Z =Cartesian coordinate system =film-cooling effectiveness
Subscripts aw =adiabatic air =air condition ax =axial chord blk =background value c =coolant fluid in =inlet mix =mixture condition O2 =pure oxygen ratio =partial pressure of oxygen ref =reference value sp =spanwise =free stream condition REFERENCES [1] Khanal, B., He, L., 2012. “Analysis of Radial Migration
of Hot-Streak in Swirling Flow through HP Turbine Stage”. In ASME Turbo Expo 2012, Copenhagen, Denmark, ASME Paper No. GT2012-68983.
[2] Qureshi, I., Smith, A., Povey, T., 2011. “Analysis of Radial Migration of Hot-Streak in Swirling Flow through HP Turbine Stage”. In ASME Turbo Expo 2011, Vancouver, British Columbia, Canada, ASME Paper No. GT2011-46037.
[3] Qureshi, I., Beretta, A., Chana, K., Povey, T., 2011. “Effect of Aggressive Inlet Swirl on Heat Transfer and Aerodynamics in an Unshrouded Transonic HP Turbine”. In ASME Turbo Expo 2011, Vancouver, British Columbia, Canada, ASME Paper No. GT2011-46038.
[4] Khanal, B., He, L., Northall, J., Adami, P., 2012. “Unsteady Aerothermal Behaviour of HP Turbine Stage under Influence of Combustor Jot Streak and Swirl”. In The 13th International Symposium on Unsteady Aerodynamics, Aeroacoustics and Aeroelasticity of Turbomachines, University of Tokyo, Japan.
[5] Zhang, L., Jaiswal, R.S., 2001. “Turbine Nozzle Endwall
Film Cooling Study Using Pressure-Sensitive Paint”,
ASME Journal of Turbomachinery, 123, pp.730–738. [6] Zhang, L., Moon, H.K., 2003. “Turbine Nozzle Endwall
Inlet Film Cooling: The Effect of a Back-Facing Step”. In ASME Turbo Expo 2003, collated with the 2003 International Joint Power Generation Conference, Atlanta, ASME Paper No.GT2003–38319.
[7] Wright, L.M., Gao, Z., Varvel, T.A., and Han, J.C., 2005. “Assessment of Steady State PSP, TSP, and IR Measurement Techniques for Flat Plate Film Cooling”. In ASME 2005 Summer Heat Transfer Conference, ASME Paper No.HT2005–72363.
[8] Wright, L.M., Blake, S., Han, J.C., 2006. “Effectiveness Distributions on Turbine Blade Cascade Platforms through Simulated Stator-Rotor Seals”. In 9th AIAA/ASME Joint Thermophysics and Heat Transfer Conference, San Francisco, AIAA Paper No.2006–3402.
[9] Gao, Z., Narzary, D., Han, J.C., 2009. “Turbine Blade Platform Film Cooling with Typical Stator-Rotor Purge Flow and Discrete-Hole Film Cooling”. Journal of Turbomachinery, 131, pp.041004/1–11.
[10] Charbonnier, D., Ott, P., Jonsson, M., Cottier, F., Köbke, Th., 2009. “Experimental and Numerical Study of the Thermal Performance of a Film Cooled Turbine Platform”. In ASME Turbo Expo 2009: Power for Land, Sea, and Air, Orlando, ASME Paper No.GT2009-60306.
[11] Gao, Z., Narzary, D., Mhetras, S., Han, J.C., 2009. “Effect of Inlet Flow Angle on Gas Turbine Blade Tip Film Cooling”. Journal of Turbomachinery, 131, pp.031005/1–12.
[12] Yang, H., Gao, Z., Chen, H.C., Han, J.C., Schobeiri, M.T., 2009. “Prediction of Film Cooling and Heat Transfer on a Rotating Blade Platform With Stator-Rotor Purge and Discrete Film-Hole Flows in a 1–1/2 Turbine Stage”. Journal of Turbomachinery, Transactions of the ASME, Vol. 131, October 2009, p. 041003/1–12.
[13] Kost F., Mullaert, A., 2006. “Migration of Film-Coolant from Slot and Hole Ejection at a Turbine Vane Endwall”. ASME Turbo Expo 2006: Power for Land, Sea, and Air (GT2006), Barcelona, Spain, ASME Paper No. GT2006-90355.
[14] Papa, M., Srinivasan, V., Goldstein, R.J, 2010. “Film Cooling Effect of Rotor-stator Purge Flow on Endwall Heat/Mass Transfer”. ASME Turbo Expo 2010: Power for Land, Sea, and Air (GT2010), Glasgow, UK, ASME Paper No.GT2010-23178.
[15] Suryanarayanan, A., Ozturk, B., Schobeiri, M.T., Han, J.C., 2010. “Film-Cooling Effectiveness on a Rotating Turbine Platform Using Pressure Sensitive Paint Technique”. Journal of Turbomachinery, 132, pp.041001/1–13.
[16] Hada, S., Thole, K.A., 2011. “Computational Study of a Midpassage Gap and Upstream Slot on Vane Endwall Film-Cooling”. Journal of Turbomachinery, 133, 011024/1–9.
[17] Knost, D.G., Thole, K.A., 2005. “Adiabatic Effectiveness Measurements of Endwall Film-Cooling for a First-Stage Vane”. Journal of Turbomachinery, 127, 297–305.
[18] Cardwell, N.D., Sundaram, N., Thole, K.A., 2006. “Effect of Midpassage Gap, Endwall Misalignment, and Roughness on Endwall Film-Cooling”. Journal of Turbomachinery, 128, 62–70.
[19] Oke, R.A., Simon, T.W., 2002. “Film Cooling Experiments With Flow Introduced Upstream of a First Stage Nozzle Guide Vane Through Slots of Various Geometries”. ASME Turbo Expo 2002: Power for Land,

13
Sea, and Air (GT2002), Amsterdam, The Netherlands, ASME Paper No. GT2002-30169.
[20] Wright, L.M., Gao, Z., Yang, H, Han, J.C., 2008. “Film Cooling Effectiveness Distribution on a Gas Turbine Blade Platform With Inclined Slot Leakage and Discrete Film Hole Flows”. Journal of Turbomachinery, 130, 071702/1–11.
[21] Rehder, H., Dannhauer, A., 2007. “Experimental Investigation of Turbine Leakage Flows on the Three-Dimensional Flow Field and Endwall Heat Transfer”. Journal of Turbomachinery, 129 , 608–618.
[22] Piggush, J.D., Simon, T.W., 2007. “Heat Transfer Measurements in a First-Stage Nozzle Cascade Having Endwall Contouring: Misalignment and Leakage Studies”. Journal of Turbomachinery, 129, 782–790.