gtap-e: energy environmental version of the gtap model...• effect of removal of fossil fuel and...
TRANSCRIPT

Center for Global Trade AnalysisDepartment of Agricultural Economics, Purdue University403 West State Street, West Lafayette, IN 47907-2056 USA
Global Trade Analysis Project
Stay Connected with GTAP!www.gtap.agecon.purdue.edu
GTAP-E: Energy Environmental Version of the GTAP Model
Instructors: Alla Golub, Robert McDougall
• Sarah Drought, Alex Kravchenko• Effect of removal of fossil fuel and energy subsidies on emissions, welfare,
output and trade• Joe Lane, Cicero Zanetti De Lima
• Chasing the investment:a journey in the wrong direction
• Enkhbayar Shagdar, Mark Staples• Implications of a carbon tax in GTAP-E model
Group Members
2

GTAP-E
• Captures features missing in standard GTAP, including:• Energy-capital substitution• Energy-energy substitution• Emissions accounting – CO2 by combustion
• Mechanism to model emissions trading and carbon taxes and carbon leakage
3

Production Structure: GTAP-E
4
land
cap
coal
gas
o
vaen
labken
nely ely
eny
p_c
ncoal
non-energy commodities
σ = 0.0
σ = 1.2
σ = 0.5
σ = 0.5
σ = 1.0
σ = 1.0

Results: Kyoto targets, partial ETSTarget NEXI u|notr u|tr u|wtr
EU −17 −1.6 −0.12 −0.08 −0.01Jpn −30 −2.0 −0.41 −0.13 −0.03EEFSU +9 +13.5 −0.94 +1.08 −0.09EEx 0 +16.1 −0.61 −0.43 −0.37Chn 0 −1.8 +0.01 +0.01 +0.13
5
Target : (quota – actual) / actual × 100%NEXI : net energy export intensity: exports / Y × 100%u|notr : percentage change in utility, with no tradingu|tr : percentage change in utility, with trading among
Annex 1 countriesu|wtr : percentage change in utility, with worldwide trading
The leakage rate is low (< 7%);

Center for Global Trade AnalysisDepartment of Agricultural Economics, Purdue University403 West State Street, West Lafayette, IN 47907-2056 USA
Global Trade Analysis Project
Stay Connected with GTAP!www.gtap.agecon.purdue.edu
Effect of removal of fossil fuel and energy subsidies on emissions,
welfare, output and tradeSarah Drought, Alex Kravchenko
Disclaimer: The views represented in these presentation notes do not represent official positions or policy of Purdue University or the Center for Global Trade Analysis.
• Effect of removing fossil fuel subsidies ($25 bn)• Global emissions go down by 0.5%, driven by • Driven by countries for which data is good (i.e. India)• Global welfare rises• Global cancer rates drop, happiness index improves, visibility in Beijing
increases by 12.43% (oh wait, not captured by GTAP)
ABSTRACT
7Disclaimer: {Optional -Use this text box to absolve your home institution of any attachment to the views and findings of your presentation}

• Subsidies on fossil fuels total over $200 billion
Motivation
8
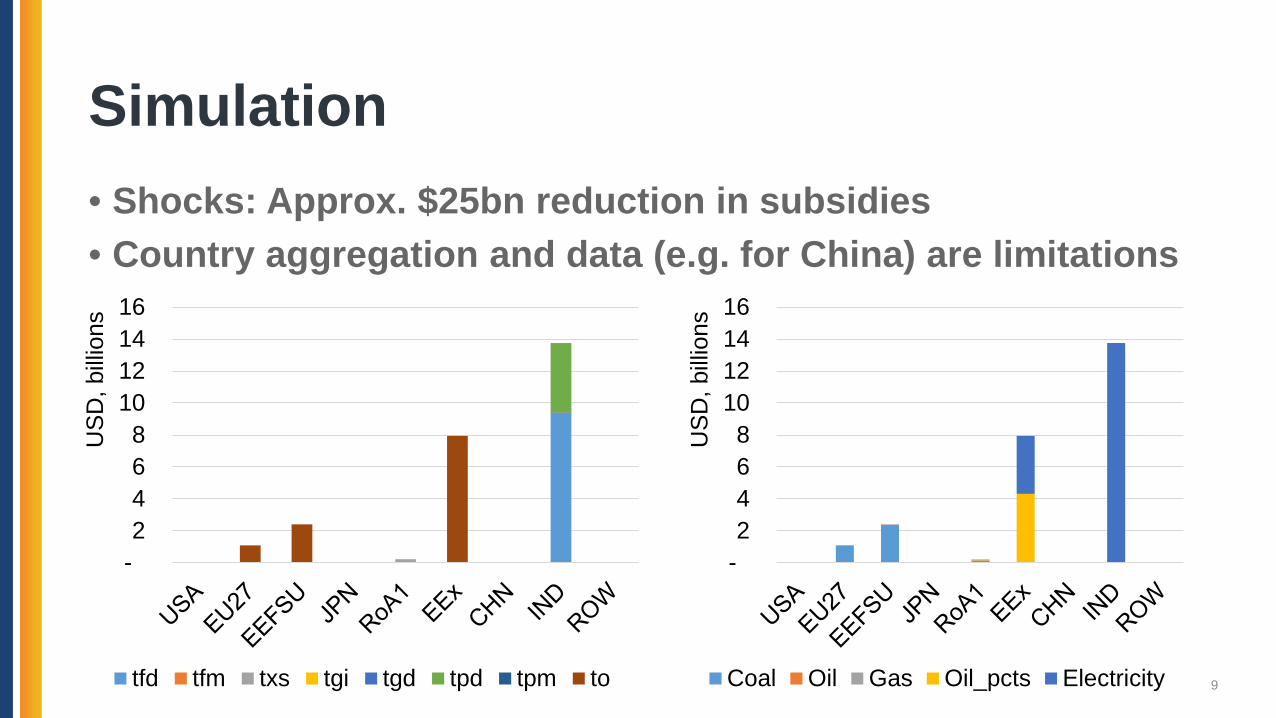
• Shocks: Approx. $25bn reduction in subsidies• Country aggregation and data (e.g. for China) are limitations
Simulation
9
- 2 4 6 8
10 12 14 16
USD
, billi
ons
tfd tfm txs tgi tgd tpd tpm to
- 2 4 6 8
10 12 14 16
USD
, billi
ons
Coal Oil Gas Oil_pcts Electricity

Finding 1: Global emissions fall by 0.5%
10
-14
-12
-10
-8
-6
-4
-2
0
2
4
USA EU27 EEFSU JPN RoA1 EEx CHN IND ROW
CO
2 em
issi
on re
duct
ion,
per
cen
t
coal oil gas oil_pcts

Finding 2: Output in India falls…
11
-16000
-12000
-8000
-4000
0
4000India output by sectorUSD$m

…but GDP in India increases slightly due to X and M
12
-25
-20
-15
-10
-5
0
5
10
USD
, billi
ons
Output (qo)
Agr Coal OilGas Oil_pcts ElectricityEn_Int_ind Oth_ind_ser CGDS
-25
-20
-15
-10
-5
0
5
10
USD
, billi
ons
Exports
Agr Coal Oil GasOil_pcts Electricity En_Int_ind Oth_ind_ser

Finding 3: Welfare rises by $2136m
13
-1500
-1000
-500
0
500
1000
1500
USA EU27 EEFSU JPN RoA1 EEx CHN IND ROW
Allocative Efficiency Terms of Trade 7 IS_F1
Center for Global Trade AnalysisDepartment of Agricultural Economics, Purdue University403 West State Street, West Lafayette, IN 47907-2056 USA
Global Trade Analysis Project
Stay Connected with GTAP!www.gtap.agecon.purdue.edu
Chasing the investmenta journey in the wrong direction
Cicero Lima and Joe Lane
Disclaimer: The views represented in these presentation notes do not represent official positions or policy of Purdue University or the Center for Global Trade Analysis.

• The static-comparative GTAP-E doesn’t characterize renewables, & doesn’t characterize investment
• A substitution of capital for fossil fuel inputs does include the effect of shifting towards fossil-free (& low opex) renewables generation
• In order to consider whether gives us insight into the renewables investment challenge, we considered:
1. What can be learned about capital (& investment…?) required to decarbonize electricity supply?
2. How might the capital (& investment…?) challenges vary under different policy schemes?
ABSTRACT
15Disclaimer: {Optional -Use this text box to absolve your home institution of any attachment to the views and findings of your presentation}

Country / Emission reductionRegion (%) (Mt-CO2) (t-CO2 / pp)
USA -22% 1,124 3.6EU27 -17% 617 1.2Japan -33% 339 2.7RoA1 -17% 178 2.4EEFSU +19% +456 +
Scenarios
16
Shocks
Scenarios1) Carbon price applied internally in each of the 4x reducing regions (no trade; EEFSU excluded)2) Permit trading between each of those 4x regions (EEFSU excluded)3) EEFSU included in the permit trading scheme
land
cap
coal
gas
o
vaen
labken
nely ely
eny
p_c
ncoal
non-energy commodities
σ = 0.0
σ = 1.2
σ = 0.5
σ = 0.5
σ = 1.0
σ = 1.0

-202468
1012141618
0 5 10 15 20 25
% increase in capital
intensity of electricity
sector
% reduction in electricity output (GWh)
-202468
1012141618
0 50 100 150 200 250
% increase in capital
intensity of electricity
sector
private cost of abatement-202468
1012141618
0.0 0.2 0.4 0.6 0.8 1.0 1.2% reduction in total welfare
-2024681012141618
051015initial GHG / electricity output (tCO2 / 1000$)
Results – no trade
17
Japan
USA
Japan
USA
Japan
USA
Japan
USA

-202468
1012141618
0 50 100 150 200 250
% increase in capital
intensity of electricity
sector
sector cost of abatement-202468
1012141618
0 50 100 150 200 250
sector cost of abatement-202468
1012141618
0 50 100 150 200 250
sector cost of abatement
Results – cost of abatement
18
No trade w/ 4 regions w/ 4 reg + EEFSU
Japan
USA USAJapan
Japan
USA
• Trade reduces the abatement cost for countries that required high capital investment for electricity (under the non-trade scenario)
• Equalisation of the capital intensities (of the electricity sector)

Results – reductions in electricity output
19
No trade w/ 4 regions w/ 4 reg + EEFSU
Japan
USA USA
Japan
JapanUSA
• Trade reduces the output & capital changes required for the countries that initially had an electricity system with low-GHG intensity
• Regional distribution of capital intensity change• Can we think of that as a proxy for the distribution of investment challenges…?

Final remarks
20
What can you learn about capital investment to decarbonize electricity supply?• the low carbon scenarios require substantially higher capital intensity in the
electricity sector• proxy for the distribution of challenges with renewables investment…?
How the investment (?) vary under different policy schemes?• Without trade, countries with low-GHG intensity electricity system face
substantially larger challenges• Expanding the trade network greatly reduces the abatement cost for the
more CO2 efficient economies

Center for Global Trade AnalysisDepartment of Agricultural Economics, Purdue University403 West State Street, West Lafayette, IN 47907-2056 USA
Global Trade Analysis Project
Stay Connected with GTAP!www.gtap.agecon.purdue.edu
Implications of a carbon tax in GTAP-E
Mark StaplesEnkhbayar Shagdar
Disclaimer: The views represented in these presentation notes do not represent official positions or policy of Purdue University or the Center for Global Trade Analysis.
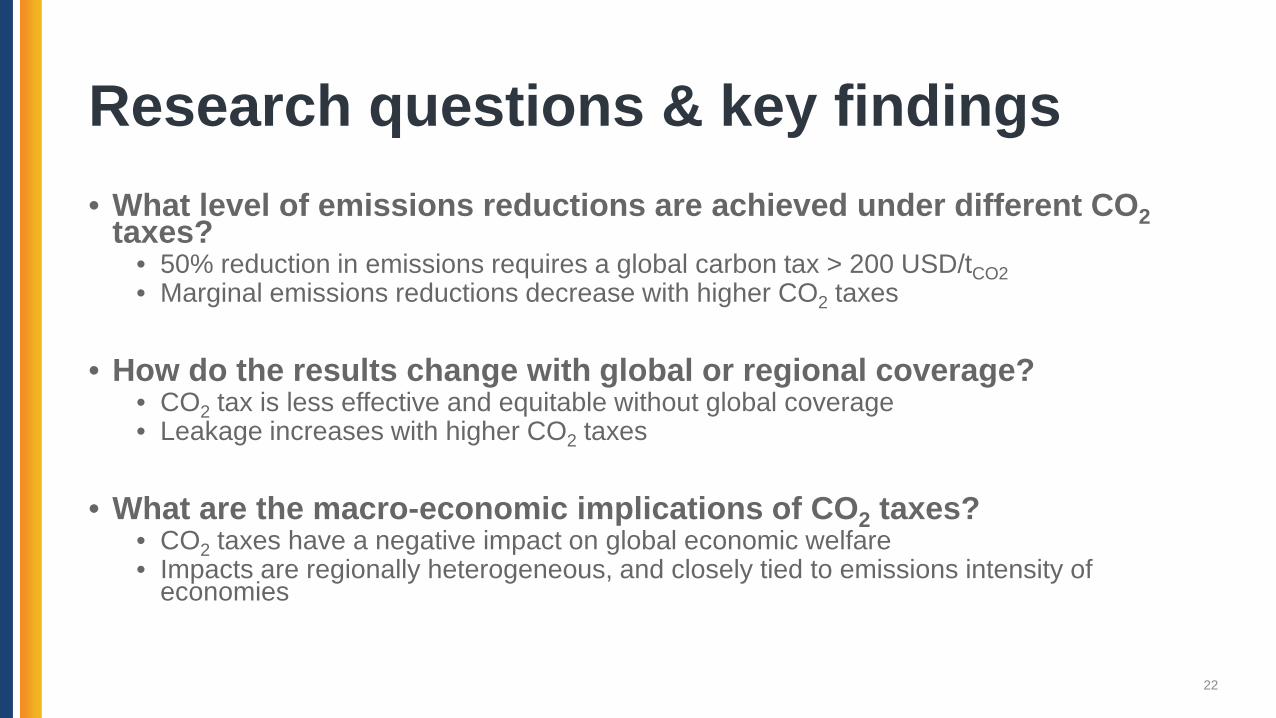
• What level of emissions reductions are achieved under different CO2taxes?• 50% reduction in emissions requires a global carbon tax > 200 USD/tCO2• Marginal emissions reductions decrease with higher CO2 taxes
• How do the results change with global or regional coverage?• CO2 tax is less effective and equitable without global coverage• Leakage increases with higher CO2 taxes
• What are the macro-economic implications of CO2 taxes?• CO2 taxes have a negative impact on global economic welfare• Impacts are regionally heterogeneous, and closely tied to emissions intensity of
economies
Research questions & key findings
22

• GTAP-E baseline indicates Kyoto commitments are possible with abatement costs of 2.1 USD/t CO2
• We explore CO2 tax rates from 2 up to 200 USD/t CO2
• 3 different coverages of the tax are considered
Policy scenarios
23
Annex I excl. EEFSU
Annex I incl. EEFSU
World
Tax coverage

• In the base version of GTAP-E, CO2 quotas (gCO2q) are exogenous, and permit price is endogenous
• We want to reverse this to implement a carbon tax
Implementing a carbon tax in GTAP-E
24
…
!!
Modified closure Example shocks

CO2 reductions vs. carbon tax rate
25
Leakage rate = Inc. CO2 outside of coverage
Dcr. CO2 inside of coverage
5.3%
6.8%
Source: Simulation results
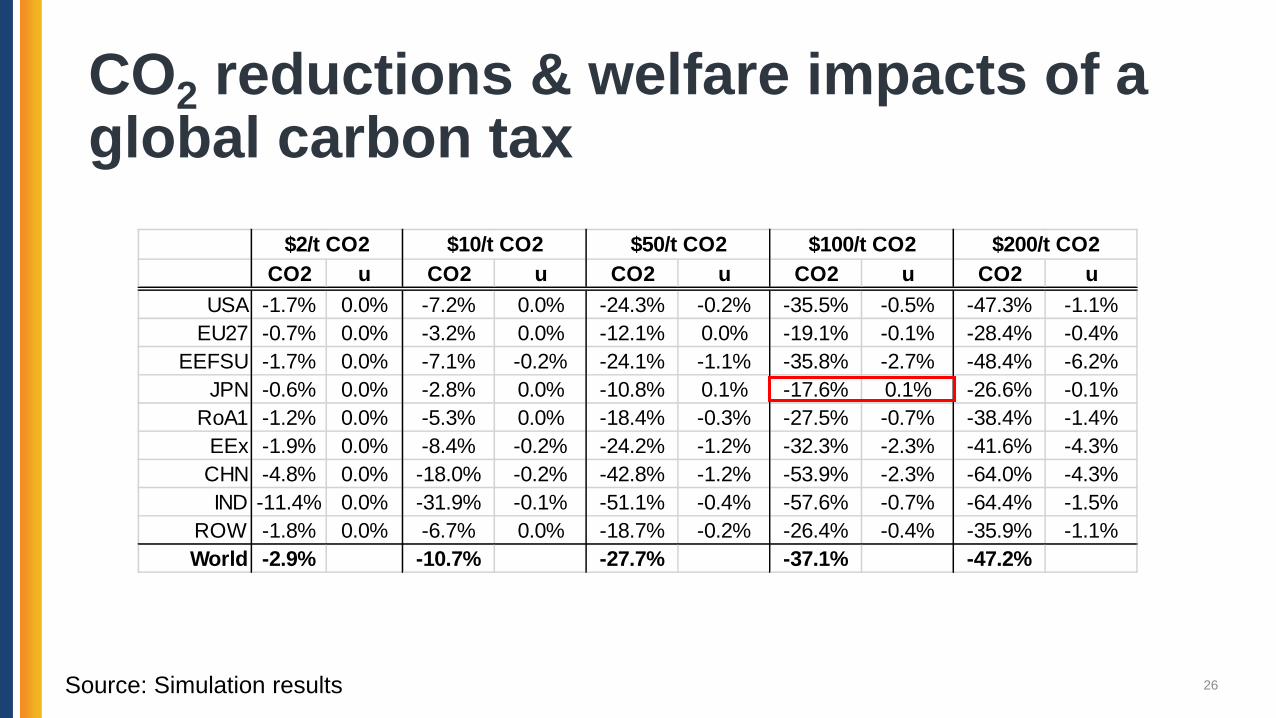
26Source: Simulation results
CO2 reductions & welfare impacts of a global carbon tax
CO2 u CO2 u CO2 u CO2 u CO2 uUSA -1.7% 0.0% -7.2% 0.0% -24.3% -0.2% -35.5% -0.5% -47.3% -1.1%
EU27 -0.7% 0.0% -3.2% 0.0% -12.1% 0.0% -19.1% -0.1% -28.4% -0.4%EEFSU -1.7% 0.0% -7.1% -0.2% -24.1% -1.1% -35.8% -2.7% -48.4% -6.2%
JPN -0.6% 0.0% -2.8% 0.0% -10.8% 0.1% -17.6% 0.1% -26.6% -0.1%RoA1 -1.2% 0.0% -5.3% 0.0% -18.4% -0.3% -27.5% -0.7% -38.4% -1.4%
EEx -1.9% 0.0% -8.4% -0.2% -24.2% -1.2% -32.3% -2.3% -41.6% -4.3%CHN -4.8% 0.0% -18.0% -0.2% -42.8% -1.2% -53.9% -2.3% -64.0% -4.3%IND -11.4% 0.0% -31.9% -0.1% -51.1% -0.4% -57.6% -0.7% -64.4% -1.5%
ROW -1.8% 0.0% -6.7% 0.0% -18.7% -0.2% -26.4% -0.4% -35.9% -1.1%World -2.9% -10.7% -27.7% -37.1% -47.2%
$50/t CO2 $100/t CO2 $200/t CO2$2/t CO2 $10/t CO2

Carbon Intensity (tCO2/USD)
27
0.17 0.21 0.230.33 0.36 0.40
0.48
0.90 0.95 0.99
0
0.2
0.4
0.6
0.8
1
1.2
4 JPN 2 EU27 5 RoA1 1 USA 9 ROW World 6 EEx 3 EEFSU 8 IND 7 CHNSource: Simulation results

1 co2trd 2 alloc_A1 6 tot_E1 7 IS_F1 Total
USA 0.20 (94,165.0) 24,412.0 4,075.0 (65,677.0)
EU27 0.00 (67,022.0) 50,747.0 (920.0) (17,195.0)
EEFSU 0.20 (35,338.0) (29,096.0) 2,401.0 (62,032.0)
JPN 0.00 (15,836.0) 19,574.0 (492.0) 3,245.0
RoA1 0.00 (18,602.0) (7,802.0) (1,141.0) (27,545.0)
Eex 0.00 (40,464.0) (94,062.0) 1,215.0 (133,311.0)
CHN (5.40) (154,579.0) 13,605.0 (3,927.0) (144,907.0)
IND 0.00 (21,272.0) 8,342.0 280.0 (12,651.0)
ROW (0.10) (49,117.0) 13,822.0 (1,496.0) (36,792.0)
Total (5.20) (496,396.0) (459.0) (6.0) (496,866.0)
Welfare decomposition summary
28Source: Simulation results for 100 USD/t CO2

• At higher CO2 taxes:• Marginal emissions reductions decrease• Leakage increases (in the absence of global coverage)
• CO2 tax is less effective and less equitable without global coverage
• CO2 taxes have a negative impact on global economic welfare
• Impacts are regionally heterogeneous, and closely tied to emissions intensity of economies
Conclusions
29

Center for Global Trade AnalysisDepartment of Agricultural Economics, Purdue University403 West State Street, West Lafayette, IN 47907-2056 USA
Global Trade Analysis Project
Stay Connected with GTAP!www.gtap.agecon.purdue.edu
Panel Q&A(All presenters from group)