gtbank annual report 2014
TRANSCRIPT

Guaranty Trust Bank Plc and Subsidiary Companies
Group Financial Statements
Together with Directors’ and Auditor’s Reports
December 2014
GTBank
Guaranty Trust Bank and Subsidiary Companies
Introduction
i
Introduction
Guaranty Trust Bank’s Consolidated Financial Statements complies with the applicable legal requirements of the Nigerian Securities and Exchange Commission regarding Annual Financial Statements and comprises Separate and Consolidated Financial Statements of the Bank and the Group for the year ended 31 December 2014. The consolidated financial statements have been prepared in accordance with International Financial Reporting Standards issued by the International Accounting Standards Board and adopted by the Financial Reporting Council of Nigeria. For better understanding, certain disclosures and some prior year figures have been presented in line with current year figures. Due to rounding, numbers presented throughout this document may not add up precisely to the totals provided and percentages may not precisely reflect the absolute figures.
Guaranty Trust Bank and Subsidiary Companies
Introduction
ii
Table of contents Page
Corporate governance 1-21
Sustainability report 22
Complaints and feedback 23-26
Anti-money laundering and combating terrorist financing framework 27-29
Internal control and risk management systems in relation to the financial reporting 30-32
Directors’ report 33-41
Statement of directors’ responsibilities 42
Report of the audit committee 43 Independent auditor’s report 44 Financial statements 45 Statement of financial position 46-47
Income statement 48 Statement of comprehensive income 49 Consolidated statement of changes in equity 50-51 Statement of changes in equity- parent 52-53
Statement of cash-flows 54-55 Reporting entity 56 Basis of preparation 56 Significant accounting policies 56-62
Other accounting policies 62-84 Financial risk management 85
Credit risk 89-148
Liquidity risk 149-166
Settlement risk 167
Market risk 167-191 Capital management and other risks 192-195 Use of estimates and judgments 195-207
Statement of prudential adjustment 208-209
Guaranty Trust Bank and Subsidiary Companies
Introduction
iii
Operating segments 210-212 Financial assets and liabilities 224-227 Notes to the statement of comprehensive income and the Statement of Financial position 228-302 Contingencies 302-303 Group entities 304-305 Unconsolidated interests in structured entities 306
FINA Bank acquisition 307-308 Related parties 309-315
Regulatory requirements under the IFRS regime 316-321
Operational risk management 322-326
Agents and agents location 327
Activities of cards operations 328-329
Value-added statement 330-331
Five-year financial summary 332-335
Shareholders information 336-337
Corporate social responsibility report 338
Corporate Governance Guaranty Trust Bank and Subsidiary Companies
1
Corporate Governance
Introduction At Guaranty Trust Bank Plc (“the Bank”), we believe that a fundamental purpose of a great company is the creation and delivery of long-term sustainable value in a manner consistent with its principles. The Bank is committed to the highest standards of corporate governance which is a vital facilitator to the creation of value for all our stakeholders. For the Bank corporate governance is not an end in itself but an essential enabler for value creation whilst propagating a values-led culture, high behavioural standards and robust procedures as fundamental tools in the entrenchment of a strong corporate governance framework. In building our corporate governance mantra the Bank’s “Orange rules” of Simplicity, Professionalism, Service, Friendliness, Excellence, Trustworthiness, Social Responsibility and Innovation signify the Bank’s guiding ideologies upon which it was established and remain the foundation upon which we have built and developed our exemplary corporate governance practices. The Bank’s Orange rules are fundamental to our culture and are part of the everyday conduct of the Bank’s business. As a company publicly quoted on the Nigerian Stock Exchange with Global Depositary Receipts (GDRs) listed on the London Stock Exchange, we remain dedicated to our duties and pledge to safeguard and increase investor value through transparent corporate governance practices. The Bank ensures compliance with the Code of Corporate Governance for Public Companies issued by the Securities and Exchange Commission (“the SEC Code”), the revised Code of Corporate Governance for Banks and Discount Houses in Nigeria issued by the Central Bank of Nigeria (“the CBN Code”) in May 2014, as well as disclosure requirements under the Disclosure and Transparency Rules of the Financial Conduct Authority (FCA), United Kingdom, which are applicable to non-United Kingdom companies with Global Depositary Receipts (GDRs) listed on the London Stock Exchange. The Bank’s Code of Corporate Governance is continuously reviewed to align with additional legal and regulatory requirements and global best practices, in order to remain a pace setter in the area of good corporate governance practices. In addition to its Code of corporate governance the Bank aggressively promotes the Bank’s core values to its employees through its Code of Professional Conduct and an Ethics Policy which regulate employee relations with internal and external parties. This is a strong indicator of the Bank’s determination to ensure that its employees remain professional at all times in their business practices. The Bank complies with the requirements of the Central Bank of Nigeria (CBN), for the internal review of its compliance status with defined corporate governance practices and submits reports on the Bank’s compliance status to the CBN and the Nigeria Deposit Insurance Corporation. An annual Board Appraisal is also conducted by an Independent Consultant appointed by the Bank whose report is submitted to the CBN and presented to Shareholders at the Annual General Meeting of the Bank in compliance with the provisions of the CBN Code of Corporate Governance. The Bank has an entrenched culture of openness in which healthy discourse is encouraged and employees are mandated to report improper activities. The Bank continues to serve customers, clients and communities and create returns for stakeholders, we are led by our belief that success is only worth celebrating when achieved the right way through a process supported and sustained with the right values. Our commitment to this principle is the key to keeping public trust and confidence in our Bank and the key to our continued long-term success.
Corporate Governance Guaranty Trust Bank and Subsidiary Companies
2
In the Bank’s bid to continue to evolve best-in-class corporate governance practices and refresh the Board appraisal process, the Board appointed new Independent Consultant, KPMG Professional Services in the course of the year, to carry out the annual Board and Directors appraisal for the 2014 financial year. KPMG Professional Services took over from JK Randle Professional services who had served the Bank meritoriously for six (6) years.
Governance Structure
The Board The Board of Directors is responsible for the governance of the Bank and is accountable to shareholders for creating and delivering sustainable value through the management of the Bank’s business. The Bank has adopted its own corporate governance code to provide a robust framework for the governance of the Board and the Bank which is in addition to the corporate governance codes of applicable regulatory agencies which the Bank is obliged to adopt. Having the right people with an appropriate balance of skills, knowledge and experience is an important aspect of corporate governance in order to continue to have an effective Board and an executive management team to steer the affairs of the Bank in an ever challenging environment. The Bank’s rigorous and robust appointment and effective succession planning framework is one way of ensuring that we continue to have the right people to drive the business in the desired direction. In addition to the Board’s direct oversight, the Board exercises its oversight responsibilities through six (6) Committees, namely, Board Risk Management Committee, Board Credit Committee, Board Human Resources and Nominations Committee, Board Remuneration Committee, Board Information Technology Strategy Committee and the Board Audit Committee which was established in July 2014. The establishment of the Board Audit Committee is in compliance with Section 2.5.1 of the revised CBN Code which stipulates that the Board should set up a committee responsible for the oversight of audit functions. This is without prejudice to the Statutory Audit Committee established in compliance with Companies and Allied Matters Act (2004). The Statutory Audit Committee of the Bank, which comprises equal numbers of representatives of the Board and Shareholders, also performs its statutory role as stipulated by the Companies and Allied Matters Act (2004).
The Board plays a central role in conjunction with Management in ensuring that the Bank is financially strong, well governed and risks are identified and well mitigated. The synergy between the Board and Management further fosters interactive dialogue in setting broad policy guidelines in the management and direction of the Bank to enhance optimal performance and ensure that associated risks are properly managed.
The Bank’s Board is made up of seasoned professionals, who have excelled in their various professions including banking, accounting, pharmacy, engineering, oil and gas as well as law. The Bank’s Directors possess the requisite integrity, skills and experience to bring to bear independent judgment on the deliberations of the Board. The Board comprises fourteen members, eight (8) of whom are Non-Executive Directors (including the Chairman of the Board), while six (6) are Executive Directors. All the Bank’s Directors bring independent judgment to bear on deliberations and decisions of the Board (without prejudice to Directors’ right to earn Directors’ fees and hold interest in shares). They have a good understanding of the Bank’s businesses and affairs to enable them properly evaluate information and responses provided by Management and provide objective challenge to Management. Directors are

Corporate Governance Guaranty Trust Bank and Subsidiary Companies
3
prepared to challenge others’ assumptions, beliefs or viewpoints as necessary for the good of the Bank and question intelligently, debate constructively and make decisions dispassionately. Two (2) of the Non-Executive Directors are “Independent Directors”, appointed based on criteria laid down by the CBN for the appointment of Independent Directors and the core values enshrined in the Bank’s Code of Corporate Governance. Both Independent Directors do not have any significant shareholding interest or any special business relationship with the Bank. The Board meets quarterly and additional meetings are convened as required. Material decisions may be taken between meetings by way of written resolutions, as provided for in the Articles of Association of the Bank. The Directors are provided with comprehensive group information at each of the quarterly Board meetings and are also briefed on business developments between Board meetings. The Board met four times during the financial year ended December 31, 2014.
Responsibilities of the Board The Board determines the strategic objectives and policies of the Bank to deliver long-term value by providing overall strategic direction within a framework of rewards, incentives and controls. The Board also ensures that Management strikes an appropriate balance between promoting long-term growth and delivering short-term objectives. In fulfilling its primary responsibility, the Board is aware of the importance of achieving a balance between conformance to governance principles and economic performance. Powers reserved for the Board include the approval of quarterly, half-yearly and full year financial statements (whether audited or unaudited) and any significant change in accounting policies and/or practices; approval of major changes to the Bank’s corporate structure and changes relating to the Bank’s capital structure or its status as a public limited company; the determination and approval of the strategic objectives and policies of the Bank to deliver long-term value; approval of the Bank’s strategy, medium and short term plan and its annual operating and capital expenditure budget; appointment or removal of Company Secretary; recommendation to shareholders of the appointment or removal of auditors and the remuneration of Auditors; approval of resolutions and corresponding documentation for shareholders in general meeting(s), shareholders circulars, prospectus and principal regulatory filings with the regulators. Other powers reserved for the Board are the determination of Board structure, size and composition, including appointment and removal of Directors, succession planning for the Board and senior management and Board Committee membership; approval of mergers and acquisitions, branch expansion and establishment of subsidiaries; approval of remuneration policy and packages of the Managing Director and other Board members, appointment of the Managing Director and other Directors of subsidiaries nominated by the Bank; approval of the Board performance evaluation process, corporate governance framework and review of the performance of the Managing Director; approval of policy documents on significant issues including Enterprise-wide Risk Management, Human Resources, Credit, Corporate governance and Anti – Money laundering, and approval of all matters of importance to the Bank as a whole because of their strategic, financial, risk or reputational implications or consequences. Roles of Chairman and Chief Executive The roles of the Chairman and Chief Executive are separate and no one individual combines the two positions. The Chairman’s main responsibility is to lead and manage the Board to ensure that it operates

Corporate Governance Guaranty Trust Bank and Subsidiary Companies
4
effectively and fully discharges its legal and regulatory responsibilities. The Chairman is responsible for ensuring that Directors receive accurate, timely and clear information to enable the Board take informed decisions and provide advice to promote the success of the Bank. The Chairman also facilitates the contribution of Directors and promotes effective relationships and open communications between Executive and Non-Executive Directors, both inside and outside the Boardroom. The Board has delegated the responsibility for the day-to-day management of the Bank to the Managing Director/Chief Executive Officer, who is supported by Executive Management, comprising the Deputy Managing Director and other Executive Directors. The Managing Director executes the powers delegated to him in accordance with guidelines approved by the Board of Directors. Executive Management is accountable to the Board for the development and implementation of strategies and policies. The Board regularly reviews group performance, matters of strategic concern and any other matter it regards as material.
Director Nomination Process The Board Human Resources and Nominations Committee is charged with the responsibility of leading the process for Board appointments and for identifying and nominating suitable candidates for the approval of the Board.
The balance and mix of appropriate skills and experience of Non-Executive Directors is taken into account when considering a proposed appointment. In reviewing Board composition, the Board ensures a mix with representatives from different industry sectors. The following core values are considered critical in nominating a new Director; (i) Integrity (ii) Professionalism (iii) Career Success (iv) Recognition (v) Ability to add value to the Bank. Shareholding in the Bank is not considered a criterion for the nomination or appointment of a Director. The appointment of Directors is subject to the approval of the shareholders and the Central Bank of Nigeria. Induction and Continuous Training On appointment to the Board and to Board Committees, all Directors receive an induction tailored to meet their individual requirements. The induction, which is arranged by the Company Secretary, may include meetings with senior management staff and key external advisors, to assist Directors in building a detailed understanding of the Bank’s operations, its strategic plan, its business environment, the key issues the Bank faces, and to introduce Directors to their fiduciary duties and responsibilities.
Training and education of Directors on issues pertaining to their oversight functions is a continuous process, in order to update their knowledge and skills and keep them informed of new developments in the Bank’s business and operating environment. The Bank attaches great premium to training its Directors; the Bank’s eight (8) Non-Executive Directors attended foreign and/or local courses during the course of the 2014 financial year.
Corporate Governance Guaranty Trust Bank and Subsidiary Companies
5
Changes on the Board During the year under review, Dr. (Mrs.) S. C. Okoli retired from the Board upon attaining the age of seventy (70) years in July, 2014. She joined the Board of the Bank in June 2010 and became the Chairman of the Board Risk Management Committee in 2013, a position she held until her retirement. She was also a member of the Board Human Resources and Nominations Committee. The Board appointed Mr. Hezekiah Adesola Oyinlola as a Non-Executive Director to fill the vacancy created on the Board by Dr. (Mrs.) Okoli’s retirement. The appointment of Mr. Oyinlola has been approved by the Central Bank of Nigeria and will be presented for shareholders’ approval at the 25th Annual General Meeting of the Bank. Profile of Mr. Oyinlola Mr. Oyinlola holds a B.Sc Accounting (First Class Hons.) degree in Accounting (1979) from the University of Ghana, Legon and an MBA from the Stanford University, Graduate School of Business, Stanford, U.S.A. He is a seasoned professional with over thirty (30) years’ work experience in the Oil and Gas industry, having worked with Schlumberger Group from 1984 till date. He has at various times served in management capacity, including being the first Nigerian Managing Director of Schlumberger Group in Nigeria and rose through the ranks to become the Chairman Africa, Schlumberger Group, a position he has held from 2011 till date. He is a member of the Advisory Board, Sustainability Accounting Standards Board; the Executive Committee, African Diaspora Health Initiative; the Board of Trustees, Nigerian American Multicultural Center; Development Board, Pan African University – Lagos Business School, Lagos; Board of Trustees, UNDP Human Development Fund. He is also a Fellow of the Institute of Petroleum Studies, University of Port Harcourt, Nigeria. Mr. Oyinlola is an alumnus of several local and international training programs on Infrastructure and Energy Finance, Reservoir Engineering, Petroleum Fiscal Systems & Economics, Project Finance, International Tax Management, Crisis Management and Management, Banking, Finance, Trade and Investment at institutions such as the Oxford University Institute for Energy Studies, Institute for Management Development, (IMD), Switzerland. Mr. Oyinlola’s appointment will be presented for shareholders’ at the 25th Annual General Meeting.
Retirement by Rotation In compliance with the provisions of Article 84(b) of the Articles of Association of the Bank which requires one third of the Directors (excluding Executive Directors) or if their number is not a multiple of three, the number nearest to but not greater than one third, to retire from office at each biennial Annual General Meeting, Mr. Olabode Mubasheer Agusto and Mr. Kadri Adebayo Adeola will retire at this Annual General Meeting and both being eligible offer themselves for re-election. Both Directors attended all Board and Board Committee Meetings and therefore qualify for re-election in line with Section 2.6.2 of the revised CBN Code which stipulates that Directors seeking re-election must have appointed at least two-third of all Board and Board Committee Meetings. A record of their attendance at Meetings is available on page 12 of this Report.
Corporate Governance Guaranty Trust Bank and Subsidiary Companies
6
Profile of retiring Directors
1. Mr Olabode Mubasheer Agusto (Non-Executive Director)
Mr Olabode Mubasheer Agusto holds a Bachelor’s degree in Accounting from the University of Lagos (1977). Mr Agusto became an Associate of the Institute of Chartered Accountants of Nigeria in 1981 and was the recipient of a fellowship from the same association in 1991. He has over 30 years’ experience in various organisations including UTC Motors Limited, PricewaterhouseCoopers and Nigeria International Bank Limited (now Citibank Nigeria Limited). He is the founder of Agusto & Co. Limited, which is the first credit rating agency registered by the SEC in Nigeria. He also held various public positions including Director, National Pension Commission (2005 to 2007), Member, Central Bank of Nigeria Monetary Policy Committee (2006 to 2007) and Director–General, Budget Office of the Federation (2003 to 2007). He serves as a non-executive director on the board of Agusto & Co. Limited and is a Shell Nigeria Closed Pension Fund Administrator. Mr Agusto is a recipient of the national honour of Member of the Order of the Federal Republic.
Mr Agusto joined the Board of Guaranty Trust Bank plc in April 2010 and became member of the Board Remuneration Committee in April 2012 and its chairman in January 2014 till date. He is a member of the Board Credit Committee (July 2010 till date), member of the Board Audit Committee (October 2014 till date) and member and Board representative on the Statutory Audit Committee of the Bank (July 2010 till date)
2. Mr Kadri Adebayo Adeola (Non-Executive Director)
Mr Kadri Adebayo Adeola holds a Bachelor’s degree in Civil Engineering (1975) from the University of Lagos and a Master of Science degree in Civil Engineering Hydraulics (1978) from the Imperial College, London, England. He has over three decades work experience in Engineering and Project Management. He is the founder and pioneer Managing Director of Comprehensive Project Management Services Limited, a firm of project managers. A philanthropist, Mr. Adeola also sits on the board of Fate Foundation, a non-governmental organisation.
Mr Adeola joined the Board of Guaranty Trust Bank plc in April 2010 and became member and chairman of the Board Information Technology Strategy Committee (April 2012 till date), member of the Board Credit Committee (July 2010 till date) and member of the Board Remuneration Committee (April 2012 till date).
Non-Executive Directors Remuneration The Bank’s policy on remuneration of Non-Executive Directors is guided by the provisions of the CBN Code which stipulates that Non-Executive Directors’ remuneration should be limited to sitting allowances, Directors’ fees and reimbursable travel and hotel expenses.
Details of remuneration paid to Executive and Non-Executive Directors is contained in Note 48 of this Annual Report.
Board Committees
The Board carries out its responsibilities through its Standing Committees, which have clearly defined terms of reference, setting out their roles, responsibilities, functions and scope of authority. The Board has six (6) Standing Committees in addition to the Audit Committee of the Bank, namely; Board Risk Management Committee, Board Credit Committee, Board Human Resources and Nominations

Corporate Governance Guaranty Trust Bank and Subsidiary Companies
7
Committee, Board Remuneration Committee, Board Information Strategy Committee and Board Audit Committee which was established in July 2014. Through these Committees, the Board is able to more effectively deal with complex issues, and to fully utilize its expertise to formulate strategies for the Bank. The Committees make recommendations to the Board, which retains responsibility for final decision making. All Committees in the exercise of their powers so delegated conform to the regulations laid down by the Board, with well-defined terms of reference contained in the Charter of each Committee. The Committees render reports to the Board at the Board’s quarterly meetings. A summary of the roles, responsibilities, composition and frequency of meetings of each of the Committees are as stated hereunder: Board Risk Management Committee This Committee is tasked with the responsibility of setting and reviewing the Bank’s risk policies. The coverage of supervision includes the following: credit risk, reputation risk, operations risk, technology risk, market and rate risks, liquidity risk and other pervasive risks as may be posed by the events in the industry at any point in time. The Terms of Reference of the Board Risk Management Committee include:
o To review and recommend for the approval of the Board, the Bank’s Risk Management Policies including the risk profile and limits;
o To determine the adequacy and effectiveness of the Bank’s risk detection and measurement systems and controls;
o To evaluate the Group’s internal control and assurance framework annually, in order to satisfy itself on the design and completeness of the framework relative to the activities and risk profile of the Bank and its subsidiaries ;
o To oversee Management’s process for the identification of significant risks across the Bank and the adequacy of risk mitigation, prevention, detection and reporting mechanisms;
o To review and recommend to the Board for approval, the contingency plan for specific risks;
o To review the Bank’s compliance level with applicable laws and regulatory requirements which may impact on the Bank’s risk profile;
o To conduct periodic review of changes in the economic and business environment, including emerging trends and other factors relevant to the Bank’s risk profile;
o To handle any other issue referred to the Committee from time to time by the Board. The Chief Risk Officer of the Bank presents regular briefings to the Committee at its meetings. The Committee meets quarterly and additional meetings are convened as required. The Committee met four (4) times in the financial year ended December 31, 2014. The Board Risk Management Committee comprised the following members during the year under review:
Corporate Governance Guaranty Trust Bank and Subsidiary Companies
8
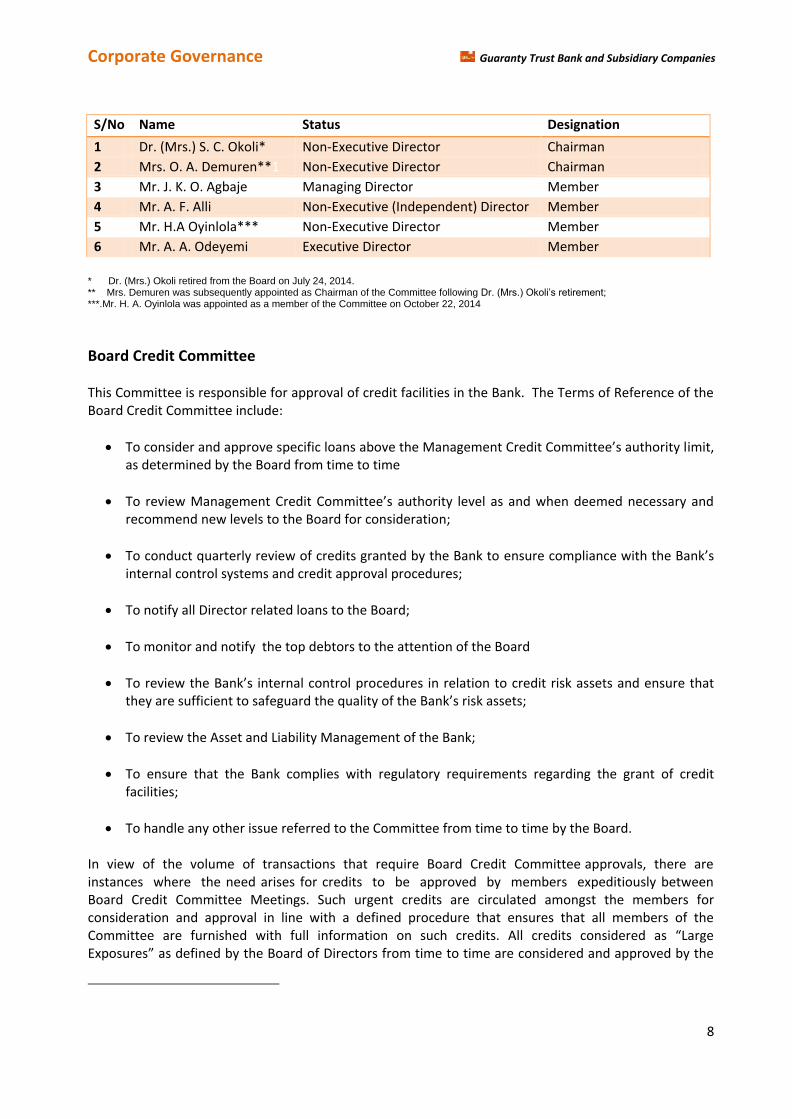
S/No Name Status Designation
1 Dr. (Mrs.) S. C. Okoli* Non-Executive Director Chairman 2 Mrs. O. A. Demuren**1 Non-Executive Director Chairman
3 Mr. J. K. O. Agbaje Managing Director Member 4 Mr. A. F. Alli Non-Executive (Independent) Director Member 5 Mr. H.A Oyinlola*** Non-Executive Director Member 6 Mr. A. A. Odeyemi Executive Director Member
* Dr. (Mrs.) Okoli retired from the Board on July 24, 2014. ** Mrs. Demuren was subsequently appointed as Chairman of the Committee following Dr. (Mrs.) Okoli’s retirement; ***.Mr. H. A. Oyinlola was appointed as a member of the Committee on October 22, 2014
Board Credit Committee This Committee is responsible for approval of credit facilities in the Bank. The Terms of Reference of the Board Credit Committee include:
To consider and approve specific loans above the Management Credit Committee’s authority limit, as determined by the Board from time to time
To review Management Credit Committee’s authority level as and when deemed necessary and recommend new levels to the Board for consideration;
To conduct quarterly review of credits granted by the Bank to ensure compliance with the Bank’s internal control systems and credit approval procedures;
To notify all Director related loans to the Board;
To monitor and notify the top debtors to the attention of the Board
To review the Bank’s internal control procedures in relation to credit risk assets and ensure that they are sufficient to safeguard the quality of the Bank’s risk assets;
To review the Asset and Liability Management of the Bank;
To ensure that the Bank complies with regulatory requirements regarding the grant of credit facilities;
To handle any other issue referred to the Committee from time to time by the Board. In view of the volume of transactions that require Board Credit Committee approvals, there are instances where the need arises for credits to be approved by members expeditiously between Board Credit Committee Meetings. Such urgent credits are circulated amongst the members for consideration and approval in line with a defined procedure that ensures that all members of the Committee are furnished with full information on such credits. All credits considered as “Large Exposures” as defined by the Board of Directors from time to time are considered and approved by the

Corporate Governance Guaranty Trust Bank and Subsidiary Companies
9
Board Credit Committee at a special meeting convened for that purpose. The Board Credit Committee meets at least once in each quarter. However, additional meetings are convened as required. The Committee met four (4) times during the financial year ended December 31, 2014.
The Board Credit Committee is made up of the following members:
S/No Name Status Designation
1 Mr. A. O. Akintoye Non-Executive (Independent) Director Chairman
2 Mrs. C. N. Echeozo Deputy Managing Director Member
3 Mr. K. A. Adeola Non-Executive Director Member
4 Mr. O. M. Agusto Non-Executive Director Member
5 Mr. I. Hassan Non-Executive Director Member
6 Mr. O. Ohiwerei Executive Director Member
7 Mr. A. A. Oyedeji Executive Director Member
Board Human Resources and Nominations Committee This Committee is responsible for the approval of the human resources matters, identification and nomination of candidates for appointment to the Board and board governance issues such as annual evaluation of the performance of the Managing Director and the Board, induction and continuous education, approval of promotion of top management staff, corporate governance, succession planning, conflict of Interest situations and compliance with legal and regulatory provisions. The Committee is also responsible for the oversight of strategic people issues, including employee retention, equality and diversity as well as other significant employee relations matters. The membership of the Committee is as follows:
S/No Name Status Designation
1 Mr. A. F. Alli Non-Executive (Independent) Director Chairman 2 Mr. J.K.O. Agbaje Managing Director Member 3 Mr. A. O. Akintoye Non-Executive (Independent) Director Member 4 Mr. I. Hassan Non-Executive Director Member 5 Dr. (Mrs) S. C. Okoli* Non-Executive Director Member 6 Mr. H.A Oyinlola** Non-Executive Director Member 7 Mrs. O. O. Omotola Executive Director Member
* Ceased to be a member of the Committee on July 24, 2014 following her retirement from the Board. ** Appointed as a member of the Committee on October 22, 2014.
The Committee is required to meet at least once a year, and additional meetings may be convened as the need arises. The Committee met three times during the year ended December 31, 2014.
Board Remuneration Committee The Board Remuneration Committee has the responsibility of setting the principles and parameters of Remuneration Policy across the Bank, determining the policy of the Bank on the remuneration of the

Corporate Governance Guaranty Trust Bank and Subsidiary Companies
10
Managing Director and other Executive Directors and the specific remuneration packages and to approve the policy relating to all remuneration schemes and long term incentives for employees of the Bank. The Board Remuneration Committee comprised the following members during the year ended 31 December, 2014:
S/No Name Status Designation
1 Mr. O. M. Agusto Non-Executive Director Chairman 2 Mr. K.A Adeola Non-Executive Director Member 3 Mrs. O. A. Demuren Non-Executive Director Member 4 Mr. A. O. Akintoye* Non-Executive Director Member
* Appointed as a member on October 22, 2014
The Committee is required to meet at least once a year, and additional meetings may be convened as the need arises. The Committee met once during the 2014 financial year. Board Information Technology Strategy Committee The Board Information Technology Strategy Committee is responsible for the provision of strategic guidance to Management on Information Technology issues and monitoring the effectiveness and efficiency of Information Technology within the Bank and the adequacy of controls. The Terms of Reference of the Board Risk Management Committee include:
1. To provide advice on the strategic direction of Information Technology issues in the Bank;
2. To inform and advise the Board on important Information Technology issues in the Bank;
3. To monitor overall Information Technology performance and practices in the Bank. The Board Information Technology Strategy Committee comprised the following members during the year under review:
S/No Name Designation Designation
1 Mr K. A. Adeola Chairman Chairman
2 Mr J. K. O. Agbaje Managing Director Member 3 Mrs. O. A. Demuren* Non-Executive Director Member 4 Mr A. A. Odeyemi Executive Director Member 5 Mr O. Ohiwerei Executive Director Member * Appointed as a member on October 22, 2014
The Committee is required to hold its Meetings bi-annually or at such other frequency as may be required. The Committee met twice during the year ended December 31, 2014.
Board Audit Committee The Board established the Board Audit Committee in July 2014, in compliance with Section 2.5.1 of the revised new CBN Code of Corporate Governance for Banks and Discount Houses which provides that the Board shall establish a committee responsible for oversight of audit functions, without prejudice to the statutory Audit Committee established in compliance with CAMA which is not considered a board
Corporate Governance Guaranty Trust Bank and Subsidiary Companies
11
committee. As stipulated by the Code, the responsibility of the Committee is to review the integrity of the Bank’s financial reporting and oversee the independence of the external auditors. The Committee shall also receive a summary of whistle blowing cases reported and the result of the investigation from the Head of Internal Audit of the Bank. The Board Audit Committee comprised the following members who were appointed by the Board on July 24, 2014:
S/No Name Status Designation
1 Mr. A. F. Alli Non-Executive Director Chairman 2 Mr. O. M. Agusto Non-Executive Director Member 3 Mr. I. Hassan Non-Executive Director Member
In view of the fact that the Board Audit Committee was newly established during the period under review, The Committee is required to hold its Meetings once every quarter.
Statutory Audit Committee of the Bank This Committee is responsible for ensuring that the Bank complies with all the relevant policies and procedures both from the regulators and as laid-down by the Board of Directors. Its major functions include the approval of the annual audit plan of the internal auditors, review and approval of the audit scope and plan of the external auditors, review of the audit report on internal weaknesses observed by both the internal and external auditors during their respective examinations and to ascertain whether the accounting and reporting policies of the Bank are in accordance with legal requirements and agreed ethical practices. The Committee also reviews the Bank’s annual and interim financial statements, particularly the effectiveness of the Bank’s disclosure controls and systems of internal control as well as areas of judgment involved in the compilation of the Bank’s results. The Committee is responsible for the review of the integrity of the Bank’s financial reporting and oversees the independence and objectivity of the external auditors. The Committee has access to external auditors to seek explanations and additional information, while the internal and external auditors have unrestricted access to the Committee, which ensures that their independence is in no way impaired. The Committee is made up of three (3) Non-Executive Directors and three (3) Shareholders of the Bank appointed at Annual General Meetings, while the Chief Inspector of the Bank serves as the secretary to the Committee. The membership of the Committee at the Board level is based on relevant experience of the Board members, while one of the shareholders serves as the Chairman of the Committee. The internal and external auditors are invited from time to time to attend the Meetings of the Committee. The Chief Financial Officer and appropriate members of Management also attend the meetings upon invitation. The Committee is required to meet quarterly or at such other frequency as may be required. The Statutory Audit Committee of the Bank met four (4) times during the 2014 financial year.

Corporate Governance Guaranty Trust Bank and Subsidiary Companies
12
The following members served on the Committee during the year ended December 31, 2014:
S/No Name Status Designation Attendance
1 Mr. A. B. Akisanmi Shareholders’ Representative Chairman 4
2 Alhaji M. O. Usman Shareholders’ Representative Member 4
3 Mrs. S. O. J. Mbagwu-Fagbemi Shareholders’ Representative Member 3
4 Mr. A. F Alli Non-Executive Director Member 4
5 Mr. I. Hassan Non-Executive Director Member 4 6 Mr. O. M. Agusto Non-Executive Director Member
Attendance of Board and Board Committee Meetings
The table below shows the frequency of meetings of the Board of Directors and Board Committees, as well as Members’ attendance for the financial year ended December 31, 2014. S/N
DIRECTORS BOARD BOARD CREDIT
COMMITTEE
BOARD RISK MANAGEMENT
COMMITTEE
BOARD HUMAN RESOURCES
& NOMINATION COMMITTEE
BOARD REMUNERATI
ON COMMITTEE
BOARD I. T. STRATEGY
TOTAL
DATE OF MEETINGS 29- Jan-2014 16-Apr- 2014 23-Jul- 2014
22-Oct- 2014
28-Jan-2014 15-Apr-2014
7-Jul- 2014 23-Jul- 2014
21-Oct- 2014
28-Jan-2014 15-Apr-2014 23-Jul- 2014
21-Oct- 2014
28-Jan-2014 15-Apr-2014 21-Oct- 2014
29-Jan-2014
27-Jan-2014 20-Oct-2014
NUMBER OF MEETINGS
4 5 4 3 1 2 19
1 Mr. E. U. Imomoh 4 N/A N/A N/A N/A N/A 4
2 Mr. J. K. O Agbaje 4 N/A 4 3 N/A 1 12 3 Mrs. C. N. Echeozo 4 5 N/A N/A N/A N/A 9 4 Mr. A O. Akintoye 4 4 N/A 3 0*** N/A 11 5 Mr. A. F. Alli 4 N/A 4 3 N/A N/A 11
6 Dr (Mrs.) S. C. Okoli**
3 N/A 2 2 N/A N/A 7
7 Mr. O. M. Agusto 4 5 N/A N/A 1 N/A 10 8 Mr. K. A. Adeola 4 5 N/A N/A 1 1 11 9 Mr. I. Hassan 4 5 N/A 2 N/A N/A 11
10 Mrs. O. A. Demuren 4 N/A 4 N/A 1 0*** 9 11 Mr. H. A. Oyinlola* 2*** N/A 0*** 0*** N/A N/A 2 12 Mr. A. A. Odeyemi 4 N/A 4 N/A N/A 1 9 13 Mr. O. Ohiwerei 4 5 N/A N/A N/A 1 10 14 Mrs. O. O. Omotola 4 N/A 4 2 N/A N/A 10 15 Mr. A. Oyedeji 4 5 N/A N/A N/A N/A 9
* Appointed to the Board on April 16, 2014 ** Retired on July 24, 2014 *** Appointed to the Committee on October 22, 2014 N/A -Not Applicable
Tenure of Directors In order to ensure both continuity and injection of fresh ideas, the tenure for Non-Executive Directors is limited to a maximum of three (3) terms of four (4) years each, i.e. twelve (12) years whilst the maximum tenure for Independent Non-Executive Directors is limited to a maximum of two (2) terms of four (4) years each, i.e. eight (8) years. This is in compliance with the directives of the CBN Code.
Corporate Governance Guaranty Trust Bank and Subsidiary Companies
13
Board Appraisal In the Bank’s customary manner of imbibing the best corporate governance practices, the Board engaged an Independent Consultant, KPMG Professional Services, to carry out the annual Board and Directors appraisal for the 2014 financial year. The annual appraisal covered all aspects of the Board’s structure, composition, responsibilities, processes, relationships, individual members’ competencies and respective roles in the Board performance, as well as the Bank’s compliance status with the provisions of the CBN and SEC Codes. The Annual Board and Director Review/Appraisal Report for the 2014 financial year would be presented at this Meeting and a copy sent to the Central Bank of Nigeria, in compliance with the requirements of the CBN Code.
Shareholders The General Meeting of the Bank is the highest decision making body of the Bank. The Bank’s General Meetings are conducted in a transparent and fair manner. Shareholders have the opportunity to express their opinions on the Bank’s financial results and other issues affecting the Bank. The Annual General Meetings are attended by representatives of regulators such as the Central Bank of Nigeria, the Securities and Exchange Commission, The Nigerian Stock Exchange, Corporate Affairs Commission as well as representatives of Shareholders’ Associations. The Bank has an Investors Relations Unit, which deals directly with enquiries from shareholders and ensures that shareholders’ views are escalated to Management and the Board. In addition, quarterly, half-yearly and annual financial results are published in widely read national newspapers. The Bank ensures that institutional investors and international holders of the Global Depositary Receipts get frequent updates on the Bank’s progress via interactive conference calls, local and international investor presentations and meetings. These conference calls and investor meetings provide our investors with direct access to senior and executive Management.
Protection of Shareholders Rights The Board ensures the protection of the statutory and general rights of shareholders at all times, particularly their right to vote at general meetings. All shareholders are treated equally, regardless of volume of shareholding or social status.
Communication Policy The Board and Management of the Bank ensure that communication and dissemination of information regarding the operations and management of the Bank to shareholders, stakeholders and the general public is timely, accurate and continuous, to give a balanced and fair view of the Bank’s financial and non-financial matters. Such information, which is in plain language, readable and understandable, is available on the Bank’s website, http://www.gtbank.com. The website is constantly updated with information as events occur.

Corporate Governance Guaranty Trust Bank and Subsidiary Companies
14
The website also has an Investors Relations portal where the Bank’s financial Reports and other relevant information about the Bank is published and made accessible to its shareholders, stakeholders and the general public. The main objective of the Bank’s Communication Policy is to support the Bank in achieving the overall goals described in the Bank’s core values which strengthens the Bank’s culture of transparency in pursuit of best corporate governance practices. In order to reach its overall goal on information dissemination, the Bank is guided by the following principles: (i) Compliance with Rules and Regulations: The Bank complies with the legislation and codes of
corporate governance of the jurisdictions within which it operates. These include the Banks and other Financial Institutions Act (BOFIA), the Companies and Allied Matters Act (CAMA) and the codes of Corporate Governance issued by the Central Bank of Nigeria as well as the Securities and Exchange Commission, the United Kingdom Listing Authority (“UKLA”) (by virtue of the listing of Global Depositary Receipts by the Bank on The London Stock Exchange in July 2007);
(ii) Efficiency: The Bank uses modern communication technologies in a timely manner to convey its
messages to its target groups. Synergies are sought when it comes to using different communication channels. The Bank replies without unnecessary delay to information requests by the media and the public;
(iii) Transparency: As an international financial institution, the Bank strives in its communication to
be as transparent and open as possible while taking into account the concept of confidentiality between the Bank and its customers, and bank secrecy. This contributes to maintaining a high level of accountability;
(iv) Pro-activity: The Bank proactively develops contacts with its target groups and identifies topics of
possible mutual interest; (v) Clarity: The Bank aims at clarity, i.e. to send uniform and clear messages on key issues; (vi) Cultural awareness: As an international financial institution, the Bank operates in a multicultural
environment and accordingly recognizes the need to be sensitive to the cultural peculiarities of its operating environment;
(vii) Feedback: The Bank actively and regularly seeks feedback on its image and communication
activities both from the media as well as from its key target groups. This feedback is used to fine-tune communication activities.
Information Flows It is the responsibility of Executive Management under the direction of the Board, to ensure that the Board receives adequate information on a timely basis, about the Bank’s businesses and operations at appropriate intervals and in an appropriate manner, to enable the Board to carry out its responsibilities.
The Company Secretary The Company Secretary provides a point of reference and support for all Directors. The Company Secretary also consults regularly with Directors to ensure that they receive required information
Corporate Governance Guaranty Trust Bank and Subsidiary Companies
15
promptly. The Board may obtain information from external sources, such as consultants and other advisers, if there is a need for outside expertise, via the Company Secretary or directly. The Company Secretary is also responsible for assisting the Board and Management in the implementation of the Code of Corporate Governance of the Bank, coordinating the orientation and training of new Directors and the continuous education of Non-Executive Directors; assisting the Chairman and Managing Director to formulate an annual Board Plan and with the administration of other strategic issues at the Board level; organizing Board meetings and ensuring that the minutes of Board meetings clearly and properly capture Board discussions and decisions.
Independent Advice Independent professional advice is available, on request, to all Directors at the Bank’s expense when such advice is required to enable a Member of the Board effectively perform certain responsibilities. The Bank meets the costs of independent professional advice obtained jointly or severally by a Director or Directors where such advice is necessary to enable the obligations imposed on an individual, through membership of the Board, to be properly fulfilled.
Insider Trading and price sensitive information Directors, insiders and their related persons in possession of confidential price sensitive information (“insider information”) are prohibited from dealing with the securities of the Bank where such would amount to insider trading. Directors, insiders and related parties are prohibited from disposing, selling, buying or transferring their shares in the Bank for a period commencing from the date of receipt of such insider information until such a period when the information is released to the public or any other period as defined by the Bank from time to time. In addition to the above, the Bank makes necessary disclosure as required under Rule 111 of the Securities and Exchange Commission Rules and Regulations which stipulates that Directors and top Management employees and other insiders of public companies shall notify the SEC of any sale or purchase of shares in the company, not later than forty-eight (48) hours after such activity,
Management Committees These are Committees comprising senior management staff of the Bank. The Committees are risk driven as they are basically set up to identify, analyze, synthesize and make recommendations on risks arising from day to day activities of the Bank. They also ensure that risk limits as contained in the Board and Regulatory policies are complied with at all times. They provide inputs for the respective Board Committees and also ensure that recommendations of the Board Committees are effectively and efficiently implemented. They meet as frequently as necessary to immediately take action and decisions within the confines of their powers. The Standing Management Committees in the Bank are:
Management Risk Committee;
Management Credit Committee;
Criticized Assets Committee;
Corporate Governance Guaranty Trust Bank and Subsidiary Companies
16
Assets and Liability Management Committee;
Information Technology (IT) Steering Committee;
Information Technology (IT) Risk Management Committee.
Management Risk Committee
This Committee is responsible for regular analysis and consideration of risks in the Bank. The Committee meets from time to time and at least quarterly. However, additional meetings may be held if required. The Committee reviews and analyses environmental issues and policies impacting either directly or remotely on the Bank, brainstorms on such issues and recommends steps to be taken by the Bank. The Committee’s approach is risk based.
The Committee provides inputs for the Board Risk Management Committee and also ensures that the decisions and policies emanating from the Committee’s meetings are implemented. The mandate of the Committee includes:
Reviews the effectiveness of GTBank’s overall risk management strategy at the enterprise level.
Follow-up on management action plans based on the status of implementation compiled by the Management Risk Committee
Identify and evaluate new strategic risks including corporate matters involving regulatory, business development issues, etc., and agree on suitable mitigants.
Review the enterprise risk scorecard and determine the risks to be escalated to the Board on a quarterly basis.
Management Credit Committee This is the Committee responsible for ensuring that the Bank complies fully with the Credit Policy Guide as laid down by the Board of Directors. The Committee also provides inputs for the Board Credit Committee. This Committee reviews and approves credit facilities to individual obligors not exceeding an aggregate sum to be determined by the Board from time to time. The Management Credit Committee is responsible for reviewing and approving all credits that are above the approval limit of the Managing Director as determined by the Board. The Committee reviews the entire credit portfolio of the Bank and conducts periodic assessment of the quality of risk assets in the Bank. It also ensures that adequate monitoring of credits is carried out. The Committee meets weekly depending on the number of credit applications to be considered. The secretary of the Committee is the Head of the Credit Administration Unit of the Bank.
Criticized Assets Committee
This Committee is responsible for the assessment of the risk asset portfolio of the Bank. It highlights the status of the Bank’s assets in line with the internal and external regulatory framework, and directs appropriate actions in respect of delinquent assets. The Committee ensures that adequate provisions are taken in line with the regulatory guidelines.

Corporate Governance Guaranty Trust Bank and Subsidiary Companies
17
Assets and Liability Management Committee
This Committee is responsible for the management of a variety of risks arising from the Bank’s business including, market and liquidity risk management, loan to deposit ratio analysis, cost of funds analysis, establishing guidelines for pricing on deposit and credit facilities, exchange rate risks analysis, balance sheet structuring, regulatory considerations and monitoring of the status of implemented assets and liability strategies. The members of the Committee include the Managing Director, Executive Directors, the Treasurer, the Head of the Financial Control Group, the Chief Risk Officer as well as a representative of the Assets and Liability Management Unit.
Information Technology (IT) Steering Committee The Committee is responsible for assisting Management with the implementation of IT strategy approved by the Board. The roles and responsibilities of the Committee include:
1. Planning, Budgeting and Monitoring
Review and approve the Bank’s IT plan and budget (short and long term).
Review IT performance against plans and budgets, and recommend changes, as required.
Review, prioritize and approve IT investment initiatives.
Establish a balance in overall IT investment portfolio in terms of risk, return and strategy.
2. Ensuring Operational Excellence
Provide recommendations to Management on strategies for new technology and systems.
Review and approve changes to IT structure, key accountabilities, and practices.
Ensure project priorities and success measures are clearly defined, and effectively monitored.
Conduct a review of exceptions and projects on selected basis.
Perform service catalogue reviews for continued strategic relevance.
Review and approve current and future technology architecture for the Bank.
Monitor service levels, improvements and IT service delivery.
Assess and improve the Bank’s overall IT competitiveness. 3. IT Risk Assurance
Review and approve governance, risk and control framework.
Monitor compliance with defined standards and agreed performance metrics.
Ensure that vulnerability assessments of new technology are performed.
Reviewing and ensuring the effectiveness of the IT Risk Management and Security plan.
Ensuring the effectiveness of disaster recovery plans and review reports on periodic disaster recovery testing.
Reviewing key IT risk and security issues relevant to the Bank’s IT processes / systems.
Ensuring the Bank’s compliance with relevant laws and regulations.
Corporate Governance Guaranty Trust Bank and Subsidiary Companies
18
Information Technology (IT) Risk Management Committee
The Information Technology Risk Management Committee is responsible for establishing standardised IT risk management practices and ensuring compliance, for institutionalising IT risk management in the Bank’s operations at all levels; and identifying and implementing cost effective solutions for IT risk mitigation. The Committee is also responsible for the continuous development of IT risk management expertise and ensuring that a proactive risk management approach is adopted throughout the Bank to drive competitive advantage.
Monitoring Compliance with Corporate Governance Chief Compliance Officer The Chief Compliance Officer monitors compliance with money laundering requirements and the implementation of the Corporate Governance Code of the Bank. The Chief Compliance Officer together with the Chief Executive of the Bank certify each year to the Central Bank of Nigeria that they are not aware of any other violation of the Corporate Governance Code, other than as disclosed to the CBN during the course of the year. The Company Secretary and the Chief Compliance Officer forward monthly returns to the Central Bank of Nigeria on all whistle-blowing reports and corporate governance breaches. Whistle Blowing procedures In line with the Bank’s commitment to instill the best corporate governance practices, the Bank has established a whistle blowing procedure that ensures anonymity. The Bank has two (2) hotlines and a dedicated e-mail address for whistle-blowing procedures. The hotline numbers are 01-4480905 and 01- 4480906, and the email address is [email protected] Internally, the Bank has a direct link on its Intranet (internal web page) for dissemination of information, to enable members of staff report all identified breaches of the Bank’s Code of Corporate Governance. Code of Professional Conduct for Employees The Bank has an internal Code of Professional Conduct which all members of staff are expected to subscribe to upon assumption of duties. Staff are also required to reaffirm their commitment to the Bank’s Code annually. All members of staff are expected to strive to maintain the highest standards of ethical conduct and integrity in all aspects of their professional life as contained in the Code of Professional Conduct which prescribes the common ethical standards, policies and procedures of the Bank relating to employee values. Human Resources Policy The Human Resources policy of the Bank is contained in the Directors’ Report on page 33 of this Annual Report.
Corporate Governance Guaranty Trust Bank and Subsidiary Companies
19
Employee Share-ownership Scheme The Bank has in place an employee share ownership scheme called the Staff Investment Trust (SIT) scheme. Under the Bank’s Articles of Association, the Scheme is authorized to hold up to a specified percentage of ordinary shares of the Bank for the benefit of eligible employees of the Bank. The scheme was established for the benefit of the Bank’s staff as an incentive mechanism, by enabling eligible staff invest in ordinary shares of the Bank at a discount (the prevailing Net Assets Value (NAV)), and buying-back their shares at the market price, subject to attaining a determined length of service at the point of disengagement from the Bank and proper conduct at disengagement. Internal Management Structure The Bank operates an internal management structure where all officers are accountable for duties and responsibilities attached to their respective offices and there are clearly defined and acceptable lines of authority and responsibility.

Subsidiary Governance Guaranty Trust Bank and Subsidiary Companies
20
Subsidiary Governance
Subsidiary governance is an integral part of a company’s risk management framework. This includes regular internal audits, assessment of corporate governance, understanding of the legal and regulatory environment in which an entity operates and ensuring appropriate controls are in place in the subsidiaries. GTBank’s downstream governance strategy is implemented through the establishment of systems and processes which will assure the Board that the subsidiaries reflect the same values, ethics, control and processes as that of the parent. The actions of the subsidiaries require the approval of the parent, especially on matters related to investment and expenditure and on significant accounting issues, where judgment is involved. GTBank Plc exercises control over its subsidiaries in the undermentioned ways: Oversight function
GTBank Plc has saddled the Executive Director of International Banking with the responsibility of overseeing the management of subsidiaries and aligning the subsidiaries’ strategy with that of parent. The International Banking division actively monitors the activities of subsidiaries and gives requisite feedback to management.
Subsidiary Board Representation
GTBank Plc has controlling representation on the Board of each subsidiary in form of Executive directors who are senior management staff of the parent. The Board representatives are seasoned professionals with high level of integrity and who have proven records in the financial services industry in Nigeria. Crucial decisions concerning the operations and management of subsidiaries are taken at the board level. Management of Subsidiaries GTBank has a policy of seconding the Managing Directors of subsidiaries from the parent company. In addition, other management staff are seconded to act as backup to the Managing Director and head the Support and Operations Divisions. The objective is to ensure adequate communication of policies and procedures; and that a high level of uniformity is achieved across all entities within the Group. Business Performance Review Session Managing Directors of GTBank Subsidiaries attend the Group’s Business Performance Review (BPR) to make presentations on the subsidiaries’ business activities during the quarter to evaluate its financial performance against budget and pledge for the next quarter. At the session, the profitability and other performances of the subsidiary is carefully monitored and reviewed; recommendations are made on business activities to be carried out in order to ensure profitability and stability. Risk Management Audit A periodic audit is carried out by the System and Control Group of GTBank Plc to review all operational areas of the bank and its subsidiaries. The annual audit focuses on operating activities in all the various units of the subsidiaries. The audit report is circulated to all Board members and relevant stakeholders for necessary action and subject to review at the Board Meeting immediately following the audit exercise. External Auditors’ Report GTBank Plc obtains management report from the auditors of GTBank Subsidiaries at the conclusion of each audit to review, follow up and to address all the issues that may have been raised in the report. The

Subsidiary Governance Guaranty Trust Bank and Subsidiary Companies
21
subsidiaries also carry out half year audit (internal audit) to further help in ensuring that they are on track and that they fully complied with the Board approved processes and procedures. Flexible Consistency GTBank Plc allows subsidiaries to operate as entities on their own with appropriate level of responsibility and authority delegated. This ensures that there is consistency across entities and the parent is also able to monitor compliance with local legal and regulatory requirements of the individual countries without stifling operational activities.
Sustainability Report Guaranty Trust Bank and Subsidiary Companies
22
Sustainability Report
As a first-class financial services provider with an internal obligation to comply with international best practices, Guaranty Trust Bank continued to ensure that its operations comply with international performance standards and applicable national environmental and social regulations. In 2014, the Bank remained at the forefront of using its banking activities in influencing the environmental and social practices of its stakeholders – customers, suppliers, workers and communities where it operates. The bank’s leadership position entrusts it with the responsibility of creating awareness amongst its stakeholders on the importance and benefits of ensuring a sustainable society and the consequences of not doing so. Guaranty Trust Bank continued to abide by the Nigerian Sustainable Banking Principles by integrating environmental and social considerations in its business and credit practices. Consequently, throughout the 2014 financial year, the bank was not involved in nor financed any operation that had negative impact on the environment. During the year, the bank conducted environmental and social risk assessments of some of its clients and monitored recommended action plans, in line with agreed timelines. Guaranty Trust Bank attaches strong importance to women economic empowerment and continuously ensured that women play prominent roles in the affairs of the bank. As at 31st December 2014, 45% of the Bank’s staff and 31% of Senior Management Staff were female. This is a clear testimony to the Bank’s commitment to gender equality and women empowerment. During the year under review, the bank commissioned a staff gymnasium to further encourage a healthy work culture and also complement various health and safety trainings conducted for staff. The Bank also continued to operate its onsite crèche for the benefit of nursing mothers. The bank launched its i-Refer scheme in November 2014, a referral scheme that rewards existing customers for introducing new prospects to the bank. The scheme aims to reach the un-banked and under-banked of the community by leveraging on the excellent customer experience of existing customers who in turn invite their friends, families and colleagues to open and maintain GTBank accounts. The bank’s branches for Agent banking has also continued to grow. Agent banking was launched to serve as a veritable tool in reaching the un-banked and under-banked members of the community. The first branch was opened in 2013. As a Pan-African Bank with a global outlook that imbibes best practices, a healthy work culture, an ethical value system and a social conscience at the heart of its operation, Guaranty Trust Bank will continue to expand its Corporate Social Responsibility footprint by growing its beneficiary base and implementing meaningful CSR schemes that impact the lives of the less privileged within its host communities.

Complaints and Feedback Guaranty Trust Bank and Subsidiary Companies
23
Treating Customer Fairly (TCF) At Guaranty Trust Bank plc (“the Bank”), we consider treating customers fairly a pivotal part of our business strategy and are appreciative of the fact that our customers are key stakeholders to our business. In accordance with the Bank’s vision to deliver the utmost in customer service, we have formulated the following guiding principles:
The essence of Treating Customers Fairly; Being attentive to customers’ needs and ensuring that appropriate feedback is given where
required; The implementation and maintenance of a Complaints management process.
Complaints and Feedback Channels The Bank has various channels for customers to liaise with us. These include but are not limited to:
The Complaints portal on the Bank’s website; An SMS platform; GT Connect (a 24 hours self-service interactive call center); Social Media feedback platform; The Whistle Blowing portal on the Bank’s website.
In addition to the above, customers can also visit any of the Bank’s branches to provide their feedback.
Customers’ opinion on products, services and processes The Bank constantly strives to improve its services to customers. To this end the Bank periodically evaluates public/customers’ opinion about our services, products and policies. The evaluation is conducted in various ways, including:
One-on-one focus meetings with customers; Interviews with randomly picked customers; Opinion cards placed in banking halls; Questionnaires administered to customers.
Resolution Structure
The Bank’s complaints and feedback structure ensures the prompt resolution of customers’ complaints. The Bank has a dedicated Complaints Unit which is responsible for receiving; prompt investigation and resolution of customers’ complaints. The Complaints Unit serves as the liaison between the Bank and its customers as well as regulatory authorities in ensuring that complaints are satisfactorily resolved.

Complaints and Feedback Guaranty Trust Bank and Subsidiary Companies
24
Complaints are stream-lined into various categories to ensure proper monitoring and efficient management. The process flow for customer complaints received and its resolution is as follows:
All complaints received are acknowledged; The complaint is reviewed to determine if it could be resolved at the point of receipt; Where a complaint can be resolved at the point of receipt, a resolution is provided to the
customer; If a complaint cannot be resolved at the point of receipt, the complaint is referred to the
appropriate unit in the Bank to handle; Upon resolution, the customer is contacted and the resolution provided to the customer; The complaint is closed and marked as resolved.
Utilization of Feedback
The Bank is appreciative of the fact that our customers are our key stakeholders. As such, lessons learnt from customer complaints are taken very seriously and used to ensure that a reoccurrence does not exist.
Feedback on customers’ complaints to the Bank Feedback on customers’ complaints is provided to the Management, relevant units and groups in the Bank to ensure that complaints and issues raised by customers do not reoccur. This serves as a learning point for the various units within the Bank on the Bank’s products and services. The feedback gathered ensures that:
The Bank retains its customers as such customers feel appreciated and respected; The quality of service delivery set by the Bank is maintained and made uniform across board; A reliable source of identifying improvement opportunities is presented to management; A reliable source of data on customers’ complaints and expectations is collated; The feedback is circulated through the Bank’s internal information channels for the general
information of all staff.
Complaints and Feedback Guaranty Trust Bank and Subsidiary Companies
25
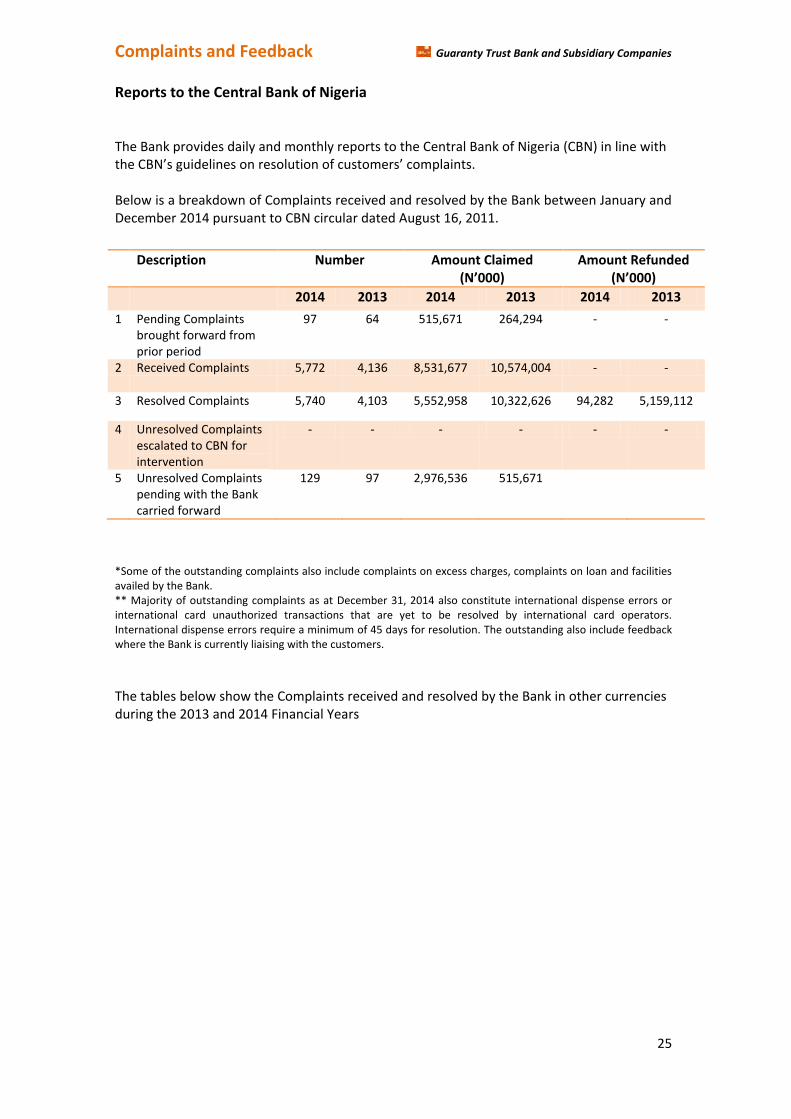
Reports to the Central Bank of Nigeria
The Bank provides daily and monthly reports to the Central Bank of Nigeria (CBN) in line with the CBN’s guidelines on resolution of customers’ complaints. Below is a breakdown of Complaints received and resolved by the Bank between January and December 2014 pursuant to CBN circular dated August 16, 2011.
*Some of the outstanding complaints also include complaints on excess charges, complaints on loan and facilities availed by the Bank. ** Majority of outstanding complaints as at December 31, 2014 also constitute international dispense errors or international card unauthorized transactions that are yet to be resolved by international card operators. International dispense errors require a minimum of 45 days for resolution. The outstanding also include feedback where the Bank is currently liaising with the customers.
The tables below show the Complaints received and resolved by the Bank in other currencies during the 2013 and 2014 Financial Years
Description Number Amount Claimed (N’000)
Amount Refunded (N’000)
2014 2013 2014 2013 2014 2013
1 Pending Complaints brought forward from prior period
97 64 515,671 264,294 - -
2 Received Complaints 5,772 4,136 8,531,677 10,574,004 - -
3 Resolved Complaints 5,740 4,103 5,552,958 10,322,626 94,282 5,159,112
4 Unresolved Complaints escalated to CBN for intervention
- - - - - -
5 Unresolved Complaints pending with the Bank carried forward
129 97 2,976,536
515,671
Complaints and Feedback Guaranty Trust Bank and Subsidiary Companies
26
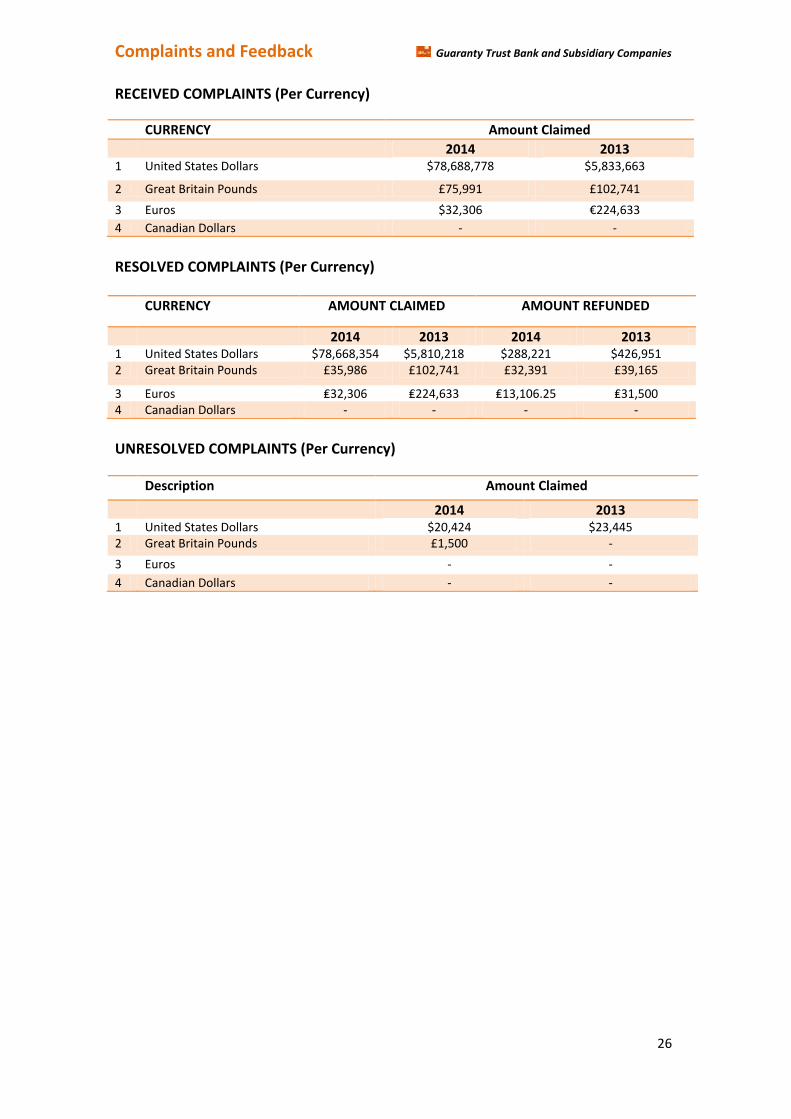
RECEIVED COMPLAINTS (Per Currency)
RESOLVED COMPLAINTS (Per Currency)
UNRESOLVED COMPLAINTS (Per Currency)
CURRENCY Amount Claimed
2014 2013 1 United States Dollars $78,688,778 $5,833,663
2 Great Britain Pounds £75,991 £102,741
3 Euros $32,306 €224,633
4 Canadian Dollars - -
CURRENCY AMOUNT CLAIMED AMOUNT REFUNDED
2014 2013 2014 2013 1 United States Dollars $78,668,354 $5,810,218 $288,221 $426,951 2 Great Britain Pounds £35,986 £102,741 £32,391 £39,165
3 Euros ₤32,306 ₤224,633 ₤13,106.25 ₤31,500 4 Canadian Dollars - - - -
Description Amount Claimed
2014 2013 1 United States Dollars $20,424 $23,445 2 Great Britain Pounds £1,500 -
3 Euros - -
4 Canadian Dollars - -
AML/CFT Framework Guaranty Trust Bank and Subsidiary Companies
27
Anti-Money Laundering and Combating the Financing of Terrorism (AML/CFT) framework
At Guaranty Trust Bank plc (“the Bank”), we have put in place a framework for Anti-Money Laundering (“AML”), Combating the Financing of Terrorism (“CFT”) and the prevention of the financing and proliferation of weapons of mass destruction, which assures adherence to the AML/CFT legislation and regulations in Nigeria as well as leading best practices including but not limited to the Financial Action Task Force (FATF) Recommendations. Where there is a difference the Bank applies the stricter of the two.
Structure of the framework
The policies and procedural guidelines that make up the structure are reviewed/revised on a periodic basis to ensure that they remain in line with regulatory requirements and leading practices. The Bank has moved away from a “one size fits all” approach to combating financial risk to a risk based approach. Thus the Bank identifies and assesses the risks from a proactive stance and allocates the requisite resources which would include systems and controls to manage these risks.
Scope of the framework
The scope of the Bank’s AML/CFT framework covers the following:
(i) Board and Management responsibilities:
The Board of Directors of the Bank has oversight responsibilities for the AML/CFT framework and ensures that the Bank is in strict compliance with all regulatory and internal procedures relating to AML/CFT. The tone is set from the top and the Bank maintains a zero tolerance to regulatory infraction.
(ii) Reports to Senior Management and the Board: Monthly and quarterly reports are provided respectively which provides them with information to enable them assess how the Bank is complying with its regulatory responsibilities as well as make them aware of current trends and compliance developments.
(iii) Know your customer (KYC) procedures:
The completion of an account opening form and the collection of identification documents is the foundation/bedrock for account opening. Customer Due Diligence (CDD) is conducted prior to entering into any relationship. This includes at a minimum identity and address verification as well as ascertaining the source of income and wealth of the customer. Enhanced Due Diligence is conducted on High Risk customers e.g. politically exposed persons and senior management approval is therefore required prior to opening the account. The Bank takes requisite and regulatory measures when embarking on relationships with designated non-financial institutions due to the risks inherent with these customers and in compliance with regulatory requirements. The Bank as part of its KYC and CDD procedures, requests and obtains identification information to confirm who the beneficial owners of a business are as well as the organization’s control and structure. The Bank in the financial year under review commenced the CBN driven additional KYC measures of obtaining biometric data from customers with the issuance of Bank Verification Number (BVN) and the use of the industry wide uniform account opening forms.

AML/CFT Framework Guaranty Trust Bank and Subsidiary Companies
28
(iv) Transaction Monitoring:
A compliance culture is embedded within the Bank and thus all members of staff understand that compliance is everybody’s responsibility. Transaction monitoring occurs on a manual and automated basis. The former by all members of staff and the latter within the Compliance Unit. All members of staff are aware of the fact that suspicious activities should be immediately referred to the Compliance Unit.
(v) Transaction Reporting:
Regulatory and statutory requirements stipulate that certain reports and returns are made to regulatory bodies. In Nigeria, the Nigerian Financial Intelligence Unit (NFIU) is the regulatory agency responsible for receipt of the following core transaction based reports:
Currency Transaction Report (CTR) Foreign Currency Transaction Report (FTR) Suspicious Transaction Report (STR)
The Bank renders reports to the NFIU in accordance with the provisions of sections 2, 6 and 10 of the Money Laundering (Prohibition) Act of 2011 as amended (“the Act”).
Section 2 of the Act provides that financial institutions must submit a report on all international transfer of funds and securities of a sum exceeding ten thousand dollars ($10,000) or its equivalent in other foreign currencies. Section 6 of the Act provides that a financial institution must submit a report on all unusual and suspicious transactions.
Section 10 of the Act provides that any lodgment or transfer of funds in excess of N5 million and above for individuals and N10 million and above for corporate customers must be reported.
(vi) Relationship with Regulators and Law Enforcement Agencies:
The Bank has an appreciation of the fact that it has a responsibility to work with law enforcement agencies in the fight against financial crime and to this end we maintain a cordial and supportive relationship with all agencies. The Bank will promptly comply with all requests made, pursuant to the law, and provide information to regulators including the NFIU, the CBN and other relevant agencies.
(vii) Sanctions Compliance Management:
All employees, as applicable to their functions, are required to screen names of individuals and organizations which have or plan to enter a business relationship or carry out a transaction with/through the Bank against the watch list. Employees are mandated, as part of the Bank's policy, to stop any relationship and/or transaction which yield a true or positive match and follow the escalation procedure. Screening of names at account opening and on a real time basis for all SWIFT transactions occurs against the various sanctioned persons list.
(viii) Politically Exposed Persons (PEPs)
PEPs are individuals who are or have been entrusted with prominent public functions and people or entities associated with them. Enhanced measures of due diligence are applied to PEPs, as with
AML/CFT Framework Guaranty Trust Bank and Subsidiary Companies
29
other high risk customers. This is to ensure that the Bank is not unknowingly supporting fraudulent activities such as money laundering and/or the financing of terrorism.
In line with FATF's recommendation, the Bank employs the use of appropriate discretionary risk based systems in identifying and monitoring PEPs transactions. This is achieved through the thorough review of information provided by the customer and transaction trends.
Establishment of new accounts for PEPs as well as continuity of such accounts (for those already existing in the system) is subject to the approval of an Executive Director.
(ix) AML/CFT principles for Correspondent Banking:
The Bank only enters into and maintains correspondent banking relations with financial institutions that have implemented AML/CFT policies and procedures. The Bank does not deal with shell banks nor maintain any payable through accounts.
(x) Training:
The Bank places a high value on the training of its employees. Trainings are carried out to ensure employees are familiar with the AML/CFT laws, KYC principles and other AML/CFT related information. Annual Compliance training is mandatory for all members of staff, including Senior Management and Directors. Training is by way of e-learning or face to face. Ad hoc training also takes place by way of the dissemination of topical national and international findings.
(xi) AML/CFT Audits:
Internal audit of the AML/CFT function is conducted on a quarterly basis. The purpose of the audit is to test for, and ensure the effectiveness of the AML/CFT measures put in place by the Bank.
The report and findings of the audit is circulated to various levels of senior management. Follow-up to the audits take place to ensure that the relevant issues are closed out.
(xii) Record Retention:
Customer identification documents are retained throughout the life of the account and for five (5) years after the cessation of the banking relationship, except in cases of litigation and/or regulatory investigations. In the case of the latter, the records will be kept for as long as they are required.
Subsidiaries The Bank ensures that its foreign subsidiaries AML/CFT provisions is consistent with the Bank’s framework which is based on leading practices. These measures are applied to the extent that the respective subsidiary’s local laws and regulations permit; however, where there are discrepancies the stricter will always prevail.

Guaranty Trust Bank and Subsidiary Companies
Internal control and Risk Management Systems
30
Internal control and Risk Management Systems in relation to the financial reporting
Guaranty Trust Bank’s internal control and risk management systems ensure that material errors or inconsistencies in the financial statements are identified and corrected. The bank’s internal control framework is patterned after the Committee of Sponsoring Organizations of the Treadway Commission’s (COSO) Framework.
COSO defines internal control as "a process effected by an entity's Board of Directors, Management and other personnel, to provide reasonable assurance regarding the achievement of objectives" in three categories--effectiveness and efficiency of operations; reliability of financial reporting; and compliance with applicable laws and regulations. The scope of internal control therefore extends to policies, plans, procedures, processes, systems, activities, functions, projects, initiatives, and endeavors of all types at all
levels of the bank.
The internal control and risk management systems comprise the following areas:
Control Environment
Risk Assessment
Control Activities
Information and Communication
Monitoring
Control Environment The Bank has three Board Committees (Board Risk Committee, Board Credit Committee and Board Audit Committee) that have oversight function on the Bank’s Risk Management Processes. The Committees are responsible for setting risk management policies that ensure material risks inherent in the Bank’s business are identified and mitigated or controlled. The Bank also has an Audit Committee which is made up of three shareholders’ representatives and three Non- Executive Directors; one of the shareholders’ representatives is the Chairman. The Audit Committee is therefore independent. Its oversight functions include among others, ensuring that quality accounting policies, internal controls, independent and objective statutory auditors are in place to prevent and detect fraud and material errors in financial reporting.
The Bank’s management committees are responsible for implementing risk management policies set out by the Board. They are also responsible for setting internal control policies and monitoring the effectiveness of the internal control systems. They ensure proper books of accounts are kept and accounting policies are in conformity with: International Financial Reporting Standards; Prudential Guidelines for licensed Banks; Circulars issued by the Central Bank of Nigeria; The requirements of the Banks and Other Financial Institutions Act; and The requirements of the Companies and Allied Matters Act.
Risk Assessment
The Board and Senior Management regularly assess the risks the Bank is exposed to, including risks relating to financial reporting. Management Committees meets on a regular basis to assess the credit, market, interest rates, liquidity, legal and reputational risks facing the bank. Senior Management also regularly considers whether the existing internal controls are effective in relation to the risks identified in the financial reporting process.
The Board also assesses the effectiveness of the bank's internal control over financial reporting on an ongoing basis and specifically at mid-year and year end. The Management letter issued by the external auditors which contains the auditors’ observations on the control environment in the bank is discussed at the Audit Committee meetings.

Guaranty Trust Bank and Subsidiary Companies
Internal control and Risk Management Systems
31
Control Activities
Control activities are an integral part of the Bank’s day to day operations. Senior Management has set up control structure to ensure control activities are defined at every business area.
Examples of the Bank’s control activities include the following;
Top Management Reviews
Internal Audit Reports eliciting control weaknesses are presented periodically to management and Board Audit Committee.
Preparation of financial statements on a daily basis for management review.
Monthly and quarterly profitability review, where the bank’s financial performance is reviewed and compared with the set budgets. Quarterly reports of the Chief Risk Officer to the Board, eliciting the existing and potential risks facing the Bank and the mitigants deployed.
Activity Control Control functions are embedded within each business area for self-checking of activities within the areas (for instance, transactions call over for timely detection of errors is carried out by all posting units).
Physical Controls
There are policies guiding access to the Bank’s physical and financial assets, including dual custody, use of overrides etc.
Compliance with Limits
The Bank sets internal limits guiding its trading book activities, liquidity and interest rate gaps, credit concentration limits. The limits are monitored on a daily basis by an independent unit outside the business areas.
Approval and Authorisation Limits
There are segregation of duties; no officer can start and conclude transactions
Limits exist for credit and expense approvals. Transactions are approved at appropriate levels.
Verifications and Reconciliations
All internal ledgers are regularly proofed and reconciled; exception reports are generated.
Whistle Blowing The bank has instituted a strong whistle blowing culture among staff and also created awareness among its stakeholders. The whistle blowing platform is accessible to all and the aim is primarily to ensure that all cases of irregularities are made known and addressed by the bank.
Information and Communication/ Monitoring
The Bank’s management understands the need for a timely, reliable and accurate information flow within the Bank, for effective decision making and enhanced financial reporting. Every activity of the Bank is codified in the Bank’s standard operating procedure (SOP), which outlines the process flow and specifies the
Guaranty Trust Bank and Subsidiary Companies
Internal control and Risk Management Systems
32
duties and responsibilities of every officer in relation to the activity. The SOP further highlights requirement for reporting, the frequency of reporting as well as those within the organization to whom the report would be directed to.
The following are some of the generic internal reports used by management for decision making and monitoring purposes:
FINSTAT- Financial Statements Report
BPR- Business Performance Review Report
MPR- Monthly Profitability Report
Liquidity Ratio Report
OPR - Operations Performance Report
APR- Account Profitability Report
ECR- Expense Control Report
CAC- Criticized Asset Committee Report
CLR- Criticized Loans Report
ALCO- Asset and Liability Committee Report
Overdraft Efficiency Report

Guaranty Trust Bank and Subsidiary Companies
33
Directors’ Report
For the year ended December 31, 2014
The Directors have pleasure in presenting their report on the affairs of Guaranty Trust Bank Plc (“the Bank”) and its subsidiaries (“the Group”), together with the Group audited financial statements and the auditor’s report for the financial year ended December 31, 2014.
Legal form and principal activity
The Bank was incorporated as a private limited liability company on July 20, 1990. It obtained a license to operate as a commercial bank on August 1, 1990, and commenced business on February 11, 1991. It became a public limited company on April 2, 1996, and its shares were listed on the Nigerian Stock Exchange on September 9, 1996. The Bank was issued a universal banking license by the Central Bank of Nigeria on February 5, 2001. Following the Bank’s divestment from all its non-banking subsidiaries in compliance with the Central Bank of Nigeria Regulation on Scope of Banking Activities and other Ancillary Matters , the Bank applied for and was issued a Commercial Banking License with International Scope on December 20, 2012, by the Central Bank of Nigeria. The Bank’s principal activity remains the provision of commercial banking services to its customers, such as retail banking, granting of loans and advances, corporate finance, money market activities and related services, as well as foreign exchange operations.
The Bank has the following overseas subsidiaries: Guaranty Trust Bank (Gambia) Limited, Guaranty Trust Bank (Sierra Leone) Limited, Guaranty Trust Bank (Ghana) Limited, Guaranty Trust Bank (United Kingdom) Limited, Guaranty Trust Bank (Liberia) Limited, Guaranty Trust Bank (Ivory Coast) Limited, Guaranty Trust Bank (Kenya) Limited, Guaranty Trust Bank (Rwanda) Limited and Guaranty Trust Bank (Uganda) Limited; as well as GTB Finance B.V. Netherlands, the special purpose entity used to raise funds from the international financial market. The financial results of all the subsidiaries have been consolidated in these financial statements.
Operating results The Group’s Gross earnings increased by 15%. Highlights of the Group’s operating results for the year ended 31 December, 2014 are as follows:
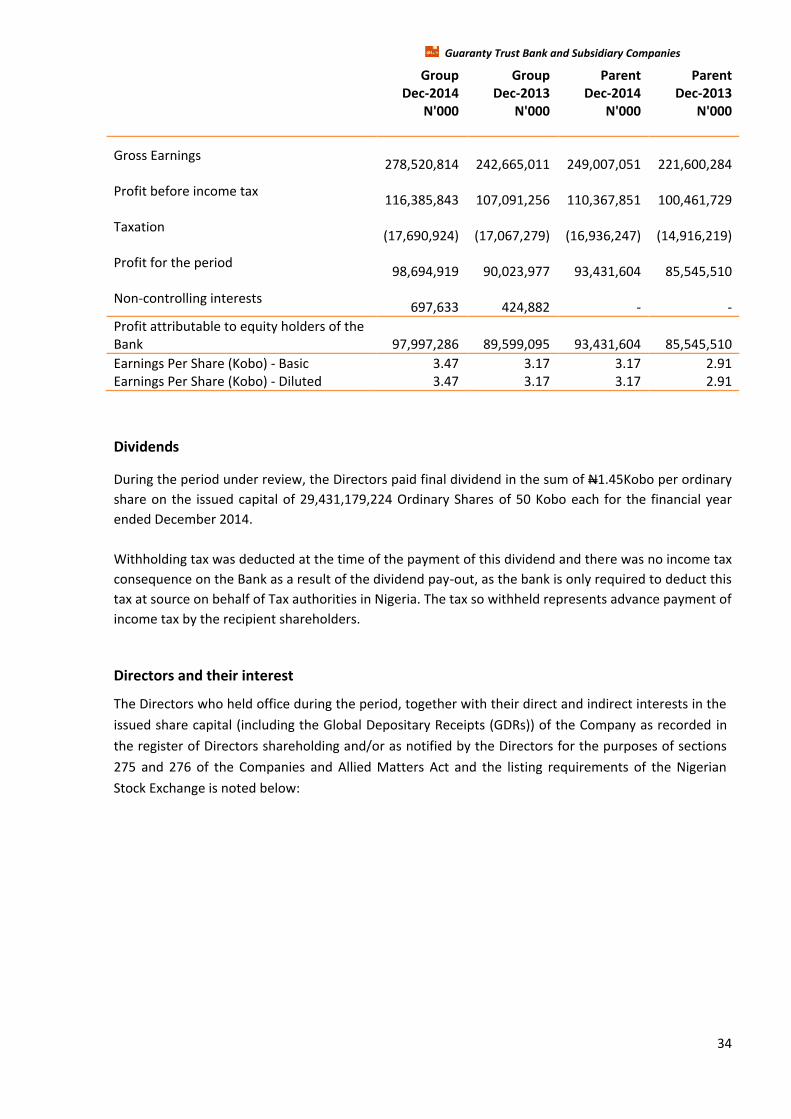
Guaranty Trust Bank and Subsidiary Companies
34
Group Group Parent Parent
Dec-2014 Dec-2013 Dec-2014 Dec-2013
N'000 N'000 N'000 N'000
Gross Earnings
278,520,814
242,665,011
249,007,051
221,600,284
Profit before income tax
116,385,843
107,091,256
110,367,851
100,461,729
Taxation
(17,690,924)
(17,067,279)
(16,936,247)
(14,916,219)
Profit for the period
98,694,919
90,023,977
93,431,604
85,545,510
Non-controlling interests
697,633
424,882
-
-
Profit attributable to equity holders of the Bank
97,997,286
89,599,095
93,431,604
85,545,510
Earnings Per Share (Kobo) - Basic 3.47 3.17 3.17 2.91 Earnings Per Share (Kobo) - Diluted 3.47 3.17 3.17 2.91
Dividends
During the period under review, the Directors paid final dividend in the sum of N1.45Kobo per ordinary
share on the issued capital of 29,431,179,224 Ordinary Shares of 50 Kobo each for the financial year
ended December 2014.
Withholding tax was deducted at the time of the payment of this dividend and there was no income tax
consequence on the Bank as a result of the dividend pay-out, as the bank is only required to deduct this
tax at source on behalf of Tax authorities in Nigeria. The tax so withheld represents advance payment of
income tax by the recipient shareholders.
Directors and their interest
The Directors who held office during the period, together with their direct and indirect interests in the
issued share capital (including the Global Depositary Receipts (GDRs)) of the Company as recorded in
the register of Directors shareholding and/or as notified by the Directors for the purposes of sections
275 and 276 of the Companies and Allied Matters Act and the listing requirements of the Nigerian
Stock Exchange is noted below:
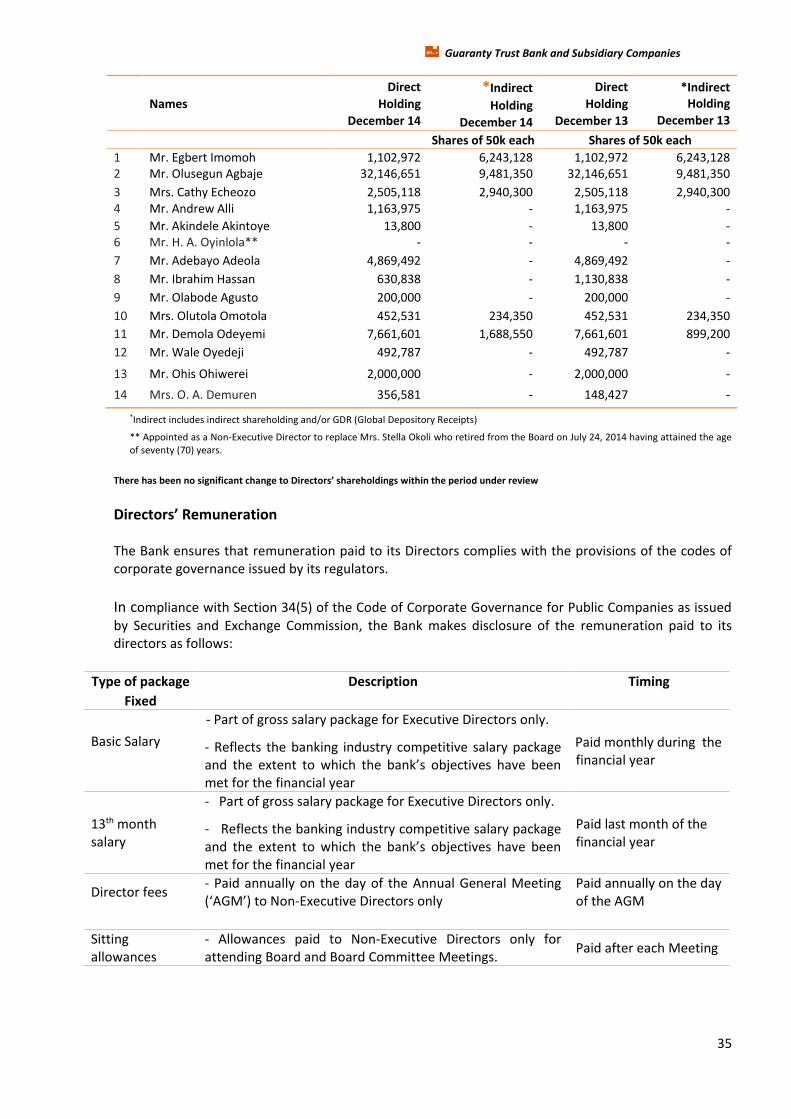
Guaranty Trust Bank and Subsidiary Companies
35
Names
Direct
Holding
December 14
*Indirect
Holding
December 14
Direct
Holding
December 13
*Indirect Holding
December 13
Shares of 50k each Shares of 50k each
1 Mr. Egbert Imomoh 1,102,972 6,243,128 1,102,972 6,243,128 2 Mr. Olusegun Agbaje 32,146,651 9,481,350 32,146,651 9,481,350
3 Mrs. Cathy Echeozo 2,505,118 2,940,300 2,505,118 2,940,300 4 Mr. Andrew Alli 1,163,975 - 1,163,975 -
5 Mr. Akindele Akintoye 13,800 - 13,800 - 6 Mr. H. A. Oyinlola** - - - -
7 Mr. Adebayo Adeola 4,869,492 - 4,869,492 -
8 Mr. Ibrahim Hassan 630,838 - 1,130,838 -
9 Mr. Olabode Agusto 200,000 - 200,000 -
10 Mrs. Olutola Omotola 452,531 234,350 452,531 234,350
11 Mr. Demola Odeyemi 7,661,601 1,688,550 7,661,601 899,200
12 Mr. Wale Oyedeji 492,787 - 492,787 -
13 Mr. Ohis Ohiwerei 2,000,000 - 2,000,000 -
14 Mrs. O. A. Demuren 356,581 - 148,427 -
*Indirect includes indirect shareholding and/or GDR (Global Depository Receipts)
** Appointed as a Non-Executive Director to replace Mrs. Stella Okoli who retired from the Board on July 24, 2014 having attained the age of seventy (70) years.
There has been no significant change to Directors’ shareholdings within the period under review
Directors’ Remuneration The Bank ensures that remuneration paid to its Directors complies with the provisions of the codes of corporate governance issued by its regulators. In compliance with Section 34(5) of the Code of Corporate Governance for Public Companies as issued by Securities and Exchange Commission, the Bank makes disclosure of the remuneration paid to its directors as follows:
Type of package Description Timing
Fixed
Basic Salary
- Part of gross salary package for Executive Directors only.
- Reflects the banking industry competitive salary package and the extent to which the bank’s objectives have been met for the financial year
Paid monthly during the financial year
13th month salary
- Part of gross salary package for Executive Directors only.
- Reflects the banking industry competitive salary package and the extent to which the bank’s objectives have been met for the financial year
Paid last month of the financial year
Director fees - Paid annually on the day of the Annual General Meeting (‘AGM’) to Non-Executive Directors only
Paid annually on the day of the AGM
Sitting allowances
- Allowances paid to Non-Executive Directors only for attending Board and Board Committee Meetings.
Paid after each Meeting
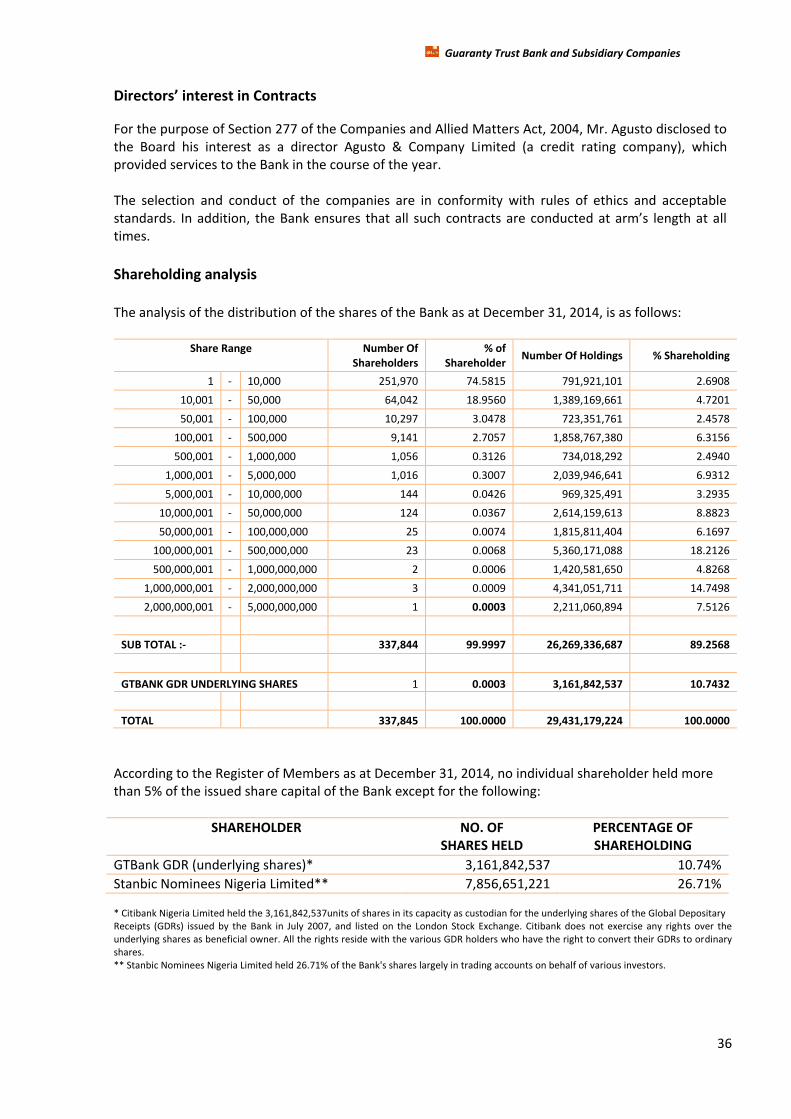
Guaranty Trust Bank and Subsidiary Companies
36
Directors’ interest in Contracts
For the purpose of Section 277 of the Companies and Allied Matters Act, 2004, Mr. Agusto disclosed to the Board his interest as a director Agusto & Company Limited (a credit rating company), which provided services to the Bank in the course of the year. The selection and conduct of the companies are in conformity with rules of ethics and acceptable standards. In addition, the Bank ensures that all such contracts are conducted at arm’s length at all times.
Shareholding analysis The analysis of the distribution of the shares of the Bank as at December 31, 2014, is as follows:
Share Range
Number Of Shareholders
% of Shareholder
Number Of Holdings % Shareholding
1 - 10,000 251,970 74.5815 791,921,101 2.6908
10,001 - 50,000 64,042 18.9560 1,389,169,661 4.7201
50,001 - 100,000 10,297 3.0478 723,351,761 2.4578
100,001 - 500,000 9,141 2.7057 1,858,767,380 6.3156
500,001 - 1,000,000 1,056 0.3126 734,018,292 2.4940
1,000,001 - 5,000,000 1,016 0.3007 2,039,946,641 6.9312
5,000,001 - 10,000,000 144 0.0426 969,325,491 3.2935
10,000,001 - 50,000,000 124 0.0367 2,614,159,613 8.8823
50,000,001 - 100,000,000 25 0.0074 1,815,811,404 6.1697
100,000,001 - 500,000,000 23 0.0068 5,360,171,088 18.2126
500,000,001 - 1,000,000,000 2 0.0006 1,420,581,650 4.8268
1,000,000,001 - 2,000,000,000 3 0.0009 4,341,051,711 14.7498
2,000,000,001 - 5,000,000,000 1 0.0003 2,211,060,894 7.5126
SUB TOTAL :- 337,844 99.9997 26,269,336,687 89.2568
GTBANK GDR UNDERLYING SHARES 1 0.0003 3,161,842,537 10.7432
TOTAL 337,845 100.0000 29,431,179,224 100.0000
According to the Register of Members as at December 31, 2014, no individual shareholder held more than 5% of the issued share capital of the Bank except for the following:
SHAREHOLDER NO. OF SHARES HELD
PERCENTAGE OF SHAREHOLDING
GTBank GDR (underlying shares)* 3,161,842,537 10.74%
Stanbic Nominees Nigeria Limited** 7,856,651,221 26.71% * Citibank Nigeria Limited held the 3,161,842,537units of shares in its capacity as custodian for the underlying shares of the Global Depositary Receipts (GDRs) issued by the Bank in July 2007, and listed on the London Stock Exchange. Citibank does not exercise any rights over the underlying shares as beneficial owner. All the rights reside with the various GDR holders who have the right to convert their GDRs to ordinary shares. ** Stanbic Nominees Nigeria Limited held 26.71% of the Bank's shares largely in trading accounts on behalf of various investors.
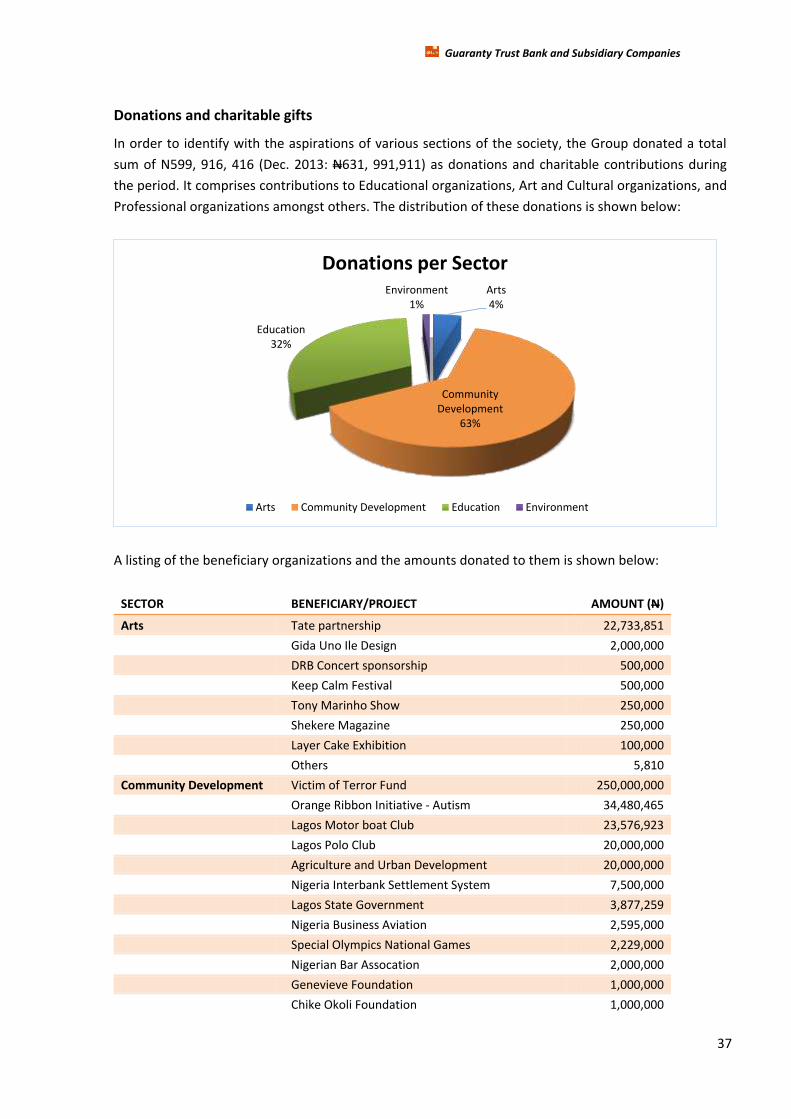
Guaranty Trust Bank and Subsidiary Companies
37
Donations and charitable gifts
In order to identify with the aspirations of various sections of the society, the Group donated a total
sum of N599, 916, 416 (Dec. 2013: N631, 991,911) as donations and charitable contributions during
the period. It comprises contributions to Educational organizations, Art and Cultural organizations, and
Professional organizations amongst others. The distribution of these donations is shown below:
A listing of the beneficiary organizations and the amounts donated to them is shown below:
SECTOR BENEFICIARY/PROJECT AMOUNT (N)
Arts Tate partnership 22,733,851
Gida Uno Ile Design 2,000,000
DRB Concert sponsorship 500,000
Keep Calm Festival 500,000
Tony Marinho Show 250,000
Shekere Magazine 250,000
Layer Cake Exhibition 100,000
Others 5,810
Community Development Victim of Terror Fund 250,000,000
Orange Ribbon Initiative - Autism 34,480,465
Lagos Motor boat Club 23,576,923
Lagos Polo Club 20,000,000
Agriculture and Urban Development 20,000,000
Nigeria Interbank Settlement System 7,500,000
Lagos State Government 3,877,259
Nigeria Business Aviation 2,595,000
Special Olympics National Games 2,229,000
Nigerian Bar Assocation 2,000,000
Genevieve Foundation 1,000,000
Chike Okoli Foundation 1,000,000
Arts4%
Community Development
63%
Education32%
Environment1%
Donations per Sector
Arts Community Development Education Environment

Guaranty Trust Bank and Subsidiary Companies
38
SECTOR BENEFICIARY/PROJECT AMOUNT (N)
Women in Management and Business 1,000,000
Centre for Values in Leadership 950,000
Patrick Speech & Languages Centre 800,000
LINDY'S gem funday 623,585
Southern Sun 500,000
WIE Conference 500,000
International Swimming Competition 500,000
We too can grow 500,000
Nigeria Transition Conference 500,000
Nigeria Association of Women Advancement 500,000
Akintola William 500,000
Child Abuse Campaign 500,000
Nigerian Annual CSR Report 500,000
Honey Bee Foundation 391,000
Volunteer Nigeria Initiative 300,000
House of Purpose Summit 200,000
Brand Leaders Summit 200,000
Nigeria Society for the Blind 200,000
Massey Hospital 175,700
Others 174,000
Onitsha North LG 100,000
CHIPROM 100,000
Special Persons Association 50,000
Education Lagos State Principals Cup 102,698,163
Ogun State Principals Cup 26,954,168
Day Waterman College 18,561,538
Heritage Cup 12,543,970
OMR form Donation to Tertiary Institutions 12,012,000
Adopt-A-School 4,135,350
Masters Cup 3,700,000
African Principals Cup 1,880,000
LSFA Training 1,768,733
American International School 1,000,000
Loyola Jesuit College 500,000
St. Saviours School 500,000
American University 500,000
Orange Excellence 487,200
African- Carribean Student Union 290,000
GEMS preparatory Schools 284,500
University of Stellenbosch 260,250
Eva Adelaja 250,000
Ekiti State University 250,000
Lagos Preparatory School 250,000
Young Achievers Scholarship 20,000
Environment UNEP-FI 1,580,550
Sokoto Roundabout Maintenance 1,473,150

Guaranty Trust Bank and Subsidiary Companies
39
SECTOR BENEFICIARY/PROJECT AMOUNT (N)
CSR Brochure 787,500
Lekki Association 500,000
SERA 500,000
Richardson health and security forum 500,000
Kano Roundabout Maintenance 390,000
Lagos Roundabout Maintenance 315,000
World Habitat Day 300,000
Global Reporting 283,750
Roundabout Maintenance 78,000
Grand Total 599,916,416
Post balance sheet events
There were no post balance sheet events which could have a material effect on the financial position
of the Group as at 31 December, 2014 and profit attributable to equity holders on the date other than
as disclosed in the financial statements.
Research and development
The Bank - on a continuous basis - carries out research into new banking products and services.
Gender Analysis
The number and percentage of women employed during the financial year vis-a-vis total workforce is as follows:
Male Female Total Male Female
Number % Employees 1,850 1,490 3,340 55% 45%
Gender analysis of Board and Top Management is as follows:
Male Female Total Male Female
Number % Board 10 4 14 73% 27% Top Management (AGM - GM) 38 17 55 69% 31% Total 48 21 69 70% 30%
Detailed Gender analysis of Board and Top Management is as follows:
Male Female Total Male Female
Number % Assistant General Manager 17 6 23 74% 26%
Deputy General Manager 14 4 18 78% 22%
General Manager 8 7 15 53% 47%
Executive Director & Deputy Managing Director 3 2 5 60% 40%
Managing Director 1 0 1 100% 0%
Non-Executive Directors 6 2 8 75% 25%
Total 49 21 70 70% 30%
Guaranty Trust Bank and Subsidiary Companies
40
Human Resources Policy (1) Recruitment The Bank conforms with all regulatory requirements in the employment of staff, whilst also ensuring that only fit and proper persons are approved for appointment to board or top management positions. All prescribed pre-employment screening for prospective employees and other requirements for regulatory confirmation of senior management appointments are duly implemented.
(2) Diversity and Inclusion The Bank treats all employees, prospective employees and customers fairly and equally regardless of their gender, sexual orientation, family status, race, colour, nationality, ethnic or national origin, religious belief, age, physical or mental disability, or any such factor. The Bank seeks to achieve a minimum of 30% and 40% female representation at Board and senior management levels respectively, subject to identification of candidates with appropriate skills. “Senior Management” positions for the purpose of this statement refers to Managing Director/CEO, Deputy Managing Director, Executive Director, General Manager, Deputy General Manager, Assistant General Manager, and Senior Manager grades.
(3) Employment of Disabled Persons The Bank operates a non-discriminatory policy in the consideration of applications for employment, including those received from disabled persons. In the event of any employee becoming disabled in the course of employment, where possible, the Bank is in a position to arrange appropriate training to ensure the continuous employment of such a person without subjecting him/her to any disadvantage in his/her career development. In the period under review, the Bank had five persons on its staff list with physical disability.
(4) Employee Involvement and Training The Bank encourages participation of employees in arriving at decisions in respect of matters affecting their well-being through various forum like town hall meetings. Towards this end, the Bank provides opportunities where employees deliberate on issues affecting the Bank and employee interests, with a view to making inputs to decisions thereon. The Bank places a high premium on the development of its workforce. Consequently, the Bank sponsored its employees for various training courses, both locally and overseas, in the period under review. The Bank has also gone into partnership with top-notch executive business schools in Europe and North America to deliver world-class technical and leadership training to employees in Nigeria. In the course of the year under review, the Bank recorded a “first” by being the first bank in Nigeria to have its corporate academy formally recognised with the accreditation of the GTBank Academy Basic School by the Chartered Institute of Bankers of Nigeria (CIBN).

Guaranty Trust Bank and Subsidiary Companies
41
(5) Health, Safety and Welfare of Employees The Bank maintains business premises designed with a view to guaranteeing the safety and healthy living conditions of its employees and customers alike. Employees are adequately insured against occupational and other hazards. In addition, the Bank provides medical facilities to its employees and their immediate families at its expense. In line with the status of the Bank as a family-friendly organization, we operate a crèche facility at Head Office and have plans to expand to other locations shortly. In 2014, a state-of-the-art gymnasium for staff was opened at Head Office. This is in addition to the registration of staff members at fitness centres (within their vicinity) and social clubs towards achieving employee wellness. The Bank has in place a number of training programmes, workshops and enlightenment programmes/publications designed to equip staff members with basic health management tips, First Aid, fire prevention and other occupational safety skills. Fire prevention and fire-fighting equipment are installed in strategic locations within the Bank’s premises. The Bank operates a Group Life and Group Personal Accident (formerly known as Workmen’s Compensation) Insurance covers and Employee Compensation Act contributions for the benefits of its employees. It also operates a contributory pension plan in line with the Pension Reform Act 2004 (amended in 2014) as well as a terminal gratuity scheme for its employees. During the year under review, the terms and conditions of car and mortgage loans were amended to the advantage of employees.
BY ORDER OF THE BOARD
Olutola Omotola
Company Secretary
Plot 635, Akin Adesola Street, Victoria Island, Lagos
28 January, 2015
Guaranty Trust Bank and Subsidiary Companies
42
Statement of Directors’ Responsibilities in Relation to the Financial Statements for
financial year ended December 31, 2014
The Directors accept responsibility for the preparation of the financial statements set out from pages 45-315 that give a true and fair view in accordance with the requirements of the International Financial Reporting Standards.
The Directors further accept responsibility for maintaining adequate accounting records as required by the Companies and Allied Matters Act of Nigeria and for such internal control as the Directors determine is necessary to enable the preparation of financial statements that are free from material misstatement whether due to fraud or error.
Going Concern: The Directors have made assessment of the Company’s ability to continue as a going concern and have no reason to believe that the Bank will not remain a going concern in the years ahead.
Resulting from the above, the directors have a reasonable expectation that the company has adequate resources to continue operations for the foreseeable future. Thus, directors continued the adoption of the going concern basis of accounting in preparing the annual financial statements.
SIGNED ON BEHALF O F THE DIRECTORS BY:
CATHY ECHEOZO SEGUN AGBAJE
28 January, 2015 28 January, 2015
Guaranty Trust Bank and Subsidiary Companies
43
Report of the Audit Committee For the financial year ended 31 December, 2014
To the members of Guaranty Trust Bank Plc
In accordance with the provisions of Section 359 (6) of the Companies and Allied Matters Act 2004, the
members of the Audit Committee of Guaranty Trust Bank Plc hereby report as follows:
♦ We have exercised our statutory functions under Section 359 (6) of the Companies and Allied Matters Act,
2004 and acknowledge the co-operation of management and staff in the conduct of these responsibilities.
♦ We are of the opinion that the accounting and reporting policies of the Bank and Group are in accordance
with legal requirements and agreed ethical practices and that the scope and planning of both the external
and internal audits for the year ended 31 December, 2014 were satisfactory and reinforce the Group’s
internal control systems.
♦ We are satisfied that the Bank has complied with the provisions of Central Bank of Nigeria
circular BSD/1/2004 dated 18 February, 2004 on “Disclosure of directors' related credits in the financial
statements of banks”, and hereby confirm that an aggregate amount of N881,920,000 (31 December,
2013: N2,371,690,000) was outstanding as at 31 Dec, 2014. The status of performance of insider related
credits is as disclosed in Note 48(d).
♦ We have deliberated with the External Auditors, who have confirmed that necessary cooperation was
received from management in the course of their statutory audit and we are satisfied with management’s
responses to the External Auditor’s recommendations on accounting and internal control matters and
with the effectiveness of the Bank’s system of accounting and internal control.
Mr. Akinola B. Akisanmi
Chairman, Audit Committee
FRC/2014/ICAN/00000005627
26 January, 2015
Members of the Audit Committee are:
1. Mr. Akinola B. Akinsami - Chairman
2. Alhaji M.A. Usman
3. Mrs. Sandra Mbagwu-Fagbemi
4. Mr. Bode Agusto
5. Ibrahim Hassan
6. Andrew Alli In attendance:
Mr. Segun Fadahunsi - Secretary
Shareholder’s Representatives
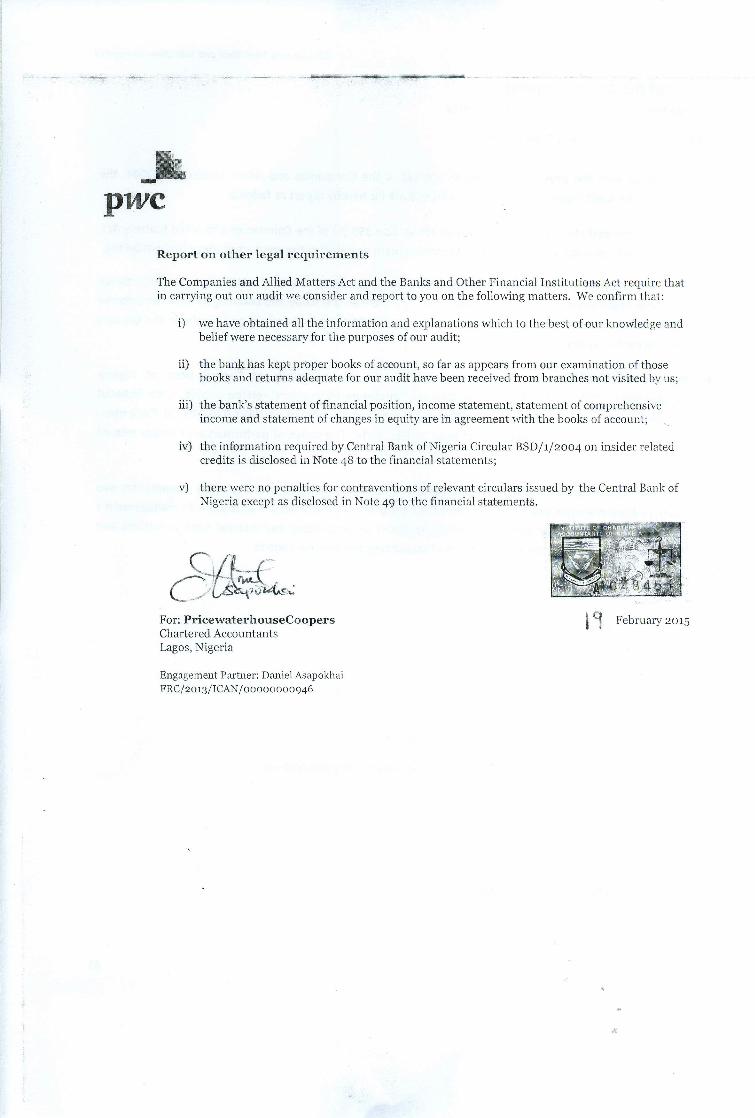
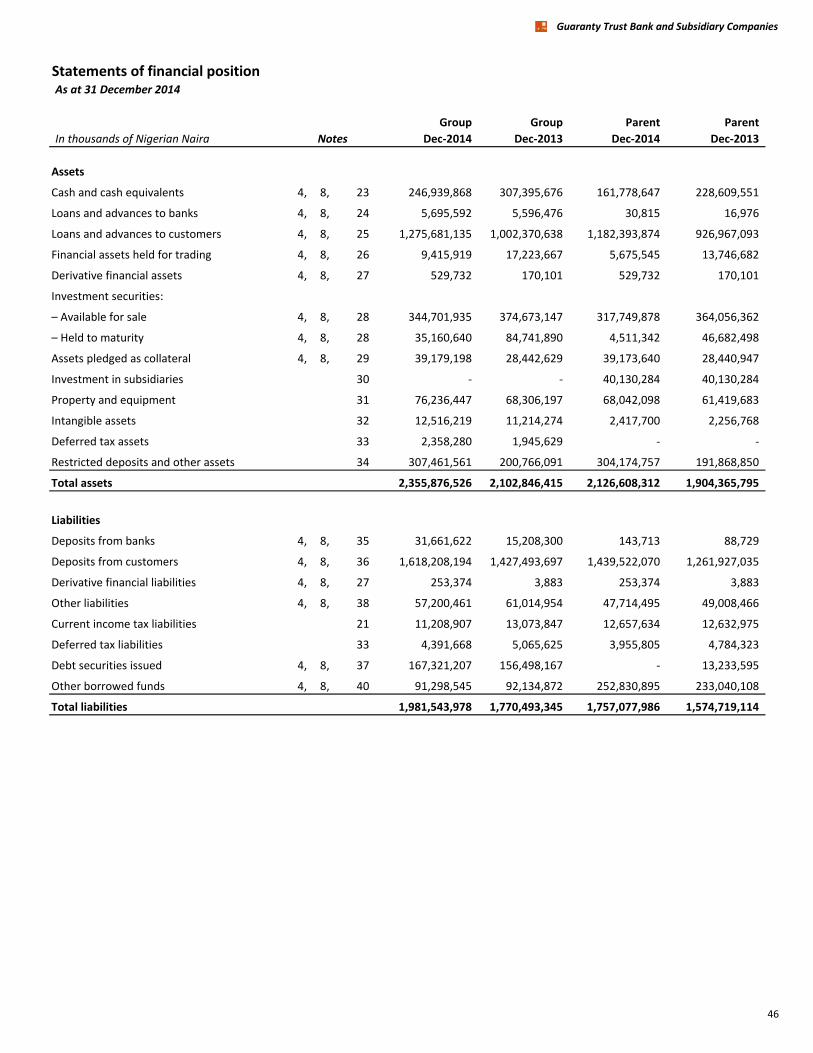
Guaranty Trust Bank and Subsidiary Companies
Statements of financial positionAs at 31 December 2014
Group Group Parent Parent
In thousands of Nigerian Naira Dec-2014 Dec-2013 Dec-2014 Dec-2013
Assets
Cash and cash equivalents 4, 8, 23 246,939,868 307,395,676 161,778,647 228,609,551
Loans and advances to banks 4, 8, 24 5,695,592 5,596,476 30,815 16,976
Loans and advances to customers 4, 8, 25 1,275,681,135 1,002,370,638 1,182,393,874 926,967,093
Financial assets held for trading 4, 8, 26 9,415,919 17,223,667 5,675,545 13,746,682
Derivative financial assets 4, 8, 27 529,732 170,101 529,732 170,101
Investment securities:
– Available for sale 4, 8, 28 344,701,935 374,673,147 317,749,878 364,056,362
– Held to maturity 4, 8, 28 35,160,640 84,741,890 4,511,342 46,682,498
Assets pledged as collateral 4, 8, 29 39,179,198 28,442,629 39,173,640 28,440,947
Investment in subsidiaries 30 - - 40,130,284 40,130,284
Property and equipment 31 76,236,447 68,306,197 68,042,098 61,419,683
Intangible assets 32 12,516,219 11,214,274 2,417,700 2,256,768
Deferred tax assets 33 2,358,280 1,945,629 - -
Restricted deposits and other assets 34 307,461,561 200,766,091 304,174,757 191,868,850
Total assets 2,355,876,526 2,102,846,415 2,126,608,312 1,904,365,795
Liabilities
Deposits from banks 4, 8, 35 31,661,622 15,208,300 143,713 88,729
Deposits from customers 4, 8, 36 1,618,208,194 1,427,493,697 1,439,522,070 1,261,927,035
Derivative financial liabilities 4, 8, 27 253,374 3,883 253,374 3,883
Other liabilities 4, 8, 38 57,200,461 61,014,954 47,714,495 49,008,466
Current income tax liabilities 21 11,208,907 13,073,847 12,657,634 12,632,975
Deferred tax liabilities 33 4,391,668 5,065,625 3,955,805 4,784,323
Debt securities issued 4, 8, 37 167,321,207 156,498,167 - 13,233,595
Other borrowed funds 4, 8, 40 91,298,545 92,134,872 252,830,895 233,040,108
Total liabilities 1,981,543,978 1,770,493,345 1,757,077,986 1,574,719,114
Notes
46
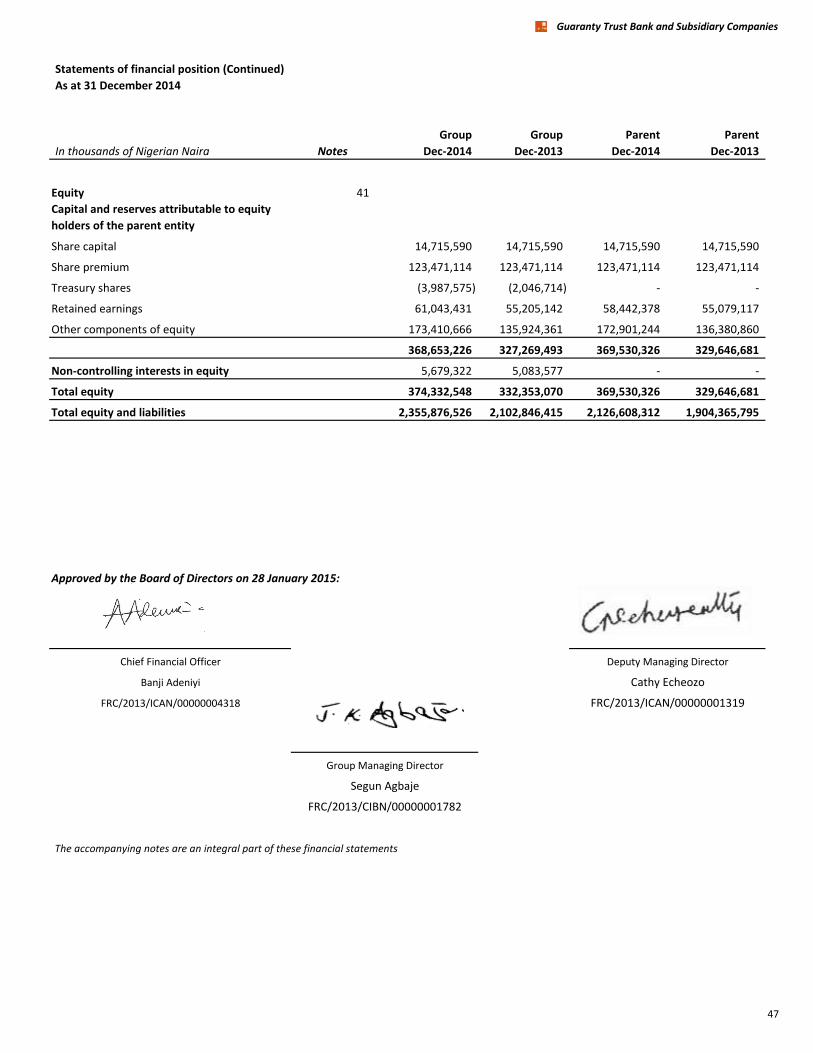
Guaranty Trust Bank and Subsidiary Companies
Statements of financial position (Continued)
As at 31 December 2014
Group Group Parent Parent
In thousands of Nigerian Naira Dec-2014 Dec-2013 Dec-2014 Dec-2013
Equity 41
Capital and reserves attributable to equity
holders of the parent entity
Share capital 14,715,590 14,715,590 14,715,590 14,715,590
Share premium 123,471,114 123,471,114 123,471,114 123,471,114
Treasury shares (3,987,575) (2,046,714) - -
Retained earnings 61,043,431 55,205,142 58,442,378 55,079,117
Other components of equity 173,410,666 135,924,361 172,901,244 136,380,860
368,653,226 327,269,493 369,530,326 329,646,681
Non-controlling interests in equity 5,679,322 5,083,577 - -
Total equity 374,332,548 332,353,070 369,530,326 329,646,681
Total equity and liabilities 2,355,876,526 2,102,846,415 2,126,608,312 1,904,365,795
Approved by the Board of Directors on 28 January 2015:
Chief Financial Officer
Banji Adeniyi
FRC/2013/ICAN/00000004318
The accompanying notes are an integral part of these financial statements
Notes
Group Managing Director
Segun Agbaje
FRC/2013/CIBN/00000001782
Deputy Managing Director
Cathy Echeozo
FRC/2013/ICAN/00000001319
47
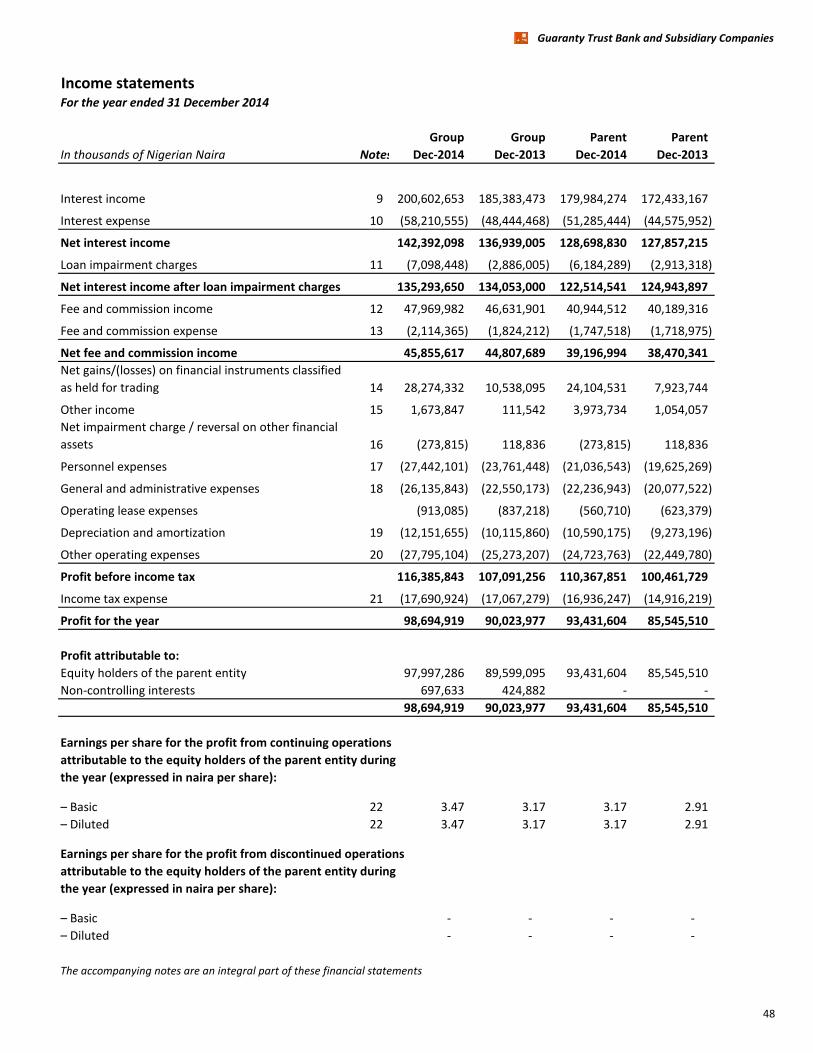
Guaranty Trust Bank and Subsidiary Companies
Income statementsFor the year ended 31 December 2014
Group Group Parent Parent
In thousands of Nigerian Naira Notes Dec-2014 Dec-2013 Dec-2014 Dec-2013
Interest income 9 200,602,653 185,383,473 179,984,274 172,433,167
Interest expense 10 (58,210,555) (48,444,468) (51,285,444) (44,575,952)
Net interest income 142,392,098 136,939,005 128,698,830 127,857,215
Loan impairment charges 11 (7,098,448) (2,886,005) (6,184,289) (2,913,318)
Net interest income after loan impairment charges 135,293,650 134,053,000 122,514,541 124,943,897
Fee and commission income 12 47,969,982 46,631,901 40,944,512 40,189,316
Fee and commission expense 13 (2,114,365) (1,824,212) (1,747,518) (1,718,975)
Net fee and commission income 45,855,617 44,807,689 39,196,994 38,470,341
Net gains/(losses) on financial instruments classified
as held for trading 14 28,274,332 10,538,095 24,104,531 7,923,744
Other income 15 1,673,847 111,542 3,973,734 1,054,057
Net impairment charge / reversal on other financial
assets 16 (273,815) 118,836 (273,815) 118,836
Personnel expenses 17 (27,442,101) (23,761,448) (21,036,543) (19,625,269)
General and administrative expenses 18 (26,135,843) (22,550,173) (22,236,943) (20,077,522)
Operating lease expenses (913,085) (837,218) (560,710) (623,379)
Depreciation and amortization 19 (12,151,655) (10,115,860) (10,590,175) (9,273,196)
Other operating expenses 20 (27,795,104) (25,273,207) (24,723,763) (22,449,780)
Profit before income tax 116,385,843 107,091,256 110,367,851 100,461,729
Income tax expense 21 (17,690,924) (17,067,279) (16,936,247) (14,916,219)
Profit for the year 98,694,919 90,023,977 93,431,604 85,545,510
Profit attributable to:
Equity holders of the parent entity 97,997,286 89,599,095 93,431,604 85,545,510
Non-controlling interests 697,633 424,882 - -
98,694,919 90,023,977 93,431,604 85,545,510
Earnings per share for the profit from continuing operations
attributable to the equity holders of the parent entity during
the year (expressed in naira per share):
– Basic 22 3.47 3.17 3.17 2.91
– Diluted 22 3.47 3.17 3.17 2.91
Earnings per share for the profit from discontinued operations
attributable to the equity holders of the parent entity during
the year (expressed in naira per share):
– Basic - - - -
– Diluted - - - -
The accompanying notes are an integral part of these financial statements
48
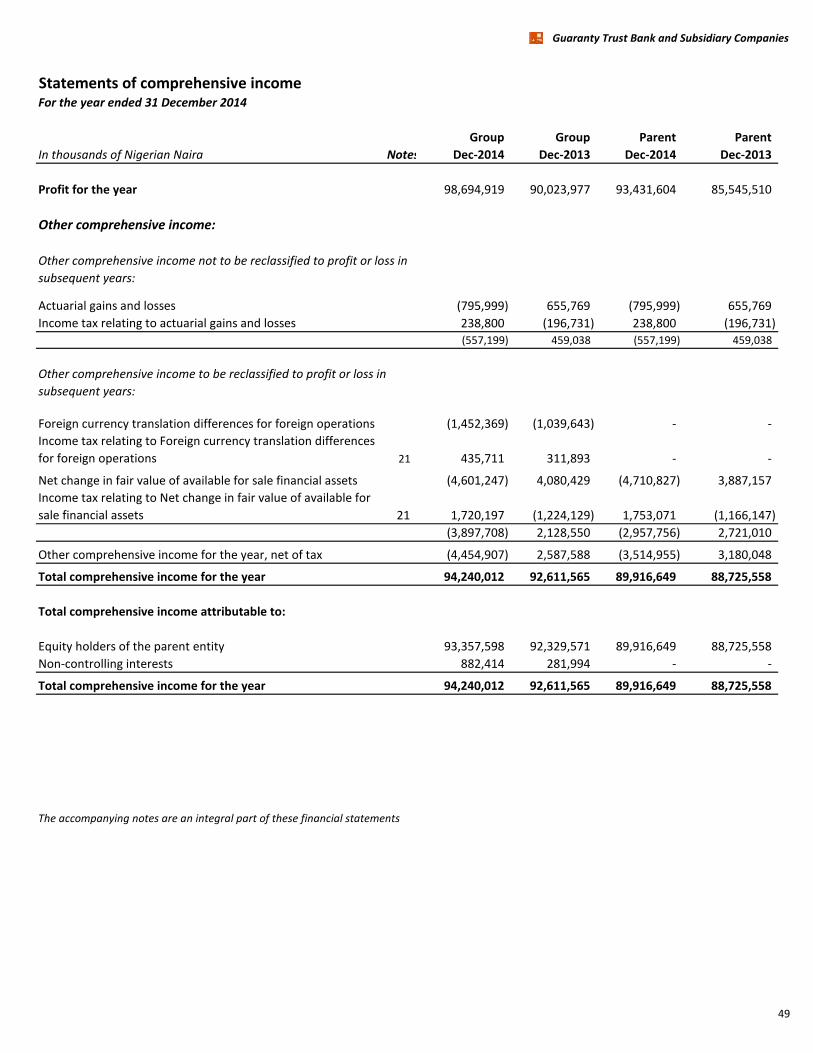
Guaranty Trust Bank and Subsidiary Companies
Statements of comprehensive incomeFor the year ended 31 December 2014
Group Group Parent Parent
In thousands of Nigerian Naira Notes Dec-2014 Dec-2013 Dec-2014 Dec-2013
Profit for the year 98,694,919 90,023,977 93,431,604 85,545,510
Other comprehensive income:
Other comprehensive income not to be reclassified to profit or loss in
subsequent years:
Actuarial gains and losses (795,999) 655,769 (795,999) 655,769
Income tax relating to actuarial gains and losses 238,800 (196,731) 238,800 (196,731)
(557,199) 459,038 (557,199) 459,038
Other comprehensive income to be reclassified to profit or loss in
subsequent years:
Foreign currency translation differences for foreign operations (1,452,369) (1,039,643) - -
Income tax relating to Foreign currency translation differences
for foreign operations 21 435,711 311,893 - -
Net change in fair value of available for sale financial assets (4,601,247) 4,080,429 (4,710,827) 3,887,157
Income tax relating to Net change in fair value of available for
sale financial assets 21 1,720,197 (1,224,129) 1,753,071 (1,166,147)
(3,897,708) 2,128,550 (2,957,756) 2,721,010
Other comprehensive income for the year, net of tax (4,454,907) 2,587,588 (3,514,955) 3,180,048
Total comprehensive income for the year 94,240,012 92,611,565 89,916,649 88,725,558
Total comprehensive income attributable to:
Equity holders of the parent entity 93,357,598 92,329,571 89,916,649 88,725,558
Non-controlling interests 882,414 281,994 - -
Total comprehensive income for the year 94,240,012 92,611,565 89,916,649 88,725,558
The accompanying notes are an integral part of these financial statements
49
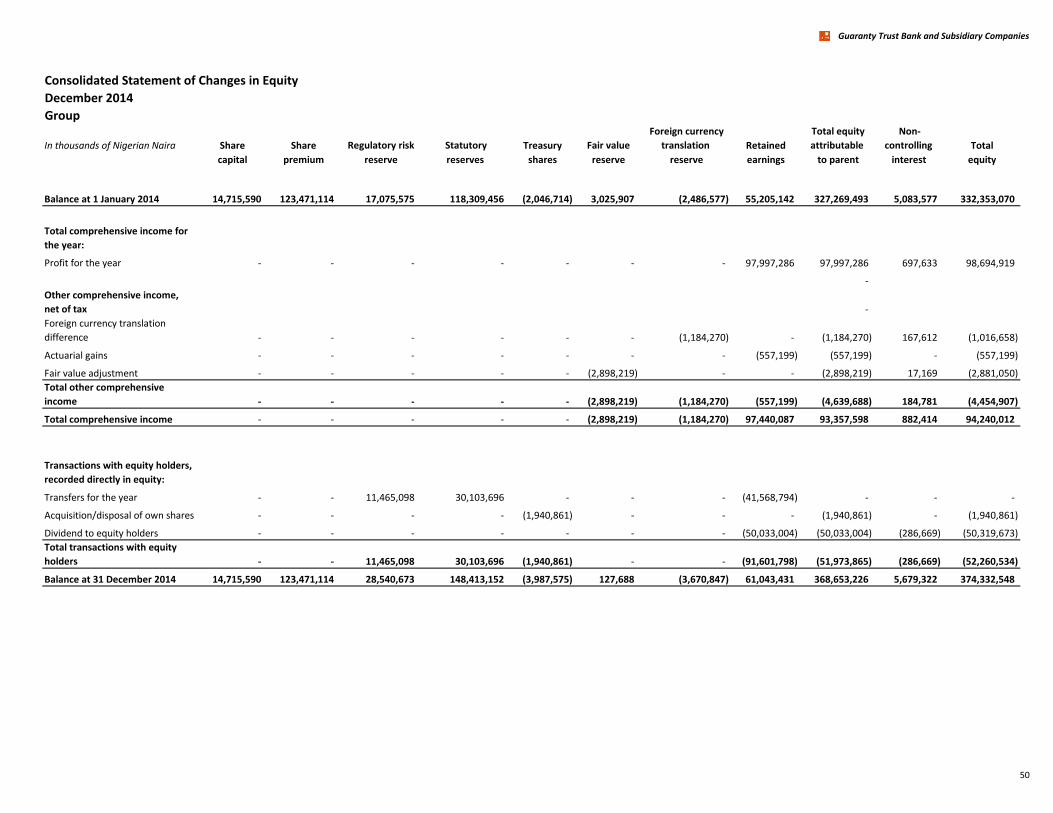
Guaranty Trust Bank and Subsidiary Companies
Consolidated Statement of Changes in Equity
December 2014
Group
In thousands of Nigerian Naira Share Share Regulatory risk Statutory Treasury Fair value
Foreign currency
translation Retained
Total equity
attributable
Non-
controlling Total
capital premium reserve reserves shares reserve reserve earnings to parent interest equity
Balance at 1 January 2014 14,715,590 123,471,114 17,075,575 118,309,456 (2,046,714) 3,025,907 (2,486,577) 55,205,142 327,269,493 5,083,577 332,353,070
Total comprehensive income for
the year:
Profit for the year - - - - - - - 97,997,286 97,997,286 697,633 98,694,919
-
Other comprehensive income,
net of tax -
Foreign currency translation
difference - - - - - - (1,184,270) - (1,184,270) 167,612 (1,016,658)
Actuarial gains - - - - - - - (557,199) (557,199) - (557,199)
Fair value adjustment - - - - - (2,898,219) - - (2,898,219) 17,169 (2,881,050)
Total other comprehensive
income - - - - - (2,898,219) (1,184,270) (557,199) (4,639,688) 184,781 (4,454,907)
Total comprehensive income - - - - - (2,898,219) (1,184,270) 97,440,087 93,357,598 882,414 94,240,012
Transactions with equity holders,
recorded directly in equity:
Transfers for the year - - 11,465,098 30,103,696 - - - (41,568,794) - - -
Acquisition/disposal of own shares - - - - (1,940,861) - - - (1,940,861) - (1,940,861)
Dividend to equity holders - - - - - - - (50,033,004) (50,033,004) (286,669) (50,319,673)
Total transactions with equity
holders - - 11,465,098 30,103,696 (1,940,861) - - (91,601,798) (51,973,865) (286,669) (52,260,534)
Balance at 31 December 2014 14,715,590 123,471,114 28,540,673 148,413,152 (3,987,575) 127,688 (3,670,847) 61,043,431 368,653,226 5,679,322 374,332,548
50

Guaranty Trust Bank and Subsidiary Companies
Consolidated Statement of Changes in Equity
Dec-2013
Group
In thousands of Nigerian Naira Share Share
Regulatory
risk Statutory Treasury Fair value
Foreign currency
translation Retained
Total equity
attributable Non-controlling Total
capital premium reserve reserves shares reserve reserve earnings to parent interest equity
Balance at 1 January 2013 14,715,590 123,471,114 11,312,801 95,070,970 (2,046,714) 169,607 (1,901,715) 39,766,597 280,558,250 1,268,691 281,826,941
Total comprehensive income for the period:
Profit for the year - - - - - - - 89,599,095 89,599,095 424,882 90,023,977
Other comprehensive income, net of tax
Foreign currency translation difference - - - - - - (584,862) - (584,862) (142,888) (727,750)
Actuarial gains - - - - - - - 459,038 459,038 - 459,038
Fair value adjustment - - - - - 2,856,300 - - 2,856,300 - 2,856,300
Total other comprehensive income - - - - - 2,856,300 (584,862) 459,038 2,730,476 (142,888) 2,587,588
Total comprehensive income - - - - - 2,856,300 (584,862) 90,058,133 92,329,571 281,994 92,611,565
Transactions with equity holders, recorded
directly in equity:
Transfers for the year - - 5,762,774 23,238,486 - - - (29,001,260) - - -
Dividend to equity holders - - - - - - - (45,618,328) (45,618,328) (131,631) (45,749,959)
Non-controlling interest of of subsidiary acquired - - - - - - - - - 3,664,523 3,664,523
Total transactions with equity holders - - 5,762,774 23,238,486 - - - (74,619,588) (45,618,328) 3,532,892 (42,085,436)
Balance at 31 December 2013 14,715,590 123,471,114 17,075,575 118,309,456 (2,046,714) 3,025,907 (2,486,577) 55,205,142 327,269,493 5,083,577 332,353,070
51

Guaranty Trust Bank and Subsidiary Companies
Statement of Changes in Equity
December 2014
Parent
In thousands of Nigerian Naira Share Share Regulatory risk Statutory Fair value Retained Total
capital premium reserve reserves reserve earnings equity
Balance at 1 January 2014 14,715,590 123,471,114 16,900,397 116,589,846 2,890,617 55,079,117 329,646,681
Total comprehensive income for the year:
Profit for the year - - - - - 93,431,604 93,431,604
Other comprehensive income, net of tax
Actuarial gains - - - - - (557,199) (557,199)
Fair value adjustment - - - - (2,957,756) - (2,957,756)
Total other comprehensive income - - - - (2,957,756) (557,199) (3,514,955)
Total comprehensive income - - - - (2,957,756) 92,874,405 89,916,649
Transactions with equity holders, recorded
directly in equity:
Transfers for the year - - 11,448,659 28,029,481 - (39,478,140) -
Dividend to equity holders - - - - - (50,033,004) (50,033,004)
Total transactions with equity holders - - 11,448,659 28,029,481 - (89,511,144) (50,033,004)
Balance at 31 December 2014 14,715,590 123,471,114 28,349,056 144,619,327 (67,139) 58,442,378 369,530,326
52
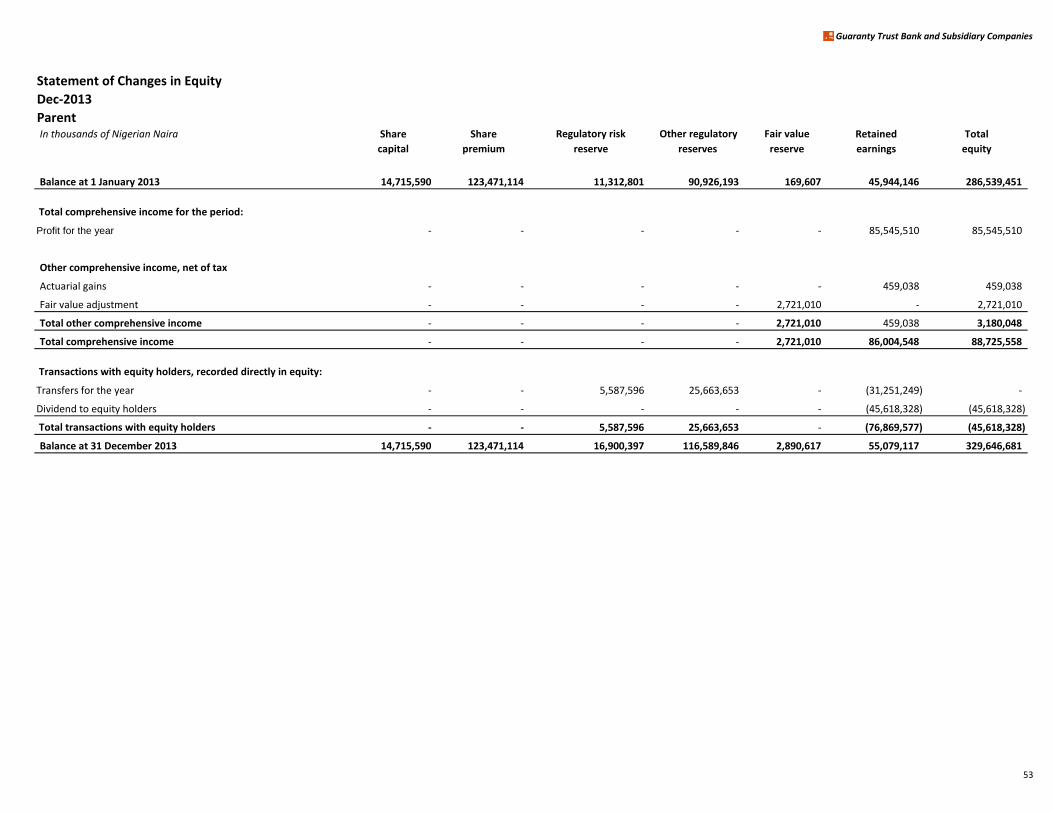
Guaranty Trust Bank and Subsidiary Companies
Statement of Changes in Equity
Dec-2013
ParentIn thousands of Nigerian Naira Share Share Regulatory risk Other regulatory Fair value Retained Total
capital premium reserve reserves reserve earnings equity
Balance at 1 January 2013 14,715,590 123,471,114 11,312,801 90,926,193 169,607 45,944,146 286,539,451
Total comprehensive income for the period:
Profit for the year - - - - - 85,545,510 85,545,510
Other comprehensive income, net of tax
Actuarial gains - - - - - 459,038 459,038
Fair value adjustment - - - - 2,721,010 - 2,721,010
Total other comprehensive income - - - - 2,721,010 459,038 3,180,048
Total comprehensive income - - - - 2,721,010 86,004,548 88,725,558
Transactions with equity holders, recorded directly in equity:
Transfers for the year - - 5,587,596 25,663,653 - (31,251,249) -
Dividend to equity holders - - - - - (45,618,328) (45,618,328)
Total transactions with equity holders - - 5,587,596 25,663,653 - (76,869,577) (45,618,328)
Balance at 31 December 2013 14,715,590 123,471,114 16,900,397 116,589,846 2,890,617 55,079,117 329,646,681
53
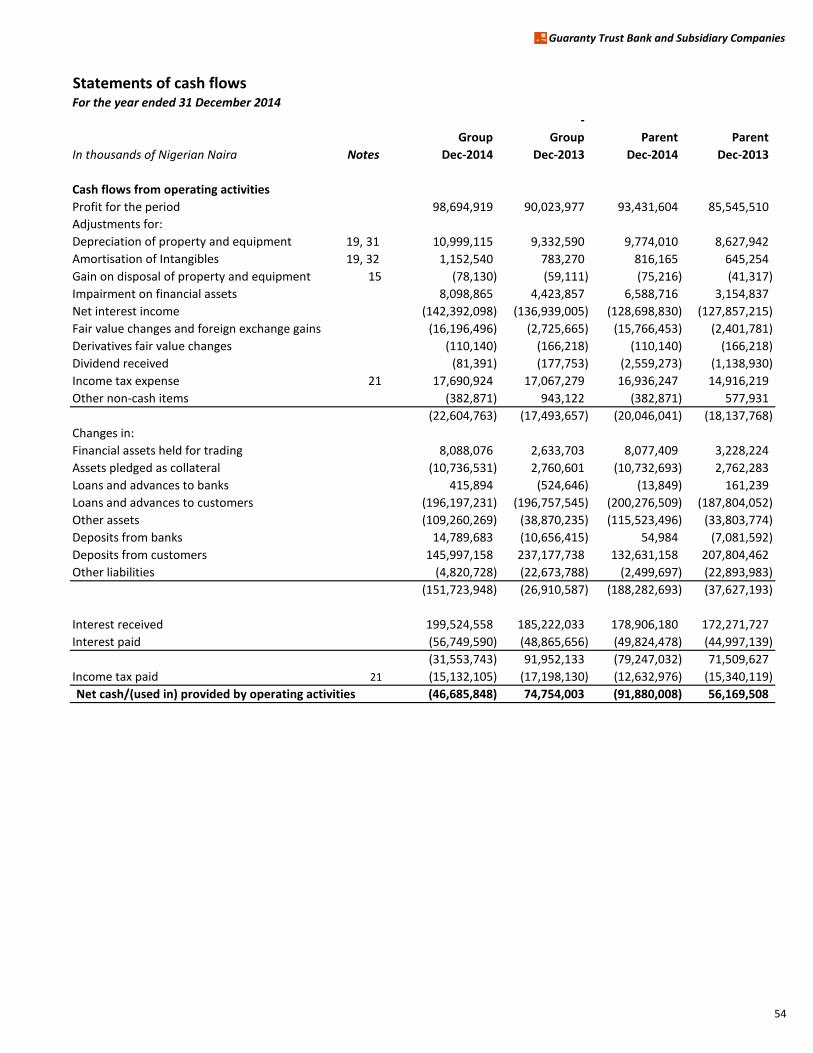
Guaranty Trust Bank and Subsidiary Companies
Statements of cash flowsFor the year ended 31 December 2014
-
Group Group Parent Parent
In thousands of Nigerian Naira Notes Dec-2014 Dec-2013 Dec-2014 Dec-2013
Cash flows from operating activities
Profit for the period 98,694,919 90,023,977 93,431,604 85,545,510
Adjustments for:
Depreciation of property and equipment 19, 31 10,999,115 9,332,590 9,774,010 8,627,942
Amortisation of Intangibles 19, 32 1,152,540 783,270 816,165 645,254
Gain on disposal of property and equipment 15 (78,130) (59,111) (75,216) (41,317)
Impairment on financial assets 8,098,865 4,423,857 6,588,716 3,154,837
Net interest income (142,392,098) (136,939,005) (128,698,830) (127,857,215)
Fair value changes and foreign exchange gains (16,196,496) (2,725,665) (15,766,453) (2,401,781)
Derivatives fair value changes (110,140) (166,218) (110,140) (166,218)
Dividend received (81,391) (177,753) (2,559,273) (1,138,930)
Income tax expense 21 17,690,924 17,067,279 16,936,247 14,916,219
Other non-cash items (382,871) 943,122 (382,871) 577,931
(22,604,763) (17,493,657) (20,046,041) (18,137,768)
Changes in:
Financial assets held for trading 8,088,076 2,633,703 8,077,409 3,228,224
Assets pledged as collateral (10,736,531) 2,760,601 (10,732,693) 2,762,283
Loans and advances to banks 415,894 (524,646) (13,849) 161,239
Loans and advances to customers (196,197,231) (196,757,545) (200,276,509) (187,804,052)
Other assets (109,260,269) (38,870,235) (115,523,496) (33,803,774)
Deposits from banks 14,789,683 (10,656,415) 54,984 (7,081,592)
Deposits from customers 145,997,158 237,177,738 132,631,158 207,804,462
Other liabilities (4,820,728) (22,673,788) (2,499,697) (22,893,983)
(151,723,948) (26,910,587) (188,282,693) (37,627,193)
Interest received 199,524,558 185,222,033 178,906,180 172,271,727
Interest paid (56,749,590) (48,865,656) (49,824,478) (44,997,139)
(31,553,743) 91,952,133 (79,247,032) 71,509,627
Income tax paid 21 (15,132,105) (17,198,130) (12,632,976) (15,340,119)
(46,685,848) 74,754,003 (91,880,008) 56,169,508 Net cash/(used in) provided by operating activities
54
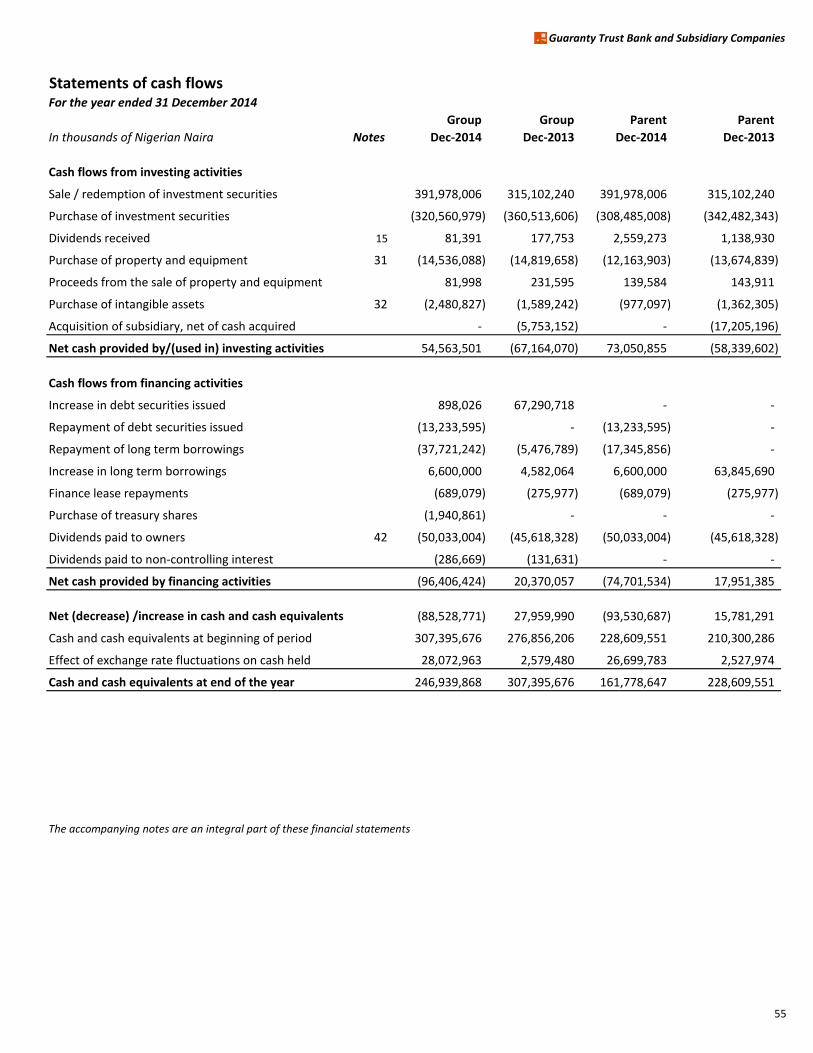
Guaranty Trust Bank and Subsidiary Companies
Statements of cash flowsFor the year ended 31 December 2014
Group Group Parent Parent
In thousands of Nigerian Naira Notes Dec-2014 Dec-2013 Dec-2014 Dec-2013
Cash flows from investing activities
Sale / redemption of investment securities 391,978,006 315,102,240 391,978,006 315,102,240
Purchase of investment securities (320,560,979) (360,513,606) (308,485,008) (342,482,343)
Dividends received 15 81,391 177,753 2,559,273 1,138,930
Purchase of property and equipment 31 (14,536,088) (14,819,658) (12,163,903) (13,674,839)
Proceeds from the sale of property and equipment 81,998 231,595 139,584 143,911
Purchase of intangible assets 32 (2,480,827) (1,589,242) (977,097) (1,362,305)
Acquisition of subsidiary, net of cash acquired - (5,753,152) - (17,205,196)
Net cash provided by/(used in) investing activities 54,563,501 (67,164,070) 73,050,855 (58,339,602)
Cash flows from financing activities
Increase in debt securities issued 898,026 67,290,718 - -
Repayment of debt securities issued (13,233,595) - (13,233,595) -
Repayment of long term borrowings (37,721,242) (5,476,789) (17,345,856) -
Increase in long term borrowings 6,600,000 4,582,064 6,600,000 63,845,690
Finance lease repayments (689,079) (275,977) (689,079) (275,977)
Purchase of treasury shares (1,940,861) - - -
Dividends paid to owners 42 (50,033,004) (45,618,328) (50,033,004) (45,618,328)
Dividends paid to non-controlling interest (286,669) (131,631) - -
Net cash provided by financing activities (96,406,424) 20,370,057 (74,701,534) 17,951,385
Net (decrease) /increase in cash and cash equivalents (88,528,771) 27,959,990 (93,530,687) 15,781,291
Cash and cash equivalents at beginning of period 307,395,676 276,856,206 228,609,551 210,300,286
Effect of exchange rate fluctuations on cash held 28,072,963 2,579,480 26,699,783 2,527,974
Cash and cash equivalents at end of the year 246,939,868 307,395,676 161,778,647 228,609,551
The accompanying notes are an integral part of these financial statements
55
Notes to the Financial statements Guaranty Trust Bank and Subsidiary Companies
56
1. Reporting entity
Guaranty Trust Bank Plc (“the Bank” or “the Parent”) is a company domiciled in Nigeria. The address of the Bank’s registered office is Plot 635, Akin Adesola Street, Victoria Island, Lagos. These separate and consolidated financial statements, for the year ended 31 December 2014, are prepared for the Parent and the Group (Bank and its subsidiaries, separately referred to as “Group entities”) respectively. The Parent and the Group are primarily involved in investment, corporate, commercial and retail banking.
2. Basis of preparation
The Consolidated and Separate financial statements of the Parent and the Group have been prepared in accordance with International Financial Reporting Standards as issued by the IASB , the requirements of the Companies and Allied Matters Act and with the Banks and Other Financial Institutions Act.
These Consolidated and Separate financial statements have been audited and were authorised for issue by the directors on 28, January 2015.
3. (a) Significant Accounting Policies
The accounting policies set out below have been applied consistently to all periods presented in these financial statements. All entities within the group apply the same accounting policies.
(a) Functional and presentation currency
These Consolidated and Separate financial statements are presented in Nigerian Naira, which is the Parent’s functional currency. Except where indicated, financial information presented in Naira has been rounded to the nearest thousand.
(b) Basis of measurement
These financial statements have been prepared on the historical cost basis except for the following:
Derivative financial instruments which are measured at fair value.
Non-derivative financial instruments, carried at fair value through profit or loss, are measured at fair value.
Available-for-sale financial assets are measured at fair value through equity. However, when the fair value of the Available-for-sale financial assets cannot be measured reliably, they are measured at cost less impairment.
Liabilities for cash-settled share-based payment arrangements are measured at fair value.
The liability for defined benefit obligations is recognized as the present value of the defined benefit obligation less the fair value of the plan assets.
The plan assets for defined benefit obligations are measured at fair value.
Assets and liabilities held for trading are measured at fair value
Assets and Liabilities held to maturity are measured at amortised cost
Loans and Receivables are measured at amortised cost.
Notes to the Financial statements Guaranty Trust Bank and Subsidiary Companies
57
(c) Use of Estimates and Judgements The preparation of the financial statements in conformity with IFRS requires the directors to make judgements, estimates and assumptions that affect the application of policies and reported amounts of assets and liabilities, income and expenses. The estimates and associated assumptions are based on historical experience and various other factors that are believed to be reasonable under the circumstances, the results of which form the basis of making the judgements about carrying values of assets and liabilities that are not readily apparent from other sources. Actual results may differ from these estimates.
The estimates and underlying assumptions are reviewed on an ongoing basis. Revisions to
accounting estimates are recognized in the period in which the estimate is revised and in any future periods affected. Information about significant areas of estimation, uncertainties and critical judgements in applying accounting policies that have the most significant effect on the amounts recognised in the financial statements are described in note 6.
(d) Changes to accounting policies
New and amended standards and interpretations The accounting policies adopted are consistent with those of the previous financial period. Standards and interpretations effective during the reporting period Amendments to the following standard(s) became effective in the reporting period from 1st January, 2014. They do not have any material impact on the accounting policies, financial position or performance of the Group.
IFRIC 21- Levies:
The amendment to IFRIC 21 provides guidance on when to recognise liabilities for levies imposed by the Government including government agencies and similar bodies in accordance with rules and regulations. The interpretation addresses what the obligating event is that gives rise to paying a levy and when a liability should be recognised. It clarifies that an entity recognises a liability for a levy no earlier than when the activity that triggers payment, as identified by the relevant legislation, occurs. It also clarifies that a levy liability is accrued progressively only if the activity that triggers payment occurs over a period of time, in accordance with the relevant legislation. For a levy that is triggered upon reaching a minimum threshold, no liability is recognised before the specified minimum threshold is reached. The Group has been recognising liabilities arising from regulations appropriately e.g. AMCON levy imposed on Banks. Therefore this amendment will not have material impact on the Group.
Amendments to IAS 32 – Financial Instruments - Presentation:
This amendment clarifies some of the requirements for offsetting financial assets and financial liabilities on the statement of financial position. The Group has been applying the right of set off if it is available at the date of preparation of statement of financial position (SOFP).
Notes to the Financial statements Guaranty Trust Bank and Subsidiary Companies
58
We do not apply this Right of set off to contingent / future transactions in the preparation of the Statement of Financial Position.
Also, the Group already complies with the legally enforceable criterion contained in these amendments by ensuring that the contractual terms and laws governing contracts give backing (support) to the right to set off financial assets and liabilities where necessary.
Lastly, the Group’s settlement process entails settlement of financial assets and liabilities on a net basis, Therefore, a single net amount is already being reported in the financial statements in accordance with IASB clarifications.
Based on the above, we believe that these amendments would have no material impact on the Group.
Amendments to IFRS 10 Consolidated Financial Statements: IFRS 10 defines an investment entity and introduces an exception from consolidation. This will particularly benefit private equity funds, as those that qualify will fair value all of their investments, including those that are controlled. The amendment to IFRS 10 was accompanied by amendments to IFRS 12 and IAS 27. No member of the Group is an Investment entity thus this amendment does not have impact on the Group.
Amendments to IAS 36 - Impairment of assets: This amendment addresses the disclosure of information about the recoverable amount of impaired assets if that amount is based on fair value less costs of disposal. This amendment has an insignificant impact on the Group. The bulk of impairment of non-financial assets reported in the Group’s financial statements are those related to prepaid fixed assets. These are constantly tested for impairment and recoverable amount determined using either the Value in Use Approach or Fair Value less Cost to Sell Approach depending on the availability of information. The recoverable amounts are also disclosed should there be an increase or reversal in these impairments. The appropriate fair values less cost to sell disclosures are also included in the financial statements. It is noteworthy to state that there were no events which warranted the Group to impair its non-financial assets such as Goodwill , Purchased software and Property and Equipment.
Amendments to IFRS 1 - First-Time Adoption of IFRS:
The amendment provides clarification on the meaning of effective IFRS. It states that an entity may choose to apply either a current standard or a new standard that is not yet mandatory, but permits early application, provided either standard is applied consistently throughout the periods presented in the entity’s first IFRS financial statements. The Group is not a first-time adopter of IFRS, therefore, this amendment is not relevant to the Group.
Amendments to IFRS 2 – Share Based Payment : The amendment captures the definitions of 'vesting condition' and 'market condition' and adds definitions for 'performance condition' and 'service condition' (which were previously part of the definition of 'vesting condition'). The amendment is to be applied

Notes to the Financial statements Guaranty Trust Bank and Subsidiary Companies
59
prospectively. The Group already incorporates the new definition of vesting condition in its accounting of Share Based Payment, as such the amendment will not have any material impact on its books.
Amendments to IFRS 3 – Business Combination The amendment requires contingent consideration in a business acquisition that is classified as an asset or a liability to be measured at fair value through profit or loss whether or not it falls within the scope of IFRS 9 Financial Instruments (or IAS 39 as applicable). The amendment is to be applied prospectively. The update does not have an immediate impact on the Group as it did not engage in any acquisition in the reporting period. It also clarifies that IFRS 3 excludes from its scope the accounting for the formation of a joint arrangement in the financial statements of the joint arrangement itself. The Group does not have a Joint arrangement with any party, hence, the amendment will not impact the Group.
Amendments to IFRS 8 – Operating Segment The amendment stipulates detailed disclosure of the judgments made by management in applying the aggregation criteria to operating segments. It also requires reconciliations of the assets of all reportable segments’ to the assets of the entity if the segments’ assets are reported regularly. The amendment is to be applied retrospectively. Amendments to the standard does not have significant impact on the Group as it currently provides relevant disclosures on its operating segment activities.
Amendments to IFRS 13 – Fair Value Measurement Amendments to the standard provides clarification that short-term receivables and payables with no stated interest rates can be held at invoice amounts when the effects of discounting is immaterial. The amendment also clarifies that the scope of the portfolio exemption defined in paragraph 52 of IFRS 13 includes all contracts within the scope of IAS 39/IFRS 9 regardless of whether they meet the definition of financial assets and financial liabilities. The exemption is in respect of items that have offsetting positions in market and/or counterparty credit risk. This amendment does not have significant impact on the Group as the major components of the entity’s financial statements are financial assets and financial liabilities which are currently measured in accordance with IFRS 7 Financial Instruments – Presentation.
Amendments to IAS 16 - Property, Plant and Equipment and IAS 38 - Intangible Assets The amendment clarifies that the asset may be revalued by reference to observable data on either the gross or the net carrying amount. The amendment also clarifies that accumulated depreciation/amortization is the difference between the gross and carrying amounts of the asset. The Group applies a historical method in its valuation of Property, Plant and Equipment and Intangible Assets, hence, amendment to the standards will not impact the bank.
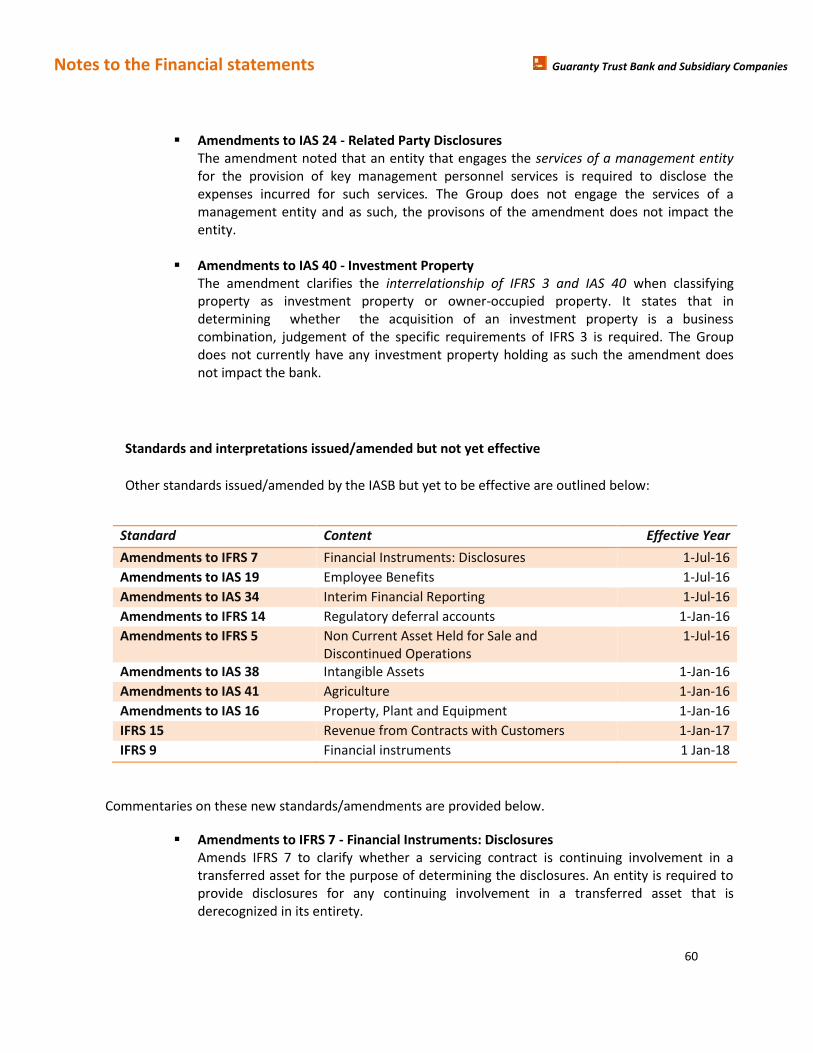
Notes to the Financial statements Guaranty Trust Bank and Subsidiary Companies
60
Amendments to IAS 24 - Related Party Disclosures
The amendment noted that an entity that engages the services of a management entity for the provision of key management personnel services is required to disclose the expenses incurred for such services. The Group does not engage the services of a management entity and as such, the provisons of the amendment does not impact the entity.
Amendments to IAS 40 - Investment Property The amendment clarifies the interrelationship of IFRS 3 and IAS 40 when classifying property as investment property or owner-occupied property. It states that in determining whether the acquisition of an investment property is a business combination, judgement of the specific requirements of IFRS 3 is required. The Group does not currently have any investment property holding as such the amendment does not impact the bank.
Standards and interpretations issued/amended but not yet effective
Other standards issued/amended by the IASB but yet to be effective are outlined below:
Standard Content Effective Year
Amendments to IFRS 7 Financial Instruments: Disclosures 1-Jul-16
Amendments to IAS 19 Employee Benefits 1-Jul-16
Amendments to IAS 34 Interim Financial Reporting 1-Jul-16
Amendments to IFRS 14 Regulatory deferral accounts 1-Jan-16
Amendments to IFRS 5 Non Current Asset Held for Sale and Discontinued Operations
1-Jul-16
Amendments to IAS 38 Intangible Assets 1-Jan-16
Amendments to IAS 41 Agriculture 1-Jan-16
Amendments to IAS 16 Property, Plant and Equipment 1-Jan-16
IFRS 15 Revenue from Contracts with Customers 1-Jan-17
IFRS 9 Financial instruments 1 Jan-18
Commentaries on these new standards/amendments are provided below.
Amendments to IFRS 7 - Financial Instruments: Disclosures Amends IFRS 7 to clarify whether a servicing contract is continuing involvement in a transferred asset for the purpose of determining the disclosures. An entity is required to provide disclosures for any continuing involvement in a transferred asset that is derecognized in its entirety.
Notes to the Financial statements Guaranty Trust Bank and Subsidiary Companies
61
It also clarifies the applicability of IFRS 7 on offsetting disclosures to condensed interim financial statements. It states that these IFRS 7 disclosures are not required in the condensed interim financial report.
Amendments to IAS 19 - Defined Benefit Plans: Employee Contributions Amends IAS 19 to clarify that high quality corporate bonds used in estimating the discount rate for post employment benefits should be denominated in the same currency as the benefits to be paid (thus, the depth of the market for high quality corporate bonds should be assessed at currency level).
Amendments to IAS 34 – Interim Financial Reporting Amends IAS 34 to clarify that the required interim disclosures must either be in the interim financial statements or incorporated by cross reference between the financial statements and wherever they are included within the greater interim financial report (e.g. management commentary or risk report).
IFRS 15 - Revenue from Contracts with Customers IFRS 15 provides a single, principles based five-step model to be applied to all contracts with customers. The five steps in the model are Identification of the contract with the customer, Identification of the performance obligations in the contract, Determination of the transaction price, Allocation of the transaction price to the performance obligations in the contracts, and Recognition of revenue when (or as) the entity satisfies a performance obligation.
IFRS 14- Regulatory deferral accounts: IFRS 14 is designed as a limited scope Standard to provide an interim, short-term solution for rate-regulated entities that have not yet adopted International Financial Reporting Standards (IFRS). Its purpose is to allow rate-regulated entities adopting IFRS for the first-time to avoid changes in accounting policies in respect of regulatory deferral accounts until such time as the International Accounting Standards Board (IASB) can complete its comprehensive project on rate regulated activities. This standard would not have an impact on the Group as it is not a first time preparer of IFRS financial statements. This is in addition to the fact that the regulators of the countries where we operate do not allow creation of any regulatory deferral account.
Amendments to IFRS 5 - Non Current Asset Held for Sale and Discontinued Operations Amends IFRS 5 with specific guidance on changes in disposal methods, for cases in which an entity reclassifies an asset from held for sale to held for distribution or vice versa and cases for which held for distribution accounting is discontinued. The amendment clarifies that changing from one of these disposal methods to the other should not be considered to be a new disposal plan, rather it is a continuation of the original plan.
Amendments to IFRS 11 - Accounting for Acquisitions of Interests in Joint Operations Amends IFRS 11 Joint Arrangements to require an acquirer of an interest in a joint operation in which the activity constitutes a business (as defined in IFRS 3 Business Combinations) to:

Notes to the Financial statements Guaranty Trust Bank and Subsidiary Companies
62
- apply all of the business combinations accounting principles in IFRS 3 and other IFRSs, except for those principles that conflict with the guidance in IFRS 11
- disclose the information required by IFRS 3 and other IFRSs for business combinations.
The amendments apply both to the initial acquisition of an interest in joint operation, and the acquisition of an additional interest in a joint operation (in the latter case, previously held interests are not remeasured).
IFRS 9 - Financial instruments IFRS 9 includes requirements for the recognition and measurement of all financial instruments with emphasis on the accounting for hedging transactions. The standard is a replacement for the current IAS 39. The Group will be impacted significantly by the adoption of IFRS 9 as all financial assets designated as Available for sale (AFS) would have to be classified as either Fair Value Through Profit or Loss or measured at amortised cost. However, the Group would continue to adopt IAS 39 (Financial Instrument: Recognition and Measurement) given that the standard will be for annual periods beginning on or after 1 January, 2018.
Other standards and interpretations issued that are effective for annual periods beginning after January 1, 2015, as shown on page 60, have not been applied in preparing these financial statements and the Group is yet to assess the full impact of the amendments arising from these standards.
3.(b )Other Accounting Policies
Other accounting policies that have been applied are:
(a) Consolidation The financial statements of the subsidiaries used to prepare the consolidated financial statements were prepared as of the parent company’s reporting date. The consolidation principles are unchanged as against the comparative period. (i) Subsidiaries Subsidiaries are entities controlled by the Parent. Control exists when the Parent has: o power over the investee; o exposure, or rights, to variable returns from its involvement with the investee; and o the ability to use its power over the investee to affect the amount of the investor’s returns.
Business combinations are accounted for using the acquisition method as at the acquisition date, which is the date on which control is transferred to the Parent.
Notes to the Financial statements Guaranty Trust Bank and Subsidiary Companies
63
Acquisitions on or after 1 January 2009
For acquisitions on or after 1 January 2009, the Group measures goodwill as the fair value of the consideration transferred including the recognised amount of any non-controlling interest in the acquiree, less the net recognised amount (generally fair value) of the identifiable assets acquired and liabilities assumed, all measured as of the acquisition date. When the excess is negative, a bargain purchase gain is recognised immediately in profit or loss.
The Group elects on a transaction-by-transaction basis whether to measure at the acquisition date components of non-controlling interests in the acquiree that are present ownership interests and entitle their holders to a proportionate share of the entity's net assets in the event of liquidation at its fair value, or at its proportionate share of the recognised amount of the identifiable net assets, as at acquisition date. All other components of non-controlling interests are measured at their acquisition-date fair values, unless another measurement basis is required by IFRS. Transaction costs, other than those associated with the issue of debt or equity securities, that the Group incurs in connection with a business combination are expensed as incurred.
Acquisitions between 1 January 2003 and 1 January 2009
For acquisitions between 1 January 2003 and 1 January 2009, goodwill represents the excess of the cost of the acquisition over the Group’s interest in the recognised amount (generally fair value) of the identifiable assets, liabilities and contingent liabilities of the acquiree. When the excess was negative, a bargain purchase gain was recognised immediately in profit or loss.
Transaction costs, other than those associated with the issue of debt or equity securities, that the Group incurred in connection with business combinations were capitalised as part of the cost of the acquisition.
Acquisitions prior to 1 January 2003
As part of its transition to IFRSs, the Group elected to restate only those business combinations that occurred on or after 1 January 2003. In respect of acquisitions prior to 1 January 2003, goodwill represents the amount recognised under the Group’s previous accounting framework, (Nigerian GAAP).
(ii) Structured entity A structured entity is an entity that has been designed so that voting or similar rights are not the dominant factor in deciding who controls the entity, such as when any voting rights relate to administrative tasks only and the relevant activities are directed by means of contractual arrangements. A structured entity is consolidated if the Group is exposed, or has rights to variable returns from its involvement with the Structured Entity and has the ability to affect those returns through its power over the Structured Entity. Power is the current ability to direct the activities that significantly influence returns. The Group established GTB Finance B.V., Netherlands as a Structured Entity to raise funds from the international financial market. Accordingly , the financial statements of GTB Finance B.V.
Notes to the Financial statements Guaranty Trust Bank and Subsidiary Companies
64
have been consolidated.
(iii) Accounting method of consolidation
Subsidiaries are fully consolidated from the date on which control is transferred to the Group. The results of the subsidiaries acquired or disposed of during the period are included in the consolidated financial statements from the effective acquisition date and or up to the effective date on which control ceases, as appropriate. The integration of the subsidiaries into the consolidated financial statements is based on consistent accounting and valuation methods for similar transactions and other occurrences under similar circumstances. (iv) Transactions eliminated on consolidation Intra-group balances, income and expenses (except for foreign currency translation gains or losses) arising from intra-group transactions, are eliminated in preparing the consolidated financial statements. Unrealised gains arising from transactions with subsidiaries, associates and jointly controlled entities are eliminated to the extent of the Group’s interest in the entity. Unrealised losses are eliminated in the same way as unrealised gains, but only to the extent that there is no evidence of impairment. Profits and losses resulting from intra-group transactions are also eliminated. (v) Non-controlling interest The group applies IFRS 10 Consolidated Financial Statements (2011) in accounting for acquisitions of non-controlling interests. Under this accounting policy, acquisitions of non-controlling interests are accounted for as transactions with equity holders in their capacity as owners and therefore no goodwill is recognised as a result of such transactions. The adjustments to non-controlling interests are based on the proportionate amount of the net assets of the subsidiary.
(b) Foreign currency translation
(i) Functional and presentation currency Items included in the financial statements of each of the Group entities are measured using the currency of the primary economic environment in which the entity operates (‘the functional currency’). (ii) Transactions and balances Foreign currency transactions, that is transactions denominated, or that require settlement in a foreign currency, are translated into the functional currency using the exchange rates prevailing at the dates of the transactions.
Monetary items denominated in foreign currency are translated using the closing rate as at the reporting date. Non-monetary items measured at historical cost denominated in a foreign currency are translated with the exchange rate as at the date of initial recognition; non monetary items in a foreign currency that are measured at fair value are translated using the exchange rates at the date when the fair value was determined. Foreign exchange gains and losses resulting from the settlement of foreign currency
Notes to the Financial statements Guaranty Trust Bank and Subsidiary Companies
65
transactions and from the year end translation of monetary assets and liabilities denominated in foreign currencies are recognised in the Income statement, except when deferred in equity as gains or losses from qualifying cash flow hedging instruments or qualifying net investment hedging instruments. All foreign exchange gains and losses recognised in the Income statement are presented net in the Income statement within the corresponding item. Foreign exchange gains and losses on other comprehensive income items are presented in other comprehensive income within the corresponding item. In the case of changes in the fair value of monetary assets denominated in foreign currency classified as available for sale, a distinction is made between translation differences resulting from changes in amortised cost of the security and other changes in the carrying amount of the security. Translation differences related to changes in the amortised cost are recognised in profit or loss, and other changes in the carrying amount, except impairment, are recognised in equity. (iii) Group Entities The results and financial position of all the Group entities (none of which has the currency of a hyperinflationary economy) that have a functional currency different from the presentation currency are translated into the presentation currency as follows:
Assets and liabilities for each statement of financial position presented are translated at the
closing rate at the date of that statement of financial position;
Income and expenses for each Income statement are translated at average exchange rates (unless this average is not a reasonable approximation of the cumulative effect of the rates prevailing on the transaction dates, in which case income and expenses are translated at the dates of the transactions);
All resulting exchange differences are recognised in other comprehensive income.
Exchange differences arising from the above process are reported in shareholders’ equity as ‘Foreign currency translation reserve’.
On consolidation, exchange differences arising from the translation of the net investment in foreign entities, and of borrowings and other currency instruments designated as hedges of such investments, are taken to ‘Other comprehensive income’. When a foreign operation is disposed of, or partially disposed of, such exchange differences are recognised in the consolidated income statement as part of the gain or loss on sale.
Goodwill and fair value adjustments arising on the acquisition of a foreign entity are treated as assets and liabilities of the foreign entity and translated at the closing rate.
(c) Interest
Interest income and expense for all interest-earning and interest-bearing financial instruments are
Notes to the Financial statements Guaranty Trust Bank and Subsidiary Companies
66
recognised in the income statement within “interest income” and “interest expense” using the effective interest method. The effective interest rate is the rate that exactly discounts the estimated future cash payments and receipts through the expected life of the financial asset or liability (or, where appropriate, the next re-pricing date) to the carrying amount of the financial asset or liability. When calculating the effective interest rate, the Group estimates future cash flows considering all contractual terms of the financial instruments but not future credit losses.
The calculation of the effective interest rate includes contractual fees and points paid or received , transaction costs, and discounts or premiums that are an integral part of the effective interest rate. Transaction costs are incremental costs that are directly attributable to the acquisition, issue or disposal of a financial asset or liability.
Interest income and expense presented in the Income statement include:
Interest on financial assets and liabilities measured at amortised cost calculated on an
effective interest rate basis.
Interest on financial assets measured at fair value through profit or loss calculated on an effective interest rate basis.
Interest on financial assets measured at fair value through OCI calculated on an effective interest rate basis.
(d) Fees and commission
Fees and Commission that are integral to the effective interest rate on a financial asset are included in the measurement of the effective interest rate. Fees, such as processing and management fees charged for assessing the financial position of the borrower, evaluating and reviewing guarantee, collateral and other security, negotiation of instruments’ terms, preparing and processing documentation and finalising the transaction are an integral part of the effective interest rate on a financial asset or liability and are included in the measurement of the effective interest rate of financial assets or liabilities.
Other fees and commissions which relates mainly to transaction and service fees, including loan account structuring and service fees, investment management and other fiduciary activity fees, sales commission, placement line fees, syndication fees and guarantee issuance fees are recognised as the related services are provided / performed.
(e) Net trading income Net trading income comprises gains less losses related to trading assets and liabilities, and it includes all fair value changes, dividends and foreign exchange differences.
Notes to the Financial statements Guaranty Trust Bank and Subsidiary Companies
67
(f) Net income from other financial instruments at fair value through profit or loss Net income from other financial instruments at fair value through profit or loss relates to derivatives held for risk management purposes that do not form part of qualifying hedge relationships.
Fair value changes on other derivatives held for risk management purposes, and other financial assets and liabilities carried at fair value through profit or loss, are presented in Other operating income – Mark to market gain/(loss) on trading investments in the Income statement.
(g) Dividend income Dividend income is recognised when the right to receive income is established. Dividends on trading equities are reflected as a component of net trading income. Dividend income on long term equity investments is recognised as a component of other operating income.
(h) Leases Leases are accounted for in accordance with IAS 17 and IFRIC 4. They are divided into finance leases and operating leases.
(a) The Group is the lessee
(i) Operating lease
Leases in which a significant portion of the risks and rewards of ownership are retained by another party, the lessor, are classified as operating leases. Payments, including prepayments, made under operating leases (net of any incentives received from the lessor) are charged to the income statements on a straight-line basis over the period of the lease. When an operating lease is terminated before the lease period has expired, any payment required to be made to the lessor by way of penalty is recognised as an expense in the period in which termination takes place.
(ii) Finance lease
Leases, where the Group has substantially all the risks and rewards of ownership, are classified as finance leases. Finance leases are capitalised at the lease’s commencement at the lower of the fair value of the leased property and the present value of the minimum lease payments. Each lease payment is allocated between the liability and finance charges so as to achieve a constant rate on the outstanding balance of the finance lease.
The corresponding rental obligations, net of finance charges, are included in other liabilities. The interest element of the finance cost is charged to the Income statement over the lease period so as to produce a constant periodic rate of interest on the remaining balance of the liability for each period. Investment properties acquired under finance lease are measured subsequently at their fair value.
(b) The Group is the lessor
When assets are leased to a third party under finance lease terms, the present value of the lease income is recognised as a receivable. The difference between the gross receivable and the
Notes to the Financial statements Guaranty Trust Bank and Subsidiary Companies
68
present value of the receivable is recognised as unearned finance income. Lease income is recognised over the term of the lease using the net investment method (before tax), which reflects a constant periodic rate of return.
(i) Income Tax
(a) Current income tax Income tax payable is calculated on the basis of the applicable tax law in the respective jurisdiction and it consists of Company Income Tax, Education tax and NITDEF tax. Company Income tax is assessed at a statutory rate of 30% of total profit. Education tax is computed as 2% of assessable profit while NITDEF tax is a 1% levy on Profit before tax of the Bank.
Current income tax is recognised as an expense for the period except to the extent that current tax is related to items that are charged or credited in other comprehensive income or directly to equity. In these circumstances, deferred tax is charged or credit to other comprehensive income or to equity (for example, current tax on available-for-sale investment). Where the Group has tax losses that can be relieved only by carrying it forward against taxable profits of future periods, a deductible temporary difference arises. Those losses carried forward are set off against deferred tax liabilities carried in the consolidated statement of financial position.
The Group evaluates positions stated in tax returns; ensuring information disclosed are in agreement with the underlying tax liability, which has been adequately provided for in the financial statements.
(b) Deferred income tax Deferred income tax is provided in full, using the liability method, on temporary differences arising between the tax bases of assets and liabilities and their carrying amounts in the financial statements. Deferred income tax is determined using tax rates (and laws) that have been enacted or substantively enacted by the end of the reporting period and are expected to apply when the related deferred income tax asset is realised or the deferred income tax liability is settled.
However, the deferred income tax is not recognised for:
temporary differences on the initial recognition of assets or liabilities in a transaction that is not a business combination and that affects neither accounting nor taxable profit or loss;
temporary differences related to investments in subsidiaries where the timing of the reversal of the temporary difference is controlled by the Group and it is probable that they will not reverse in the foreseeable future; and
temporary differences arising on the initial recognition of goodwill.
Notes to the Financial statements Guaranty Trust Bank and Subsidiary Companies
69
Deferred tax assets are recognised when it is probable that future taxable profit will be available against which these temporary differences can be utilised. The tax effects of carry-forwards of unused losses or unused tax credits are recognised as an asset when it is probable that future taxable profits will be available against which these losses can be utilised. Deferred tax related to fair value re-measurement of available-for-sale investments and cash flow hedges, which are recognised in other comprehensive income, is also recognised in the other comprehensive income and subsequently in the income statement together with the deferred gain or loss.
Deferred tax assets and liabilities are offset if there is a legally enforceable right to offset current tax liabilities against current tax assets, and they relate to taxes levied by the same tax authority on the same taxable entity, or on different tax entities, but they intend to settle current tax liabilities and assets on a net basis or their tax assets and liabilities will be realised simultaneously.
(j) Financial assets and liabilities
(i) Recognition
The Group initially recognises loans and advances, Deposits, Debt securities issued and Subordinated liabilities on the date that the Bank becomes a party to the contract. All other financial assets and liabilities (including assets and liabilities designated at fair value through profit or loss) are initially recognised on the trade date at which the Group becomes a party to the contractual provisions of the instrument.
(ii) Classification
The classification of financial instruments depends on the purpose and management’s intention for which the financial instruments were acquired and their characteristics. The Group’s classification of financial assets and liabilities are in accordance with IAS 39, viz: a) Loans and Receivables The group’s loans and receivable comprises loans and advances, cash and cash equivalent and other receivables. Loans and advances are non-derivative financial assets with fixed or determinable payments that are not quoted in an active market and that the Group does not intend to sell immediately or in the near term.
When the Group is the lessor in a lease agreement that transfers substantially all of the risks and rewards incidental to ownership of an asset to the lessee, the arrangement is classified as a finance lease and a receivable equal to the net investment in the lease is recognised and presented within loans and advances.
When the Group purchases a financial asset and simultaneously enters into an agreement to resell the asset (or a substantially similar asset) at a fixed price on a future date (“reverse repo or stock borrowing”), the arrangement is accounted for as a loan or advance, and the

Notes to the Financial statements Guaranty Trust Bank and Subsidiary Companies
70
underlying asset is not recognised in the Group’s financial statements. Cash and cash equivalents include notes and coins on hand, Unrestricted balances held with central banks, Balances held with other banks , Money market placements and highly liquid financial assets with original maturities of less than three months, which are subject to insignificant risk of changes in their fair value, and are used by the Group in the management of its short-term commitments. Cash and cash equivalents are carried at amortised cost in the Statements of financial position.
b) Available-for-sale investments Available-for-sale investments are non-derivative investments that are not designated as another category of financial assets. Unquoted equity securities whose fair value cannot be reliably measured are carried at cost. All other available-for-sale investments are carried at fair value (see note J (iii)).
Interest income is recognised in profit or loss using the effective interest method. Dividend income is recognised in profit or loss when the Group becomes entitled to the dividend. Foreign exchange gains or losses on available-for-sale debt security investments are recognised in profit or loss.
Other fair value changes are recognised directly in other comprehensive income until the investment is sold or impaired whereupon the cumulative gains and losses previously recognised in other comprehensive income are recognised in profit or loss as a reclassification adjustment.
A non-derivative financial asset may be reclassified from the available-for-sale category to the loans and receivable category if it otherwise would have met the definition of loans and receivables and if the Group has the intention and ability to hold that financial asset for the foreseeable future or until maturity.
c) Held-to-maturity
Held-to-maturity investments are non-derivative assets with fixed or determinable payments and fixed maturity that the Group has the positive intent and ability to hold to maturity, and which are not designated at fair value through profit or loss or available-for-sale.
Held-to-maturity investments are carried at amortised cost using the effective interest method. A sale or reclassification of a significant amount of held-to-maturity investments would result in the reclassification of all held-to-maturity investments as available-for-sale, and prevent the Group from classifying investment securities as held-to-maturity for the current and the following two financial years. However, sales and reclassifications in any of the following circumstances would not trigger a reclassification:
Sales or reclassifications that are so close to maturity that changes in the market rate of
interest would not have a significant effect on the financial asset’s fair value.
Notes to the Financial statements Guaranty Trust Bank and Subsidiary Companies
71
Sales or reclassifications after the Group have collected substantially all the asset’s
original Principal.
Sales or reclassification attributable to non-recurring isolated events beyond the Group’s
control that could not have been reasonably anticipated.
d) Financial assets and liabilities at fair value through profit or loss This category comprises two sub-categories: financial assets classified as held for trading, and financial assets designated by the Group as at fair value through profit or loss upon initial recognition. Financial liabilities for which the fair value option is applied are recognised in the Statements of financial position as ‘Financial liabilities designated at fair value’. Fair value changes relating to financial liabilities designated at fair value through profit or loss are recognised in ‘Net gains/(losses) on financial instruments designated at fair value through profit or loss’.
- Financial assets and liabilities classified as held for trading -
Trading assets and liabilities are those assets and liabilities that the Group acquires or incurs principally for the purpose of selling or repurchasing in the near term, or holds as part of a portfolio that is managed together for short-term profit.
Trading assets and liabilities (including derivatives other than those designated as hedging instruments) are initially recognised and subsequently measured at fair value in the statement of financial position with transaction costs recognised in profit or loss. All changes in fair value are recognised as part of net trading income in profit or loss.
- Designation at fair value through profit or loss
The Group designates certain financial assets upon initial recognition as at fair value through profit or loss (fair value option). This designation cannot subsequently be changed. According to IAS 39, the fair value option is only applied when the following conditions are met:
the application of the fair value option reduces or eliminates an accounting mismatch that would otherwise arise or
the financial assets are part of a portfolio of financial instruments which is risk managed and reported to senior management on a fair value basis or
the financial assets consists of debt host and an embedded derivative that must be separated.
To reduce accounting mismatch, the fair value option is applied to certain loans and
Notes to the Financial statements Guaranty Trust Bank and Subsidiary Companies
72
receivables that are hedged with credit derivatives or interest rate swaps but for which the hedge accounting conditions of IAS 39 are not fulfilled. The loans would have been otherwise accounted for at amortised cost, whereas the derivatives are measured at fair value through profit or loss. The fair value option is also applied to investment funds that are part of a portfolio managed on a fair value basis. Furthermore, the fair value option is applied to structured instruments that include embedded derivatives.
Financial assets for which the fair value option is applied are recognised in the Statements of financial position as ‘Financial assets designated at fair value’. Fair value changes relating to financial assets designated at fair value through profit or loss are recognised in ‘Net gains/(losses) on financial instruments designated at fair value through profit or loss’.
(iii) Measurement
All financial instruments are measured initially at their fair value plus transaction costs, except in the case of financial assets and financial liabilities recorded at fair value through profit or loss where transaction cost are expensed in the income statement.
Financial assets at fair value through profit and loss are subsequently measured at fair value. Held to maturity financial assets and Loans and receivables are subsequently measured at amortised cost using the effective interest rate. Available for sale financial assets are subsequently measured at fair value through equity except where the fair value cannot be reliably measured.
Non-trade financial liabilities are measured at amortised cost. Liabilities held for trading are measured at fair value. Subsequent recognition of financial assets and liabilities is at amortised cost or value.
Changes in the fair value of monetary and non monetary securities classified as available-for-sale are recognised in their comprehensive income (OCI). When securities classified as available for sale are sold or impaired, the accumulated fair value adjustments recognized in equity are included in the income statements as “gains or losses from investment securities”.
a) Amortised cost measurement The amortised cost of a financial asset or liability is the amount at which the financial asset or liability is measured at initial recognition, minus principal repayments, plus or minus the cumulative amortisation using the effective interest method of any difference between the initial amount recognised and the maturity amount, minus any reduction for impairment.
b) Fair value measurement
Fair Value is the price that would be received to sell an asset or paid to transfer a liability in
an orderly transaction between market participants at the measurement date
For financial instruments traded in active markets, the determination of fair values of financial assets and financial liabilities is based on quoted market prices or dealer price quotations. This includes listed equity securities and quoted debt instruments on major exchanges (for example,
Notes to the Financial statements Guaranty Trust Bank and Subsidiary Companies
73
NSE, LSE) and broker quotes from Bloomberg and Reuters.
A financial instrument is regarded as quoted in an active market if it is traded in a market with sufficient frequency and volume to provide pricing information on an ongoing basis on the instrument. Otherwise, the market is to be regarded as inactive.
For financial instruments with no readily available quoted market price , fair value is determined using valuation techniques. In these techniques, fair values are estimated from observable data in respect of similar financial instruments, using models to estimate the present value of expected future cash flows or other valuation techniques, using inputs (for example, NIBOR, LIBOR yield curve, FX rates, volatilities and counterparty spreads) existing at the end of the reporting period.
The Group uses widely recognised valuation models for determining fair values of non-standardised financial instruments of lower complexity, such as options or interest rate and currency swaps. For these financial instruments, inputs into models are generally market-observable.
For more complex instruments, the Group uses internally developed models, which are usually based on valuation methods and techniques generally recognised as standard within the industry. Valuation models are used primarily to value derivatives transacted in the over-the-counter market, unlisted debt securities (including those with embedded derivatives) and other debt instruments for which markets were or have become illiquid. Some of the inputs to these models may not be market observable and are therefore estimated based on assumptions.
In cases when the fair value of unlisted equity instruments cannot be determined reliably, the instruments are carried at cost less impairment. For the purpose of disclosure, the fair value for loans and advances as well as liabilities to banks and customers are determined using a present value model on the basis of contractually agreed cash flows, taking into account credit quality, liquidity and costs.
(iv) Offsetting
Financial assets and liabilities are set off and the net amount presented in the statements of financial position when, and only when, the Group has a legal right to set off the amounts and intends either to settle on a net basis or to realise the asset and settle the liability simultaneously. Income and expenses are presented on a net basis only when permitted under IFRSs, or for gains and losses arising from a group of similar transactions such as in the Group’s trading activity.
(v) De-recognition
On derecognition of a financial asset, the difference between the carrying amount of the asset (or the carrying amount allocated to the portion of the asset transferred), and the sum of (i) the consideration received (including any new asset obtained less any new liability assumed) and (ii) any cumulative gain or loss that had been recognized in other comprehensive income is
Notes to the Financial statements Guaranty Trust Bank and Subsidiary Companies
74
recognized in profit or loss. The Group derecognizes a financial asset when the contractual rights to the cash flows from the financial asset expire, or it transfers the rights to receive the contractual cash flows in a transaction in which substantially all the risks and rewards of ownership of the financial asset are transferred or in which the Group neither transfers nor retains substantially all the risks and rewards of ownership and it does not retain control of the financial asset. Any interest in such transferred financial asset that qualify for derecognition that is created or retained by the Group is recognized as a separate asset or liability.
In certain transactions the Group retains the obligations to service the transferred financial asset for a fee. The transferred asset is derecognized if it meets the derecognition criteria. An asset or liability is recognized for the servicing contract, depending on whether the servicing fee is more than adequate (asset) or is less than adequate (liability) for performing the servicing.
The Group enters into transactions whereby it transfers assets recognized on its statement of financial position, but retains either all or substantially all of the risks and rewards of the transferred assets or a portion of them. If all or substantially all risks and rewards are retained, then the transferred assets are not derecognized. Transfers of assets with retention of all or substantially all risks and rewards include, for example, securities lending and repurchase transactions.
When assets are sold to a third party with a concurrent total rate of return swap on the transferred assets, the transaction is accounted for as a secured financing transaction similar to repurchase transactions as the Group retains all or substantially all the risks and rewards of ownership of such assets.
In transactions in which the Group neither retains nor transfers substantially all the risks and rewards of ownership of a financial asset and it retains control over the asset, the Group continues to recognize the asset to the extent of its continuing involvement, determined by the extent to which it is exposed to changes in the value of the transferred asset.
Derecognition of a financial liability occurs only when the obligation is extinguished. A financial liability is said to be extinguished when the obligation is discharged, cancelled or expired.
(vi) Pledge of assets as collateral
Financial assets transferred to external parties that do not qualify for de-recognition (see J(v)) are reclassified in the statement of financial position from investment securities to assets pledged as collateral, if the transferee has received the right to sell or re-pledge them in the event of default from agreed terms.
Initial recognition of assets pledged as collateral is at fair value, whilst subsequent measurement is based on the classification of the financial asset. Assets pledged as collateral are either designated as available for sale or held to maturity. Where the assets pledged as collateral are designated as available for sale, subsequent measurement is at fair-value through equity. Assets
Notes to the Financial statements Guaranty Trust Bank and Subsidiary Companies
75
pledged as collateral designated as held to maturity are measured at amortized cost.
(vii) Sale and repurchase agreements
Securities sold under repurchase agreements (‘repos’) remain on the statements of financial position; the counterparty liability is included in amounts due to other banks, deposits from banks, other deposits or deposits due to customers, as appropriate. Securities purchased under agreements to resell (reverse repos’) are recorded as money market placement. The difference between sale and repurchase price is treated as interest and accrued over the life of the agreements using the effective interest method.
Securities lent to counterparties are also retained in the financial statements. Securities borrowed are not recognised in the financial statements, unless these are sold to third parties, in which case the purchase and sale are recorded with the gain or loss included in trading income.
(viii) Identification and measurement of impairment
(a) Assets carried at amortised cost
The Group assesses at each reporting date whether there is objective evidence that a financial asset or group of financial assets is impaired. A financial asset or a group of financial assets is impaired and impairment losses are incurred only if there is objective evidence of impairment as a result of one or more events that occurred after the initial recognition of the asset (a ‘loss event’) and that loss event (or events) has an impact on the estimated future cash flows of the financial asset or group of financial assets that can be reliably estimated. The criteria that the Group uses to determine that there is objective evidence of an impairment loss include:
(i) significant financial difficulty of the issuer or obligor; (ii) a breach of contract, such as a default or delinquency in interest or principal payments; (iii) the lender, for economic or legal reasons relating to the borrower’s financial difficulty,
granting to the borrower a concession that the lender would not otherwise consider; (iv) it becomes probable that the borrower will enter bankruptcy or other financial re-
organisation; (v) the disappearance of an active market for that financial asset because of financial
difficulties; or (vi) observable data indicating that there is a measurable decrease in the estimated future cash
flows from a portfolio of financial assets since the initial recognition of those assets, although the decrease cannot yet be identified with the individual financial assets in the portfolio, including:
Notes to the Financial statements Guaranty Trust Bank and Subsidiary Companies
76
(i) adverse changes in the payment status of borrowers in the portfolio; and (ii) national economic conditions that correlate with defaults on the assets in the portfolio.
The estimated period between a loss occurring and its identification is determined by local management for each identified portfolio. In general, the periods used vary between three months and 12 months.
The Group first assesses whether objective evidence of impairment exists individually for financial assets that are individually significant, and individually or collectively for financial assets that are not individually significant. If the Group determines that no objective evidence of impairment exists for an individually assessed financial asset, whether significant or not, it includes the asset in a group of financial assets with similar credit risk characteristics and collectively assesses them for impairment. Assets that are individually assessed for impairment and for which an impairment loss is or continues to be recognised are not included in a collective assessment of impairment.
The amount of the loss is measured as the difference between the asset’s carrying amount and the present value of estimated future cash flows (excluding future credit losses that have not been incurred) discounted at the financial asset’s original effective interest rate. The carrying amount of the asset is reduced through the use of an allowance account and the amount of the loss is recognised in the Income statement. If a loan or held-to-maturity investment has a variable interest rate, the discount rate for measuring any impairment loss is the current effective interest rate determined under the contract. As a practical expedient, the Group may measure impairment on the basis of an instrument’s fair value using an observable market price.
The calculation of the present value of the estimated future cash flows of a collateralized financial asset reflects the cash flows that may result from foreclosure less costs for obtaining and selling the collateral, whether or not foreclosure is probable.
For the purposes of a collective evaluation of impairment, financial assets are grouped on the basis of similar credit risk characteristics (that is, on the basis of the Group’s grading process that considers asset type, industry, geographical location, collateral type, past-due status and other relevant factors). Those characteristics are relevant to the estimation of future cash flows for groups of such assets by being indicative of the debtors’ ability to pay all amounts due according to the contractual terms of the assets being evaluated. Future cash flows in a group of financial assets that are collectively evaluated for impairment are estimated on the basis of the contractual cash flows of the assets in the Group and historical loss experience for assets with credit risk characteristics similar to those in the Group. Historical loss experience is adjusted on the basis of current observable data to reflect the effects of current conditions that did not affect the period on which the historical loss experience is based and to remove the effects of conditions in the historical period that do not currently exist.
Estimates of changes in future cash flows for groups of assets should reflect and be
Notes to the Financial statements Guaranty Trust Bank and Subsidiary Companies
77
directionally consistent with changes in related observable data from period to period (for example, changes in unemployment rates, property prices, payment status, or other factors indicative of changes in the probability of losses in the Group and their magnitude). The methodology and assumptions used for estimating future cash flows are reviewed regularly by the Group to reduce any differences between loss estimates and actual loss experience.
When a loan is uncollectible, it is written off against the related allowance for loan impairment. Such loans are written off after all the necessary procedures have been completed and the amount of the loss has been determined. Impairment charges relating to loans and advances to banks and customers are classified in loan impairment charges whilst impairment charges relating to investment securities (held to maturity category) are classified in ‘Net gains/ (losses) on investment securities’.
If, in a subsequent period, the amount of the impairment loss decreases and the decrease can be related objectively to an event occurring after the impairment was recognised (such as an improvement in the debtor’s credit rating), the previously recognised impairment loss is reversed by adjusting the allowance account. The amount of the reversal is recognised in the Income statement.
(b) Assets classified as available for sale
The Group assesses at the end of each reporting period whether there is objective evidence that a financial asset or a group of financial assets is impaired. In the case of equity investments classified as available for sale, a significant or prolonged decline in the fair value of the security below its cost is objective evidence of impairment resulting in the recognition of an impairment loss. If any such evidence exists for available-for-sale financial assets, the cumulative loss – measured as the difference between the acquisition cost and the current fair value, less any impairment loss on that financial asset previously recognised in profit or loss – is removed from equity and recognised in the Income statement. Impairment losses recognised in the Income statement on equity instruments are not reversed through the Income statement. If, in a subsequent period, the fair value of a debt instrument classified as available for sale increases and the increase can be objectively related to an event occurring after the impairment loss was recognised in profit or loss, the impairment loss is reversed through the Income statement.
Assets classified as available for sale are assessed for impairment in the same manner as assets carried at amortised cost.
(k) Investment securities Investment securities are initially measured at fair value plus, in case of investment securities not at fair
value through profit or loss, incremental direct transaction costs and subsequently accounted for depending on their classification as either held for trading, held-to-maturity, fair value through profit or loss or available-for-sale. See description in accounting policy Note J (ii) above
(l) Derivatives held for risk management purposes
Notes to the Financial statements Guaranty Trust Bank and Subsidiary Companies
78
Derivatives held for risk management purposes include all derivative assets and liabilities that are not classified as trading assets or liabilities. Derivatives are recognised initially at fair value; attributable transaction costs are recognised in profit or loss when incurred. Subsequent to initial recognition, derivatives are measured at fair value with changes in fair value recognised in profit or loss.
(m) Investment in subsidiaries Investments in subsidiaries are reported at cost less any impairment (if any).
(n) Property and equipment
(i) Recognition and measurement The bank recognizes items of property, plant and equipment at the time the cost is incurred. These costs include costs incurred initially to acquire or construct an item of property, plant and equipment as well as the costs of its dismantlement, removal or restoration, the obligation for which an entity incurs as a consequence of using the item during a particular period. Items of property and equipment are measured at cost less accumulated depreciation and impairment losses. Cost includes expenditures that are directly attributable to the acquisition of the asset. When parts of an item of property or equipment have different useful lives, they are accounted for as separate items (major components) of property and equipment.
The assets’ carrying values and useful lives are reviewed, and written down if appropriate, at each reporting date. Assets are impaired whenever events or changes in circumstances indicate that the carrying amount is less than the recoverable amount; see note (p) on impairment of non-financial assets.
(ii) Subsequent costs
The cost of replacing part of an item of property or equipment is recognised in the carrying amount of the item if it is probable that the future economic benefits embodied within the part will flow to the Group and its cost can be measured reliably. The carrying amount of the replaced part is derecognised. The costs of the day-to- day servicing of property and equipment are recognised in the income statement as incurred.
(iii) Depreciation Depreciation is recognised in the income statement on a straight-line basis to write down the cost of each asset, to their residual values over the estimated useful lives of each part of an item of property and equipment. Leased assets under finance lease are depreciated over the shorter of the lease term and their useful lives.
Depreciation begins when an asset is available for use and ceases at the earlier of the date that the asset is derecognised or classified as held for sale in accordance with IFRS 5. A non-current asset or disposal group is not depreciated while it is classified as held for sale.
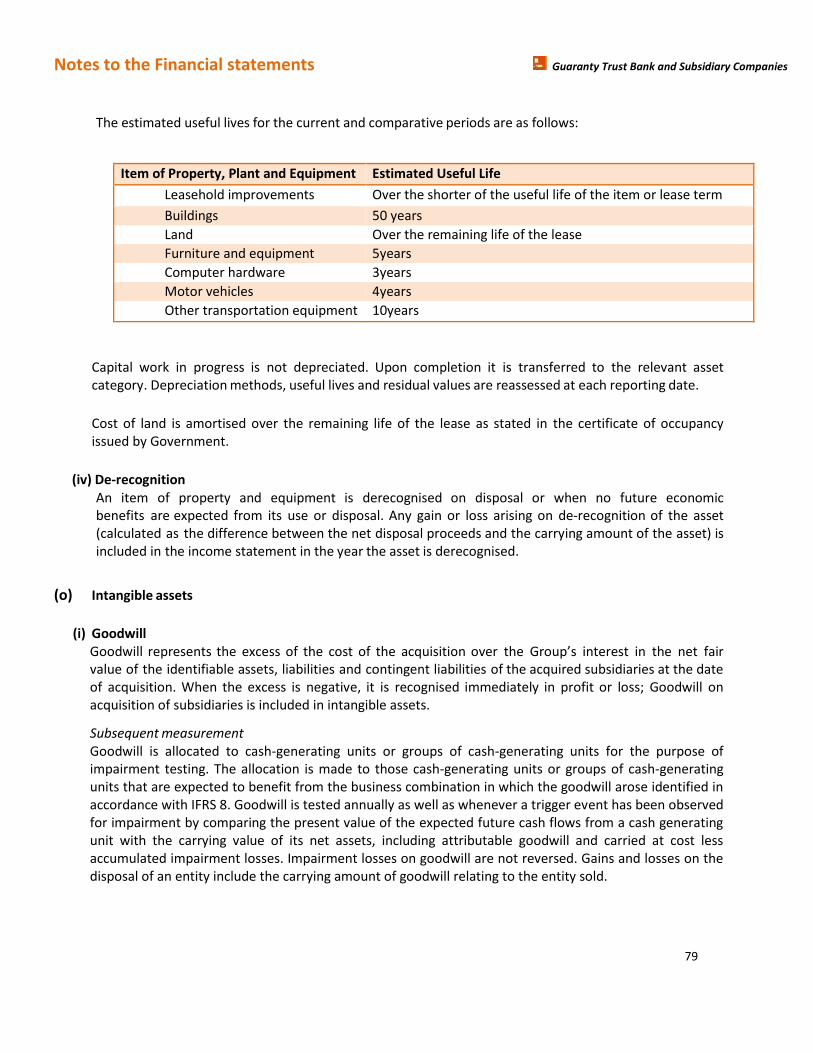
Notes to the Financial statements Guaranty Trust Bank and Subsidiary Companies
79
The estimated useful lives for the current and comparative periods are as follows:
Item of Property, Plant and Equipment Estimated Useful Life
Leasehold improvements Over the shorter of the useful life of the item or lease term
Buildings 50 years
Land Over the remaining life of the lease
Furniture and equipment 5years
Computer hardware 3years
Motor vehicles 4years
Other transportation equipment 10years
Capital work in progress is not depreciated. Upon completion it is transferred to the relevant asset category. Depreciation methods, useful lives and residual values are reassessed at each reporting date.
Cost of land is amortised over the remaining life of the lease as stated in the certificate of occupancy issued by Government.
(iv) De-recognition
An item of property and equipment is derecognised on disposal or when no future economic benefits are expected from its use or disposal. Any gain or loss arising on de-recognition of the asset (calculated as the difference between the net disposal proceeds and the carrying amount of the asset) is included in the income statement in the year the asset is derecognised.
(o) Intangible assets
(i) Goodwill
Goodwill represents the excess of the cost of the acquisition over the Group’s interest in the net fair value of the identifiable assets, liabilities and contingent liabilities of the acquired subsidiaries at the date of acquisition. When the excess is negative, it is recognised immediately in profit or loss; Goodwill on acquisition of subsidiaries is included in intangible assets.
Subsequent measurement Goodwill is allocated to cash-generating units or groups of cash-generating units for the purpose of impairment testing. The allocation is made to those cash-generating units or groups of cash-generating units that are expected to benefit from the business combination in which the goodwill arose identified in accordance with IFRS 8. Goodwill is tested annually as well as whenever a trigger event has been observed for impairment by comparing the present value of the expected future cash flows from a cash generating unit with the carrying value of its net assets, including attributable goodwill and carried at cost less accumulated impairment losses. Impairment losses on goodwill are not reversed. Gains and losses on the disposal of an entity include the carrying amount of goodwill relating to the entity sold.
Notes to the Financial statements Guaranty Trust Bank and Subsidiary Companies
80
(ii) Software Software acquired by the Group is stated at cost less accumulated amortisation and accumulated impairment losses. Expenditure on internally developed software is recognised as an asset when the Group is able to demonstrate its intention and ability to complete the development and use the software in a manner that will generate future economic benefits, and can reliably measure the costs to complete the development. Development costs previously expensed cannot be capitalised. The capitalised costs of internally developed software include all costs directly attributable to developing the software and capitalised borrowing costs, and are amortised over its useful life. Internally developed software is stated at capitalised cost less accumulated amortisation and impairment. Subsequent expenditure on software assets is capitalised only when it increases the future economic benefits embodied in the specific asset to which it relates. All other expenditure is expensed as incurred. Amortisation is recognised in profit or loss on a straight-line basis over the estimated useful life of the software, from the date that it is available for use since this most closely reflects the expected pattern of consumption of the future economic benefits embodied in the asset. The maximum useful life of software is five years. Amortisation methods, useful lives and residual values are reviewed at each financial year-end and adjusted if appropriate.
(p) Impairment of non-financial assets
The carrying amounts of the Group’s non-financial assets, inclusive of deferred tax assets are reviewed at each reporting date to determine whether there is any indication of impairment. If any such indication exists then the asset’s recoverable amount is estimated. For goodwill and intangible assets that have indefinite useful lives or that are available for use, the recoverable amount is estimated each year. However, the Group chooses the cost model measurement to reassess investment property after initial recognition i.e. depreciated cost less any accumulated impairment losses.
An impairment loss is recognised in the income statement if the carrying amount of an asset or its cash-generating unit exceeds its recoverable amount. A cash-generating unit is the smallest identifiable asset group that generates cash flows that largely are independent from other assets and groups. Impairment losses recognised in respect of cash-generating units are allocated first to reduce the carrying amount of any goodwill allocated to the units and then to reduce the carrying amount of the other assets in the unit (group of units) on a pro rata basis.
The recoverable amount of an asset or cash-generating unit is the greater of its value in use and its fair value less costs to sell. In assessing value in use, the estimated future cash flows are discounted to their present value using a pre-tax discount rate that reflects current market assessments of the time value of money and the risks specific to the asset.
An impairment loss in respect of goodwill is not reversed. In respect of other assets, impairment losses recognised in prior periods are assessed at each reporting date for any indications that the loss has decreased or no longer exists. An impairment loss is reversed if there has been a change in the estimates used to
Notes to the Financial statements Guaranty Trust Bank and Subsidiary Companies
81
determine the recoverable amount only to the extent that the asset’s carrying amount does not exceed the carrying amount that would have been determined, net of depreciation or amortisation, if no impairment loss had been recognised.
(q) Deposits, debt securities issued Deposits and debt securities issued are the Group’s sources of debt funding. When the Group sells a financial asset and simultaneously enters into a “repo” or “stock lending” agreement to repurchase the asset (or a similar asset) at a fixed price on a future date, the arrangement is accounted for as a deposit, and the underlying asset continues to be recognised in the Group’s financial statements.
The Group classifies capital instruments as financial liabilities or equity instruments in accordance with the substance of the contractual terms of the instruments.
Deposits and debt securities issued are initially measured at fair value plus transaction costs, and subsequently measured at their amortised cost using the effective interest method, except where the Group chooses to carry the liabilities at fair value through profit or loss.
(r) Provisions A provision is recognized if, as a result of a past event, the Group has a present legal or constructive obligation that can be estimated reliably, and it is probable that an outflow of economic benefits will be required to settle the obligation. Provisions are determined by discounting the expected future cash flows at a pre-tax rate that reflects current market assessments of the time value of money and, where appropriate, the risks specific to the liability.
A provision for restructuring is recognised when the Group has approved a detailed and formal restructuring plan, and the restructuring either has commenced or has been announced publicly. The Group recognizes no provision for future operating losses.
A provision for onerous contracts is recognised when the expected benefits to be derived by the Group from a contract are lower than the unavoidable cost of meeting its obligations under the contract. The provision is measured at the present value of the lower of the expected cost of terminating the contract and the expected net cost of continuing with the contract. Before a provision is established, the Group recognises any impairment loss on the assets associated with that contract.
(s) Financial guarantees
Financial guarantees are contracts that require the Group to make specified payments to reimburse the holder for a loss it incurs because a specified debtor fails to make payment when due in accordance with the terms of a debt instrument. Financial guarantee liabilities are initially recognised at their fair value, and the initial fair value is amortised over the life of the financial guarantee. The guarantee liability is subsequently carried at the higher of this amortised amount and the present value of any expected payment (when a payment under the guarantee has become probable). Financial guarantees, principally consisting of letters of credit are included within other liabilities.
Notes to the Financial statements Guaranty Trust Bank and Subsidiary Companies
82
(t) Employee benefits
(i) Defined contribution plans A defined contribution plan is a pension plan under which the Group pays fixed contributions to a separate entity. The Group has no legal or constructive obligations to pay further contributions if the fund does not hold sufficient assets to pay all employees the benefits relating to employee service in the current and prior periods. For defined contribution plans, the Group pays contributions to publicly or privately administered pension fund administrators (PFA) on a mandatory, contractual or voluntary basis. The Group has no further payment obligations once the contributions have been paid. The contributions are recognised as employee benefit expense in the Statements of Comprehensive Income when they are due. Prepaid contributions are recognised as an asset to the extent that a cash refund or a reduction in the future payments is available. (ii) Defined benefit plans A defined benefit plan is a pension plan that defines an amount of pension benefit that an employee will receive on retirement, usually dependent on one or more factors, such as age, years of service and compensation. The liability recognised in the Statements of financial position in respect of defined benefit pension plans is the present value of the defined benefit obligation at the date of the Statements of financial position less the fair value of plan assets. The defined benefit obligation is calculated annually by independent actuaries using the projected unit credit method. In determining the appropriate discount rate, the Group considers the market yields on Government Bonds of medium duration as compiled by the Debt Management Organisation.
Remeasurements arising from experience adjustments and changes in actuarial assumptions in excess of the plan assets or of the defined benefit obligation are charged or credited to Other Comprehensive Income in the financial year in which they arise. Past-service costs are recognised immediately in the Income statement.
(iii)Termination Benefits Termination benefits are recognised as an expense when the Group is demonstrably committed, without realistic possibility of withdrawal, to a formal detailed plan to terminate employment before the normal retirement date. Termination benefits for voluntary redundancies are recognised if the Group has made an offer encouraging voluntary redundancy, it is probable that the offer will be accepted, and the number of acceptances can be estimated reliably. (iv)Short-term employee benefits Short-term employee benefit obligations are measured on an undiscounted basis and are expensed as the related service is provided.
A liability is recognised for the amount expected to be paid under short-term cash bonus or profit-
Notes to the Financial statements Guaranty Trust Bank and Subsidiary Companies
83
sharing plans if the Group has a present legal or constructive obligation to pay this amount as a result of past service provided by the employee and the obligation can be estimated reliably.
(v) Share-based payment transactions The Bank operates a cash-settled share based compensation plan (i.e. share appreciation rights - SARs) for its management personnel. The management personnel are entitled to the share appreciation rights at a pre-determined price, usually market price, after spending ten years in the Bank.
The fair value of the amount payable to employees in respect of share appreciation rights, which are settled in cash, is recognized as an expense, with a corresponding increase in liabilities, over the period in which the employees become unconditionally entitled to payment. The liability is re-measured at each reporting date and at settlement date. Any changes in the fair value of the liability are recognized as personnel expense in profit or loss.
(u) Discontinued operations The Group presents discontinued operations in a separate line in the Income statement if an entity or a component of an entity has been disposed of or is classified as held for sale and: (a) Represents a separate major line of business or geographical area of operations; (b) Is part of a single co-ordinated plan to dispose of a separate major line of business or geographical area of operations; or (c) Is a subsidiary acquired exclusively with a view to resale Net profit from discontinued operations includes the net total of operating profit and loss before tax from operations, including net gain or loss on sale before tax or measurement to fair value less costs to sell and discontinued operations tax expense. A component of an entity comprises operations and cash flows that can be clearly distinguished, operationally and for financial reporting purposes, from the rest of the Group´s operations and cash flows. If an entity or a component of an entity is classified as a discontinued operation, the Group restates prior periods in the Income statement. Non-current assets classified as held for sale are measured at the lower of carrying amount and fair value less costs to sell. Non-current assets are classified as held for sale if their carrying amount will be recovered through a sale transaction rather than through continuing use. This condition is regarded as met only when the sale is highly probable and the asset is available for immediate sale in its present condition, subject to terms that are usual and customary for sales of such assets.
(v) Share capital and reserves
(i) Share issue costs Incremental costs directly attributable to the issue of an equity instrument are deducted from the initial measurement of the equity instrument.
(ii) Dividend on the Bank’s ordinary shares Dividends on the Bank’s ordinary shares are recognised in equity when approved by the Bank’s
shareholders.
Notes to the Financial statements Guaranty Trust Bank and Subsidiary Companies
84
(iii)Treasury shares Where the Bank or any member of the Group purchases the Bank’s shares, the consideration paid is deducted from shareholders’ equity as treasury shares until they are cancelled. Where such shares are subsequently sold or reissued, any consideration received is included in shareholders’ equity.
(w) Earnings per share The Group presents Basic Earnings Per Share (EPS) for its ordinary shares. Basic EPS is calculated by dividing the profit or loss attributable to ordinary shareholders of the Bank by the weighted average number of ordinary shares outstanding during the period. Diluted EPS is determined by adjusting the profit or loss that is attributable to ordinary shareholders and the weighted-average number of ordinary shares outstanding for effects of all dilutive potential ordinary shares.
(x) Segment reporting
An operating segment is a component of the Group that engages in business activities from which it can earn revenues and incur expenses, including revenues and expenses that relate to transactions with any of the Group’s other components, whose operating results are reviewed regularly by the Executive Management Committee to make decisions about resources allocated to each segment and assess its performance, and for which discrete financial information is available. All costs that are directly traceable to the operating segments are allocated to the segment concerned, while indirect cost are allocated based on the benefits derived from such costs.
Financial Risk Management Guaranty Trust Bank and Subsidiary Companies
85
4. Financial risk management
(a) Introduction and overview Guaranty Trust Bank has a robust and functional Enterprise-wide Risk Management (ERM) Framework that is responsible for identifying and managing the inherent and residual risks facing the Bank. The Group has exposure to the following risks from its use of financial instruments:
Credit risk
Liquidity risk
Market risks
Other key risks faced by the bank as a result of its existence and operations include operational risks, settlement risks, reputational and strategy risks.
This note presents information about the Group’s exposure to each of the risks stated above, its policies and processes for measuring and managing risks, and the management of capital.
(b) Risk Management Philosophy The Risk Management philosophy of the Guaranty Trust Bank Plc Group states thus: “We desire to be the reference point for risk management in the industry whilst maximizing our stakeholders’ objectives. We employ the best risk management practices applicable in our operating environment in order to identify, measure, monitor, control and report every material risks prevailing in our business operation. Consequently, we would not avoid risk but manage it. Risk controls would not constitute an impediment to the achievement of our strategic goals. We continually review our activities to determine the level of risks inherent in them. We also review and adopt appropriate risk response at all time. Our decisions are based on careful analysis of implications of such risks to our strategic goals and our operating environment” This philosophy is drawn from the Guaranty Trust Bank Plc Group’s mission and vision statements and seeks to achieve optimization of the risk – return trade off, while ensuring strong commitment to the following key indices:
Excellent service delivery across business segments
Sound performance reporting (financial and non-financial)
Sound corporate governance
Consistent appreciation in shareholders’ value.
Guaranty Trust Bank Plc group will continue to adhere to the following risk principles to perform consistently on the above stated indices:
The Group will not take any action that will compromise its integrity
The Group will adhere to the Risk Management practice of identifying, measuring, controlling, monitoring and reporting risks.
Financial Risk Management Guaranty Trust Bank and Subsidiary Companies
86
The Group will be mindful of Risk control that may impede the achievement of the Bank's Strategic objectives.
The Group will always comply with all government regulations and embrace global best practices.
The Group will only assume risks that fall within its risk appetite with commensurate returns.
Risk Appetite The Group’s Risk Appetite is defined as the level and type of risks that the Group is willing to take in its exposures and business activities, in order to achieve its strategic objectives, as recommended by Management and approved by the Board of Directors. It explains the acceptable risks and related tolerances, arising from stakeholders’ objectives that the Bank is willing to absorb. The Group’s Risk Appetite Statement states thus; “Guaranty Trust Bank maintains a moderate risk appetite in pursuit of its core strategies to dominate its priority sectors, expand its franchise on Africa continent, contain its operating cost whilst leveraging on technology and remain the most profitable, without taking undue risks.” The Risk Appetite Statement defines the bank’s risk tolerance, taking into consideration the bank’s desire to meet the expectations of different stakeholders including Investors/Shareholders, Regulators, Customers, Rating agencies, Staff and the Community at large. The expectations of the stakeholders may differ yet they congregate into the following; (a) maintaining business (b) growth, profitability and earnings stability, (c) ensuring regulatory compliance, and (d) remaining employer of choice and a good corporate citizen. The Group translated the Risk Appetite statement into quantitative risk limits and qualitative statements (Risk Metrics) to determine its risk profile at a point in time. The Group’s risk appetite is monitored periodically by measuring its risk profile against the defined risk limits through a dashboard
(c) Risk Management Framework The Group’s Risk Management Framework is built on a well-defined organisational structure and established policies to guide in the function of identifying, analysing, managing and monitoring the various risks inherent in the business as well as setting appropriate risk limits and controls to align the risks with the strategic objectives. The r i s k m a n a g e m e n t policies a r e subject to review at least once a year. However more frequent reviews may be conducted a t t h e i n s t a n c e of the Board, when changes in laws, regulations, market conditions or the Group’s activities are material enough to impact on the continued adoption of the existing policies. The Group, through its trainings and management standards and procedures, aims to develop a disciplined and engaging and controlled environment, in which all employees understand their roles and obligations.
The Board of Directors has overall responsibility for the establishment of the Group’s Risk Management framework and exercises its oversight function over all the Group’s prevalent risks via its various committees; Board Risk Committee, Board Credit Committee, and Board Audit Committee. These committees are responsible for developing and monitoring risk policies in their specific areas and report regularly to the Board of Directors. All Board committees have both executive and non-executive members.
The Board Committees are assisted by the various Management Committees in identifying and assessing risks arising from day to day activities of the Group. These committees include:
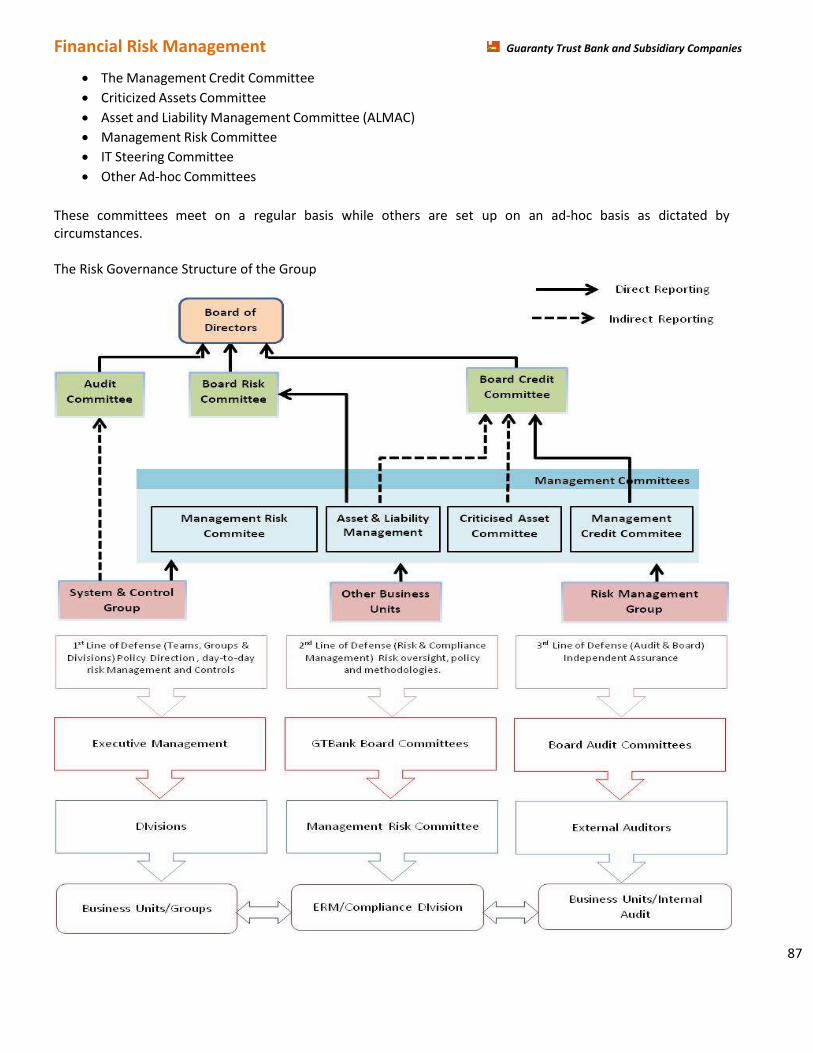
Financial Risk Management Guaranty Trust Bank and Subsidiary Companies
87
The Management Credit Committee
Criticized Assets Committee
Asset and Liability Management Committee (ALMAC)
Management Risk Committee
IT Steering Committee
Other Ad-hoc Committees
These committees meet on a regular basis while others are set up on an ad-hoc basis as dictated by circumstances. The Risk Governance Structure of the Group

Financial Risk Management Guaranty Trust Bank and Subsidiary Companies
88
The Board Risk Committee is responsible for reviewing and recommending risk management policies, procedures and profiles including risk philosophy, risk appetite and risk tolerance of the Group. The oversight functions cut across all risk areas including credit risk,market and interest rate risk, liquidity risk, operational risk, reputation risk, technology risk and other major risks that may arise from time to time. The committee monitors the Group’s plans and progress towards meeting regulatory Risk-Based Supervision requirements including Basel II compliance as well as the overall Regulatory and Economic Capital Adequacy. It also reviews and approves the contingency plan for specific risks and ensures that all members of the Group are fully aware of the risks involved in their functions.
The Group’s Board Audit Committee is responsible for monitoring compliance with the risk management policies and procedures, and for reviewing the adequacy of the risk management framework in relation to risks faced by the Group. The Audit Committee is assisted by the Internal Audit group, in carrying out these functions. Internal Audit undertakes both regular and ad-hoc reviews of risk management controls and procedures, the results of which are reported to the Audit Committee. The Group’s Board of Directors has delegated responsibility for the management of credit risk to the Board Credit Committee. The Board Credit Committee considers and approves all lending exposures, including treasury investment exposures, as well as insider-related credits in excess of limits assigned to the Management Credit Committee by the Board. The committee also ensures that the Bank’s internal control procedures in the area of risk assets remain fool proof to safeguard the quality of the Bank’s risk assets. Management Risk Committee examines risk in its entirety by reviewing and analysing environmental issues and policies impacting the Group, either directly or remotely, and make recommendations to the Board Risk Committee. Management Credit Committee formulates credit policies in consultation with business units, covering credit assessment, risk grading and reporting, collateral, regulatory and statutory requirements. The committee also assesses and approves all credit exposures in excess of the Managing Director’s limit set by the Board.
The Asset & Liability Management Committee establishes the Group’s standards and policies covering the various components of Market Risk Management. These include Interest Rate Risk, Liquidity Risk, Investment Risk and Trading Risk. It ensures that the authority delegated by the Board and Management Risk Committees with regard to Market Risk is exercised, and that Market Risk exposures are monitored and managed. Furthermore, the Committee limits and monitors the potential impact of specific pre-defined market movements on the comprehensive income of the Bank through stress tests and simulations.
Criticised Assets Committee is responsible for the assessment of the bank’s credit risk asset portfolio. It highlights the status of the risk assets in line with the internal and external regulatory framework and ensures that triggers are sent in respect of delinquent credit risk assets. It also ensures adequate provisions are taken in line with the regulatory guidelines.
The Credit Risk Management Group is responsible for identifying, controlling, monitoring and reporting credit risk related issues. The Group also serves as the secretariat for the Management Credit Committee. Credit risk is the most critical risk for the Group as credit exposures, arising from lending activities account for the major portion of the Group’s assets and source of its revenue. Thus, the Group ensures that credit risk related exposures are properly monitored, managed and controlled. The Credit Risk Management Group is responsible for managing the credit exposures, which arise as a result of the lending and investment activities as well other unfunded credit exposures that have default probabilities; such as contingent liabilities.

Financial Risk Management Guaranty Trust Bank and Subsidiary Companies
89
(d) Risk Management Methodology The Group recognizes that it is in the business of managing risks to derive optimal satisfaction for all stakeholders. It has therefore, over the years detailed its approach to risk management through various policies and procedures, which include the following:
ERM Policy
Credit Policy Guide
Human Resources Policy Manual
Quality Manual
Standard Operating Procedures
IT Policy
To ensure adherence to the policies and procedures, several exception reports on customers and activities of the Group are generated by the various audit/control units for management’s decision making. These include:
Monthly Management Profitability Reports (MPR) for the marketing teams
Monthly Operations Performance Reports (OPR) for the support teams
Quarterly Business Profitability Review
Annual Bank-wide performance appraisal systems
Monthly Expense Control Monitoring Report
Criticized Asset Committee Report
(e) Risk Management Overview The Group operates a functional Enterprise-wide Risk Management (ERM) Division that manages all aspects of risk including threats and opportunities. The risk management infrastructure therefore encompasses a comprehensive and integrated approach to identifying, managing, monitoring and reporting:
(i) the 3 main inherent risk groups –Credit, Market and Operational; (ii) additional core risks such as Reputation and Strategy risks
In addition to this, in compliance with the Central Bank of Nigeria’s ‘Risk-based Supervision’ guidelines, and to align with Basel II Capital requirements / best global practices, the Group has incorporated a strategic framework for efficient measurement and management of the bank’s risks and capital. The Group has implemented Basel II recommended capital measurement approaches for the estimate of the bank’s economic capital required to cope with unexpected losses. The Group has also put in place other qualitative and quantitative measures that will assist with enhancing risk management processes and creating a platform for more risk-adjusted decision-making.
Financial Risk Management Guaranty Trust Bank and Subsidiary Companies
90
(f) Credit risk Lending and other financial activities form the core business of the Group. The Group recognises this and has laid great emphasis on effective management of its exposure to credit risk. The Group defines credit risk as the risk of counterparty’s failure to meet the terms of any lending contracts with the Group or otherwise to perform as agreed. Credit risk arises anytime the Group’s funds are extended, committed, invested or otherwise exposed through actual or implied contractual agreements.
The Group’s specific credit risk objectives, as contained in the Credit Risk Management Framework, are:
Maintenance of an efficient loan portfolio
Institutionalization of sound credit culture in the Bank
Adoption of international best practices in credit risk management
Development of Credit Risk Management professionals.
Each business unit is required to implement credit policies and procedures in line with the the credit policy guide approved by the Board . Each business unit is responsible for the quality and performance of its credit portfolio and for monitoring and controlling all credit risks in its portfolio, including those subject to Management Credit Committee’s approval. The Internal Audit and Credit Administration units respectively undertake regular audits of business units and credit quality reviews.
The Group continues to focus attention on intrinsic and concentration risks inherent in its business in order to manage its portfolio risk. It sets portfolio concentration limits that are measured under the following parameters: concentration limits per obligor, business lines, industry, sector, rating grade and geographical area. Sector limits reflect the risk appetite of the Group.
The Group drives the credit risk management processes using appropriate technology to achieve global best practices. To comply with the CBN requirements on implementation of Basel II, especially with the computation of capital adequacy ratio and market disclosure, the Group invested in two major softwares namely: Lead to Loan
and OFSAA Basel II solution. These softwares are customised to suit the internal processes of GTBank and to interact seamlessly with the bank’s core banking application
To satisfy the Basel II pillar 2 requirements, the Group came up with a comprehensive ICAAP (Internal Capital Adequacy Assessment Process) document which detailed our approach and procedures on how the bank measures its various risks and capital required. The document also spells out the capital planning process of the bank. Lead to Loan is an integrated credit solution software which handles customers’ profiles, rating scores, document and collateral management, credit workflow processes, disbursement, recoveries and collection. The deployment of ‘Lead to Loan’ will enhance the credit processes of the Group and guarantee data integrity towards achieving the CBN required sets of disclosure and application of Internal Rating Based – Advanced to the measurement and management of capital. OFSAA Basel II solution is an Oracle Financial Services Analytical Application which is capable of handling the complete range of calculations covered in the Basel II Accord. It supports Risk Weighted Assets (RWA) computation for credit risk, market risk and operational risk and performs the capital computation as well as risk weighted assets aggregation for all risk areas considered. Aside from achieving Pillar 1 with OFSAA, the software is configured to process data from Lead to loan and the bank’s core application and generate different required

Financial Risk Management Guaranty Trust Bank and Subsidiary Companies
91
regulatory reports For Credit Risk Capital Adequacy computation under Basel ll Pillar l, the Group has commenced with the use of the Standardized Approach for Credit Risk Measurement using the OFSAA Basel II solution software, while collating relevant data required for migration to the Internal Rating Based (IRB – Foundation & Advanced) Approach.
For risk management purposes, credit risk arising on trading securities is managed independently, but reported as a component of market risk exposure.
(i) Management of Credit Risk The Board of Directors has delegated responsibility for the management of credit risk to its Board Credit Committee. The Management Credit Committee reporting to the Board Credit Committee is responsible for oversight of the Group’s credit risk, including:
Formulating credit policies in consultation with business units, covering collateral requirements, credit assessment, risk grading and reporting, documentary and legal procedures, and compliance with regulatory and statutory requirements.
Establishing the authorisation structure for the approval and renewal of credit facilities.
Authorisation limits are allocated to business unit heads. Larger facilities require approval by the Management Credit Committee, Deputy Managing Director, Managing Director and the Board Credit Committee/Board of Directors as appropriate.
Reviewing and assessing credit risk. Management Credit Committee assesses all credit
exposures in excess of designated limits, prior to facilities being committed to customers by the business unit concerned. Renewals and reviews of facilities are subject to the same review process.
Developing and maintaining the Group’s risk grading in order to categorise exposures according
to the degree of risk of financial loss faced and to focus management on the attendant risks. The current risk grading framework consists of ten grades reflecting varying degrees of risk of default and the availability of collateral or other credit risk mitigation. The responsibility for approving the risk grades lies with the Board Credit Committee. The risk grades are subject to regular reviews by the Risk Management Group.
Reviewing compliance of business units with agreed exposure limits, including those for
selected industries, country risk and product types. Regular reports are provided to Risk Management Group on the credit quality of local portfolios and appropriate corrective action is taken.
Providing advice, guidance and specialist skills to business units to promote best practice
throughout the Group in the management of credit risk.
There were no changes in the Group’s risk management policies. Each business unit is required to implement Group credit policies and procedures, with credit approval authorised by the Board Credit Committee.
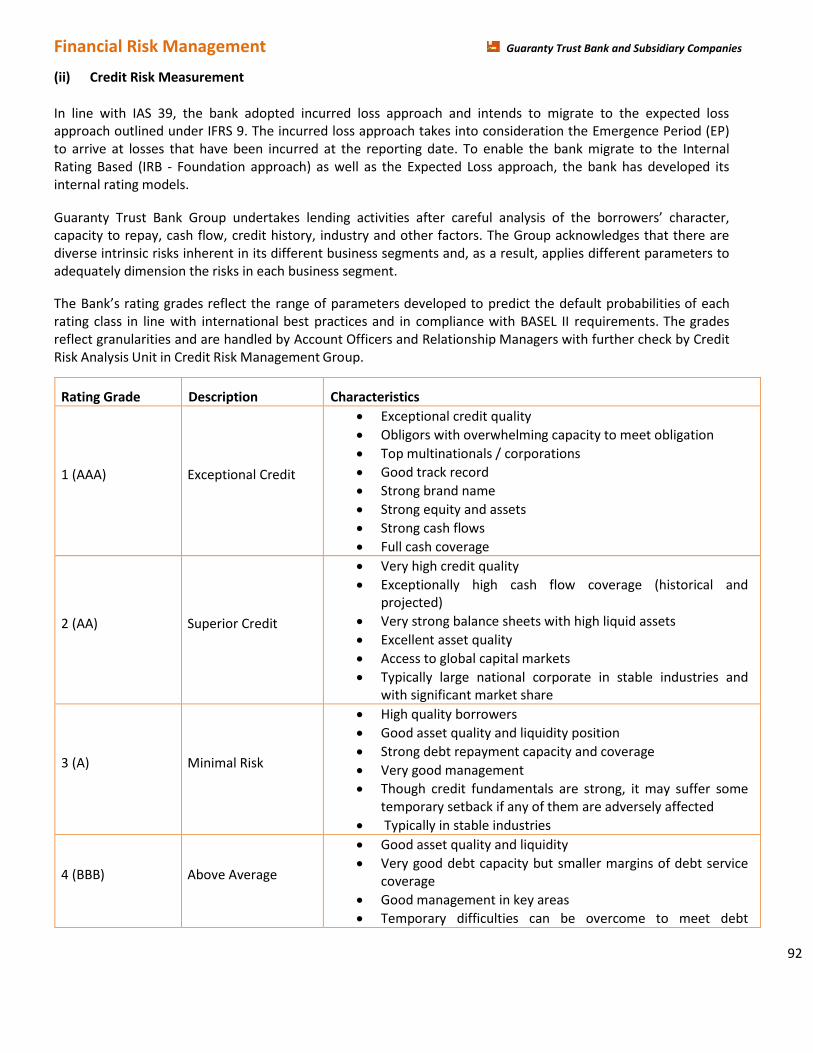
Financial Risk Management Guaranty Trust Bank and Subsidiary Companies
92
(ii) Credit Risk Measurement In line with IAS 39, the bank adopted incurred loss approach and intends to migrate to the expected loss approach outlined under IFRS 9. The incurred loss approach takes into consideration the Emergence Period (EP) to arrive at losses that have been incurred at the reporting date. To enable the bank migrate to the Internal Rating Based (IRB - Foundation approach) as well as the Expected Loss approach, the bank has developed its internal rating models.
Guaranty Trust Bank Group undertakes lending activities after careful analysis of the borrowers’ character, capacity to repay, cash flow, credit history, industry and other factors. The Group acknowledges that there are diverse intrinsic risks inherent in its different business segments and, as a result, applies different parameters to adequately dimension the risks in each business segment.
The Bank’s rating grades reflect the range of parameters developed to predict the default probabilities of each rating class in line with international best practices and in compliance with BASEL II requirements. The grades reflect granularities and are handled by Account Officers and Relationship Managers with further check by Credit Risk Analysis Unit in Credit Risk Management Group.
Rating Grade Description Characteristics
1 (AAA) Exceptional Credit
Exceptional credit quality
Obligors with overwhelming capacity to meet obligation
Top multinationals / corporations
Good track record
Strong brand name
Strong equity and assets
Strong cash flows
Full cash coverage
2 (AA) Superior Credit
Very high credit quality
Exceptionally high cash flow coverage (historical and projected)
Very strong balance sheets with high liquid assets
Excellent asset quality
Access to global capital markets
Typically large national corporate in stable industries and with significant market share
3 (A) Minimal Risk
High quality borrowers
Good asset quality and liquidity position
Strong debt repayment capacity and coverage
Very good management
Though credit fundamentals are strong, it may suffer some temporary setback if any of them are adversely affected
Typically in stable industries
4 (BBB) Above Average
Good asset quality and liquidity
Very good debt capacity but smaller margins of debt service coverage
Good management in key areas
Temporary difficulties can be overcome to meet debt
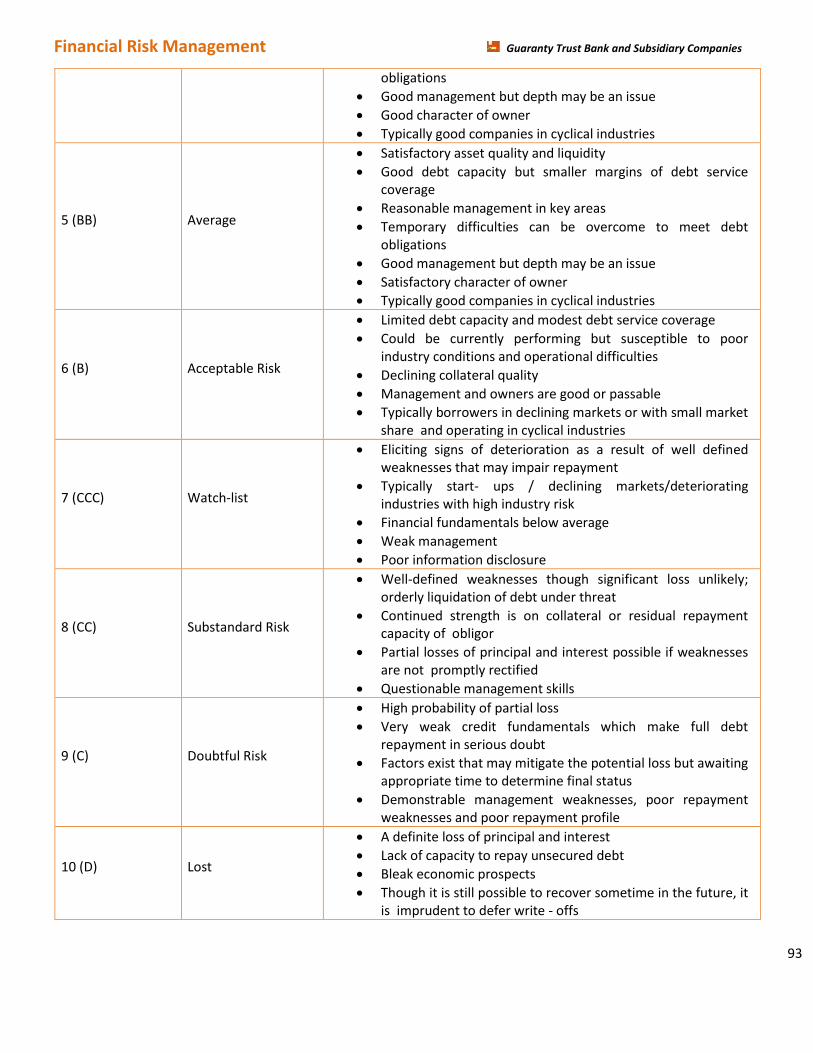
Financial Risk Management Guaranty Trust Bank and Subsidiary Companies
93
obligations
Good management but depth may be an issue
Good character of owner
Typically good companies in cyclical industries
5 (BB) Average
Satisfactory asset quality and liquidity
Good debt capacity but smaller margins of debt service coverage
Reasonable management in key areas
Temporary difficulties can be overcome to meet debt obligations
Good management but depth may be an issue
Satisfactory character of owner
Typically good companies in cyclical industries
6 (B) Acceptable Risk
Limited debt capacity and modest debt service coverage
Could be currently performing but susceptible to poor industry conditions and operational difficulties
Declining collateral quality
Management and owners are good or passable
Typically borrowers in declining markets or with small market share and operating in cyclical industries
7 (CCC) Watch-list
Eliciting signs of deterioration as a result of well defined weaknesses that may impair repayment
Typically start- ups / declining markets/deteriorating industries with high industry risk
Financial fundamentals below average
Weak management
Poor information disclosure
8 (CC) Substandard Risk
Well-defined weaknesses though significant loss unlikely; orderly liquidation of debt under threat
Continued strength is on collateral or residual repayment capacity of obligor
Partial losses of principal and interest possible if weaknesses are not promptly rectified
Questionable management skills
9 (C) Doubtful Risk
High probability of partial loss
Very weak credit fundamentals which make full debt repayment in serious doubt
Factors exist that may mitigate the potential loss but awaiting appropriate time to determine final status
Demonstrable management weaknesses, poor repayment weaknesses and poor repayment profile
10 (D) Lost
A definite loss of principal and interest
Lack of capacity to repay unsecured debt
Bleak economic prospects
Though it is still possible to recover sometime in the future, it is imprudent to defer write - offs
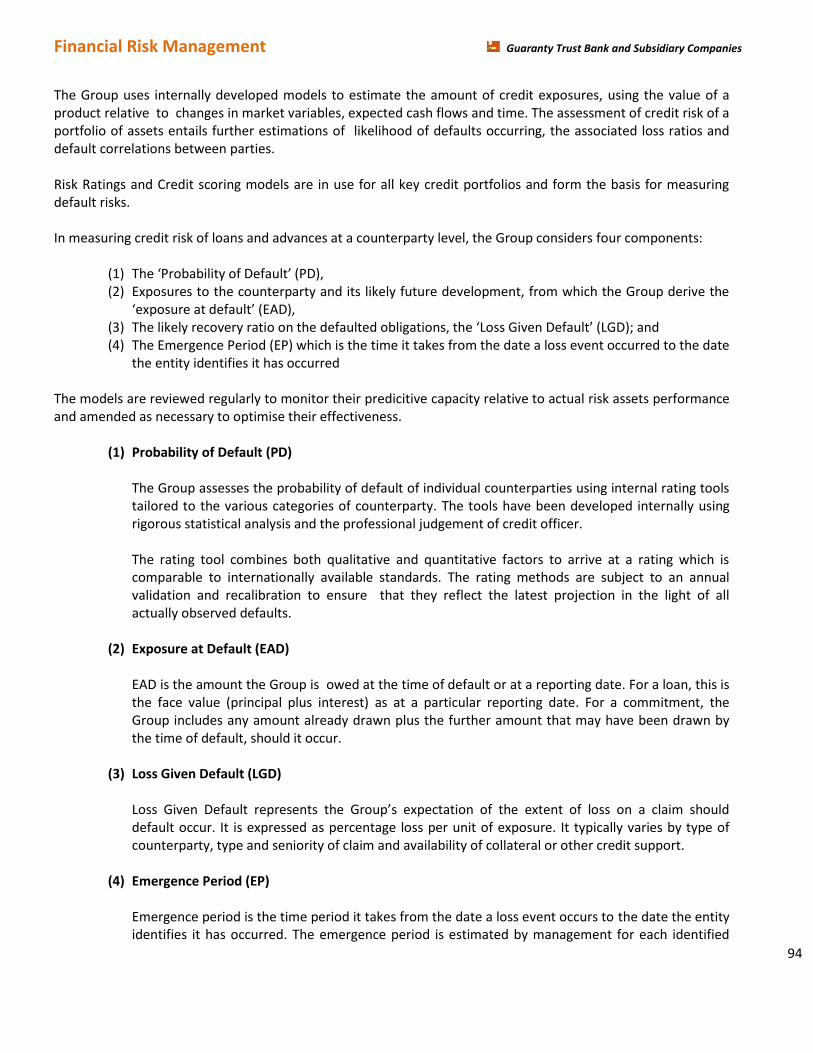
Financial Risk Management Guaranty Trust Bank and Subsidiary Companies
94
The Group uses internally developed models to estimate the amount of credit exposures, using the value of a product relative to changes in market variables, expected cash flows and time. The assessment of credit risk of a portfolio of assets entails further estimations of likelihood of defaults occurring, the associated loss ratios and default correlations between parties. Risk Ratings and Credit scoring models are in use for all key credit portfolios and form the basis for measuring default risks. In measuring credit risk of loans and advances at a counterparty level, the Group considers four components:
(1) The ‘Probability of Default’ (PD), (2) Exposures to the counterparty and its likely future development, from which the Group derive the
‘exposure at default’ (EAD), (3) The likely recovery ratio on the defaulted obligations, the ‘Loss Given Default’ (LGD); and (4) The Emergence Period (EP) which is the time it takes from the date a loss event occurred to the date
the entity identifies it has occurred
The models are reviewed regularly to monitor their predicitive capacity relative to actual risk assets performance and amended as necessary to optimise their effectiveness.
(1) Probability of Default (PD)
The Group assesses the probability of default of individual counterparties using internal rating tools tailored to the various categories of counterparty. The tools have been developed internally using rigorous statistical analysis and the professional judgement of credit officer. The rating tool combines both qualitative and quantitative factors to arrive at a rating which is comparable to internationally available standards. The rating methods are subject to an annual validation and recalibration to ensure that they reflect the latest projection in the light of all actually observed defaults.
(2) Exposure at Default (EAD)
EAD is the amount the Group is owed at the time of default or at a reporting date. For a loan, this is the face value (principal plus interest) as at a particular reporting date. For a commitment, the Group includes any amount already drawn plus the further amount that may have been drawn by the time of default, should it occur.
(3) Loss Given Default (LGD)
Loss Given Default represents the Group’s expectation of the extent of loss on a claim should default occur. It is expressed as percentage loss per unit of exposure. It typically varies by type of counterparty, type and seniority of claim and availability of collateral or other credit support.
(4) Emergence Period (EP)
Emergence period is the time period it takes from the date a loss event occurs to the date the entity identifies it has occurred. The emergence period is estimated by management for each identified
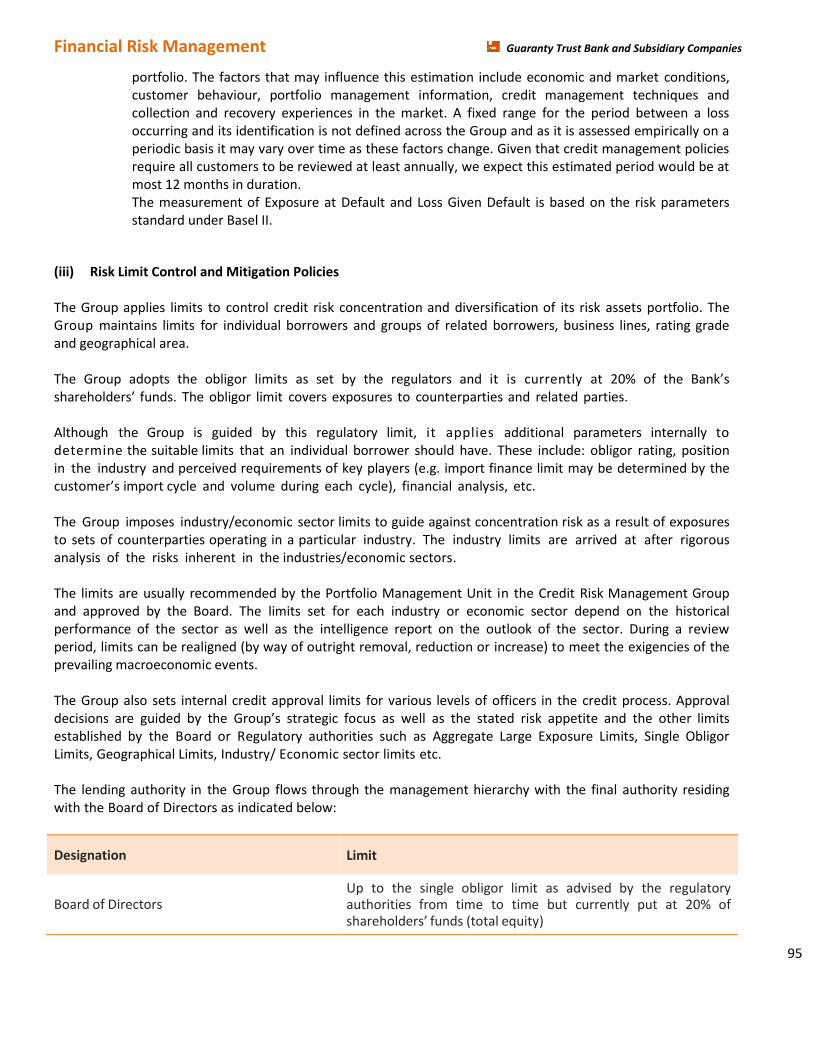
Financial Risk Management Guaranty Trust Bank and Subsidiary Companies
95
portfolio. The factors that may influence this estimation include economic and market conditions, customer behaviour, portfolio management information, credit management techniques and collection and recovery experiences in the market. A fixed range for the period between a loss occurring and its identification is not defined across the Group and as it is assessed empirically on a periodic basis it may vary over time as these factors change. Given that credit management policies require all customers to be reviewed at least annually, we expect this estimated period would be at most 12 months in duration. The measurement of Exposure at Default and Loss Given Default is based on the risk parameters standard under Basel II.
(iii) Risk Limit Control and Mitigation Policies The Group applies limits to control credit risk concentration and diversification of its risk assets portfolio. The Group maintains limits for individual borrowers and groups of related borrowers, business lines, rating grade and geographical area. The Group adopts the obligor limits as set by the regulators and it is currently at 20% of the Bank’s shareholders’ funds. The obligor limit covers exposures to counterparties and related parties. Although the Group is guided by this regulatory limit, it applies additional parameters internally to determine the suitable limits that an individual borrower should have. These include: obligor rating, position in the industry and perceived requirements of key players (e.g. import finance limit may be determined by the customer’s import cycle and volume during each cycle), financial analysis, etc. The Group imposes industry/economic sector limits to guide against concentration risk as a result of exposures to sets of counterparties operating in a particular industry. The industry limits are arrived at after rigorous analysis of the risks inherent in the industries/economic sectors. The limits are usually recommended by the Portfolio Management Unit in the Credit Risk Management Group and approved by the Board. The limits set for each industry or economic sector depend on the historical performance of the sector as well as the intelligence report on the outlook of the sector. During a review period, limits can be realigned (by way of outright removal, reduction or increase) to meet the exigencies of the prevailing macroeconomic events. The Group also sets internal credit approval limits for various levels of officers in the credit process. Approval decisions are guided by the Group’s strategic focus as well as the stated risk appetite and the other limits established by the Board or Regulatory authorities such as Aggregate Large Exposure Limits, Single Obligor Limits, Geographical Limits, Industry/ Economic sector limits etc. The lending authority in the Group flows through the management hierarchy with the final authority residing with the Board of Directors as indicated below:
Designation Limit
Board of Directors Up to the single obligor limit as advised by the regulatory authorities from time to time but currently put at 20% of shareholders’ funds (total equity)

Financial Risk Management Guaranty Trust Bank and Subsidiary Companies
96
Management Credit Committee Up to N2 Billion
Managing Director Up to N500 Million
Deputy Managing Director Up to N350 Million
Other Approving Officers as delegated by the Managing Director
The above limits are subject to the following overriding approvals:
The deposit required for all cash collateralized facilities (with the exception of bonds, guarantees and
indemnities) must be 125% of the facility amount to provide a cushion for interest and other charges.
All new facilities require one-up approval i.e. approval at a level higher than that of the person that would
ordinarily approve it.
Master Netting Arrangements
The Group further manages its exposure to credit losses by entering into master netting arrangements, where applicable, with counterparties with which it undertakes a significant volume of transactions. The right to set off is triggered at default. By so doing, the credit risk associated with favourable contracts is reduced by a master netting arrangement to the extent that if a default occurs, all amounts with the counterparty are terminated and settled on a net basis. The Group’s overall exposure to credit risk on derivative instruments subject to master netting arrangements can change substantially within a short period, as it is affected by each transaction subject to the arrangement.
Off-balance sheet engagements
These instruments are contingent in nature and carry the same credit risk as loans and advances. As a policy, the Group ensures that all its off-balance sheet exposures are subjected to the same rigorous credit analysis, like that of the on-balance sheet exposures, before availment. The major off-balance sheet items in the Group’s books are Bonds and Guarantees, which the Group will only issue where it has full cash collateral or a counter guarantee from a first class bank, or another acceptable security. Contigencies Contingent assets/liabilities which include transaction- related bonds and guarantees, letters of credit and short term foreign currency related transactions, are not recognized in the annual financial statements but are disclosed when, as a result of past events; it is highly likely that economic benefits/settlement will flow to/from the Group. However this will only be confirmed by the occurrence or non-occurrence of one or more uncertain future events which are not wholly within the Group’s control.
Placements
The Group has placement lines for it’s counterparties. The lines cover the settlement risks inherent in the activities with these counterparties. The limits are arrived at after conducting fundamental analysis of the counterparties, presentation of findings to, and approval by the Group’s Management Credit Committee. The lines are monitored by market risk arm of Enterprise Risk Management Division. As a rule, the Group’s placements with local banks are backed with treasury bills.
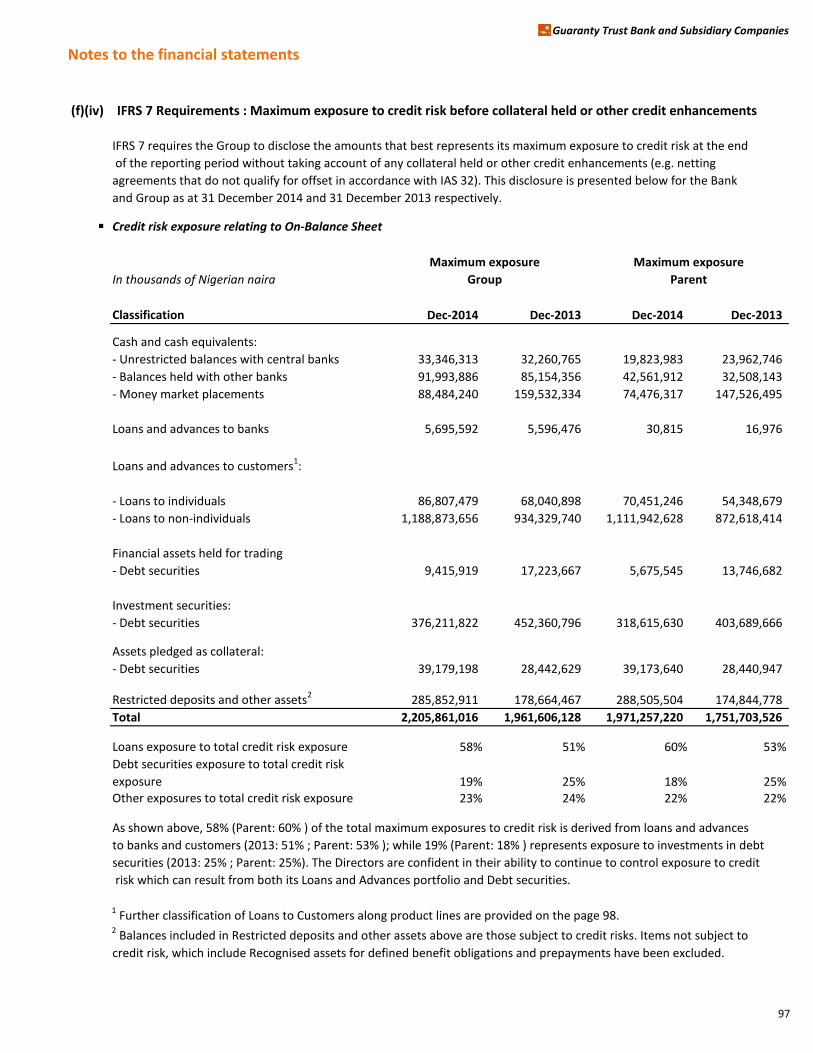
Notes to the financial statements
Guaranty Trust Bank and Subsidiary Companies
(f)(iv) IFRS 7 Requirements : Maximum exposure to credit risk before collateral held or other credit enhancements
IFRS 7 requires the Group to disclose the amounts that best represents its maximum exposure to credit risk at the end
of the reporting period without taking account of any collateral held or other credit enhancements (e.g. netting
agreements that do not qualify for offset in accordance with IAS 32). This disclosure is presented below for the Bank
and Group as at 31 December 2014 and 31 December 2013 respectively.
Credit risk exposure relating to On-Balance Sheet
In thousands of Nigerian naira
Classification Dec-2014 Dec-2013 Dec-2014 Dec-2013
Cash and cash equivalents:
- Unrestricted balances with central banks 33,346,313 32,260,765 19,823,983 23,962,746
- Balances held with other banks 91,993,886 85,154,356 42,561,912 32,508,143
- Money market placements 88,484,240 159,532,334 74,476,317 147,526,495
Loans and advances to banks 5,695,592 5,596,476 30,815 16,976
Loans and advances to customers1:
- Loans to individuals 86,807,479 68,040,898 70,451,246 54,348,679
- Loans to non-individuals 1,188,873,656 934,329,740 1,111,942,628 872,618,414
Financial assets held for trading
- Debt securities 9,415,919 17,223,667 5,675,545 13,746,682
Investment securities:
- Debt securities 376,211,822 452,360,796 318,615,630 403,689,666
Assets pledged as collateral:
- Debt securities 39,179,198 28,442,629 39,173,640 28,440,947
Restricted deposits and other assets2285,852,911 178,664,467 288,505,504 174,844,778
Total 2,205,861,016 1,961,606,128 1,971,257,220 1,751,703,526
Loans exposure to total credit risk exposure 58% 51% 60% 53%
Debt securities exposure to total credit risk
exposure 19% 25% 18% 25%Other exposures to total credit risk exposure 23% 24% 22% 22%
As shown above, 58% (Parent: 60% ) of the total maximum exposures to credit risk is derived from loans and advances
to banks and customers (2013: 51% ; Parent: 53% ); while 19% (Parent: 18% ) represents exposure to investments in debt
securities (2013: 25% ; Parent: 25%). The Directors are confident in their ability to continue to control exposure to credit
risk which can result from both its Loans and Advances portfolio and Debt securities.
1 Further classification of Loans to Customers along product lines are provided on the page 98.2 Balances included in Restricted deposits and other assets above are those subject to credit risks. Items not subject to
credit risk, which include Recognised assets for defined benefit obligations and prepayments have been excluded.
Maximum exposure Maximum exposure
Group Parent
97
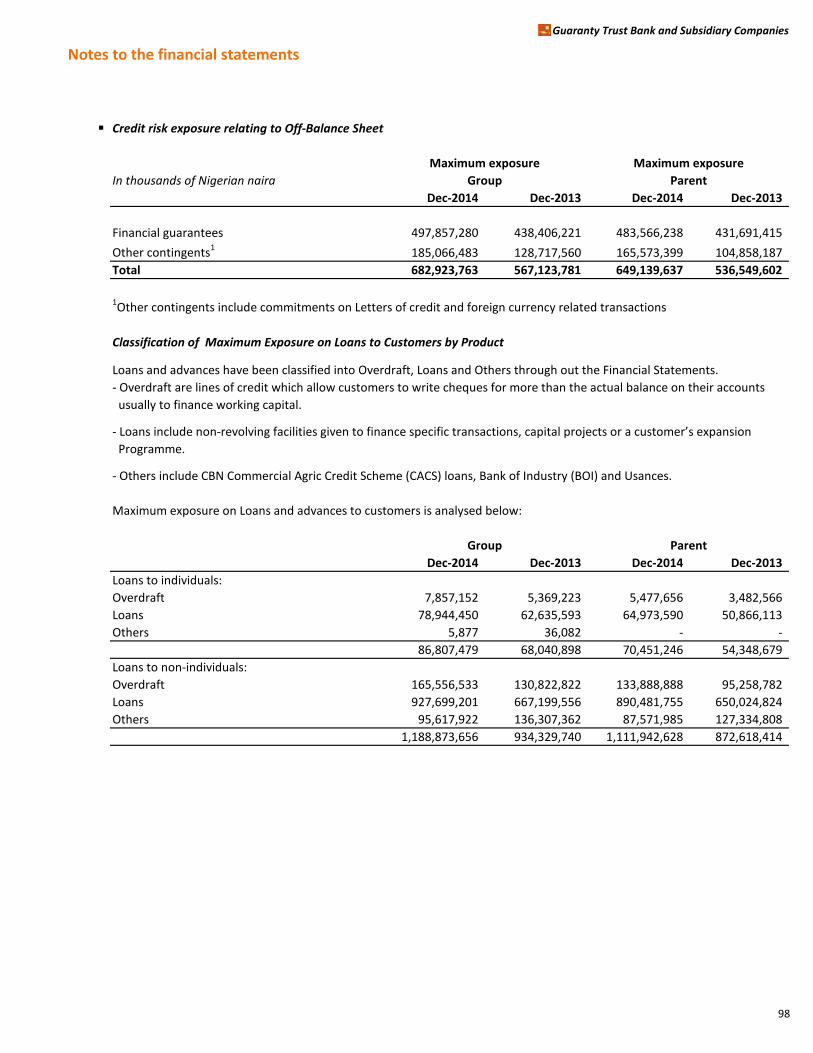
Notes to the financial statements
Guaranty Trust Bank and Subsidiary Companies
Credit risk exposure relating to Off-Balance Sheet
In thousands of Nigerian naira
Dec-2014 Dec-2013 Dec-2014 Dec-2013
Financial guarantees 497,857,280 438,406,221 483,566,238 431,691,415
Other contingents1185,066,483 128,717,560 165,573,399 104,858,187
Total 682,923,763 567,123,781 649,139,637 536,549,602
1Other contingents include commitments on Letters of credit and foreign currency related transactions
Classification of Maximum Exposure on Loans to Customers by Product
Loans and advances have been classified into Overdraft, Loans and Others through out the Financial Statements.
- Overdraft are lines of credit which allow customers to write cheques for more than the actual balance on their accounts
usually to finance working capital.
- Loans include non-revolving facilities given to finance specific transactions, capital projects or a customer’s expansion
Programme.
- Others include CBN Commercial Agric Credit Scheme (CACS) loans, Bank of Industry (BOI) and Usances.
Maximum exposure on Loans and advances to customers is analysed below:
Dec-2014 Dec-2013 Dec-2014 Dec-2013
Loans to individuals:
Overdraft 7,857,152 5,369,223 5,477,656 3,482,566
Loans 78,944,450 62,635,593 64,973,590 50,866,113
Others 5,877 36,082 - -
86,807,479 68,040,898 70,451,246 54,348,679
Loans to non-individuals:
Overdraft 165,556,533 130,822,822 133,888,888 95,258,782
Loans 927,699,201 667,199,556 890,481,755 650,024,824
Others 95,617,922 136,307,362 87,571,985 127,334,808
1,188,873,656 934,329,740 1,111,942,628 872,618,414
Maximum exposure Maximum exposure
Group Parent
Group Parent
98
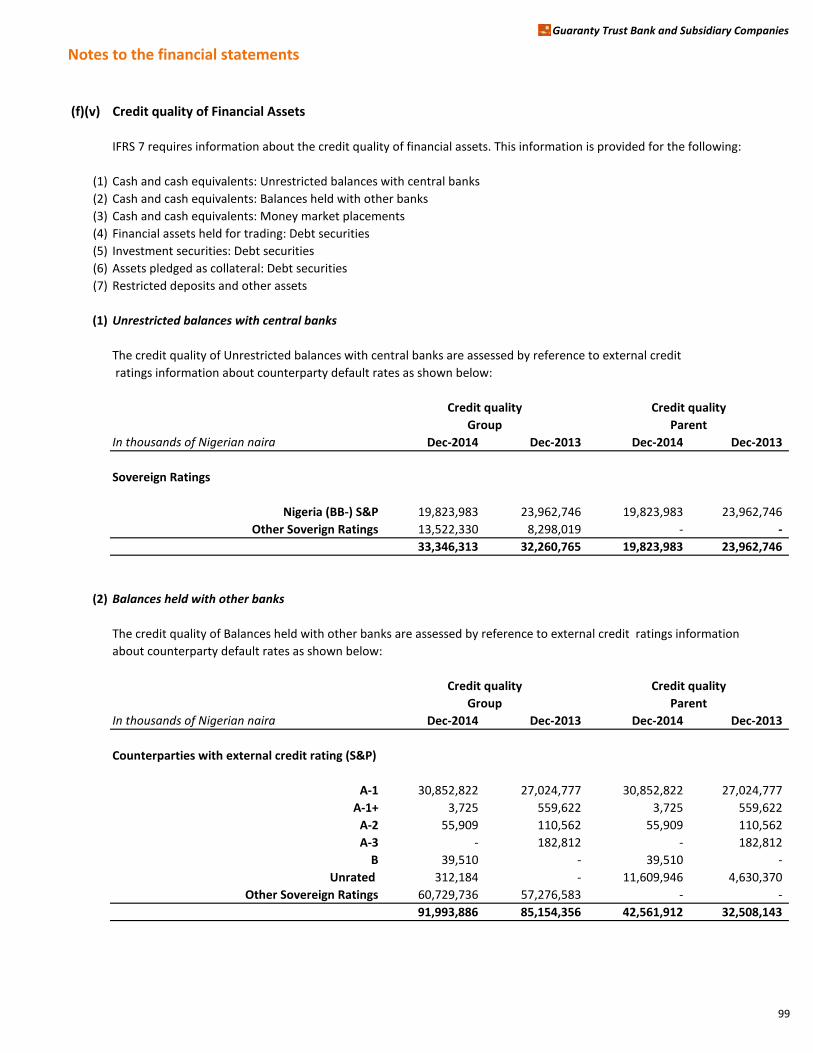
Notes to the financial statements
Guaranty Trust Bank and Subsidiary Companies
(f)(v) Credit quality of Financial Assets
IFRS 7 requires information about the credit quality of financial assets. This information is provided for the following:
(1) Cash and cash equivalents: Unrestricted balances with central banks
(2) Cash and cash equivalents: Balances held with other banks
(3) Cash and cash equivalents: Money market placements
(4) Financial assets held for trading: Debt securities
(5) Investment securities: Debt securities
(6) Assets pledged as collateral: Debt securities
(7) Restricted deposits and other assets
(1) Unrestricted balances with central banks
The credit quality of Unrestricted balances with central banks are assessed by reference to external credit
ratings information about counterparty default rates as shown below:
In thousands of Nigerian naira Dec-2014 Dec-2013 Dec-2014 Dec-2013
Sovereign Ratings
Nigeria (BB-) S&P 19,823,983 23,962,746 19,823,983 23,962,746
Other Soverign Ratings 13,522,330 8,298,019 - -
33,346,313 32,260,765 19,823,983 23,962,746
(2) Balances held with other banks
The credit quality of Balances held with other banks are assessed by reference to external credit ratings information
about counterparty default rates as shown below:
In thousands of Nigerian naira Dec-2014 Dec-2013 Dec-2014 Dec-2013
Counterparties with external credit rating (S&P)
A-1 30,852,822 27,024,777 30,852,822 27,024,777
A-1+ 3,725 559,622 3,725 559,622
A-2 55,909 110,562 55,909 110,562
A-3 - 182,812 - 182,812
B 39,510 - 39,510 -
Unrated 312,184 - 11,609,946 4,630,370
Other Sovereign Ratings 60,729,736 57,276,583 - -
91,993,886 85,154,356 42,561,912 32,508,143
Credit quality Credit quality
Group Parent
Credit quality Credit quality
Group Parent
99
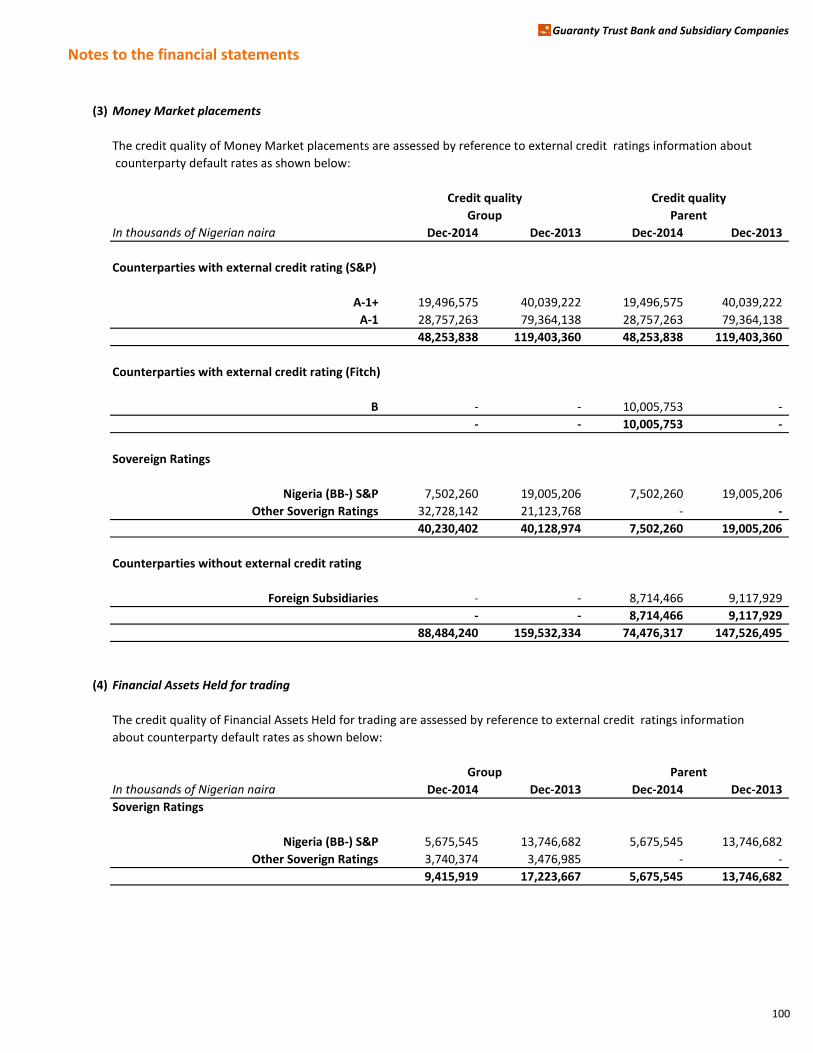
Notes to the financial statements
Guaranty Trust Bank and Subsidiary Companies
(3) Money Market placements
The credit quality of Money Market placements are assessed by reference to external credit ratings information about
counterparty default rates as shown below:
In thousands of Nigerian naira Dec-2014 Dec-2013 Dec-2014 Dec-2013
Counterparties with external credit rating (S&P)
A-1+ 19,496,575 40,039,222 19,496,575 40,039,222
A-1 28,757,263 79,364,138 28,757,263 79,364,138
48,253,838 119,403,360 48,253,838 119,403,360
Counterparties with external credit rating (Fitch)
B - - 10,005,753 -
- - 10,005,753 -
Sovereign Ratings
Nigeria (BB-) S&P 7,502,260 19,005,206 7,502,260 19,005,206
Other Soverign Ratings 32,728,142 21,123,768 - -
40,230,402 40,128,974 7,502,260 19,005,206
Counterparties without external credit rating
Foreign Subsidiaries - - 8,714,466 9,117,929
- - 8,714,466 9,117,929
88,484,240 159,532,334 74,476,317 147,526,495
(4) Financial Assets Held for trading
The credit quality of Financial Assets Held for trading are assessed by reference to external credit ratings information
about counterparty default rates as shown below:
In thousands of Nigerian naira Dec-2014 Dec-2013 Dec-2014 Dec-2013
Soverign Ratings
Nigeria (BB-) S&P 5,675,545 13,746,682 5,675,545 13,746,682
Other Soverign Ratings 3,740,374 3,476,985 - -
9,415,919 17,223,667 5,675,545 13,746,682
Credit quality Credit quality
Group Parent
Group Parent
100
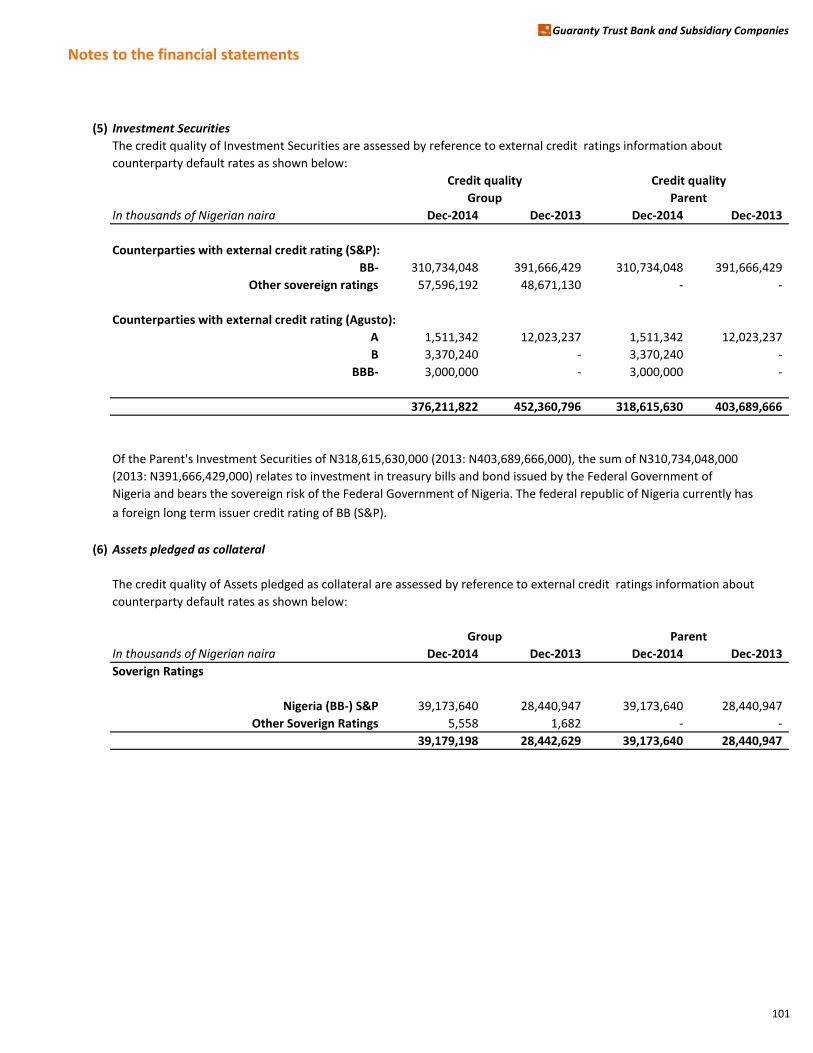
Notes to the financial statements
Guaranty Trust Bank and Subsidiary Companies
(5) Investment Securities
The credit quality of Investment Securities are assessed by reference to external credit ratings information about
counterparty default rates as shown below:
In thousands of Nigerian naira Dec-2014 Dec-2013 Dec-2014 Dec-2013
Counterparties with external credit rating (S&P):
BB- 310,734,048 391,666,429 310,734,048 391,666,429
Other sovereign ratings 57,596,192 48,671,130 - -
Counterparties with external credit rating (Agusto):
A 1,511,342 12,023,237 1,511,342 12,023,237
B 3,370,240 - 3,370,240 -
BBB- 3,000,000 - 3,000,000 -
376,211,822 452,360,796 318,615,630 403,689,666
Of the Parent's Investment Securities of N318,615,630,000 (2013: N403,689,666,000), the sum of N310,734,048,000
(2013: N391,666,429,000) relates to investment in treasury bills and bond issued by the Federal Government of
Nigeria and bears the sovereign risk of the Federal Government of Nigeria. The federal republic of Nigeria currently has
a foreign long term issuer credit rating of BB (S&P).
(6) Assets pledged as collateral
The credit quality of Assets pledged as collateral are assessed by reference to external credit ratings information about
counterparty default rates as shown below:
In thousands of Nigerian naira Dec-2014 Dec-2013 Dec-2014 Dec-2013
Soverign Ratings
Nigeria (BB-) S&P 39,173,640 28,440,947 39,173,640 28,440,947
Other Soverign Ratings 5,558 1,682 - -
39,179,198 28,442,629 39,173,640 28,440,947
Credit quality Credit quality
Group Parent
Group Parent
101
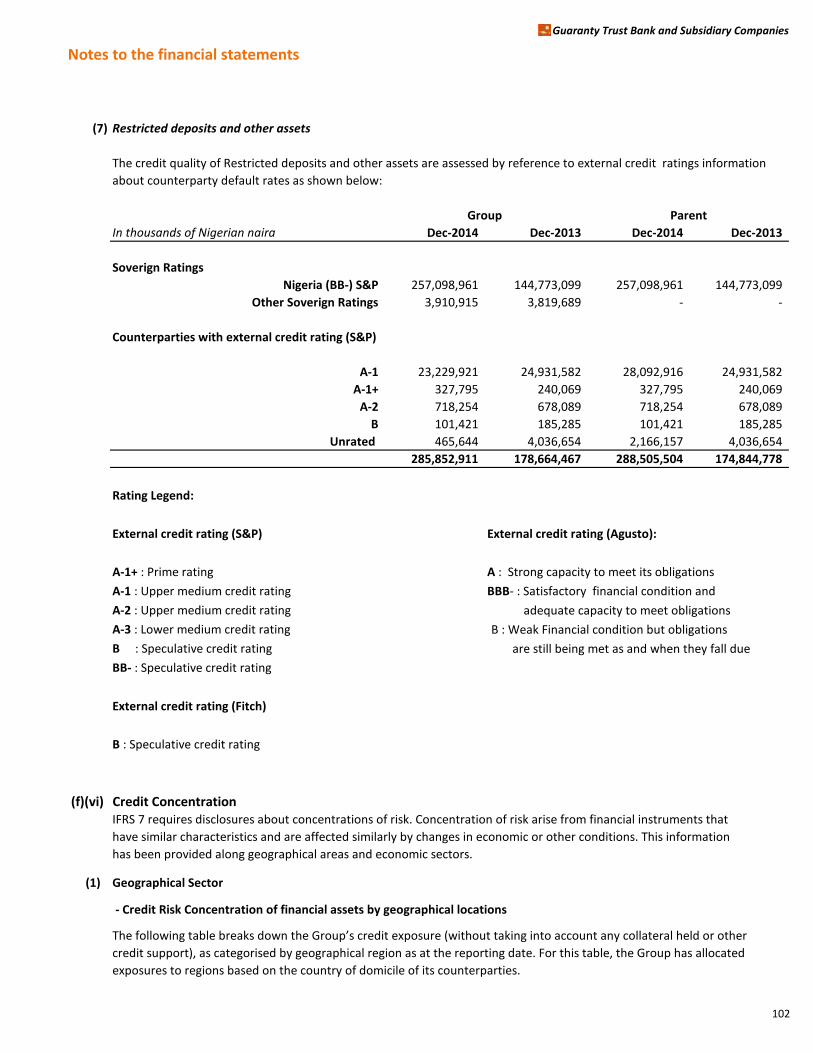
Notes to the financial statements
Guaranty Trust Bank and Subsidiary Companies
(7) Restricted deposits and other assets
The credit quality of Restricted deposits and other assets are assessed by reference to external credit ratings information
about counterparty default rates as shown below:
In thousands of Nigerian naira Dec-2014 Dec-2013 Dec-2014 Dec-2013
Soverign Ratings
Nigeria (BB-) S&P 257,098,961 144,773,099 257,098,961 144,773,099
Other Soverign Ratings 3,910,915 3,819,689 - -
Counterparties with external credit rating (S&P)
A-1 23,229,921 24,931,582 28,092,916 24,931,582
A-1+ 327,795 240,069 327,795 240,069
A-2 718,254 678,089 718,254 678,089
B 101,421 185,285 101,421 185,285
Unrated 465,644 4,036,654 2,166,157 4,036,654
285,852,911 178,664,467 288,505,504 174,844,778
Rating Legend:
External credit rating (S&P) External credit rating (Agusto):
A-1+ : Prime rating A : Strong capacity to meet its obligations
A-1 : Upper medium credit rating BBB- : Satisfactory financial condition and
A-2 : Upper medium credit rating adequate capacity to meet obligations
A-3 : Lower medium credit rating B : Weak Financial condition but obligations
B : Speculative credit rating are still being met as and when they fall due
BB- : Speculative credit rating
External credit rating (Fitch)
B : Speculative credit rating
(f)(vi) Credit ConcentrationIFRS 7 requires disclosures about concentrations of risk. Concentration of risk arise from financial instruments that
have similar characteristics and are affected similarly by changes in economic or other conditions. This information
has been provided along geographical areas and economic sectors.
(1) Geographical Sector
- Credit Risk Concentration of financial assets by geographical locations
The following table breaks down the Group’s credit exposure (without taking into account any collateral held or other
credit support), as categorised by geographical region as at the reporting date. For this table, the Group has allocated
exposures to regions based on the country of domicile of its counterparties.
Group Parent
102
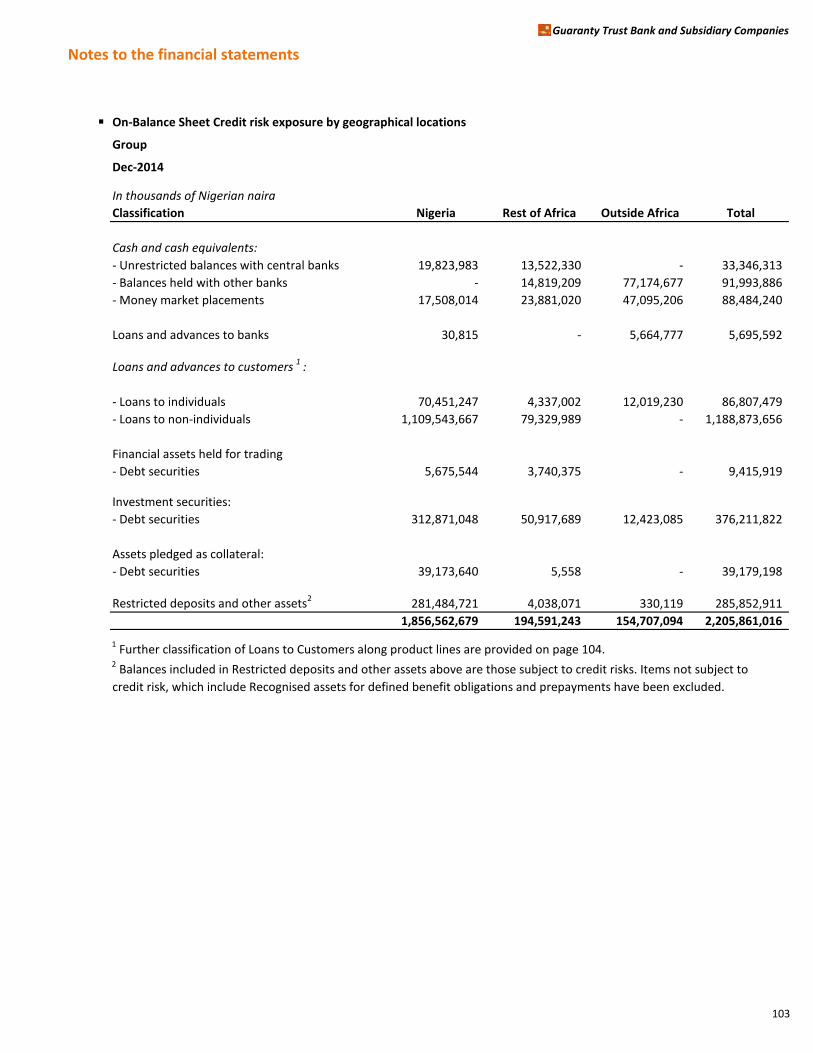
Notes to the financial statements
Guaranty Trust Bank and Subsidiary Companies
On-Balance Sheet Credit risk exposure by geographical locations
Group
Dec-2014
In thousands of Nigerian naira
Classification Nigeria Rest of Africa Outside Africa Total
Cash and cash equivalents:
- Unrestricted balances with central banks 19,823,983 13,522,330 - 33,346,313
- Balances held with other banks - 14,819,209 77,174,677 91,993,886
- Money market placements 17,508,014 23,881,020 47,095,206 88,484,240
Loans and advances to banks 30,815 - 5,664,777 5,695,592
Loans and advances to customers 1 :
- Loans to individuals 70,451,247 4,337,002 12,019,230 86,807,479
- Loans to non-individuals 1,109,543,667 79,329,989 - 1,188,873,656
Financial assets held for trading
- Debt securities 5,675,544 3,740,375 - 9,415,919
Investment securities:
- Debt securities 312,871,048 50,917,689 12,423,085 376,211,822
Assets pledged as collateral:
- Debt securities 39,173,640 5,558 - 39,179,198
Restricted deposits and other assets2281,484,721 4,038,071 330,119 285,852,911
1,856,562,679 194,591,243 154,707,094 2,205,861,016
1 Further classification of Loans to Customers along product lines are provided on page 104.2 Balances included in Restricted deposits and other assets above are those subject to credit risks. Items not subject to
credit risk, which include Recognised assets for defined benefit obligations and prepayments have been excluded.
103
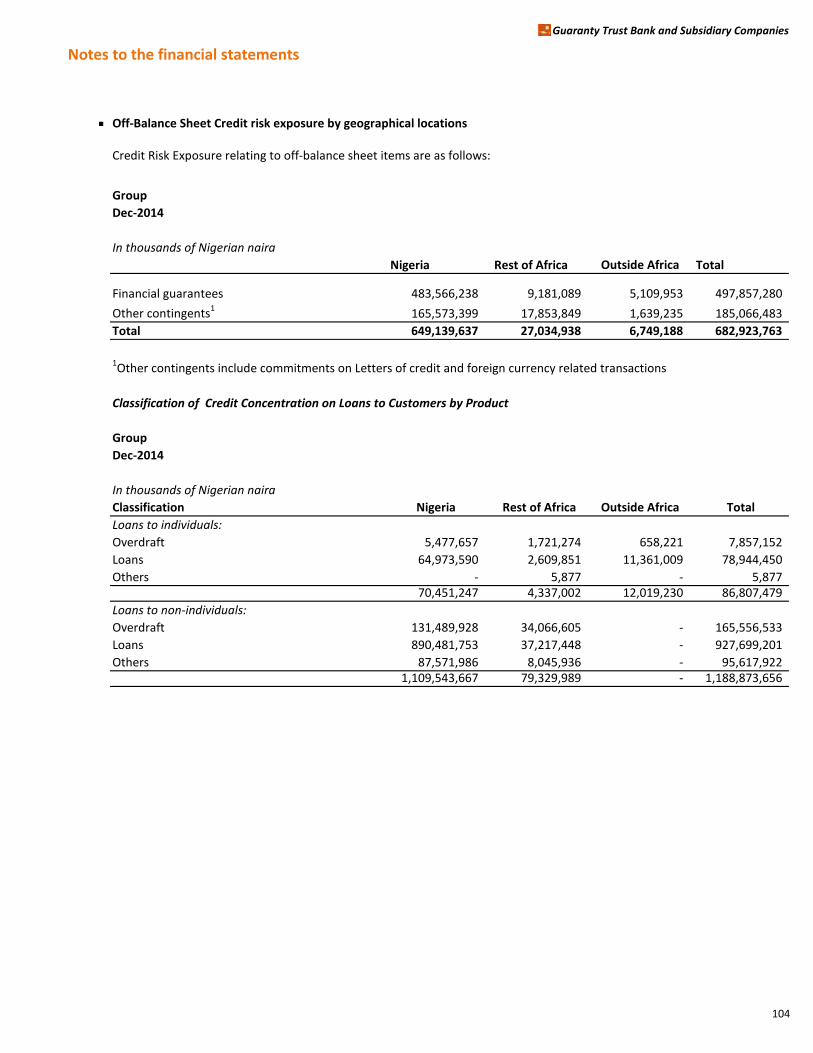
Notes to the financial statements
Guaranty Trust Bank and Subsidiary Companies
Off-Balance Sheet Credit risk exposure by geographical locations
Credit Risk Exposure relating to off-balance sheet items are as follows:
Group
Dec-2014
In thousands of Nigerian naira
Nigeria Rest of Africa Outside Africa Total
Financial guarantees 483,566,238 9,181,089 5,109,953 497,857,280
Other contingents1165,573,399 17,853,849 1,639,235 185,066,483
Total 649,139,637 27,034,938 6,749,188 682,923,763
1Other contingents include commitments on Letters of credit and foreign currency related transactions
Classification of Credit Concentration on Loans to Customers by Product
Group
Dec-2014
In thousands of Nigerian naira
Classification Nigeria Rest of Africa Outside Africa Total
Loans to individuals:
Overdraft 5,477,657 1,721,274 658,221 7,857,152
Loans 64,973,590 2,609,851 11,361,009 78,944,450
Others - 5,877 - 5,877 70,451,247 4,337,002 12,019,230 86,807,479
Loans to non-individuals:
Overdraft 131,489,928 34,066,605 - 165,556,533
Loans 890,481,753 37,217,448 - 927,699,201
Others 87,571,986 8,045,936 - 95,617,922 1,109,543,667 79,329,989 - 1,188,873,656
104
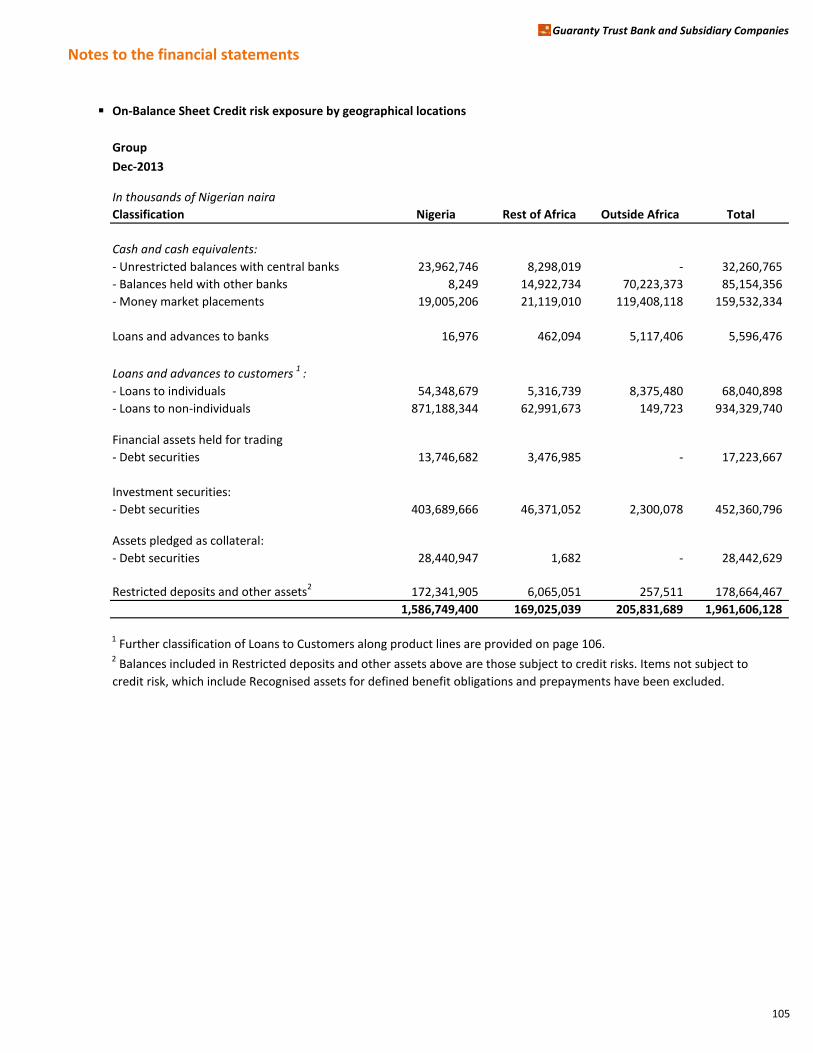
Notes to the financial statements
Guaranty Trust Bank and Subsidiary Companies
On-Balance Sheet Credit risk exposure by geographical locations
Group
Dec-2013
In thousands of Nigerian naira
Classification Nigeria Rest of Africa Outside Africa Total
Cash and cash equivalents:
- Unrestricted balances with central banks 23,962,746 8,298,019 - 32,260,765
- Balances held with other banks 8,249 14,922,734 70,223,373 85,154,356
- Money market placements 19,005,206 21,119,010 119,408,118 159,532,334
Loans and advances to banks 16,976 462,094 5,117,406 5,596,476
Loans and advances to customers 1 :
- Loans to individuals 54,348,679 5,316,739 8,375,480 68,040,898
- Loans to non-individuals 871,188,344 62,991,673 149,723 934,329,740
Financial assets held for trading
- Debt securities 13,746,682 3,476,985 - 17,223,667
Investment securities:
- Debt securities 403,689,666 46,371,052 2,300,078 452,360,796
Assets pledged as collateral:
- Debt securities 28,440,947 1,682 - 28,442,629
Restricted deposits and other assets2172,341,905 6,065,051 257,511 178,664,467
1,586,749,400 169,025,039 205,831,689 1,961,606,128
1 Further classification of Loans to Customers along product lines are provided on page 106.2 Balances included in Restricted deposits and other assets above are those subject to credit risks. Items not subject to
credit risk, which include Recognised assets for defined benefit obligations and prepayments have been excluded.
105
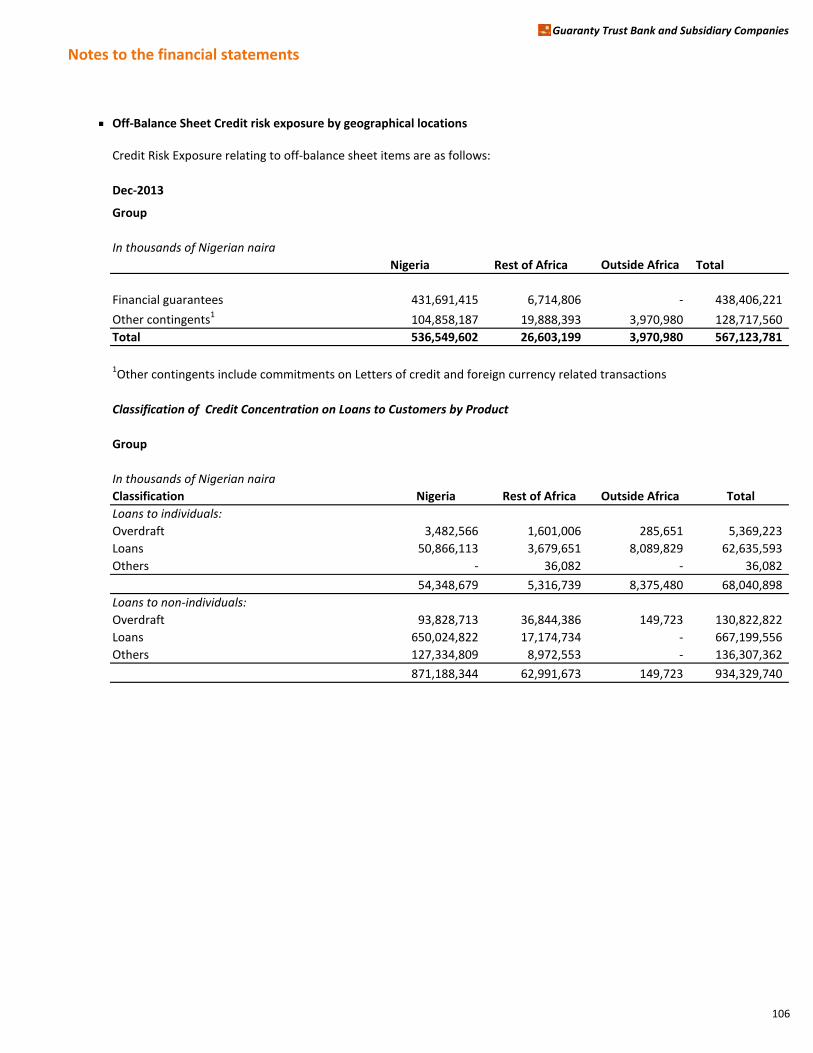
Notes to the financial statements
Guaranty Trust Bank and Subsidiary Companies
Off-Balance Sheet Credit risk exposure by geographical locations
Credit Risk Exposure relating to off-balance sheet items are as follows:
Dec-2013
Group
In thousands of Nigerian naira
Nigeria Rest of Africa Outside Africa Total
Financial guarantees 431,691,415 6,714,806 - 438,406,221
Other contingents1104,858,187 19,888,393 3,970,980 128,717,560
Total 536,549,602 26,603,199 3,970,980 567,123,781
1Other contingents include commitments on Letters of credit and foreign currency related transactions
Classification of Credit Concentration on Loans to Customers by Product
Group
In thousands of Nigerian naira
Classification Nigeria Rest of Africa Outside Africa Total
Loans to individuals:
Overdraft 3,482,566 1,601,006 285,651 5,369,223
Loans 50,866,113 3,679,651 8,089,829 62,635,593
Others - 36,082 - 36,082
54,348,679 5,316,739 8,375,480 68,040,898
Loans to non-individuals:
Overdraft 93,828,713 36,844,386 149,723 130,822,822
Loans 650,024,822 17,174,734 - 667,199,556
Others 127,334,809 8,972,553 - 136,307,362
871,188,344 62,991,673 149,723 934,329,740
106
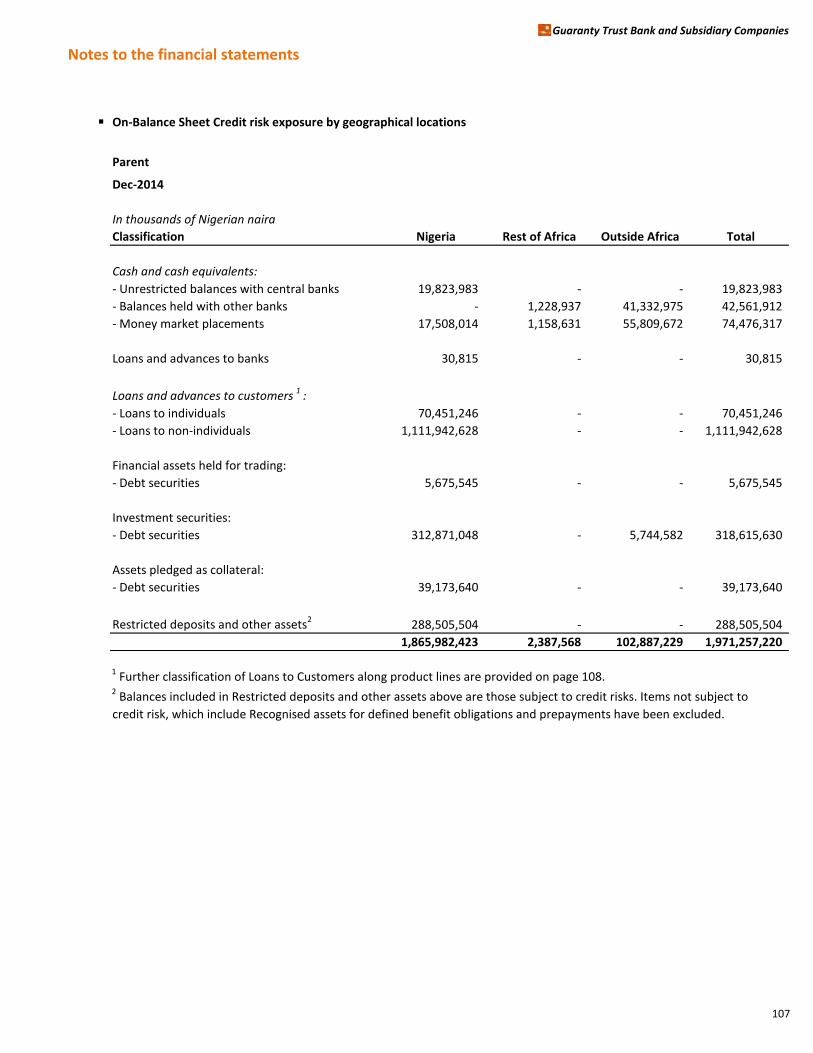
Notes to the financial statements
Guaranty Trust Bank and Subsidiary Companies
On-Balance Sheet Credit risk exposure by geographical locations
Parent
Dec-2014
In thousands of Nigerian naira
Classification Nigeria Rest of Africa Outside Africa Total
Cash and cash equivalents:
- Unrestricted balances with central banks 19,823,983 - - 19,823,983
- Balances held with other banks - 1,228,937 41,332,975 42,561,912
- Money market placements 17,508,014 1,158,631 55,809,672 74,476,317
Loans and advances to banks 30,815 - - 30,815
Loans and advances to customers 1 :
- Loans to individuals 70,451,246 - - 70,451,246
- Loans to non-individuals 1,111,942,628 - - 1,111,942,628
Financial assets held for trading:
- Debt securities 5,675,545 - - 5,675,545
Investment securities:
- Debt securities 312,871,048 - 5,744,582 318,615,630
Assets pledged as collateral:
- Debt securities 39,173,640 - - 39,173,640
Restricted deposits and other assets2288,505,504 - - 288,505,504
1,865,982,423 2,387,568 102,887,229 1,971,257,220
1 Further classification of Loans to Customers along product lines are provided on page 108.2 Balances included in Restricted deposits and other assets above are those subject to credit risks. Items not subject to
credit risk, which include Recognised assets for defined benefit obligations and prepayments have been excluded.
107
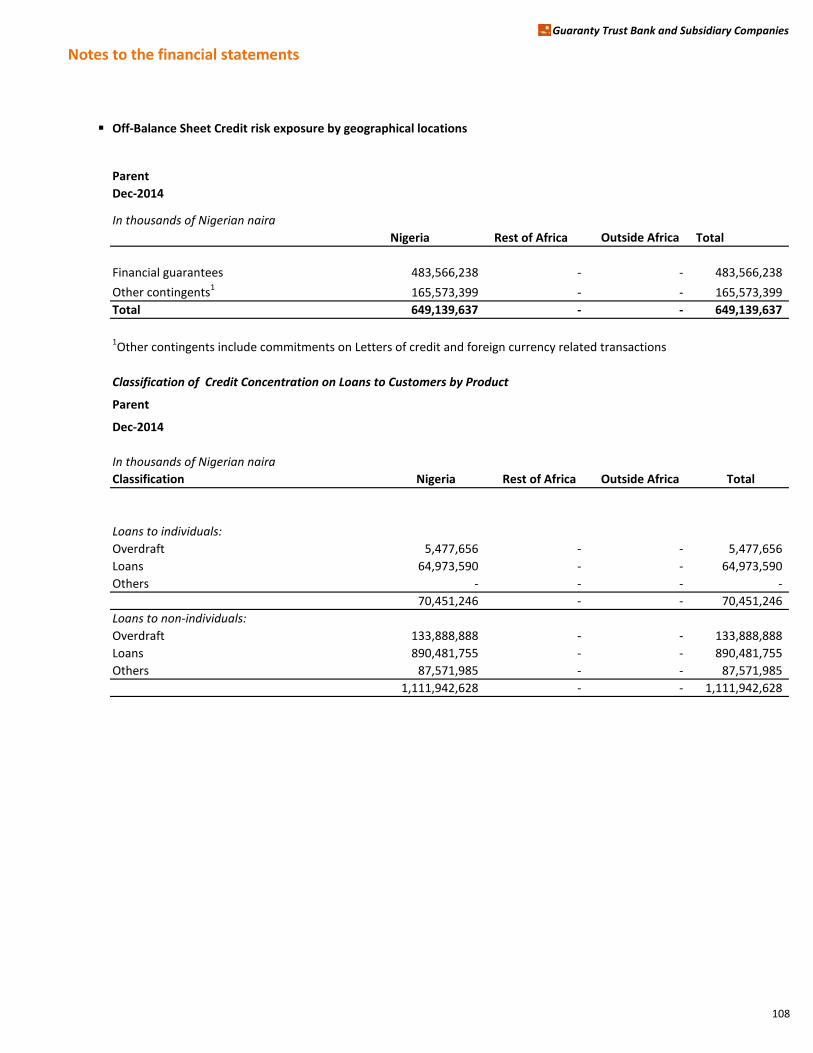
Notes to the financial statements
Guaranty Trust Bank and Subsidiary Companies
Off-Balance Sheet Credit risk exposure by geographical locations
Parent
Dec-2014
In thousands of Nigerian naira
Nigeria Rest of Africa Outside Africa Total
Financial guarantees 483,566,238 - - 483,566,238
Other contingents1165,573,399 - - 165,573,399
Total 649,139,637 - - 649,139,637
1Other contingents include commitments on Letters of credit and foreign currency related transactions
Classification of Credit Concentration on Loans to Customers by Product
Parent
Dec-2014
In thousands of Nigerian naira
Classification Nigeria Rest of Africa Outside Africa Total
Loans to individuals:
Overdraft 5,477,656 - - 5,477,656
Loans 64,973,590 - - 64,973,590
Others - - - -
70,451,246 - - 70,451,246
Loans to non-individuals:
Overdraft 133,888,888 - - 133,888,888
Loans 890,481,755 - - 890,481,755
Others 87,571,985 - - 87,571,985
1,111,942,628 - - 1,111,942,628
108

Notes to the financial statements
Guaranty Trust Bank and Subsidiary Companies
On-Balance Sheet Credit risk exposure by geographical locations
Dec-2013
Parent
In thousands of Nigerian naira
Classification Nigeria Rest of Africa Outside Africa Total
Cash and cash equivalents:
- Unrestricted balances with central banks 23,962,746 - - 23,962,746
- Balances held with other banks 8,249 542,578 31,957,316 32,508,143
- Money market placements 19,005,206 482,318 128,038,971 147,526,495
Loans and advances to banks 16,976 - - 16,976
Loans and advances to customers 1 :
- Loans to individuals 54,348,679 - - 54,348,679
- Loans to non-individuals 872,618,414 - - 872,618,414
Financial assets held for trading
- Debt securities 13,746,682 - - 13,746,682
Investment securities:
- Debt securities 403,689,666 - - 403,689,666
Assets pledged as collateral:
- Debt securities 28,440,947 - - 28,440,947
Restricted deposits and other assets2174,844,778 - - 174,844,778
1,590,682,343 1,024,896 159,996,287 1,751,703,526
1 Further classification of Loans to Customers along product lines are provided on page 110.2 Balances included in Restricted deposits and other assets above are those subject to credit risks. Items not subject to
credit risk, which include Recognised assets for defined benefit obligations and prepayments have been excluded.
109

Notes to the financial statements
Guaranty Trust Bank and Subsidiary Companies
Off-Balance Sheet Credit risk exposure by geographical locations
Credit Risk Exposure relating to off-balance sheet items are as follows:
Dec-2013
Parent
In thousands of Nigerian naira
Nigeria Rest of Africa Outside Africa Total
Financial guarantees 431,691,415 - - 431,691,415
Other contingents1104,858,187 - - 104,858,187
Total 536,549,602 - - 536,549,602
1Other contingents include commitments on Letters of credit and foreign currency related transactions
Dec-2013
Parent
In thousands of Nigerian naira
Classification Nigeria Rest of Africa Outside Africa Total
Loans to individuals:
Overdraft 3,482,566 - - 3,482,566
Loans 50,866,113 - - 50,866,113
Others - - - -
54,348,679 - - 54,348,679
Loans to non-individuals:
Overdraft 95,258,782 - - 95,258,782
Loans 650,024,824 - - 650,024,824
Others 127,334,808 - - 127,334,808
872,618,414 - - 872,618,414
110
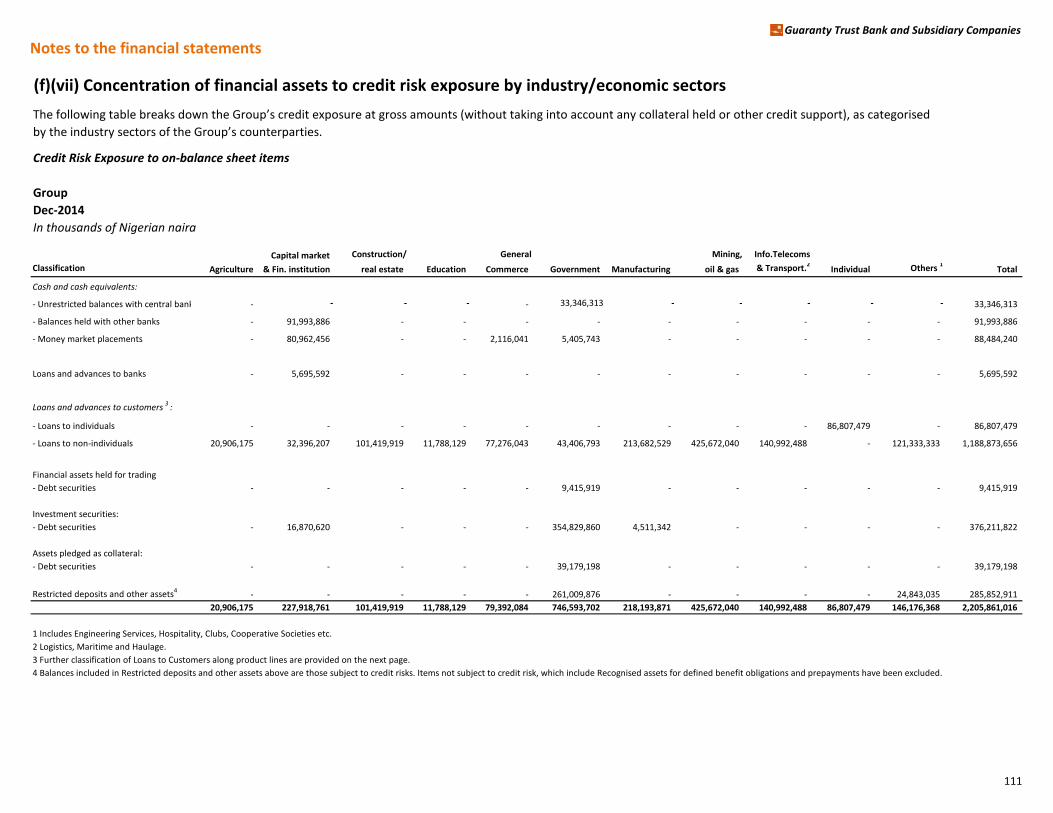
Notes to the financial statementsGuaranty Trust Bank and Subsidiary Companies
(f)(vii) Concentration of financial assets to credit risk exposure by industry/economic sectors
The following table breaks down the Group’s credit exposure at gross amounts (without taking into account any collateral held or other credit support), as categorised
by the industry sectors of the Group’s counterparties.
Credit Risk Exposure to on-balance sheet items
Group
Dec-2014
In thousands of Nigerian naira
Capital market Construction/ General Mining, Info.Telecoms
Classification Agriculture & Fin. institution real estate Education Commerce Government Manufacturing oil & gas & Transport.2Individual Others 1 Total
Cash and cash equivalents:
- Unrestricted balances with central banks - - - - - 33,346,313 - - - - - 33,346,313
- Balances held with other banks - 91,993,886 - - - - - - - - - 91,993,886
- Money market placements - 80,962,456 - - 2,116,041 5,405,743 - - - - - 88,484,240
Loans and advances to banks - 5,695,592 - - - - - - - - - 5,695,592
Loans and advances to customers 3 :
- Loans to individuals - - - - - - - - - 86,807,479 - 86,807,479
- Loans to non-individuals 20,906,175 32,396,207 101,419,919 11,788,129 77,276,043 43,406,793 213,682,529 425,672,040 140,992,488 - 121,333,333 1,188,873,656
Financial assets held for trading
- Debt securities - - - - - 9,415,919 - - - - - 9,415,919
Investment securities:
- Debt securities - 16,870,620 - - - 354,829,860 4,511,342 - - - - 376,211,822
Assets pledged as collateral:
- Debt securities - - - - - 39,179,198 - - - - - 39,179,198
Restricted deposits and other assets4- - - - - 261,009,876 - - - - 24,843,035 285,852,911
20,906,175 227,918,761 101,419,919 11,788,129 79,392,084 746,593,702 218,193,871 425,672,040 140,992,488 86,807,479 146,176,368 2,205,861,016
1 Includes Engineering Services, Hospitality, Clubs, Cooperative Societies etc.
2 Logistics, Maritime and Haulage.
3 Further classification of Loans to Customers along product lines are provided on the next page.
4 Balances included in Restricted deposits and other assets above are those subject to credit risks. Items not subject to credit risk, which include Recognised assets for defined benefit obligations and prepayments have been excluded.
111
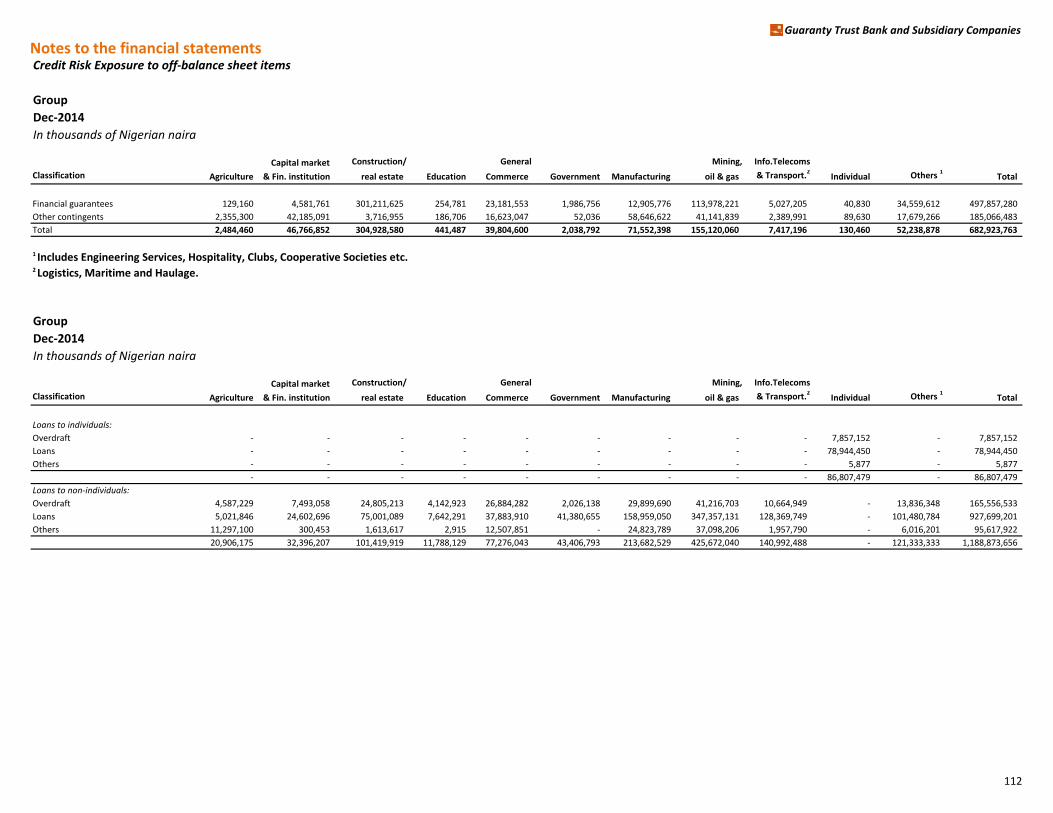
Notes to the financial statementsGuaranty Trust Bank and Subsidiary Companies
Credit Risk Exposure to off-balance sheet items
Group
Dec-2014
In thousands of Nigerian naira
Capital market Construction/ General Mining, Info.Telecoms
Classification Agriculture & Fin. institution real estate Education Commerce Government Manufacturing oil & gas & Transport.2Individual Others 1 Total
Financial guarantees 129,160 4,581,761 301,211,625 254,781 23,181,553 1,986,756 12,905,776 113,978,221 5,027,205 40,830 34,559,612 497,857,280
Other contingents 2,355,300 42,185,091 3,716,955 186,706 16,623,047 52,036 58,646,622 41,141,839 2,389,991 89,630 17,679,266 185,066,483
Total 2,484,460 46,766,852 304,928,580 441,487 39,804,600 2,038,792 71,552,398 155,120,060 7,417,196 130,460 52,238,878 682,923,763
1 Includes Engineering Services, Hospitality, Clubs, Cooperative Societies etc.2 Logistics, Maritime and Haulage.
Group
Dec-2014
In thousands of Nigerian naira
Capital market Construction/ General Mining, Info.Telecoms
Classification Agriculture & Fin. institution real estate Education Commerce Government Manufacturing oil & gas & Transport.2Individual Others 1 Total
Loans to individuals:
Overdraft - - - - - - - - - 7,857,152 - 7,857,152
Loans - - - - - - - - - 78,944,450 - 78,944,450
Others - - - - - - - - - 5,877 - 5,877
- - - - - - - - - 86,807,479 - 86,807,479
Loans to non-individuals:
Overdraft 4,587,229 7,493,058 24,805,213 4,142,923 26,884,282 2,026,138 29,899,690 41,216,703 10,664,949 - 13,836,348 165,556,533
Loans 5,021,846 24,602,696 75,001,089 7,642,291 37,883,910 41,380,655 158,959,050 347,357,131 128,369,749 - 101,480,784 927,699,201
Others 11,297,100 300,453 1,613,617 2,915 12,507,851 - 24,823,789 37,098,206 1,957,790 - 6,016,201 95,617,922
20,906,175 32,396,207 101,419,919 11,788,129 77,276,043 43,406,793 213,682,529 425,672,040 140,992,488 - 121,333,333 1,188,873,656
112

Notes to the financial statementsGuaranty Trust Bank and Subsidiary Companies
Credit Risk Exposure to on-balance sheet items
Group
Dec-2013
In thousands of Nigerian naira
Capital market Construction/ General Mining, Info.Telecoms
Classification Agriculture & Fin. institution real estate Education Commerce Government Manufacturing oil & gas & Transport.2Individual Others 1 Total
Cash and cash equivalents:
- Unrestricted balances with central banks - - - - - 32,260,765 - - - - - 32,260,765
- Balances held with other banks - 85,154,356 - - - - - - - - - 85,154,356
- Money market placements - 148,372,732 - - 902,337 10,257,265 - - - - - 159,532,334
Loans and advances to banks - 5,134,324 - - - - - - - - 462,152 5,596,476
Loans and advances to customers 3 :
- Loans to individuals - - - - - - - - - 68,040,898 - 68,040,898
- Loans to non-individuals 7,417,120 3,594,459 67,263,903 10,424,654 57,203,752 86,217,123 174,513,226 289,744,935 141,852,816 - 96,097,752 934,329,740
Financial assets held for trading
- Debt securities - - - - 3,476,985 13,746,682 - - - - - 17,223,667
Investment securities:
- Debt securities - 21,906,816 - - - 427,855,465 2,115,879 - - - 482,636 452,360,796
Assets pledged as collateral:
- Debt securities - - - - 1,682 28,440,947 - - - - - 28,442,629
Restricted deposits and other assets4
- - - - - 148,592,788 - - - - 30,071,679 178,664,467
7,417,120 264,162,687 67,263,903 10,424,654 61,584,756 747,371,035 176,629,105 289,744,935 141,852,816 68,040,898 127,114,219 1,961,606,128
1 Includes Engineering Services, Hospitality, Clubs, Cooperative Societies etc.2
Logistics, Maritime and Haulage.3
Further classification of Loans to Customers along product lines are provided on the next page.4 Balances included in Restricted deposits and other assets above are those subject to credit risks. Items not subject to credit risk, which include Recognised assets for defined benefit obligations and prepayments have been excluded.
113

Notes to the financial statementsGuaranty Trust Bank and Subsidiary Companies
Credit Risk Exposure to off-balance sheet items
Group
Dec-2013
In thousands of Nigerian naira
Capital market Construction/ General Mining, Info.Telecoms
Classification Agriculture & Fin. institution real estate Education Commerce Government Manufacturing oil & gas & Transport.2Individual Others 1 Total
Financial guarantees 123,897 4,118,412 302,808,785 243,911 22,197,214 2,519,174 5,794,836 64,076,940 7,448,136 726,769 28,348,147 438,406,221
Other contingents 253,837 31,440,191 2,448,898 125,459 9,358,679 2,094,966 54,955,534 16,048,536 229,143 - 11,762,317 128,717,560
Total 377,734 35,558,603 305,257,683 369,370 31,555,893 4,614,140 60,750,370 80,125,476 7,677,279 726,769 40,110,464 567,123,781
Group
Dec-2013
In thousands of Nigerian naira
Capital market Construction/ General Mining, Info.Telecoms
Classification Agriculture & Fin. institution real estate Education Commerce Government Manufacturing oil & gas & Transport.2Individual Others 1 Total
Loans to individuals:
Overdraft - - - - - - - - - 5,369,223 - 5,369,223
Loans - - - - - - - - - 62,635,593 - 62,635,593
Others - - - - - - - - - 36,082 - 36,082
- - - - - - - - - 68,040,898 - 68,040,898
Loans to non-individuals:
Overdraft 2,776,692 1,369,157 16,879,992 1,104,263 20,041,059 937,729 24,629,232 20,698,333 14,087,408 - 28,298,957 130,822,822
Loans 1,403,178 2,225,302 46,797,587 8,983,063 19,111,519 84,424,714 70,301,559 246,496,460 125,396,409 - 62,059,765 667,199,556
Others 3,237,250 - 3,586,324 337,328 18,051,174 854,680 79,582,435 22,550,142 2,368,999 - 5,739,030 136,307,362
7,417,120 3,594,459 67,263,903 10,424,654 57,203,752 86,217,123 174,513,226 289,744,935 141,852,816 - 96,097,752 934,329,740
114
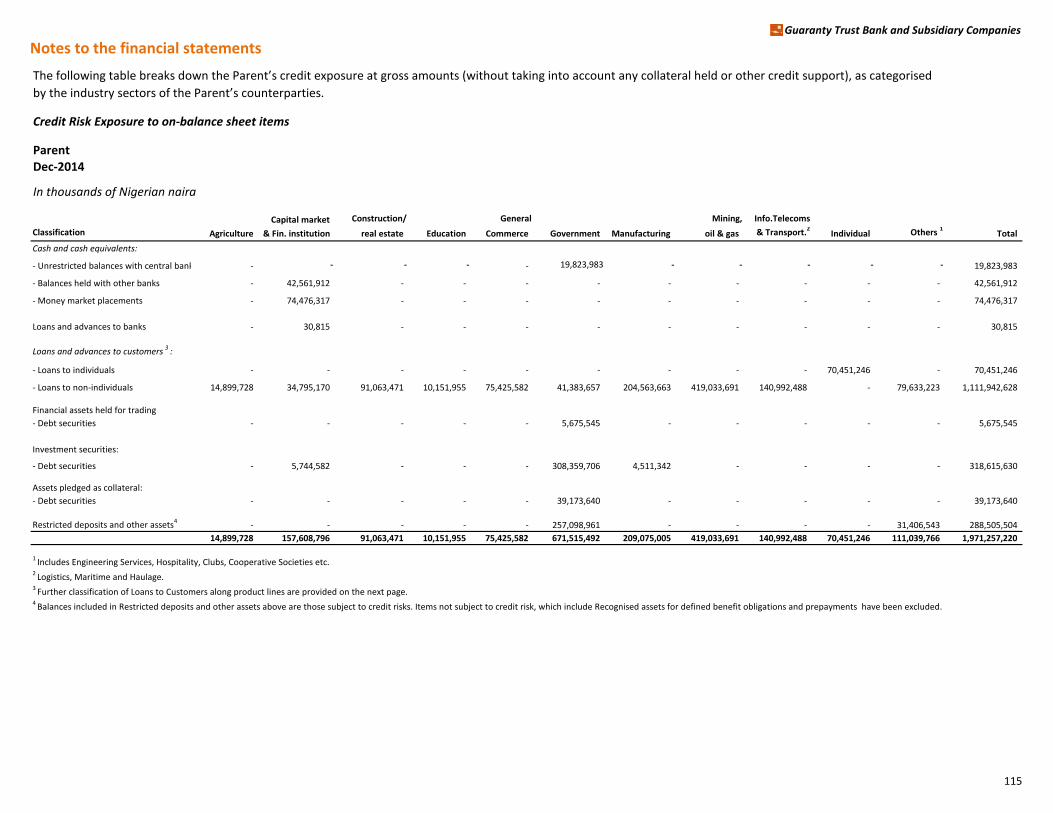
Notes to the financial statementsGuaranty Trust Bank and Subsidiary Companies
The following table breaks down the Parent’s credit exposure at gross amounts (without taking into account any collateral held or other credit support), as categorised
by the industry sectors of the Parent’s counterparties.
Credit Risk Exposure to on-balance sheet items
Parent
Dec-2014
In thousands of Nigerian naira
Capital market Construction/ General Mining, Info.Telecoms
Classification Agriculture & Fin. institution real estate Education Commerce Government Manufacturing oil & gas & Transport.2Individual Others 1 Total
Cash and cash equivalents:
- Unrestricted balances with central banks - - - - - 19,823,983 - - - - - 19,823,983
- Balances held with other banks - 42,561,912 - - - - - - - - - 42,561,912
- Money market placements - 74,476,317 - - - - - - - - - 74,476,317
Loans and advances to banks - 30,815 - - - - - - - - - 30,815
Loans and advances to customers 3 :
- Loans to individuals - - - - - - - - - 70,451,246 - 70,451,246
- Loans to non-individuals 14,899,728 34,795,170 91,063,471 10,151,955 75,425,582 41,383,657 204,563,663 419,033,691 140,992,488 - 79,633,223 1,111,942,628
Financial assets held for trading
- Debt securities - - - - - 5,675,545 - - - - - 5,675,545
Investment securities:
- Debt securities - 5,744,582 - - - 308,359,706 4,511,342 - - - - 318,615,630
Assets pledged as collateral:
- Debt securities - - - - - 39,173,640 - - - - - 39,173,640
Restricted deposits and other assets4- - - - - 257,098,961 - - - - 31,406,543 288,505,504
14,899,728 157,608,796 91,063,471 10,151,955 75,425,582 671,515,492 209,075,005 419,033,691 140,992,488 70,451,246 111,039,766 1,971,257,220
1 Includes Engineering Services, Hospitality, Clubs, Cooperative Societies etc.2 Logistics, Maritime and Haulage.3 Further classification of Loans to Customers along product lines are provided on the next page.4 Balances included in Restricted deposits and other assets above are those subject to credit risks. Items not subject to credit risk, which include Recognised assets for defined benefit obligations and prepayments have been excluded.
115

Notes to the financial statementsGuaranty Trust Bank and Subsidiary Companies
Credit Risk Exposure to off-balance sheet items
ParentDec-2014
counterparty default rates as shown below:
Capital market Construction/ General Mining, Info.Telecoms
Classification Agriculture & Fin. institution real estate Education Commerce Government Manufacturing oil & gas & Transport.2
Individual Others 1
Total
Financial guarantees 7,422 4,581,280 300,123,223 200,000 18,804,034 1,970,115 12,303,874 113,746,861 5,027,205 40,830 26,761,394 483,566,238
Other contingents 1,968,379 42,076,324 3,335,029 15,405 15,442,334 - 58,052,146 41,113,331 2,389,991 89,630 1,090,830 165,573,399
Total 1,975,801 46,657,604 303,458,252 215,405 34,246,368 1,970,115 70,356,020 154,860,192 7,417,196 130,460 27,852,224 649,139,637
Parent
Dec-2014
In thousands of Nigerian naira
Capital market Construction/ General Mining, Info.Telecoms
Classification Agriculture & Fin. institution real estate Education Commerce Government Manufacturing oil & gas & Transport.2Individual Others 1 Total
Loans to individuals:
Overdraft - - - - - - - - - 5,477,656 - 5,477,656
Loans - - - - - - - - - 64,973,590 - 64,973,590
Others - - - - - - - - - - - -
- - - - - - - - - 70,451,246 - 70,451,246
Loans to non-individuals:
Overdraft 1,604,052 9,892,021 16,214,636 2,769,411 25,207,134 3,002 22,712,953 35,053,803 10,664,949 - 9,766,927 133,888,888
Loans 3,988,083 24,602,696 73,235,218 7,382,544 37,710,597 41,380,655 157,087,929 346,881,682 128,369,749 - 69,842,602 890,481,755
Others 9,307,593 300,453 1,613,617 - 12,507,851 - 24,762,781 37,098,206 1,957,790 - 23,694 87,571,985
14,899,728 34,795,170 91,063,471 10,151,955 75,425,582 41,383,657 204,563,663 419,033,691 140,992,488 - 79,633,223 1,111,942,628
116
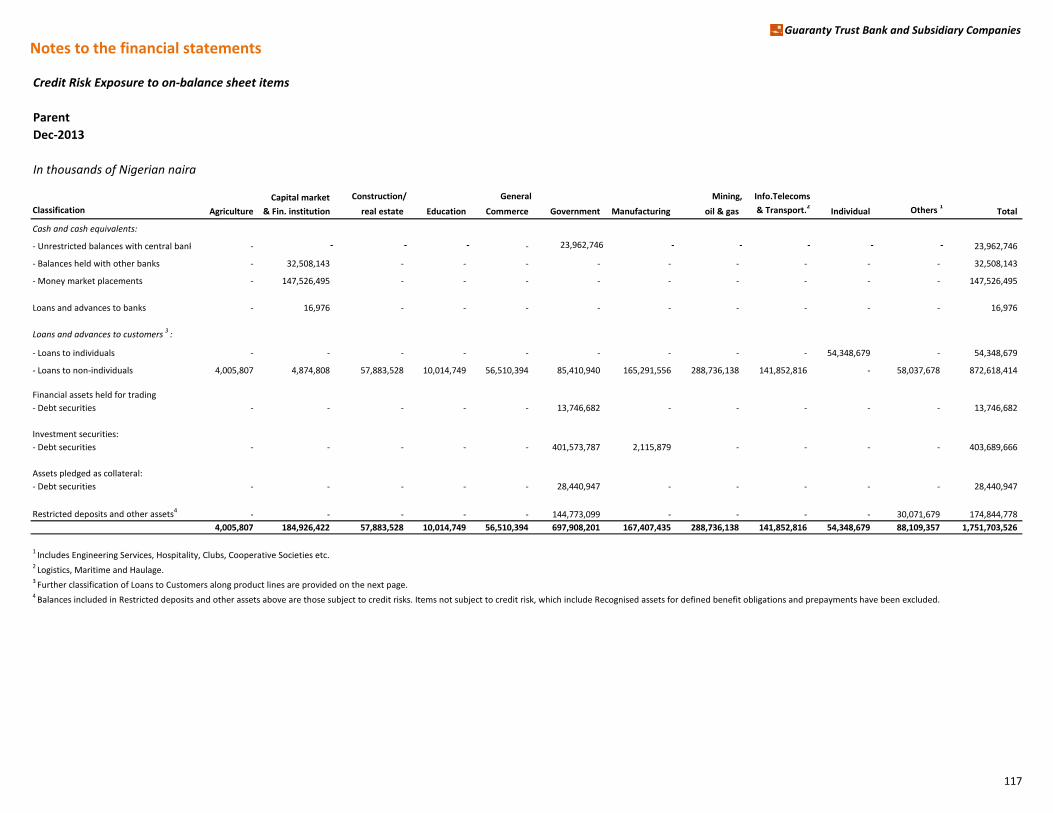
Notes to the financial statementsGuaranty Trust Bank and Subsidiary Companies
Credit Risk Exposure to on-balance sheet items
Parent
Dec-2013
In thousands of Nigerian naira
Capital market Construction/ General Mining, Info.Telecoms
Classification Agriculture & Fin. institution real estate Education Commerce Government Manufacturing oil & gas & Transport.2Individual Others 1 Total
Cash and cash equivalents:
- Unrestricted balances with central banks - - - - - 23,962,746 - - - - - 23,962,746
- Balances held with other banks - 32,508,143 - - - - - - - - - 32,508,143
- Money market placements - 147,526,495 - - - - - - - - - 147,526,495
Loans and advances to banks - 16,976 - - - - - - - - - 16,976
Loans and advances to customers 3 :
- Loans to individuals - - - - - - - - - 54,348,679 - 54,348,679
- Loans to non-individuals 4,005,807 4,874,808 57,883,528 10,014,749 56,510,394 85,410,940 165,291,556 288,736,138 141,852,816 - 58,037,678 872,618,414
Financial assets held for trading
- Debt securities - - - - - 13,746,682 - - - - - 13,746,682
Investment securities:
- Debt securities - - - - - 401,573,787 2,115,879 - - - - 403,689,666
Assets pledged as collateral:
- Debt securities - - - - - 28,440,947 - - - - - 28,440,947
Restricted deposits and other assets4- - - - - 144,773,099 - - - - 30,071,679 174,844,778
4,005,807 184,926,422 57,883,528 10,014,749 56,510,394 697,908,201 167,407,435 288,736,138 141,852,816 54,348,679 88,109,357 1,751,703,526
1 Includes Engineering Services, Hospitality, Clubs, Cooperative Societies etc.2 Logistics, Maritime and Haulage.3 Further classification of Loans to Customers along product lines are provided on the next page.4 Balances included in Restricted deposits and other assets above are those subject to credit risks. Items not subject to credit risk, which include Recognised assets for defined benefit obligations and prepayments have been excluded.
117
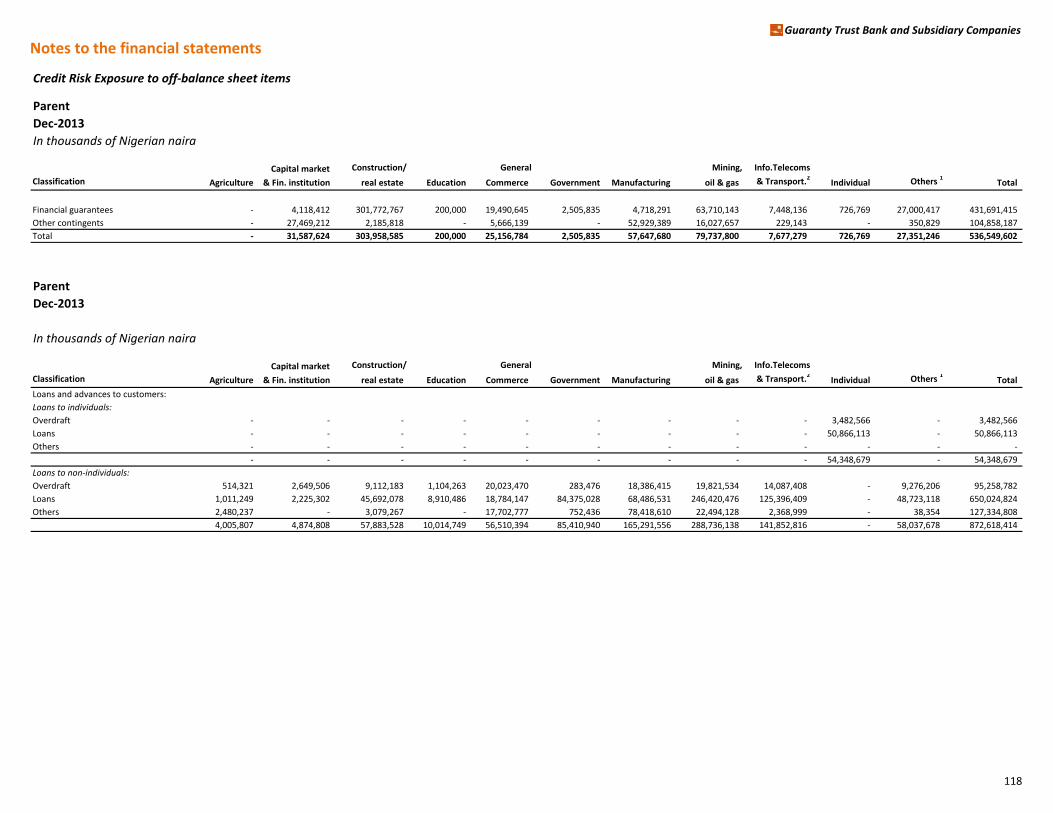
Notes to the financial statementsGuaranty Trust Bank and Subsidiary Companies
Credit Risk Exposure to off-balance sheet items
Parent
Dec-2013
In thousands of Nigerian naira
Capital market Construction/ General Mining, Info.Telecoms
Classification Agriculture & Fin. institution real estate Education Commerce Government Manufacturing oil & gas & Transport.2Individual Others 1 Total
Financial guarantees - 4,118,412 301,772,767 200,000 19,490,645 2,505,835 4,718,291 63,710,143 7,448,136 726,769 27,000,417 431,691,415
Other contingents - 27,469,212 2,185,818 - 5,666,139 - 52,929,389 16,027,657 229,143 - 350,829 104,858,187
Total - 31,587,624 303,958,585 200,000 25,156,784 2,505,835 57,647,680 79,737,800 7,677,279 726,769 27,351,246 536,549,602
Parent
Dec-2013
In thousands of Nigerian naira
Capital market Construction/ General Mining, Info.Telecoms
Classification Agriculture & Fin. institution real estate Education Commerce Government Manufacturing oil & gas & Transport.2Individual Others 1 Total
Loans and advances to customers:
Loans to individuals:
Overdraft - - - - - - - - - 3,482,566 - 3,482,566
Loans - - - - - - - - - 50,866,113 - 50,866,113
Others - - - - - - - - - - - -
- - - - - - - - - 54,348,679 - 54,348,679
Loans to non-individuals:
Overdraft 514,321 2,649,506 9,112,183 1,104,263 20,023,470 283,476 18,386,415 19,821,534 14,087,408 - 9,276,206 95,258,782
Loans 1,011,249 2,225,302 45,692,078 8,910,486 18,784,147 84,375,028 68,486,531 246,420,476 125,396,409 - 48,723,118 650,024,824
Others 2,480,237 - 3,079,267 - 17,702,777 752,436 78,418,610 22,494,128 2,368,999 - 38,354 127,334,808
4,005,807 4,874,808 57,883,528 10,014,749 56,510,394 85,410,940 165,291,556 288,736,138 141,852,816 - 58,037,678 872,618,414
118
Notes to the financial statements Guaranty Trust Bank and Subsidiary Companies
119
(viii) Impairment and provisioning policies
The following policies guide the Bank’s provisioning and impairment: (1) Loan Categorization
All loans and advances are categorized as follows:
Neither past due nor impaired: These are loans and advances where contractual interest or principal payments are not past due. The credit quality of the portfolio of loans and advances that were neither past due nor impaired can be assessed by reference to the internal rating system adopted by the Group (see Note 4(f)(ii) Credit Risk Measurement). These are assigned ratings 1-61.
Past due but not impaired:
These are loans and advances where contractual interest or principal payments are past due but individually assessed as not being impaired. The Group believes that impairment is not appropriate on the basis of the level of receivable/security/collateral available and/or the stage of collection of amounts owed to the Group. This is assigned rating 71.
Individually impaired:
Individually impaired are loans and advances for which the Group determines that it is probable that it will be unable to collect all principal and interest due according to the contractual terms of the loan/advance agreement(s). These are loans and advances specifically impaired. These are assigned ratings 8-101.
Collectively impaired:
Collectively impaired are portfolios of homogenous loans and advances where contractual interest or principal payments are not past due, but have been assessed for impairment by the Group. Thus, Loans assessed for collective impairment transverse from ratings 1 to ratings 71.
1 Ratings 1 Exceptional capacity Ratings 2 Very strong capacity Ratings 3-5 Strong repayment capacity Ratings 6 Acceptable Risk Ratings 1-7 Collectively impaired Ratings 8-10 Individually impaired This classification is in line with disclosures in note 4 on page 92-93
Notes to the financial statements Guaranty Trust Bank and Subsidiary Companies
120
(2) Allowances for impairment
The Group establishes an allowance for impairment losses that represents its estimate of incurred losses in its loan portfolio. The main components of this allowance are a specific loss component that relates to individually significant exposures, and a collective loan loss allowance, established for groups of homogeneous assets in respect of losses that have been incurred but have not been identified on loans subject to individual assessment for impairment. Specific Impairment – This is derived by identifying exposure at default and recoverable cash-flows. The Cash-flows are then discounted to present value using the original effective interest rate on the exposures. The shortfall between the discounted cash-flows and the exposure at default is recognized as individual impairment. Collective Impairment - This is arrived at using the incurred loss model under IAS 39 by incorporating emergence period (EP) into the expected loss model under Basel II. Realizable collaterals are important component of cash flows.
(3) Loans with renegotiated terms Loans with renegotiated terms are loans that have been restructured due to deterioration in the borrower’s financial position and where the Group has made concessions that it would not otherwise consider. Once the loan is restructured, it remains in this category independent of satisfactory performance after restructuring.
(4) Write-off policy
The Group writes off a loan / security balance (and any related allowances for impairment losses) when Group Management Credit Committee determines that the loans / securities are uncollectible. This determination is reached after considering information such as the occurrence of significant changes in the borrower / issuer’s financial position such that the borrower / issuer can no longer pay the obligation, or that proceeds from collateral will not be sufficient to pay back the entire exposure. For smaller balance standardised loans, charge off decisions are generally based on a product specific past due status.
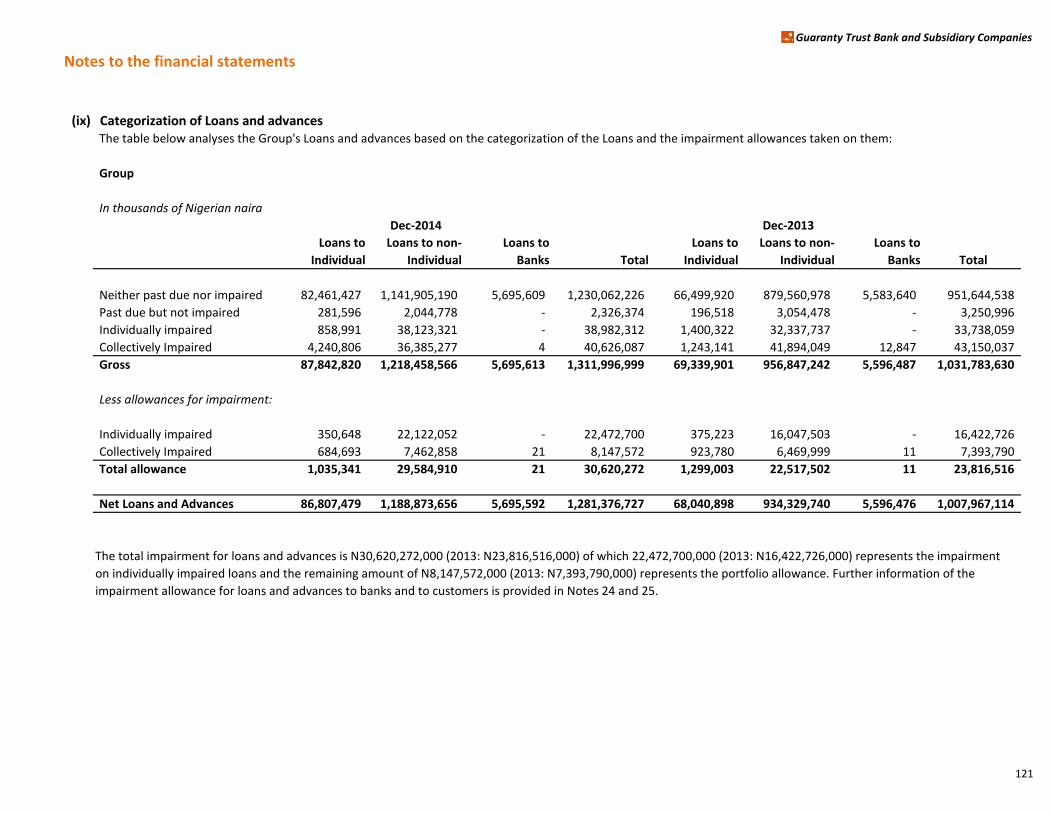
Notes to the financial statements
Guaranty Trust Bank and Subsidiary Companies
(ix) Categorization of Loans and advancesThe table below analyses the Group's Loans and advances based on the categorization of the Loans and the impairment allowances taken on them:
Group
In thousands of Nigerian naira
Loans to
Individual
Loans to non-
Individual
Loans to
Banks Total
Loans to
Individual
Loans to non-
Individual
Loans to
Banks Total
Neither past due nor impaired 82,461,427 1,141,905,190 5,695,609 1,230,062,226 66,499,920 879,560,978 5,583,640 951,644,538
Past due but not impaired 281,596 2,044,778 - 2,326,374 196,518 3,054,478 - 3,250,996
Individually impaired 858,991 38,123,321 - 38,982,312 1,400,322 32,337,737 - 33,738,059
Collectively Impaired 4,240,806 36,385,277 4 40,626,087 1,243,141 41,894,049 12,847 43,150,037
Gross 87,842,820 1,218,458,566 5,695,613 1,311,996,999 69,339,901 956,847,242 5,596,487 1,031,783,630
Less allowances for impairment:
Individually impaired 350,648 22,122,052 - 22,472,700 375,223 16,047,503 - 16,422,726
Collectively Impaired 684,693 7,462,858 21 8,147,572 923,780 6,469,999 11 7,393,790
Total allowance 1,035,341 29,584,910 21 30,620,272 1,299,003 22,517,502 11 23,816,516
Net Loans and Advances 86,807,479 1,188,873,656 5,695,592 1,281,376,727 68,040,898 934,329,740 5,596,476 1,007,967,114
The total impairment for loans and advances is N30,620,272,000 (2013: N23,816,516,000) of which 22,472,700,000 (2013: N16,422,726,000) represents the impairment
on individually impaired loans and the remaining amount of N8,147,572,000 (2013: N7,393,790,000) represents the portfolio allowance. Further information of the
impairment allowance for loans and advances to banks and to customers is provided in Notes 24 and 25.
Dec-2014 Dec-2013
121

Notes to the financial statements
Guaranty Trust Bank and Subsidiary Companies
Each category of the gross loans of the Group is further analysed into product as follows:
Group
In thousands of Nigerian naira
Loans to
Individual
Loans to non-
Individual
Loans to
Banks Total
Loans to
Individual
Loans to non-
Individual
Loans to
Banks Total
Loans 77,280,890 901,426,756 17,518 978,725,164 62,386,353 635,101,115 - 697,487,468
Overdrafts 5,180,537 149,665,487 5,678,091 160,524,115 4,090,364 118,943,164 5,583,640 128,617,168
Others - 90,812,947 - 90,812,947 23,203 125,516,699 - 125,539,902
Neither past due nor impaired 82,461,427 1,141,905,190 5,695,609 1,230,062,226 66,499,920 879,560,978 5,583,640 951,644,538
Loans 32,833 529,088 - 561,921 31,926 329,466 - 361,392
Overdrafts 247,912 1,304,588 - 1,552,500 164,021 732,645 - 896,666
Others 851 211,102 - 211,953 571 1,992,367 - 1,992,938
Past due but not impaired 281,596 2,044,778 - 2,326,374 196,518 3,054,478 - 3,250,996
Loans 49,155 22,053,350 - 22,102,505 445,553 20,007,816 - 20,453,369
Overdrafts 808,561 13,994,802 - 14,803,363 946,494 8,462,080 - 9,408,574
Others 1,275 2,075,169 - 2,076,444 8,275 3,867,841 - 3,876,116
Individually impaired 858,991 38,123,321 - 38,982,312 1,400,322 32,337,737 - 33,738,059
Loans 1,966,223 22,445,717 4 24,411,944 429,916 26,351,076 4,911 26,785,903
Overdrafts 2,269,761 10,026,118 - 12,295,879 806,962 8,843,345 7,936 9,658,243
Others 4,822 3,913,442 - 3,918,264 6,263 6,699,628 - 6,705,891
Collectively Impaired 4,240,806 36,385,277 4 40,626,087 1,243,141 41,894,049 12,847 43,150,037
Dec-2014 Dec-2013
122
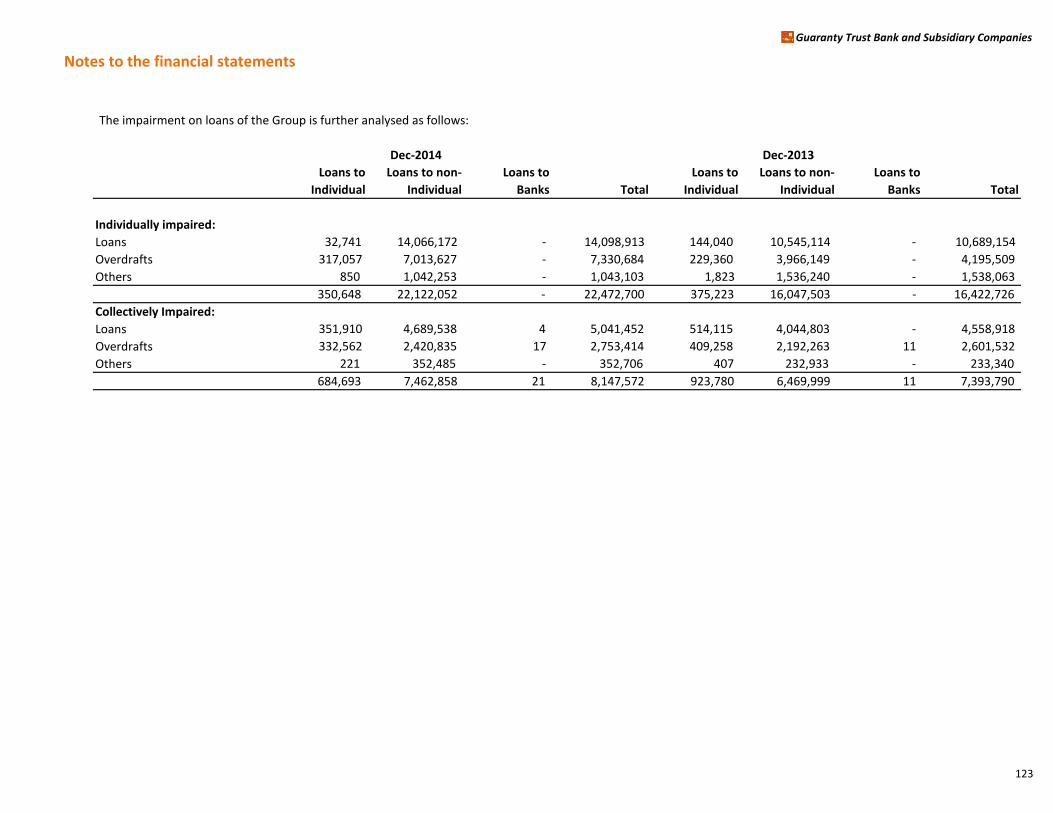
Notes to the financial statements
Guaranty Trust Bank and Subsidiary Companies
The impairment on loans of the Group is further analysed as follows:
Loans to
Individual
Loans to non-
Individual
Loans to
Banks Total
Loans to
Individual
Loans to non-
Individual
Loans to
Banks Total
Individually impaired:
Loans 32,741 14,066,172 - 14,098,913 144,040 10,545,114 - 10,689,154
Overdrafts 317,057 7,013,627 - 7,330,684 229,360 3,966,149 - 4,195,509
Others 850 1,042,253 - 1,043,103 1,823 1,536,240 - 1,538,063
350,648 22,122,052 - 22,472,700 375,223 16,047,503 - 16,422,726
Collectively Impaired:
Loans 351,910 4,689,538 4 5,041,452 514,115 4,044,803 - 4,558,918
Overdrafts 332,562 2,420,835 17 2,753,414 409,258 2,192,263 11 2,601,532
Others 221 352,485 - 352,706 407 232,933 - 233,340
684,693 7,462,858 21 8,147,572 923,780 6,469,999 11 7,393,790
Dec-2014 Dec-2013
123
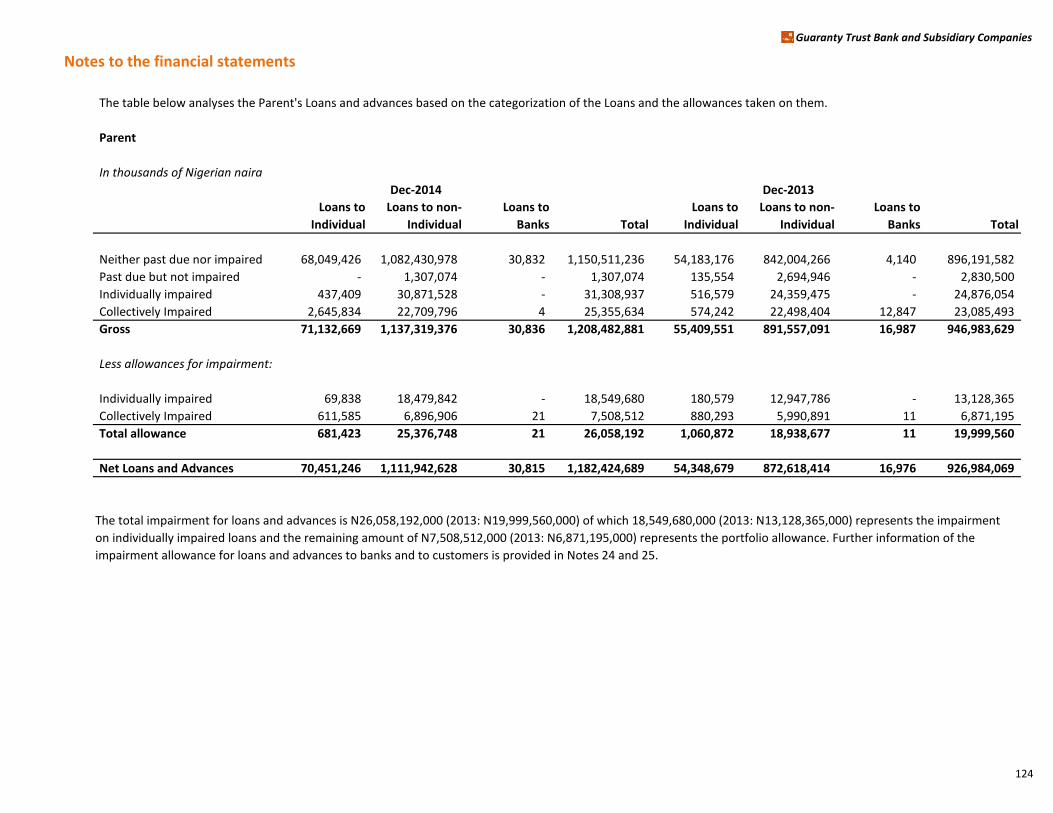
Notes to the financial statements
Guaranty Trust Bank and Subsidiary Companies
The table below analyses the Parent's Loans and advances based on the categorization of the Loans and the allowances taken on them.
Parent
In thousands of Nigerian naira
Loans to
Individual
Loans to non-
Individual
Loans to
Banks Total
Loans to
Individual
Loans to non-
Individual
Loans to
Banks Total
Neither past due nor impaired 68,049,426 1,082,430,978 30,832 1,150,511,236 54,183,176 842,004,266 4,140 896,191,582
Past due but not impaired - 1,307,074 - 1,307,074 135,554 2,694,946 - 2,830,500
Individually impaired 437,409 30,871,528 - 31,308,937 516,579 24,359,475 - 24,876,054
Collectively Impaired 2,645,834 22,709,796 4 25,355,634 574,242 22,498,404 12,847 23,085,493
Gross 71,132,669 1,137,319,376 30,836 1,208,482,881 55,409,551 891,557,091 16,987 946,983,629
Less allowances for impairment:
Individually impaired 69,838 18,479,842 - 18,549,680 180,579 12,947,786 - 13,128,365
Collectively Impaired 611,585 6,896,906 21 7,508,512 880,293 5,990,891 11 6,871,195
Total allowance 681,423 25,376,748 21 26,058,192 1,060,872 18,938,677 11 19,999,560
Net Loans and Advances 70,451,246 1,111,942,628 30,815 1,182,424,689 54,348,679 872,618,414 16,976 926,984,069
The total impairment for loans and advances is N26,058,192,000 (2013: N19,999,560,000) of which 18,549,680,000 (2013: N13,128,365,000) represents the impairment
on individually impaired loans and the remaining amount of N7,508,512,000 (2013: N6,871,195,000) represents the portfolio allowance. Further information of the
impairment allowance for loans and advances to banks and to customers is provided in Notes 24 and 25.
Dec-2014 Dec-2013
124
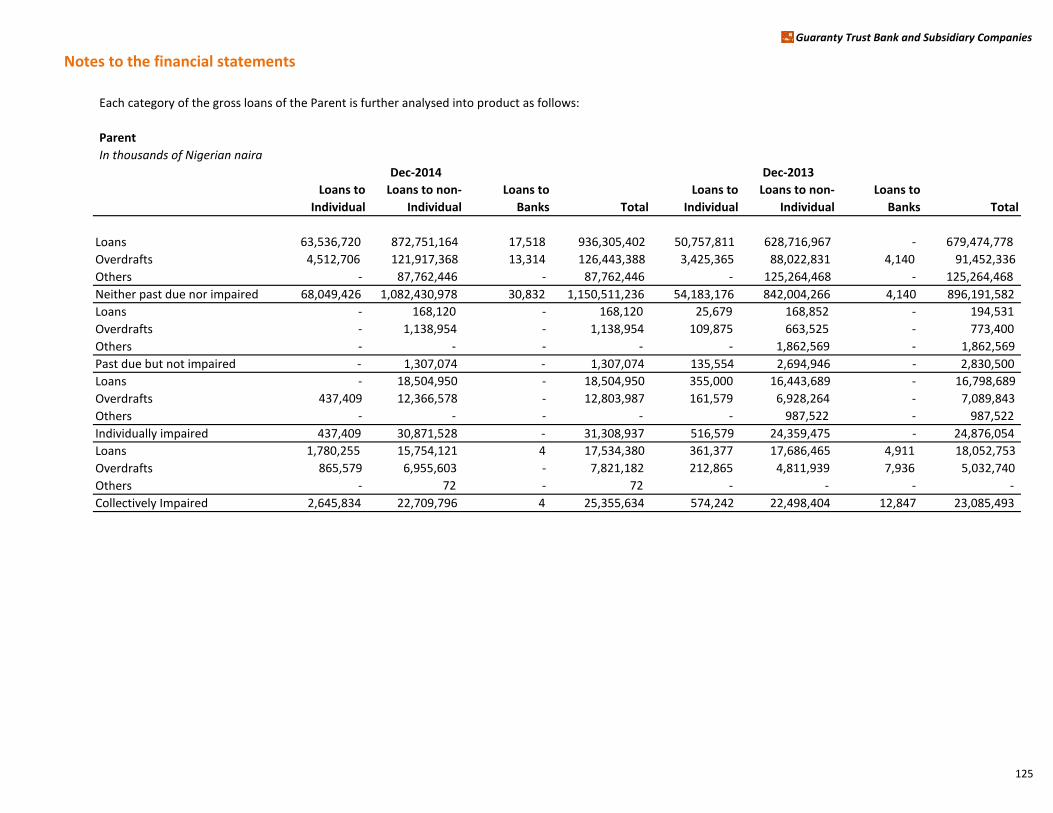
Notes to the financial statements
Guaranty Trust Bank and Subsidiary Companies
Each category of the gross loans of the Parent is further analysed into product as follows:
Parent
In thousands of Nigerian naira
Loans to
Individual
Loans to non-
Individual
Loans to
Banks Total
Loans to
Individual
Loans to non-
Individual
Loans to
Banks Total
Loans 63,536,720 872,751,164 17,518 936,305,402 50,757,811 628,716,967 - 679,474,778
Overdrafts 4,512,706 121,917,368 13,314 126,443,388 3,425,365 88,022,831 4,140 91,452,336
Others - 87,762,446 - 87,762,446 - 125,264,468 - 125,264,468
Neither past due nor impaired 68,049,426 1,082,430,978 30,832 1,150,511,236 54,183,176 842,004,266 4,140 896,191,582
Loans - 168,120 - 168,120 25,679 168,852 - 194,531
Overdrafts - 1,138,954 - 1,138,954 109,875 663,525 - 773,400
Others - - - - - 1,862,569 - 1,862,569
Past due but not impaired - 1,307,074 - 1,307,074 135,554 2,694,946 - 2,830,500
Loans - 18,504,950 - 18,504,950 355,000 16,443,689 - 16,798,689
Overdrafts 437,409 12,366,578 - 12,803,987 161,579 6,928,264 - 7,089,843
Others - - - - - 987,522 - 987,522
Individually impaired 437,409 30,871,528 - 31,308,937 516,579 24,359,475 - 24,876,054
Loans 1,780,255 15,754,121 4 17,534,380 361,377 17,686,465 4,911 18,052,753
Overdrafts 865,579 6,955,603 - 7,821,182 212,865 4,811,939 7,936 5,032,740
Others - 72 - 72 - - - -
Collectively Impaired 2,645,834 22,709,796 4 25,355,634 574,242 22,498,404 12,847 23,085,493
Dec-2014 Dec-2013
125
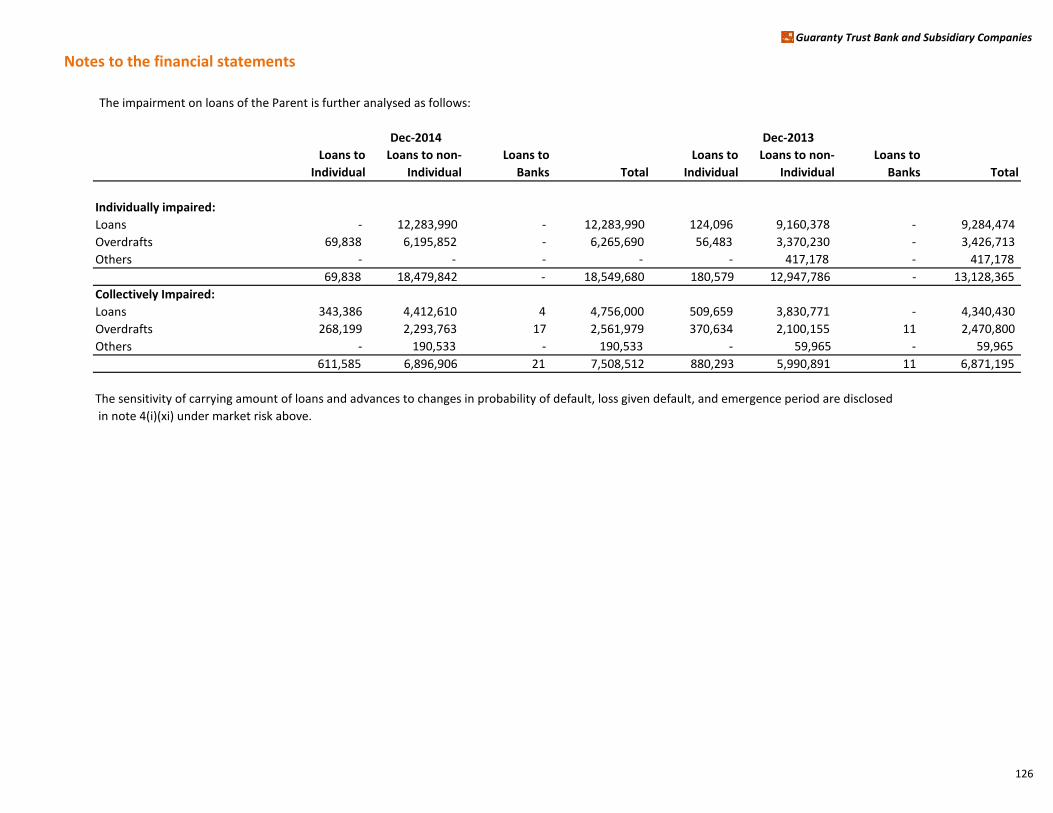
Notes to the financial statements
Guaranty Trust Bank and Subsidiary Companies
The impairment on loans of the Parent is further analysed as follows:
Loans to
Individual
Loans to non-
Individual
Loans to
Banks Total
Loans to
Individual
Loans to non-
Individual
Loans to
Banks Total
Individually impaired:
Loans - 12,283,990 - 12,283,990 124,096 9,160,378 - 9,284,474
Overdrafts 69,838 6,195,852 - 6,265,690 56,483 3,370,230 - 3,426,713
Others - - - - - 417,178 - 417,178
69,838 18,479,842 - 18,549,680 180,579 12,947,786 - 13,128,365
Collectively Impaired:
Loans 343,386 4,412,610 4 4,756,000 509,659 3,830,771 - 4,340,430
Overdrafts 268,199 2,293,763 17 2,561,979 370,634 2,100,155 11 2,470,800
Others - 190,533 - 190,533 - 59,965 - 59,965
611,585 6,896,906 21 7,508,512 880,293 5,990,891 11 6,871,195
The sensitivity of carrying amount of loans and advances to changes in probability of default, loss given default, and emergence period are disclosed
in note 4(i)(xi) under market risk above.
Dec-2014 Dec-2013
126
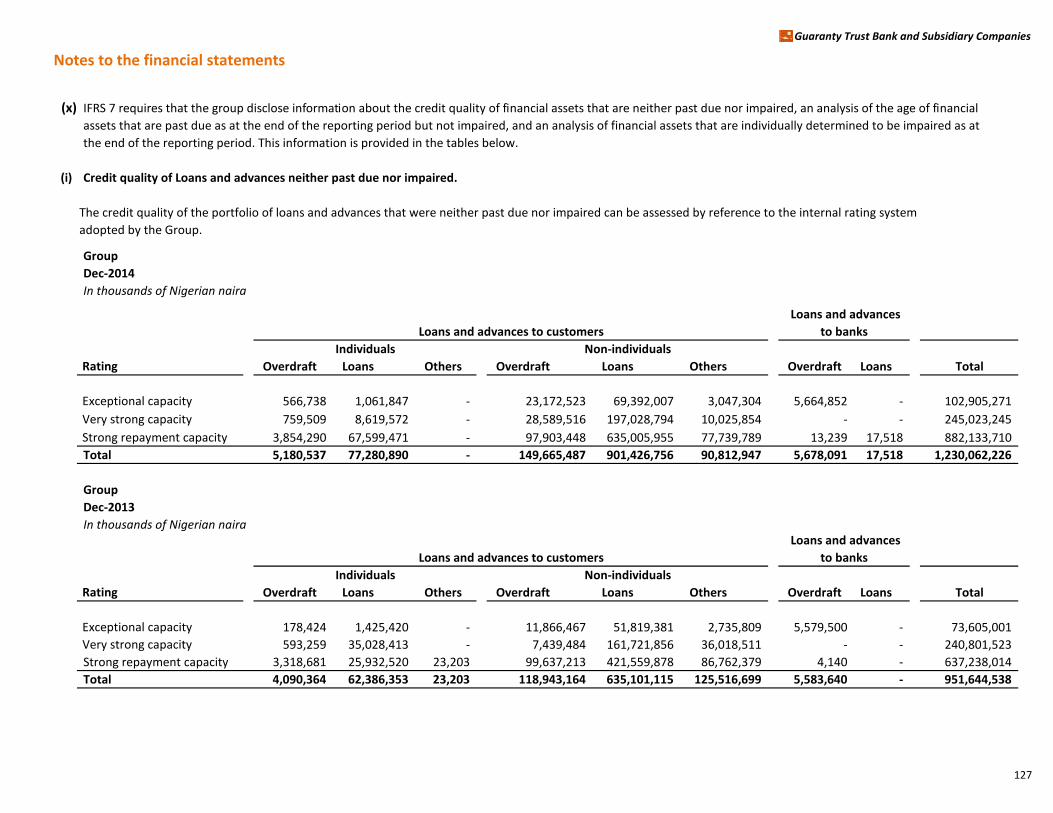
Notes to the financial statements
Guaranty Trust Bank and Subsidiary Companies
(x) IFRS 7 requires that the group disclose information about the credit quality of financial assets that are neither past due nor impaired, an analysis of the age of financial
assets that are past due as at the end of the reporting period but not impaired, and an analysis of financial assets that are individually determined to be impaired as at
the end of the reporting period. This information is provided in the tables below.
(i) Credit quality of Loans and advances neither past due nor impaired.
The credit quality of the portfolio of loans and advances that were neither past due nor impaired can be assessed by reference to the internal rating system
adopted by the Group.
Group
Dec-2014
In thousands of Nigerian naira
Rating Overdraft Loans Others Overdraft Loans Others Overdraft Loans Total
Exceptional capacity 566,738 1,061,847 - 23,172,523 69,392,007 3,047,304 5,664,852 - 102,905,271
Very strong capacity 759,509 8,619,572 - 28,589,516 197,028,794 10,025,854 - - 245,023,245
Strong repayment capacity 3,854,290 67,599,471 - 97,903,448 635,005,955 77,739,789 13,239 17,518 882,133,710
Total 5,180,537 77,280,890 - 149,665,487 901,426,756 90,812,947 5,678,091 17,518 1,230,062,226
Group
Dec-2013
In thousands of Nigerian naira
Rating Overdraft Loans Others Overdraft Loans Others Overdraft Loans Total
Exceptional capacity 178,424 1,425,420 - 11,866,467 51,819,381 2,735,809 5,579,500 - 73,605,001
Very strong capacity 593,259 35,028,413 - 7,439,484 161,721,856 36,018,511 - - 240,801,523
Strong repayment capacity 3,318,681 25,932,520 23,203 99,637,213 421,559,878 86,762,379 4,140 - 637,238,014
Total 4,090,364 62,386,353 23,203 118,943,164 635,101,115 125,516,699 5,583,640 - 951,644,538
Individuals Non-individuals
Loans and advances to customers
Loans and advances
to banks
Individuals Non-individuals
Loans and advances to customers
Loans and advances
to banks
127

Notes to the financial statements
Guaranty Trust Bank and Subsidiary Companies
Parent
Dec-2014
In thousands of Nigerian naira
Rating Overdraft Loans Others Overdraft Loans Others Overdraft Loans Total
Exceptional capacity - - - - 43,774,962 - - - 43,774,962
Very strong capacity 759,509 8,548,855 - 25,588,611 195,227,262 10,024,309 - - 240,148,546
Strong repayment capacity 3,753,197 54,987,865 - 96,328,757 633,748,940 77,738,137 13,314 17,518 866,587,728
Total 4,512,706 63,536,720 - 121,917,368 872,751,164 87,762,446 13,314 17,518 1,150,511,236
Parent
Dec-2013
In thousands of Nigerian naira
Rating Overdraft Loans Others Overdraft Loans Others Overdraft Loans Total
Exceptional capacity - - - 7,605,496 50,440,480 2,674,815 - - 60,720,791
Very strong capacity 493,863 34,574,183 - 2,437,721 160,515,819 36,018,511 - - 234,040,097
Strong repayment capacity 2,931,502 16,183,628 - 77,979,614 417,760,668 86,571,142 4,140 - 601,430,694
Total 3,425,365 50,757,811 - 88,022,831 628,716,967 125,264,468 4,140 - 896,191,582
Loans and advances to customers
Loans and advances
to banks
Individuals Non-individuals
Loans and advances to customers
Loans and advances
to banks
Individuals Non-individuals
128

Notes to the financial statements
Guaranty Trust Bank and Subsidiary Companies
(ii) Loans and advances past due but not impaired
Clearing cheques, late processing and other administrative delays on the side of the borrower can lead to a financial
asset being past due but not impaired. Therefore, loans and advances less than 90 days past due are not usually
considered impaired, unless other information is available to indicate the contrary. Gross amount of loans and
advances by class to customers that were past due but not impaired were as follows:
Group
Dec-2014
In thousands of Nigerian naira
Age
Loans to
Individual
Loans to Non-
individual Total
0 - 90 days 281,596 2,044,778 2,326,374
91 - 180 days - - -
181 - 365 days - - -
281,596 2,044,778 2,326,374
FV of collateral 839,719 77,112,848 77,952,567
Amount of undercollateralisation - - -
Maturity of past due but not impaired loans by type of loan is further analysed below:
Group
Dec-2014
In thousands of Nigerian naira
Age
Loans to
Individual
Loans to Non-
individual Total
Loans
0 - 90 days 32,833 529,088 561,921
91 - 180 days - - -
181 - 365 days - - -
32,833 529,088 561,921
Overdrafts
0 - 90 days 247,912 1,304,588 1,552,500
91 - 180 days - - -
181 - 365 days - - -
247,912 1,304,588 1,552,500
Others
0 - 90 days 851 211,102 211,953
91 - 180 days - - -
181 - 365 days - - -
851 211,102 211,953
281,596 2,044,778 2,326,374
129
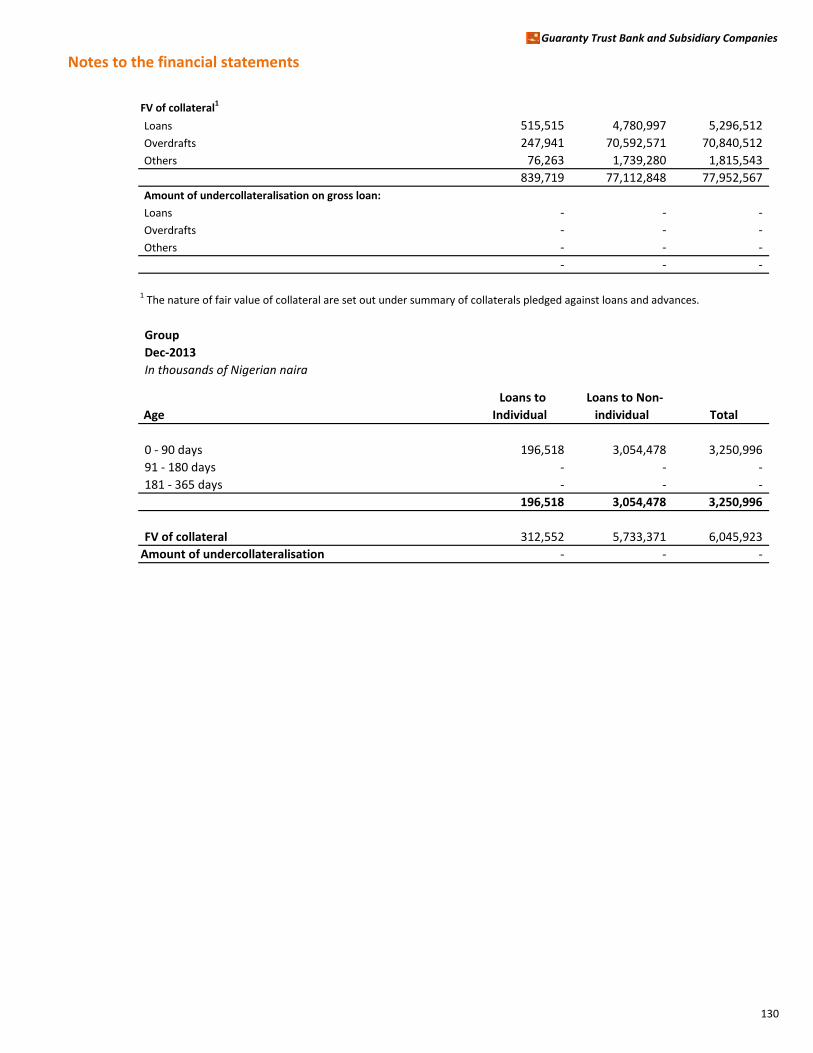
Notes to the financial statements
Guaranty Trust Bank and Subsidiary Companies
FV of collateral1
Loans 515,515 4,780,997 5,296,512
Overdrafts 247,941 70,592,571 70,840,512
Others 76,263 1,739,280 1,815,543
839,719 77,112,848 77,952,567
Amount of undercollateralisation on gross loan:
Loans - - -
Overdrafts - - -
Others - - -
- - -
1 The nature of fair value of collateral are set out under summary of collaterals pledged against loans and advances.
Group
Dec-2013
In thousands of Nigerian naira
Age
Loans to
Individual
Loans to Non-
individual Total
0 - 90 days 196,518 3,054,478 3,250,996
91 - 180 days - - -
181 - 365 days - - -
196,518 3,054,478 3,250,996
FV of collateral 312,552 5,733,371 6,045,923
Amount of undercollateralisation - - -
130
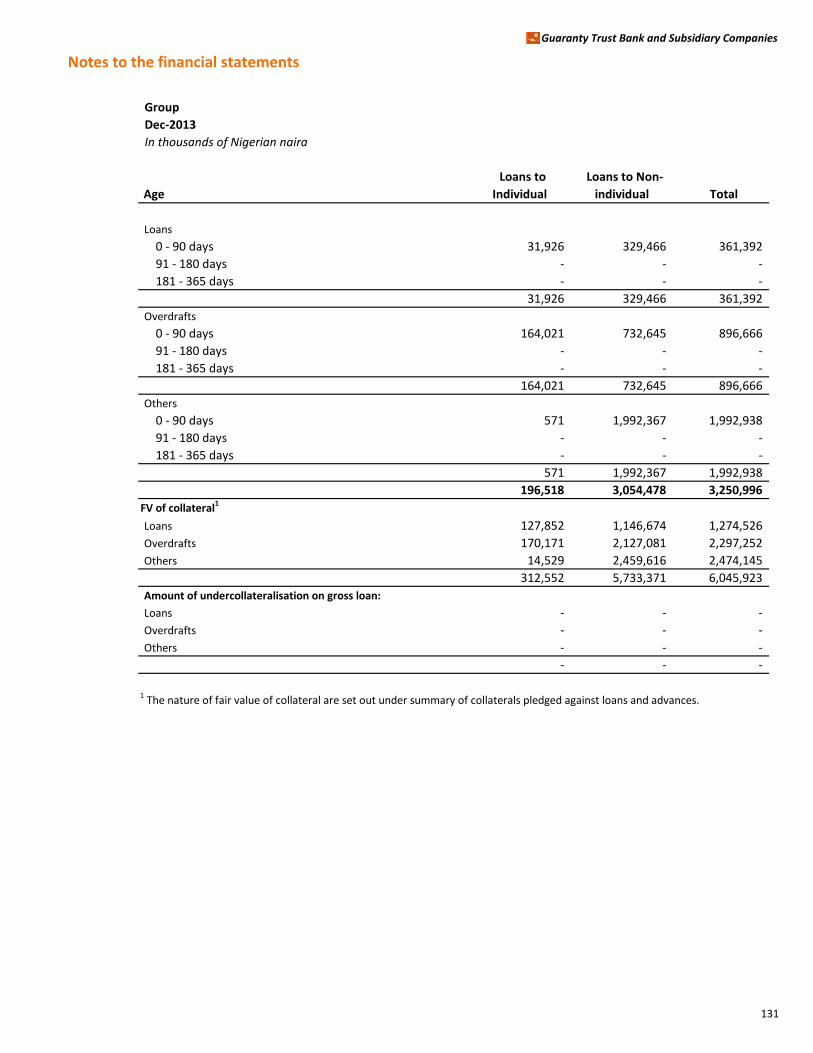
Notes to the financial statements
Guaranty Trust Bank and Subsidiary Companies
Group
Dec-2013
In thousands of Nigerian naira
Age
Loans to
Individual
Loans to Non-
individual Total
Loans
0 - 90 days 31,926 329,466 361,392
91 - 180 days - - -
181 - 365 days - - -
31,926 329,466 361,392
Overdrafts
0 - 90 days 164,021 732,645 896,666
91 - 180 days - - -
181 - 365 days - - -
164,021 732,645 896,666
Others
0 - 90 days 571 1,992,367 1,992,938
91 - 180 days - - -
181 - 365 days - - -
571 1,992,367 1,992,938
196,518 3,054,478 3,250,996
FV of collateral1
Loans 127,852 1,146,674 1,274,526
Overdrafts 170,171 2,127,081 2,297,252
Others 14,529 2,459,616 2,474,145
312,552 5,733,371 6,045,923
Amount of undercollateralisation on gross loan:
Loans - - -
Overdrafts - - -
Others - - -
- - -
1 The nature of fair value of collateral are set out under summary of collaterals pledged against loans and advances.
131
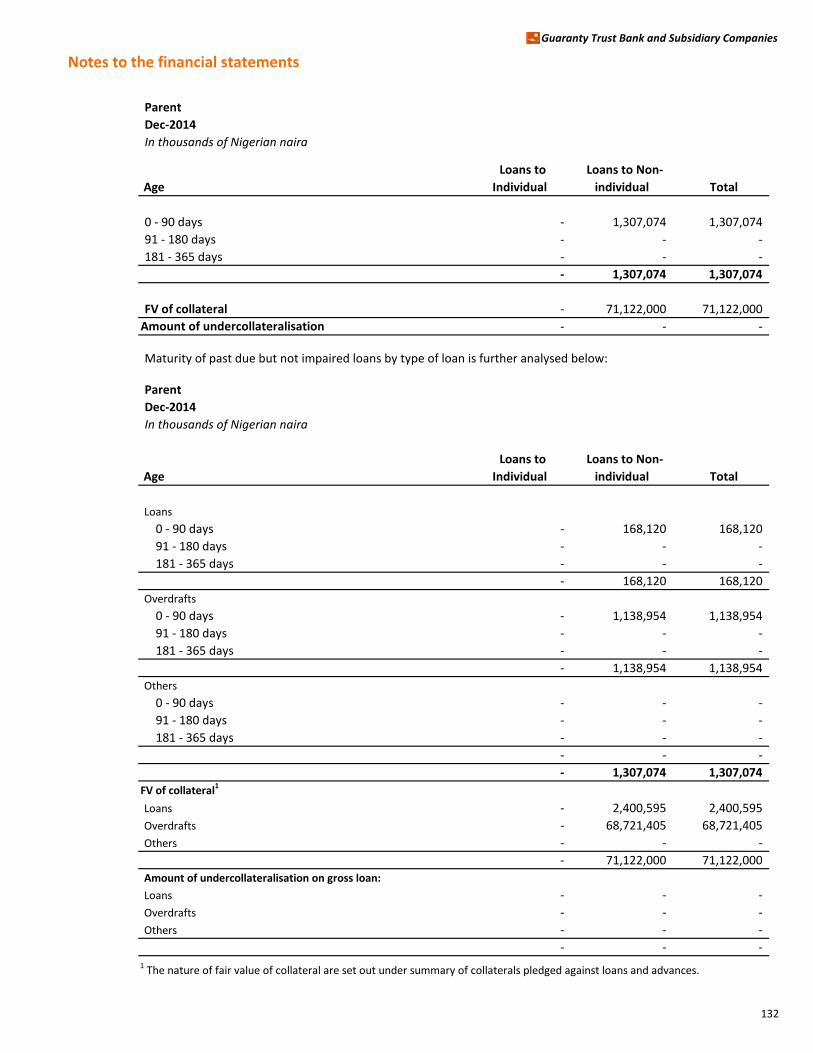
Notes to the financial statements
Guaranty Trust Bank and Subsidiary Companies
Parent
Dec-2014
In thousands of Nigerian naira
Age
Loans to
Individual
Loans to Non-
individual Total
0 - 90 days - 1,307,074 1,307,074
91 - 180 days - - -
181 - 365 days - - -
- 1,307,074 1,307,074
FV of collateral - 71,122,000 71,122,000
Amount of undercollateralisation - - -
Maturity of past due but not impaired loans by type of loan is further analysed below:
Parent
Dec-2014
In thousands of Nigerian naira
Age
Loans to
Individual
Loans to Non-
individual Total
Loans
0 - 90 days - 168,120 168,120
91 - 180 days - - -
181 - 365 days - - -
- 168,120 168,120
Overdrafts
0 - 90 days - 1,138,954 1,138,954
91 - 180 days - - -
181 - 365 days - - -
- 1,138,954 1,138,954
Others
0 - 90 days - - -
91 - 180 days - - -
181 - 365 days - - -
- - -
- 1,307,074 1,307,074
FV of collateral1
Loans - 2,400,595 2,400,595
Overdrafts - 68,721,405 68,721,405
Others - - -
- 71,122,000 71,122,000
Amount of undercollateralisation on gross loan:
Loans - - -
Overdrafts - - -
Others - - -
- - -
1 The nature of fair value of collateral are set out under summary of collaterals pledged against loans and advances.
132

Notes to the financial statements
Guaranty Trust Bank and Subsidiary Companies
ParentDec-2013
In thousands of Nigerian naira
Age
Loans to
Individual
Loans to Non-
individual Total
0 - 90 days 135,554 2,694,946 2,830,500
91 - 180 days - - -
181 - 365 days - - -
135,554 2,694,946 2,830,500
FV of collateral 136,875 4,313,485 4,450,360
Amount of undercollateralisation - - -
Maturity of past due but not impaired loans by type of loan is further analysed below:
Parent
Dec-2013
In thousands of Nigerian naira
Age
Loans to
Individual
Loans to Non-
individual Total
Loans
0 - 90 days 25,679 168,853 194,532
91 - 180 days - - -
181 - 365 days - - -
25,679 168,853 194,532
Overdrafts
0 - 90 days 109,875 663,524 773,399
91 - 180 days - - -
181 - 365 days - - -
109,875 663,524 773,399
Others
0 - 90 days - 1,862,569 1,862,569
91 - 180 days - - -
181 - 365 days - - -
- 1,862,569 1,862,569
135,554 2,694,946 2,830,500
FV of collateral1
Loans 27,000 634,485 661,485
Overdrafts 109,875 1,679,000 1,788,875
Others - 2,000,000 2,000,000
136,875 4,313,485 4,450,360
Amount of undercollateralisation on gross loan:
Loans - - -
Overdrafts - - -
Others - - - - - -
1 The nature of fair value of collateral are set out under summary of collaterals pledged against loans and advances.
Upon initial recognition of loans and advances, the fair value of collateral are determined with reference
to market price or indexes of similar assets.
133
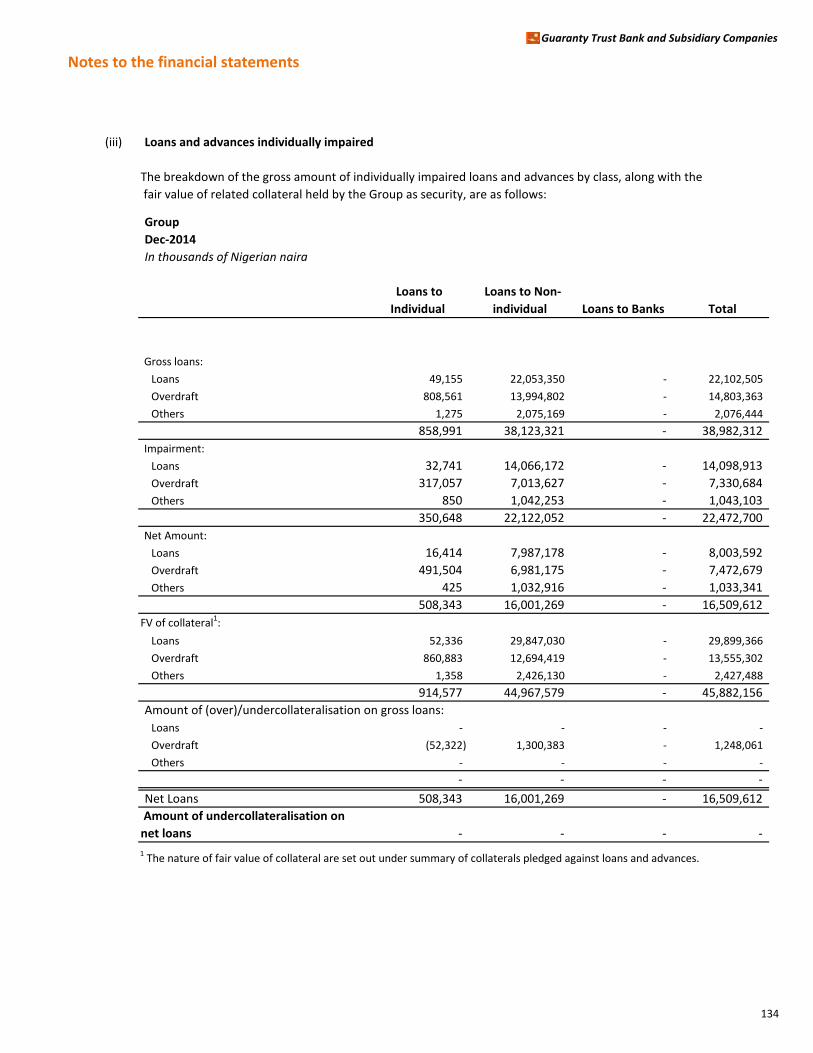
Notes to the financial statements
Guaranty Trust Bank and Subsidiary Companies
(iii) Loans and advances individually impaired
The breakdown of the gross amount of individually impaired loans and advances by class, along with the
fair value of related collateral held by the Group as security, are as follows:
Group
Dec-2014
In thousands of Nigerian naira
Loans to
Individual
Loans to Non-
individual Loans to Banks Total
Gross loans:
Loans 49,155 22,053,350 - 22,102,505
Overdraft 808,561 13,994,802 - 14,803,363
Others 1,275 2,075,169 - 2,076,444
858,991 38,123,321 - 38,982,312
Impairment:
Loans 32,741 14,066,172 - 14,098,913
Overdraft 317,057 7,013,627 - 7,330,684
Others 850 1,042,253 - 1,043,103
350,648 22,122,052 - 22,472,700
Net Amount:
Loans 16,414 7,987,178 - 8,003,592
Overdraft 491,504 6,981,175 - 7,472,679
Others 425 1,032,916 - 1,033,341
508,343 16,001,269 - 16,509,612
FV of collateral1:
Loans 52,336 29,847,030 - 29,899,366
Overdraft 860,883 12,694,419 - 13,555,302
Others 1,358 2,426,130 - 2,427,488
914,577 44,967,579 - 45,882,156
Amount of (over)/undercollateralisation on gross loans:
Loans - - - -
Overdraft (52,322) 1,300,383 - 1,248,061
Others - - - -
- - - -
Net Loans 508,343 16,001,269 - 16,509,612
Amount of undercollateralisation on
net loans - - - -
1 The nature of fair value of collateral are set out under summary of collaterals pledged against loans and advances.
134
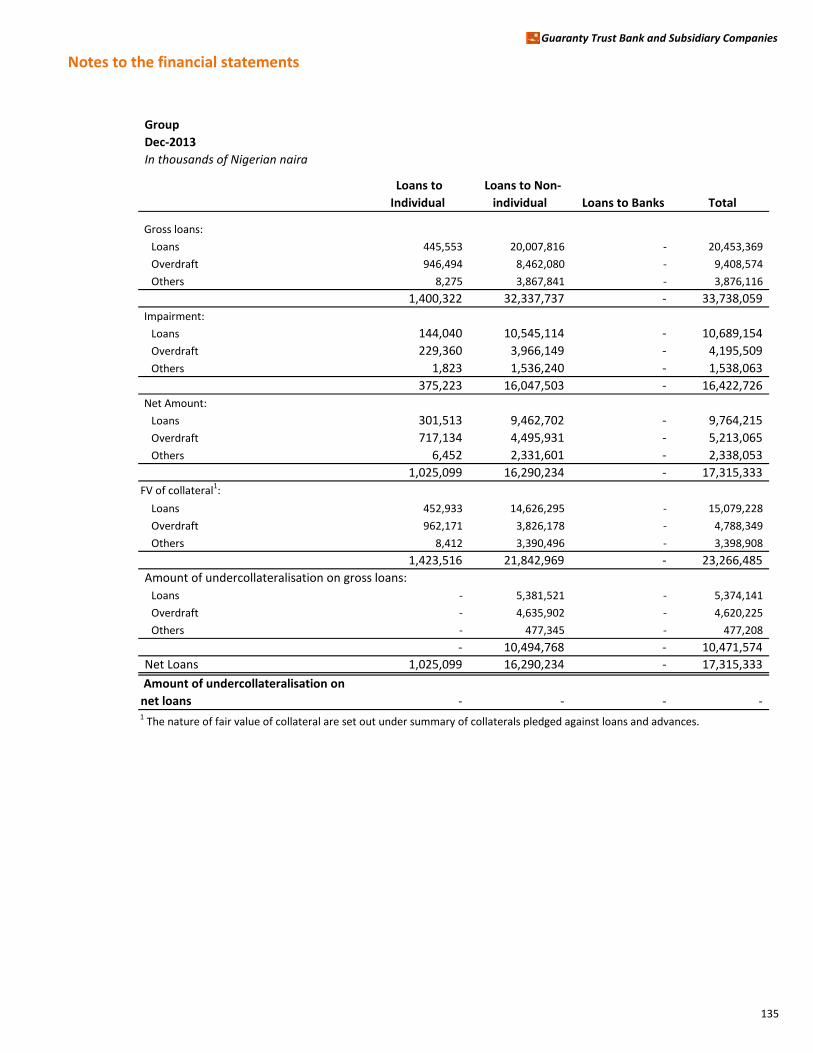
Notes to the financial statements
Guaranty Trust Bank and Subsidiary Companies
Group
Dec-2013
In thousands of Nigerian naira
Loans to
Individual
Loans to Non-
individual Loans to Banks Total
Gross loans:
Loans 445,553 20,007,816 - 20,453,369
Overdraft 946,494 8,462,080 - 9,408,574
Others 8,275 3,867,841 - 3,876,116
1,400,322 32,337,737 - 33,738,059
Impairment:
Loans 144,040 10,545,114 - 10,689,154
Overdraft 229,360 3,966,149 - 4,195,509
Others 1,823 1,536,240 - 1,538,063
375,223 16,047,503 - 16,422,726
Net Amount:
Loans 301,513 9,462,702 - 9,764,215
Overdraft 717,134 4,495,931 - 5,213,065
Others 6,452 2,331,601 - 2,338,053
1,025,099 16,290,234 - 17,315,333
FV of collateral1:
Loans 452,933 14,626,295 - 15,079,228
Overdraft 962,171 3,826,178 - 4,788,349
Others 8,412 3,390,496 - 3,398,908
1,423,516 21,842,969 - 23,266,485
Amount of undercollateralisation on gross loans:
Loans - 5,381,521 - 5,374,141
Overdraft - 4,635,902 - 4,620,225
Others - 477,345 - 477,208
- 10,494,768 - 10,471,574
Net Loans 1,025,099 16,290,234 - 17,315,333
Amount of undercollateralisation on
net loans - - - - 1 The nature of fair value of collateral are set out under summary of collaterals pledged against loans and advances.
135
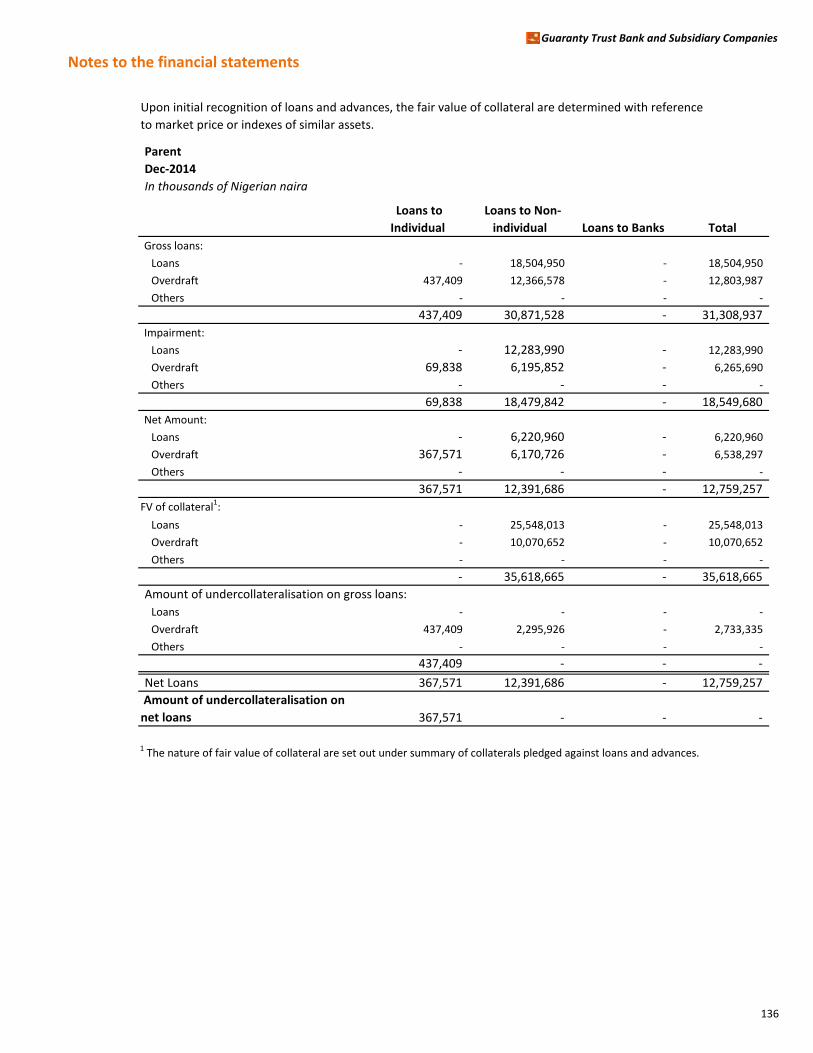
Notes to the financial statements
Guaranty Trust Bank and Subsidiary Companies
Upon initial recognition of loans and advances, the fair value of collateral are determined with reference
to market price or indexes of similar assets.
Parent
Dec-2014
In thousands of Nigerian naira
Loans to
Individual
Loans to Non-
individual Loans to Banks Total
Gross loans:
Loans - 18,504,950 - 18,504,950
Overdraft 437,409 12,366,578 - 12,803,987
Others - - - -
437,409 30,871,528 - 31,308,937
Impairment:
Loans - 12,283,990 - 12,283,990
Overdraft 69,838 6,195,852 - 6,265,690
Others - - - -
69,838 18,479,842 - 18,549,680
Net Amount:
Loans - 6,220,960 - 6,220,960
Overdraft 367,571 6,170,726 - 6,538,297
Others - - - -
367,571 12,391,686 - 12,759,257
FV of collateral1:
Loans - 25,548,013 - 25,548,013
Overdraft - 10,070,652 - 10,070,652
Others - - - -
- 35,618,665 - 35,618,665
Amount of undercollateralisation on gross loans:
Loans - - - -
Overdraft 437,409 2,295,926 - 2,733,335
Others - - - -
437,409 - - -
Net Loans 367,571 12,391,686 - 12,759,257
Amount of undercollateralisation on
net loans 367,571 - - -
1 The nature of fair value of collateral are set out under summary of collaterals pledged against loans and advances.
136
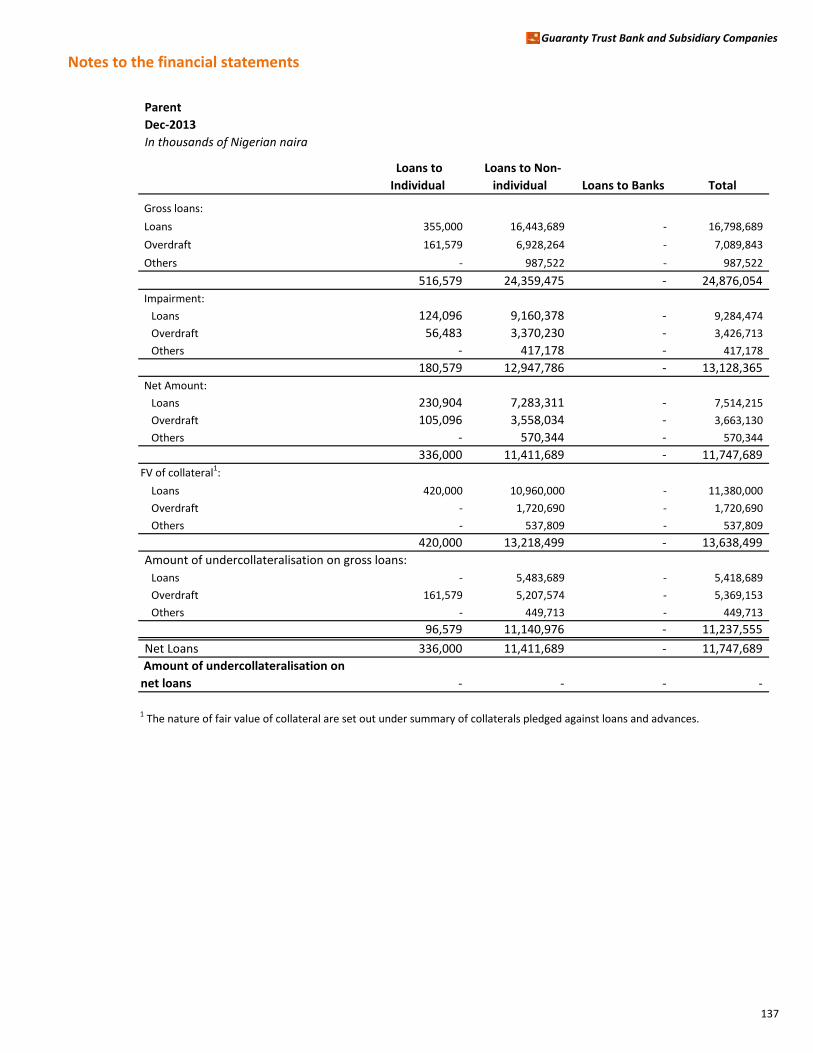
Notes to the financial statements
Guaranty Trust Bank and Subsidiary Companies
Parent
Dec-2013
In thousands of Nigerian naira
Loans to
Individual
Loans to Non-
individual Loans to Banks Total
Gross loans:
Loans 355,000 16,443,689 - 16,798,689
Overdraft 161,579 6,928,264 - 7,089,843
Others - 987,522 - 987,522
516,579 24,359,475 - 24,876,054
Impairment:
Loans 124,096 9,160,378 - 9,284,474
Overdraft 56,483 3,370,230 - 3,426,713
Others - 417,178 - 417,178
180,579 12,947,786 - 13,128,365
Net Amount:
Loans 230,904 7,283,311 - 7,514,215
Overdraft 105,096 3,558,034 - 3,663,130
Others - 570,344 - 570,344
336,000 11,411,689 - 11,747,689
FV of collateral1:
Loans 420,000 10,960,000 - 11,380,000
Overdraft - 1,720,690 - 1,720,690
Others - 537,809 - 537,809
420,000 13,218,499 - 13,638,499
Amount of undercollateralisation on gross loans:
Loans - 5,483,689 - 5,418,689
Overdraft 161,579 5,207,574 - 5,369,153
Others - 449,713 - 449,713
96,579 11,140,976 - 11,237,555
Net Loans 336,000 11,411,689 - 11,747,689
Amount of undercollateralisation on
net loans - - - -
1 The nature of fair value of collateral are set out under summary of collaterals pledged against loans and advances.
137

Notes to the financial statements
Guaranty Trust Bank and Subsidiary Companies
(iv) Undercollaterisation of Individually impaired and collectively impaired loans is shown below:
Group Group Parent Parent
In thousands of Nigerian Naira Dec-2014 Dec-2013 Dec-2014 Dec-2013
Past due and impaired:
Gross loans 38,982,312 33,738,059 31,308,937 24,876,054
Collateral 45,882,156 23,266,485 35,618,665 13,638,499
Undercollaterisation - (10,471,574) - (11,237,555)
Collectively impaired
Gross loans 40,626,083 43,137,190 25,355,630 23,072,646
Collateral 234,191,264 235,027,631 192,658,227 179,498,764
Undercollaterisation - - - -
138
Notes to the financial statements Guaranty Trust Bank and Subsidiary Companies
139
(xi) Credit collateral
The Group ensures that each credit is reviewed and granted based on the strength of the borrowers’ cash flow. However, the Group also ensures its credit facilities are well secured as a second way out. The policies that guide collateral for facilities are embedded within the Group’s credit policy guide. These include the following policy statements amongst others: Loans to individuals or sole proprietors must be secured by tangible, marketable collateral that has a market value that is supported by a valuation report from a registered estate valuer who is acceptable to the Group. The collateral must also be easy to check and easy to dispose of. This collateral must be in the possession of, or pledged to, the Group. Client’s account balances must be within the scope of cover provided by its collateral.
All collateral offered must have the following attributes:
• There must be good legal title
• The title must be easy to transfer
• It should be easy and relatively cheap to value
• The value should be appreciating or at least stable
• The security must be easy to sell.
All collateral must be protected by insurance. Exceptions include cash collateral, securities in safe keeping, indemnity or guarantees, or where our interest is general (for instance in a negative pledge). The insurance policy has to be issued by an insurer acceptable to the Bank. All cash collateralized facilities shall have a 20% margin to provide cushion for interest and other charges i.e. only 80% of the deposit or cash collateral may be availed to an obligor. The main collateral types acceptable to the Bank for loans and advances include:
• Mortgages over residential properties
• Charges over business premises, fixed and floating assets as well as inventory.
• Charges over financial instruments such as equities, treasury bills etc.
The fair values of collaterals are based upon last annual valuation undertaken by independent valuers on
behalf of the Bank. The valuation techniques adopted for properties are based upon fair values of similar
properties in the neighbourhood taking into cognizance the advantages and disadvantages of the
comparatives over the subject property and any other factor which can have effect on the valuation e.g.
subsequent movements in house prices, after making allowance for dilapidations. The fair values of non-
property collaterals (such as equities, bond, treasury bills, etc.) are determined with reference to market
quoted prices or market values of similar instrument.
The same Fair value approach is used in determining the collaterals value in the course of sale or
realisation.The Bank does not take physical possession of properties or other assets held as collateral and
uses external agents to realise the value as soon as practicable, generally at auction, to settle
indebtedness. Any surplus funds are returned to the borrower.

Notes to the financial statements
Guaranty Trust Bank and Subsidiary Companies
(a) Summary of collaterals pledged against loans and advances
An estimate of the fair value of any collateral and other security enhancements held against loans and advances to customers
and banks is shown below:
Group
Dec-2014
In thousands of Nigerian Naira Gross Loans Collateral Gross Loans Collateral
Against individually impaired 38,982,312 45,882,156 - -
Against collectively impaired 40,626,083 234,191,264 4 -
Against past due but not impaired 2,326,374 77,952,567 - -
Against neither past due nor impaired 1,224,366,617 2,512,322,338 5,695,609 8,280,559
Total 1,306,301,386 2,870,348,325 5,695,613 8,280,559
Group
Dec-2013
In thousands of Nigerian Naira Gross Loans Collateral Gross Loans Collateral
Against individually impaired 33,738,059 23,266,485 - -
Against collectively impaired 43,137,190 235,027,631 12,847 -
Against past due but not impaired 3,250,996 6,045,923 - -
Against neither past due nor impaired 946,060,898 1,405,866,876 5,583,640 502,152
Total 1,026,187,143 1,670,206,915 5,596,487 502,152
Parent
Dec-2014
In thousands of Nigerian Naira Gross Loans Collateral Gross Loans Collateral
Against individually impaired 31,308,937 35,618,665 - -
Against collectively impaired 25,355,630 192,658,227 4 -
Against past due but not impaired 1,307,074 71,122,000 - -
Against neither past due nor impaired 1,150,480,404 2,433,040,393 30,832 188,000
Total 1,208,452,045 2,732,439,285 30,836 188,000
Parent
Dec-2013
In thousands of Nigerian Naira Gross Loans Collateral Gross Loans Collateral
Against individually impaired 24,876,054 13,638,499 - -
Against collectively impaired 23,072,646 179,498,764 12,847 -
Against past due but not impaired 2,830,500 4,450,360 - -
Against neither past due nor impaired 896,187,442 1,355,895,284 4,140 40,000
Total 946,966,642 1,553,482,907 16,987 40,000
Loans and advances Loans and advances
to customers to Banks
Loans and advances Loans and advances
to customers to Banks
Loans and advances Loans and advances
to customers to Banks
Loans and advances Loans and advances
to customers to Banks
140
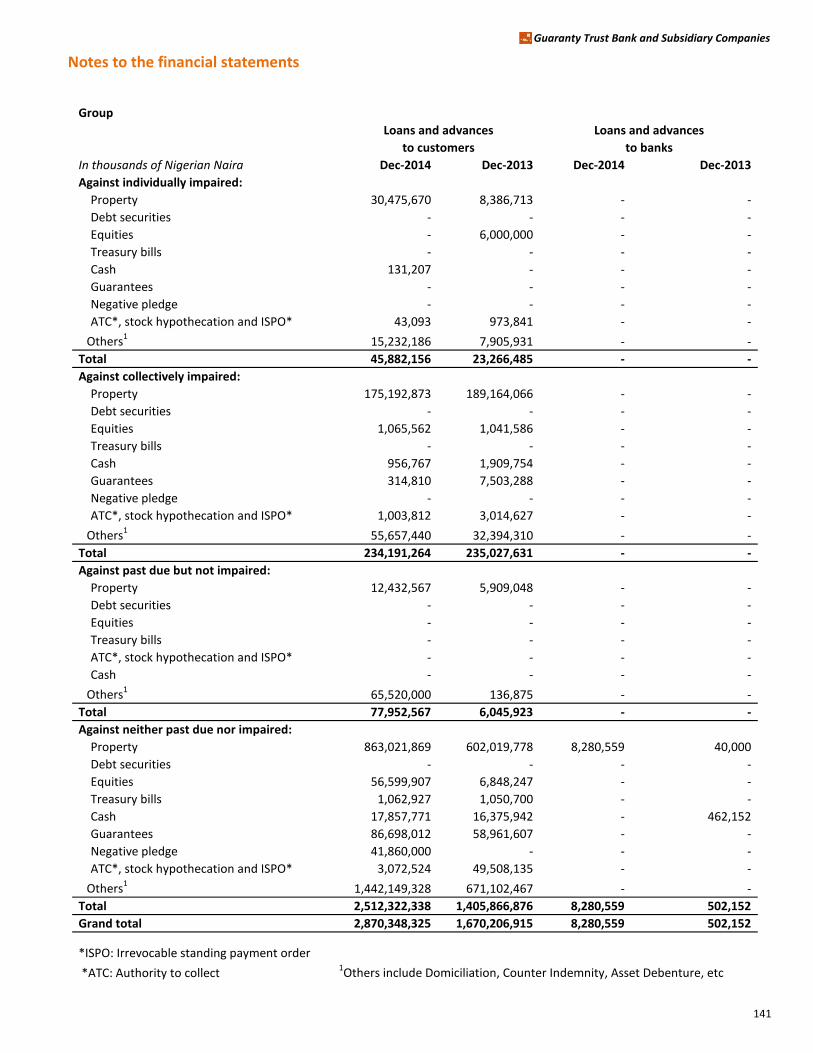
Notes to the financial statements
Guaranty Trust Bank and Subsidiary Companies
Group
In thousands of Nigerian Naira Dec-2014 Dec-2013 Dec-2014 Dec-2013
Against individually impaired:
Property 30,475,670 8,386,713 - -
Debt securities - - - -
Equities - 6,000,000 - -
Treasury bills - - - -
Cash 131,207 - - -
Guarantees - - - -
Negative pledge - - - -
ATC*, stock hypothecation and ISPO* 43,093 973,841 - -
Others115,232,186 7,905,931 - -
Total 45,882,156 23,266,485 - -
Against collectively impaired:
Property 175,192,873 189,164,066 - -
Debt securities - - - -
Equities 1,065,562 1,041,586 - -
Treasury bills - - - -
Cash 956,767 1,909,754 - -
Guarantees 314,810 7,503,288 - -
Negative pledge - - - -
ATC*, stock hypothecation and ISPO* 1,003,812 3,014,627 - -
Others155,657,440 32,394,310 - -
Total 234,191,264 235,027,631 - -
Against past due but not impaired:
Property 12,432,567 5,909,048 - -
Debt securities - - - -
Equities - - - -
Treasury bills - - - -
ATC*, stock hypothecation and ISPO* - - - -
Cash - - - -
Others165,520,000 136,875 - -
Total 77,952,567 6,045,923 - -
Against neither past due nor impaired:
Property 863,021,869 602,019,778 8,280,559 40,000
Debt securities - - - -
Equities 56,599,907 6,848,247 - -
Treasury bills 1,062,927 1,050,700 - -
Cash 17,857,771 16,375,942 - 462,152
Guarantees 86,698,012 58,961,607 - -
Negative pledge 41,860,000 - - -
ATC*, stock hypothecation and ISPO* 3,072,524 49,508,135 - -
Others11,442,149,328 671,102,467 - -
Total 2,512,322,338 1,405,866,876 8,280,559 502,152
Grand total 2,870,348,325 1,670,206,915 8,280,559 502,152
*ISPO: Irrevocable standing payment order
*ATC: Authority to collect 1Others include Domiciliation, Counter Indemnity, Asset Debenture, etc
Loans and advances Loans and advances
to customers to banks
141
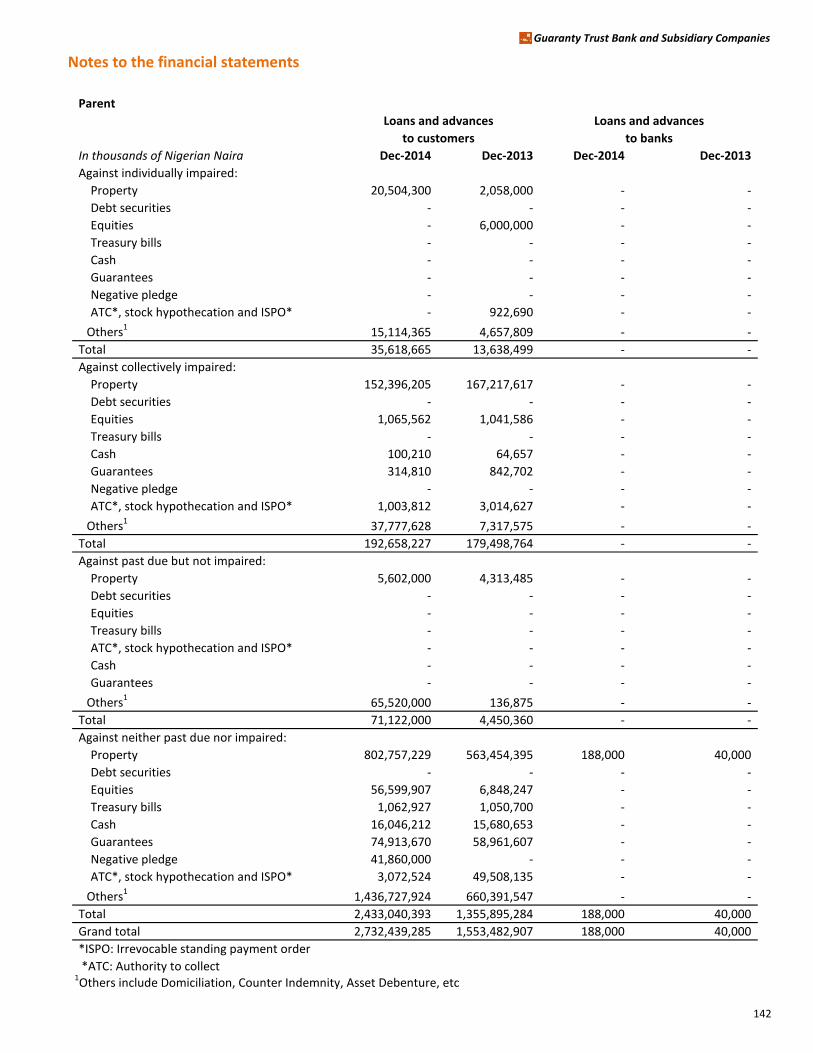
Notes to the financial statements
Guaranty Trust Bank and Subsidiary Companies
Parent
In thousands of Nigerian Naira Dec-2014 Dec-2013 Dec-2014 Dec-2013
Against individually impaired:
Property 20,504,300 2,058,000 - -
Debt securities - - - -
Equities - 6,000,000 - -
Treasury bills - - - -
Cash - - - -
Guarantees - - - -
Negative pledge - - - -
ATC*, stock hypothecation and ISPO* - 922,690 - -
Others115,114,365 4,657,809 - -
Total 35,618,665 13,638,499 - -
Against collectively impaired:
Property 152,396,205 167,217,617 - -
Debt securities - - - -
Equities 1,065,562 1,041,586 - -
Treasury bills - - - -
Cash 100,210 64,657 - -
Guarantees 314,810 842,702 - -
Negative pledge - - - -
ATC*, stock hypothecation and ISPO* 1,003,812 3,014,627 - -
Others137,777,628 7,317,575 - -
Total 192,658,227 179,498,764 - -
Against past due but not impaired:
Property 5,602,000 4,313,485 - -
Debt securities - - - -
Equities - - - -
Treasury bills - - - -
ATC*, stock hypothecation and ISPO* - - - -
Cash - - - -
Guarantees - - - -
Others165,520,000 136,875 - -
Total 71,122,000 4,450,360 - -
Against neither past due nor impaired:
Property 802,757,229 563,454,395 188,000 40,000
Debt securities - - - -
Equities 56,599,907 6,848,247 - -
Treasury bills 1,062,927 1,050,700 - -
Cash 16,046,212 15,680,653 - -
Guarantees 74,913,670 58,961,607 - -
Negative pledge 41,860,000 - - -
ATC*, stock hypothecation and ISPO* 3,072,524 49,508,135 - -
Others11,436,727,924 660,391,547 - -
Total 2,433,040,393 1,355,895,284 188,000 40,000
Grand total 2,732,439,285 1,553,482,907 188,000 40,000
*ISPO: Irrevocable standing payment order
*ATC: Authority to collect 1Others include Domiciliation, Counter Indemnity, Asset Debenture, etc
Loans and advances Loans and advances
to customers to banks
142
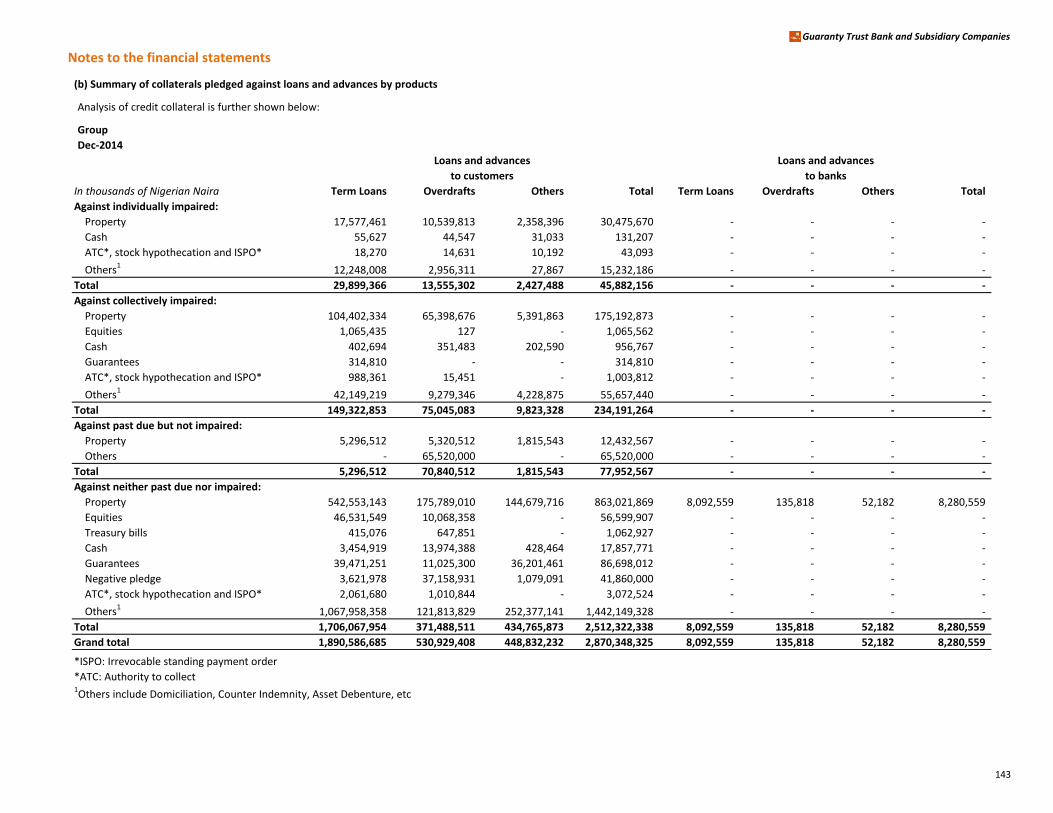
Notes to the financial statements
Guaranty Trust Bank and Subsidiary Companies
(b) Summary of collaterals pledged against loans and advances by products
Analysis of credit collateral is further shown below:
Group
Dec-2014
In thousands of Nigerian Naira Term Loans Overdrafts Others Total Term Loans Overdrafts Others Total
Against individually impaired:
Property 17,577,461 10,539,813 2,358,396 30,475,670 - - - -
Cash 55,627 44,547 31,033 131,207 - - - -
ATC*, stock hypothecation and ISPO* 18,270 14,631 10,192 43,093 - - - -
Others112,248,008 2,956,311 27,867 15,232,186 - - - -
Total 29,899,366 13,555,302 2,427,488 45,882,156 - - - -
Against collectively impaired:
Property 104,402,334 65,398,676 5,391,863 175,192,873 - - - -
Equities 1,065,435 127 - 1,065,562 - - - -
Cash 402,694 351,483 202,590 956,767 - - - -
Guarantees 314,810 - - 314,810 - - - -
ATC*, stock hypothecation and ISPO* 988,361 15,451 - 1,003,812 - - - -
Others142,149,219 9,279,346 4,228,875 55,657,440 - - - -
Total 149,322,853 75,045,083 9,823,328 234,191,264 - - - -
Against past due but not impaired:
Property 5,296,512 5,320,512 1,815,543 12,432,567 - - - -
Others - 65,520,000 - 65,520,000 - - - -
Total 5,296,512 70,840,512 1,815,543 77,952,567 - - - -
Against neither past due nor impaired:
Property 542,553,143 175,789,010 144,679,716 863,021,869 8,092,559 135,818 52,182 8,280,559
Equities 46,531,549 10,068,358 - 56,599,907 - - - -
Treasury bills 415,076 647,851 - 1,062,927 - - - -
Cash 3,454,919 13,974,388 428,464 17,857,771 - - - -
Guarantees 39,471,251 11,025,300 36,201,461 86,698,012 - - - -
Negative pledge 3,621,978 37,158,931 1,079,091 41,860,000 - - - -
ATC*, stock hypothecation and ISPO* 2,061,680 1,010,844 - 3,072,524 - - - -
Others11,067,958,358 121,813,829 252,377,141 1,442,149,328 - - - -
Total 1,706,067,954 371,488,511 434,765,873 2,512,322,338 8,092,559 135,818 52,182 8,280,559
Grand total 1,890,586,685 530,929,408 448,832,232 2,870,348,325 8,092,559 135,818 52,182 8,280,559
*ISPO: Irrevocable standing payment order
*ATC: Authority to collect 1Others include Domiciliation, Counter Indemnity, Asset Debenture, etc
Loans and advances Loans and advances
to customers to banks
143
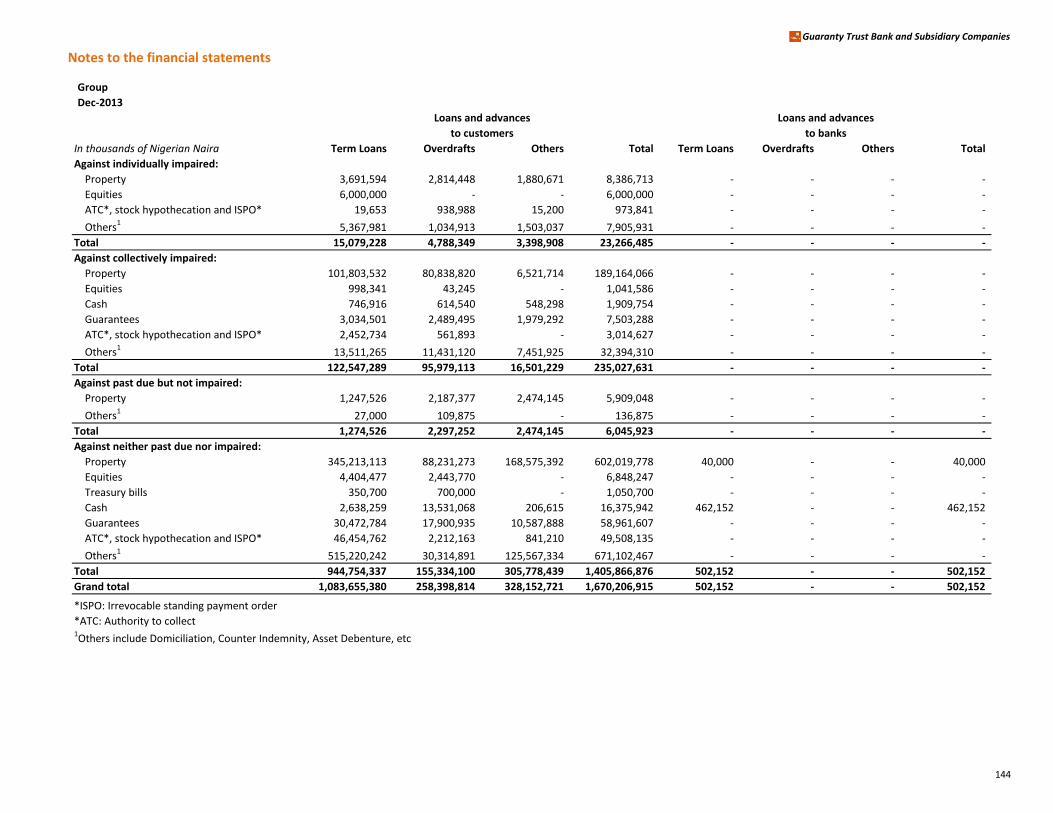
Notes to the financial statements
Guaranty Trust Bank and Subsidiary Companies
Group
Dec-2013
In thousands of Nigerian Naira Term Loans Overdrafts Others Total Term Loans Overdrafts Others Total
Against individually impaired:
Property 3,691,594 2,814,448 1,880,671 8,386,713 - - - -
Equities 6,000,000 - - 6,000,000 - - - -
ATC*, stock hypothecation and ISPO* 19,653 938,988 15,200 973,841 - - - -
Others15,367,981 1,034,913 1,503,037 7,905,931 - - - -
Total 15,079,228 4,788,349 3,398,908 23,266,485 - - - -
Against collectively impaired:
Property 101,803,532 80,838,820 6,521,714 189,164,066 - - - -
Equities 998,341 43,245 - 1,041,586 - - - -
Cash 746,916 614,540 548,298 1,909,754 - - - -
Guarantees 3,034,501 2,489,495 1,979,292 7,503,288 - - - -
ATC*, stock hypothecation and ISPO* 2,452,734 561,893 - 3,014,627 - - - -
Others113,511,265 11,431,120 7,451,925 32,394,310 - - - -
Total 122,547,289 95,979,113 16,501,229 235,027,631 - - - -
Against past due but not impaired:
Property 1,247,526 2,187,377 2,474,145 5,909,048 - - - -
Others127,000 109,875 - 136,875 - - - -
Total 1,274,526 2,297,252 2,474,145 6,045,923 - - - -
Against neither past due nor impaired:
Property 345,213,113 88,231,273 168,575,392 602,019,778 40,000 - - 40,000
Equities 4,404,477 2,443,770 - 6,848,247 - - - -
Treasury bills 350,700 700,000 - 1,050,700 - - - -
Cash 2,638,259 13,531,068 206,615 16,375,942 462,152 - - 462,152
Guarantees 30,472,784 17,900,935 10,587,888 58,961,607 - - - -
ATC*, stock hypothecation and ISPO* 46,454,762 2,212,163 841,210 49,508,135 - - - -
Others1515,220,242 30,314,891 125,567,334 671,102,467 - - - -
Total 944,754,337 155,334,100 305,778,439 1,405,866,876 502,152 - - 502,152
Grand total 1,083,655,380 258,398,814 328,152,721 1,670,206,915 502,152 - - 502,152
*ISPO: Irrevocable standing payment order
*ATC: Authority to collect 1Others include Domiciliation, Counter Indemnity, Asset Debenture, etc
Loans and advances Loans and advances
to customers to banks
144
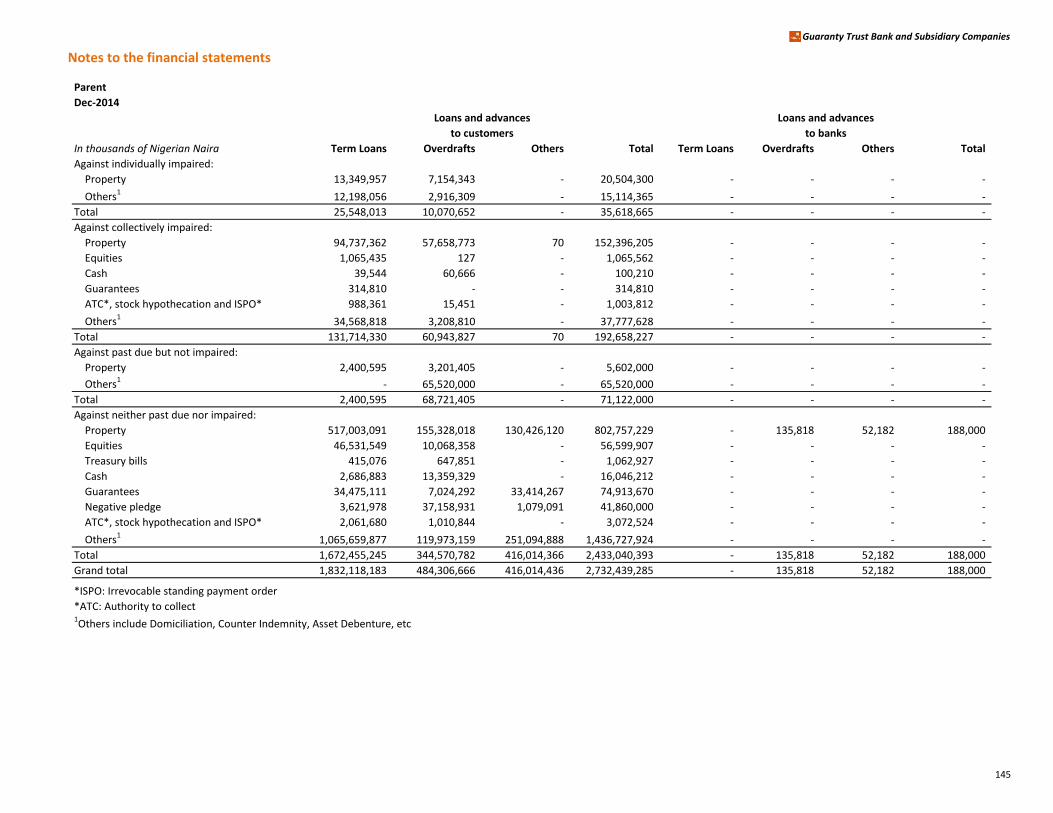
Notes to the financial statements
Guaranty Trust Bank and Subsidiary Companies
Parent
Dec-2014
In thousands of Nigerian Naira Term Loans Overdrafts Others Total Term Loans Overdrafts Others Total
Against individually impaired:
Property 13,349,957 7,154,343 - 20,504,300 - - - -
Others112,198,056 2,916,309 - 15,114,365 - - - -
Total 25,548,013 10,070,652 - 35,618,665 - - - -
Against collectively impaired:
Property 94,737,362 57,658,773 70 152,396,205 - - - -
Equities 1,065,435 127 - 1,065,562 - - - -
Cash 39,544 60,666 - 100,210 - - - -
Guarantees 314,810 - - 314,810 - - - -
ATC*, stock hypothecation and ISPO* 988,361 15,451 - 1,003,812 - - - -
Others134,568,818 3,208,810 - 37,777,628 - - - -
Total 131,714,330 60,943,827 70 192,658,227 - - - -
Against past due but not impaired:
Property 2,400,595 3,201,405 - 5,602,000 - - - -
Others1- 65,520,000 - 65,520,000 - - - -
Total 2,400,595 68,721,405 - 71,122,000 - - - -
Against neither past due nor impaired:
Property 517,003,091 155,328,018 130,426,120 802,757,229 - 135,818 52,182 188,000
Equities 46,531,549 10,068,358 - 56,599,907 - - - -
Treasury bills 415,076 647,851 - 1,062,927 - - - -
Cash 2,686,883 13,359,329 - 16,046,212 - - - -
Guarantees 34,475,111 7,024,292 33,414,267 74,913,670 - - - -
Negative pledge 3,621,978 37,158,931 1,079,091 41,860,000 - - - -
ATC*, stock hypothecation and ISPO* 2,061,680 1,010,844 - 3,072,524 - - - -
Others11,065,659,877 119,973,159 251,094,888 1,436,727,924 - - - -
Total 1,672,455,245 344,570,782 416,014,366 2,433,040,393 - 135,818 52,182 188,000
Grand total 1,832,118,183 484,306,666 416,014,436 2,732,439,285 - 135,818 52,182 188,000
*ISPO: Irrevocable standing payment order
*ATC: Authority to collect 1Others include Domiciliation, Counter Indemnity, Asset Debenture, etc
Loans and advances Loans and advances
to customers to banks
145
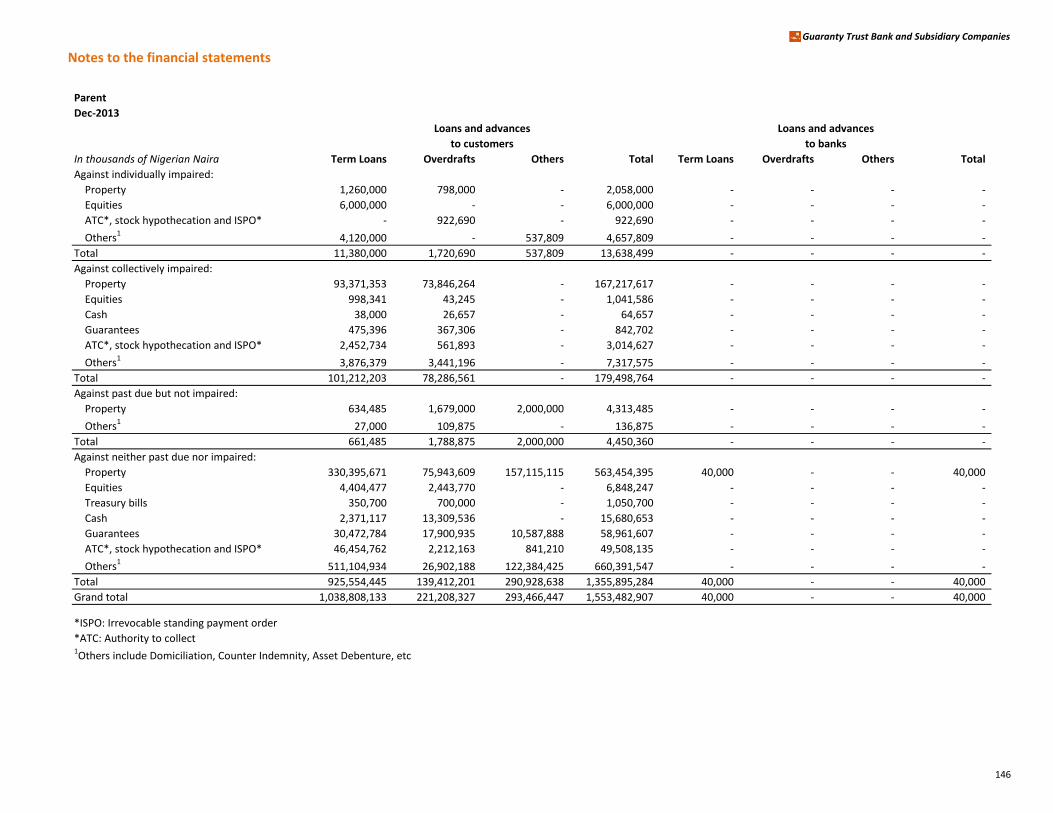
Notes to the financial statements
Guaranty Trust Bank and Subsidiary Companies
Parent
Dec-2013
In thousands of Nigerian Naira Term Loans Overdrafts Others Total Term Loans Overdrafts Others Total
Against individually impaired:
Property 1,260,000 798,000 - 2,058,000 - - - -
Equities 6,000,000 - - 6,000,000 - - - -
ATC*, stock hypothecation and ISPO* - 922,690 - 922,690 - - - -
Others14,120,000 - 537,809 4,657,809 - - - -
Total 11,380,000 1,720,690 537,809 13,638,499 - - - -
Against collectively impaired:
Property 93,371,353 73,846,264 - 167,217,617 - - - -
Equities 998,341 43,245 - 1,041,586 - - - -
Cash 38,000 26,657 - 64,657 - - - -
Guarantees 475,396 367,306 - 842,702 - - - -
ATC*, stock hypothecation and ISPO* 2,452,734 561,893 - 3,014,627 - - - -
Others13,876,379 3,441,196 - 7,317,575 - - - -
Total 101,212,203 78,286,561 - 179,498,764 - - - -
Against past due but not impaired:
Property 634,485 1,679,000 2,000,000 4,313,485 - - - -
Others127,000 109,875 - 136,875 - - - -
Total 661,485 1,788,875 2,000,000 4,450,360 - - - -
Against neither past due nor impaired:
Property 330,395,671 75,943,609 157,115,115 563,454,395 40,000 - - 40,000
Equities 4,404,477 2,443,770 - 6,848,247 - - - -
Treasury bills 350,700 700,000 - 1,050,700 - - - -
Cash 2,371,117 13,309,536 - 15,680,653 - - - -
Guarantees 30,472,784 17,900,935 10,587,888 58,961,607 - - - -
ATC*, stock hypothecation and ISPO* 46,454,762 2,212,163 841,210 49,508,135 - - - -
Others1511,104,934 26,902,188 122,384,425 660,391,547 - - - -
Total 925,554,445 139,412,201 290,928,638 1,355,895,284 40,000 - - 40,000
Grand total 1,038,808,133 221,208,327 293,466,447 1,553,482,907 40,000 - - 40,000
*ISPO: Irrevocable standing payment order
*ATC: Authority to collect 1Others include Domiciliation, Counter Indemnity, Asset Debenture, etc
Loans and advances Loans and advances
to customers to banks
146

Notes to the consolidated financial statements
Guaranty Trust Bank and Subsidiary Companies
Credit risk (continued)
(xii) Analysis of the Bank's investments in debt instruments
The table below shows analysis of debt securities into the different classifications:
Group
Dec-2014
In thousands of Nigerian Naira
Financial assets held
for trading
Investment
securities
Assets pledged
as collateral Total
Federal government bonds 60,413 8,257,110 - 8,317,523
State government bonds - 4,632,153 - 4,632,153
Corporate bonds - 7,255,924 - 7,255,924
Treasury bills 9,355,506 356,066,635 39,179,198 404,601,339
9,415,919 376,211,822 39,179,198 424,806,939
The Group’s investment in risk-free Government securities constitutes 99% of debt instruments portfolio
(December 2013: 99%). Investment in corporate bond accounts for the outstanding 1% (December 2013: 1%).
Group
Dec-2013
In thousands of Nigerian Naira
Financial assets held
for trading
Investment
securities
Assets pledged
as collateral Total
Federal government bonds 5,143,554 15,879,968 - 21,023,522
State government bonds - 6,735,679 - 6,735,679
Corporate bonds - 2,758,568 - 2,758,568
AMCON bonds1- 39,359,346 - 39,359,346
Treasury bills 12,080,113 387,627,235 28,442,629 428,149,977
17,223,667 452,360,796 28,442,629 498,027,092
1 AMCON Bonds are issued by the Asset Management Corporation of Nigeria and are fully guaranteed by the Federal
Government of Nigeria.
147

Notes to the consolidated financial statements
Guaranty Trust Bank and Subsidiary Companies
Parent
Dec-2014
In thousands of Nigerian Naira
Financial assets held
for trading
Investment
securities
Assets pledged
as collateral Total
Federal government bonds 60,413 - - 60,413
State government bonds - 3,000,000 - 3,000,000
Corporate bonds - 7,255,924 - 7,255,924
Treasury bills 5,615,132 308,359,706 39,173,640 353,148,478
5,675,545 318,615,630 39,173,640 363,464,815
The Bank’s investment in risk-free Government securities constitutes 99% of debt instruments portfolio
(December 2013: 99%). Investment in corporate bond accounts for the outstanding 1% (December 2013: 1%).
Parent
Dec-2013
In thousands of Nigerian Naira
Financial assets held
for trading
Investment
securities
Assets pledged
as collateral Total
Federal government bonds 5,143,554 5,207,273 - 10,350,827
State government bonds - 4,802,488 - 4,802,488
Corporate bonds - 2,115,879 - 2,115,879
AMCON bonds1- 39,359,346 - 39,359,346
Treasury bills 8,603,128 352,204,680 28,440,947 389,248,755
13,746,682 403,689,666 28,440,947 445,877,295
1 AMCON Bonds are issued by the Asset Management Corporation of Nigeria and are fully guaranteed by the Federal
Government of Nigeria.
148

Notes to the financial statements Guaranty Trust Bank and Subsidiary Companies
149
(g) Liquidity risk
The Bank’s liquidity risk management process is primarily the responsibility of the Market Risk Management Group within the ERM Division. A brief overview of the bank’s liquidity management processes during the year includes the following:
1. Maintenance of minimum levels of liquid and marketable assets above the regulatory requirement of 30%.
The Bank has also set for itself more stringent in-house limits above this regulatory requirement to which it adheres.
2. Monitoring of its cash flow and balance sheet trends. The Bank also makes forecasts of anticipated deposits
and withdrawals to determine their potential effect on the Bank.
3. Regular measurement & monitoring of its liquidity position/ratios in line with regulatory requirements and in-house limits.
4. Regular monitoring of non-earning assets.
5. Monitoring of deposit concentration.
6. Ensure diversification of funding sources.
7. Monitoring of level of undrawn commitments.
8. Maintaining a contingency funding plan.
(i) Funding approach The Bank’s overall approach to funding is as follows:
1. Generation of large pool of low cost deposits. 2. Maintenance of efficiently diversified sources of funds along product lines, business segments and also
regions to avoid concentration risk
The bank was able to meet all its financial commitments and obligations without any liquidity risk exposure during the financial year ended December 2014. The Group’s Asset and Liability Management Committee (ALMAC) is charged with the responsibility of managing the Group’s daily liquidity position. A daily liquidity position is monitored and regular liquidity stress testing is conducted under a variety of scenarios covering both normal and more severe market conditions. All liquidity policies and procedures are subject to review and approval by ALMAC. The Risk Management Group sets limits which are in conformity with the regulatory limits. The limits are monitored regularly and exceptions are reported to ALMAC as appropriate. In addition, gap reports are prepared monthly to measure the maturity mismatches between assets and liabilities. The cumulative gap over total assets is not expected to exceed 20%.

Notes to the financial statements Guaranty Trust Bank and Subsidiary Companies
150
(ii) Exposure to liquidity risk
The key measure used by the Group for managing liquidity risk is the ratio of liquid assets to short term liabilities. For this purpose, liquid assets are considered as including cash and cash equivalents and investment grade debt securities for which there is an active and liquid market. Short term liability includes local currency deposits from banks and customers. A similar calculation is used to measure the Group’s compliance with the liquidity limit established by the Bank’s lead regulator (The Central Bank of Nigeria).
Dec-2014 Dec-2013
At end of period 40.07% 50.31%
Average for the period 43.88% 49.67%
Maximum for the period 49.27% 55.44%
Minimum for the period 39.66% 43.99%
Liquidity ratio which is a measure of liquidity risk is calculated as a ratio of naira liquid assets to local currency
deposits and it is expressed in percentages.
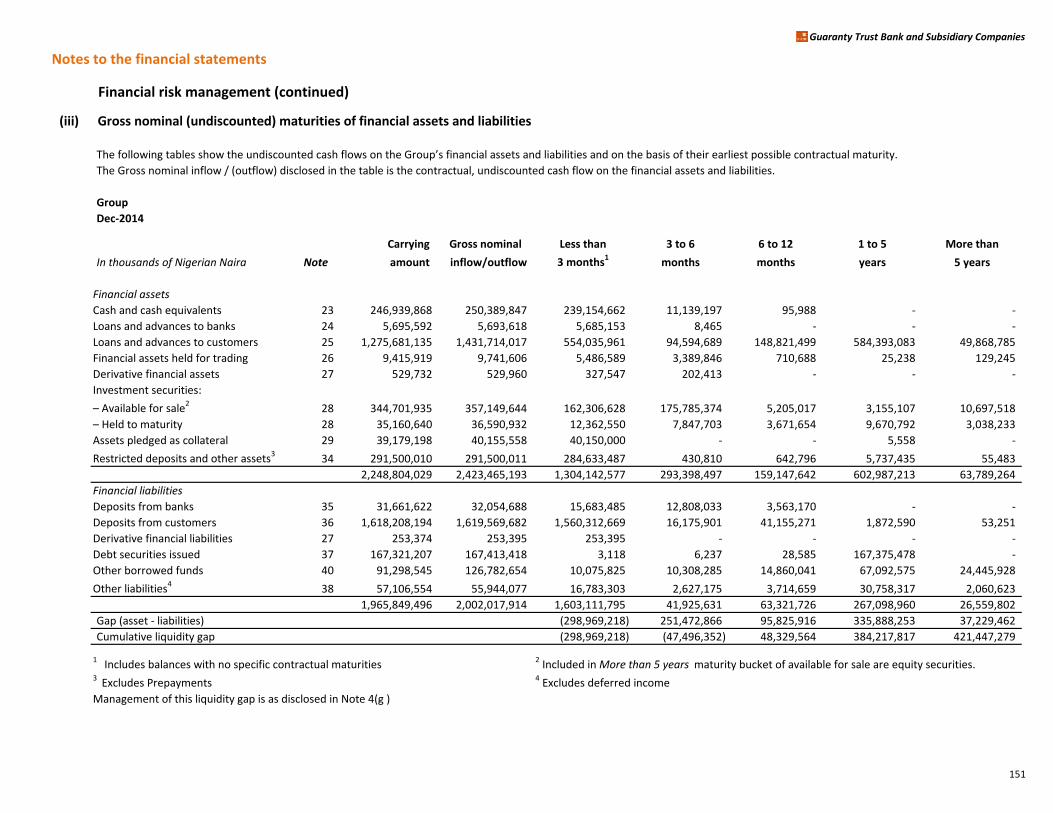
Notes to the financial statements
Guaranty Trust Bank and Subsidiary Companies
Financial risk management (continued)
(iii) Gross nominal (undiscounted) maturities of financial assets and liabilities
The following tables show the undiscounted cash flows on the Group’s financial assets and liabilities and on the basis of their earliest possible contractual maturity.
The Gross nominal inflow / (outflow) disclosed in the table is the contractual, undiscounted cash flow on the financial assets and liabilities.
Group
Dec-2014
Carrying Gross nominal Less than 3 to 6 6 to 12 1 to 5 More than
In thousands of Nigerian Naira Note amount inflow/outflow 3 months1months months years 5 years
Financial assets
Cash and cash equivalents 23 246,939,868 250,389,847 239,154,662 11,139,197 95,988 - -
Loans and advances to banks 24 5,695,592 5,693,618 5,685,153 8,465 - - -
Loans and advances to customers 25 1,275,681,135 1,431,714,017 554,035,961 94,594,689 148,821,499 584,393,083 49,868,785
Financial assets held for trading 26 9,415,919 9,741,606 5,486,589 3,389,846 710,688 25,238 129,245
Derivative financial assets 27 529,732 529,960 327,547 202,413 - - -
Investment securities:
– Available for sale228 344,701,935 357,149,644 162,306,628 175,785,374 5,205,017 3,155,107 10,697,518
– Held to maturity 28 35,160,640 36,590,932 12,362,550 7,847,703 3,671,654 9,670,792 3,038,233
Assets pledged as collateral 29 39,179,198 40,155,558 40,150,000 - - 5,558 -
Restricted deposits and other assets3 34 291,500,010 291,500,011 284,633,487 430,810 642,796 5,737,435 55,483
2,248,804,029 2,423,465,193 1,304,142,577 293,398,497 159,147,642 602,987,213 63,789,264
Financial liabilities
Deposits from banks 35 31,661,622 32,054,688 15,683,485 12,808,033 3,563,170 - -
Deposits from customers 36 1,618,208,194 1,619,569,682 1,560,312,669 16,175,901 41,155,271 1,872,590 53,251
Derivative financial liabilities 27 253,374 253,395 253,395 - - - -
Debt securities issued 37 167,321,207 167,413,418 3,118 6,237 28,585 167,375,478 -
Other borrowed funds 40 91,298,545 126,782,654 10,075,825 10,308,285 14,860,041 67,092,575 24,445,928
Other liabilities438 57,106,554 55,944,077 16,783,303 2,627,175 3,714,659 30,758,317 2,060,623
1,965,849,496 2,002,017,914 1,603,111,795 41,925,631 63,321,726 267,098,960 26,559,802
Gap (asset - liabilities) (298,969,218) 251,472,866 95,825,916 335,888,253 37,229,462
Cumulative liquidity gap (298,969,218) (47,496,352) 48,329,564 384,217,817 421,447,279
1 Includes balances with no specific contractual maturities 2 Included in More than 5 years maturity bucket of available for sale are equity securities.3 Excludes Prepayments 4 Excludes deferred income
Management of this liquidity gap is as disclosed in Note 4(g )
151
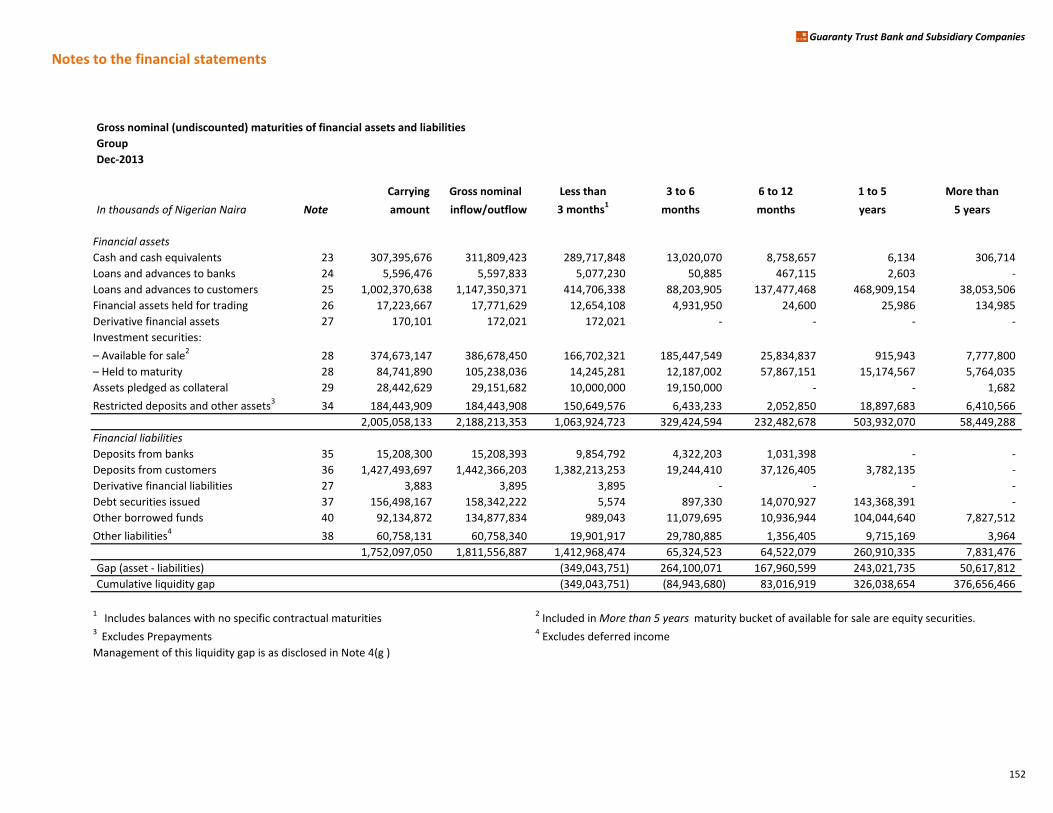
Notes to the financial statements
Guaranty Trust Bank and Subsidiary Companies
Gross nominal (undiscounted) maturities of financial assets and liabilities
Group
Dec-2013
Carrying Gross nominal Less than 3 to 6 6 to 12 1 to 5 More than
In thousands of Nigerian Naira Note amount inflow/outflow 3 months1months months years 5 years
Financial assets
Cash and cash equivalents 23 307,395,676 311,809,423 289,717,848 13,020,070 8,758,657 6,134 306,714
Loans and advances to banks 24 5,596,476 5,597,833 5,077,230 50,885 467,115 2,603 -
Loans and advances to customers 25 1,002,370,638 1,147,350,371 414,706,338 88,203,905 137,477,468 468,909,154 38,053,506
Financial assets held for trading 26 17,223,667 17,771,629 12,654,108 4,931,950 24,600 25,986 134,985
Derivative financial assets 27 170,101 172,021 172,021 - - - -
Investment securities:
– Available for sale2
28 374,673,147 386,678,450 166,702,321 185,447,549 25,834,837 915,943 7,777,800
– Held to maturity 28 84,741,890 105,238,036 14,245,281 12,187,002 57,867,151 15,174,567 5,764,035
Assets pledged as collateral 29 28,442,629 29,151,682 10,000,000 19,150,000 - - 1,682
Restricted deposits and other assets3 34 184,443,909 184,443,908 150,649,576 6,433,233 2,052,850 18,897,683 6,410,566
2,005,058,133 2,188,213,353 1,063,924,723 329,424,594 232,482,678 503,932,070 58,449,288
Financial liabilities
Deposits from banks 35 15,208,300 15,208,393 9,854,792 4,322,203 1,031,398 - -
Deposits from customers 36 1,427,493,697 1,442,366,203 1,382,213,253 19,244,410 37,126,405 3,782,135 -
Derivative financial liabilities 27 3,883 3,895 3,895 - - - -
Debt securities issued 37 156,498,167 158,342,222 5,574 897,330 14,070,927 143,368,391 -
Other borrowed funds 40 92,134,872 134,877,834 989,043 11,079,695 10,936,944 104,044,640 7,827,512
Other liabilities438 60,758,131 60,758,340 19,901,917 29,780,885 1,356,405 9,715,169 3,964
1,752,097,050 1,811,556,887 1,412,968,474 65,324,523 64,522,079 260,910,335 7,831,476
Gap (asset - liabilities) (349,043,751) 264,100,071 167,960,599 243,021,735 50,617,812
Cumulative liquidity gap (349,043,751) (84,943,680) 83,016,919 326,038,654 376,656,466
1 Includes balances with no specific contractual maturities 2 Included in More than 5 years maturity bucket of available for sale are equity securities.3 Excludes Prepayments 4 Excludes deferred income
Management of this liquidity gap is as disclosed in Note 4(g )
152
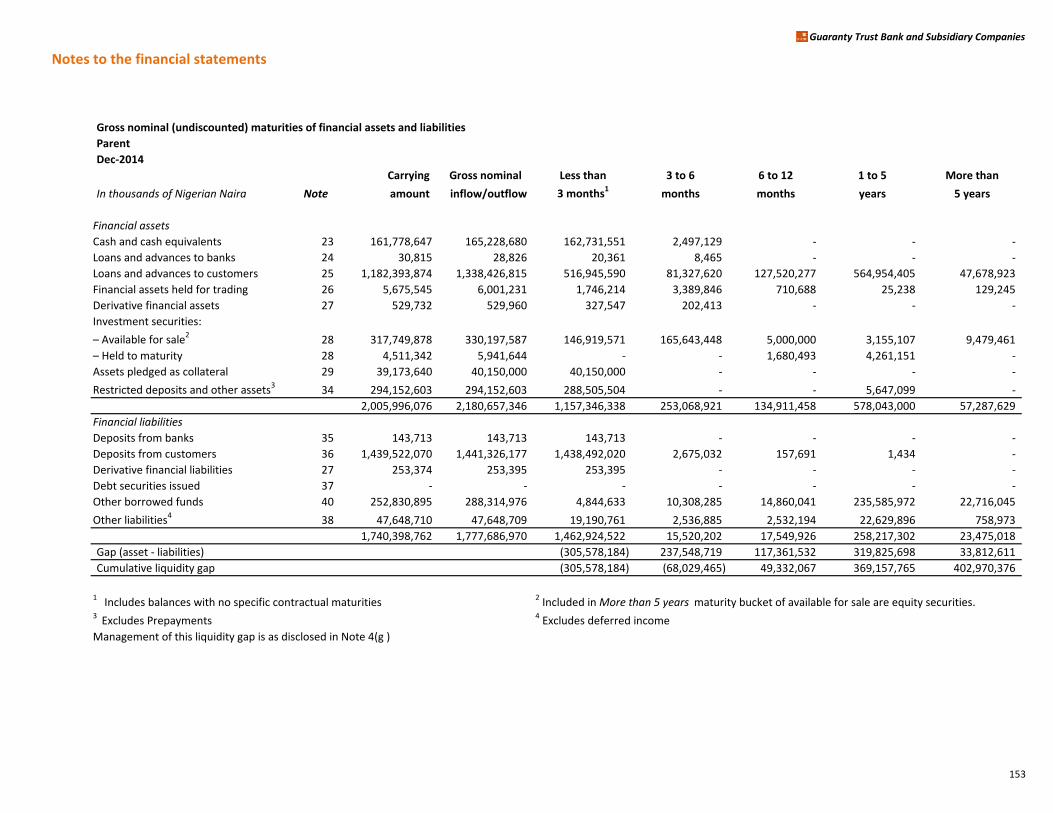
Notes to the financial statements
Guaranty Trust Bank and Subsidiary Companies
Gross nominal (undiscounted) maturities of financial assets and liabilities
Parent
Dec-2014
Carrying Gross nominal Less than 3 to 6 6 to 12 1 to 5 More than
In thousands of Nigerian Naira Note amount inflow/outflow 3 months1months months years 5 years
Financial assets
Cash and cash equivalents 23 161,778,647 165,228,680 162,731,551 2,497,129 - - -
Loans and advances to banks 24 30,815 28,826 20,361 8,465 - - -
Loans and advances to customers 25 1,182,393,874 1,338,426,815 516,945,590 81,327,620 127,520,277 564,954,405 47,678,923
Financial assets held for trading 26 5,675,545 6,001,231 1,746,214 3,389,846 710,688 25,238 129,245
Derivative financial assets 27 529,732 529,960 327,547 202,413 - - -
Investment securities:
– Available for sale2
28 317,749,878 330,197,587 146,919,571 165,643,448 5,000,000 3,155,107 9,479,461
– Held to maturity 28 4,511,342 5,941,644 - - 1,680,493 4,261,151 -
Assets pledged as collateral 29 39,173,640 40,150,000 40,150,000 - - - -
Restricted deposits and other assets3 34 294,152,603 294,152,603 288,505,504 - - 5,647,099 -
2,005,996,076 2,180,657,346 1,157,346,338 253,068,921 134,911,458 578,043,000 57,287,629
Financial liabilities
Deposits from banks 35 143,713 143,713 143,713 - - - -
Deposits from customers 36 1,439,522,070 1,441,326,177 1,438,492,020 2,675,032 157,691 1,434 -
Derivative financial liabilities 27 253,374 253,395 253,395 - - - -
Debt securities issued 37 - - - - - - -
Other borrowed funds 40 252,830,895 288,314,976 4,844,633 10,308,285 14,860,041 235,585,972 22,716,045
Other liabilities438 47,648,710 47,648,709 19,190,761 2,536,885 2,532,194 22,629,896 758,973
1,740,398,762 1,777,686,970 1,462,924,522 15,520,202 17,549,926 258,217,302 23,475,018
Gap (asset - liabilities) (305,578,184) 237,548,719 117,361,532 319,825,698 33,812,611
Cumulative liquidity gap (305,578,184) (68,029,465) 49,332,067 369,157,765 402,970,376
1 Includes balances with no specific contractual maturities 2 Included in More than 5 years maturity bucket of available for sale are equity securities.3 Excludes Prepayments 4 Excludes deferred income
Management of this liquidity gap is as disclosed in Note 4(g )
153
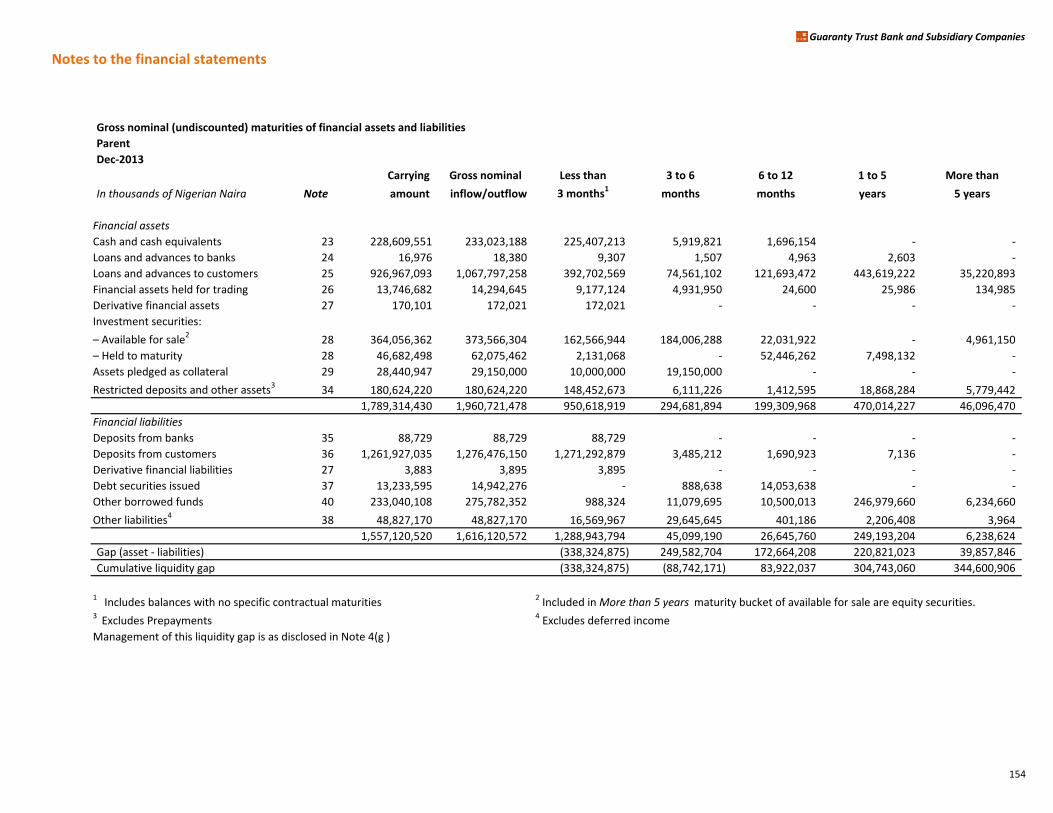
Notes to the financial statements
Guaranty Trust Bank and Subsidiary Companies
Gross nominal (undiscounted) maturities of financial assets and liabilities
Parent
Dec-2013
Carrying Gross nominal Less than 3 to 6 6 to 12 1 to 5 More than
In thousands of Nigerian Naira Note amount inflow/outflow 3 months1months months years 5 years
Financial assets
Cash and cash equivalents 23 228,609,551 233,023,188 225,407,213 5,919,821 1,696,154 - -
Loans and advances to banks 24 16,976 18,380 9,307 1,507 4,963 2,603 -
Loans and advances to customers 25 926,967,093 1,067,797,258 392,702,569 74,561,102 121,693,472 443,619,222 35,220,893
Financial assets held for trading 26 13,746,682 14,294,645 9,177,124 4,931,950 24,600 25,986 134,985
Derivative financial assets 27 170,101 172,021 172,021 - - - -
Investment securities:
– Available for sale2
28 364,056,362 373,566,304 162,566,944 184,006,288 22,031,922 - 4,961,150
– Held to maturity 28 46,682,498 62,075,462 2,131,068 - 52,446,262 7,498,132 -
Assets pledged as collateral 29 28,440,947 29,150,000 10,000,000 19,150,000 - - -
Restricted deposits and other assets3 34 180,624,220 180,624,220 148,452,673 6,111,226 1,412,595 18,868,284 5,779,442
1,789,314,430 1,960,721,478 950,618,919 294,681,894 199,309,968 470,014,227 46,096,470
Financial liabilities
Deposits from banks 35 88,729 88,729 88,729 - - - -
Deposits from customers 36 1,261,927,035 1,276,476,150 1,271,292,879 3,485,212 1,690,923 7,136 -
Derivative financial liabilities 27 3,883 3,895 3,895 - - - -
Debt securities issued 37 13,233,595 14,942,276 - 888,638 14,053,638 - -
Other borrowed funds 40 233,040,108 275,782,352 988,324 11,079,695 10,500,013 246,979,660 6,234,660
Other liabilities438 48,827,170 48,827,170 16,569,967 29,645,645 401,186 2,206,408 3,964
1,557,120,520 1,616,120,572 1,288,943,794 45,099,190 26,645,760 249,193,204 6,238,624
Gap (asset - liabilities) (338,324,875) 249,582,704 172,664,208 220,821,023 39,857,846
Cumulative liquidity gap (338,324,875) (88,742,171) 83,922,037 304,743,060 344,600,906
1 Includes balances with no specific contractual maturities 2 Included in More than 5 years maturity bucket of available for sale are equity securities.3 Excludes Prepayments 4 Excludes deferred income
Management of this liquidity gap is as disclosed in Note 4(g )
154
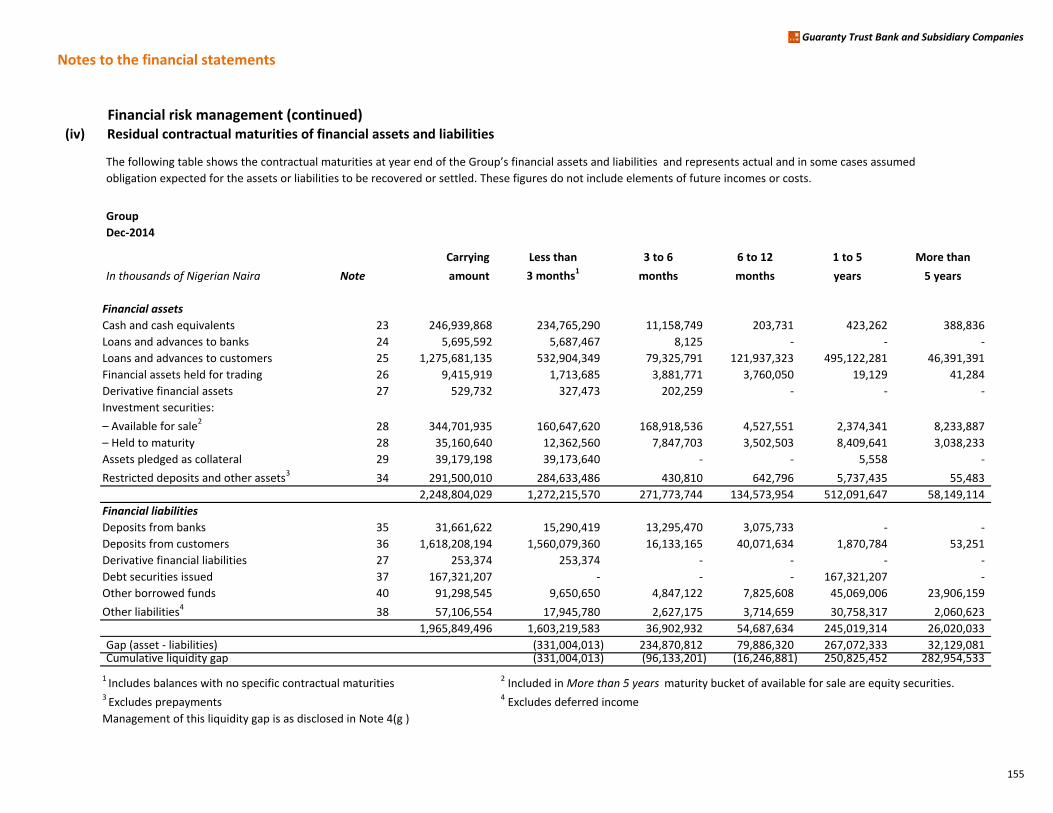
Notes to the financial statements
Guaranty Trust Bank and Subsidiary Companies
Financial risk management (continued)(iv) Residual contractual maturities of financial assets and liabilities
The following table shows the contractual maturities at year end of the Group’s financial assets and liabilities and represents actual and in some cases assumed
obligation expected for the assets or liabilities to be recovered or settled. These figures do not include elements of future incomes or costs.
Group
Dec-2014
Carrying Less than 3 to 6 6 to 12 1 to 5 More than
In thousands of Nigerian Naira Note amount 3 months1
months months years 5 years
Financial assets
Cash and cash equivalents 23 246,939,868 234,765,290 11,158,749 203,731 423,262 388,836
Loans and advances to banks 24 5,695,592 5,687,467 8,125 - - -
Loans and advances to customers 25 1,275,681,135 532,904,349 79,325,791 121,937,323 495,122,281 46,391,391
Financial assets held for trading 26 9,415,919 1,713,685 3,881,771 3,760,050 19,129 41,284
Derivative financial assets 27 529,732 327,473 202,259 - - -
Investment securities:
– Available for sale2
28 344,701,935 160,647,620 168,918,536 4,527,551 2,374,341 8,233,887
– Held to maturity 28 35,160,640 12,362,560 7,847,703 3,502,503 8,409,641 3,038,233
Assets pledged as collateral 29 39,179,198 39,173,640 - - 5,558 -
Restricted deposits and other assets334 291,500,010 284,633,486 430,810 642,796 5,737,435 55,483
2,248,804,029 1,272,215,570 271,773,744 134,573,954 512,091,647 58,149,114
Financial liabilities
Deposits from banks 35 31,661,622 15,290,419 13,295,470 3,075,733 - -
Deposits from customers 36 1,618,208,194 1,560,079,360 16,133,165 40,071,634 1,870,784 53,251
Derivative financial liabilities 27 253,374 253,374 - - - -
Debt securities issued 37 167,321,207 - - - 167,321,207 -
Other borrowed funds 40 91,298,545 9,650,650 4,847,122 7,825,608 45,069,006 23,906,159
Other liabilities4
38 57,106,554 17,945,780 2,627,175 3,714,659 30,758,317 2,060,623
1,965,849,496 1,603,219,583 36,902,932 54,687,634 245,019,314 26,020,033
Gap (asset - liabilities) (331,004,013) 234,870,812 79,886,320 267,072,333 32,129,081 Cumulative liquidity gap (331,004,013) (96,133,201) (16,246,881) 250,825,452 282,954,533
1 Includes balances with no specific contractual maturities
2 Included in More than 5 years maturity bucket of available for sale are equity securities.
3 Excludes prepayments
4 Excludes deferred income
Management of this liquidity gap is as disclosed in Note 4(g )
155
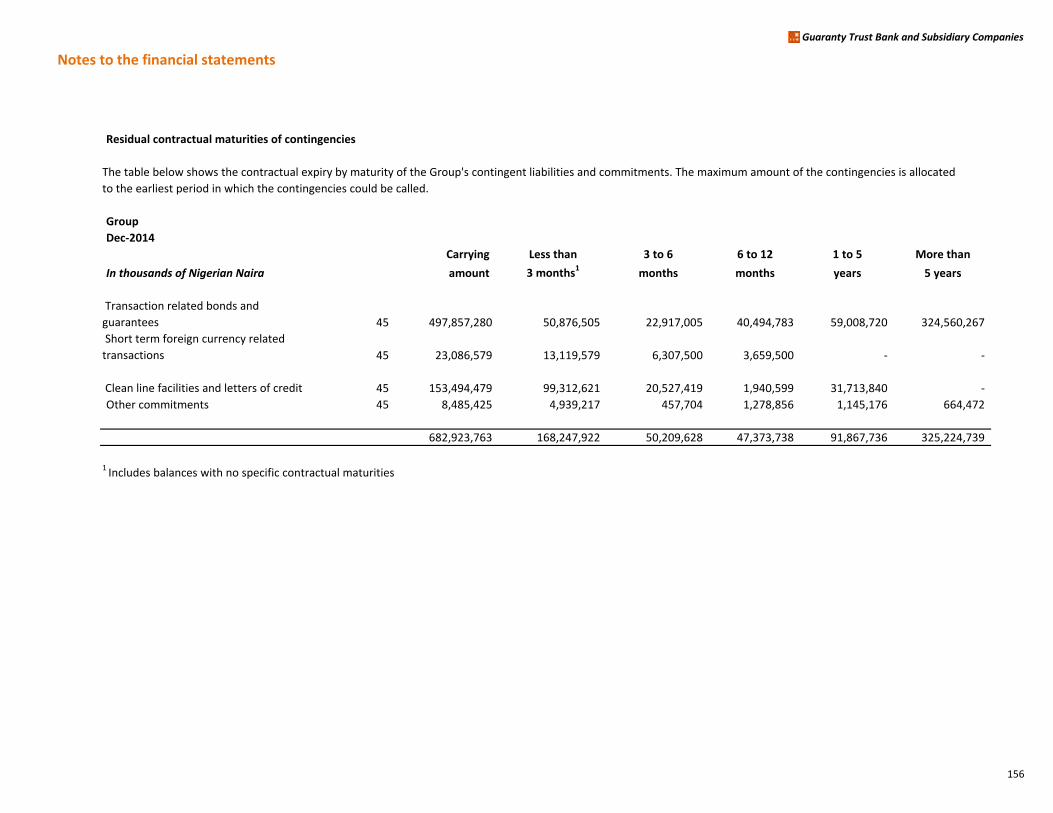
Notes to the financial statements
Guaranty Trust Bank and Subsidiary Companies
Residual contractual maturities of contingencies
The table below shows the contractual expiry by maturity of the Group's contingent liabilities and commitments. The maximum amount of the contingencies is allocated
to the earliest period in which the contingencies could be called.
Group
Dec-2014
Carrying Less than 3 to 6 6 to 12 1 to 5 More than
In thousands of Nigerian Naira amount 3 months1months months years 5 years
Transaction related bonds and
guarantees 45 497,857,280 50,876,505 22,917,005 40,494,783 59,008,720 324,560,267
Short term foreign currency related
transactions 45 23,086,579 13,119,579 6,307,500 3,659,500 - -
Clean line facilities and letters of credit 45 153,494,479 99,312,621 20,527,419 1,940,599 31,713,840 -
Other commitments 45 8,485,425 4,939,217 457,704 1,278,856 1,145,176 664,472
682,923,763 168,247,922 50,209,628 47,373,738 91,867,736 325,224,739
1 Includes balances with no specific contractual maturities
156
Notes to the financial statements
Guaranty Trust Bank and Subsidiary Companies
Residual contractual maturities of financial assets and liabilities
Group
Dec-2013
Carrying Less than 3 to 6 6 to 12 1 to 5 More than
In thousands of Nigerian Naira Note amount 3 months1months months years 5 years
Financial assets
Cash and cash equivalents 23 307,395,676 287,152,129 11,410,570 8,520,129 6,134 306,714
Loans and advances to banks 24 5,596,476 5,076,820 50,628 466,528 2,500 -
Loans and advances to customers 25 1,002,370,638 393,353,291 75,102,163 110,010,379 389,641,946 34,262,859
Financial assets held for trading 26 17,223,667 8,923,311 5,317,092 2,919,671 19,267 44,326
Derivative financial assets 27 170,101 170,101 - - - -
Investment securities:
– Available for sale228 374,673,147 164,207,494 178,162,155 23,614,897 42,673 8,645,928
– Held to maturity 28 84,741,890 14,058,383 12,026,838 44,558,792 10,397,702 3,700,175
Assets pledged as collateral 29 28,442,629 9,944,110 18,496,837 - - 1,682
Restricted deposits and other assets334 184,443,909 150,649,577 6,433,233 2,052,850 18,897,683 6,410,566
2,005,058,133 1,033,535,216 306,999,516 192,143,246 419,007,905 53,372,250
Financial liabilities
Deposits from banks 35 15,208,300 9,854,698 4,876,773 476,829 - -
Deposits from customers 36 1,427,493,697 1,367,487,360 19,126,749 37,101,602 3,777,986 -
Derivative financial liabilities 27 3,883 3,883 - - - -
Debt securities issued 37 156,498,167 - 68,595 13,165,000 143,264,572 -
Other borrowed funds 40 92,134,872 984,059 6,567,045 4,774,451 78,216,465 1,592,852
Other liabilities438 60,758,131 19,901,708 29,780,885 1,356,405 9,715,169 3,964
1,752,097,050 1,398,231,708 60,420,047 56,874,287 234,974,192 1,596,816
Gap (asset - liabilities) (364,696,492) 246,579,469 135,268,959 184,033,713 51,775,434
Cumulative liquidity gap (364,696,492) (118,117,023) 17,151,936 201,185,649 252,961,083
1 Includes balances with no specific contractual maturities 2 Included in More than 5 years maturity bucket of available for sale are equity securities.3
Excludes prepayments4 Excludes deferred income
Management of this liquidity gap is as disclosed in Note 4(g )
157
Notes to the financial statements
Guaranty Trust Bank and Subsidiary Companies
Residual contractual maturities of contingencies
The table below shows the contractual expiry by maturity of the Group's contingent liabilities and commitments. The maximum amount of the contingencies is allocated
to the earliest period in which the contingencies could be called.
Group
Dec-2013
Carrying Less than 3 to 6 6 to 12 1 to 5 More than
In thousands of Nigerian Naira amount 3 months1months months years 5 years
Transaction related bonds and
guarantees 45 438,406,221 35,945,448 23,787,669 55,048,183 49,486,581 274,138,340
Short term foreign currency related
transactions 45 28,169,581 27,469,212 700,369 - - -
Clean line facilities and letters of credit 45 91,820,634 42,757,380 17,499,394 1,171,128 30,392,732 -
Other commitments 45 8,727,345 3,897,905 3,057,894 527,862 787,024 456,660
567,123,781 110,069,945 45,045,326 56,747,173 80,666,337 274,595,000
1 Includes balances with no specific contractual maturities
158
Notes to the financial statements
Guaranty Trust Bank and Subsidiary Companies
Residual contractual maturities of financial assets and liabilities
obligation expected for the assets or liabilities to be recovered or settled. These figures do not include elements of future incomes or costs.
Parent
Dec-2014
Carrying Less than 3 to 6 6 to 12 1 to 5 More than
In thousands of Nigerian Naira Note amount 3 months1
months months years 5 years
Financial assets
Cash and cash equivalents 23 161,778,647 159,323,888 2,454,759 - - -
Loans and advances to banks 24 30,815 22,690 8,125 - - -
Loans and advances to customers 25 1,182,393,874 495,440,463 65,555,647 99,313,431 477,882,804 44,201,529
Financial assets held for trading 26 5,675,545 1,713,686 3,258,724 642,722 19,129 41,284
Derivative financial assets 27 529,732 327,473 202,259 - - -
Investment securities:
– Available for sale228 317,749,878 145,260,563 158,776,610 4,322,534 2,374,341 7,015,830
– Held to maturity 28 4,511,342 - - 1,511,342 3,000,000 -
Assets pledged as collateral 29 39,173,640 39,173,640 - - - -
Restricted deposits and other assets3
34 294,152,603 288,505,504 - - 5,647,099 -
2,005,996,076 1,129,767,907 230,256,124 105,790,029 488,923,373 51,258,643
Financial liabilities
Deposits from banks 35 143,713 143,713 - - - -
Deposits from customers 36 1,439,522,070 1,436,778,090 2,589,568 153,120 1,292 -
Derivative financial liabilities 27 253,374 253,374 - - - -
Debt securities issued 37 - - - - - -
Other borrowed funds 40 252,830,895 4,419,486 4,847,122 7,825,608 213,562,403 22,176,276
Other liabilities4
38 47,648,710 19,190,762 2,536,885 2,532,194 22,629,896 758,973
1,740,398,762 1,460,785,425 9,973,575 10,510,922 236,193,591 22,935,249
Gap (asset - liabilities) (331,017,518) 220,282,549 95,279,107 252,729,782 28,323,394
Cumulative liquidity gap (331,017,518) (110,734,969) (15,455,862) 237,273,920 265,597,314
1 Includes balances with no specific contractual maturities 2 Included in More than 5 years maturity bucket of available for sale are equity securities.3 Excludes prepayments 4 Excludes deferred income
Management of this liquidity gap is as disclosed in Note 4(g )
The following table shows the contractual maturities at year end of the Bank’s financial assets and liabilities and represents actual and in some cases assumed
159

Notes to the financial statements
Guaranty Trust Bank and Subsidiary Companies
Residual contractual maturities of contingencies
The table below shows the contractual expiry by maturity of the Bank's contingent liabilities and commitments. The maximum amount of the contingencies is allocated
to the earliest period in which the contingencies could be called.
Parent
Dec-2014
Carrying Less than 3 to 6 6 to 12 1 to 5 More than
In thousands of Nigerian Naira amount 3 months1months months years 5 years
Transaction related bonds and
guarantees 45 483,566,238 42,045,909 21,758,181 36,272,765 58,929,116 324,560,267
Short term foreign currency related
transactions 45 20,103,363 10,136,363 6,307,500 3,659,500 - -
Clean line facilities and letters of credit 45 145,470,036 96,198,633 17,212,640 475,088 31,583,675 -
649,139,637 148,380,905 45,278,321 40,407,353 90,512,791 324,560,267
1 Includes balances with no specific contractual maturities
160
Notes to the financial statements
Guaranty Trust Bank and Subsidiary Companies
Residual contractual maturities of financial assets and liabilities
Parent
Dec-2013
Carrying Less than 3 to 6 6 to 12 1 to 5 More than
In thousands of Nigerian Naira Note amount 3 months1months months years 5 years
Financial assets
Cash and cash equivalents 23 228,609,551 222,841,603 4,310,321 1,457,627 - -
Loans and advances to banks 24 16,976 8,850 1,250 4,376 2,500 -
Loans and advances to customers 25 926,967,093 374,873,788 61,031,154 93,779,786 365,809,717 31,472,648
Financial assets held for trading 26 13,746,682 8,923,310 4,737,919 21,860 19,267 44,326
Derivative financial assets 27 170,101 170,101 - - - -
Investment securities:
– Available for sale228 364,056,362 160,176,479 176,801,838 20,028,851 - 7,049,194
– Held to maturity 28 46,682,498 2,102,574 - 39,461,752 5,118,172 -
Assets pledged as collateral 29 28,440,947 9,944,110 18,496,837 - - -
Restricted deposits and other assets3
34 180,624,220 148,452,673 6,111,226 1,412,595 18,868,284 5,779,442
1,789,314,430 927,493,488 271,490,545 156,166,847 389,817,940 44,345,610
Financial liabilities
Deposits from banks 35 88,729 88,729 - - - -
Deposits from customers 36 1,261,927,035 1,256,834,971 3,397,584 1,688,171 6,309 -
Derivative financial liabilities 27 3,883 3,883 - - - -
Debt securities issued 37 13,233,595 - 68,595 13,165,000 - -
Other borrowed funds 40 233,040,108 984,058 6,567,045 4,337,520 221,151,485 -
Other liabilities438 48,827,170 16,569,967 29,645,645 401,186 2,206,408 3,964
1,557,120,520 1,274,481,608 39,678,869 19,591,877 223,364,202 3,964
Gap (asset - liabilities) (346,988,120) 231,811,676 136,574,970 166,453,738 44,341,646
Cumulative liquidity gap (346,988,120) (115,176,444) 21,398,526 187,852,264 232,193,910
1 Includes balances with no specific contractual maturities 2 Included in More than 5 years maturity bucket of available for sale are equity securities.3 Excludes prepayments 4 Excludes deferred income
Management of this liquidity gap is as disclosed in Note 4(g )
161

Notes to the financial statements
Guaranty Trust Bank and Subsidiary Companies
Residual contractual maturities of contingencies
The table below shows the contractual expiry by maturity of the Bank's contingent liabilities and commitments. The maximum amount of the contingencies is allocated
to the earliest period in which the contingencies could be called.
Parent
Dec-2013
Carrying Less than 3 to 6 6 to 12 1 to 5 More than
In thousands of Nigerian Naira amount 3 months1months months years 5 years
Transaction related bonds and
guarantees 45 431,691,415 34,123,411 22,384,301 51,749,377 49,377,487 274,056,839
Short term foreign currency related
transactions 45 27,469,212 27,469,212 - - - -
Clean line facilities and letters of credit 45 77,388,975 32,158,735 14,505,589 598,040 30,126,611 -
536,549,602 93,751,358 36,889,890 52,347,417 79,504,098 274,056,839
1 Includes balances with no specific contractual maturities
162
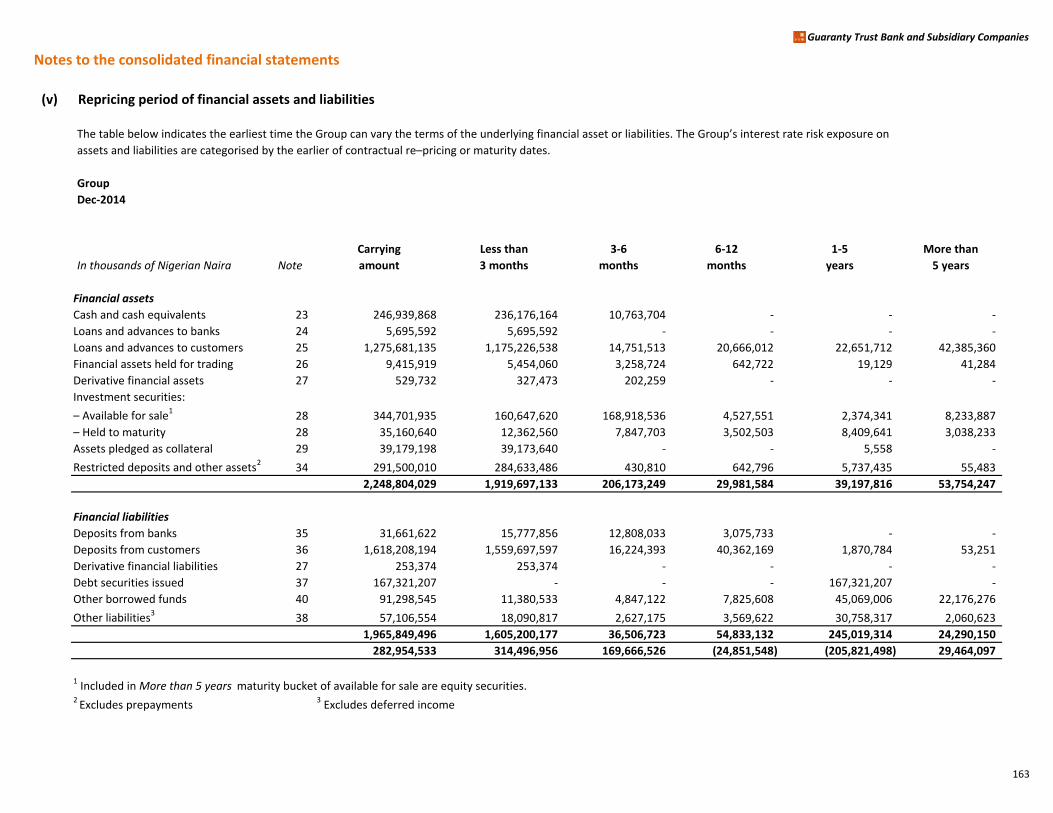
Notes to the consolidated financial statements
Guaranty Trust Bank and Subsidiary Companies
(v) Repricing period of financial assets and liabilities
The table below indicates the earliest time the Group can vary the terms of the underlying financial asset or liabilities. The Group’s interest rate risk exposure on
assets and liabilities are categorised by the earlier of contractual re–pricing or maturity dates.
Group
Dec-2014
Carrying Less than 3-6 6-12 1-5 More than
In thousands of Nigerian Naira Note amount 3 months months months years 5 years
Financial assets
Cash and cash equivalents 23 246,939,868 236,176,164 10,763,704 - - -
Loans and advances to banks 24 5,695,592 5,695,592 - - - -
Loans and advances to customers 25 1,275,681,135 1,175,226,538 14,751,513 20,666,012 22,651,712 42,385,360
Financial assets held for trading 26 9,415,919 5,454,060 3,258,724 642,722 19,129 41,284
Derivative financial assets 27 529,732 327,473 202,259 - - -
Investment securities:
– Available for sale128 344,701,935 160,647,620 168,918,536 4,527,551 2,374,341 8,233,887
– Held to maturity 28 35,160,640 12,362,560 7,847,703 3,502,503 8,409,641 3,038,233
Assets pledged as collateral 29 39,179,198 39,173,640 - - 5,558 -
Restricted deposits and other assets2 34 291,500,010 284,633,486 430,810 642,796 5,737,435 55,483
2,248,804,029 1,919,697,133 206,173,249 29,981,584 39,197,816 53,754,247
Financial liabilities
Deposits from banks 35 31,661,622 15,777,856 12,808,033 3,075,733 - -
Deposits from customers 36 1,618,208,194 1,559,697,597 16,224,393 40,362,169 1,870,784 53,251
Derivative financial liabilities 27 253,374 253,374 - - - -
Debt securities issued 37 167,321,207 - - - 167,321,207 -
Other borrowed funds 40 91,298,545 11,380,533 4,847,122 7,825,608 45,069,006 22,176,276
Other liabilities3
38 57,106,554 18,090,817 2,627,175 3,569,622 30,758,317 2,060,623
1,965,849,496 1,605,200,177 36,506,723 54,833,132 245,019,314 24,290,150
282,954,533 314,496,956 169,666,526 (24,851,548) (205,821,498) 29,464,097
1 Included in More than 5 years maturity bucket of available for sale are equity securities.2
Excludes prepayments3 Excludes deferred income
163

Notes to the consolidated financial statements
Guaranty Trust Bank and Subsidiary Companies
Repricing period of financial assets and liabilities
The table below indicates the earliest time the Group can vary the terms of the underlying financial asset or liabilities. The Group’s interest rate risk exposure on
assets and liabilities are categorised by the earlier of contractual re–pricing or maturity dates.
Group
Dec-2013
Carrying Less than 3-6 6-12 1-5 More than
In thousands of Nigerian Naira Note amount 3 months months months years 5 years
Financial assets
Cash and cash equivalents 23 307,395,676 287,152,129 11,410,570 8,520,129 6,134 306,714
Loans and advances to banks 24 5,596,476 5,547,098 49,378 - - -
Loans and advances to customers 25 1,002,370,638 902,713,925 13,807,950 15,319,680 26,685,054 43,844,029
Financial assets held for trading 26 17,223,667 8,923,311 5,317,092 2,919,671 63,593 -
Derivative financial assets 27 170,101 170,101 - - - -
Investment securities: - - - - -
– Available for sale128 374,673,147 164,258,023 178,004,813 23,721,710 42,673 8,645,928
– Held to maturity 28 84,741,890 14,058,383 12,026,838 44,558,792 10,397,702 3,700,175
Assets pledged as collateral 29 28,442,629 9,944,110 18,496,837 - - 1,682
Restricted deposits and other assets2
34 184,443,909 150,649,577 6,433,233 2,052,850 18,897,683 6,410,566
2,005,058,133 1,543,416,657 245,546,711 97,092,832 56,092,839 62,909,094
Financial liabilities
Deposits from banks 35 15,208,300 9,854,699 4,322,203 1,031,398 - -
Deposits from customers 36 1,427,493,697 1,367,487,361 19,126,749 37,101,602 3,777,985 -
Derivative financial liabilities 27 3,883 3,883 - - - -
Debt securities issued 37 156,498,167 - 68,595 13,165,000 143,264,572 -
Other borrowed funds 40 92,134,872 2,576,910 6,567,045 4,774,451 78,216,466 -
Other liabilities338 60,758,131 19,901,708 29,780,885 1,356,405 9,715,169 3,964
1,752,097,050 1,399,824,561 59,865,477 57,428,856 234,974,192 3,964
252,961,083 143,592,096 185,681,234 39,663,976 (178,881,353) 62,905,130
1 Included in More than 5 years maturity bucket of available for sale are equity securities.2
Excludes prepayments3 Excludes deferred income
164
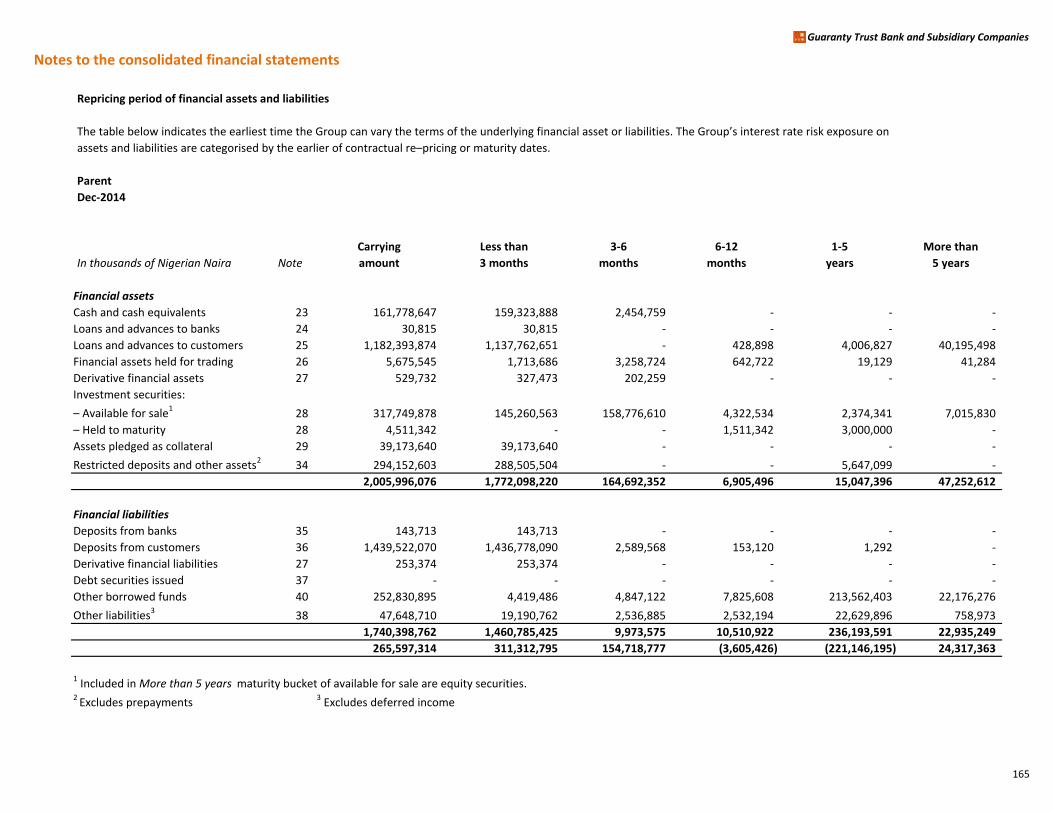
Notes to the consolidated financial statements
Guaranty Trust Bank and Subsidiary Companies
Repricing period of financial assets and liabilities
The table below indicates the earliest time the Group can vary the terms of the underlying financial asset or liabilities. The Group’s interest rate risk exposure on
assets and liabilities are categorised by the earlier of contractual re–pricing or maturity dates.
Parent
Dec-2014
Carrying Less than 3-6 6-12 1-5 More than
In thousands of Nigerian Naira Note amount 3 months months months years 5 years
Financial assets
Cash and cash equivalents 23 161,778,647 159,323,888 2,454,759 - - -
Loans and advances to banks 24 30,815 30,815 - - - -
Loans and advances to customers 25 1,182,393,874 1,137,762,651 - 428,898 4,006,827 40,195,498
Financial assets held for trading 26 5,675,545 1,713,686 3,258,724 642,722 19,129 41,284
Derivative financial assets 27 529,732 327,473 202,259 - - -
Investment securities:
– Available for sale128 317,749,878 145,260,563 158,776,610 4,322,534 2,374,341 7,015,830
– Held to maturity 28 4,511,342 - - 1,511,342 3,000,000 -
Assets pledged as collateral 29 39,173,640 39,173,640 - - - -
Restricted deposits and other assets2
34 294,152,603 288,505,504 - - 5,647,099 -
2,005,996,076 1,772,098,220 164,692,352 6,905,496 15,047,396 47,252,612
Financial liabilities
Deposits from banks 35 143,713 143,713 - - - -
Deposits from customers 36 1,439,522,070 1,436,778,090 2,589,568 153,120 1,292 -
Derivative financial liabilities 27 253,374 253,374 - - - -
Debt securities issued 37 - - - - - -
Other borrowed funds 40 252,830,895 4,419,486 4,847,122 7,825,608 213,562,403 22,176,276
Other liabilities338 47,648,710 19,190,762 2,536,885 2,532,194 22,629,896 758,973
1,740,398,762 1,460,785,425 9,973,575 10,510,922 236,193,591 22,935,249
265,597,314 311,312,795 154,718,777 (3,605,426) (221,146,195) 24,317,363
1 Included in More than 5 years maturity bucket of available for sale are equity securities.2
Excludes prepayments3 Excludes deferred income
165
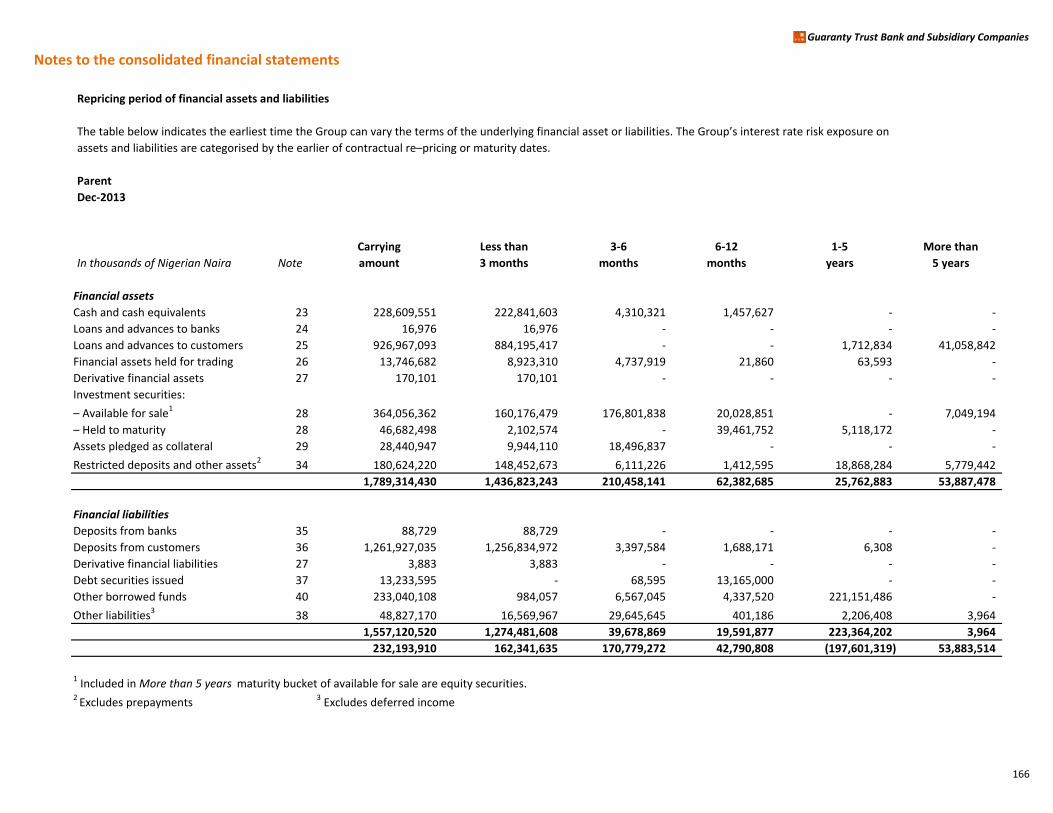
Notes to the consolidated financial statements
Guaranty Trust Bank and Subsidiary Companies
Repricing period of financial assets and liabilities
The table below indicates the earliest time the Group can vary the terms of the underlying financial asset or liabilities. The Group’s interest rate risk exposure on
assets and liabilities are categorised by the earlier of contractual re–pricing or maturity dates.
Parent
Dec-2013
Carrying Less than 3-6 6-12 1-5 More than
In thousands of Nigerian Naira Note amount 3 months months months years 5 years
Financial assets
Cash and cash equivalents 23 228,609,551 222,841,603 4,310,321 1,457,627 - -
Loans and advances to banks 24 16,976 16,976 - - - -
Loans and advances to customers 25 926,967,093 884,195,417 - - 1,712,834 41,058,842
Financial assets held for trading 26 13,746,682 8,923,310 4,737,919 21,860 63,593 -
Derivative financial assets 27 170,101 170,101 - - - -
Investment securities:
– Available for sale128 364,056,362 160,176,479 176,801,838 20,028,851 - 7,049,194
– Held to maturity 28 46,682,498 2,102,574 - 39,461,752 5,118,172 -
Assets pledged as collateral 29 28,440,947 9,944,110 18,496,837 - - -
Restricted deposits and other assets2
34 180,624,220 148,452,673 6,111,226 1,412,595 18,868,284 5,779,442
1,789,314,430 1,436,823,243 210,458,141 62,382,685 25,762,883 53,887,478
Financial liabilities
Deposits from banks 35 88,729 88,729 - - - -
Deposits from customers 36 1,261,927,035 1,256,834,972 3,397,584 1,688,171 6,308 -
Derivative financial liabilities 27 3,883 3,883 - - - -
Debt securities issued 37 13,233,595 - 68,595 13,165,000 - -
Other borrowed funds 40 233,040,108 984,057 6,567,045 4,337,520 221,151,486 -
Other liabilities338 48,827,170 16,569,967 29,645,645 401,186 2,206,408 3,964
1,557,120,520 1,274,481,608 39,678,869 19,591,877 223,364,202 3,964
232,193,910 162,341,635 170,779,272 42,790,808 (197,601,319) 53,883,514
1 Included in More than 5 years maturity bucket of available for sale are equity securities.2
Excludes prepayments3 Excludes deferred income
166
NOTES TO THE FINANCIAL STATEMENT Guaranty Trust Bank and Subsidiary Companies
167
(h) Settlement risk
The Group’s activities may give rise to risk at the time of settlement of transactions and trade. Settlement risk is the risk of loss due to the failure of a company to honour its obligations to deliver cash, securities or other assets as contractually agreed. For certain types of transactions, the Group mitigates this risk by conducting settlements through a settlement clearing agent to ensure that a trade is settled only when both parties have fulfilled their contractual settlement obligations. Settlement limits form part of the credit approval / limit monitoring process described earlier. Acceptance of settlement risk on free settlement trade requires transaction specific or counterparty specific approvals from Group Risk Management Unit.
(i) Market risk
Market risk is the risk that changes in market variables, such as interest rate, equity prices, foreign exchange rates and credit spreads (not relating to changes in the obligor’s / issuer’s credit standing) will affect the Group’s income or the value of its holdings of financial instruments. The objective of market risk management is to manage and control market risk exposures within acceptable parameters, while optimising the return on risk.
(i) Management of market risk The Group separates its exposure to market risk between trading and non-trading portfolios. Trading portfolios are mainly held by the Treasury Group, and include positions arising from market making and proprietary position taking, together with financial assets and liabilities that are managed on a fair value basis. With the exception of translation risk arising on the Group’s net investment in its foreign operations, all foreign exchange risks within the Group are monitored by the Treasury Group. Accordingly, the foreign exchange position is treated as part of the Group’s trading portfolios for risk management purposes. Overall authority for market risk is vested in Market Risk Management Committee. However, the Market Risk Management group within the Enterprise-wide Risk Management Division is responsible for the development of detailed risk management policies (subject to review and approval by the Committee) and for the day-to-day review of their implementation.
(ii) Exposure to market risks – trading portfolios The principal tool used to measure and control market risk exposure within the Group’s trading portfolios is the open position limits using the Earning-at-Risk approach. Specific limits (regulatory and in-house) have been set across the various trading portfolios to prevent undue exposure and the market risk management group ensures that these limits and triggers are adhered to by the bank. The bank traded in the following financial instruments in the course of the period; 1. Treasury Bills 2. Bonds (Spot and Repo transactions) 3. Foreign currencies (Spot, Forwards and Swaps)
4. Money market products
NOTES TO THE FINANCIAL STATEMENT Guaranty Trust Bank and Subsidiary Companies
168
(iii) Exposure to interest rate risk – Trading and non-trading portfolios
The principal risk to which non-trading portfolios are exposed is the risk of loss from fluctuations in the future cash flows or fair values of financial instruments because of a change in market interest rates. Interest rate risk is managed principally through monitoring interest rate gaps and by having pre-approved limits for re-pricing bands. The ALMAC is the monitoring body for compliance with these limits and is assisted by Risk Management in its day-to-day monitoring activities. A summary of the Group’s interest rate gap position on trading and non-trading portfolios is as follows: The Bank makes use of limit monitoring, earnings-at-risk, gap analyses and scenario analyses to measure and control the market risk exposures within its trading and banking books. The bank also performs regular stress tests on its banking and trading books. In performing this, the bank ensures there are quantitative criteria in building the scenarios. The bank determines the effect of changes in interest rates on interest income; volatility in prices on trading income; and changes in funding sources and uses on the bank’s liquidity. During the period, the key potential risks the bank was exposed to from these instruments were foreign exchange risk and interest rate risk and price risk. However, all potential risk exposures in the course of the period were successfully mitigated as mentioned above.

Notes to the financial statements Guaranty Trust Bank and Subsidiary Companies
169
(v) Other market risks: Sensitivity analysis of non-trading portfolios to various scenarios The management of interest rate risk against interest rate gap limits is supplemented with monitoring the sensitivity of the Group’s financial assets and liabilities to various scenarios. Credit spread risk (not relating to changes in the obligor / issuer’s credit standing) on debt securities held by the Group and equity price risk is subject to regular monitoring by Group Management Risk committee, but is not currently significant in relation to the overall results and financial position of the Group. Interest rate movement have both cash flow and fair value effect depending on whether interest rate is fixed or floating. The impact resulting from adverse or favourable movement flows from either retained earnings or OCI and ultimately ends in equity in the following manner:
Retained earnings arising from increase or decrease in net interest income and the fair value changes reported in profit or loss.
Fair value reserves arising from increases or decreases in fair value of available-for-sale financial instruments reported directly in other comprehensive income.
At 31 December, 2014, the group’s interest rate risk arises principally from risk assets and borrowings i.e. (deposit liabilities and long-term borrowings). Borrowings issued at variable rates expose the group to cash flow interest rate risk which is partially offset by cash held at variable rates. Borrowings issued at fixed rates expose the group to fair value interest rate risk. The group therefore analyses its interest rate exposure on a dynamic basis. Various scenarios are simulated taking into consideration refinancing, renewal of existing positions, alternative financing and hedging. Based on these scenarios, the group calculates the impact on profit and loss of a defined interest rate shift. For each simulation, the same interest rate shift is used for all currencies. The scenarios are run only for assets and liabilities that represent the major interest-earning and bearing positions. Major assumptions underlying the sensitivity are as follows:
• 100 basis point changes in floating interest rate on assets and liabilities held at amortized cost; and Assets and liabilities accounted at fair value through profit or loss (December 2013 – 100 basis points) with all other variables held constant, resulted in the impact on profit or loss as set out in the table on page 170.
In arriving at the 100 basis point used for the sensitivity analysis of interest rate, the fluctuation in the interest rate of the Group’s major assets and liabilities were considered as shown below:
The prime lending rate on loans and advances which ranged between 15.88% and 16.95% over the period, a change of about 100 basis points is therefore desirable.
The discount rate on various maturities of treasury bills ranged between 9.75% and 11.92% over the financial period as published by Central Bank of Nigeria (CBN) which represents a variability of about 100 basis points in the observed discount rates for the year.
A 100 basis point proportional change in the cost of fund was also assumed as costs of funds seldom vary beyond 100 basis point.
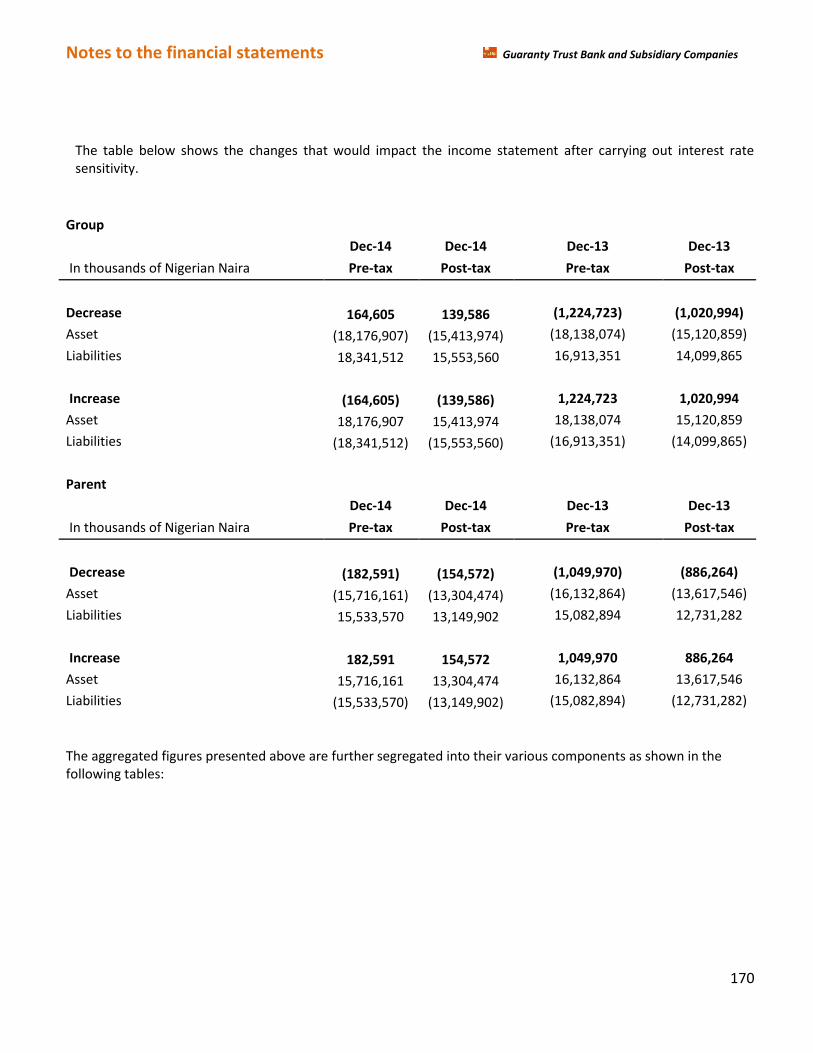
Notes to the financial statements Guaranty Trust Bank and Subsidiary Companies
170
The table below shows the changes that would impact the income statement after carrying out interest rate sensitivity.
Group
Dec-14 Dec-14 Dec-13 Dec-13
In thousands of Nigerian Naira Pre-tax Post-tax Pre-tax Post-tax
Decrease 164,605 139,586 (1,224,723) (1,020,994)
Asset (18,176,907) (15,413,974) (18,138,074) (15,120,859)
Liabilities 18,341,512 15,553,560 16,913,351 14,099,865
Increase (164,605) (139,586) 1,224,723 1,020,994
Asset 18,176,907 15,413,974 18,138,074 15,120,859
Liabilities (18,341,512) (15,553,560) (16,913,351) (14,099,865)
Parent
Dec-14 Dec-14 Dec-13 Dec-13
In thousands of Nigerian Naira Pre-tax Post-tax Pre-tax Post-tax
Decrease (182,591) (154,572) (1,049,970) (886,264)
Asset (15,716,161) (13,304,474) (16,132,864) (13,617,546)
Liabilities 15,533,570 13,149,902 15,082,894 12,731,282
Increase 182,591 154,572 1,049,970 886,264
Asset 15,716,161 13,304,474 16,132,864 13,617,546
Liabilities (15,533,570) (13,149,902) (15,082,894) (12,731,282)
The aggregated figures presented above are further segregated into their various components as shown in the following tables:
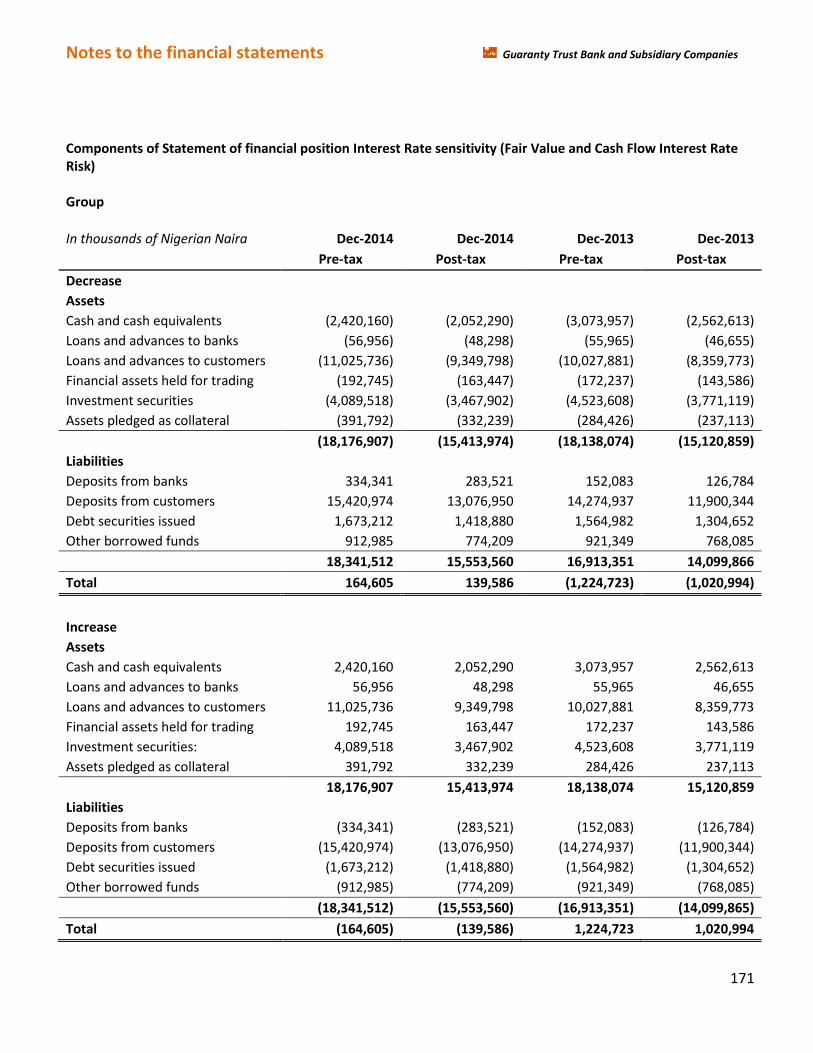
Notes to the financial statements Guaranty Trust Bank and Subsidiary Companies
171
Components of Statement of financial position Interest Rate sensitivity (Fair Value and Cash Flow Interest Rate Risk) Group
In thousands of Nigerian Naira Dec-2014 Dec-2014 Dec-2013 Dec-2013
Pre-tax Post-tax Pre-tax Post-tax
Decrease Assets Cash and cash equivalents (2,420,160) (2,052,290) (3,073,957) (2,562,613)
Loans and advances to banks (56,956) (48,298) (55,965) (46,655)
Loans and advances to customers (11,025,736) (9,349,798) (10,027,881) (8,359,773)
Financial assets held for trading (192,745) (163,447) (172,237) (143,586)
Investment securities (4,089,518) (3,467,902) (4,523,608) (3,771,119)
Assets pledged as collateral (391,792) (332,239) (284,426) (237,113)
(18,176,907) (15,413,974) (18,138,074) (15,120,859)
Liabilities Deposits from banks 334,341 283,521 152,083 126,784
Deposits from customers 15,420,974 13,076,950 14,274,937 11,900,344
Debt securities issued 1,673,212 1,418,880 1,564,982 1,304,652
Other borrowed funds 912,985 774,209 921,349 768,085
18,341,512 15,553,560 16,913,351 14,099,866
Total 164,605 139,586 (1,224,723) (1,020,994)
Increase Assets Cash and cash equivalents 2,420,160 2,052,290 3,073,957 2,562,613
Loans and advances to banks 56,956 48,298 55,965 46,655
Loans and advances to customers 11,025,736 9,349,798 10,027,881 8,359,773
Financial assets held for trading 192,745 163,447 172,237 143,586
Investment securities: 4,089,518 3,467,902 4,523,608 3,771,119
Assets pledged as collateral 391,792 332,239 284,426 237,113
18,176,907 15,413,974 18,138,074 15,120,859
Liabilities Deposits from banks (334,341) (283,521) (152,083) (126,784)
Deposits from customers (15,420,974) (13,076,950) (14,274,937) (11,900,344)
Debt securities issued (1,673,212) (1,418,880) (1,564,982) (1,304,652)
Other borrowed funds (912,985) (774,209) (921,349) (768,085)
(18,341,512) (15,553,560) (16,913,351) (14,099,865)
Total (164,605) (139,586) 1,224,723 1,020,994
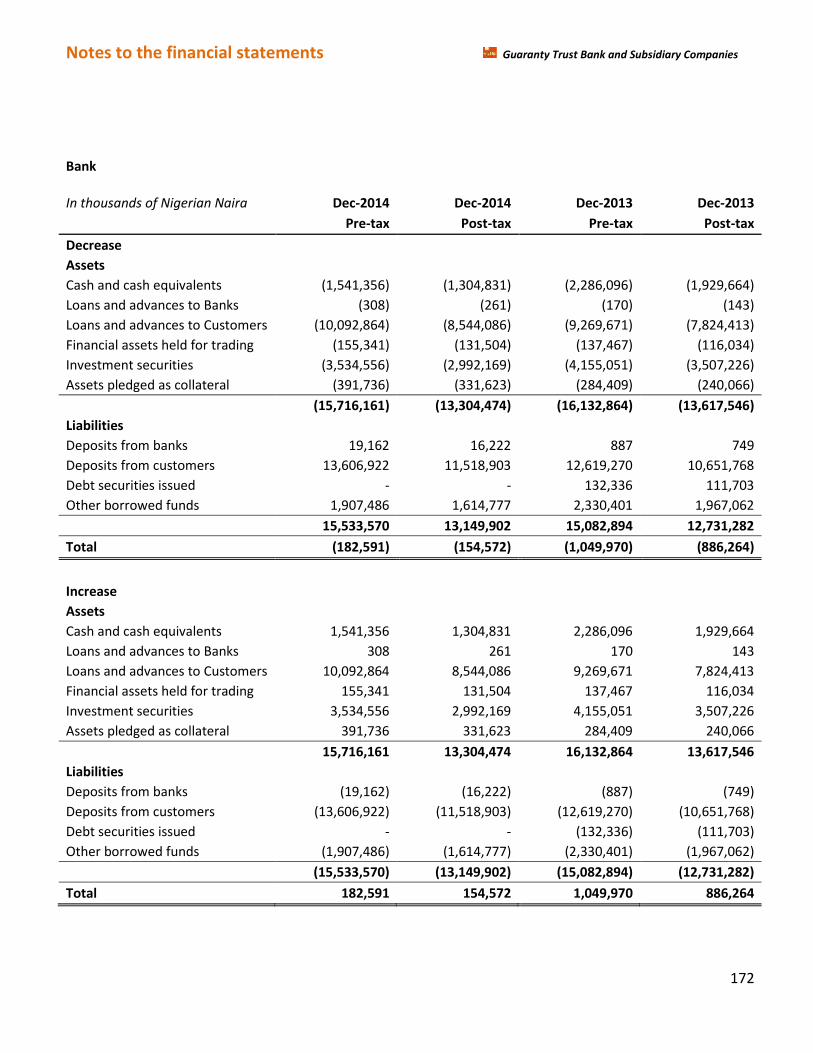
Notes to the financial statements Guaranty Trust Bank and Subsidiary Companies
172
Bank
In thousands of Nigerian Naira Dec-2014 Dec-2014 Dec-2013 Dec-2013
Pre-tax Post-tax Pre-tax Post-tax
Decrease Assets Cash and cash equivalents (1,541,356) (1,304,831) (2,286,096) (1,929,664)
Loans and advances to Banks (308) (261) (170) (143)
Loans and advances to Customers (10,092,864) (8,544,086) (9,269,671) (7,824,413)
Financial assets held for trading (155,341) (131,504) (137,467) (116,034)
Investment securities (3,534,556) (2,992,169) (4,155,051) (3,507,226)
Assets pledged as collateral (391,736) (331,623) (284,409) (240,066)
(15,716,161) (13,304,474) (16,132,864) (13,617,546)
Liabilities Deposits from banks 19,162 16,222 887 749
Deposits from customers 13,606,922 11,518,903 12,619,270 10,651,768
Debt securities issued - - 132,336 111,703
Other borrowed funds 1,907,486 1,614,777 2,330,401 1,967,062
15,533,570 13,149,902 15,082,894 12,731,282
Total (182,591) (154,572) (1,049,970) (886,264)
Increase Assets Cash and cash equivalents 1,541,356 1,304,831 2,286,096 1,929,664
Loans and advances to Banks 308 261 170 143
Loans and advances to Customers 10,092,864 8,544,086 9,269,671 7,824,413
Financial assets held for trading 155,341 131,504 137,467 116,034
Investment securities 3,534,556 2,992,169 4,155,051 3,507,226
Assets pledged as collateral 391,736 331,623 284,409 240,066
15,716,161 13,304,474 16,132,864 13,617,546
Liabilities Deposits from banks (19,162) (16,222) (887) (749)
Deposits from customers (13,606,922) (11,518,903) (12,619,270) (10,651,768)
Debt securities issued - - (132,336) (111,703)
Other borrowed funds (1,907,486) (1,614,777) (2,330,401) (1,967,062)
(15,533,570) (13,149,902) (15,082,894) (12,731,282)
Total 182,591 154,572 1,049,970 886,264
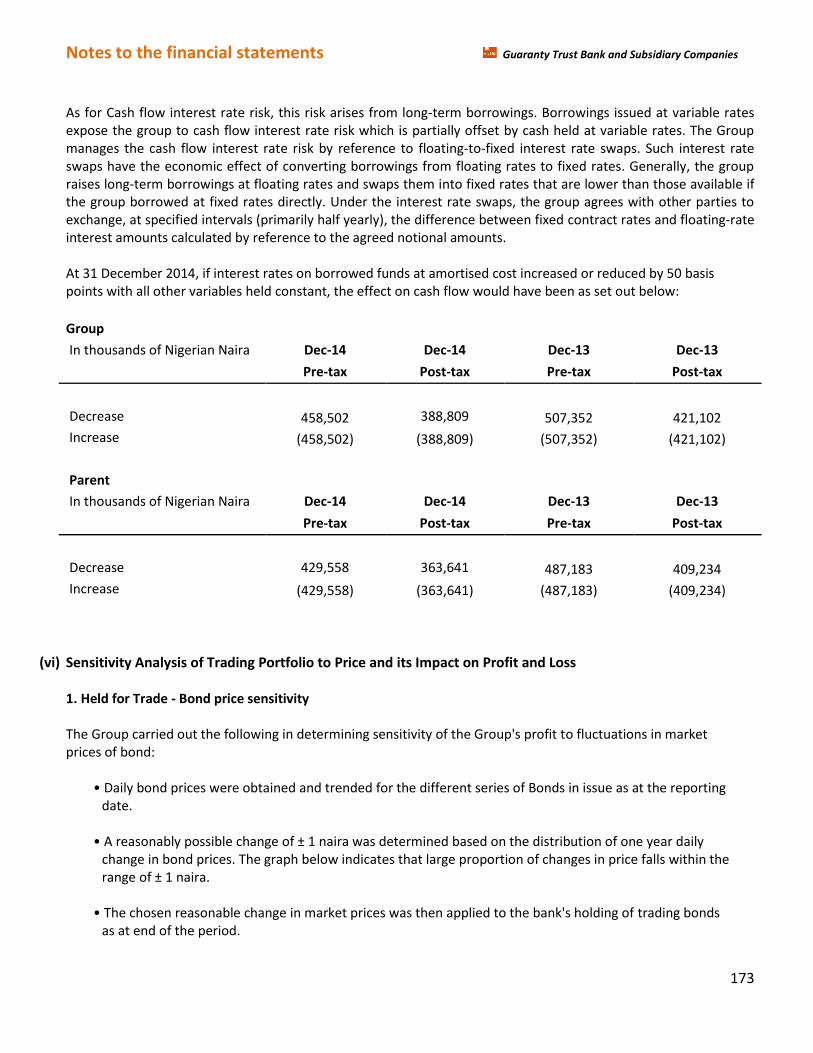
Notes to the financial statements Guaranty Trust Bank and Subsidiary Companies
173
As for Cash flow interest rate risk, this risk arises from long-term borrowings. Borrowings issued at variable rates expose the group to cash flow interest rate risk which is partially offset by cash held at variable rates. The Group manages the cash flow interest rate risk by reference to floating-to-fixed interest rate swaps. Such interest rate swaps have the economic effect of converting borrowings from floating rates to fixed rates. Generally, the group raises long-term borrowings at floating rates and swaps them into fixed rates that are lower than those available if the group borrowed at fixed rates directly. Under the interest rate swaps, the group agrees with other parties to exchange, at specified intervals (primarily half yearly), the difference between fixed contract rates and floating-rate interest amounts calculated by reference to the agreed notional amounts. At 31 December 2014, if interest rates on borrowed funds at amortised cost increased or reduced by 50 basis points with all other variables held constant, the effect on cash flow would have been as set out below:
Group In thousands of Nigerian Naira Dec-14 Dec-14 Dec-13 Dec-13
Pre-tax Post-tax Pre-tax Post-tax
Decrease 458,502 388,809 507,352 421,102
Increase (458,502) (388,809) (507,352) (421,102)
Parent In thousands of Nigerian Naira Dec-14 Dec-14 Dec-13 Dec-13
Pre-tax Post-tax Pre-tax Post-tax
Decrease 429,558 363,641 487,183 409,234
Increase (429,558) (363,641) (487,183) (409,234)
(vi) Sensitivity Analysis of Trading Portfolio to Price and its Impact on Profit and Loss 1. Held for Trade - Bond price sensitivity The Group carried out the following in determining sensitivity of the Group's profit to fluctuations in market prices of bond:
• Daily bond prices were obtained and trended for the different series of Bonds in issue as at the reporting date.
• A reasonably possible change of ± 1 naira was determined based on the distribution of one year daily
change in bond prices. The graph below indicates that large proportion of changes in price falls within the range of ± 1 naira.
• The chosen reasonable change in market prices was then applied to the bank's holding of trading bonds
as at end of the period.
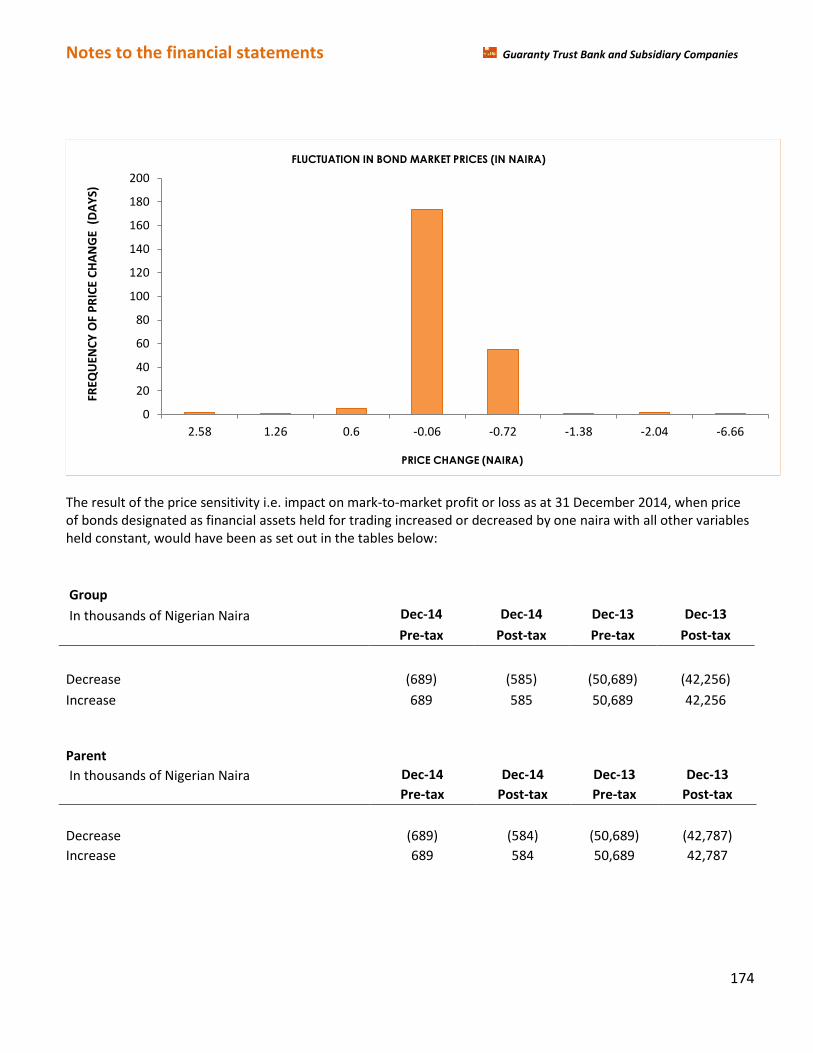
Notes to the financial statements Guaranty Trust Bank and Subsidiary Companies
174
The result of the price sensitivity i.e. impact on mark-to-market profit or loss as at 31 December 2014, when price of bonds designated as financial assets held for trading increased or decreased by one naira with all other variables held constant, would have been as set out in the tables below:
Group In thousands of Nigerian Naira Dec-14 Dec-14 Dec-13 Dec-13
Pre-tax Post-tax Pre-tax Post-tax
Decrease (689) (585) (50,689) (42,256)
Increase 689 585 50,689 42,256
Parent In thousands of Nigerian Naira Dec-14 Dec-14 Dec-13 Dec-13
Pre-tax Post-tax Pre-tax Post-tax
Decrease (689) (584) (50,689) (42,787)
Increase 689 584 50,689 42,787
0
20
40
60
80
100
120
140
160
180
200
2.58 1.26 0.6 -0.06 -0.72 -1.38 -2.04 -6.66
FREQ
UEN
CY
OF
PR
ICE
CH
AN
GE
(D
AY
S)
PRICE CHANGE (NAIRA)
FLUCTUATION IN BOND MARKET PRICES (IN NAIRA)
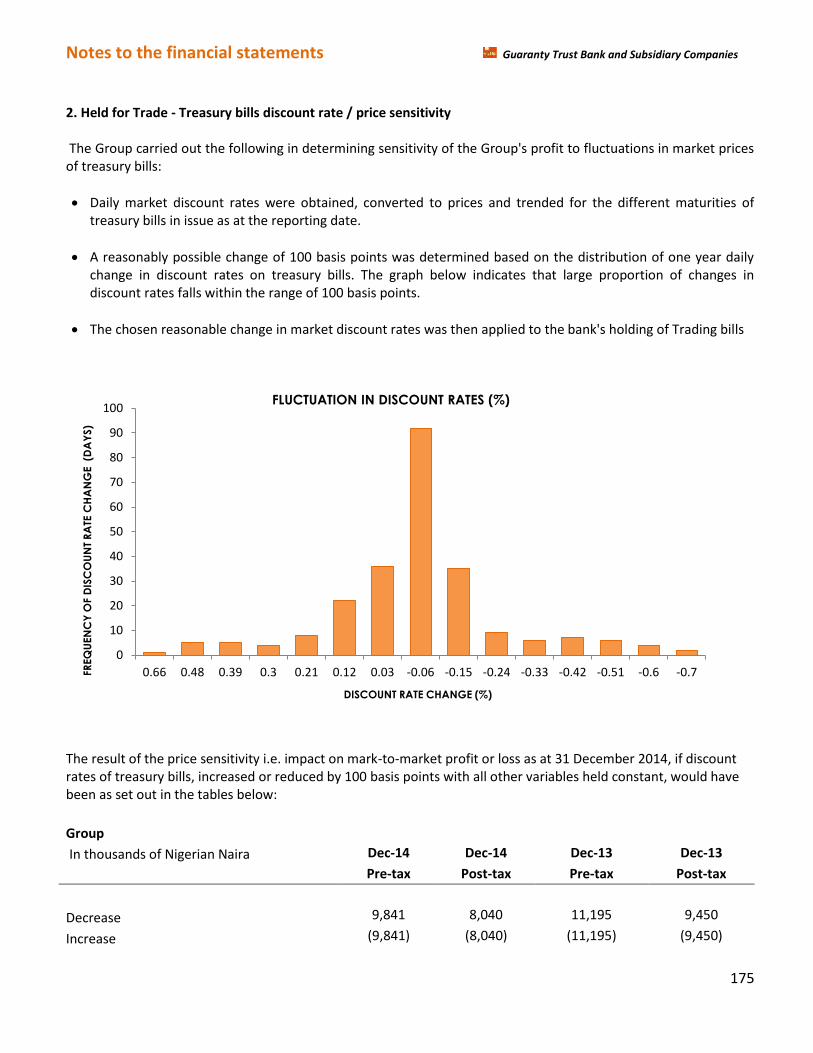
Notes to the financial statements Guaranty Trust Bank and Subsidiary Companies
175
2. Held for Trade - Treasury bills discount rate / price sensitivity The Group carried out the following in determining sensitivity of the Group's profit to fluctuations in market prices of treasury bills:
Daily market discount rates were obtained, converted to prices and trended for the different maturities of treasury bills in issue as at the reporting date.
A reasonably possible change of 100 basis points was determined based on the distribution of one year daily change in discount rates on treasury bills. The graph below indicates that large proportion of changes in discount rates falls within the range of 100 basis points.
The chosen reasonable change in market discount rates was then applied to the bank's holding of Trading bills
The result of the price sensitivity i.e. impact on mark-to-market profit or loss as at 31 December 2014, if discount rates of treasury bills, increased or reduced by 100 basis points with all other variables held constant, would have been as set out in the tables below:
Group In thousands of Nigerian Naira Dec-14 Dec-14 Dec-13 Dec-13
Pre-tax Post-tax Pre-tax Post-tax
Decrease 9,841 8,040 11,195 9,450
Increase (9,841) (8,040) (11,195) (9,450)
0
10
20
30
40
50
60
70
80
90
100
0.66 0.48 0.39 0.3 0.21 0.12 0.03 -0.06 -0.15 -0.24 -0.33 -0.42 -0.51 -0.6 -0.7FR
EQ
UEN
CY
OF D
ISC
OU
NT
RA
TE C
HA
NG
E (D
AY
S)
DISCOUNT RATE CHANGE (%)
FLUCTUATION IN DISCOUNT RATES (%)
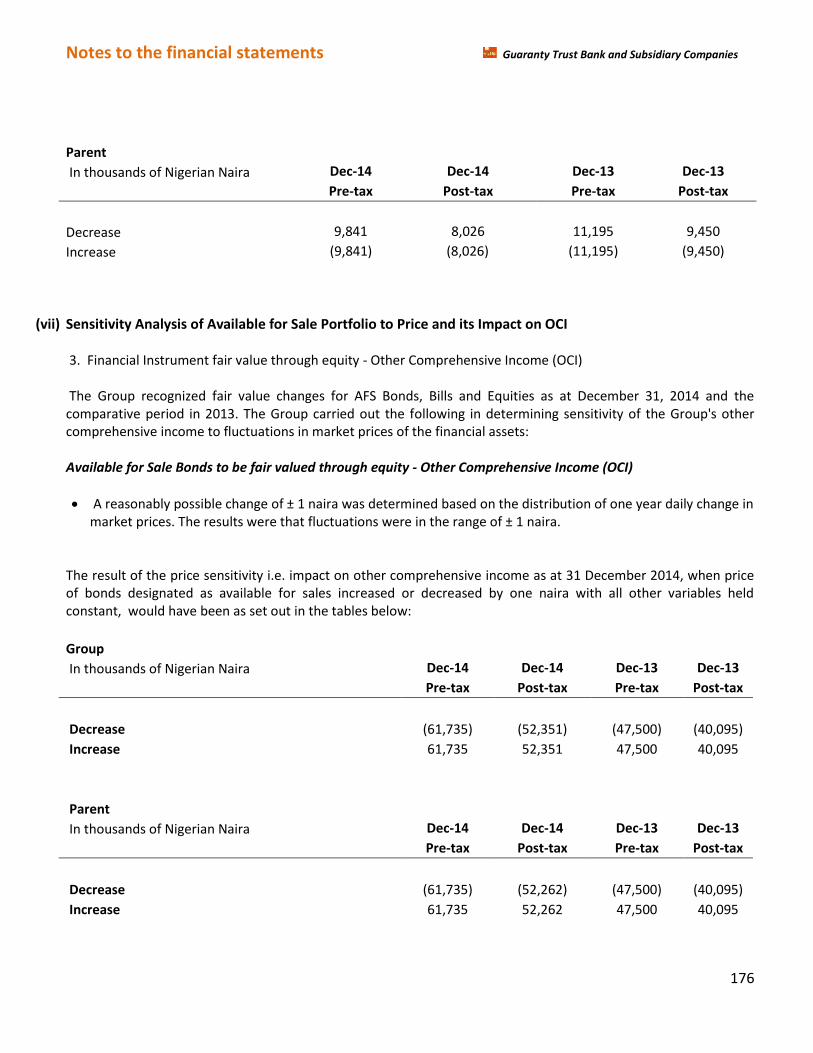
Notes to the financial statements Guaranty Trust Bank and Subsidiary Companies
176
Parent In thousands of Nigerian Naira Dec-14 Dec-14 Dec-13 Dec-13
Pre-tax Post-tax Pre-tax Post-tax
Decrease 9,841 8,026 11,195 9,450
Increase (9,841) (8,026) (11,195) (9,450)
(vii) Sensitivity Analysis of Available for Sale Portfolio to Price and its Impact on OCI 3. Financial Instrument fair value through equity - Other Comprehensive Income (OCI) The Group recognized fair value changes for AFS Bonds, Bills and Equities as at December 31, 2014 and the comparative period in 2013. The Group carried out the following in determining sensitivity of the Group's other comprehensive income to fluctuations in market prices of the financial assets: Available for Sale Bonds to be fair valued through equity - Other Comprehensive Income (OCI)
A reasonably possible change of ± 1 naira was determined based on the distribution of one year daily change in market prices. The results were that fluctuations were in the range of ± 1 naira.
The result of the price sensitivity i.e. impact on other comprehensive income as at 31 December 2014, when price of bonds designated as available for sales increased or decreased by one naira with all other variables held constant, would have been as set out in the tables below:
Group In thousands of Nigerian Naira Dec-14 Dec-14 Dec-13 Dec-13
Pre-tax Post-tax Pre-tax Post-tax
Decrease (61,735) (52,351) (47,500) (40,095)
Increase 61,735 52,351 47,500 40,095
Parent In thousands of Nigerian Naira Dec-14 Dec-14 Dec-13 Dec-13
Pre-tax Post-tax Pre-tax Post-tax
Decrease (61,735) (52,262) (47,500) (40,095)
Increase 61,735 52,262 47,500 40,095

Notes to the financial statements Guaranty Trust Bank and Subsidiary Companies
177
Available for Sale Treasury Bills to be fair valued through equity - Other Comprehensive Income (OCI) The Group carried out the following in determining sensitivity of the Group's profit to fluctuations in market prices of treasury bills:
Daily market discount rates were obtained and trended for the different maturities of treasury bills in issue as at the reporting date.
A reasonably possible change of ± 100 basis points was determined based on the distribution of one year daily change in discount rates on treasury bills. The graph below indicates that large proportion of changes in discount rates falls in the range of ± 100 basis points.
The chosen reasonable change in market discount rates was then applied to the bank's holding of Available for Sale treasury bills as at end of the period.
The result of the price sensitivity i.e. impact on other comprehensive income as at 31 December 2014, if discount rates of treasury bills designated as available for sales, converted to prices, increased or reduced by 100 basis points with all other variables held constant, would have been as set out in the tables below:
Group In thousands of Nigerian Naira Dec-14 Dec-14 Dec-13 Dec-13
Pre-tax Post-tax Pre-tax Post-tax
Decrease 699,608 593,266 454,098 378,545 Increase (699,608) (593,266) (454,098) (378,545)
Parent In thousands of Nigerian Naira Dec-14 Dec-14 Dec-13 Dec-13
Pre-tax Post-tax Pre-tax Post-tax
Decrease 699,608 592,251 454,098 378,545
Increase (699,608) (592,251) (454,098) (378,545)
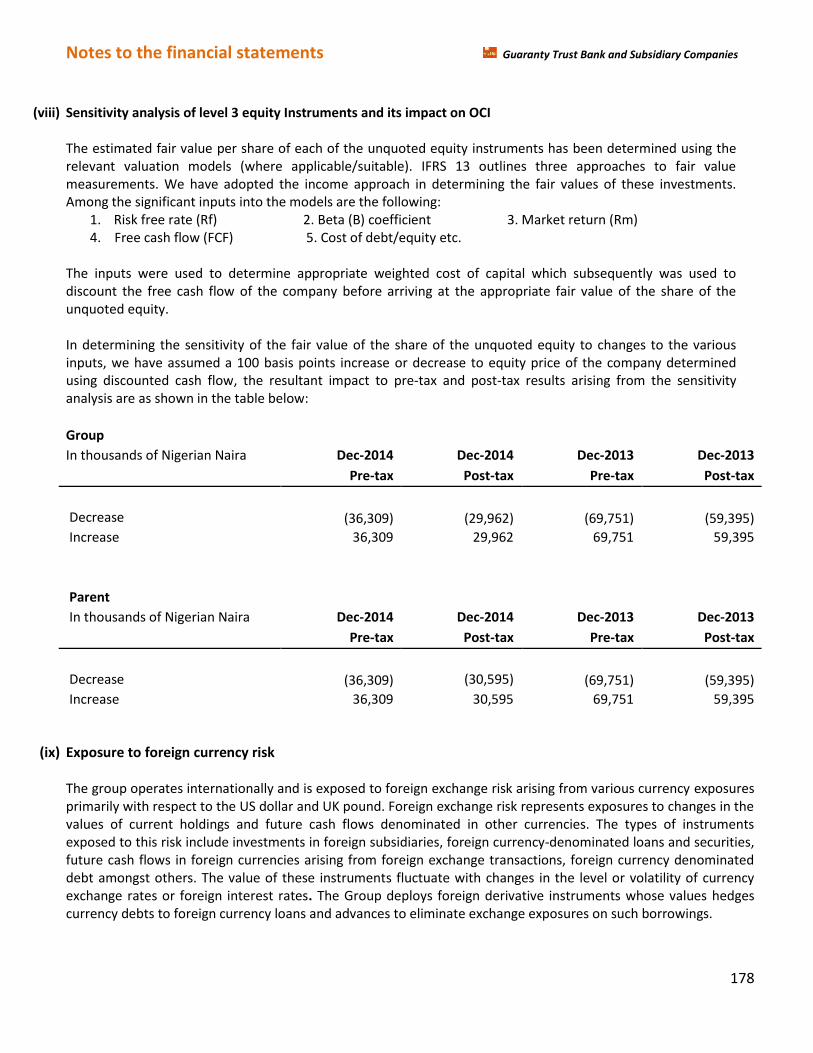
Notes to the financial statements Guaranty Trust Bank and Subsidiary Companies
178
(viii) Sensitivity analysis of level 3 equity Instruments and its impact on OCI
The estimated fair value per share of each of the unquoted equity instruments has been determined using the relevant valuation models (where applicable/suitable). IFRS 13 outlines three approaches to fair value measurements. We have adopted the income approach in determining the fair values of these investments. Among the significant inputs into the models are the following:
1. Risk free rate (Rf) 2. Beta (B) coefficient 3. Market return (Rm) 4. Free cash flow (FCF) 5. Cost of debt/equity etc.
The inputs were used to determine appropriate weighted cost of capital which subsequently was used to discount the free cash flow of the company before arriving at the appropriate fair value of the share of the unquoted equity. In determining the sensitivity of the fair value of the share of the unquoted equity to changes to the various inputs, we have assumed a 100 basis points increase or decrease to equity price of the company determined using discounted cash flow, the resultant impact to pre-tax and post-tax results arising from the sensitivity analysis are as shown in the table below:
Group In thousands of Nigerian Naira Dec-2014 Dec-2014 Dec-2013 Dec-2013
Pre-tax Post-tax Pre-tax Post-tax
Decrease (36,309) (29,962) (69,751) (59,395)
Increase 36,309 29,962 69,751 59,395
Parent
In thousands of Nigerian Naira Dec-2014 Dec-2014 Dec-2013 Dec-2013
Pre-tax Post-tax Pre-tax Post-tax
Decrease (36,309) (30,595) (69,751) (59,395)
Increase 36,309 30,595 69,751 59,395
(ix) Exposure to foreign currency risk The group operates internationally and is exposed to foreign exchange risk arising from various currency exposures primarily with respect to the US dollar and UK pound. Foreign exchange risk represents exposures to changes in the values of current holdings and future cash flows denominated in other currencies. The types of instruments exposed to this risk include investments in foreign subsidiaries, foreign currency-denominated loans and securities, future cash flows in foreign currencies arising from foreign exchange transactions, foreign currency denominated debt amongst others. The value of these instruments fluctuate with changes in the level or volatility of currency exchange rates or foreign interest rates. The Group deploys foreign derivative instruments whose values hedges currency debts to foreign currency loans and advances to eliminate exchange exposures on such borrowings.
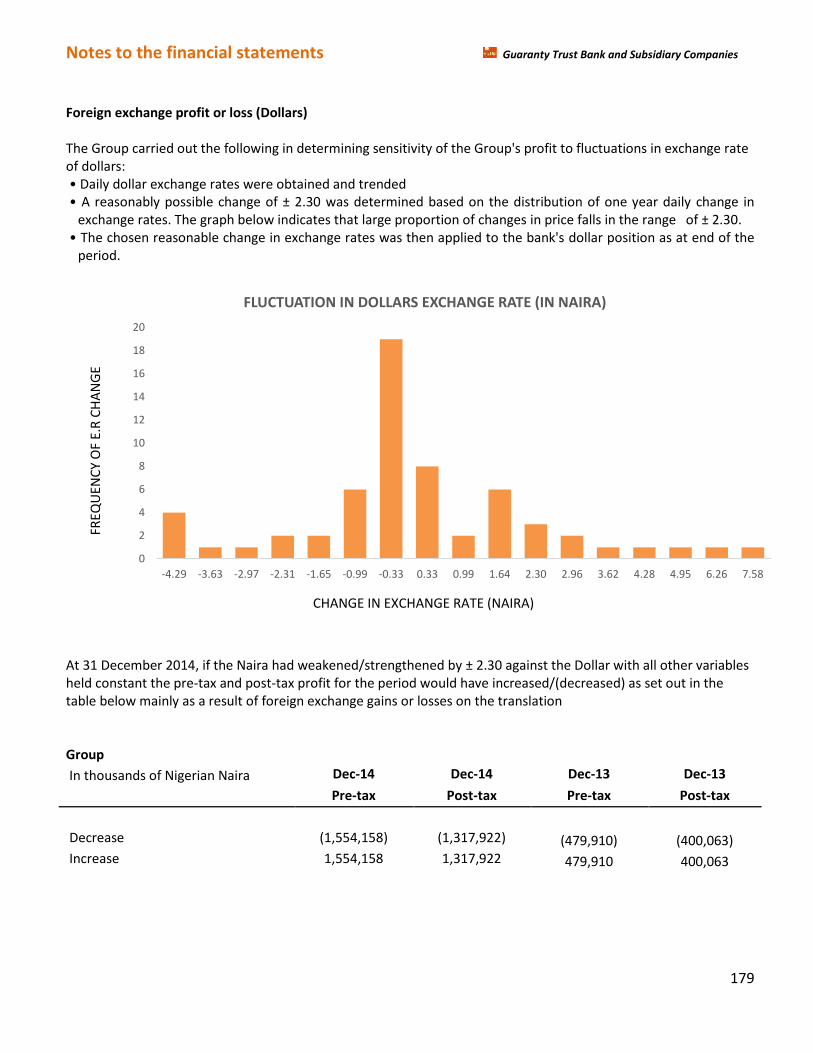
Notes to the financial statements Guaranty Trust Bank and Subsidiary Companies
179
Foreign exchange profit or loss (Dollars) The Group carried out the following in determining sensitivity of the Group's profit to fluctuations in exchange rate of dollars: • Daily dollar exchange rates were obtained and trended • A reasonably possible change of ± 2.30 was determined based on the distribution of one year daily change in
exchange rates. The graph below indicates that large proportion of changes in price falls in the range of ± 2.30. • The chosen reasonable change in exchange rates was then applied to the bank's dollar position as at end of the
period.
At 31 December 2014, if the Naira had weakened/strengthened by ± 2.30 against the Dollar with all other variables held constant the pre-tax and post-tax profit for the period would have increased/(decreased) as set out in the table below mainly as a result of foreign exchange gains or losses on the translation Group
In thousands of Nigerian Naira Dec-14 Dec-14 Dec-13 Dec-13
Pre-tax Post-tax Pre-tax Post-tax
Decrease (1,554,158) (1,317,922) (479,910) (400,063) Increase 1,554,158 1,317,922 479,910 400,063
0
2
4
6
8
10
12
14
16
18
20
-4.29 -3.63 -2.97 -2.31 -1.65 -0.99 -0.33 0.33 0.99 1.64 2.30 2.96 3.62 4.28 4.95 6.26 7.58
FLUCTUATION IN DOLLARS EXCHANGE RATE (IN NAIRA)
CHANGE IN EXCHANGE RATE (NAIRA)
FREQ
UEN
CY
OF
E.R
CH
AN
GE
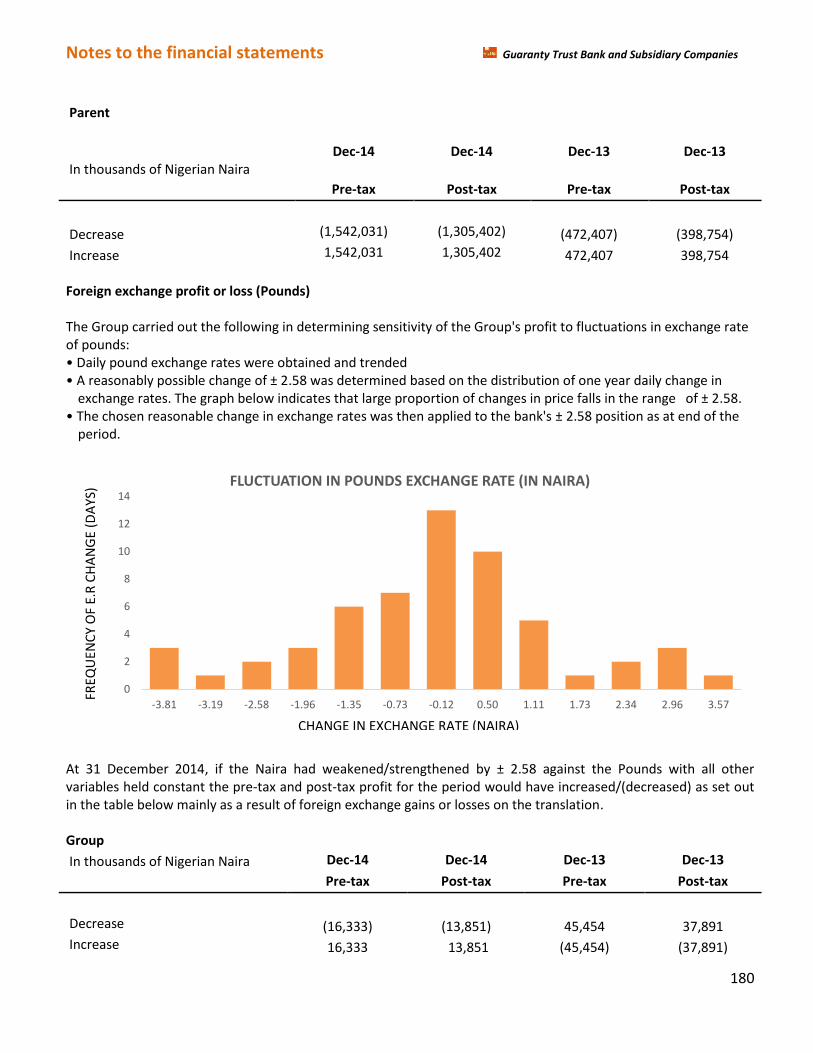
Notes to the financial statements Guaranty Trust Bank and Subsidiary Companies
180
Parent
In thousands of Nigerian Naira
Dec-14 Dec-14 Dec-13 Dec-13
Pre-tax Post-tax Pre-tax Post-tax
Decrease (1,542,031) (1,305,402) (472,407) (398,754)
Increase 1,542,031 1,305,402 472,407 398,754 Foreign exchange profit or loss (Pounds) The Group carried out the following in determining sensitivity of the Group's profit to fluctuations in exchange rate of pounds: • Daily pound exchange rates were obtained and trended • A reasonably possible change of ± 2.58 was determined based on the distribution of one year daily change in
exchange rates. The graph below indicates that large proportion of changes in price falls in the range of ± 2.58. • The chosen reasonable change in exchange rates was then applied to the bank's ± 2.58 position as at end of the
period.
At 31 December 2014, if the Naira had weakened/strengthened by ± 2.58 against the Pounds with all other variables held constant the pre-tax and post-tax profit for the period would have increased/(decreased) as set out in the table below mainly as a result of foreign exchange gains or losses on the translation. Group
In thousands of Nigerian Naira Dec-14 Dec-14 Dec-13 Dec-13
Pre-tax Post-tax Pre-tax Post-tax
Decrease (16,333) (13,851) 45,454 37,891 Increase 16,333 13,851 (45,454) (37,891)
0
2
4
6
8
10
12
14
-3.81 -3.19 -2.58 -1.96 -1.35 -0.73 -0.12 0.50 1.11 1.73 2.34 2.96 3.57
FLUCTUATION IN POUNDS EXCHANGE RATE (IN NAIRA)
CHANGE IN EXCHANGE RATE (NAIRA)
FREQ
UEN
CY
OF
E.R
CH
AN
GE
(DA
YS)
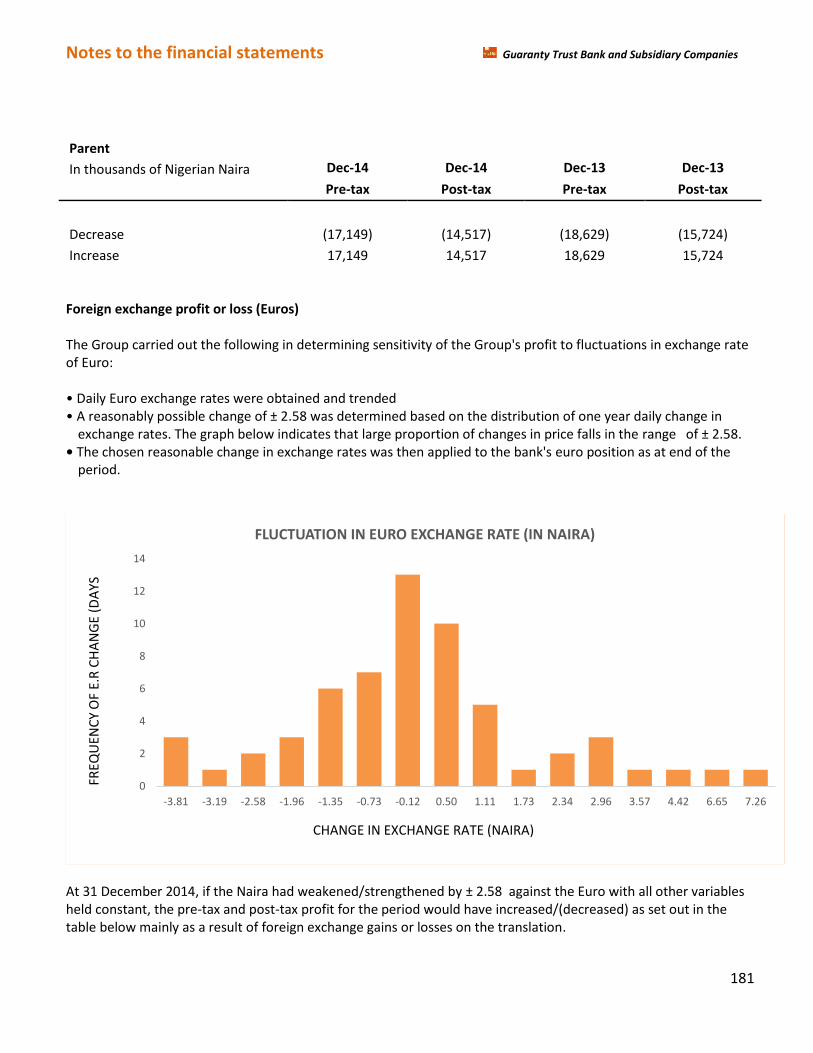
Notes to the financial statements Guaranty Trust Bank and Subsidiary Companies
181
Parent
In thousands of Nigerian Naira Dec-14 Dec-14 Dec-13 Dec-13
Pre-tax Post-tax Pre-tax Post-tax
Decrease (17,149) (14,517) (18,629) (15,724)
Increase 17,149 14,517 18,629 15,724 Foreign exchange profit or loss (Euros) The Group carried out the following in determining sensitivity of the Group's profit to fluctuations in exchange rate of Euro: • Daily Euro exchange rates were obtained and trended • A reasonably possible change of ± 2.58 was determined based on the distribution of one year daily change in
exchange rates. The graph below indicates that large proportion of changes in price falls in the range of ± 2.58. • The chosen reasonable change in exchange rates was then applied to the bank's euro position as at end of the
period.
At 31 December 2014, if the Naira had weakened/strengthened by ± 2.58 against the Euro with all other variables held constant, the pre-tax and post-tax profit for the period would have increased/(decreased) as set out in the table below mainly as a result of foreign exchange gains or losses on the translation.
0
2
4
6
8
10
12
14
-3.81 -3.19 -2.58 -1.96 -1.35 -0.73 -0.12 0.50 1.11 1.73 2.34 2.96 3.57 4.42 6.65 7.26
FLUCTUATION IN EURO EXCHANGE RATE (IN NAIRA)
CHANGE IN EXCHANGE RATE (NAIRA)
FREQ
UEN
CY
OF
E.R
CH
AN
GE
(DA
YS

Notes to the financial statements Guaranty Trust Bank and Subsidiary Companies
182
Group
In thousands of Nigerian Naira Dec-2014 Dec-2014 Dec-2013 Dec-2013
Pre-tax Post-tax Pre-tax Post-tax
Decrease (38,150) (32,351) (32,058) (26,724) Increase 38,150 32,351 32,058 26,724
Parent In thousands of Nigerian Naira Dec-2014 Dec-2014 Dec-2013 Dec-2013
Pre-tax Post-tax Pre-tax Post-tax
Decrease (38,020) (32,185) (25,610) (21,617) Increase 38,020 32,185 25,610 21,617 Foreign Exchange Profit or Loss (Other Currencies) At 31 December 2014, if Naira had weakened/strengthened by ± 2 against the other currencies with all other variables held constant the pre-tax and post-tax profit for the period, the impact of possible fluctuations in exchange rates on the overall foreign exchange revaluation profit of the bank is as shown below:
Group In thousands of Nigerian Naira Dec-2013 Dec-2013 Dec-2013 Dec-2013
Pre-tax Post-tax Pre-tax Post-tax
Decrease (161,779) (137,189) (94,919) (79,126) Increase 161,779 137,189 94,919 79,126
Parent In thousands of Nigerian Naira Dec-2013 Dec-2013 Dec-2013 Dec-2013
Pre-tax Post-tax Pre-tax Post-tax
Decrease (161,354) (136,594) (81,185) (68,527) Increase 161,354 136,594 81,185 68,527 The impact of possible fluctuations in exchange rates on pre-tax and post-tax profits or loss as shown above is unrepresentative of the risk inherent in the financial instruments due to volatility in foreign exchange rate during the year.
Notes to the financial statements Guaranty Trust Bank and Subsidiary Companies
183
(x) Sensitivity analysis of derivative valuations
The fair value of foreign exchange contracts varies largely due to changes in foreign currency exchange
rates. For the purpose of assessing specific risks, the Group carried out a sensitivity analysis to
determine the effects that market risk exposures may have on the fair value of the Group’s derivative
financial instruments and results of operations. To perform the sensitivity analysis, daily U.S. Dollar
exchange rates were obtained and trended; with all other variables kept constant and a proportional
foreign exchange rate movement of -0.6% (depreciation of the Nigerian Naira) and +0.6% (appreciation
of the Nigerian Naira) against the U.S. Dollar; or ± 1 change in Nigerian Naira against the U.S. Dollar have
been considered to be reasonably possible based on the distribution of two-year daily change in
exchange rates of the U.S. Dollar.
The following table summarizes our derivatives financial instruments as at December 31, 2014 and
analyzes the sensitivity of their fair values to an immediate change in foreign currency rates. Fair values
represent the present value of forecasted future cash flows at market foreign currency exchange rates.
A favorable change indicates a weakening of the Nigerian Naira against the U.S. Dollar and an
unfavorable change indicates a strengthening of the Nigerian Naira against the U.S. Dollar. The selection
of 0.6% or =N=1 favorable or unfavorable change in foreign currency exchange rates should not be
construed as a prediction by the Group of future market events, but rather, to illustrate the potential
impact of such an event. The modeling technique used to calculate the exposure does not take into
account correlation among foreign currency exchange rates, or correlation among various markets such
as the foreign exchange, equity and fixed-income markets. Actual experience may differ from the results
in the table below due to the correlation assumptions utilized, or if events occur that were not included
in the methodology, such as significant liquidity or market events.
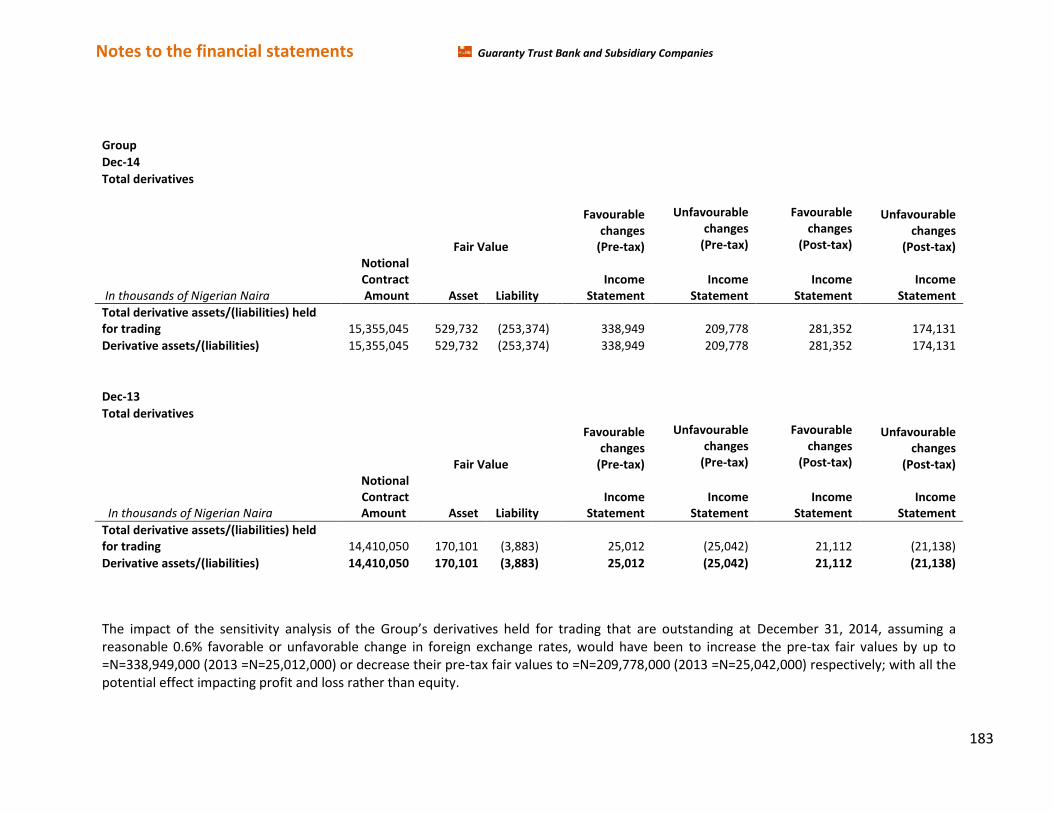
Notes to the financial statements Guaranty Trust Bank and Subsidiary Companies
183
Group
Dec-14
Total derivatives
Fair Value
Favourable changes
(Pre-tax)
Unfavourable changes
(Pre-tax)
Favourable changes
(Post-tax)
Unfavourable changes
(Post-tax)
In thousands of Nigerian Naira
Notional Contract Amount Asset Liability
Income Statement
Income Statement
Income Statement
Income Statement
Total derivative assets/(liabilities) held for trading 15,355,045 529,732 (253,374) 338,949 209,778 281,352 174,131
Derivative assets/(liabilities) 15,355,045 529,732 (253,374) 338,949 209,778 281,352 174,131
Dec-13
Total derivatives
Fair Value
Favourable changes
(Pre-tax)
Unfavourable changes
(Pre-tax)
Favourable changes
(Post-tax)
Unfavourable changes
(Post-tax)
In thousands of Nigerian Naira
Notional Contract Amount Asset Liability
Income Statement
Income Statement
Income Statement
Income Statement
Total derivative assets/(liabilities) held for trading 14,410,050 170,101 (3,883) 25,012 (25,042) 21,112 (21,138)
Derivative assets/(liabilities) 14,410,050 170,101 (3,883) 25,012 (25,042) 21,112 (21,138)
The impact of the sensitivity analysis of the Group’s derivatives held for trading that are outstanding at December 31, 2014, assuming a reasonable 0.6% favorable or unfavorable change in foreign exchange rates, would have been to increase the pre-tax fair values by up to =N=338,949,000 (2013 =N=25,012,000) or decrease their pre-tax fair values to =N=209,778,000 (2013 =N=25,042,000) respectively; with all the potential effect impacting profit and loss rather than equity.

Notes to the financial statements Guaranty Trust Bank and Subsidiary Companies
184
Dec-14
Total derivatives
Fair Value
Favourable changes
(Pre-tax)
Unfavourable changes
(Pre-tax)
Favourable changes
(Post-tax)
Unfavourable changes
(Post-tax)
In thousands of Nigerian Naira
Notional Contract Amount Asset Liability
Income Statement
Income Statement
Income Statement
Income Statement
Total derivative assets/(liabilities) held for trading 15,355,045 529,732 (253,374) 338,949 209,778 281,352 174,131
Derivative assets/(liabilities) 15,355,045 529,732 (253,374) 338,949 209,778 281,352 174,131
Dec-13
Total derivatives
Fair Value
Favourable changes
(Pre-tax)
Unfavourable changes
(Pre-tax)
Favourable changes
(Post-tax)
Unfavourable changes
(Post-tax)
In thousands of Nigerian Naira
Notional Contract Amount Asset Liability
Income Statement
Income Statement
Income Statement
Income Statement
Total derivative assets/(liabilities) held for trading 14,410,050 170,101 (3,883) 25,012 (25,042) 21,112 (21,138)
Derivative assets/(liabilities) 14,410,050 170,101 (3,883) 25,012 (25,042) 21,112 (21,138)
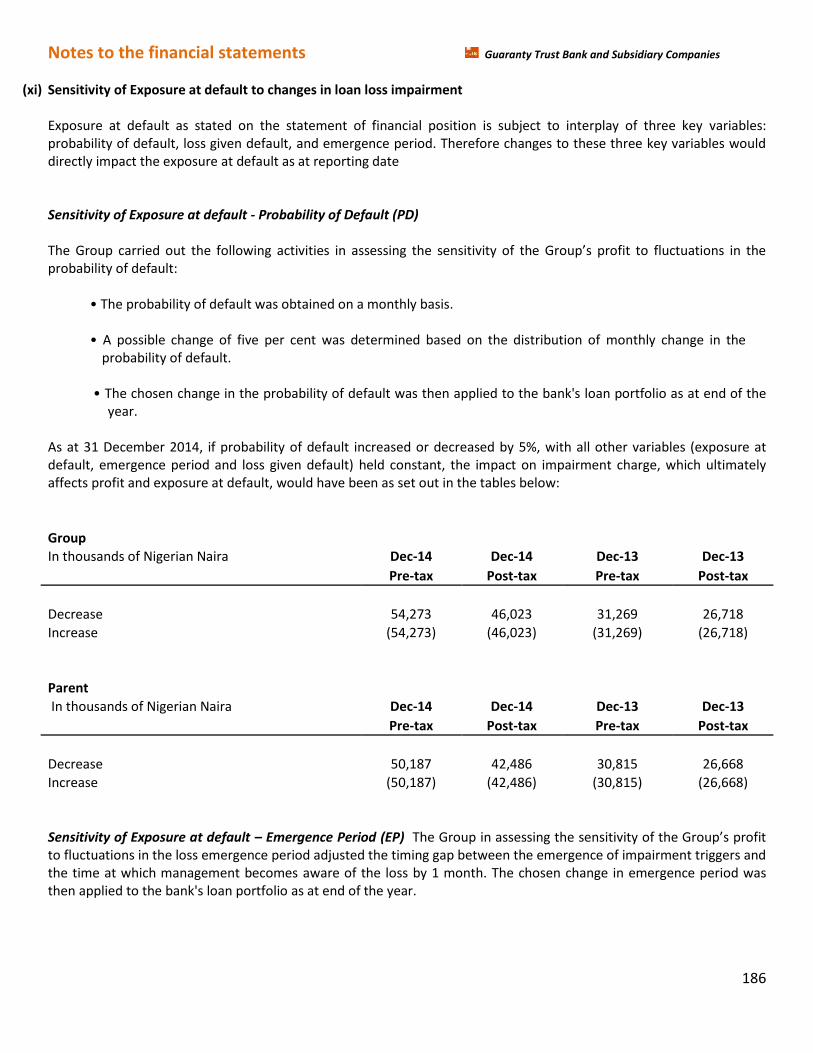
Notes to the financial statements Guaranty Trust Bank and Subsidiary Companies
186
(xi) Sensitivity of Exposure at default to changes in loan loss impairment Exposure at default as stated on the statement of financial position is subject to interplay of three key variables: probability of default, loss given default, and emergence period. Therefore changes to these three key variables would directly impact the exposure at default as at reporting date Sensitivity of Exposure at default - Probability of Default (PD) The Group carried out the following activities in assessing the sensitivity of the Group’s profit to fluctuations in the probability of default:
• The probability of default was obtained on a monthly basis. • A possible change of five per cent was determined based on the distribution of monthly change in the
probability of default. • The chosen change in the probability of default was then applied to the bank's loan portfolio as at end of the
year. As at 31 December 2014, if probability of default increased or decreased by 5%, with all other variables (exposure at default, emergence period and loss given default) held constant, the impact on impairment charge, which ultimately affects profit and exposure at default, would have been as set out in the tables below:
Group In thousands of Nigerian Naira Dec-14 Dec-14 Dec-13 Dec-13
Pre-tax Post-tax Pre-tax Post-tax
Decrease 54,273 46,023 31,269 26,718
Increase (54,273) (46,023) (31,269) (26,718)
Parent In thousands of Nigerian Naira Dec-14 Dec-14 Dec-13 Dec-13
Pre-tax Post-tax Pre-tax Post-tax
Decrease 50,187 42,486 30,815 26,668
Increase (50,187) (42,486) (30,815) (26,668)
Sensitivity of Exposure at default – Emergence Period (EP) The Group in assessing the sensitivity of the Group’s profit to fluctuations in the loss emergence period adjusted the timing gap between the emergence of impairment triggers and the time at which management becomes aware of the loss by 1 month. The chosen change in emergence period was then applied to the bank's loan portfolio as at end of the year.
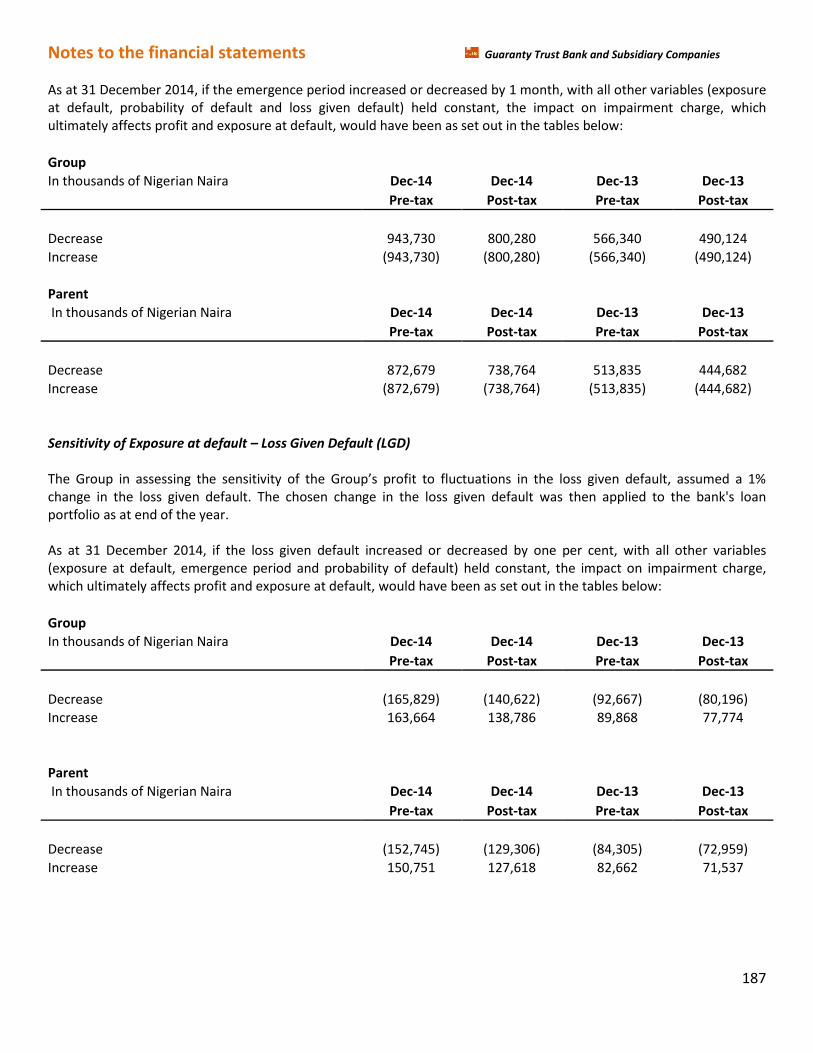
Notes to the financial statements Guaranty Trust Bank and Subsidiary Companies
187
As at 31 December 2014, if the emergence period increased or decreased by 1 month, with all other variables (exposure at default, probability of default and loss given default) held constant, the impact on impairment charge, which ultimately affects profit and exposure at default, would have been as set out in the tables below:
Group In thousands of Nigerian Naira Dec-14 Dec-14 Dec-13 Dec-13
Pre-tax Post-tax Pre-tax Post-tax
Decrease 943,730 800,280 566,340 490,124
Increase (943,730) (800,280) (566,340) (490,124)
Parent In thousands of Nigerian Naira Dec-14 Dec-14 Dec-13 Dec-13
Pre-tax Post-tax Pre-tax Post-tax
Decrease 872,679 738,764 513,835 444,682
Increase (872,679) (738,764) (513,835) (444,682)
Sensitivity of Exposure at default – Loss Given Default (LGD) The Group in assessing the sensitivity of the Group’s profit to fluctuations in the loss given default, assumed a 1% change in the loss given default. The chosen change in the loss given default was then applied to the bank's loan portfolio as at end of the year. As at 31 December 2014, if the loss given default increased or decreased by one per cent, with all other variables (exposure at default, emergence period and probability of default) held constant, the impact on impairment charge, which ultimately affects profit and exposure at default, would have been as set out in the tables below:
Group In thousands of Nigerian Naira Dec-14 Dec-14 Dec-13 Dec-13
Pre-tax Post-tax Pre-tax Post-tax
Decrease (165,829) (140,622) (92,667) (80,196) Increase 163,664 138,786 89,868 77,774
Parent In thousands of Nigerian Naira Dec-14 Dec-14 Dec-13 Dec-13
Pre-tax Post-tax Pre-tax Post-tax
Decrease (152,745) (129,306) (84,305) (72,959)
Increase 150,751 127,618 82,662 71,537
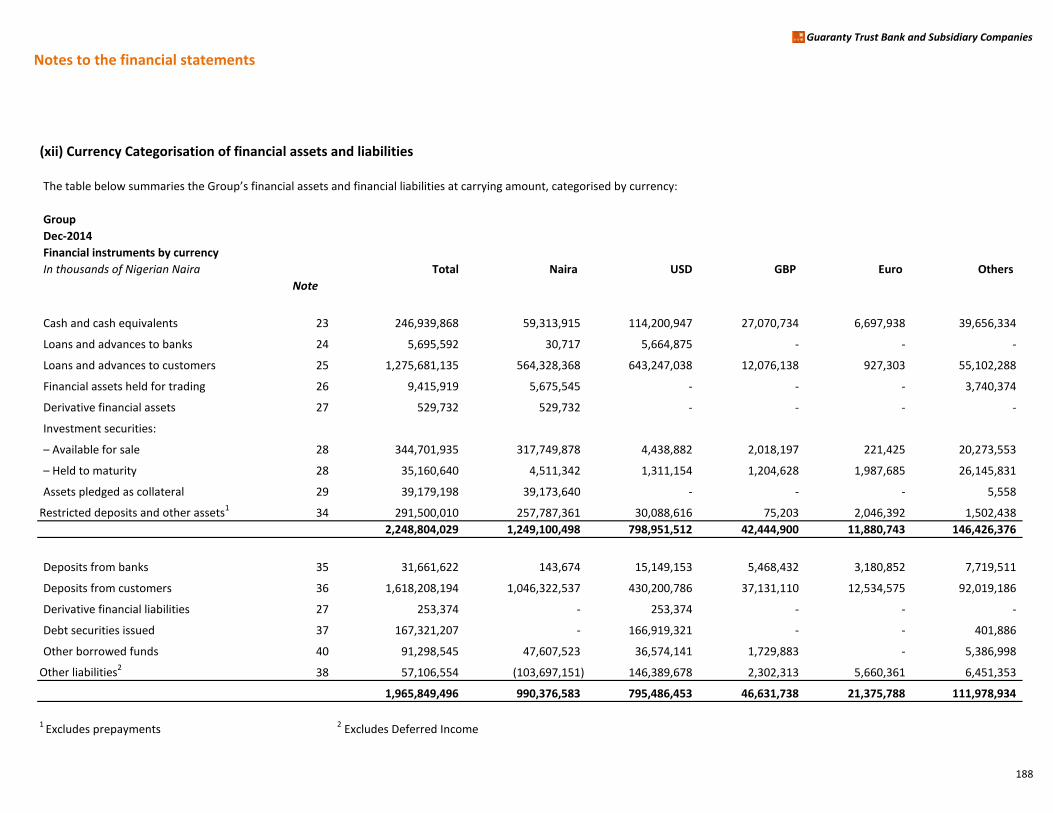
Notes to the financial statements
Guaranty Trust Bank and Subsidiary Companies
(xii) Currency Categorisation of financial assets and liabilities
The table below summaries the Group’s financial assets and financial liabilities at carrying amount, categorised by currency:
Group
Dec-2014
Financial instruments by currency
In thousands of Nigerian Naira Total Naira USD GBP Euro Others
Note
Cash and cash equivalents 23 246,939,868 59,313,915 114,200,947 27,070,734 6,697,938 39,656,334
Loans and advances to banks 24 5,695,592 30,717 5,664,875 - - -
Loans and advances to customers 25 1,275,681,135 564,328,368 643,247,038 12,076,138 927,303 55,102,288
Financial assets held for trading 26 9,415,919 5,675,545 - - - 3,740,374
Derivative financial assets 27 529,732 529,732 - - - -
Investment securities:
– Available for sale 28 344,701,935 317,749,878 4,438,882 2,018,197 221,425 20,273,553
– Held to maturity 28 35,160,640 4,511,342 1,311,154 1,204,628 1,987,685 26,145,831
Assets pledged as collateral 29 39,179,198 39,173,640 - - - 5,558
Restricted deposits and other assets1 34 291,500,010 257,787,361 30,088,616 75,203 2,046,392 1,502,438
2,248,804,029 1,249,100,498 798,951,512 42,444,900 11,880,743 146,426,376
Deposits from banks 35 31,661,622 143,674 15,149,153 5,468,432 3,180,852 7,719,511
Deposits from customers 36 1,618,208,194 1,046,322,537 430,200,786 37,131,110 12,534,575 92,019,186
Derivative financial liabilities 27 253,374 - 253,374 - - -
Debt securities issued 37 167,321,207 - 166,919,321 - - 401,886
Other borrowed funds 40 91,298,545 47,607,523 36,574,141 1,729,883 - 5,386,998
Other liabilities238 57,106,554 (103,697,151) 146,389,678 2,302,313 5,660,361 6,451,353
1,965,849,496 990,376,583 795,486,453 46,631,738 21,375,788 111,978,934
1 Excludes prepayments 2 Excludes Deferred Income
188
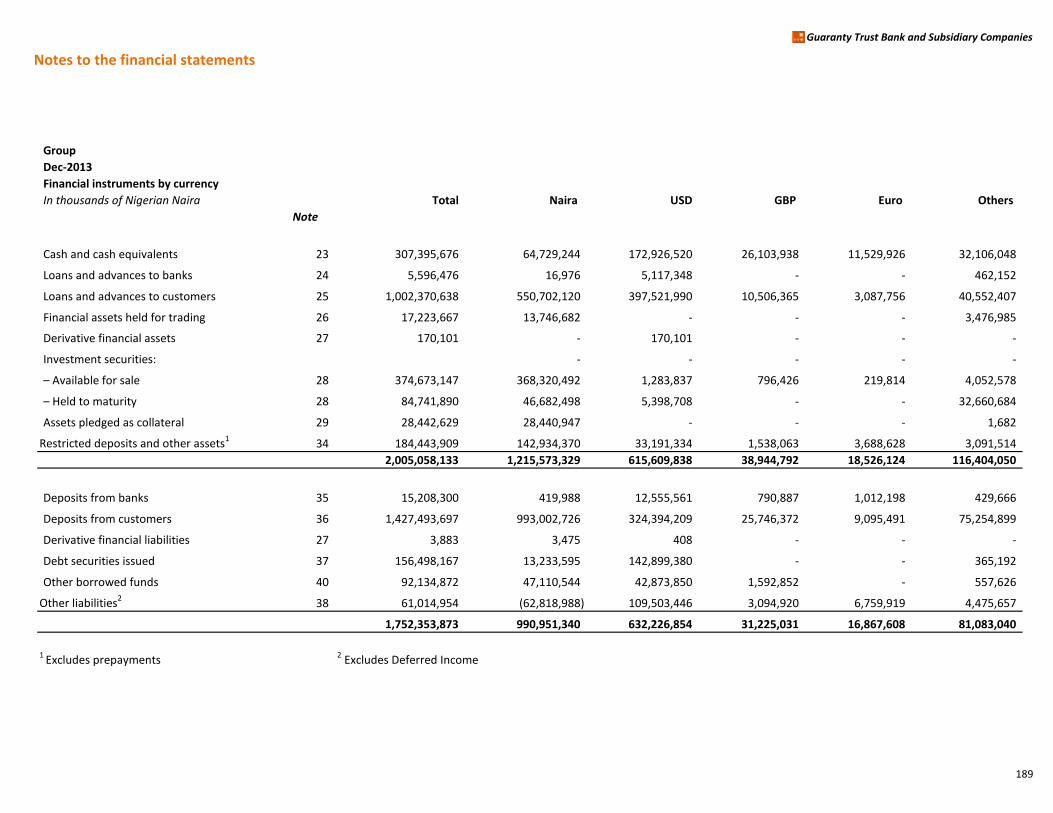
Notes to the financial statements
Guaranty Trust Bank and Subsidiary Companies
Group
Dec-2013
Financial instruments by currency
In thousands of Nigerian Naira Total Naira USD GBP Euro Others
Note
Cash and cash equivalents 23 307,395,676 64,729,244 172,926,520 26,103,938 11,529,926 32,106,048
Loans and advances to banks 24 5,596,476 16,976 5,117,348 - - 462,152
Loans and advances to customers 25 1,002,370,638 550,702,120 397,521,990 10,506,365 3,087,756 40,552,407
Financial assets held for trading 26 17,223,667 13,746,682 - - - 3,476,985
Derivative financial assets 27 170,101 - 170,101 - - -
Investment securities: - - - - -
– Available for sale 28 374,673,147 368,320,492 1,283,837 796,426 219,814 4,052,578
– Held to maturity 28 84,741,890 46,682,498 5,398,708 - - 32,660,684
Assets pledged as collateral 29 28,442,629 28,440,947 - - - 1,682
Restricted deposits and other assets1 34 184,443,909 142,934,370 33,191,334 1,538,063 3,688,628 3,091,514
2,005,058,133 1,215,573,329 615,609,838 38,944,792 18,526,124 116,404,050
Deposits from banks 35 15,208,300 419,988 12,555,561 790,887 1,012,198 429,666
Deposits from customers 36 1,427,493,697 993,002,726 324,394,209 25,746,372 9,095,491 75,254,899
Derivative financial liabilities 27 3,883 3,475 408 - - -
Debt securities issued 37 156,498,167 13,233,595 142,899,380 - - 365,192
Other borrowed funds 40 92,134,872 47,110,544 42,873,850 1,592,852 - 557,626
Other liabilities238 61,014,954 (62,818,988) 109,503,446 3,094,920 6,759,919 4,475,657
1,752,353,873 990,951,340 632,226,854 31,225,031 16,867,608 81,083,040
1 Excludes prepayments 2 Excludes Deferred Income
189
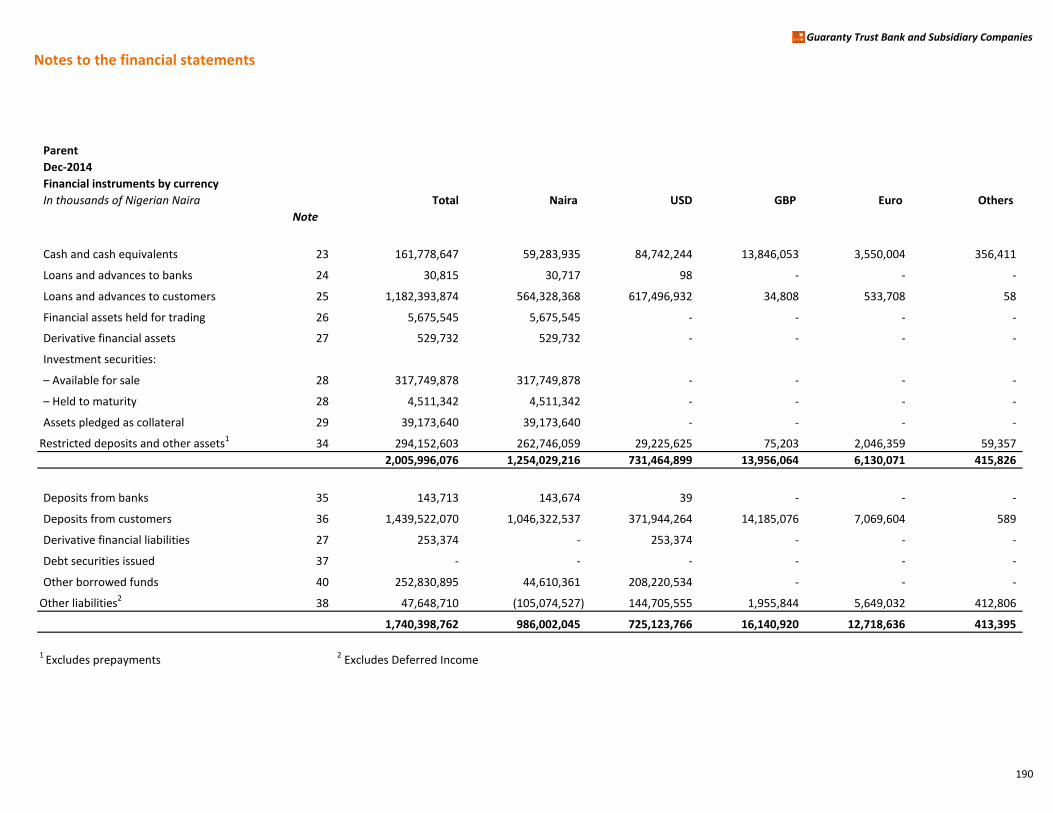
Notes to the financial statements
Guaranty Trust Bank and Subsidiary Companies
Parent
Dec-2014
Financial instruments by currency
In thousands of Nigerian Naira Total Naira USD GBP Euro Others
Note
Cash and cash equivalents 23 161,778,647 59,283,935 84,742,244 13,846,053 3,550,004 356,411
Loans and advances to banks 24 30,815 30,717 98 - - -
Loans and advances to customers 25 1,182,393,874 564,328,368 617,496,932 34,808 533,708 58
Financial assets held for trading 26 5,675,545 5,675,545 - - - -
Derivative financial assets 27 529,732 529,732 - - - -
Investment securities:
– Available for sale 28 317,749,878 317,749,878 - - - -
– Held to maturity 28 4,511,342 4,511,342 - - - -
Assets pledged as collateral 29 39,173,640 39,173,640 - - - -
Restricted deposits and other assets1 34 294,152,603 262,746,059 29,225,625 75,203 2,046,359 59,357
2,005,996,076 1,254,029,216 731,464,899 13,956,064 6,130,071 415,826
Deposits from banks 35 143,713 143,674 39 - - -
Deposits from customers 36 1,439,522,070 1,046,322,537 371,944,264 14,185,076 7,069,604 589
Derivative financial liabilities 27 253,374 - 253,374 - - -
Debt securities issued 37 - - - - - -
Other borrowed funds 40 252,830,895 44,610,361 208,220,534 - - -
Other liabilities238 47,648,710 (105,074,527) 144,705,555 1,955,844 5,649,032 412,806
1,740,398,762 986,002,045 725,123,766 16,140,920 12,718,636 413,395
1 Excludes prepayments 2 Excludes Deferred Income
190
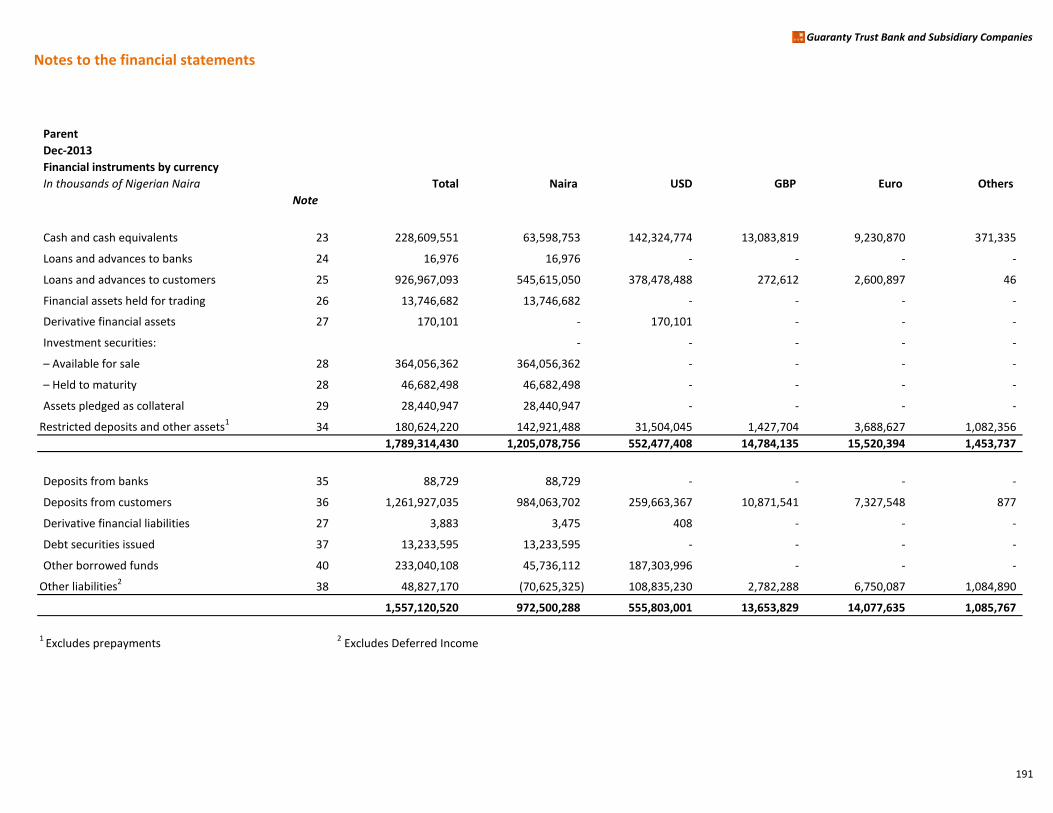
Notes to the financial statements
Guaranty Trust Bank and Subsidiary Companies
Parent
Dec-2013
Financial instruments by currency
In thousands of Nigerian Naira Total Naira USD GBP Euro Others
Note
Cash and cash equivalents 23 228,609,551 63,598,753 142,324,774 13,083,819 9,230,870 371,335
Loans and advances to banks 24 16,976 16,976 - - - -
Loans and advances to customers 25 926,967,093 545,615,050 378,478,488 272,612 2,600,897 46
Financial assets held for trading 26 13,746,682 13,746,682 - - - -
Derivative financial assets 27 170,101 - 170,101 - - -
Investment securities: - - - - -
– Available for sale 28 364,056,362 364,056,362 - - - -
– Held to maturity 28 46,682,498 46,682,498 - - - -
Assets pledged as collateral 29 28,440,947 28,440,947 - - - -
Restricted deposits and other assets1 34 180,624,220 142,921,488 31,504,045 1,427,704 3,688,627 1,082,356
1,789,314,430 1,205,078,756 552,477,408 14,784,135 15,520,394 1,453,737
Deposits from banks 35 88,729 88,729 - - - -
Deposits from customers 36 1,261,927,035 984,063,702 259,663,367 10,871,541 7,327,548 877
Derivative financial liabilities 27 3,883 3,475 408 - - -
Debt securities issued 37 13,233,595 13,233,595 - - - -
Other borrowed funds 40 233,040,108 45,736,112 187,303,996 - - -
Other liabilities238 48,827,170 (70,625,325) 108,835,230 2,782,288 6,750,087 1,084,890
1,557,120,520 972,500,288 555,803,001 13,653,829 14,077,635 1,085,767
1 Excludes prepayments 2 Excludes Deferred Income
191
NOTES TO THE FINANCIAL STATEMENT Guaranty Trust Bank and Subsidiary Companies
192
5. Capital management and other risks
(a) Regulatory capital
The Group’s lead regulator, the Central Bank of Nigeria (CBN), sets and monitors capital requirements for the Bank. The parent company and individual banking operations are directly supervised by the Central Bank of Nigeria (CBN) and the respective regulatory authorities in the countries in which the subsidiary banking operations are domiciled.
During the year under review, CBN directed all Nigerian banks and banking groups to commence full adoption of Basel II by October 1, 2014. To this end, the Bank’s Capital Adequacy Ratio (CAR) has been calculated in line with Basel II.
(b) Capital Adequacy Position in line with Basel II Accord
The International Convergence of Capital Measurement and Capital Standards: a Revised Framework, popularly known as the Basel II Framework was introduced in 2004 as a new set of international standards and best practices that define the minimum capital requirements for internationally active banks. The Basel II framework stipulates a minimum level of capital that banks must maintain to ensure that they can meet their obligations, cover unexpected losses; and can, very importantly, promote public confidence.
Basel II is a three-pronged approach relying on three Pillars -Minimum Capital Requirements (Pillar 1), Supervisory Review Process (Pillar 2) and Market Discipline (Pillar 3).
Pillar 1 Minimum Capital Requirements: It prescribes the capital allocation methodology against the core traditional credit, market and operational risks to ensure these are adequately measured and that banks have adequate capital to mitigate these risks.
Pillar 2 Supervisory Review: It requires banks to establish a risk management framework to identify, assess and manage major risks inherent in the institution and allocate adequate capital against those risks. It emphasizes that supervisors should be able to evaluate the soundness of these assessments.
Pillar 3 Market Discipline: It sets out to encourage market discipline by requiring a number of disclosure requirements in respect of a bank’s risk exposures, risk assessment process and capital adequacy.
The CBN specifies approaches for quantifying the risk weighted assets for credit, market and operational risk for the purpose of determining regulatory capital. Although the computations are consistent with the requirements of Pillar 1 Basel II Accord, certain sections have been adjusted to reflect the peculiarities of the Nigerian environment. In compliance with CBN, the Bank adopted the Standardized Approach (SA) in determining capital charge for Credit Risk and Market Risk while capital charge for Operational Risk was determined using the Basic Indicator Approach (BIA).
Pillar 1 focuses mainly on CAR, also known as Capital to Risk (Weighted) Assets Ratio (CRAR). This is the ratio of a bank’s capital to its risk. CBN requires the minimum requirement of 10% or 15% of Capital to risk weighted assets be maintained by Nigerian banks or banking groups with regional/national license and international banking license respectively.
NOTES TO THE FINANCIAL STATEMENT Guaranty Trust Bank and Subsidiary Companies
193
CAR is measured as: Total Capital
------------------------------------------------------------------------------------------------------------------- (Credit Risk Weighted Assets + Market Risk Weighted Assets + Operational Risk Weighted Assets)
The Bank’s regulatory capital is analysed into two tiers:
Tier 1 capital includes ordinary share capital, share premium, retained earnings, statutory reserves, and other reserves excluding regulatory reserves. Intangible assets and investments in subsidiaries were also deducted from Tier I capital for capital adequacy purposes.
Tier 2 capital comprises Fair Value Reserves.
The Bank and its individually regulated operations have complied with all externally imposed capital requirements throughout the period. There have been no material changes in the Bank’s management of capital during the period.
Year under review
A fundamental part of the Bank’s overall business strategy is its sound capital management practices. It adopts a capital planning process that ensures that regulatory capital remains within approved ranges or above target levels across economic and business cycles. The Bank is appropriately capitalized under normal and severe scenarios as well as a range of stress events.
Stress-testing models are used to gauge vulnerability of the bank to exceptional yet possible events. The result of stress-testing reveals the minimum capital requirements of the bank in the event that unforeseen negative events crystallize. The critical objective underpinning the stress-testing exercise is to identify as early as possible, any shortfall in capital requirements of the Bank and take corrective actions which may be direct or indirect.
Throughout the year under review, the Bank operated above its targeted capitalization range and well over the CBN-mandated regulatory minimum of 15% for international banks. As at December 31, 2014, the Bank’s capital adequacy ratio was 21.40% (December 31, 2013- 23.91%).
The following table shows the composition of regulatory capital and risk weighted assets for the Bank:

Notes to the financial statements
Guaranty Trust Bank and Subsidiary Companies
Capital adequacy ratio
Bank
In thousands of Nigerian Naira Note Dec-2014 Dec-2013
Tier 1 capital
Share capital 41 14,715,590 14,715,590
Share premium 41 123,471,114 123,471,114
Retained profits 58,442,378 55,079,117
Statutory Reserve 140,386,849 112,357,368
SMEEIS Reserve 4,232,478 4,232,478
Tier 1 Sub-Total 341,248,409 309,855,667
Less Regulatory deductions :
Other intangible assets 32 (2,417,700) (2,256,768)
100% of investments in unconsolidated Banking and 30 (40,130,284) (40,130,284)
financial subsidiary/associate companies.
Net Total Tier 1 Capital (A) 298,700,425 267,468,615
Tier 2 capital
Fair Value Reserves (67,139) 2,890,616
Net Total Tier 2 Capital (B) (67,139) 2,890,616
Total Qualifying Capital (C= A+B) 298,633,286 270,359,231
Composition Of Risk-Weighted Assets
Risk-Weighted Amount For Credit Risk 1,088,435,493 936,357,961
Risk-Weighted Amount For Operational Risk 290,901,833 183,145,013
Risk-Weighted Amount For Market Risk 16,324,984 11,134,356
Aggregate Risk-Weighted Assets 1,395,662,310 1,130,637,330
Total Risk-Weighted Capital Ratio 21.40% 23.91%
Tier 1 Risk-Based Capital Ratio 21.40% 23.66%
194

NOTES TO THE FINANCIAL STATEMENT Guaranty Trust Bank and Subsidiary Companies
195
(c) Capital allocation
The allocation of capital between specific operations and activities is, to a large extent, driven by optimization of the return achieved on the capital allocated. The amount of capital allocated to each operation or activity is based primarily upon the regulatory capital, but in some cases, the regulatory requirements do not reflect fully the varying degree of risk associated with different activities. In such cases, the capital requirements may be flexed to reflect differing risk profiles, subject to the overall level of capital to support a particular operation or activity not falling below the minimum required for regulatory purposes. The process of allocating capital to specific operations and activities is undertaken independently of those responsible for the operation, by the Group Enterprise Risk Management Division, and is subject to review by the Group Credit Committee or ALMAC as appropriate.
Although maximisation of the return on risk-adjusted capital is the principal basis used in determining how capital is allocated within the Group to particular operations or activities, it is not the sole basis used for decision making. Consideration is also given to synergies with other operations and activities, the availability of management and other resources, and the fit of the activity with the Group’s longer term strategic objectives. The Group’s policies in respect of capital management and allocation are reviewed regularly by the Board of Directors.
6. Use of estimates and judgments
These disclosures supplement the commentary on financial risk management (see note 4). (a) Key sources of estimation uncertainty
Allowances for credit losses Assets accounted for at amortised cost are evaluated for impairment on a basis described in accounting policy 3b (j)(viii). The specific counterparty component of the total allowances for impairment applies to claims evaluated individually for impairment and is based upon management’s best estimate of the present value of the cash flows that are expected to be received. In estimating these cash flows, management makes judgements about a counter party’s financial situation and the net realisable value of any underlying collateral. Each impaired asset is assessed on its merits, and the workout strategy and estimate of cash flows considered recoverable are independently approved by the Credit Risk function.
Collectively assessed impairment allowances cover credit losses inherent in portfolios of loans and advances and held to maturity investment securities with similar economic characteristics when there is objective evidence to suggest that they contain impaired loans and advances and held to maturity investment securities, but the individual impaired items cannot yet be identified. A component of collectively assessed allowances is for country risks. In assessing the need for collective loan loss allowances, management considers factors such as credit quality, portfolio size, concentrations, and economic factors. In order to estimate the required allowance, assumptions are made to define the way inherent losses are modelled and to determine the required input parameters, based on historical experience and current economic conditions. The accuracy of the allowances depends on how well future cash flows for specific counterparty allowances and the model assumptions and parameters used in determining collective allowances are estimated. Please refer to page 186 for sensitivity analysis of the exposure at default to changes to the EP, LGD and PD. Determining fair values The determination of fair value for financial assets and liabilities for which there is no observable market price requires the use of valuation techniques as described in accounting policy 3b (j)(vii). For financial instruments that
NOTES TO THE FINANCIAL STATEMENT Guaranty Trust Bank and Subsidiary Companies
196
trade infrequently and have little price transparency, fair value is less objective, and requires varying degrees of judgement depending on liquidity, concentration, uncertainty of market factors, pricing assumptions and other risks affecting the specific instrument.
(b) Critical accounting judgements in applying the Group’s accounting policies
Critical accounting judgements made in applying the Group’s accounting policies include:
Financial asset and liability classification The Group’s accounting policies provide scope for assets and liabilities to be designated on inception into different accounting categories in certain circumstances: 1. In classifying financial assets or liabilities as “trading”, the Group has determined that it meets the
description of trading assets and liabilities set out in accounting policy 3b(j)(ii). 2. In designating financial assets or liabilities as available for sale, the Group has determined that it has met one
of the criteria for this designation set out in accounting policy 3b (j)(iib). 3. In classifying financial assets as held-to-maturity, the Group has determined that it has both the positive
intention and ability to hold the assets until their maturity date as required by accounting policy 3b (j)(iic). Details of the Group’s classification of financial assets and liabilities are given in note 8 and sensitivity analysis are as stated on page 169. Depreciation and carrying value of property and equipment The estimation of the useful lives of assets is based on management’s judgement. Any material adjustment to the estimated useful lives of items of property and equipment will have an impact on the carrying value of these items. Determination of impairment of property and equipment, and intangible assets Management is required to make judgements concerning the cause, timing and amount of impairment. In the identification of impairment indicators, management considers the impact of changes in current competitive conditions, cost of capital, availability of funding, technological obsolescence, discontinuance of services and other circumstances that could indicate that impairment exists. The Group applies the impairment assessment to its separate cash generating units. This requires management to make significant judgements and estimates concerning the existence of impairment indicators, separate cash generating units, remaining useful lives of assets, projected cash flows and net realisable values. Management’s judgement is also required when assessing whether a previously recognised impairment loss should be reversed.
Defined benefits plan The present value of the retirement benefit obligations depends on a number of factors that are determined on an actuarial basis using a number of assumptions. Any changes in these assumptions will impact the carrying amount of pension obligations. The assumptions used in determining the net cost (income) for pensions include the discount rate. The Group determines the appropriate discount rate at the end of each year. This is the interest rate that should be used to determine the present value of estimated future cash outflows expected to be required to settle the pension obligations. In determining the appropriate discount rate, the Group considers the market yields on Government Bonds of medium duration as compiled by the Debt Management Organisation that are denominated in the currency in which the benefits will be paid and that have terms to maturity approximating the terms of the related pension liability. Other key assumptions for pension obligations are based in part on current market conditions.
NOTES TO THE FINANCIAL STATEMENT Guaranty Trust Bank and Subsidiary Companies
197
Impairment of available-for-sale equity investments The Group determines that available-for-sale equity investments are impaired when there has been a significant or prolonged decline in the fair value below cost. This determination of what is significant or prolonged requires judgement. In making this judgement, the Group evaluates among other factors, the volatility in share price. In addition, objective evidence of impairment may be deterioration in the financial health of the investee, industry and sector performance, changes in technology, and operational and financing cash flows. The sensitivity analysis of level 3 equity Instruments and its impact on OCI are shown in note 4(d) under market risk above. Impairment of Goodwill
The Group tests annually whether goodwill has suffered any impairment in accordance with the accounting policy in note 3(b)(o). The recoverable amounts of cash generating units have been determined based on value in use calculations. These calculations require the use of estimates. Goodwill and Goodwill Impairment testing are shown in note 32(b) below. Valuation of financial instruments The Group’s accounting policy on fair value measurements is discussed under note 3b (j)(iiib) The Group measures fair values using the following hierarchy of methods.
Level 1: Quoted market price in an active market for an identical instrument.
Level 2: Valuation techniques based on observable inputs. This category includes instruments valued using: quoted market prices in active markets for similar instruments; quoted prices for similar instruments in markets that are considered less than active; or other valuation techniques where all significant inputs are directly or indirectly observable from market data.
Level 3: This includes financial instruments, the valuation of which incorporate significant inputs for the asset or liability that is not based on observable market date (unobservable inputs). Unobservable inputs are those not readily available in an active market due to market illiquidity or complexity of the product. These inputs are generally determined based on inputs of a similar nature, historic observations on the level of the input or analytical techniques. This category includes loans and advances to banks and customers, investment securities, deposits from banks and customers, debt securities and other borrowed funds.
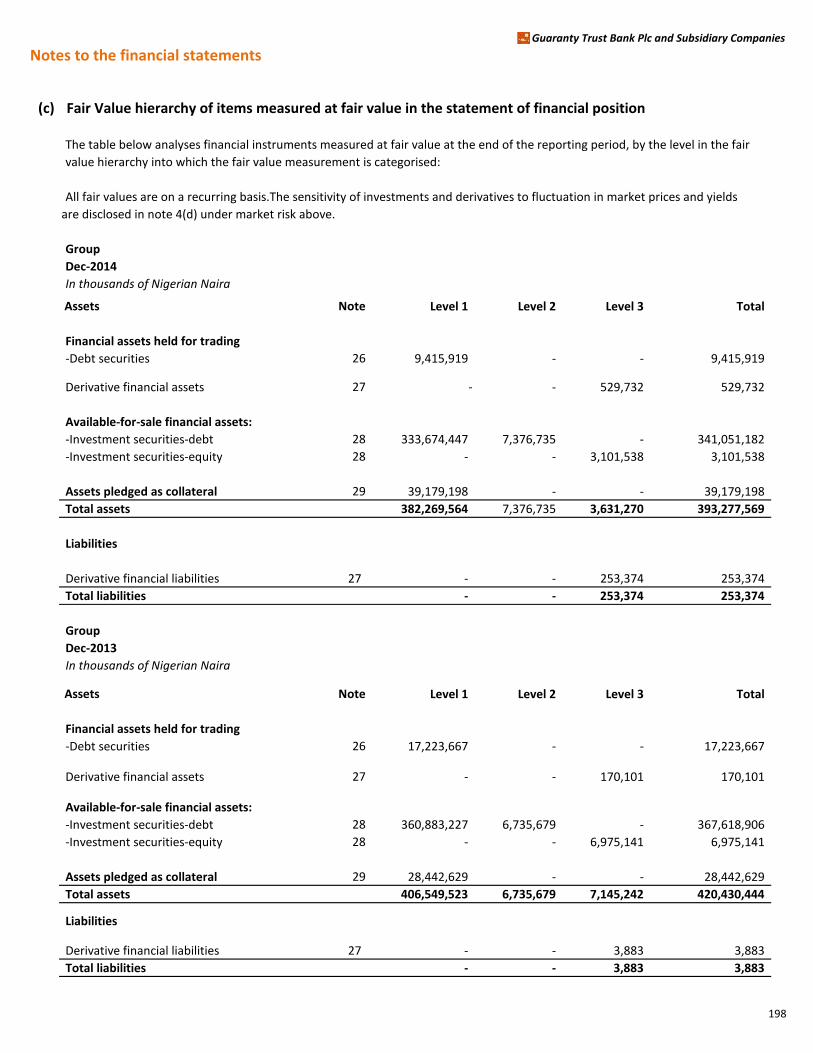
Notes to the financial statementsGuaranty Trust Bank Plc and Subsidiary Companies
(c) Fair Value hierarchy of items measured at fair value in the statement of financial position
The table below analyses financial instruments measured at fair value at the end of the reporting period, by the level in the fair
value hierarchy into which the fair value measurement is categorised:
All fair values are on a recurring basis.The sensitivity of investments and derivatives to fluctuation in market prices and yields
are disclosed in note 4(d) under market risk above.
Group
Dec-2014
In thousands of Nigerian Naira
Assets Note Level 1 Level 2 Level 3 Total
Financial assets held for trading
-Debt securities 26 9,415,919 - - 9,415,919
Derivative financial assets 27 - - 529,732 529,732
Available-for-sale financial assets:
-Investment securities-debt 28 333,674,447 7,376,735 - 341,051,182
-Investment securities-equity 28 - - 3,101,538 3,101,538
Assets pledged as collateral 29 39,179,198 - - 39,179,198
Total assets 382,269,564 7,376,735 3,631,270 393,277,569
Liabilities
Derivative financial liabilities 27 - - 253,374 253,374
Total liabilities - - 253,374 253,374
Group
Dec-2013
In thousands of Nigerian Naira
Assets Note Level 1 Level 2 Level 3 Total
Financial assets held for trading
-Debt securities 26 17,223,667 - - 17,223,667
Derivative financial assets 27 - - 170,101 170,101
Available-for-sale financial assets:
-Investment securities-debt 28 360,883,227 6,735,679 - 367,618,906
-Investment securities-equity 28 - - 6,975,141 6,975,141
Assets pledged as collateral 29 28,442,629 - - 28,442,629
Total assets 406,549,523 6,735,679 7,145,242 420,430,444
Liabilities
Derivative financial liabilities 27 - - 3,883 3,883
Total liabilities - - 3,883 3,883
198
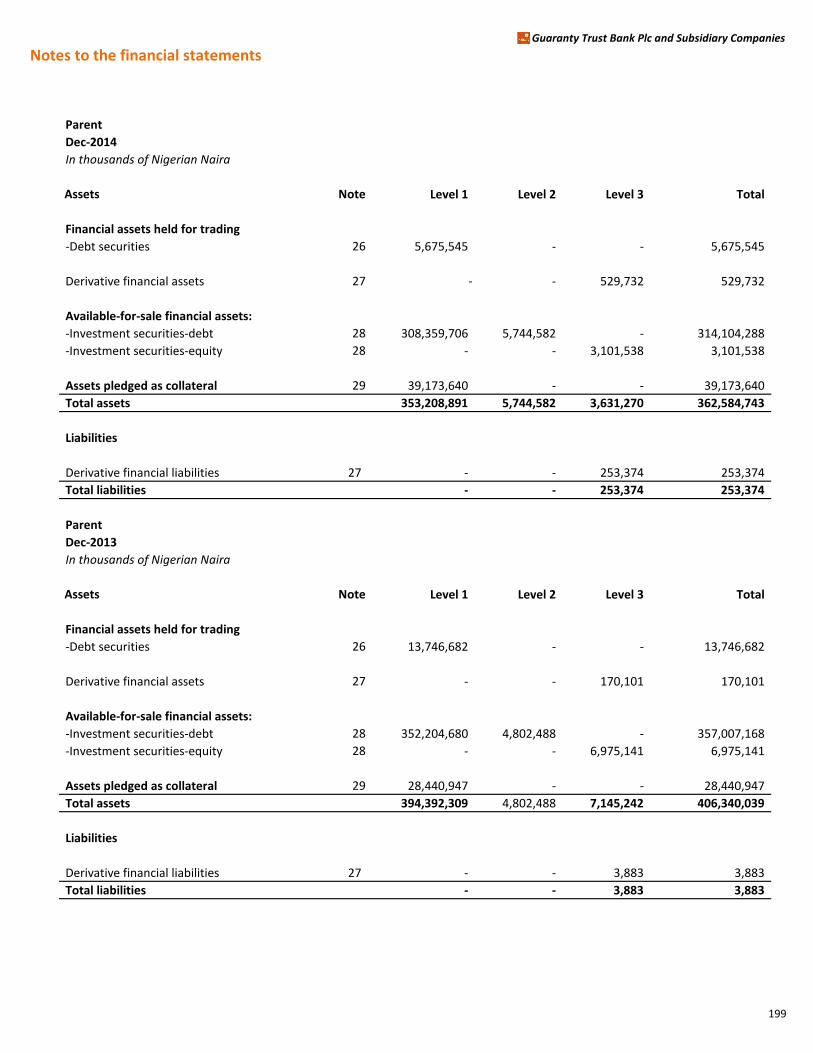
Notes to the financial statementsGuaranty Trust Bank Plc and Subsidiary Companies
Parent
Dec-2014
In thousands of Nigerian Naira
Assets Note Level 1 Level 2 Level 3 Total
Financial assets held for trading
-Debt securities 26 5,675,545 - - 5,675,545
Derivative financial assets 27 - - 529,732 529,732
Available-for-sale financial assets:
-Investment securities-debt 28 308,359,706 5,744,582 - 314,104,288
-Investment securities-equity 28 - - 3,101,538 3,101,538
Assets pledged as collateral 29 39,173,640 - - 39,173,640
Total assets 353,208,891 5,744,582 3,631,270 362,584,743
Liabilities
Derivative financial liabilities 27 - - 253,374 253,374
Total liabilities - - 253,374 253,374
Parent
Dec-2013
In thousands of Nigerian Naira
Assets Note Level 1 Level 2 Level 3 Total
Financial assets held for trading
-Debt securities 26 13,746,682 - - 13,746,682
Derivative financial assets 27 - - 170,101 170,101
Available-for-sale financial assets:
-Investment securities-debt 28 352,204,680 4,802,488 - 357,007,168
-Investment securities-equity 28 - - 6,975,141 6,975,141
Assets pledged as collateral 29 28,440,947 - - 28,440,947
Total assets 394,392,309 4,802,488 7,145,242 406,340,039
Liabilities
Derivative financial liabilities 27 - - 3,883 3,883
Total liabilities - - 3,883 3,883
199

Notes to the financial statementsGuaranty Trust Bank Plc and Subsidiary Companies
Reconciliation of Level 3 Items
-Derivative financial assets
In thousands of Nigerian Naira Group Group Parent Parent
Dec-2014 Dec-2013 Dec-2014 Dec-2013
At 1 January 170,101 - 170,101 -
Settlements (170,101) - (170,101) -
Gains and losses recognised in profit or loss 529,732 170,101 529,732 170,101
529,732 170,101 529,732 170,101
There was no transfer into and out of Level 3 during the period.
Reconciliation of Level 3 Items
-Derivative financial liabilities
In thousands of Nigerian Naira Group Group Parent Parent
Dec-2014 Dec-2013 Dec-2014 Dec-2013
At 1 January 3,883 - 3,883 -
Settlements (3,883) - (3,883) -
Gains and losses recognised in profit or loss 253,374 3,883 253,374 3,883
253,374 3,883 253,374 3,883
There was no transfer into and out of Level 3 during the period.
The fair value of derivative financial assets and liabilities is calculated as the present value of the estimated future
cash flows based on a discount rate of 0.2556%
Reconciliation of Level 3 Items
-Available for sale financial assets
In thousands of Nigerian Naira Group Group Parent Parent
Dec-2014 Dec-2013 Dec-2014 Dec-2013
At 1 January 6,975,141 - 6,975,141 -
Total gains or (losses)
in Profit and Loss (538,016) - (538,016) -
in OCI (2,831,488) 3,964,232 (2,831,488) 3,964,232
Cost of Asset Additions / (Disposal) (34,100) 3,010,909 (34,100) 3,010,909
Reclassification to unquoted equity at cost (469,999) - (469,999) -
3,101,538 6,975,141 3,101,538 6,975,141
The Group reclassified investment in TerraKulture Limited to Unquoted equity Investments at cost due to non-availability
of financial data. Consequently, the Group reversed fair value gain of N359,355,000. The carrying value at the point of
reclassification was in the sum of N829,354,000.
Sensiitivity of financial instruments to changes in market variables are disclosed in note 4(i)(vii) under market risk above
200
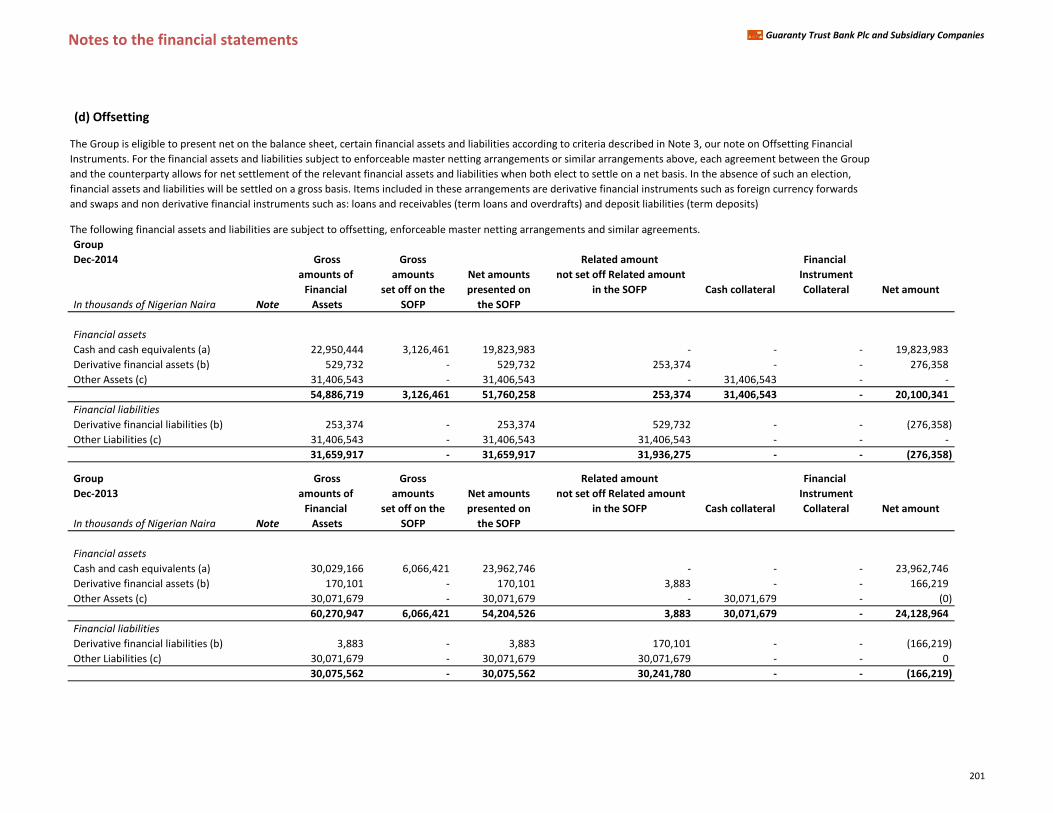
Notes to the financial statements Guaranty Trust Bank Plc and Subsidiary Companies
(d) Offsetting
The Group is eligible to present net on the balance sheet, certain financial assets and liabilities according to criteria described in Note 3, our note on Offsetting Financial
Instruments. For the financial assets and liabilities subject to enforceable master netting arrangements or similar arrangements above, each agreement between the Group
and the counterparty allows for net settlement of the relevant financial assets and liabilities when both elect to settle on a net basis. In the absence of such an election,
financial assets and liabilities will be settled on a gross basis. Items included in these arrangements are derivative financial instruments such as foreign currency forwards
and swaps and non derivative financial instruments such as: loans and receivables (term loans and overdrafts) and deposit liabilities (term deposits)
The following financial assets and liabilities are subject to offsetting, enforceable master netting arrangements and similar agreements.
Group
Dec-2014 Gross Gross Related amount Financial
amounts of amounts Net amounts not set off Related amount Instrument
Financial set off on the presented on in the SOFP Cash collateral Collateral Net amount
In thousands of Nigerian Naira Note Assets SOFP the SOFP
Financial assets
Cash and cash equivalents (a) 22,950,444 3,126,461 19,823,983 - - - 19,823,983
Derivative financial assets (b) 529,732 - 529,732 253,374 - - 276,358
Other Assets (c) 31,406,543 - 31,406,543 - 31,406,543 - -
54,886,719 3,126,461 51,760,258 253,374 31,406,543 - 20,100,341
Financial liabilities
Derivative financial liabilities (b) 253,374 - 253,374 529,732 - - (276,358)
Other Liabilities (c) 31,406,543 - 31,406,543 31,406,543 - - -
31,659,917 - 31,659,917 31,936,275 - - (276,358)
Group Gross Gross Related amount Financial
Dec-2013 amounts of amounts Net amounts not set off Related amount Instrument
Financial set off on the presented on in the SOFP Cash collateral Collateral Net amount
In thousands of Nigerian Naira Note Assets SOFP the SOFP
Financial assets
Cash and cash equivalents (a) 30,029,166 6,066,421 23,962,746 - - - 23,962,746
Derivative financial assets (b) 170,101 - 170,101 3,883 - - 166,219
Other Assets (c) 30,071,679 - 30,071,679 - 30,071,679 - (0)
60,270,947 6,066,421 54,204,526 3,883 30,071,679 - 24,128,964
Financial liabilities
Derivative financial liabilities (b) 3,883 - 3,883 170,101 - - (166,219)
Other Liabilities (c) 30,071,679 - 30,071,679 30,071,679 - - 0
30,075,562 - 30,075,562 30,241,780 - - (166,219)
201

Notes to the financial statements Guaranty Trust Bank Plc and Subsidiary Companies
Parent
Dec-2014 Gross Gross Related amount Financial
amounts of amounts Net amounts not set off Related amount Instrument
Financial set off on the presented on in the SOFP Cash collateral Collateral Net amount
In thousands of Nigerian Naira Note Assets SOFP the SOFP
Financial assets
Cash and cash equivalents (a) 22,950,444 3,126,461 19,823,983 - - - 19,823,983
Derivative financial assets (b) 529,732 - 529,732 253,374 - - 276,358
Other Assets (c) 31,406,543 - 31,406,543 31,406,543 -
54,886,719 3,126,461 51,760,258 253,374 31,406,543 - 20,100,341
Financial liabilities
Derivative financial liabilities (b) 253,374 253,374 529,732 - - (276,358)
Other Liabilities (c) 31,406,543 31,406,543 31,406,543 - - -
31,659,917 - 31,659,917 31,936,275 - - (276,358)
Parent
Dec-2013 Gross Gross Related amount Financial
amounts of amounts Net amounts not set off Related amount Instrument
Financial set off on the presented on in the SOFP Cash collateral Collateral Net amount
In thousands of Nigerian Naira Note Assets SOFP the SOFP
Financial assets
Cash and cash equivalents (a) 30,029,166 6,066,421 23,962,746 - - - 23,962,746
Derivative financial assets (b) 170,101 - 170,101 3,883 - - 166,219
Other Assets (c) 30,071,679 - 30,071,679 30,071,679 (0)
60,270,947 6,066,421 54,204,526 3,883 30,071,679 - 24,128,964
Financial liabilities
Derivative financial liabilities (b) 3,883 3,883 170,101 - - (166,219)
Other Liabilities (c) 30,071,679 30,071,679 30,071,679 - - 0
30,075,562 - 30,075,562 30,241,780 - - (166,219)
(a) Standard terms of clearing in Nigeria include provisions allowing net settlements of payments in the normal course of business.
(b) GTBank Plc derivatives are subject to an enforceable master netting arrangement in the form of CBN regulated agreements with a derivative counterparty. Under the terms of the regulations
offsetting of FX derivative contracts is permitted only in the event that the counterparty has indicated that it will not meet its obligations. Due to changes in market prices from the transcation
date to December 31, 2014 the fair value of the derivative asset increased to N 529,732,000 while that of the derivative liablility increased to N 253,374,000.
(c) Certain customers provide monies to the Bank to serve as cash collateral for their LC transactions. The Bank simultaneously increases its balances with the correspondent banks
to reflect this. As such, the Bank intends to realise the asset and settle the liability simultaneously.
202
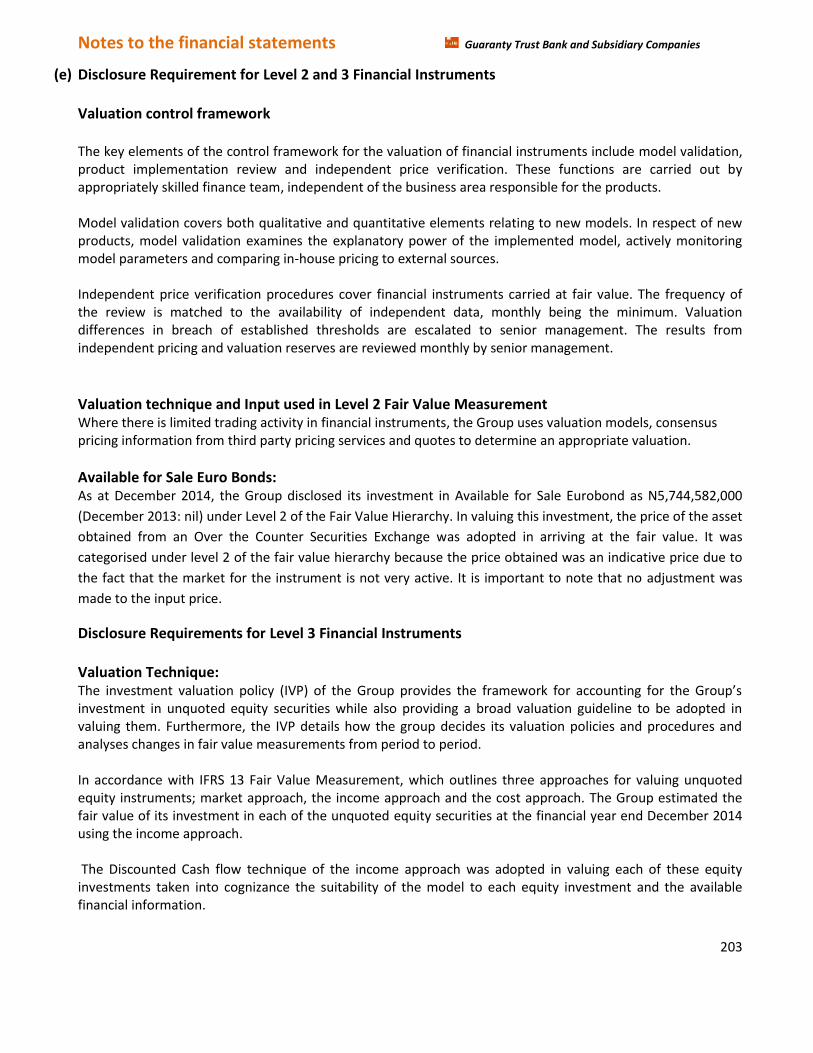
Notes to the financial statements Guaranty Trust Bank and Subsidiary Companies
203
(e) Disclosure Requirement for Level 2 and 3 Financial Instruments Valuation control framework The key elements of the control framework for the valuation of financial instruments include model validation, product implementation review and independent price verification. These functions are carried out by appropriately skilled finance team, independent of the business area responsible for the products. Model validation covers both qualitative and quantitative elements relating to new models. In respect of new products, model validation examines the explanatory power of the implemented model, actively monitoring model parameters and comparing in-house pricing to external sources. Independent price verification procedures cover financial instruments carried at fair value. The frequency of the review is matched to the availability of independent data, monthly being the minimum. Valuation differences in breach of established thresholds are escalated to senior management. The results from independent pricing and valuation reserves are reviewed monthly by senior management.
Valuation technique and Input used in Level 2 Fair Value Measurement Where there is limited trading activity in financial instruments, the Group uses valuation models, consensus pricing information from third party pricing services and quotes to determine an appropriate valuation.
Available for Sale Euro Bonds: As at December 2014, the Group disclosed its investment in Available for Sale Eurobond as N5,744,582,000
(December 2013: nil) under Level 2 of the Fair Value Hierarchy. In valuing this investment, the price of the asset
obtained from an Over the Counter Securities Exchange was adopted in arriving at the fair value. It was
categorised under level 2 of the fair value hierarchy because the price obtained was an indicative price due to
the fact that the market for the instrument is not very active. It is important to note that no adjustment was
made to the input price.
Disclosure Requirements for Level 3 Financial Instruments Valuation Technique: The investment valuation policy (IVP) of the Group provides the framework for accounting for the Group’s investment in unquoted equity securities while also providing a broad valuation guideline to be adopted in valuing them. Furthermore, the IVP details how the group decides its valuation policies and procedures and analyses changes in fair value measurements from period to period. In accordance with IFRS 13 Fair Value Measurement, which outlines three approaches for valuing unquoted equity instruments; market approach, the income approach and the cost approach. The Group estimated the fair value of its investment in each of the unquoted equity securities at the financial year end December 2014 using the income approach. The Discounted Cash flow technique of the income approach was adopted in valuing each of these equity investments taken into cognizance the suitability of the model to each equity investment and the available financial information.
Notes to the financial statements Guaranty Trust Bank and Subsidiary Companies
204
Description of Valuation Methodology and inputs: Discounted Cash flow Technique (DCF) The fair value of the other unquoted equity securities was derived using the Discounted Cash flow Technique. The steps involved in estimating the fair value of the Group’s investment in each of the investees (i.e. unquoted equity securities) are as follows: Step 1: A five-year forecast of the FCFF for each of the equity investments was made (see (a) below for the
definition, explanation and derivation of FCFF). Step 2: The yearly FCFF forecasts were discounted to present value using the company’s WACC. (See (b) below
for the definition, explanation and derivation of WACC).
Step 3: The terminal value at year five was estimated by dividing the compounded (with ‘g’) year five FCFF by
the capitalization rate (please see (c) below) Step 4: The terminal value was discounted to present value using the company’s WACC Step 5: The firm value was obtained by adding the present value of the five-year FCFF obtained in step (2)
above to the present value of terminal value obtained in step (4) above. Step 6: The equity value of the firm was obtained by deducting the value of the debt of the company from the
firm value obtained in step (5) above (i.e. Firm value minus market value of debt = Equity value) Step 7: The equity value per share was obtained by dividing the Equity value obtained in step (6) above by the
number of shares outstanding in the company. Step 8: The fair value of the group’s investment in each of the relevant unquoted equity securities was derived
by multiplying the number of the Groups’ shares in the investee by the value per share obtained in step (7) above.
a. Free Cash flow to the Firm (FCFF): A measure of financial performance that expresses the net amount of cash that is generated for the
firm, consisting of expenses, taxes and changes in net working capital and investments. Free cash flow
to the firm is the cash available to all investors, both equity and debt holders.
FCFF = NI + NCC + [Int x (1-tax rate)] – FCInv – WCInv
Where:
NI = Net Income NCC = Non Cash Charges Int = Interest T= tax rate FCI = Fixed Capital Investment WCI = Working Capital Investment
b. Weighted average Cost of Capital (WACC):
This is the average cost of both equity and debt capital used in financing a business.
WACC= {(D/D+E) x Ke} + {(E/D+E) x Kd (1-T)}
Where:
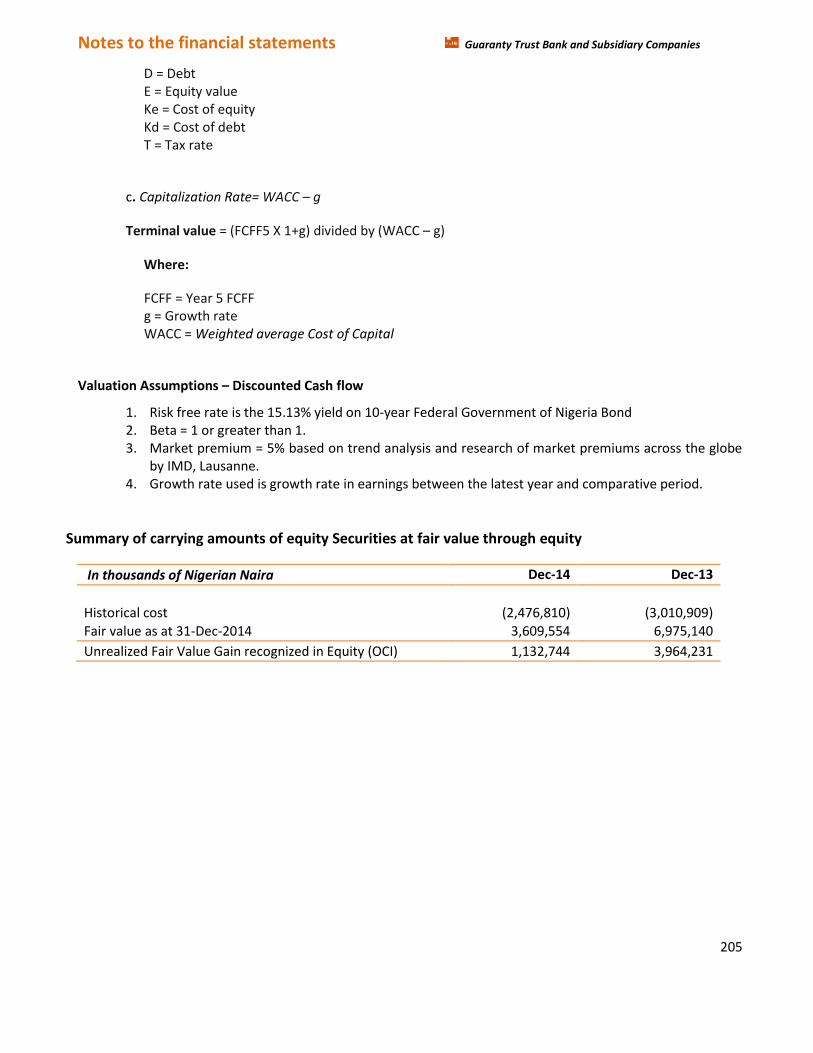
Notes to the financial statements Guaranty Trust Bank and Subsidiary Companies
205
D = Debt E = Equity value Ke = Cost of equity Kd = Cost of debt T = Tax rate
c. Capitalization Rate= WACC – g
Terminal value = (FCFF5 X 1+g) divided by (WACC – g)
Where:
FCFF = Year 5 FCFF g = Growth rate WACC = Weighted average Cost of Capital
Valuation Assumptions – Discounted Cash flow
1. Risk free rate is the 15.13% yield on 10-year Federal Government of Nigeria Bond 2. Beta = 1 or greater than 1. 3. Market premium = 5% based on trend analysis and research of market premiums across the globe
by IMD, Lausanne. 4. Growth rate used is growth rate in earnings between the latest year and comparative period.
Summary of carrying amounts of equity Securities at fair value through equity
In thousands of Nigerian Naira Dec-14 Dec-13
Historical cost (2,476,810) (3,010,909) Fair value as at 31-Dec-2014 3,609,554 6,975,140
Unrealized Fair Value Gain recognized in Equity (OCI) 1,132,744 3,964,231
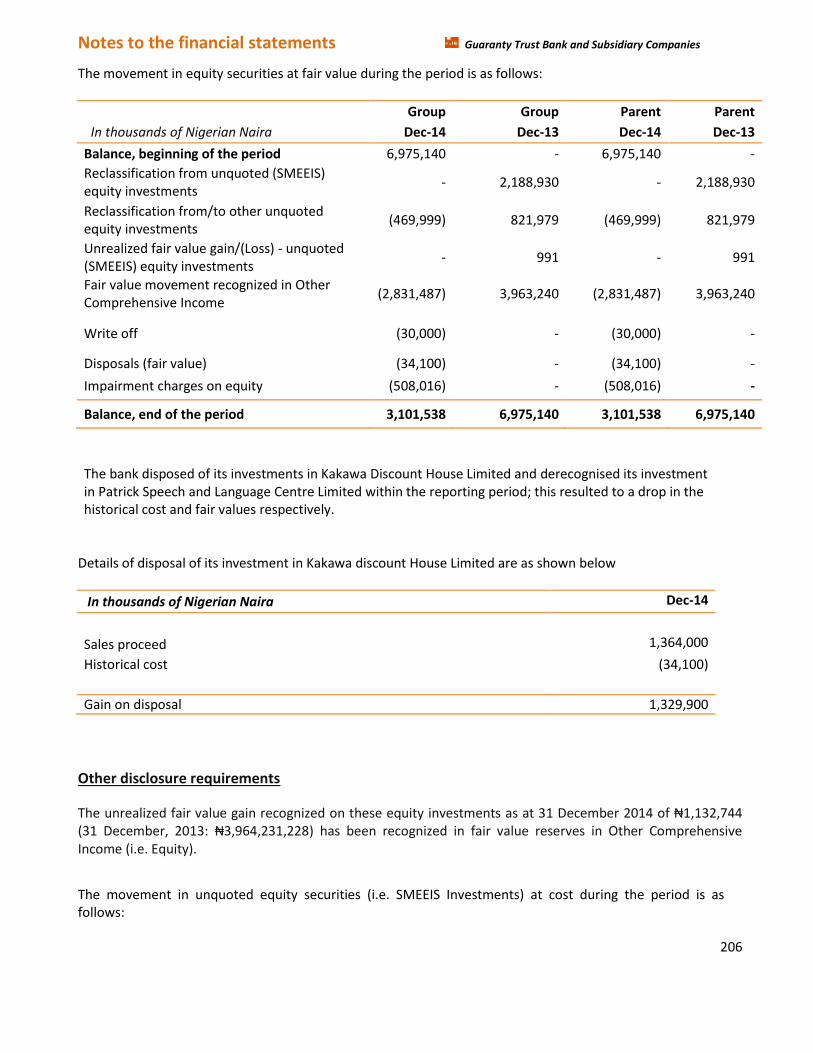
Notes to the financial statements Guaranty Trust Bank and Subsidiary Companies
206
The movement in equity securities at fair value during the period is as follows:
Group Group Parent Parent
In thousands of Nigerian Naira Dec-14 Dec-13 Dec-14 Dec-13
Balance, beginning of the period 6,975,140 - 6,975,140 -
Reclassification from unquoted (SMEEIS) equity investments
- 2,188,930 - 2,188,930
Reclassification from/to other unquoted equity investments
(469,999) 821,979 (469,999) 821,979
Unrealized fair value gain/(Loss) - unquoted (SMEEIS) equity investments
- 991 - 991
Fair value movement recognized in Other Comprehensive Income
(2,831,487) 3,963,240 (2,831,487) 3,963,240
Write off (30,000) - (30,000) -
Disposals (fair value) (34,100) - (34,100) -
Impairment charges on equity (508,016) - (508,016) -
Balance, end of the period 3,101,538 6,975,140 3,101,538 6,975,140
The bank disposed of its investments in Kakawa Discount House Limited and derecognised its investment in Patrick Speech and Language Centre Limited within the reporting period; this resulted to a drop in the historical cost and fair values respectively.
Details of disposal of its investment in Kakawa discount House Limited are as shown below
In thousands of Nigerian Naira Dec-14
Sales proceed 1,364,000
Historical cost (34,100)
Gain on disposal 1,329,900
Other disclosure requirements
The unrealized fair value gain recognized on these equity investments as at 31 December 2014 of ₦1,132,744 (31 December, 2013: ₦3,964,231,228) has been recognized in fair value reserves in Other Comprehensive Income (i.e. Equity).
The movement in unquoted equity securities (i.e. SMEEIS Investments) at cost during the period is as follows:
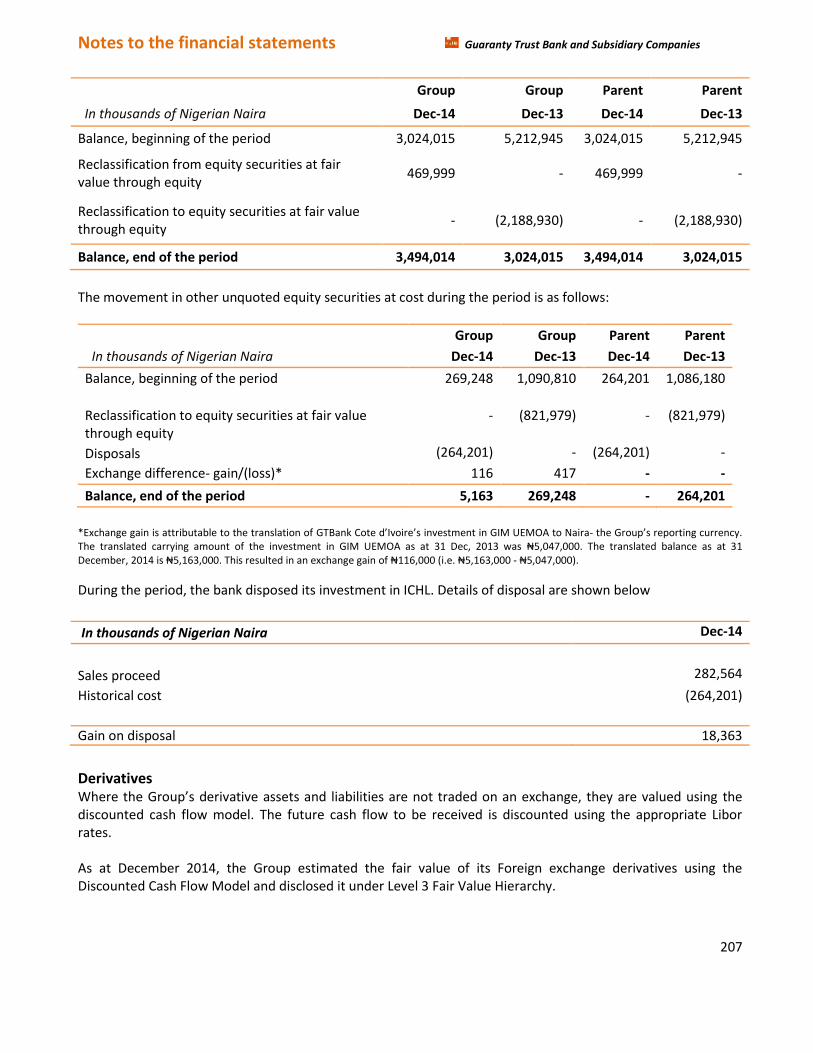
Notes to the financial statements Guaranty Trust Bank and Subsidiary Companies
207
Group Group Parent Parent
In thousands of Nigerian Naira Dec-14 Dec-13 Dec-14 Dec-13
Balance, beginning of the period 3,024,015 5,212,945 3,024,015 5,212,945
Reclassification from equity securities at fair value through equity
469,999 - 469,999 -
Reclassification to equity securities at fair value through equity
- (2,188,930) - (2,188,930)
Balance, end of the period 3,494,014 3,024,015 3,494,014 3,024,015
The movement in other unquoted equity securities at cost during the period is as follows:
Group Group Parent Parent
In thousands of Nigerian Naira Dec-14 Dec-13 Dec-14 Dec-13
Balance, beginning of the period 269,248 1,090,810 264,201 1,086,180
Reclassification to equity securities at fair value through equity
- (821,979) - (821,979)
Disposals (264,201) - (264,201) -
Exchange difference- gain/(loss)* 116 417 - -
Balance, end of the period 5,163 269,248 - 264,201
*Exchange gain is attributable to the translation of GTBank Cote d’Ivoire’s investment in GIM UEMOA to Naira- the Group’s reporting currency. The translated carrying amount of the investment in GIM UEMOA as at 31 Dec, 2013 was ₦5,047,000. The translated balance as at 31 December, 2014 is ₦5,163,000. This resulted in an exchange gain of ₦116,000 (i.e. ₦5,163,000 - ₦5,047,000).
During the period, the bank disposed its investment in ICHL. Details of disposal are shown below
In thousands of Nigerian Naira Dec-14
Sales proceed 282,564
Historical cost (264,201)
Gain on disposal 18,363
Derivatives Where the Group’s derivative assets and liabilities are not traded on an exchange, they are valued using the discounted cash flow model. The future cash flow to be received is discounted using the appropriate Libor rates. As at December 2014, the Group estimated the fair value of its Foreign exchange derivatives using the Discounted Cash Flow Model and disclosed it under Level 3 Fair Value Hierarchy.

Notes to the financial statements Guaranty Trust Bank and Subsidiary Companies
208
(f) Statement of Prudential Adjustment
In the 2014 financial year, the bank transferred the sum of N11,448,660,000 from its retained earnings to a
non-distributable regulatory risk reserve within the Statement of Changes in Equity. This transfer takes the
total regulatory risk reserve to N28,349,056,000. The stated sum represents the difference between the
Central Bank of Nigeria (CBN) recommended Provision for Loan Losses amounting to N54,326,317,000 and the
Loan Impairment allowance determined in accordance with provisions of IAS 39 amounting to
N26,058,192,569. Of the amount recommended by the Central Bank of Nigeria, N11,510,805,000 relates to 1%
General Loan Loss Provision on performing loans.
Also, N3,844,466,000 recommended by CBN for Other Known Losses was adequately provided for in the 2014
IFRS Financial Statement
The Reconciliation between the CBN Recommended provisions and that under IFRS as at Dec 2014 is as shown
in the table below:
In thousands of Nigerian Naira Reference
Specific General Total
a Loans and Advances:
Provision per CBN Prudential Guidelines 42,815,512 11,510,805 54,326,317
Impairment Allowance per IAS 39:
(Inclusive of Collective Allowance) (Note 24 & 25) 26,058,193 - 26,058,193
Amount required in Regulatory Risk Reserve2 16,757,319 11,510,805 28,268,124
b Provision for Other Known Losses:
Provision for Other Known Losses - CBN
3,844,466
Provision for Other Known Losses - IFRS
Specific Impairment For Equities (Note 28)
3,457,978
Impairment On Other Assets (Note 34)
305,556
3,763,534
Amount required in Regulatory Risk Reserve2 80,932
2Regulatory Risk Reserve refers to the difference between the Provision assessment under CBN Prudential
Guideline and impairment assessment under IFRS
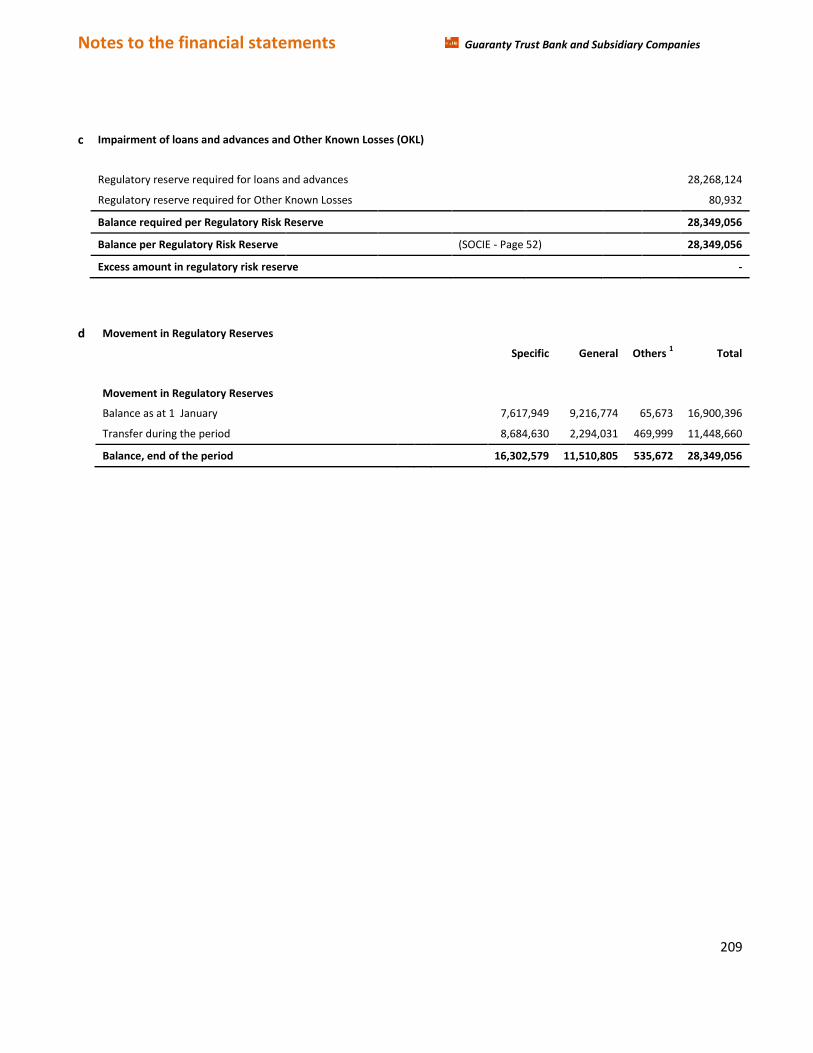
Notes to the financial statements Guaranty Trust Bank and Subsidiary Companies
209
c Impairment of loans and advances and Other Known Losses (OKL)
Regulatory reserve required for loans and advances
28,268,124
Regulatory reserve required for Other Known Losses
80,932
Balance required per Regulatory Risk Reserve 28,349,056
Balance per Regulatory Risk Reserve (SOCIE - Page 52) 28,349,056
Excess amount in regulatory risk reserve -
d Movement in Regulatory Reserves
Specific General Others 1 Total
Movement in Regulatory Reserves
Balance as at 1 January
7,617,949 9,216,774 65,673 16,900,396
Transfer during the period 8,684,630 2,294,031 469,999 11,448,660
Balance, end of the period 16,302,579 11,510,805 535,672 28,349,056
Notes to the financial statements Guaranty Trust Bank and Subsidiary Companies
210
7. Operating segments The Group has five reportable segments, as described below, which are the Group’s strategic business units.
The strategic business units offer varied products and services, and are managed separately based on the
Group’s management and internal reporting structure. For each of the strategic business units, the Executive
Management Committee reviews internal management reports on at least a quarterly basis.
. The following summary describes the operations in each of the Group’s reportable segments:
o Corporate banking – Incorporates current accounts, deposits, overdrafts, loans and other credit facilities, foreign currency and derivative products offered to very large corporate customers and blue chips.
o Commercial banking – Incorporates current accounts, deposits, overdrafts, loans and other credit facilities, foreign currency and derivative products for mid-size and fledgling corporate customers.
o Retail banking – Incorporates private banking services, private customer current accounts,
savings deposits, investment savings products, custody, credit and debit cards, consumer loans and mortgages.
o SME banking – Incorporates current accounts, deposits, overdrafts, loans and other credit
facilities, foreign currency and derivative products for small and medium-size enterprises and ventures.
o Public Sector – Incorporates current accounts, deposits, overdrafts, loans and other credit
facilities, foreign currency and derivative products for Government Ministries, Departments and Agencies.
Notes to the financial statements Guaranty Trust Bank and Subsidiary Companies
211
Information regarding the results of each reportable segment is included below. Performance is measured
based on segment profit before income tax, as included in the internal management reports that are
reviewed by the Executive Management Committee. Segment profit is used to measure performance as
management believes that such information is the most relevant in evaluating the results of certain
segments relative to other entities that operate within these industries. Inter-segment pricing is determined on
an arm’s length basis.
No single external customer accounts for 10% or more of the Group’s revenue.
The measurement policies the Group uses for segment reporting are the same as those used in its financial
statements, except that activities of Staff Investment Trust have not been consolidated in arriving at the
operating profit, assets and liabilities of the operating segment (see note 30(b)). There have been no changes
from prior periods in the measurement methods used to determine reported segment profit or loss.
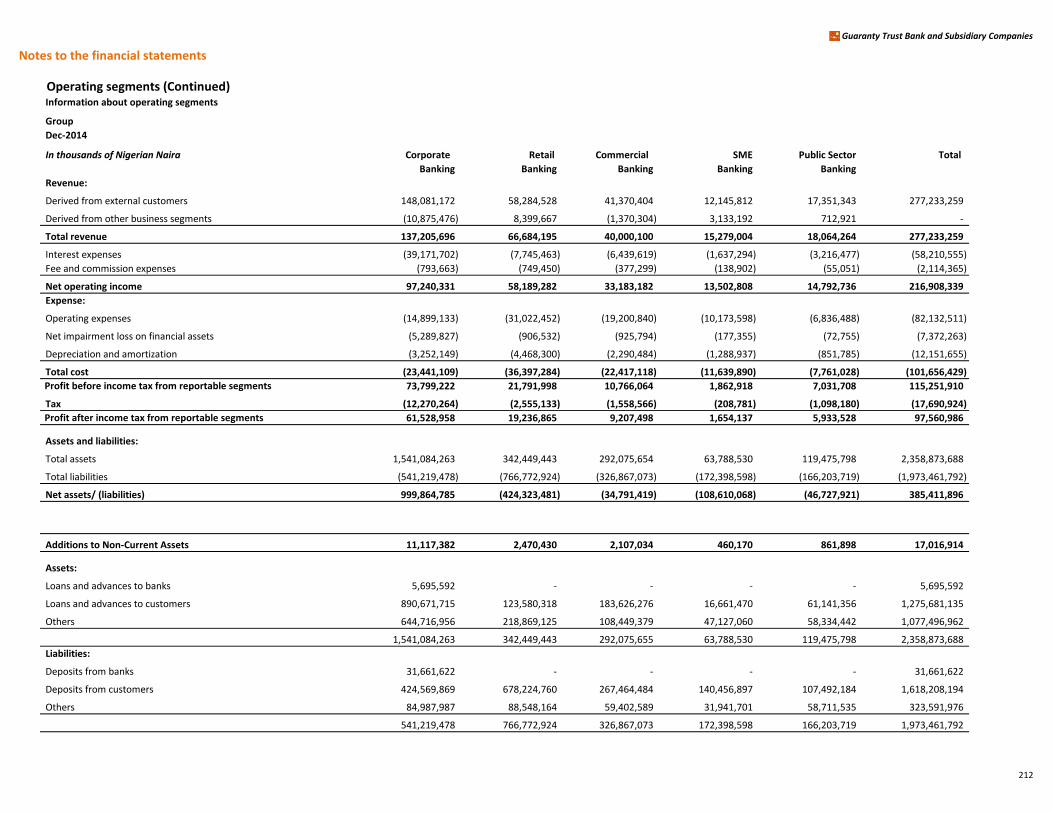
Notes to the financial statements
Guaranty Trust Bank and Subsidiary Companies
Operating segments (Continued)Information about operating segments
Group
Dec-2014
In thousands of Nigerian Naira Corporate Retail Commercial SME Public Sector Total
Banking Banking Banking Banking Banking
Revenue:
Derived from external customers 148,081,172 58,284,528 41,370,404 12,145,812 17,351,343 277,233,259
Derived from other business segments (10,875,476) 8,399,667 (1,370,304) 3,133,192 712,921 -
Total revenue 137,205,696 66,684,195 40,000,100 15,279,004 18,064,264 277,233,259
Interest expenses (39,171,702) (7,745,463) (6,439,619) (1,637,294) (3,216,477) (58,210,555)
Fee and commission expenses (793,663) (749,450) (377,299) (138,902) (55,051) (2,114,365)
Net operating income 97,240,331 58,189,282 33,183,182 13,502,808 14,792,736 216,908,339
Expense:
Operating expenses (14,899,133) (31,022,452) (19,200,840) (10,173,598) (6,836,488) (82,132,511)
Net impairment loss on financial assets (5,289,827) (906,532) (925,794) (177,355) (72,755) (7,372,263)
Depreciation and amortization (3,252,149) (4,468,300) (2,290,484) (1,288,937) (851,785) (12,151,655)
Total cost (23,441,109) (36,397,284) (22,417,118) (11,639,890) (7,761,028) (101,656,429)
Profit before income tax from reportable segments 73,799,222 21,791,998 10,766,064 1,862,918 7,031,708 115,251,910
Tax (12,270,264) (2,555,133) (1,558,566) (208,781) (1,098,180) (17,690,924)
Profit after income tax from reportable segments 61,528,958 19,236,865 9,207,498 1,654,137 5,933,528 97,560,986
Assets and liabilities:
Total assets 1,541,084,263 342,449,443 292,075,654 63,788,530 119,475,798 2,358,873,688
Total liabilities (541,219,478) (766,772,924) (326,867,073) (172,398,598) (166,203,719) (1,973,461,792)
Net assets/ (liabilities) 999,864,785 (424,323,481) (34,791,419) (108,610,068) (46,727,921) 385,411,896
Additions to Non-Current Assets 11,117,382 2,470,430 2,107,034 460,170 861,898 17,016,914
Assets:
Loans and advances to banks 5,695,592 - - - - 5,695,592
Loans and advances to customers 890,671,715 123,580,318 183,626,276 16,661,470 61,141,356 1,275,681,135
Others 644,716,956 218,869,125 108,449,379 47,127,060 58,334,442 1,077,496,962
1,541,084,263 342,449,443 292,075,655 63,788,530 119,475,798 2,358,873,688
Liabilities:
Deposits from banks 31,661,622 - - - - 31,661,622
Deposits from customers 424,569,869 678,224,760 267,464,484 140,456,897 107,492,184 1,618,208,194
Others 84,987,987 88,548,164 59,402,589 31,941,701 58,711,535 323,591,976
541,219,478 766,772,924 326,867,073 172,398,598 166,203,719 1,973,461,792
212
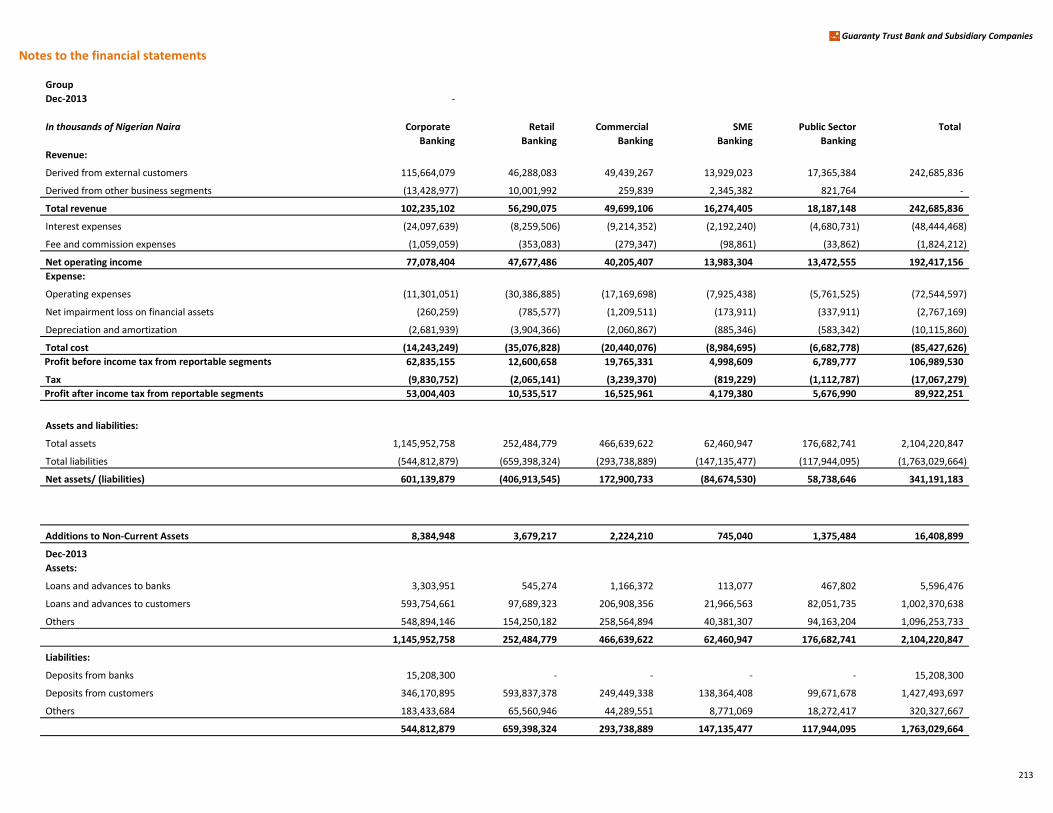
Notes to the financial statements
Guaranty Trust Bank and Subsidiary Companies
Group
Dec-2013 -
In thousands of Nigerian Naira Corporate Retail Commercial SME Public Sector Total
Banking Banking Banking Banking Banking
Revenue:
Derived from external customers 115,664,079 46,288,083 49,439,267 13,929,023 17,365,384 242,685,836
Derived from other business segments (13,428,977) 10,001,992 259,839 2,345,382 821,764 -
Total revenue 102,235,102 56,290,075 49,699,106 16,274,405 18,187,148 242,685,836
Interest expenses (24,097,639) (8,259,506) (9,214,352) (2,192,240) (4,680,731) (48,444,468)
Fee and commission expenses (1,059,059) (353,083) (279,347) (98,861) (33,862) (1,824,212)
Net operating income 77,078,404 47,677,486 40,205,407 13,983,304 13,472,555 192,417,156
Expense:
Operating expenses (11,301,051) (30,386,885) (17,169,698) (7,925,438) (5,761,525) (72,544,597)
Net impairment loss on financial assets (260,259) (785,577) (1,209,511) (173,911) (337,911) (2,767,169)
Depreciation and amortization (2,681,939) (3,904,366) (2,060,867) (885,346) (583,342) (10,115,860)
Total cost (14,243,249) (35,076,828) (20,440,076) (8,984,695) (6,682,778) (85,427,626)
Profit before income tax from reportable segments 62,835,155 12,600,658 19,765,331 4,998,609 6,789,777 106,989,530
Tax (9,830,752) (2,065,141) (3,239,370) (819,229) (1,112,787) (17,067,279)
Profit after income tax from reportable segments 53,004,403 10,535,517 16,525,961 4,179,380 5,676,990 89,922,251
Assets and liabilities:
Total assets 1,145,952,758 252,484,779 466,639,622 62,460,947 176,682,741 2,104,220,847
Total liabilities (544,812,879) (659,398,324) (293,738,889) (147,135,477) (117,944,095) (1,763,029,664)
Net assets/ (liabilities) 601,139,879 (406,913,545) 172,900,733 (84,674,530) 58,738,646 341,191,183
Additions to Non-Current Assets 8,384,948 3,679,217 2,224,210 745,040 1,375,484 16,408,899
Dec-2013
Assets:
Loans and advances to banks 3,303,951 545,274 1,166,372 113,077 467,802 5,596,476
Loans and advances to customers 593,754,661 97,689,323 206,908,356 21,966,563 82,051,735 1,002,370,638
Others 548,894,146 154,250,182 258,564,894 40,381,307 94,163,204 1,096,253,733
1,145,952,758 252,484,779 466,639,622 62,460,947 176,682,741 2,104,220,847
Liabilities:
Deposits from banks 15,208,300 - - - - 15,208,300
Deposits from customers 346,170,895 593,837,378 249,449,338 138,364,408 99,671,678 1,427,493,697
Others 183,433,684 65,560,946 44,289,551 8,771,069 18,272,417 320,327,667
544,812,879 659,398,324 293,738,889 147,135,477 117,944,095 1,763,029,664
213
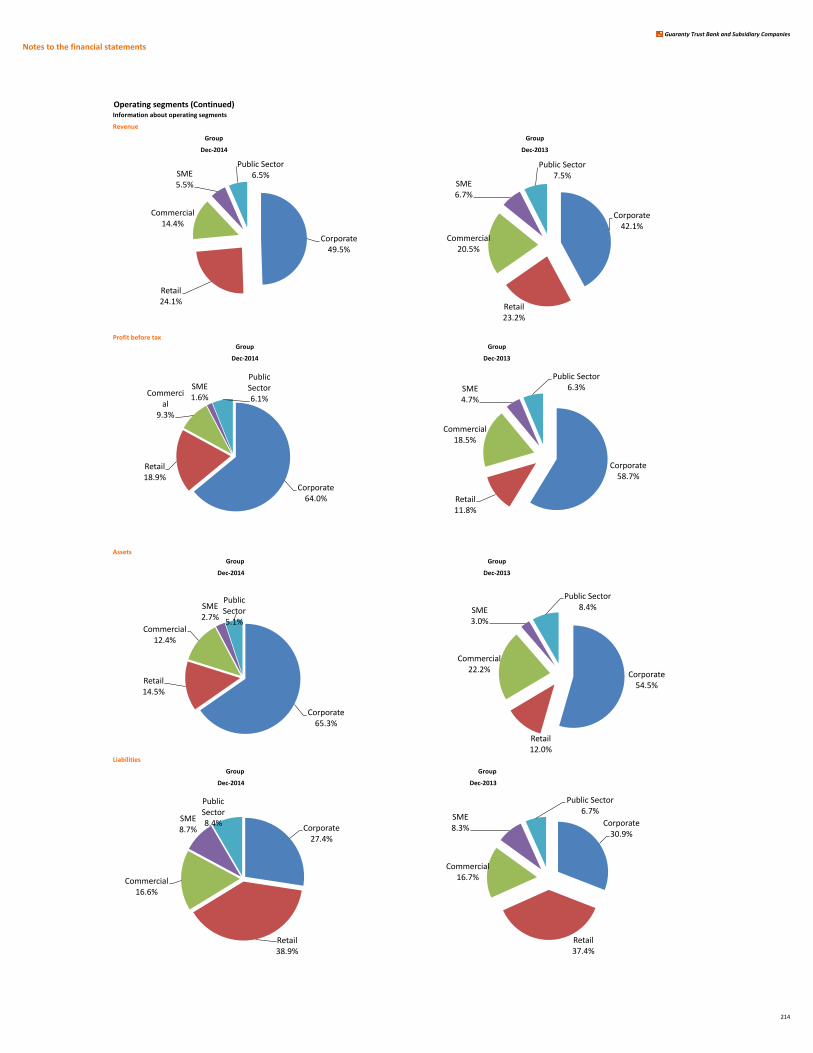
Notes to the financial statements
Guaranty Trust Bank and Subsidiary Companies
Operating segments (Continued)Information about operating segments
Revenue
Group Group
Dec-2014 Dec-2013
Profit before tax
Assets
Group
Dec-2014
Liabilities
Group Group
Dec-2014 Dec-2013
Dec-2013
Group Group
Dec-2014 Dec-2013
Group
Corporate 49.5%
Retail 24.1%
Commercial 14.4%
SME 5.5%
Public Sector 6.5%
Corporate 42.1%
Retail 23.2%
Commercial 20.5%
SME 6.7%
Public Sector 7.5%
Corporate 64.0%
Retail 18.9%
Commercial
9.3%
SME 1.6%
Public Sector 6.1%
Corporate 58.7%
Retail 11.8%
Commercial 18.5%
SME 4.7%
Public Sector 6.3%
Corporate 65.3%
Retail 14.5%
Commercial 12.4%
SME 2.7%
Public Sector 5.1%
Corporate 54.5%
Retail 12.0%
Commercial 22.2%
SME 3.0%
Public Sector 8.4%
Corporate 27.4%
Retail 38.9%
Commercial 16.6%
SME 8.7%
Public Sector 8.4% Corporate
30.9%
Retail 37.4%
Commercial 16.7%
SME 8.3%
Public Sector 6.7%
214
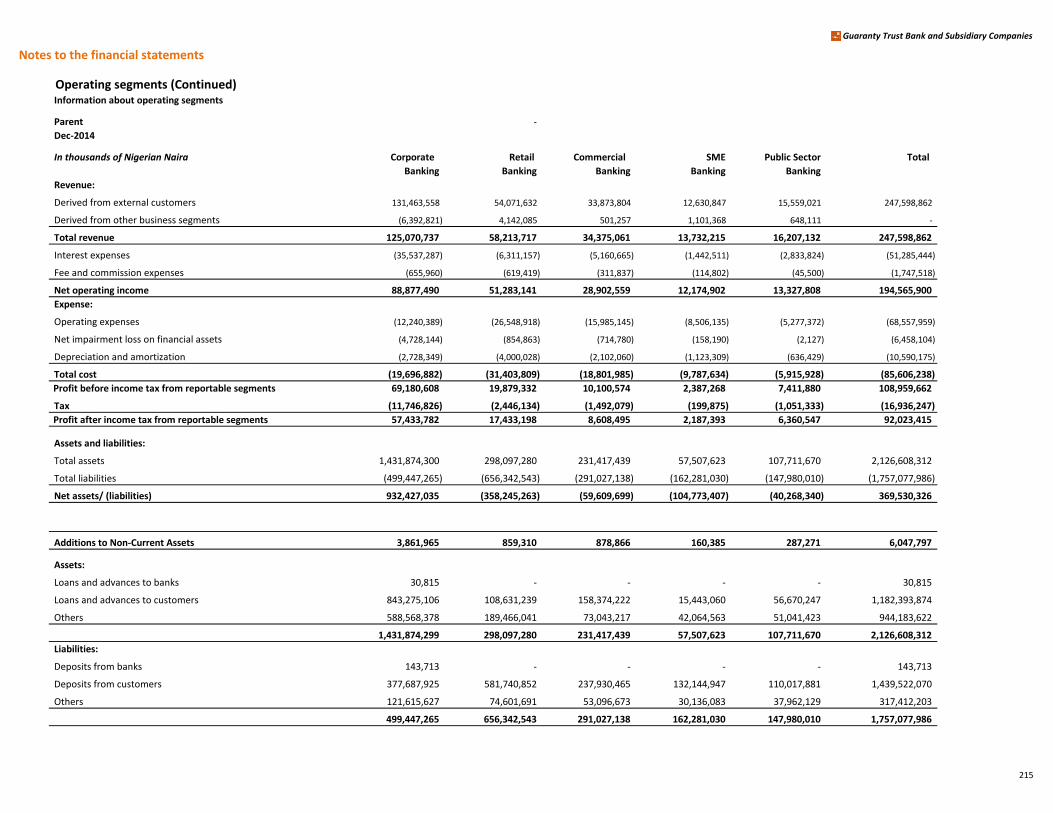
Notes to the financial statements
Guaranty Trust Bank and Subsidiary Companies
Operating segments (Continued)Information about operating segments
Parent -
Dec-2014
In thousands of Nigerian Naira Corporate Retail Commercial SME Public Sector Total
Banking Banking Banking Banking Banking
Revenue:
Derived from external customers 131,463,558 54,071,632 33,873,804 12,630,847 15,559,021 247,598,862
Derived from other business segments (6,392,821) 4,142,085 501,257 1,101,368 648,111 -
Total revenue 125,070,737 58,213,717 34,375,061 13,732,215 16,207,132 247,598,862
Interest expenses (35,537,287) (6,311,157) (5,160,665) (1,442,511) (2,833,824) (51,285,444)
Fee and commission expenses (655,960) (619,419) (311,837) (114,802) (45,500) (1,747,518)
Net operating income 88,877,490 51,283,141 28,902,559 12,174,902 13,327,808 194,565,900
Expense:
Operating expenses (12,240,389) (26,548,918) (15,985,145) (8,506,135) (5,277,372) (68,557,959)
Net impairment loss on financial assets (4,728,144) (854,863) (714,780) (158,190) (2,127) (6,458,104)
Depreciation and amortization (2,728,349) (4,000,028) (2,102,060) (1,123,309) (636,429) (10,590,175)
Total cost (19,696,882) (31,403,809) (18,801,985) (9,787,634) (5,915,928) (85,606,238)
Profit before income tax from reportable segments 69,180,608 19,879,332 10,100,574 2,387,268 7,411,880 108,959,662
Tax (11,746,826) (2,446,134) (1,492,079) (199,875) (1,051,333) (16,936,247)
Profit after income tax from reportable segments 57,433,782 17,433,198 8,608,495 2,187,393 6,360,547 92,023,415
Assets and liabilities:
Total assets 1,431,874,300 298,097,280 231,417,439 57,507,623 107,711,670 2,126,608,312
Total liabilities (499,447,265) (656,342,543) (291,027,138) (162,281,030) (147,980,010) (1,757,077,986)
Net assets/ (liabilities) 932,427,035 (358,245,263) (59,609,699) (104,773,407) (40,268,340) 369,530,326
Additions to Non-Current Assets 3,861,965 859,310 878,866 160,385 287,271 6,047,797
Assets:
Loans and advances to banks 30,815 - - - - 30,815
Loans and advances to customers 843,275,106 108,631,239 158,374,222 15,443,060 56,670,247 1,182,393,874
Others 588,568,378 189,466,041 73,043,217 42,064,563 51,041,423 944,183,622
1,431,874,299 298,097,280 231,417,439 57,507,623 107,711,670 2,126,608,312
Liabilities:
Deposits from banks 143,713 - - - - 143,713
Deposits from customers 377,687,925 581,740,852 237,930,465 132,144,947 110,017,881 1,439,522,070
Others 121,615,627 74,601,691 53,096,673 30,136,083 37,962,129 317,412,203
499,447,265 656,342,543 291,027,138 162,281,030 147,980,010 1,757,077,986
215
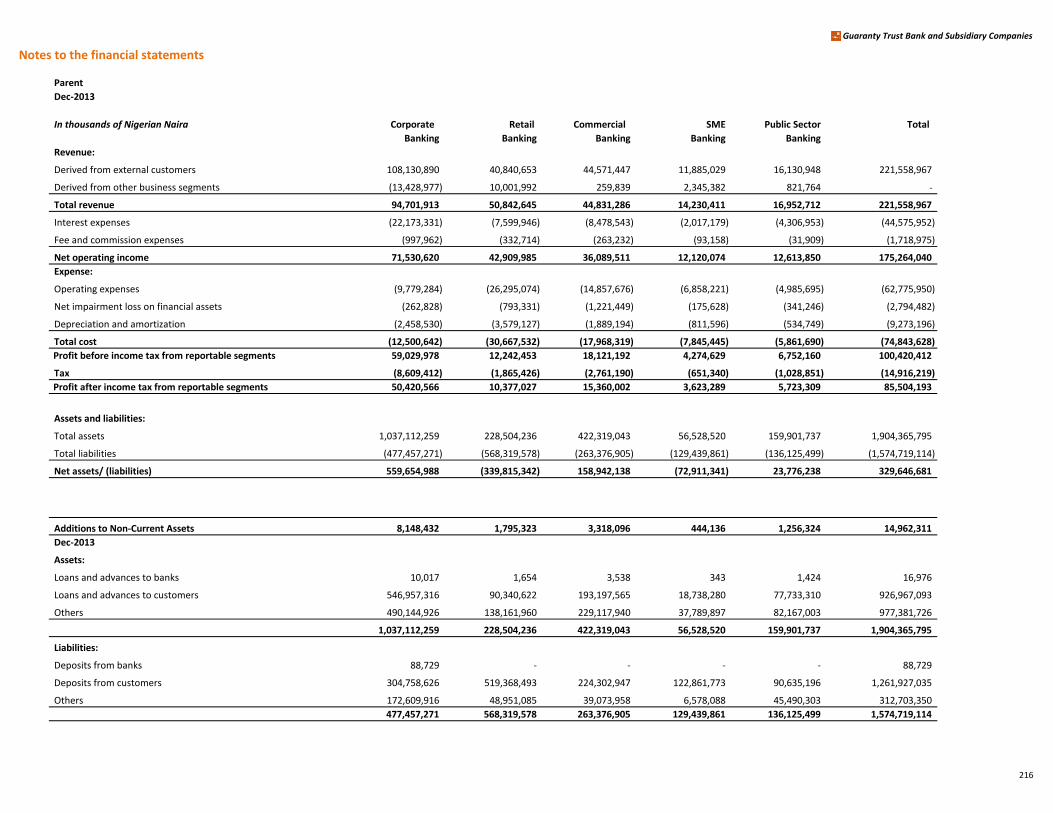
Notes to the financial statements
Guaranty Trust Bank and Subsidiary Companies
Parent
Dec-2013
In thousands of Nigerian Naira Corporate Retail Commercial SME Public Sector Total
Banking Banking Banking Banking Banking
Revenue:
Derived from external customers 108,130,890 40,840,653 44,571,447 11,885,029 16,130,948 221,558,967
Derived from other business segments (13,428,977) 10,001,992 259,839 2,345,382 821,764 -
Total revenue 94,701,913 50,842,645 44,831,286 14,230,411 16,952,712 221,558,967
Interest expenses (22,173,331) (7,599,946) (8,478,543) (2,017,179) (4,306,953) (44,575,952)
Fee and commission expenses (997,962) (332,714) (263,232) (93,158) (31,909) (1,718,975)
Net operating income 71,530,620 42,909,985 36,089,511 12,120,074 12,613,850 175,264,040
Expense:
Operating expenses (9,779,284) (26,295,074) (14,857,676) (6,858,221) (4,985,695) (62,775,950)
Net impairment loss on financial assets (262,828) (793,331) (1,221,449) (175,628) (341,246) (2,794,482)
Depreciation and amortization (2,458,530) (3,579,127) (1,889,194) (811,596) (534,749) (9,273,196)
Total cost (12,500,642) (30,667,532) (17,968,319) (7,845,445) (5,861,690) (74,843,628)
Profit before income tax from reportable segments 59,029,978 12,242,453 18,121,192 4,274,629 6,752,160 100,420,412
Tax (8,609,412) (1,865,426) (2,761,190) (651,340) (1,028,851) (14,916,219)
Profit after income tax from reportable segments 50,420,566 10,377,027 15,360,002 3,623,289 5,723,309 85,504,193
Assets and liabilities:
Total assets 1,037,112,259 228,504,236 422,319,043 56,528,520 159,901,737 1,904,365,795
Total liabilities (477,457,271) (568,319,578) (263,376,905) (129,439,861) (136,125,499) (1,574,719,114)
Net assets/ (liabilities) 559,654,988 (339,815,342) 158,942,138 (72,911,341) 23,776,238 329,646,681
Additions to Non-Current Assets 8,148,432 1,795,323 3,318,096 444,136 1,256,324 14,962,311
Dec-2013
Assets:
Loans and advances to banks 10,017 1,654 3,538 343 1,424 16,976
Loans and advances to customers 546,957,316 90,340,622 193,197,565 18,738,280 77,733,310 926,967,093
Others 490,144,926 138,161,960 229,117,940 37,789,897 82,167,003 977,381,726
1,037,112,259 228,504,236 422,319,043 56,528,520 159,901,737 1,904,365,795
Liabilities:
Deposits from banks 88,729 - - - - 88,729
Deposits from customers 304,758,626 519,368,493 224,302,947 122,861,773 90,635,196 1,261,927,035
Others 172,609,916 48,951,085 39,073,958 6,578,088 45,490,303 312,703,350
477,457,271 568,319,578 263,376,905 129,439,861 136,125,499 1,574,719,114
216
Notes to the financial statements
Guaranty Trust Bank and Subsidiary Companies
Operating segments (Continued)Information about operating segments
Revenue
Parent Parent
Dec-2014 Dec-2013
Profit before tax
Assets
Parent
Dec-2014
Liabilities
Parent Parent
Dec-2014 Dec-2013
Dec-2013
Parent Parent
Dec-2014 Dec-2013
Parent
Corporate 50.5%
Retail 23.5%
Commercial 13.9%
SME 5.5%
Public Sector 6.5%
Corporate 48.8%
Retail 18.4%
Commercial 20.1%
SME 5.4%
Public Sector 7.3%
Corporate 63.5%
Retail 18.2%
Commercial
9.3%
SME 2.2%
Public Sector 6.8%
Corporate 58.8%
Retail 12.2%
Commercial 18.0%
SME 4.3%
Public Sector 6.7%
Corporate 67.3%
Retail 14.0%
Commercial 10.9%
SME 2.7%
Public Sector 5.1%
Corporate 54.5%
Retail 12.0%
Commercial 22.2%
SME 3.0%
Public Sector 8.4%
Corporate 28.4%
Retail 37.4%
Commercial 16.6%
SME 9.2%
Public Sector 8.4% Corporate
30.3%
Retail 36.1%
Commercial 16.7%
SME 8.2%
Public Sector 8.6%
217
Notes to the financial statements
Guaranty Trust Bank and Subsidiary Companies
7 Operating segments (Continued) The following is an analysis of the Group’s revenue and gains by products and services;
Group Group Parent Parent
In thousands of Nigerian Naira Dec-2014 Dec-2013 Dec-2014 Dec-2013
Bonds 19,635,369 16,394,657 28,591,505 14,971,506
Placements 13,140,367 5,180,893 7,642,761 4,731,161
Treasury bills 54,010,219 54,092,264 45,809,721 49,396,744
Loans 187,036,043 159,108,583 163,550,329 145,297,046
Contingents 4,698,816 7,888,614 3,412,735 7,203,827
278,520,814 242,665,011 249,007,051 221,600,284
Reconciliation of reportable segment revenues, operating expenses, profit or loss and assets and liabilities
Reconciliation of revenues
Group Group Parent Parent
In thousands of Nigerian Naira Dec-2014 Dec-2013 Dec-2014 Dec-2013
Total revenue from reportable segments 277,233,259 242,685,836 247,598,862 221,558,967
Consolidation and adjustments:
- Interest income (123,548) (81,956) - -
- Other operating income - 2,020 - -
Revenue 277,109,711 242,605,900 247,598,862 221,558,967
218
Notes to the financial statements
Guaranty Trust Bank and Subsidiary Companies
Revenue as shown above is made up of:
Group Group Parent Parent
In thousands of Nigerian Naira Dec-2014 Dec-2013 Dec-2014 Dec-2013
Interest income 200,602,653 185,383,473 179,984,274 172,433,167
Fee and commission income 47,969,982 46,631,901 40,944,512 40,189,316
Net gains/(losses) on financial instruments classified as
held for trading 28,274,332 10,538,095 24,104,531 7,923,744
Other operating income 1,673,847 111,542 3,973,734 1,054,057
Revenue and gains 278,520,814 242,665,011 249,007,051 221,600,284
Less gains:
- Gain on disposal of fixed assets (78,130) (59,111) (75,216) (41,317)
- Net portfolio gain on SMEEIS investments (1,332,973) - (1,332,973) -
Revenue 277,109,711 242,605,900 247,598,862 221,558,967
Reconciliation of operating expenses
Group Group Parent Parent
In thousands of Nigerian Naira Dec-2014 Dec-2013 Dec-2014 Dec-2013
Total operating expense from reportable segments 82,132,511 72,544,597 68,557,959 62,775,950
Gains:
Consolidation and adjustments:
- Personnel expenses1153,622 (122,551) - -
Operating expense 82,286,133 72,422,046 68,557,959 62,775,950
1 relates to share based payments during the period
219
Notes to the financial statements
Guaranty Trust Bank and Subsidiary Companies
Operating expense as shown above is made up of:
Group Group Parent Parent
In thousands of Nigerian Naira Dec-2014 Dec-2013 Dec-2014 Dec-2013
Personnel expenses (See Note17) 27,442,101 23,761,448 21,036,543 19,625,269
General and administrative expenses (See Note18) 26,135,843 22,550,173 22,236,943 20,077,522
Operating lease expenses 913,085 837,218 560,710 623,379
Other operating expenses (See Note20) 27,795,104 25,273,207 24,723,763 22,449,780
82,286,133 72,422,046 68,557,959 62,775,950
Reconciliation of profit or loss
Group Group Parent Parent
In thousands of Nigerian Naira Dec-2014 Dec-2013 Dec-2014 Dec-2013
Total profit or loss for reportable segments 115,251,910 106,989,530 108,959,662 100,420,412
Consolidation and adjustments:
- Interest income (123,548) (81,956) - -
- Personnel expenses (153,622) 122,551 - -
- Other operating income - 2,020 - -
Gains:
- Gain on disposal of fixed assets 78,130 59,111 75,216 41,317
- Net portfolio (loss)/gain on SMEEIS investments 1,332,973 - 1,332,973 -
Profit before income tax 116,385,843 107,091,256 110,367,851 100,461,729
220
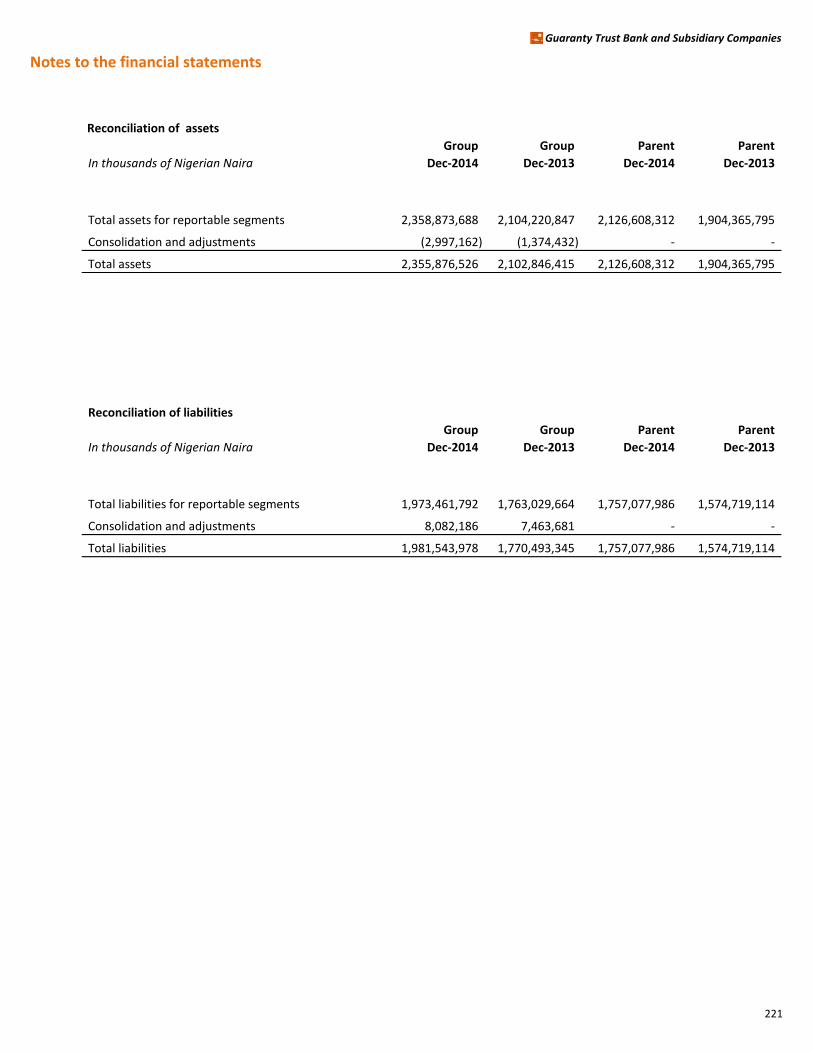
Notes to the financial statements
Guaranty Trust Bank and Subsidiary Companies
Reconciliation of assets
Group Group Parent Parent
In thousands of Nigerian Naira Dec-2014 Dec-2013 Dec-2014 Dec-2013
Total assets for reportable segments 2,358,873,688 2,104,220,847 2,126,608,312 1,904,365,795
Consolidation and adjustments (2,997,162) (1,374,432) - -
Total assets 2,355,876,526 2,102,846,415 2,126,608,312 1,904,365,795
Reconciliation of liabilities
Group Group Parent Parent
In thousands of Nigerian Naira Dec-2014 Dec-2013 Dec-2014 Dec-2013
Total liabilities for reportable segments 1,973,461,792 1,763,029,664 1,757,077,986 1,574,719,114
Consolidation and adjustments 8,082,186 7,463,681 - -
Total liabilities 1,981,543,978 1,770,493,345 1,757,077,986 1,574,719,114
221

Notes to the financial statements
Guaranty Trust Bank and Subsidiary Companies
Geographical segments
The Group operates in three geographic regions, being:
· Nigeria
· Rest of West Africa (comprising Ghana, Gambia, Sierra Leone, Liberia)
· East Africa (comprising Kenya, Uganda and Rwanda)
· Europe (UK and the Netherlands)
Dec-2014
Rest of West East
In thousands of Nigerian Naira Nigeria Africa Africa Europe Total
Derived from external customers 245,332,887 19,828,823 9,666,628 2,281,373 277,109,711
Derived from other segments - - - - -
Total Revenue 245,332,887 19,828,823 9,666,628 2,281,373 277,109,711
Interest expense (51,285,446) (3,227,896) (3,528,864) (168,349) (58,210,555)
Fee and commission expenses (1,747,514) (208,645) (158,206) - (2,114,365)
Net interest margin 192,299,927 16,392,282 5,979,558 2,113,024 216,784,791
Profit before income tax 107,521,688 7,624,549 1,090,992 148,614 116,385,843
Assets and liabilities:
Total assets 1,899,886,422 119,961,576 93,998,638 242,029,890 2,355,876,526
Total liabilities (1,596,389,766) (93,263,508) (79,378,448) (212,512,256) (1,981,543,978)
Net assets 303,496,656 26,698,068 14,620,190 29,517,634 374,332,548
222
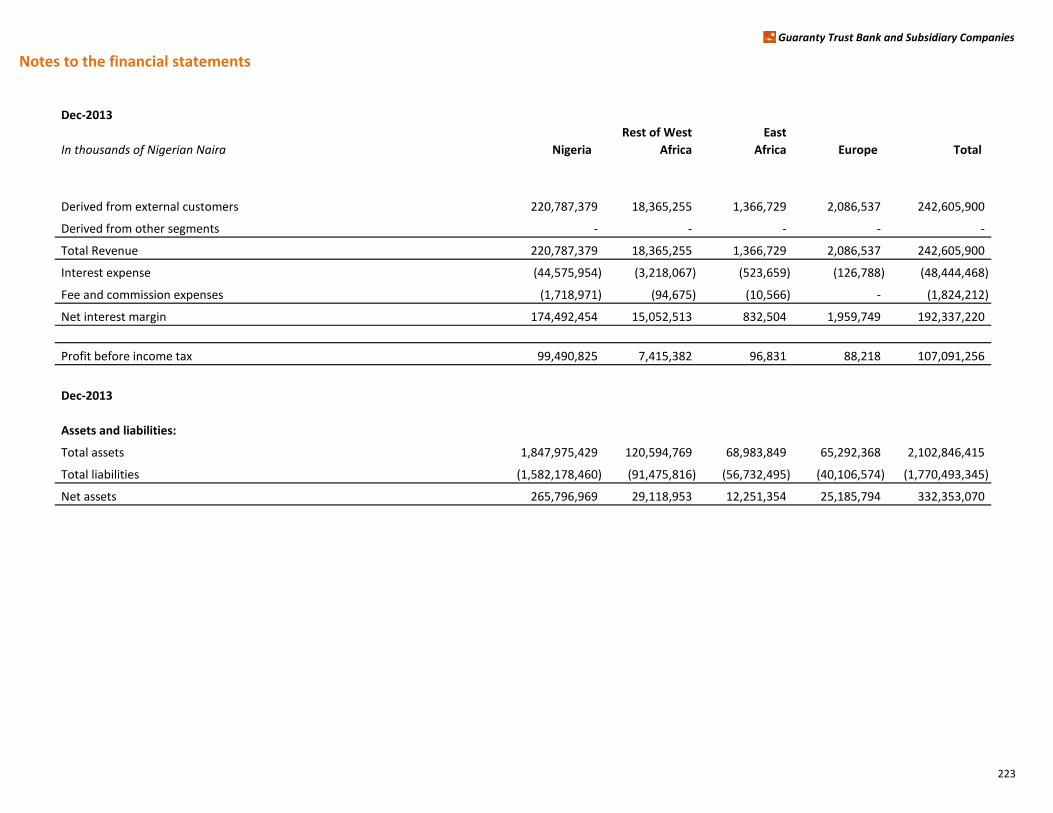
Notes to the financial statements
Guaranty Trust Bank and Subsidiary Companies
Dec-2013
Rest of West East
In thousands of Nigerian Naira Nigeria Africa Africa Europe Total
Derived from external customers 220,787,379 18,365,255 1,366,729 2,086,537 242,605,900
Derived from other segments - - - - -
Total Revenue 220,787,379 18,365,255 1,366,729 2,086,537 242,605,900
Interest expense (44,575,954) (3,218,067) (523,659) (126,788) (48,444,468)
Fee and commission expenses (1,718,971) (94,675) (10,566) - (1,824,212)
Net interest margin 174,492,454 15,052,513 832,504 1,959,749 192,337,220
Profit before income tax 99,490,825 7,415,382 96,831 88,218 107,091,256
Dec-2013
Assets and liabilities:
Total assets 1,847,975,429 120,594,769 68,983,849 65,292,368 2,102,846,415
Total liabilities (1,582,178,460) (91,475,816) (56,732,495) (40,106,574) (1,770,493,345)
Net assets 265,796,969 29,118,953 12,251,354 25,185,794 332,353,070
223
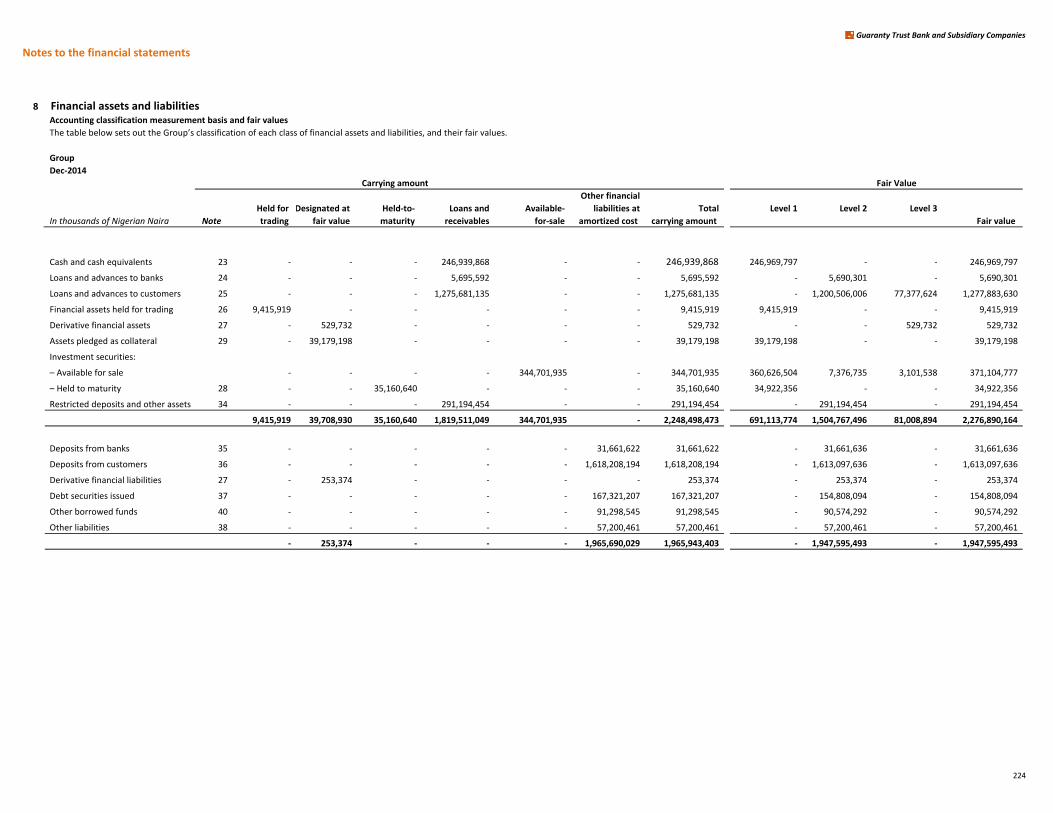
Notes to the financial statements
Guaranty Trust Bank and Subsidiary Companies
8 Financial assets and liabilitiesAccounting classification measurement basis and fair values
The table below sets out the Group’s classification of each class of financial assets and liabilities, and their fair values.
Group
Dec-2014
Carrying amount Fair Value
Other financial
Held for Designated at Held-to- Loans and Available- liabilities at Total Level 1 Level 2 Level 3
In thousands of Nigerian Naira Note trading fair value maturity receivables for-sale amortized cost carrying amount Fair value
Cash and cash equivalents 23 - - - 246,939,868 - - 246,939,868 246,969,797 - - 246,969,797
Loans and advances to banks 24 - - - 5,695,592 - - 5,695,592 - 5,690,301 - 5,690,301
Loans and advances to customers 25 - - - 1,275,681,135 - - 1,275,681,135 - 1,200,506,006 77,377,624 1,277,883,630
Financial assets held for trading 26 9,415,919 - - - - - 9,415,919 9,415,919 - - 9,415,919
Derivative financial assets 27 - 529,732 - - - - 529,732 - - 529,732 529,732
Assets pledged as collateral 29 - 39,179,198 - - - - 39,179,198 39,179,198 - - 39,179,198
Investment securities:
– Available for sale - - - - 344,701,935 - 344,701,935 360,626,504 7,376,735 3,101,538 371,104,777
– Held to maturity 28 - - 35,160,640 - - - 35,160,640 34,922,356 - - 34,922,356
Restricted deposits and other assets 34 - - - 291,194,454 - - 291,194,454 - 291,194,454 - 291,194,454
9,415,919 39,708,930 35,160,640 1,819,511,049 344,701,935 - 2,248,498,473 691,113,774 1,504,767,496 81,008,894 2,276,890,164
Deposits from banks 35 - - - - - 31,661,622 31,661,622 - 31,661,636 - 31,661,636
Deposits from customers 36 - - - - - 1,618,208,194 1,618,208,194 - 1,613,097,636 - 1,613,097,636
Derivative financial liabilities 27 - 253,374 - - - - 253,374 - 253,374 - 253,374
Debt securities issued 37 - - - - - 167,321,207 167,321,207 - 154,808,094 - 154,808,094
Other borrowed funds 40 - - - - - 91,298,545 91,298,545 - 90,574,292 - 90,574,292
Other liabilities 38 - - - - - 57,200,461 57,200,461 - 57,200,461 - 57,200,461
- 253,374 - - - 1,965,690,029 1,965,943,403 - 1,947,595,493 - 1,947,595,493
224
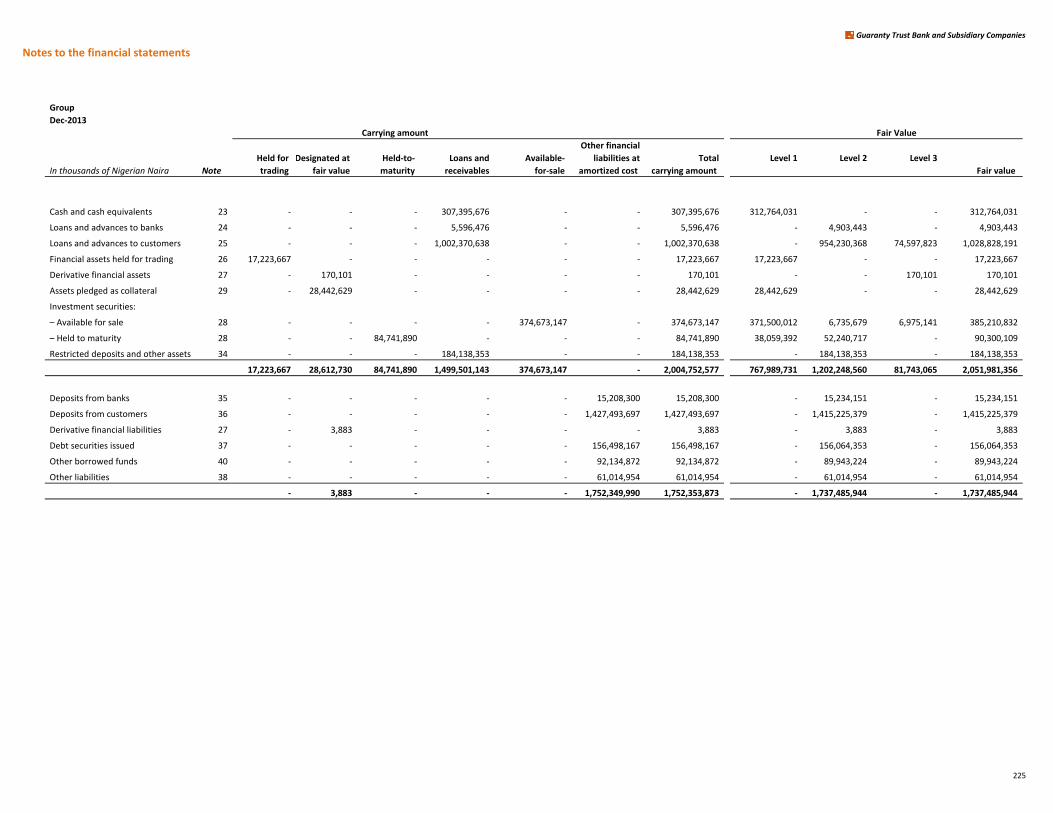
Notes to the financial statements
Guaranty Trust Bank and Subsidiary Companies
Group
Dec-2013
Carrying amount Fair Value
Other financial
Held for Designated at Held-to- Loans and Available- liabilities at Total Level 1 Level 2 Level 3
In thousands of Nigerian Naira Note trading fair value maturity receivables for-sale amortized cost carrying amount Fair value
Cash and cash equivalents 23 - - - 307,395,676 - - 307,395,676 312,764,031 - - 312,764,031
Loans and advances to banks 24 - - - 5,596,476 - - 5,596,476 - 4,903,443 - 4,903,443
Loans and advances to customers 25 - - - 1,002,370,638 - - 1,002,370,638 - 954,230,368 74,597,823 1,028,828,191
Financial assets held for trading 26 17,223,667 - - - - - 17,223,667 17,223,667 - - 17,223,667
Derivative financial assets 27 - 170,101 - - - - 170,101 - - 170,101 170,101
Assets pledged as collateral 29 - 28,442,629 - - - - 28,442,629 28,442,629 - - 28,442,629
Investment securities:
– Available for sale 28 - - - - 374,673,147 - 374,673,147 371,500,012 6,735,679 6,975,141 385,210,832
– Held to maturity 28 - - 84,741,890 - - - 84,741,890 38,059,392 52,240,717 - 90,300,109
Restricted deposits and other assets 34 - - - 184,138,353 - - 184,138,353 - 184,138,353 - 184,138,353
17,223,667 28,612,730 84,741,890 1,499,501,143 374,673,147 - 2,004,752,577 767,989,731 1,202,248,560 81,743,065 2,051,981,356
Deposits from banks 35 - - - - - 15,208,300 15,208,300 - 15,234,151 - 15,234,151
Deposits from customers 36 - - - - - 1,427,493,697 1,427,493,697 - 1,415,225,379 - 1,415,225,379
Derivative financial liabilities 27 - 3,883 - - - - 3,883 - 3,883 - 3,883
Debt securities issued 37 - - - - - 156,498,167 156,498,167 - 156,064,353 - 156,064,353
Other borrowed funds 40 - - - - - 92,134,872 92,134,872 - 89,943,224 - 89,943,224
Other liabilities 38 - - - - - 61,014,954 61,014,954 - 61,014,954 - 61,014,954
- 3,883 - - - 1,752,349,990 1,752,353,873 - 1,737,485,944 - 1,737,485,944
225
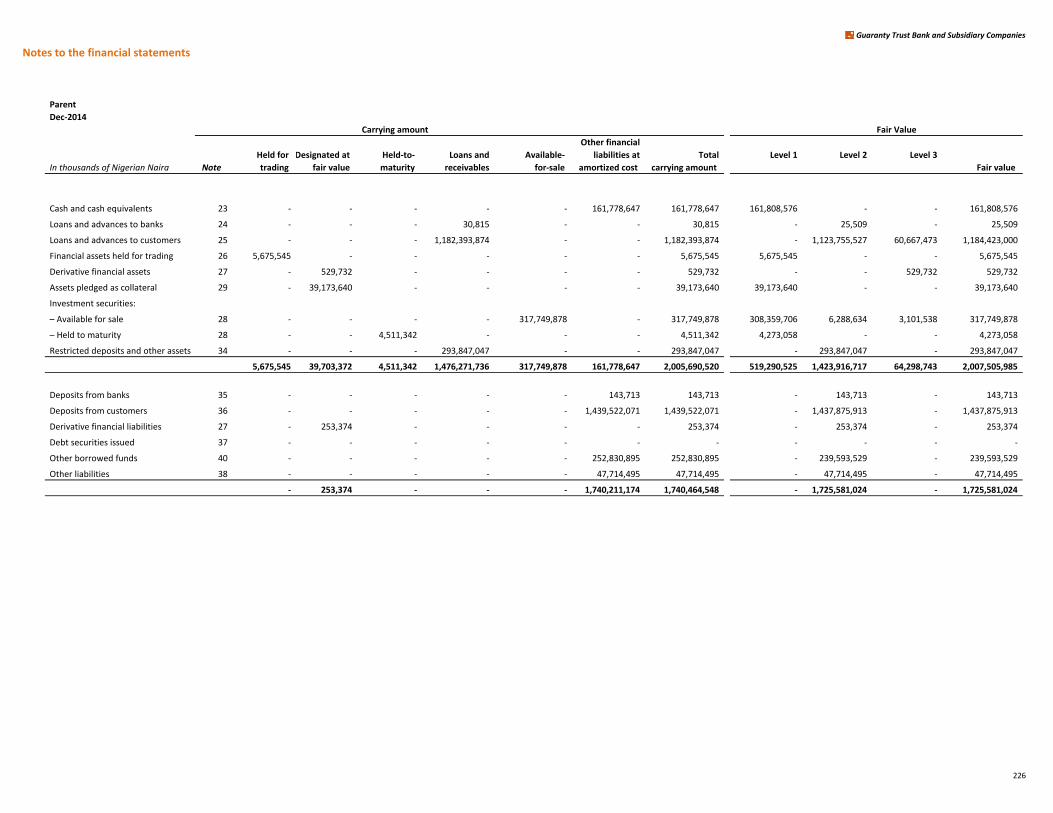
Notes to the financial statements
Guaranty Trust Bank and Subsidiary Companies
Parent
Dec-2014
Carrying amount Fair Value
Other financial
Held for Designated at Held-to- Loans and Available- liabilities at Total Level 1 Level 2 Level 3
In thousands of Nigerian Naira Note trading fair value maturity receivables for-sale amortized cost carrying amount Fair value
Cash and cash equivalents 23 - - - - - 161,778,647 161,778,647 161,808,576 - - 161,808,576
Loans and advances to banks 24 - - - 30,815 - - 30,815 - 25,509 - 25,509
Loans and advances to customers 25 - - - 1,182,393,874 - - 1,182,393,874 - 1,123,755,527 60,667,473 1,184,423,000
Financial assets held for trading 26 5,675,545 - - - - - 5,675,545 5,675,545 - - 5,675,545
Derivative financial assets 27 - 529,732 - - - - 529,732 - - 529,732 529,732
Assets pledged as collateral 29 - 39,173,640 - - - - 39,173,640 39,173,640 - - 39,173,640
Investment securities:
– Available for sale 28 - - - - 317,749,878 - 317,749,878 308,359,706 6,288,634 3,101,538 317,749,878
– Held to maturity 28 - - 4,511,342 - - - 4,511,342 4,273,058 - - 4,273,058
Restricted deposits and other assets 34 - - - 293,847,047 - - 293,847,047 - 293,847,047 - 293,847,047
5,675,545 39,703,372 4,511,342 1,476,271,736 317,749,878 161,778,647 2,005,690,520 519,290,525 1,423,916,717 64,298,743 2,007,505,985
Deposits from banks 35 - - - - - 143,713 143,713 - 143,713 - 143,713
Deposits from customers 36 - - - - - 1,439,522,071 1,439,522,071 - 1,437,875,913 - 1,437,875,913
Derivative financial liabilities 27 - 253,374 - - - - 253,374 - 253,374 - 253,374
Debt securities issued 37 - - - - - - - - - - -
Other borrowed funds 40 - - - - - 252,830,895 252,830,895 - 239,593,529 - 239,593,529
Other liabilities 38 - - - - - 47,714,495 47,714,495 - 47,714,495 - 47,714,495
- 253,374 - - - 1,740,211,174 1,740,464,548 - 1,725,581,024 - 1,725,581,024
226

Notes to the financial statements
Guaranty Trust Bank and Subsidiary Companies
Parent
Dec-2013
Carrying amount Fair Value
Other financial
Held for Designated at Held-to- Loans and Available- liabilities at Total Level 1 Level 2 Level 3
In thousands of Nigerian Naira Note trading fair value maturity receivables for-sale amortized cost carrying amount Fair value
Cash and cash equivalents 23 - - - - - 228,609,550 228,609,550 233,977,904 - - 233,977,904
Loans and advances to banks 24 - - - 16,976 - - 16,976 - 17,411 - 17,411
Loans and advances to customers 25 - - - 926,967,093 - - 926,967,093 - 892,721,934 60,667,473 953,389,407
Financial assets held for trading 26 13,746,682 - - - - - 13,746,682 13,746,682 - - 13,746,682
Derivative financial assets 27 - 170,101 - - - - 170,101 - - 170,101 170,101
Assets pledged as collateral 29 - 28,440,947 - - - - 28,440,947 28,440,947 - - 28,440,947
Investment securities:
– Available for sale 28 - - - - 364,056,362 - 364,056,362 352,204,680 4,876,541 6,975,141 364,056,362
– Held to maturity 28 - - 46,682,498 - - - 46,682,498 - 52,240,717 - 52,240,717
Restricted deposits and other assets 34 - - - 180,318,664 - - 180,318,664 - 180,318,664 - 180,318,664
13,746,682 28,611,048 46,682,498 1,107,302,733 364,056,362 228,609,550 1,789,008,873 628,370,213 1,130,175,267 67,812,715 1,826,358,195
Deposits from banks 35 - - - - - 88,729 88,729 - 88,729 - 88,729
Deposits from customers 36 - - - - - 1,261,927,035 1,261,927,035 - 1,257,958,050 - 1,257,958,050
Derivative financial liabilities 27 - 3,883 - - - - 3,883 - 3,883 - 3,883
Debt securities issued 37 - - - - - 13,233,595 13,233,595 - 13,165,000 - 13,165,000
Other borrowed funds 40 - - - - - 233,040,108 233,040,108 - 233,881,975 - 233,881,975
Other liabilities 38 - - - - - 49,008,466 49,008,466 - 49,008,466 - 49,008,466
- 3,883 - - - 1,557,297,933 1,557,301,816 - 1,554,106,103 - 1,554,106,103
Fair value of loans and advances
The fair values of non retail loans have been determined based on observable market data (transactions) (level 2) whilst those of retail loans have been 'estimated using Discounted Cash Flow (DCF) valuation models (level 3).
Inputs into this valuation technique include: expected cash flows, expected losses, tenor and interest rates, risk premium between interest rate on the loan and risk free rate in the economy.
The expected cash flows (estimated recoverable amount from receivables, collateral and otherwise) are thus discounted to obtain the fair value of the retail loans. To improve the accuracy of fair value of retail loans, these
loans are grouped into homogenous portfolio along product and customer type.
Fair value of customers’ deposits
Fair values of customers’ deposits have been determined using discounted cash flow techniques applying the rates on deposits of similar maturities and terms to discount the contractual cash flows.
227
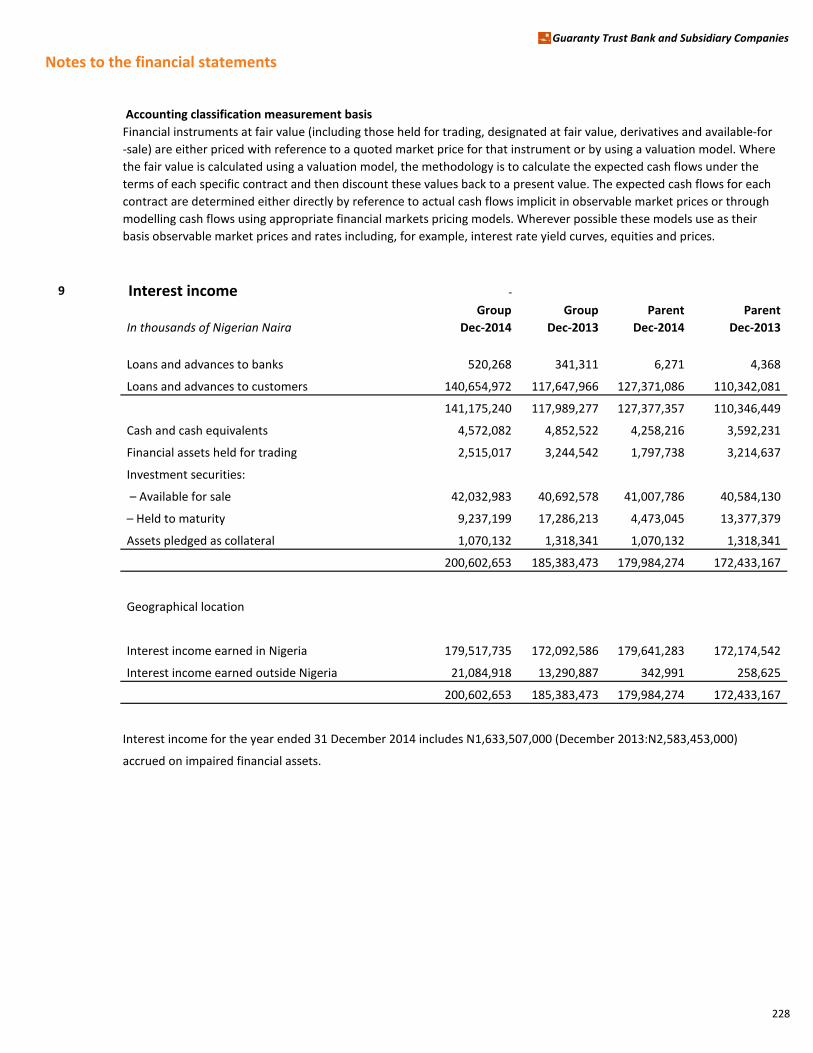
Notes to the financial statements
Guaranty Trust Bank and Subsidiary Companies
Accounting classification measurement basis
Financial instruments at fair value (including those held for trading, designated at fair value, derivatives and available-for
-sale) are either priced with reference to a quoted market price for that instrument or by using a valuation model. Where
the fair value is calculated using a valuation model, the methodology is to calculate the expected cash flows under the
terms of each specific contract and then discount these values back to a present value. The expected cash flows for each
contract are determined either directly by reference to actual cash flows implicit in observable market prices or through
modelling cash flows using appropriate financial markets pricing models. Wherever possible these models use as their
basis observable market prices and rates including, for example, interest rate yield curves, equities and prices.
9 Interest income -
Group Group Parent Parent
In thousands of Nigerian Naira Dec-2014 Dec-2013 Dec-2014 Dec-2013
Loans and advances to banks 520,268 341,311 6,271 4,368
Loans and advances to customers 140,654,972 117,647,966 127,371,086 110,342,081
141,175,240 117,989,277 127,377,357 110,346,449
Cash and cash equivalents 4,572,082 4,852,522 4,258,216 3,592,231
Financial assets held for trading 2,515,017 3,244,542 1,797,738 3,214,637
Investment securities:
– Available for sale 42,032,983 40,692,578 41,007,786 40,584,130
– Held to maturity 9,237,199 17,286,213 4,473,045 13,377,379
Assets pledged as collateral 1,070,132 1,318,341 1,070,132 1,318,341
200,602,653 185,383,473 179,984,274 172,433,167
Geographical location
Interest income earned in Nigeria 179,517,735 172,092,586 179,641,283 172,174,542
Interest income earned outside Nigeria 21,084,918 13,290,887 342,991 258,625
200,602,653 185,383,473 179,984,274 172,433,167
Interest income for the year ended 31 December 2014 includes N1,633,507,000 (December 2013:N2,583,453,000)
accrued on impaired financial assets.
228
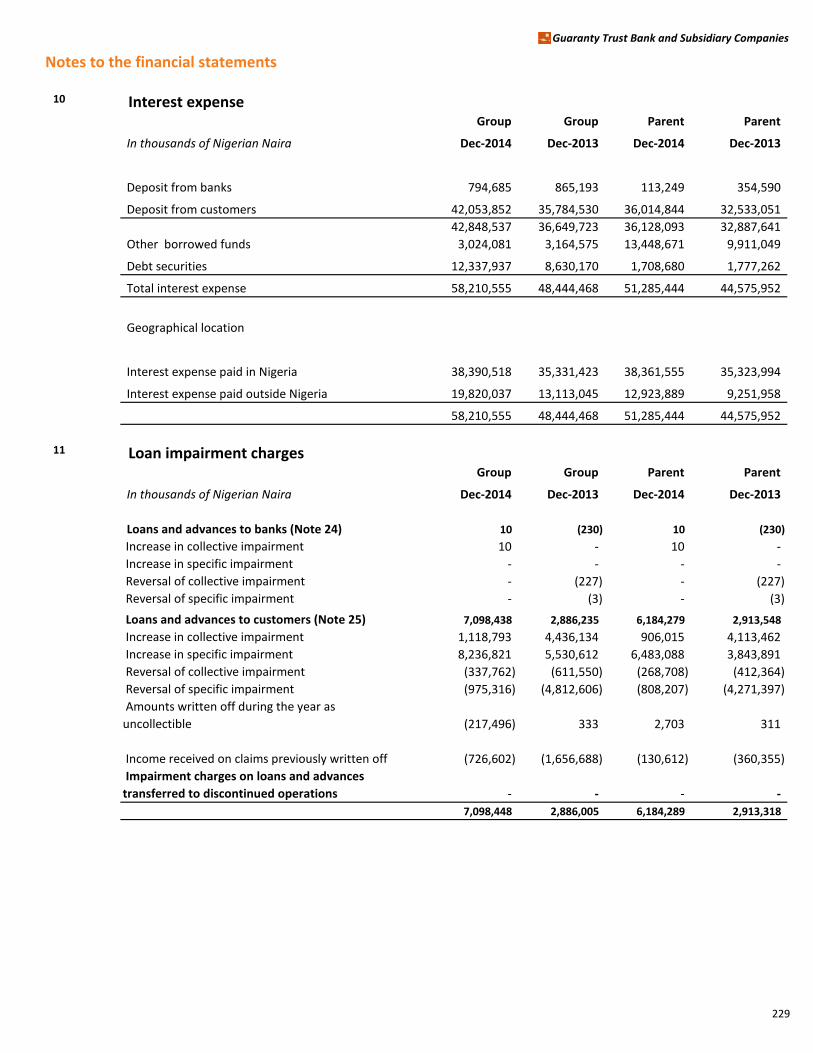
Notes to the financial statements
Guaranty Trust Bank and Subsidiary Companies
10 Interest expenseGroup Group Parent Parent
In thousands of Nigerian Naira Dec-2014 Dec-2013 Dec-2014 Dec-2013
Deposit from banks 794,685 865,193 113,249 354,590
Deposit from customers 42,053,852 35,784,530 36,014,844 32,533,051
42,848,537 36,649,723 36,128,093 32,887,641
Other borrowed funds 3,024,081 3,164,575 13,448,671 9,911,049
Debt securities 12,337,937 8,630,170 1,708,680 1,777,262
Total interest expense 58,210,555 48,444,468 51,285,444 44,575,952
Geographical location
Interest expense paid in Nigeria 38,390,518 35,331,423 38,361,555 35,323,994
Interest expense paid outside Nigeria 19,820,037 13,113,045 12,923,889 9,251,958
58,210,555 48,444,468 51,285,444 44,575,952
11 Loan impairment chargesGroup Group Parent Parent
In thousands of Nigerian Naira Dec-2014 Dec-2013 Dec-2014 Dec-2013
Loans and advances to banks (Note 24) 10 (230) 10 (230)
Increase in collective impairment 10 - 10 -
Increase in specific impairment - - - -
Reversal of collective impairment - (227) - (227)
Reversal of specific impairment - (3) - (3)
Loans and advances to customers (Note 25) 7,098,438 2,886,235 6,184,279 2,913,548
Increase in collective impairment 1,118,793 4,436,134 906,015 4,113,462
Increase in specific impairment 8,236,821 5,530,612 6,483,088 3,843,891
Reversal of collective impairment (337,762) (611,550) (268,708) (412,364)
Reversal of specific impairment (975,316) (4,812,606) (808,207) (4,271,397)
Amounts written off during the year as
uncollectible (217,496) 333 2,703 311
Income received on claims previously written off (726,602) (1,656,688) (130,612) (360,355)
Impairment charges on loans and advances
transferred to discontinued operations - - - -
7,098,448 2,886,005 6,184,289 2,913,318
229
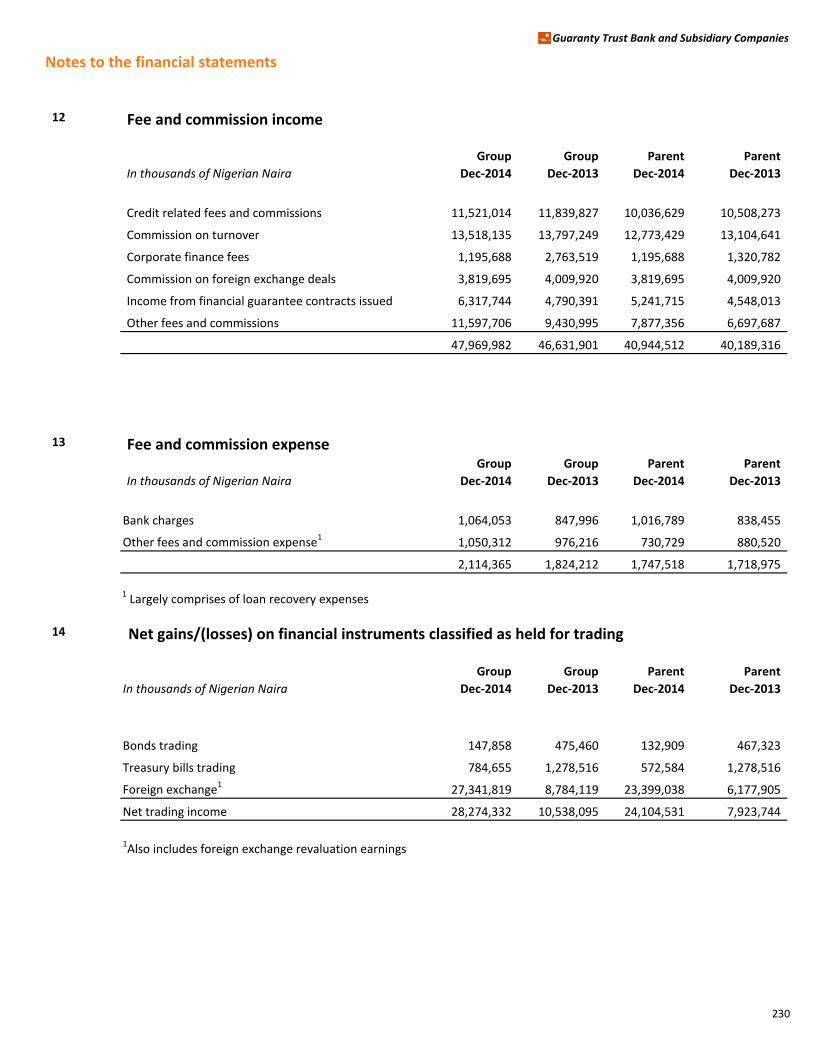
Notes to the financial statements
Guaranty Trust Bank and Subsidiary Companies
12 Fee and commission income
Group Group Parent Parent
In thousands of Nigerian Naira Dec-2014 Dec-2013 Dec-2014 Dec-2013
Credit related fees and commissions 11,521,014 11,839,827 10,036,629 10,508,273
Commission on turnover 13,518,135 13,797,249 12,773,429 13,104,641
Corporate finance fees 1,195,688 2,763,519 1,195,688 1,320,782
Commission on foreign exchange deals 3,819,695 4,009,920 3,819,695 4,009,920
Income from financial guarantee contracts issued 6,317,744 4,790,391 5,241,715 4,548,013
Other fees and commissions 11,597,706 9,430,995 7,877,356 6,697,687
47,969,982 46,631,901 40,944,512 40,189,316
13 Fee and commission expense Group Group Parent Parent
In thousands of Nigerian Naira Dec-2014 Dec-2013 Dec-2014 Dec-2013
Bank charges 1,064,053 847,996 1,016,789 838,455
Other fees and commission expense11,050,312 976,216 730,729 880,520
2,114,365 1,824,212 1,747,518 1,718,975
1 Largely comprises of loan recovery expenses
14 Net gains/(losses) on financial instruments classified as held for trading
Group Group Parent Parent
In thousands of Nigerian Naira Dec-2014 Dec-2013 Dec-2014 Dec-2013
Bonds trading 147,858 475,460 132,909 467,323
Treasury bills trading 784,655 1,278,516 572,584 1,278,516
Foreign exchange127,341,819 8,784,119 23,399,038 6,177,905
Net trading income 28,274,332 10,538,095 24,104,531 7,923,744
1Also includes foreign exchange revaluation earnings
230
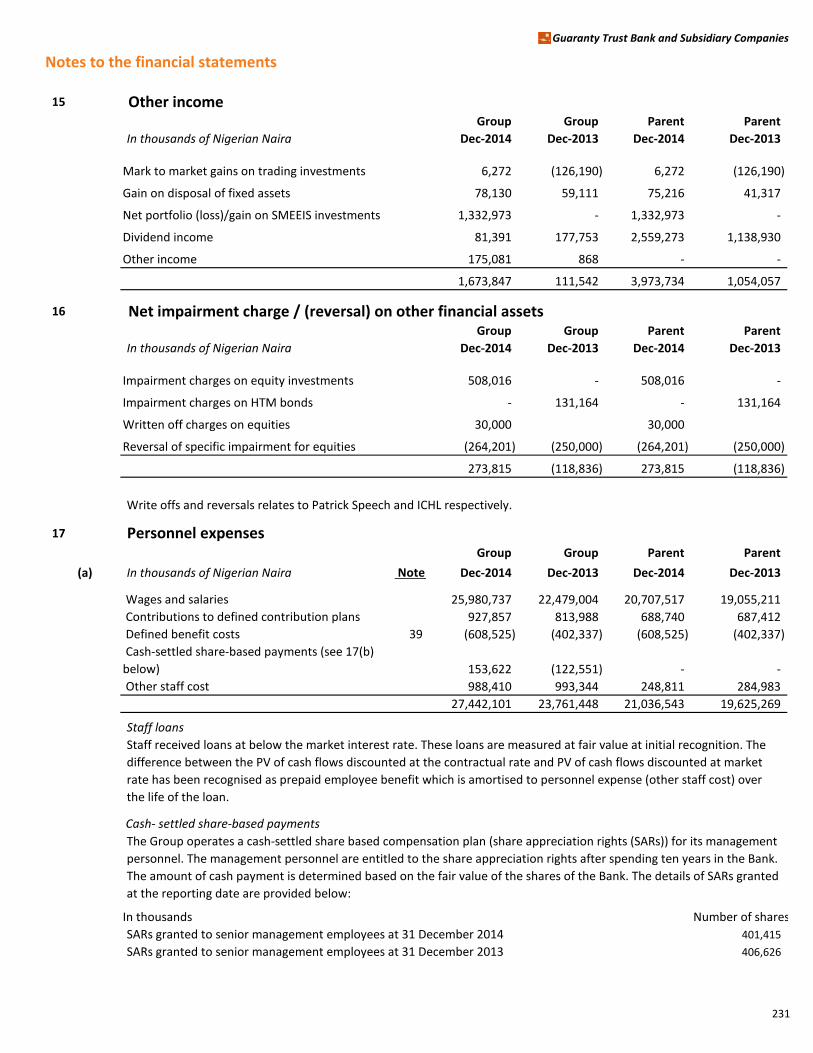
Notes to the financial statements
Guaranty Trust Bank and Subsidiary Companies
15 Other incomeGroup Group Parent Parent
In thousands of Nigerian Naira Dec-2014 Dec-2013 Dec-2014 Dec-2013
Mark to market gains on trading investments 6,272 (126,190) 6,272 (126,190)
Gain on disposal of fixed assets 78,130 59,111 75,216 41,317
Net portfolio (loss)/gain on SMEEIS investments 1,332,973 - 1,332,973 -
Dividend income 81,391 177,753 2,559,273 1,138,930
Other income 175,081 868 - -
1,673,847 111,542 3,973,734 1,054,057
16 Net impairment charge / (reversal) on other financial assetsGroup Group Parent Parent
In thousands of Nigerian Naira Dec-2014 Dec-2013 Dec-2014 Dec-2013
Impairment charges on equity investments 508,016 - 508,016 -
Impairment charges on HTM bonds - 131,164 - 131,164
Written off charges on equities 30,000 30,000
Reversal of specific impairment for equities (264,201) (250,000) (264,201) (250,000)
273,815 (118,836) 273,815 (118,836)
Write offs and reversals relates to Patrick Speech and ICHL respectively.
17 Personnel expenses Group Group Parent Parent
(a) In thousands of Nigerian Naira Note Dec-2014 Dec-2013 Dec-2014 Dec-2013
Wages and salaries 25,980,737 22,479,004 20,707,517 19,055,211
Contributions to defined contribution plans 927,857 813,988 688,740 687,412
Defined benefit costs 39 (608,525) (402,337) (608,525) (402,337)
Cash-settled share-based payments (see 17(b)
below) 153,622 (122,551) - -
Other staff cost 988,410 993,344 248,811 284,983
27,442,101 23,761,448 21,036,543 19,625,269
Staff loans
Staff received loans at below the market interest rate. These loans are measured at fair value at initial recognition. The
difference between the PV of cash flows discounted at the contractual rate and PV of cash flows discounted at market
rate has been recognised as prepaid employee benefit which is amortised to personnel expense (other staff cost) over
the life of the loan.
Cash- settled share-based payments
The Group operates a cash-settled share based compensation plan (share appreciation rights (SARs)) for its management
personnel. The management personnel are entitled to the share appreciation rights after spending ten years in the Bank.
The amount of cash payment is determined based on the fair value of the shares of the Bank. The details of SARs granted
at the reporting date are provided below:
In thousands Number of shares
SARs granted to senior management employees at 31 December 2014 401,415
SARs granted to senior management employees at 31 December 2013 406,626
231
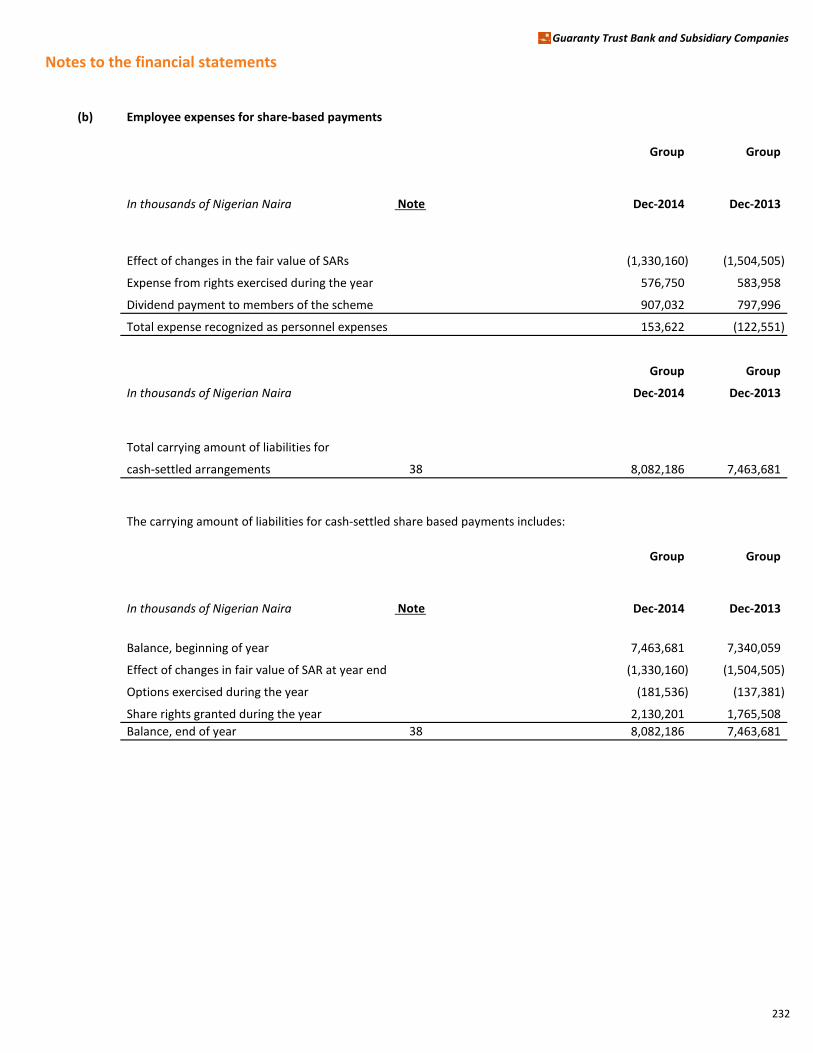
Notes to the financial statements
Guaranty Trust Bank and Subsidiary Companies
(b) Employee expenses for share-based payments
Group Group
In thousands of Nigerian Naira Note Dec-2014 Dec-2013
Effect of changes in the fair value of SARs (1,330,160) (1,504,505)
Expense from rights exercised during the year 576,750 583,958
Dividend payment to members of the scheme 907,032 797,996
Total expense recognized as personnel expenses 153,622 (122,551)
Group Group
In thousands of Nigerian Naira Dec-2014 Dec-2013
Total carrying amount of liabilities for
cash-settled arrangements 38 8,082,186 7,463,681
The carrying amount of liabilities for cash-settled share based payments includes:
Group Group
In thousands of Nigerian Naira Note Dec-2014 Dec-2013
Balance, beginning of year 7,463,681 7,340,059
Effect of changes in fair value of SAR at year end (1,330,160) (1,504,505)
Options exercised during the year (181,536) (137,381)
Share rights granted during the year 2,130,201 1,765,508
Balance, end of year 38 8,082,186 7,463,681
232
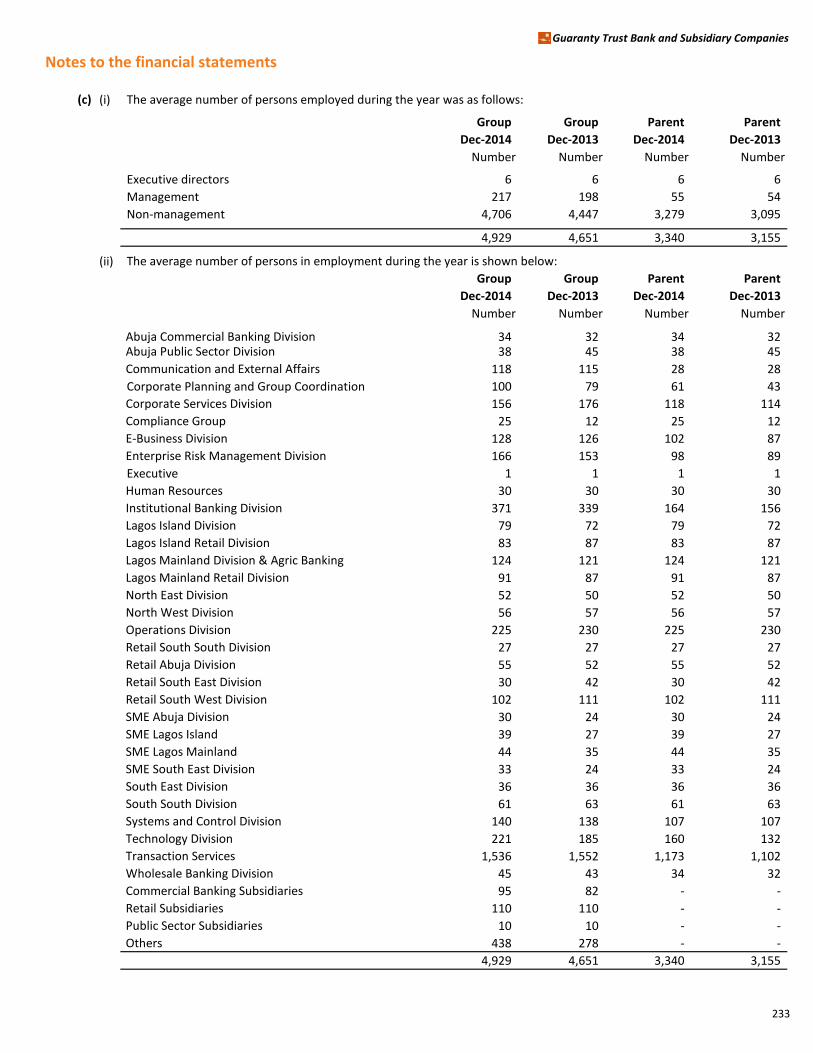
Notes to the financial statements
Guaranty Trust Bank and Subsidiary Companies
(c) (i) The average number of persons employed during the year was as follows:
Group Group Parent Parent
Dec-2014 Dec-2013 Dec-2014 Dec-2013
Number Number Number Number
Executive directors 6 6 6 6
Management 217 198 55 54
Non-management 4,706 4,447 3,279 3,095
4,929 4,651 3,340 3,155
(ii) The average number of persons in employment during the year is shown below:
Group Group Parent Parent
Dec-2014 Dec-2013 Dec-2014 Dec-2013
Number Number Number Number
Abuja Commercial Banking Division 34 32 34 32 Abuja Public Sector Division 38 45 38 45
Communication and External Affairs 118 115 28 28
Corporate Planning and Group Coordination 100 79 61 43
Corporate Services Division 156 176 118 114
Compliance Group 25 12 25 12
E-Business Division 128 126 102 87
Enterprise Risk Management Division 166 153 98 89
Executive 1 1 1 1
Human Resources 30 30 30 30
Institutional Banking Division 371 339 164 156
Lagos Island Division 79 72 79 72
Lagos Island Retail Division 83 87 83 87
Lagos Mainland Division & Agric Banking 124 121 124 121
Lagos Mainland Retail Division 91 87 91 87
North East Division 52 50 52 50
North West Division 56 57 56 57
Operations Division 225 230 225 230
Retail South South Division 27 27 27 27
Retail Abuja Division 55 52 55 52
Retail South East Division 30 42 30 42
Retail South West Division 102 111 102 111
SME Abuja Division 30 24 30 24
SME Lagos Island 39 27 39 27
SME Lagos Mainland 44 35 44 35
SME South East Division 33 24 33 24
South East Division 36 36 36 36
South South Division 61 63 61 63
Systems and Control Division 140 138 107 107
Technology Division 221 185 160 132
Transaction Services 1,536 1,552 1,173 1,102
Wholesale Banking Division 45 43 34 32
Commercial Banking Subsidiaries 95 82 - -
Retail Subsidiaries 110 110 - -
Public Sector Subsidiaries 10 10 - -
Others 438 278 - -
4,929 4,651 3,340 3,155
233

Notes to the financial statements
Guaranty Trust Bank and Subsidiary Companies
(iii) Average number of employees other than directors, earning more than N720,000 per annum, received emoluments
(excluding pension contributions and certain benefits) in the following ranges:
Group Group Parent Parent
Dec-2014 Dec-2013 Dec-2014 Dec-2013
Number Number Number Number
N720,001 - N1,400,000 1,361 1,248 - -
N1,400,001 - N2,050,000 496 284 458 221
N2,190,001 - N2,330,000 51 52 - 1
N2,330,001 - N2,840,000 9 16 - -
N2,840,001 - N3,000,000 11 13 - -
N3,001,001 - N3,830,000 985 974 969 957
N3,830,001 - N4,530,000 4 6 - -
N4,530,001 - N5,930,000 567 548 561 544
N6,000,001 - N6,800,000 488 532 483 514
N6,800,001 - N7,300,000 9 19 - -
N7,300,001 - N7,800,000 361 392 332 384
N7,800,001 - N8,600,000 5 6 - -
N8,600,001 - N11,800,000 378 367 366 360
Above N11,800,000 198 188 165 168
4,923 4,645 3,334 3,149
18 General and administrative expensesGroup Group Parent Parent
In thousands of Nigerian Naira Dec-2014 Dec-2013 Dec-2014 Dec-2013
Stationery and postage 2,473,760 1,978,642 2,213,886 1,804,026
Business travel expenses 829,233 906,690 562,505 823,009
Advert, promotion and corporate gifts 6,140,857 4,823,523 5,633,065 4,474,748
Repairs and maintenance 4,431,725 3,825,739 3,884,056 3,468,893
Occupancy costs 4,334,097 3,483,295 3,123,614 2,743,729
Directors' emoluments 512,409 366,194 220,891 216,910
Contract services 7,413,762 7,166,090 6,598,926 6,546,207
26,135,843 22,550,173 22,236,943 20,077,522
234
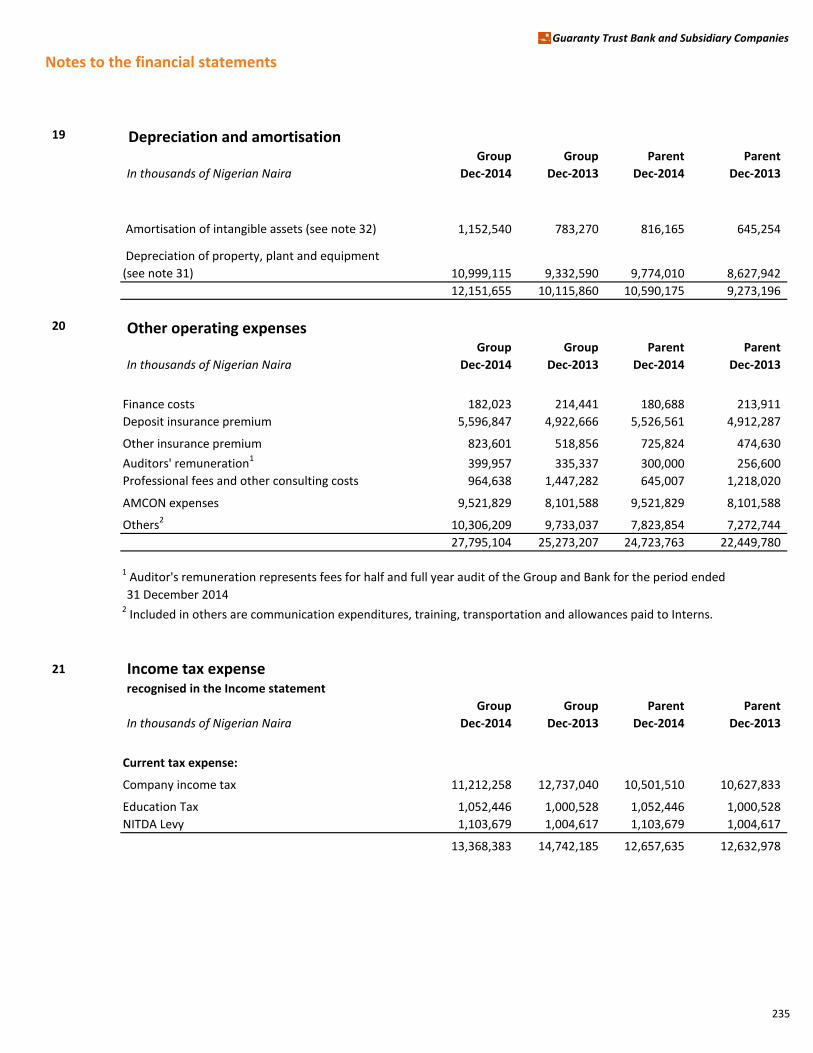
Notes to the financial statements
Guaranty Trust Bank and Subsidiary Companies
19 Depreciation and amortisationGroup Group Parent Parent
In thousands of Nigerian Naira Dec-2014 Dec-2013 Dec-2014 Dec-2013
Amortisation of intangible assets (see note 32) 1,152,540 783,270 816,165 645,254
Depreciation of property, plant and equipment
(see note 31) 10,999,115 9,332,590 9,774,010 8,627,942
12,151,655 10,115,860 10,590,175 9,273,196
20 Other operating expenses Group Group Parent Parent
In thousands of Nigerian Naira Dec-2014 Dec-2013 Dec-2014 Dec-2013
Finance costs 182,023 214,441 180,688 213,911
Deposit insurance premium 5,596,847 4,922,666 5,526,561 4,912,287
Other insurance premium 823,601 518,856 725,824 474,630
Auditors' remuneration1399,957 335,337 300,000 256,600
Professional fees and other consulting costs 964,638 1,447,282 645,007 1,218,020
AMCON expenses 9,521,829 8,101,588 9,521,829 8,101,588
Others210,306,209 9,733,037 7,823,854 7,272,744
27,795,104 25,273,207 24,723,763 22,449,780
1 Auditor's remuneration represents fees for half and full year audit of the Group and Bank for the period ended
31 December 20142 Included in others are communication expenditures, training, transportation and allowances paid to Interns.
21 Income tax expense recognised in the Income statement
Group Group Parent Parent
In thousands of Nigerian Naira Dec-2014 Dec-2013 Dec-2014 Dec-2013
Current tax expense:
Company income tax 11,212,258 12,737,040 10,501,510 10,627,833
Education Tax 1,052,446 1,000,528 1,052,446 1,000,528
NITDA Levy 1,103,679 1,004,617 1,103,679 1,004,617
13,368,383 14,742,185 12,657,635 12,632,978
235

Notes to the financial statements
Guaranty Trust Bank and Subsidiary Companies
Deferred tax expense:
Charges on capital allowance 3,115,259 1,395,423 3,115,259 1,395,423
Origination of temporary differences 1,207,282 929,671 1,163,353 887,818
Deferred tax expense transferred to disposal
group - - - -
17,690,924 17,067,279 16,936,247 14,916,219
Reconciliation of effective tax rate
Group
In thousands of Nigerian Naira Dec-2014 Dec-2014 Dec-2013 Dec-2013
Profit before income tax 116,385,843 107,091,256
Income tax using the domestic corporation tax rate 34,915,753 30.0% 32,127,377 30.0%
Effect of tax rates in foreign jurisdictions (1,050,720) -0.9% 162,201 0.2%
Tax reliefs/WHT Credits (689,032) -0.6% (497,326) -0.5%
Net capital allowance (4,596,150) -3.9% (3,882,764) -3.6%
Non-deductible expenses 3,517,433 3.0% 4,009,821 3.7%
Education tax levy 1,052,446 0.9% 1,000,528 0.9%
NITDEF tax levy 1,103,679 0.9% 1,004,617 0.9%
Tax exempt income (16,231,380) -13.9% (16,555,790) -15.5%
Deductible expenses (331,105) -0.3% (301,385) -0.3%
Total income tax expense in comprehensive income 17,690,924 15.2% 17,067,279 15.9%
Reconciliation of effective tax rate
Parent
In thousands of Nigerian Naira Dec-2014 Dec-2014 Dec-2013 Dec-2013
Profit before income tax 110,367,851 100,461,729
Income tax using the domestic corporation tax rate 33,110,356 30.0% 30,138,518 30.0%
Tax reliefs/WHT Credits (689,032) -0.6% (497,326) -0.5%
Net capital allowance (4,596,150) -4.2% (3,882,764) -3.9%
Non-deductible expenses 3,517,433 3.2% 4,009,821 4.0%
Education tax levy 1,052,446 1.0% 1,000,528 1.0%
NITDEF tax levy 1,103,679 1.0% 1,004,617 1.0%
Tax exempt income (16,231,380) -14.7% (16,555,790) -16.5%
Deductible expenses (331,105) -0.3% (301,385) -0.3%
Total income tax expense in comprehensive income 16,936,247 15.3% 14,916,219 14.8%
236

Notes to the financial statements
Guaranty Trust Bank and Subsidiary Companies
Income tax recognised in other comprehensive income
Group Group Parent Parent
In thousands of Nigerian Naira Dec-2014 Dec-2013 Dec-2014 Dec-2013
Income tax relating to actuarial gains and losses (238,800) 196,731 (238,800) 196,731
Income tax relating to foreign currency
translation differences for foreign operations (435,711) (311,893) - -
Income tax relating to net change in fair value of
available for sale financial assets (1,720,197) 1,224,129 (1,753,071) 1,166,147
(2,394,708) 1,108,967 (1,991,871) 1,362,878
(b) Current income tax payable
The movement on the current income tax payable account during the year was as follows:
Group Group Parent Parent
In thousands of Nigerian Naira Dec-2014 Dec-2013 Dec-2014 Dec-2013
Balance, beginning of the year 13,073,847 15,630,973 12,632,975 15,340,116
Exchange difference on translation (101,218) (159,848) - -
Charge for the year 13,368,383 14,742,185 12,657,635 12,632,978
Payments during the year (15,132,105) (17,198,130) (12,632,976) (15,340,119)
Liabilities on acquisition of subsidiaries - 58,667 - -
Balance, end of the year 11,208,907 13,073,847 12,657,634 12,632,975
237

Notes to the financial statements
Guaranty Trust Bank and Subsidiary Companies
22 Basic and Diluted earnings per share
Basic earnings per share is calculated by dividing the net profit attributable to equity holders of the company by the
weighted average number of ordinary shares in issue during the year, excluding the average number of ordinary shares
purchased by the company and held as treasury shares.
The calculation of basic earnings per share for the reporting period was based on the profit atttributable to ordinary
shareholders of N97,997,286,000 and a weighted average number of ordinary shares outstanding of 28,219,671,660 and
it is calculated as follows:
Profit attributable to ordinary shareholders
Group Group Parent Parent
In thousands of Nigerian Naira Dec-2014 Dec-2013 Dec-2014 Dec-2013
Net profit attributable to equity holders 97,997,286 89,599,095 93,431,604 85,545,510
Interest expense on convertible debt (net of tax) - - - -
Net profit used to determine diluted earnings
per share 97,997,286 89,599,095 93,431,604 85,545,510
Number of ordinary shares
Group Group Parent Parent
In thousands of shares Dec-2014 Dec-2013 Dec-2014 Dec-2013
Weighted average number of ordinary shares in
issue 28,219,672 28,260,505 29,431,179 29,431,179
Basic earnings per share (expressed in naira per
share) 3.47 3.17 3.17 2.91
The Group does not have any dilutive potential ordinary shares. Therefore, Basic EPS and Diluted EPS are the same
for the Group.
238
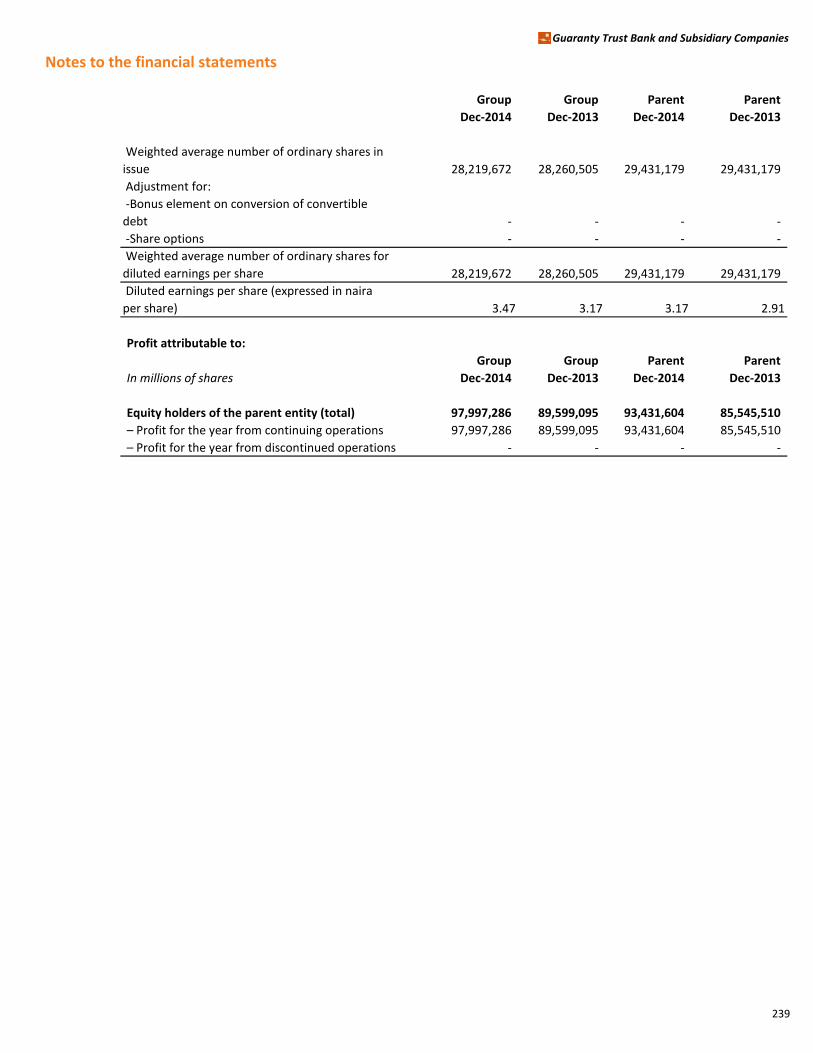
Notes to the financial statements
Guaranty Trust Bank and Subsidiary Companies
Group Group Parent Parent
Dec-2014 Dec-2013 Dec-2014 Dec-2013
Weighted average number of ordinary shares in
issue 28,219,672 28,260,505 29,431,179 29,431,179
Adjustment for:
-Bonus element on conversion of convertible
debt - - - -
-Share options - - - -
Weighted average number of ordinary shares for
diluted earnings per share 28,219,672 28,260,505 29,431,179 29,431,179
Diluted earnings per share (expressed in naira
per share) 3.47 3.17 3.17 2.91
Profit attributable to:
Group Group Parent Parent
In millions of shares Dec-2014 Dec-2013 Dec-2014 Dec-2013
Equity holders of the parent entity (total) 97,997,286 89,599,095 93,431,604 85,545,510
– Profit for the year from continuing operations 97,997,286 89,599,095 93,431,604 85,545,510
– Profit for the year from discontinued operations - - - -
239
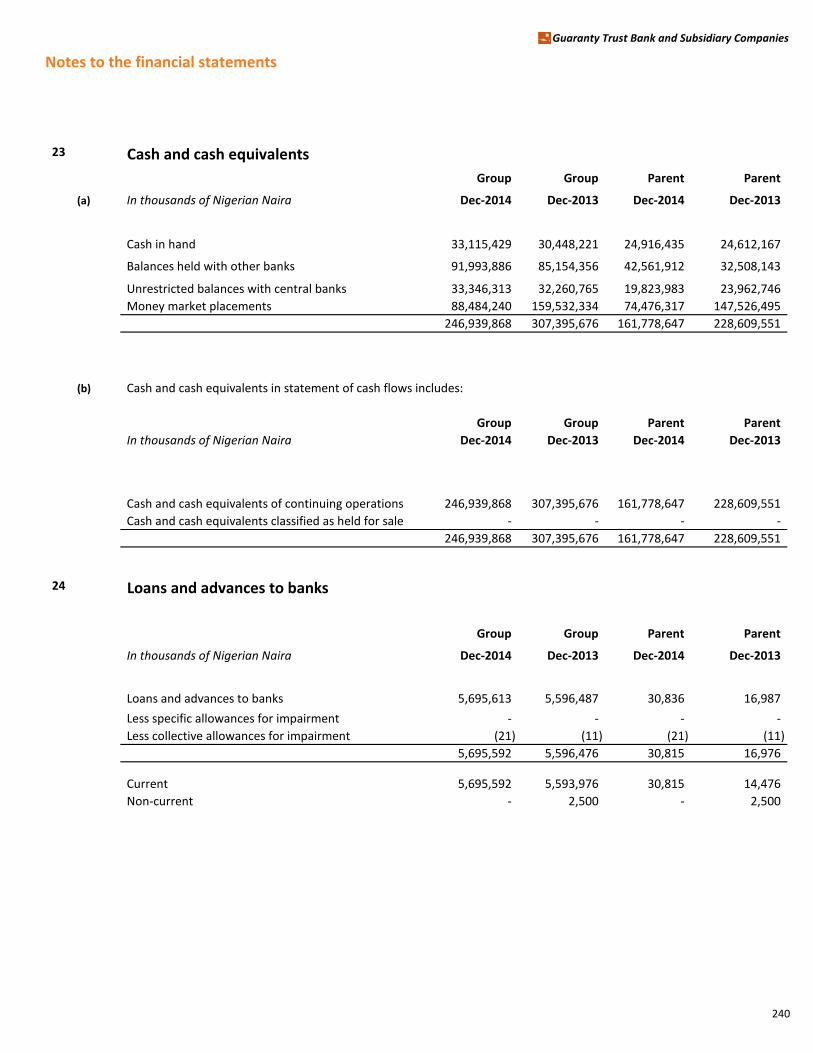
Notes to the financial statements
Guaranty Trust Bank and Subsidiary Companies
23 Cash and cash equivalents
Group Group Parent Parent
(a) In thousands of Nigerian Naira Dec-2014 Dec-2013 Dec-2014 Dec-2013
Cash in hand 33,115,429 30,448,221 24,916,435 24,612,167
Balances held with other banks 91,993,886 85,154,356 42,561,912 32,508,143
Unrestricted balances with central banks 33,346,313 32,260,765 19,823,983 23,962,746
Money market placements 88,484,240 159,532,334 74,476,317 147,526,495
246,939,868 307,395,676 161,778,647 228,609,551
(b) Cash and cash equivalents in statement of cash flows includes:
Group Group Parent Parent
In thousands of Nigerian Naira Dec-2014 Dec-2013 Dec-2014 Dec-2013
Cash and cash equivalents of continuing operations 246,939,868 307,395,676 161,778,647 228,609,551
Cash and cash equivalents classified as held for sale - - - -
246,939,868 307,395,676 161,778,647 228,609,551
24 Loans and advances to banks
Group Group Parent Parent
In thousands of Nigerian Naira Dec-2014 Dec-2013 Dec-2014 Dec-2013
Loans and advances to banks 5,695,613 5,596,487 30,836 16,987
Less specific allowances for impairment - - - -
Less collective allowances for impairment (21) (11) (21) (11)
5,695,592 5,596,476 30,815 16,976
Current 5,695,592 5,593,976 30,815 14,476
Non-current - 2,500 - 2,500
240
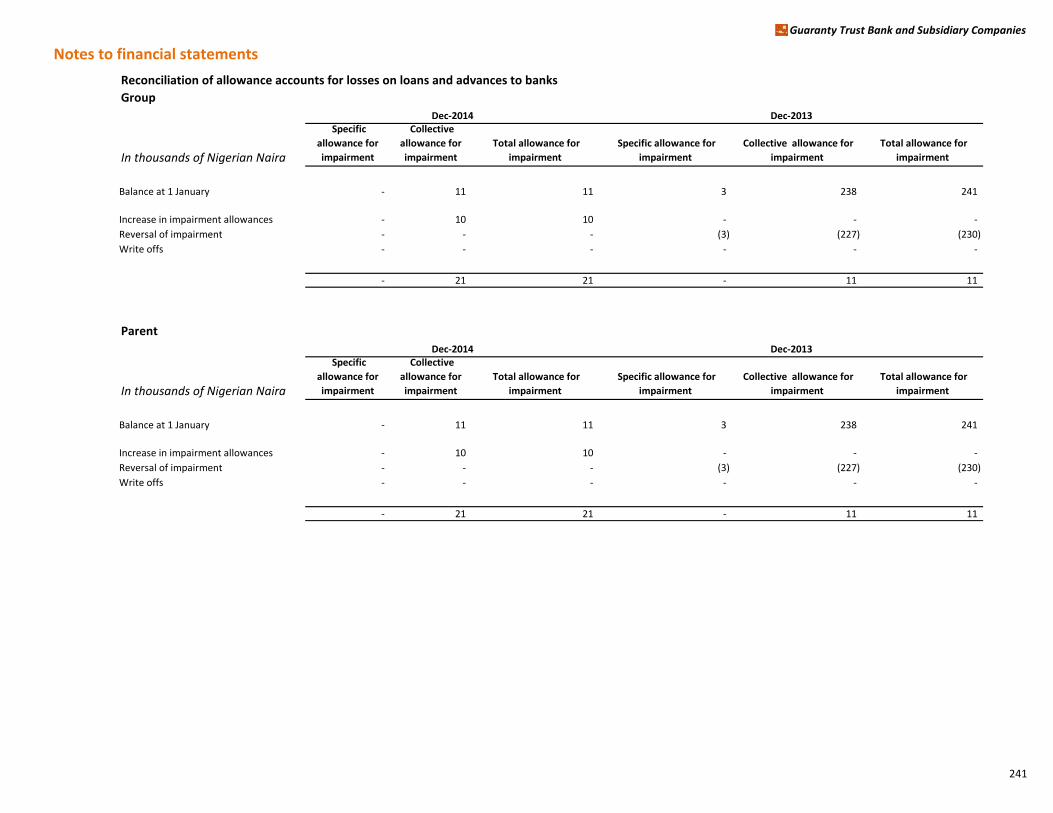
Notes to financial statements
Guaranty Trust Bank and Subsidiary Companies
Reconciliation of allowance accounts for losses on loans and advances to banks
Group
In thousands of Nigerian Naira
Specific
allowance for
impairment
Collective
allowance for
impairment
Total allowance for
impairment
Specific allowance for
impairment
Collective allowance for
impairment
Total allowance for
impairment
Balance at 1 January - 11 11 3 238 241
Increase in impairment allowances - 10 10 - - -
Reversal of impairment - - - (3) (227) (230)
Write offs - - - - - -
- 21 21 - 11 11
Parent
In thousands of Nigerian Naira
Specific
allowance for
impairment
Collective
allowance for
impairment
Total allowance for
impairment
Specific allowance for
impairment
Collective allowance for
impairment
Total allowance for
impairment
Balance at 1 January - 11 11 3 238 241
Increase in impairment allowances - 10 10 - - -
Reversal of impairment - - - (3) (227) (230)
Write offs - - - - - -
- 21 21 - 11 11
Dec-2014 Dec-2013
Dec-2014 Dec-2013
241

Notes to financial statements
Guaranty Trust Bank and Subsidiary Companies
25 Loans and advances to customersGroup Group Group Parent Parent
Dec-2014 Dec-2014 Dec-2013 Dec-2014 Dec-2013
Loans to individuals:
Loans 79,329,101 63,293,748 65,316,975 51,499,867
Overdrafts 8,506,771 6,007,841 5,815,694 3,909,684
Others16,948 38,312 - -
Gross loans 87,842,820 69,339,901 71,132,669 55,409,551
Loans (32,741) (144,040) - (124,096)
Overdrafts (317,057) (229,360) (69,838) (56,483)
Others1(850) (1,823) - -
Specific impairment (350,648) (375,223) (69,838) (180,579)
Loans (351,910) (514,115) (343,386) (509,659)
Overdrafts (332,562) (409,258) (268,199) (370,634)
Others1(221) (407) - -
Collective impairment (684,693) (923,780) (611,585) (880,293)
Loans (384,651) (658,155) (343,386) (633,755)
Overdrafts (649,619) (638,618) (338,037) (427,117)
Others1(1,071) (2,230) - -
Total impairment (1,035,341) (1,299,003) (681,423) (1,060,872)
Loans 78,944,450 62,635,593 64,973,589 50,866,112
Overdrafts 7,857,152 5,369,223 5,477,657 3,482,567
Others15,877 36,082 - -
Carrying amount 86,807,479 68,040,898 70,451,246 54,348,679
Loans to Non-individuals:
Loans 946,454,911 681,789,473 907,178,355 663,015,973
Overdrafts 174,990,995 136,981,234 142,378,503 100,729,165
Others197,012,660 138,076,535 87,762,518 127,811,953
Gross loans 1,218,458,566 956,847,242 1,137,319,376 891,557,091
Loans (14,066,172) (10,545,114) (12,283,990) (9,160,378)
Overdrafts (7,013,627) (3,966,149) (6,195,852) (3,370,230)
Others1(1,042,253) (1,536,240) - (417,178)
Specific impairment (22,122,052) (16,047,503) (18,479,842) (12,947,786)
Loans (4,689,538) (4,044,803) (4,412,610) (3,830,771)
Overdrafts (2,420,835) (2,192,263) (2,293,763) (2,100,155)
Others1(352,485) (232,933) (190,533) (59,965)
Collective impairment (7,462,858) (6,469,999) (6,896,906) (5,990,891)
Loans (18,755,710) (14,589,917) (16,696,600) (12,991,149)
Overdrafts (9,434,462) (6,158,412) (8,489,615) (5,470,385)
Others1(1,394,738) (1,769,173) (190,533) (477,143)
Total impairment (29,584,910) (22,517,502) (25,376,748) (18,938,677)
Loans 927,699,201 667,199,556 890,481,755 650,024,824
Overdrafts 165,556,533 130,822,822 133,888,888 95,258,780
Others195,617,922 136,307,362 87,571,985 127,334,810
Carrying amount 1,188,873,656 934,329,740 1,111,942,628 872,618,414
Total carrying amount (individual and non
individual) 1,275,681,135 1,002,370,638 1,182,393,874 926,967,093
1 Others include CBN Commercial Agric Credit Scheme (CACS) loans, Bank of Industry (BOI) and Usances.
Group Group Parent Parent
In thousands of Nigerian Naira Dec-2014 Dec-2013 Dec-2014 Dec-2013
Current 734,167,463 578,465,833 660,309,541 529,684,728
Non-current 541,513,672 423,904,805 522,084,333 397,282,365
242
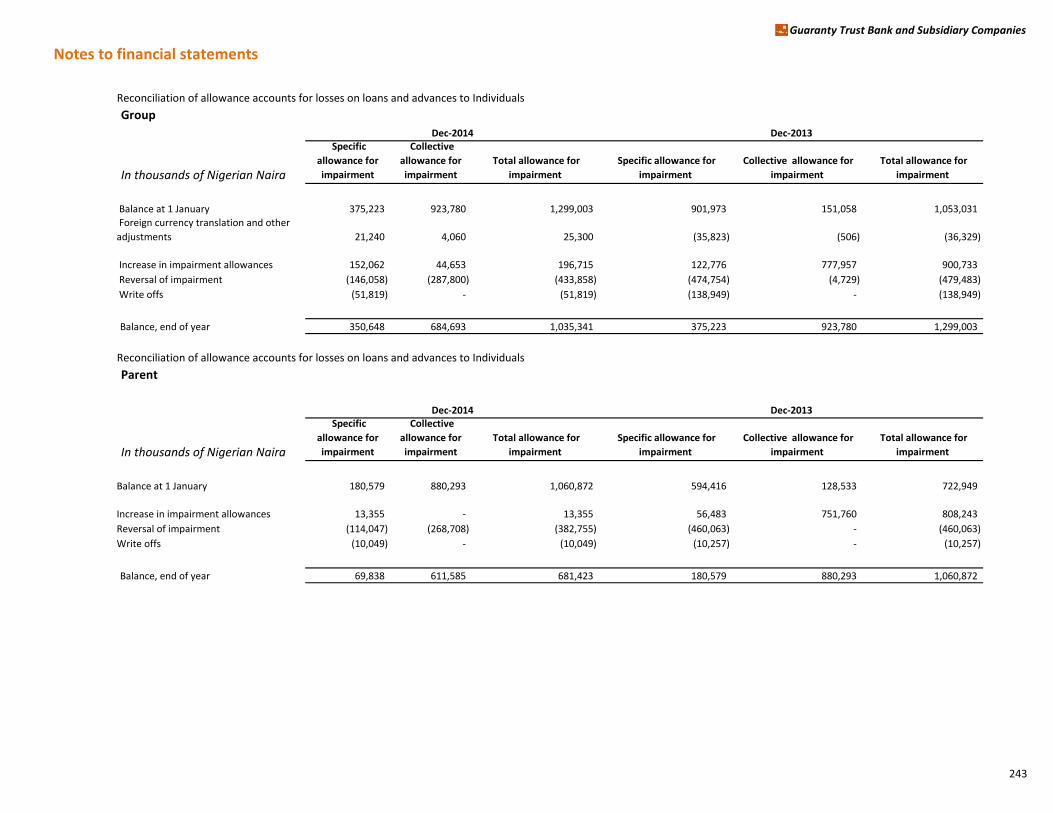
Notes to financial statements
Guaranty Trust Bank and Subsidiary Companies
Reconciliation of allowance accounts for losses on loans and advances to Individuals
Group
In thousands of Nigerian Naira
Specific
allowance for
impairment
Collective
allowance for
impairment
Total allowance for
impairment
Specific allowance for
impairment
Collective allowance for
impairment
Total allowance for
impairment
Balance at 1 January 375,223 923,780 1,299,003 901,973 151,058 1,053,031
Foreign currency translation and other
adjustments 21,240 4,060 25,300 (35,823) (506) (36,329)
Increase in impairment allowances 152,062 44,653 196,715 122,776 777,957 900,733
Reversal of impairment (146,058) (287,800) (433,858) (474,754) (4,729) (479,483)
Write offs (51,819) - (51,819) (138,949) - (138,949)
Balance, end of year 350,648 684,693 1,035,341 375,223 923,780 1,299,003
Reconciliation of allowance accounts for losses on loans and advances to Individuals
Parent
In thousands of Nigerian Naira
Specific
allowance for
impairment
Collective
allowance for
impairment
Total allowance for
impairment
Specific allowance for
impairment
Collective allowance for
impairment
Total allowance for
impairment
Balance at 1 January 180,579 880,293 1,060,872 594,416 128,533 722,949
Increase in impairment allowances 13,355 - 13,355 56,483 751,760 808,243
Reversal of impairment (114,047) (268,708) (382,755) (460,063) - (460,063)
Write offs (10,049) - (10,049) (10,257) - (10,257)
Balance, end of year 69,838 611,585 681,423 180,579 880,293 1,060,872
Dec-2014 Dec-2013
Dec-2014 Dec-2013
243
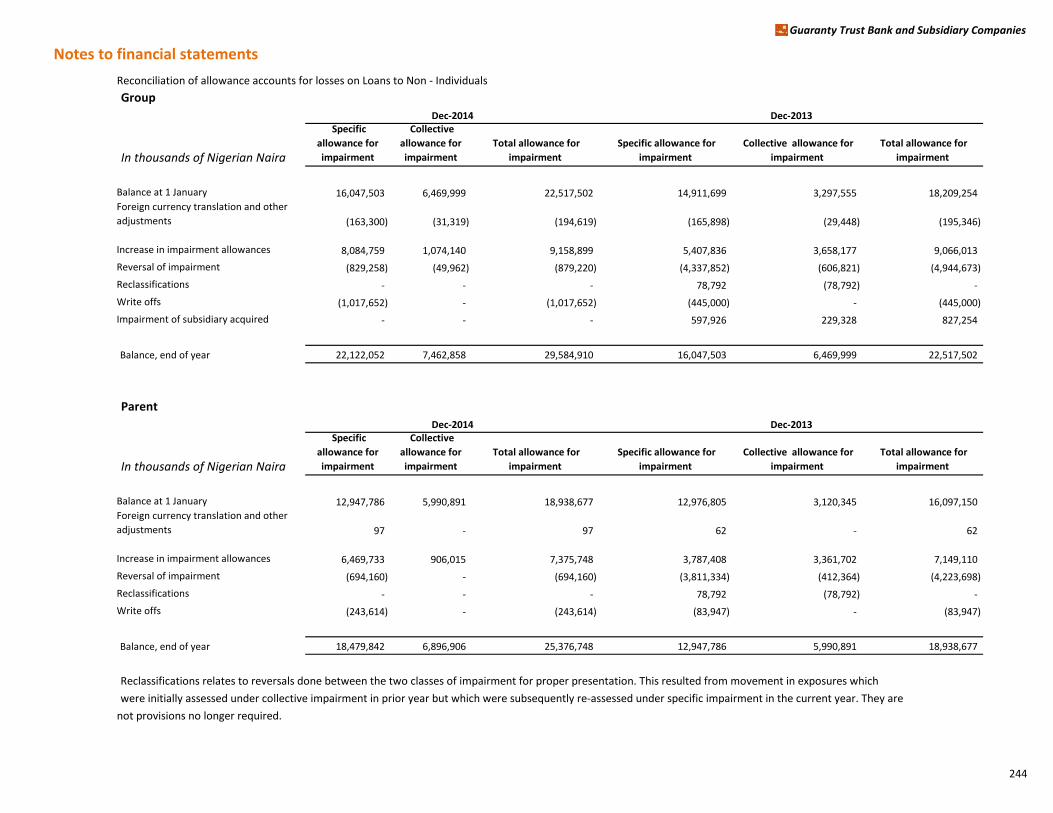
Notes to financial statements
Guaranty Trust Bank and Subsidiary Companies
Reconciliation of allowance accounts for losses on Loans to Non - Individuals
Group
In thousands of Nigerian Naira
Specific
allowance for
impairment
Collective
allowance for
impairment
Total allowance for
impairment
Specific allowance for
impairment
Collective allowance for
impairment
Total allowance for
impairment
Balance at 1 January 16,047,503 6,469,999 22,517,502 14,911,699 3,297,555 18,209,254
Foreign currency translation and other
adjustments (163,300) (31,319) (194,619) (165,898) (29,448) (195,346)
Increase in impairment allowances 8,084,759 1,074,140 9,158,899 5,407,836 3,658,177 9,066,013
Reversal of impairment (829,258) (49,962) (879,220) (4,337,852) (606,821) (4,944,673)
Reclassifications - - - 78,792 (78,792) -
Write offs (1,017,652) - (1,017,652) (445,000) - (445,000)
Impairment of subsidiary acquired - - - 597,926 229,328 827,254
Balance, end of year 22,122,052 7,462,858 29,584,910 16,047,503 6,469,999 22,517,502
Parent
In thousands of Nigerian Naira
Specific
allowance for
impairment
Collective
allowance for
impairment
Total allowance for
impairment
Specific allowance for
impairment
Collective allowance for
impairment
Total allowance for
impairment
Balance at 1 January 12,947,786 5,990,891 18,938,677 12,976,805 3,120,345 16,097,150 Foreign currency translation and other
adjustments 97 - 97 62 - 62
Increase in impairment allowances 6,469,733 906,015 7,375,748 3,787,408 3,361,702 7,149,110
Reversal of impairment (694,160) - (694,160) (3,811,334) (412,364) (4,223,698)
Reclassifications - - - 78,792 (78,792) -
Write offs (243,614) - (243,614) (83,947) - (83,947)
Balance, end of year 18,479,842 6,896,906 25,376,748 12,947,786 5,990,891 18,938,677
Reclassifications relates to reversals done between the two classes of impairment for proper presentation. This resulted from movement in exposures which
were initially assessed under collective impairment in prior year but which were subsequently re-assessed under specific impairment in the current year. They are
not provisions no longer required.
Dec-2014 Dec-2013
Dec-2014 Dec-2013
244

Notes to financial statements
Guaranty Trust Bank and Subsidiary Companies
Reconciliation of allowance accounts for losses on loans and advances to banks
Group
Dec-2014
In thousands of Nigerian Naira
Specific
allowance for
impairment
Collective
allowance for
impairment
Total
allowance for
impairment
Specific
allowance for
impairment
Collective
allowance for
impairment
Total
allowance for
impairment
Specific
allowance for
impairment
Collective
allowance for
impairment
Total
allowance for
impairment
Specific
allowance for
impairment
Collective
allowance for
impairment
Total
allowance for
impairment
Balance at 1 January - - - - 11 11 - - - - 11 11
Increase in impairment allowances - 4 4 - 6 6 - - - - 10 10
- 4 4 - 17 17 - - - - 21 21
Group
Dec-2013
In thousands of Nigerian Naira
Specific
allowance for
impairment
Collective
allowance for
impairment
Total
allowance for
impairment
Specific
allowance for
impairment
Collective
allowance for
impairment
Total
allowance for
impairment
Specific
allowance for
impairment
Collective
allowance for
impairment
Total
allowance for
impairment
Specific
allowance for
impairment
Collective
allowance for
impairment
Total
allowance for
impairment
Balance at 1 January - - - 3 238 241 - - - 3 238 241
Increase in impairment allowances - - - - - - - - - - - -
Reversal of impairment - - - (3) (227) (230) - - - (3) (227) (230)
Write offs - - - - - - - - - - - -
- - - - 11 11 - - - - 11 11
Parent
Dec-2014
In thousands of Nigerian Naira
Specific
allowance for
impairment
Collective
allowance for
impairment
Total
allowance for
impairment
Specific
allowance for
impairment
Collective
allowance for
impairment
Total
allowance for
impairment
Specific
allowance for
impairment
Collective
allowance for
impairment
Total
allowance for
impairment
Specific
allowance for
impairment
Collective
allowance for
impairment
Total
allowance for
impairment
Balance at 1 January - - - - 11 11 - - - - 11 11
Increase in impairment allowances - 4 4 - 6 6 - - - - 10 10
Reversal of impairment - - - - - - - - - - - -
- 4 4 - 17 17 - - - - 21 21
Loans Overdrafts Others Total
Loans Overdrafts Others Total
Loans Overdrafts Others Total
245
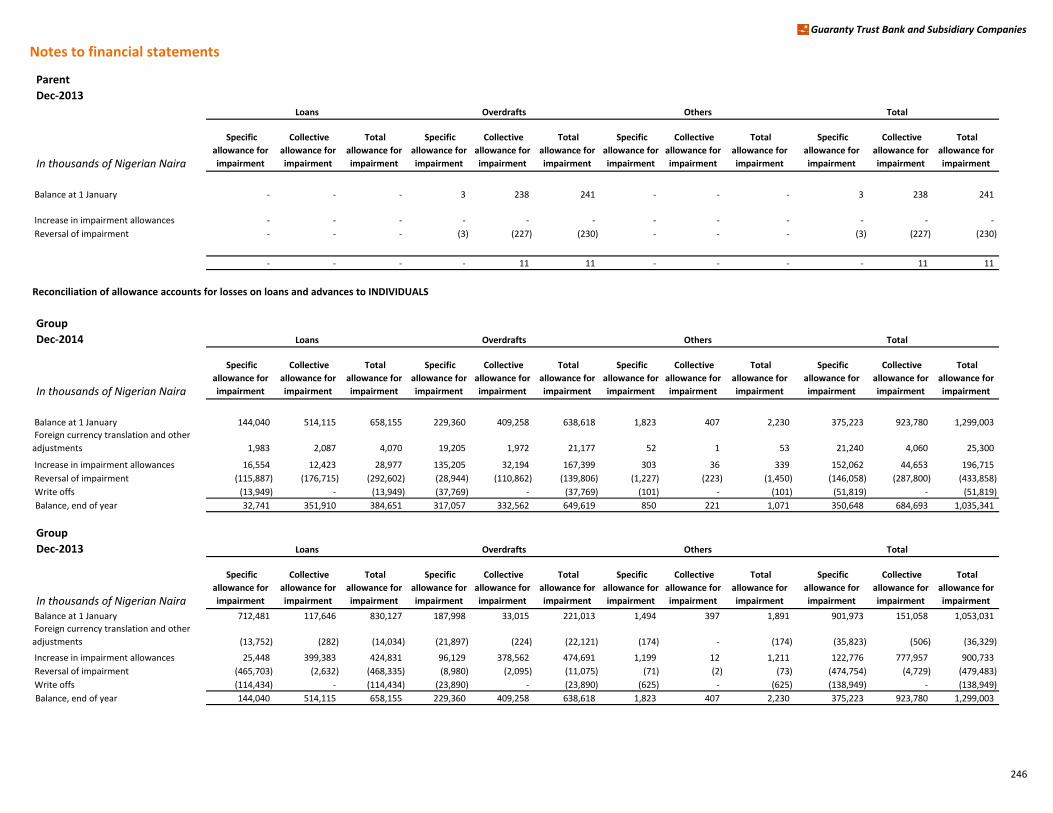
Notes to financial statements
Guaranty Trust Bank and Subsidiary Companies
Parent
Dec-2013
In thousands of Nigerian Naira
Specific
allowance for
impairment
Collective
allowance for
impairment
Total
allowance for
impairment
Specific
allowance for
impairment
Collective
allowance for
impairment
Total
allowance for
impairment
Specific
allowance for
impairment
Collective
allowance for
impairment
Total
allowance for
impairment
Specific
allowance for
impairment
Collective
allowance for
impairment
Total
allowance for
impairment
Balance at 1 January - - - 3 238 241 - - - 3 238 241
Increase in impairment allowances - - - - - - - - - - - -
Reversal of impairment - - - (3) (227) (230) - - - (3) (227) (230)
- - - - 11 11 - - - - 11 11
Reconciliation of allowance accounts for losses on loans and advances to INDIVIDUALS
Group
Dec-2014
In thousands of Nigerian Naira
Specific
allowance for
impairment
Collective
allowance for
impairment
Total
allowance for
impairment
Specific
allowance for
impairment
Collective
allowance for
impairment
Total
allowance for
impairment
Specific
allowance for
impairment
Collective
allowance for
impairment
Total
allowance for
impairment
Specific
allowance for
impairment
Collective
allowance for
impairment
Total
allowance for
impairment
Balance at 1 January 144,040 514,115 658,155 229,360 409,258 638,618 1,823 407 2,230 375,223 923,780 1,299,003
Foreign currency translation and other
adjustments 1,983 2,087 4,070 19,205 1,972 21,177 52 1 53 21,240 4,060 25,300
Increase in impairment allowances 16,554 12,423 28,977 135,205 32,194 167,399 303 36 339 152,062 44,653 196,715
Reversal of impairment (115,887) (176,715) (292,602) (28,944) (110,862) (139,806) (1,227) (223) (1,450) (146,058) (287,800) (433,858)
Write offs (13,949) - (13,949) (37,769) - (37,769) (101) - (101) (51,819) - (51,819)
Balance, end of year 32,741 351,910 384,651 317,057 332,562 649,619 850 221 1,071 350,648 684,693 1,035,341
Group
Dec-2013
In thousands of Nigerian Naira
Specific
allowance for
impairment
Collective
allowance for
impairment
Total
allowance for
impairment
Specific
allowance for
impairment
Collective
allowance for
impairment
Total
allowance for
impairment
Specific
allowance for
impairment
Collective
allowance for
impairment
Total
allowance for
impairment
Specific
allowance for
impairment
Collective
allowance for
impairment
Total
allowance for
impairment
Balance at 1 January 712,481 117,646 830,127 187,998 33,015 221,013 1,494 397 1,891 901,973 151,058 1,053,031
Foreign currency translation and other
adjustments (13,752) (282) (14,034) (21,897) (224) (22,121) (174) - (174) (35,823) (506) (36,329)
Increase in impairment allowances 25,448 399,383 424,831 96,129 378,562 474,691 1,199 12 1,211 122,776 777,957 900,733
Reversal of impairment (465,703) (2,632) (468,335) (8,980) (2,095) (11,075) (71) (2) (73) (474,754) (4,729) (479,483)
Write offs (114,434) - (114,434) (23,890) - (23,890) (625) - (625) (138,949) - (138,949)
Balance, end of year 144,040 514,115 658,155 229,360 409,258 638,618 1,823 407 2,230 375,223 923,780 1,299,003
Loans Overdrafts Others Total
Loans Overdrafts Others Total
Loans Overdrafts Others Total
246
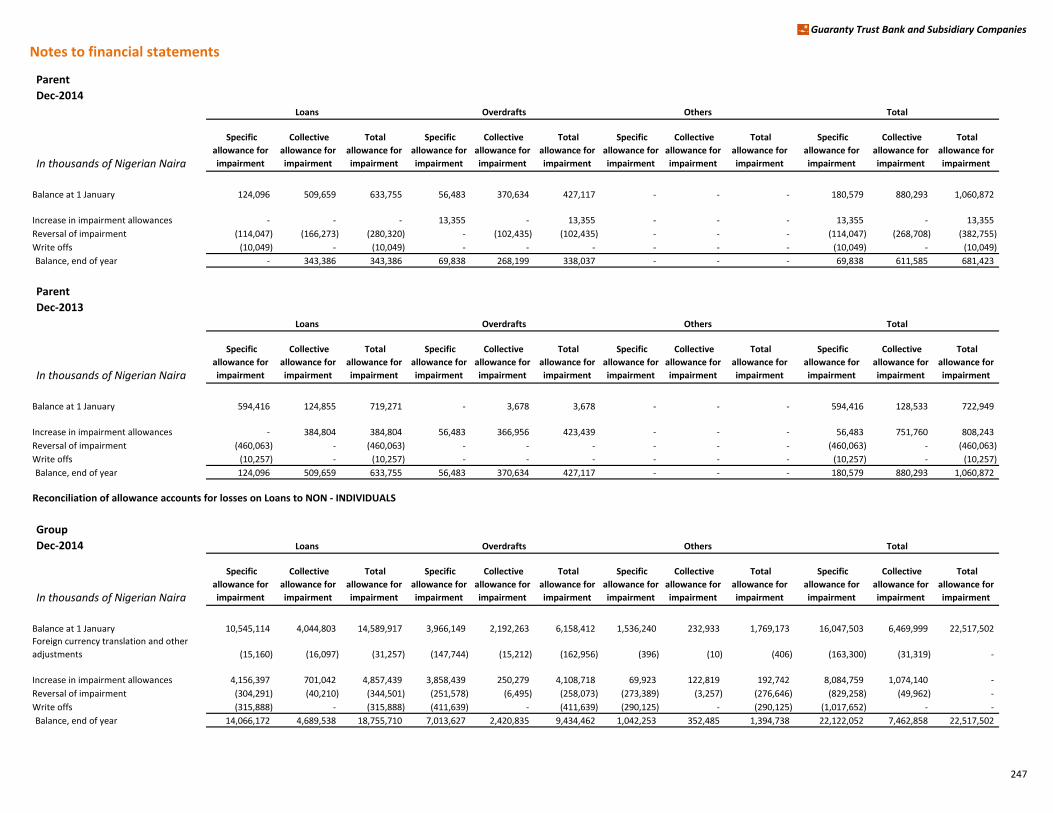
Notes to financial statements
Guaranty Trust Bank and Subsidiary Companies
Parent
Dec-2014
In thousands of Nigerian Naira
Specific
allowance for
impairment
Collective
allowance for
impairment
Total
allowance for
impairment
Specific
allowance for
impairment
Collective
allowance for
impairment
Total
allowance for
impairment
Specific
allowance for
impairment
Collective
allowance for
impairment
Total
allowance for
impairment
Specific
allowance for
impairment
Collective
allowance for
impairment
Total
allowance for
impairment
Balance at 1 January 124,096 509,659 633,755 56,483 370,634 427,117 - - - 180,579 880,293 1,060,872
Increase in impairment allowances - - - 13,355 - 13,355 - - - 13,355 - 13,355
Reversal of impairment (114,047) (166,273) (280,320) - (102,435) (102,435) - - - (114,047) (268,708) (382,755)
Write offs (10,049) - (10,049) - - - - - - (10,049) - (10,049)
Balance, end of year - 343,386 343,386 69,838 268,199 338,037 - - - 69,838 611,585 681,423
Parent
Dec-2013
In thousands of Nigerian Naira
Specific
allowance for
impairment
Collective
allowance for
impairment
Total
allowance for
impairment
Specific
allowance for
impairment
Collective
allowance for
impairment
Total
allowance for
impairment
Specific
allowance for
impairment
Collective
allowance for
impairment
Total
allowance for
impairment
Specific
allowance for
impairment
Collective
allowance for
impairment
Total
allowance for
impairment
Balance at 1 January 594,416 124,855 719,271 - 3,678 3,678 - - - 594,416 128,533 722,949
Increase in impairment allowances - 384,804 384,804 56,483 366,956 423,439 - - - 56,483 751,760 808,243
Reversal of impairment (460,063) - (460,063) - - - - - - (460,063) - (460,063)
Write offs (10,257) - (10,257) - - - - - - (10,257) - (10,257)
Balance, end of year 124,096 509,659 633,755 56,483 370,634 427,117 - - - 180,579 880,293 1,060,872
Reconciliation of allowance accounts for losses on Loans to NON - INDIVIDUALS
Group
Dec-2014
In thousands of Nigerian Naira
Specific
allowance for
impairment
Collective
allowance for
impairment
Total
allowance for
impairment
Specific
allowance for
impairment
Collective
allowance for
impairment
Total
allowance for
impairment
Specific
allowance for
impairment
Collective
allowance for
impairment
Total
allowance for
impairment
Specific
allowance for
impairment
Collective
allowance for
impairment
Total
allowance for
impairment
Balance at 1 January 10,545,114 4,044,803 14,589,917 3,966,149 2,192,263 6,158,412 1,536,240 232,933 1,769,173 16,047,503 6,469,999 22,517,502
Foreign currency translation and other
adjustments (15,160) (16,097) (31,257) (147,744) (15,212) (162,956) (396) (10) (406) (163,300) (31,319) -
Increase in impairment allowances 4,156,397 701,042 4,857,439 3,858,439 250,279 4,108,718 69,923 122,819 192,742 8,084,759 1,074,140 -
Reversal of impairment (304,291) (40,210) (344,501) (251,578) (6,495) (258,073) (273,389) (3,257) (276,646) (829,258) (49,962) -
Write offs (315,888) - (315,888) (411,639) - (411,639) (290,125) - (290,125) (1,017,652) - -
Balance, end of year 14,066,172 4,689,538 18,755,710 7,013,627 2,420,835 9,434,462 1,042,253 352,485 1,394,738 22,122,052 7,462,858 22,517,502
Loans Overdrafts Others Total
Loans Overdrafts Others Total
Loans Overdrafts Others Total
247
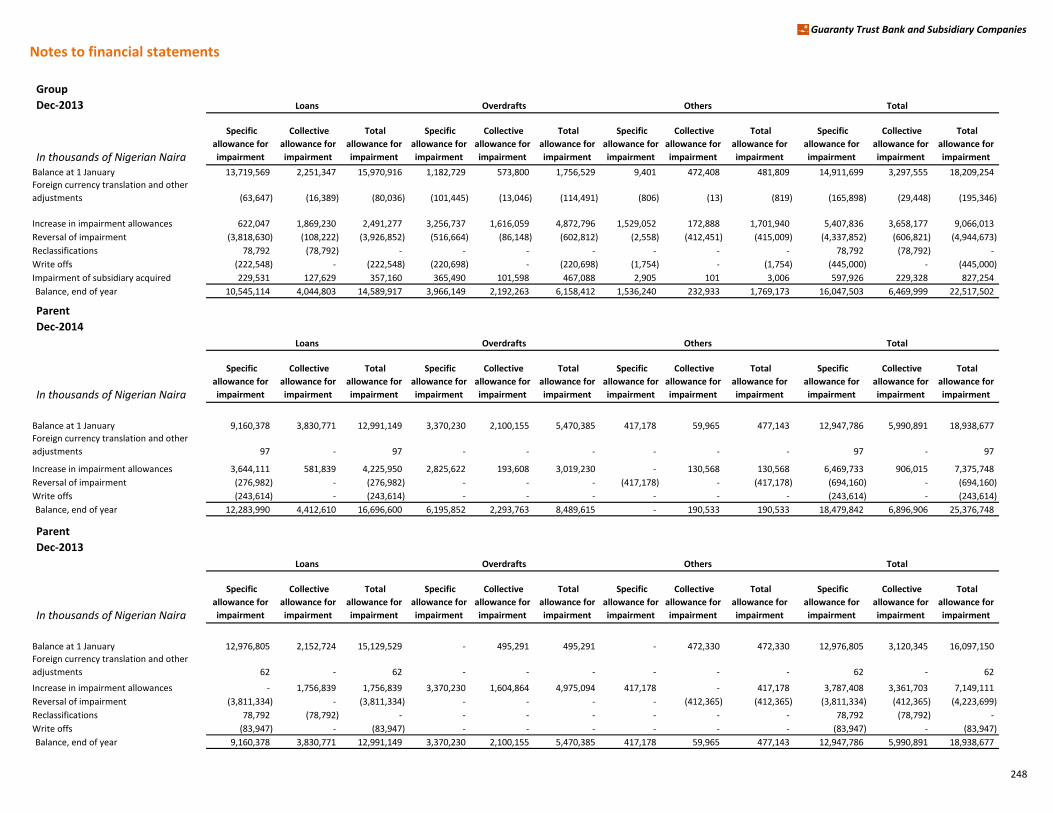
Notes to financial statements
Guaranty Trust Bank and Subsidiary Companies
Group
Dec-2013
In thousands of Nigerian Naira
Specific
allowance for
impairment
Collective
allowance for
impairment
Total
allowance for
impairment
Specific
allowance for
impairment
Collective
allowance for
impairment
Total
allowance for
impairment
Specific
allowance for
impairment
Collective
allowance for
impairment
Total
allowance for
impairment
Specific
allowance for
impairment
Collective
allowance for
impairment
Total
allowance for
impairment
Balance at 1 January 13,719,569 2,251,347 15,970,916 1,182,729 573,800 1,756,529 9,401 472,408 481,809 14,911,699 3,297,555 18,209,254
Foreign currency translation and other
adjustments (63,647) (16,389) (80,036) (101,445) (13,046) (114,491) (806) (13) (819) (165,898) (29,448) (195,346)
Increase in impairment allowances 622,047 1,869,230 2,491,277 3,256,737 1,616,059 4,872,796 1,529,052 172,888 1,701,940 5,407,836 3,658,177 9,066,013
Reversal of impairment (3,818,630) (108,222) (3,926,852) (516,664) (86,148) (602,812) (2,558) (412,451) (415,009) (4,337,852) (606,821) (4,944,673)
Reclassifications 78,792 (78,792) - - - - - - - 78,792 (78,792) -
Write offs (222,548) - (222,548) (220,698) - (220,698) (1,754) - (1,754) (445,000) - (445,000)
Impairment of subsidiary acquired 229,531 127,629 357,160 365,490 101,598 467,088 2,905 101 3,006 597,926 229,328 827,254
Balance, end of year 10,545,114 4,044,803 14,589,917 3,966,149 2,192,263 6,158,412 1,536,240 232,933 1,769,173 16,047,503 6,469,999 22,517,502
Parent
Dec-2014
In thousands of Nigerian Naira
Specific
allowance for
impairment
Collective
allowance for
impairment
Total
allowance for
impairment
Specific
allowance for
impairment
Collective
allowance for
impairment
Total
allowance for
impairment
Specific
allowance for
impairment
Collective
allowance for
impairment
Total
allowance for
impairment
Specific
allowance for
impairment
Collective
allowance for
impairment
Total
allowance for
impairment
Balance at 1 January 9,160,378 3,830,771 12,991,149 3,370,230 2,100,155 5,470,385 417,178 59,965 477,143 12,947,786 5,990,891 18,938,677
Foreign currency translation and other
adjustments 97 - 97 - - - - - - 97 - 97
Increase in impairment allowances 3,644,111 581,839 4,225,950 2,825,622 193,608 3,019,230 - 130,568 130,568 6,469,733 906,015 7,375,748
Reversal of impairment (276,982) - (276,982) - - - (417,178) - (417,178) (694,160) - (694,160)
Write offs (243,614) - (243,614) - - - - - - (243,614) - (243,614)
Balance, end of year 12,283,990 4,412,610 16,696,600 6,195,852 2,293,763 8,489,615 - 190,533 190,533 18,479,842 6,896,906 25,376,748
Parent
Dec-2013
In thousands of Nigerian Naira
Specific
allowance for
impairment
Collective
allowance for
impairment
Total
allowance for
impairment
Specific
allowance for
impairment
Collective
allowance for
impairment
Total
allowance for
impairment
Specific
allowance for
impairment
Collective
allowance for
impairment
Total
allowance for
impairment
Specific
allowance for
impairment
Collective
allowance for
impairment
Total
allowance for
impairment
Balance at 1 January 12,976,805 2,152,724 15,129,529 - 495,291 495,291 - 472,330 472,330 12,976,805 3,120,345 16,097,150
Foreign currency translation and other
adjustments 62 - 62 - - - - - - 62 - 62
Increase in impairment allowances - 1,756,839 1,756,839 3,370,230 1,604,864 4,975,094 417,178 - 417,178 3,787,408 3,361,703 7,149,111
Reversal of impairment (3,811,334) - (3,811,334) - - - - (412,365) (412,365) (3,811,334) (412,365) (4,223,699)
Reclassifications 78,792 (78,792) - - - - - - - 78,792 (78,792) -
Write offs (83,947) - (83,947) - - - - - - (83,947) - (83,947)
Balance, end of year 9,160,378 3,830,771 12,991,149 3,370,230 2,100,155 5,470,385 417,178 59,965 477,143 12,947,786 5,990,891 18,938,677
Loans Overdrafts Others Total
Loans Overdrafts Others Total
Loans Overdrafts Others Total
248
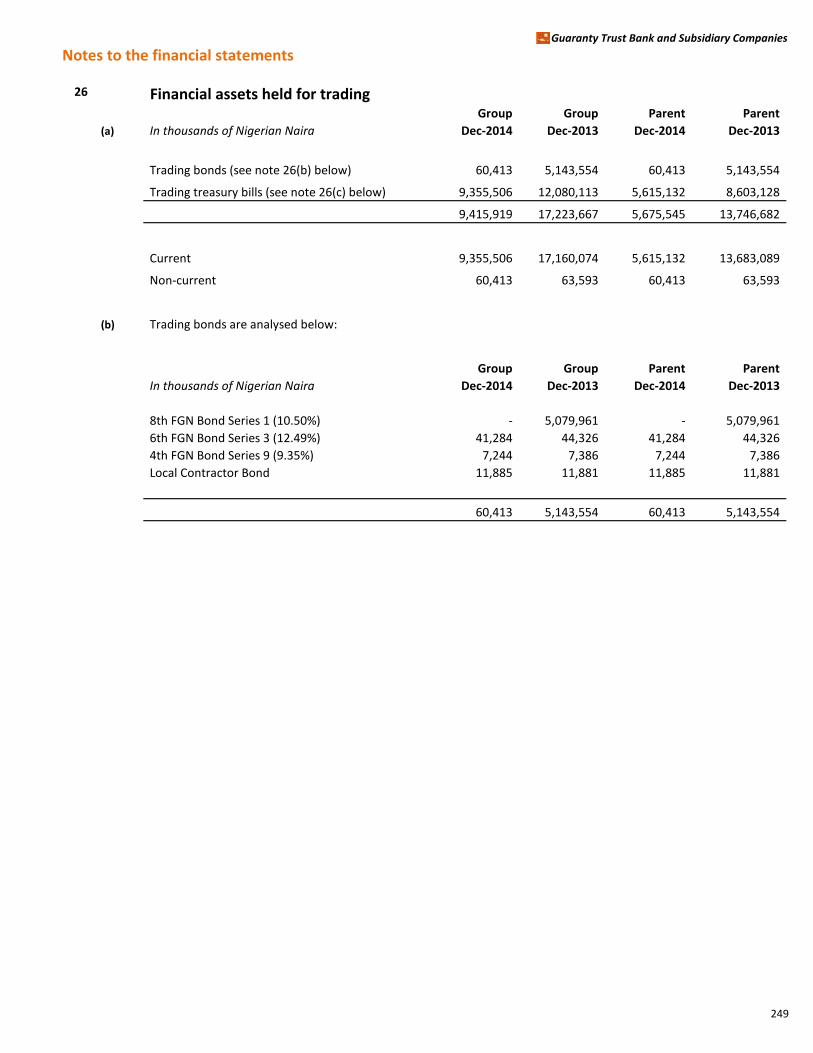
Notes to the financial statementsGuaranty Trust Bank and Subsidiary Companies
26 Financial assets held for trading Group Group Parent Parent
(a) In thousands of Nigerian Naira Dec-2014 Dec-2013 Dec-2014 Dec-2013
Trading bonds (see note 26(b) below) 60,413 5,143,554 60,413 5,143,554
Trading treasury bills (see note 26(c) below) 9,355,506 12,080,113 5,615,132 8,603,128
9,415,919 17,223,667 5,675,545 13,746,682
Current 9,355,506 17,160,074 5,615,132 13,683,089
Non-current 60,413 63,593 60,413 63,593
(b) Trading bonds are analysed below:
Group Group Parent Parent
In thousands of Nigerian Naira Dec-2014 Dec-2013 Dec-2014 Dec-2013
8th FGN Bond Series 1 (10.50%) - 5,079,961 - 5,079,961
6th FGN Bond Series 3 (12.49%) 41,284 44,326 41,284 44,326
4th FGN Bond Series 9 (9.35%) 7,244 7,386 7,244 7,386
Local Contractor Bond 11,885 11,881 11,885 11,881
60,413 5,143,554 60,413 5,143,554
249
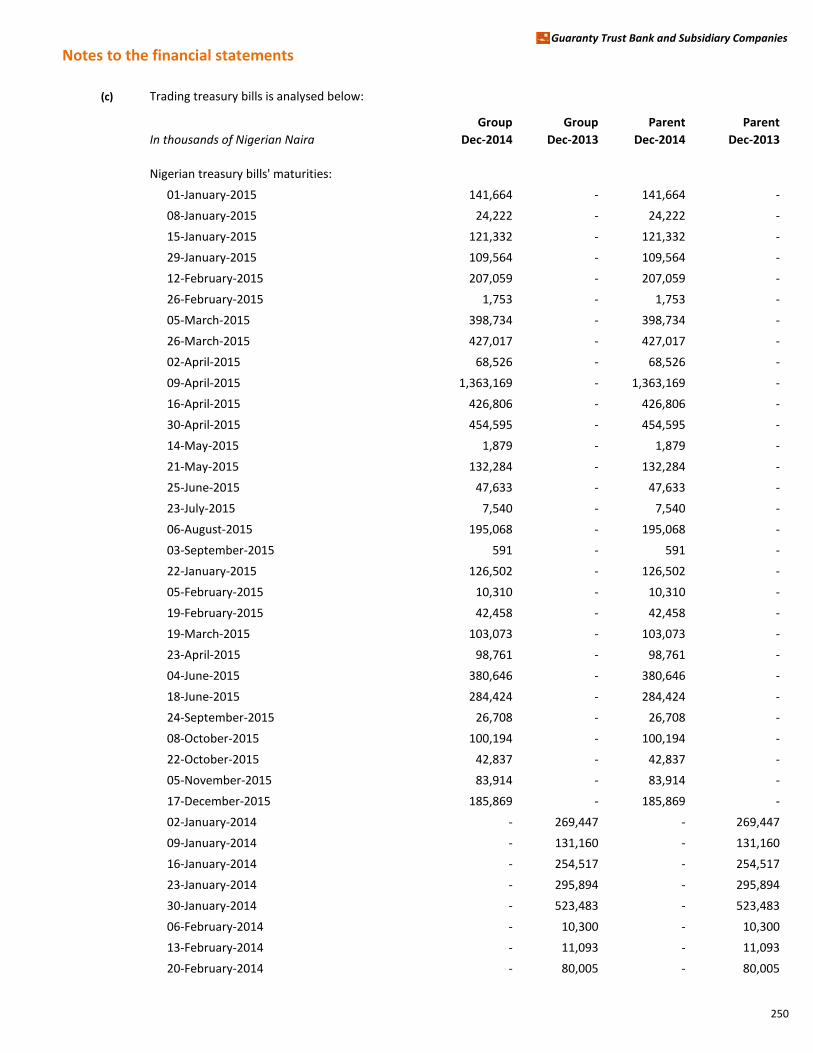
Notes to the financial statementsGuaranty Trust Bank and Subsidiary Companies
(c) Trading treasury bills is analysed below:
Group Group Parent Parent
In thousands of Nigerian Naira Dec-2014 Dec-2013 Dec-2014 Dec-2013
Nigerian treasury bills' maturities:
01-January-2015 141,664 - 141,664 -
08-January-2015 24,222 - 24,222 -
15-January-2015 121,332 - 121,332 -
29-January-2015 109,564 - 109,564 -
12-February-2015 207,059 - 207,059 -
26-February-2015 1,753 - 1,753 -
05-March-2015 398,734 - 398,734 -
26-March-2015 427,017 - 427,017 -
02-April-2015 68,526 - 68,526 -
09-April-2015 1,363,169 - 1,363,169 -
16-April-2015 426,806 - 426,806 -
30-April-2015 454,595 - 454,595 -
14-May-2015 1,879 - 1,879 -
21-May-2015 132,284 - 132,284 -
25-June-2015 47,633 - 47,633 -
23-July-2015 7,540 - 7,540 -
06-August-2015 195,068 - 195,068 -
03-September-2015 591 - 591 -
22-January-2015 126,502 - 126,502 -
05-February-2015 10,310 - 10,310 -
19-February-2015 42,458 - 42,458 -
19-March-2015 103,073 - 103,073 -
23-April-2015 98,761 - 98,761 -
04-June-2015 380,646 - 380,646 -
18-June-2015 284,424 - 284,424 -
24-September-2015 26,708 - 26,708 -
08-October-2015 100,194 - 100,194 -
22-October-2015 42,837 - 42,837 -
05-November-2015 83,914 - 83,914 -
17-December-2015 185,869 - 185,869 -
02-January-2014 - 269,447 - 269,447
09-January-2014 - 131,160 - 131,160
16-January-2014 - 254,517 - 254,517
23-January-2014 - 295,894 - 295,894
30-January-2014 - 523,483 - 523,483
06-February-2014 - 10,300 - 10,300
13-February-2014 - 11,093 - 11,093
20-February-2014 - 80,005 - 80,005
250
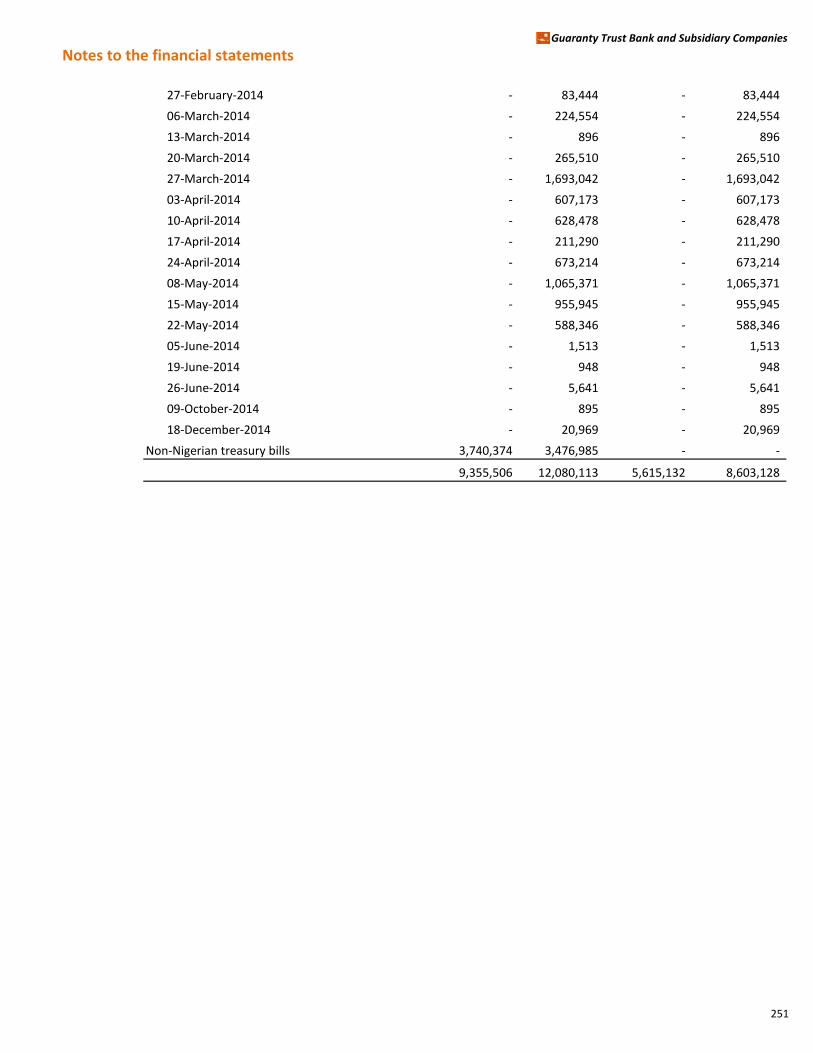
Notes to the financial statementsGuaranty Trust Bank and Subsidiary Companies
27-February-2014 - 83,444 - 83,444
06-March-2014 - 224,554 - 224,554
13-March-2014 - 896 - 896
20-March-2014 - 265,510 - 265,510
27-March-2014 - 1,693,042 - 1,693,042
03-April-2014 - 607,173 - 607,173
10-April-2014 - 628,478 - 628,478
17-April-2014 - 211,290 - 211,290
24-April-2014 - 673,214 - 673,214
08-May-2014 - 1,065,371 - 1,065,371
15-May-2014 - 955,945 - 955,945
22-May-2014 - 588,346 - 588,346
05-June-2014 - 1,513 - 1,513
19-June-2014 - 948 - 948
26-June-2014 - 5,641 - 5,641
09-October-2014 - 895 - 895
18-December-2014 - 20,969 - 20,969
Non-Nigerian treasury bills 3,740,374 3,476,985 - -
9,355,506 12,080,113 5,615,132 8,603,128
251
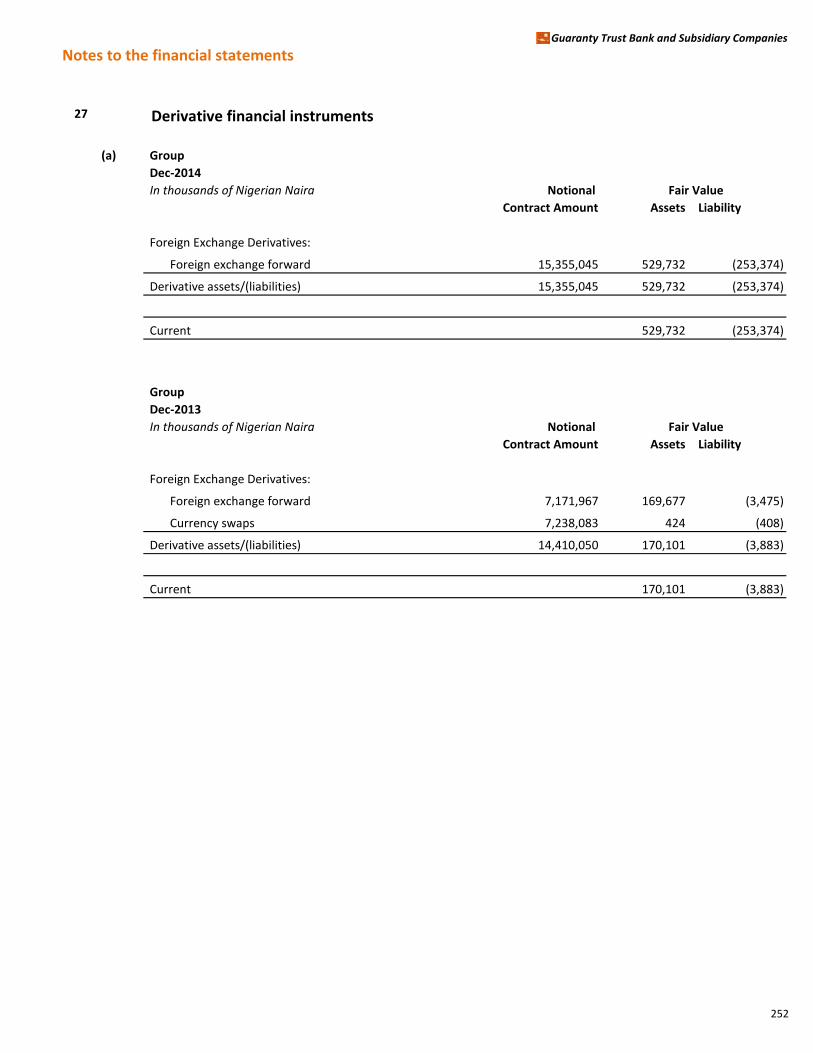
Notes to the financial statementsGuaranty Trust Bank and Subsidiary Companies
27 Derivative financial instruments
(a) Group
Dec-2014
In thousands of Nigerian Naira Notional
Contract Amount Assets Liability
Foreign Exchange Derivatives:
Foreign exchange forward 15,355,045 529,732 (253,374)
Derivative assets/(liabilities) 15,355,045 529,732 (253,374)
Current 529,732 (253,374)
Group
Dec-2013
In thousands of Nigerian Naira Notional
Contract Amount Assets Liability
Foreign Exchange Derivatives:
Foreign exchange forward 7,171,967 169,677 (3,475)
Currency swaps 7,238,083 424 (408)
Derivative assets/(liabilities) 14,410,050 170,101 (3,883)
Current 170,101 (3,883)
Fair Value
Fair Value
252

Notes to the financial statementsGuaranty Trust Bank and Subsidiary Companies
Parent
Dec-2014
In thousands of Nigerian Naira Notional
Contract Amount Assets Liability
Foreign Exchange Derivatives:
Foreign exchange forward 15,355,045 529,732 (253,374)
Derivative assets/(liabilities) 15,355,045 529,732 (253,374)
Current 529,732 (253,374)
Parent
Dec-2013
In thousands of Nigerian Naira Notional
Contract Amount Assets Liability
Foreign Exchange Derivatives:
Foreign exchange forward 7,171,967 169,677 (3,475)
Currency swaps 7,238,083 424 (408)
Derivative assets/(liabilities) 14,410,050 170,101 (3,883)
Current 170,101 (3,883)
(b) All derivatives are settled in less than one year.
(c) Foreign exchange derivatives
The Group enters into forward foreign exchange contracts and currency swaps designated as held for trading.
A forward foreign exchange contract is an agreement by two counterparties to exchange currencies at a pre-
determined rate on some future date. No funds change hands when a typical forward foreign exchange contract
originates; a funds flow occurs only at the contract’s stated future delivery time. A currency swap is the
simultaneous spot sale (or purchase) of currency against a forward purchase (or sale) of approximately an equal
amount. In a swap contract, there is an exchange, or notional exchange, of equivalent amounts of two currencies
and a commitment to exchange interest periodically until the principal amounts are re-exchanged on a future date.
The Group’s foreign exchange derivatives do not qualify for hedge accounting; therefore all gains and losses from
changes in their fair values are recognised immediately in the income statement and are reported in
‘Net gains/(losses) on financial instruments classified as held for trading’.
Fair Value
Fair Value
253
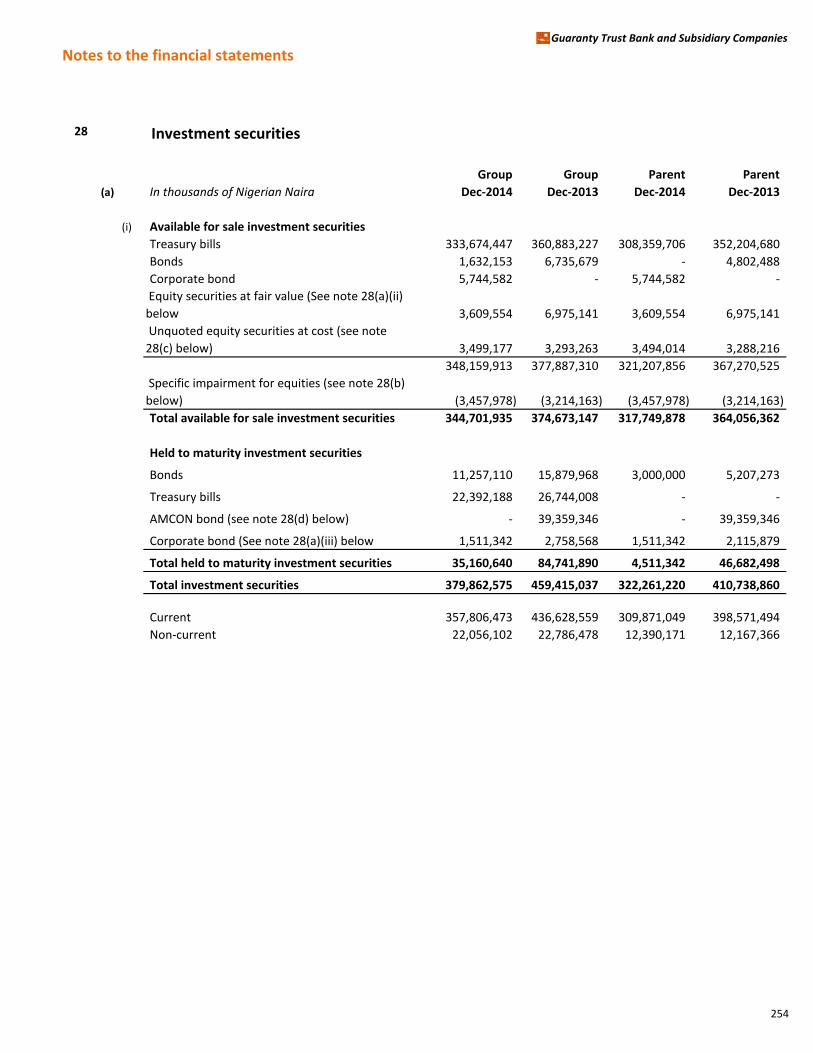
Notes to the financial statementsGuaranty Trust Bank and Subsidiary Companies
28 Investment securities
Group Group Parent Parent
(a) In thousands of Nigerian Naira Dec-2014 Dec-2013 Dec-2014 Dec-2013
(i) Available for sale investment securities
Treasury bills 333,674,447 360,883,227 308,359,706 352,204,680
Bonds 1,632,153 6,735,679 - 4,802,488
Corporate bond 5,744,582 - 5,744,582 -
Equity securities at fair value (See note 28(a)(ii)
below 3,609,554 6,975,141 3,609,554 6,975,141
Unquoted equity securities at cost (see note
28(c) below) 3,499,177 3,293,263 3,494,014 3,288,216
348,159,913 377,887,310 321,207,856 367,270,525
Specific impairment for equities (see note 28(b)
below) (3,457,978) (3,214,163) (3,457,978) (3,214,163)
Total available for sale investment securities 344,701,935 374,673,147 317,749,878 364,056,362
Held to maturity investment securities
Bonds 11,257,110 15,879,968 3,000,000 5,207,273
Treasury bills 22,392,188 26,744,008 - -
AMCON bond (see note 28(d) below) - 39,359,346 - 39,359,346
Corporate bond (See note 28(a)(iii) below 1,511,342 2,758,568 1,511,342 2,115,879
Total held to maturity investment securities 35,160,640 84,741,890 4,511,342 46,682,498
Total investment securities 379,862,575 459,415,037 322,261,220 410,738,860
Current 357,806,473 436,628,559 309,871,049 398,571,494
Non-current 22,056,102 22,786,478 12,390,171 12,167,366
254
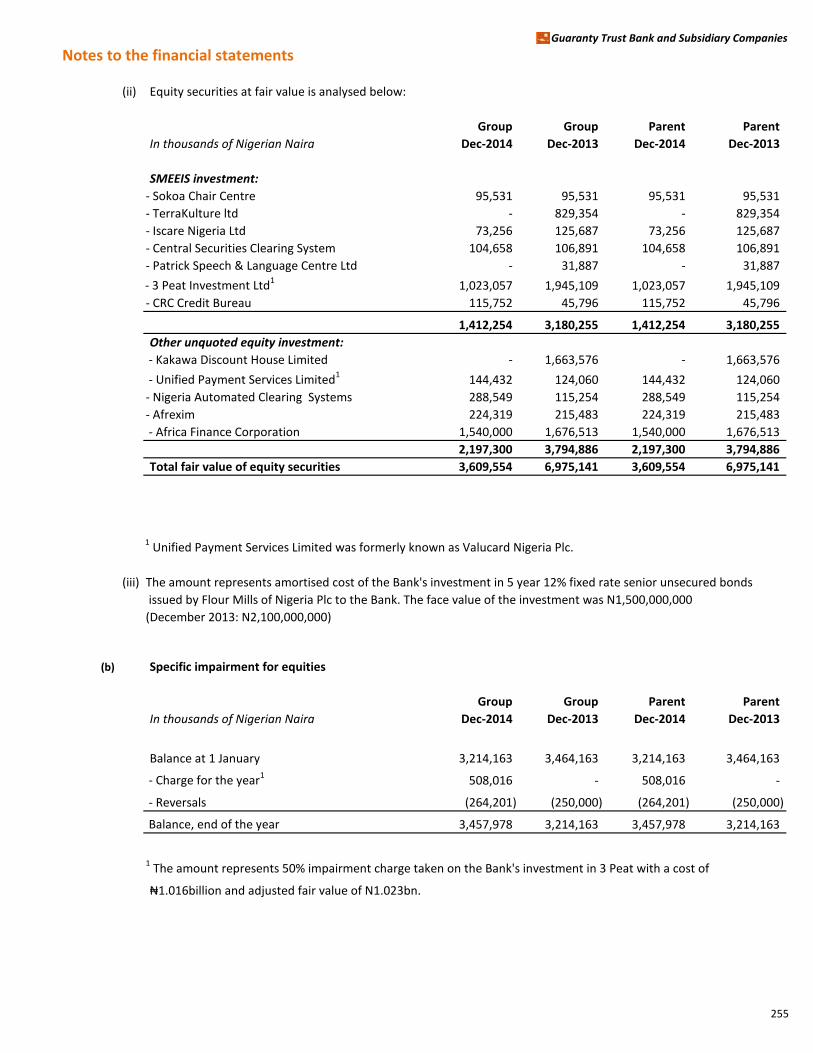
Notes to the financial statementsGuaranty Trust Bank and Subsidiary Companies
(ii) Equity securities at fair value is analysed below:
Group Group Parent Parent
In thousands of Nigerian Naira Dec-2014 Dec-2013 Dec-2014 Dec-2013
SMEEIS investment:
- Sokoa Chair Centre 95,531 95,531 95,531 95,531
- TerraKulture ltd - 829,354 - 829,354
- Iscare Nigeria Ltd 73,256 125,687 73,256 125,687
- Central Securities Clearing System 104,658 106,891 104,658 106,891
- Patrick Speech & Language Centre Ltd - 31,887 - 31,887
- 3 Peat Investment Ltd11,023,057 1,945,109 1,023,057 1,945,109
- CRC Credit Bureau 115,752 45,796 115,752 45,796
1,412,254 3,180,255 1,412,254 3,180,255
Other unquoted equity investment:
- Kakawa Discount House Limited - 1,663,576 - 1,663,576
- Unified Payment Services Limited1144,432 124,060 144,432 124,060
- Nigeria Automated Clearing Systems 288,549 115,254 288,549 115,254
- Afrexim 224,319 215,483 224,319 215,483
- Africa Finance Corporation 1,540,000 1,676,513 1,540,000 1,676,513
2,197,300 3,794,886 2,197,300 3,794,886
Total fair value of equity securities 3,609,554 6,975,141 3,609,554 6,975,141
1 Unified Payment Services Limited was formerly known as Valucard Nigeria Plc.
(iii) The amount represents amortised cost of the Bank's investment in 5 year 12% fixed rate senior unsecured bonds
issued by Flour Mills of Nigeria Plc to the Bank. The face value of the investment was N1,500,000,000
(December 2013: N2,100,000,000)
(b) Specific impairment for equities
Group Group Parent Parent
In thousands of Nigerian Naira Dec-2014 Dec-2013 Dec-2014 Dec-2013
Balance at 1 January 3,214,163 3,464,163 3,214,163 3,464,163
- Charge for the year1508,016 - 508,016 -
- Reversals (264,201) (250,000) (264,201) (250,000)
Balance, end of the year 3,457,978 3,214,163 3,457,978 3,214,163
1 The amount represents 50% impairment charge taken on the Bank's investment in 3 Peat with a cost of
₦1.016billion and adjusted fair value of N1.023bn.
255

Notes to the financial statementsGuaranty Trust Bank and Subsidiary Companies
Specific impairment for equities is further analysed below:
Group Group Parent Parent
In thousands of Nigerian Naira Dec-2014 Dec-2013 Dec-2014 Dec-2013
Specific impairment on equity securities at
cost less impairment 2,949,962 3,214,163 2,949,962 3,214,163
Specific impairment on equity securities at
fair value 508,016 - 508,016 -
3,457,978 3,214,163 3,457,978 3,214,163
(c) Unquoted equity securities at cost relates to the banks investment in SMEEIS and equity investments:
Unquoted equity securities at cost less impairment is analysed below:
Group Group Parent Parent
In thousands of Nigerian Naira Dec-2014 Dec-2013 Dec-2014 Dec-2013
SMEEIS investment:
- Forrilon Translantic Ltd 1,080,851 1,080,851 1,080,851 1,080,851
- TerraKulture ltd 469,999 - 469,999 -
- Ruqayya Integrated Farms 40,500 40,500 40,500 40,500
- National E-Government Strategy 25,000 25,000 25,000 25,000
- Bookcraft Ltd 20,000 20,000 20,000 20,000
- Shonga F.H. Nigeria Ltd 200,000 200,000 200,000 200,000
- Safe Nigeria Ltd 350,000 350,000 350,000 350,000
- Cards Technology Limited 265,000 265,000 265,000 265,000
- Thisday Events Center 500,000 500,000 500,000 500,000
- HITV Limited 500,000 500,000 500,000 500,000
- SCC Algon Ltd 42,664 42,664 42,664 42,664
Cost of SMIEES investment 3,494,014 3,024,015 3,494,014 3,024,015
Less specific impairment for equities (2,949,962) (2,949,962) (2,949,962) (2,949,962)
Carrying value of SMIEES investment 544,052 74,053 544,052 74,053
Other unquoted equity investment:
- ICHL Nigeria Limited - 264,201 - 264,201
- GIM UEMOA 5,163 5,047 - -
Cost of other unquoted equity investment 5,163 269,248 - 264,201
Less specific impairment for equities - (264,201) - (264,201)
Carrying value of other unquoted equity investment 5,163 5,047 - -
Total cost of unquoted equity investment 3,499,177 3,293,263 3,494,014 3,288,216
Total impairment of unquoted equity investment (2,949,962) (3,214,163) (2,949,962) (3,214,163)
Total carrying value of unquoted equity investment 549,215 79,100 544,052 74,053
256

Notes to the financial statementsGuaranty Trust Bank and Subsidiary Companies
Movement in unquoted equities at cost:
Group Group Parent Parent
In thousands of Nigerian Naira Dec-2014 Dec-2013 Dec-2014 Dec-2013
Balance at 1 January 79,100 79,100 74,053 74,053
- Exchange difference 116 - -
- Disposal (264,201) - (264,201) -
- Reversal of impairment 264,201 - 264,201 -
- Transfer from equity investments at fair value 469,999 - 469,999 -
Balance, end of the year 549,215 79,100 544,052 74,053
Fair values of certain SMEEIS and other long term investments which are borne out of regulatory
requirement in force as at the time of investment cannot be measured reliably because there are no
active market for these financial instruments; they have therefore been disclosed at cost less
impairment..
Their impairment was based on the observable data from the environment which suggests that the
recoverable amount will be much lower than the carrying value of these investments; hence, they are
carried at cost less impairment and included in Level 3 of the fair value hierarchy table. The
outstanding carrying amount on the book for these investments as at 31st December 2014 is N544,052,000
(December 2013: N74,053,000).
The Group is willing to divest from these entities if willing buyers come across and upon obtaining
appropriate regulatory approvals since the regulation that led to their creation has been abolished.
The Group does not have power to influence the returns from the investees. Consequently, the Group does
not have have power over the investees investments because of the following:
• There are no material transactions between the Group and the entities and it does not participate
in the policy making processes owing to the nature of these entities.
• The Group does not provide essential technical information to the entities.
• There is no inter-change of personnel between the Group and the entities.
• Although the Group is represented in some of the boards, these representations do not connote any
form of control or significant influence because most of the entities do not hold regular board meetings
and are run like sole proprietorship businesses.
257
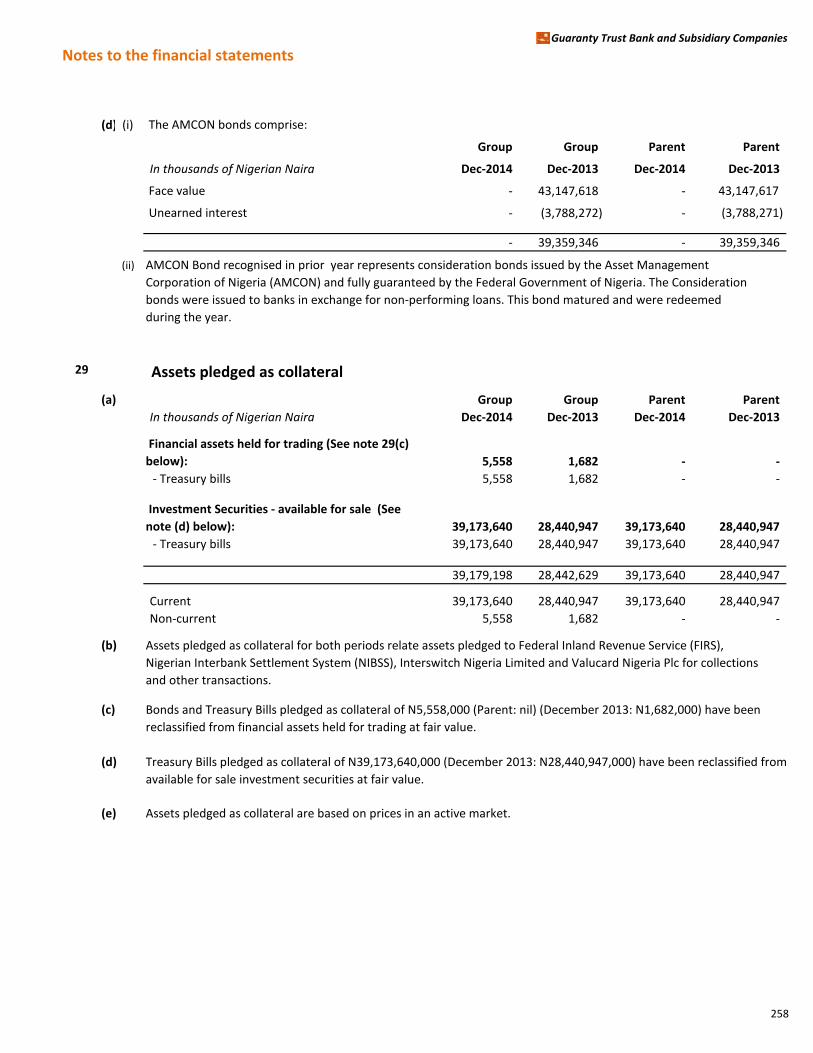
Notes to the financial statementsGuaranty Trust Bank and Subsidiary Companies
(d) (i) The AMCON bonds comprise:
Group Group Parent Parent
In thousands of Nigerian Naira Dec-2014 Dec-2013 Dec-2014 Dec-2013
Face value - 43,147,618 - 43,147,617
Unearned interest - (3,788,272) - (3,788,271)
- 39,359,346 - 39,359,346
(ii) AMCON Bond recognised in prior year represents consideration bonds issued by the Asset Management
Corporation of Nigeria (AMCON) and fully guaranteed by the Federal Government of Nigeria. The Consideration
bonds were issued to banks in exchange for non-performing loans. This bond matured and were redeemed
during the year.
29 Assets pledged as collateral
(a) Group Group Parent Parent
In thousands of Nigerian Naira Dec-2014 Dec-2013 Dec-2014 Dec-2013
Financial assets held for trading (See note 29(c)
below): 5,558 1,682 - -
- Treasury bills 5,558 1,682 - -
Investment Securities - available for sale (See
note (d) below): 39,173,640 28,440,947 39,173,640 28,440,947
- Treasury bills 39,173,640 28,440,947 39,173,640 28,440,947
39,179,198 28,442,629 39,173,640 28,440,947
Current 39,173,640 28,440,947 39,173,640 28,440,947
Non-current 5,558 1,682 - -
(b) Assets pledged as collateral for both periods relate assets pledged to Federal Inland Revenue Service (FIRS),
Nigerian Interbank Settlement System (NIBSS), Interswitch Nigeria Limited and Valucard Nigeria Plc for collections
and other transactions.
(c) Bonds and Treasury Bills pledged as collateral of N5,558,000 (Parent: nil) (December 2013: N1,682,000) have been
reclassified from financial assets held for trading at fair value.
(d) Treasury Bills pledged as collateral of N39,173,640,000 (December 2013: N28,440,947,000) have been reclassified from
available for sale investment securities at fair value.
(e) Assets pledged as collateral are based on prices in an active market.
258
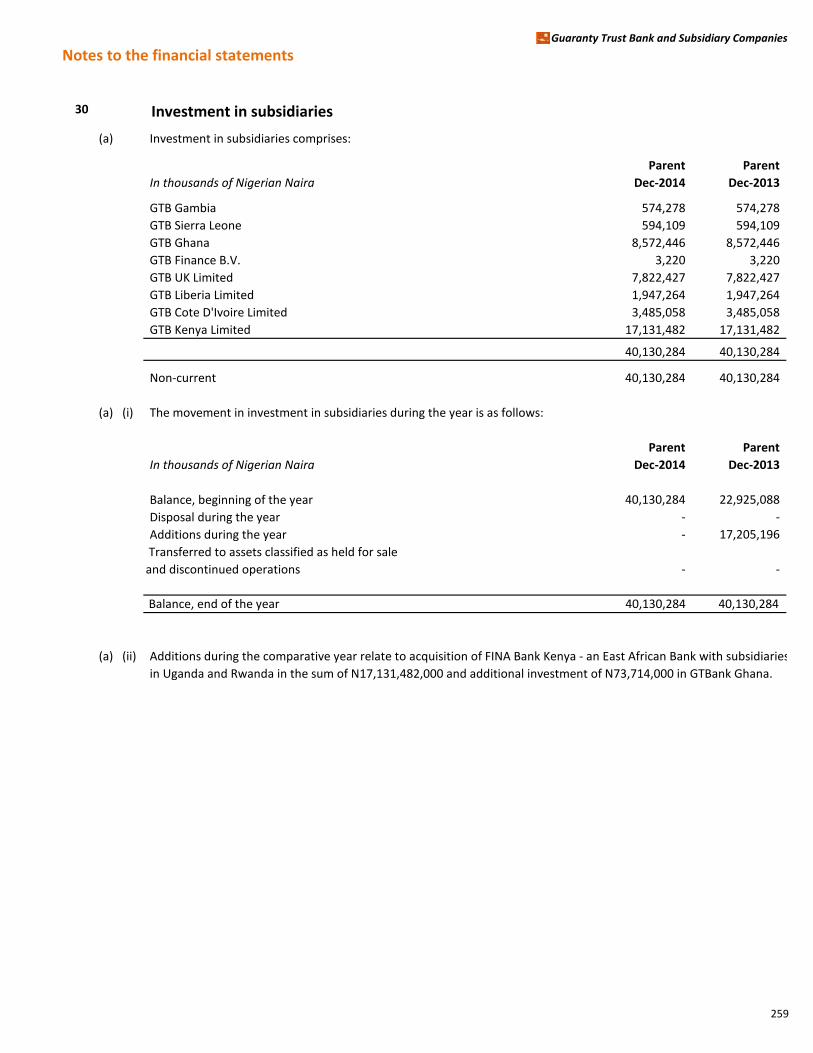
Notes to the financial statementsGuaranty Trust Bank and Subsidiary Companies
30 Investment in subsidiaries
(a) Investment in subsidiaries comprises:
Parent Parent
In thousands of Nigerian Naira Dec-2014 Dec-2013
GTB Gambia 574,278 574,278
GTB Sierra Leone 594,109 594,109
GTB Ghana 8,572,446 8,572,446
GTB Finance B.V. 3,220 3,220
GTB UK Limited 7,822,427 7,822,427
GTB Liberia Limited 1,947,264 1,947,264
GTB Cote D'Ivoire Limited 3,485,058 3,485,058
GTB Kenya Limited 17,131,482 17,131,482
40,130,284 40,130,284
Non-current 40,130,284 40,130,284
(a) (i) The movement in investment in subsidiaries during the year is as follows:
Parent Parent
In thousands of Nigerian Naira Dec-2014 Dec-2013
Balance, beginning of the year 40,130,284 22,925,088
Disposal during the year - -
Additions during the year - 17,205,196
Transferred to assets classified as held for sale
and discontinued operations - -
Balance, end of the year 40,130,284 40,130,284
(a) (ii) Additions during the comparative year relate to acquisition of FINA Bank Kenya - an East African Bank with subsidiaries
in Uganda and Rwanda in the sum of N17,131,482,000 and additional investment of N73,714,000 in GTBank Ghana.
259

Notes to the financial statementsGuaranty Trust Bank and Subsidiary Companies
(b) Condensed results of consolidated entities
Condensed results of the consolidated entities as at 31 December 2014, are as follows:
Full year profit and loss
Dec-2014
In thousands of Nigerian Naira Group balance
Elimination
Entries GTBank Plc SIT
GTB Finance
B.V.
GT Bank
Ghana
GT Bank
Sierra Leone
GT Bank
Liberia GT Bank UK
GT Bank
Gambia
GT Bank
Cote D'Ivoire
GT Bank
Kenya
Operating income 217,922,079 (2,477,876) 195,700,274 (120,073) - 10,298,624 3,109,184 1,410,680 2,031,013 1,780,956 209,738 5,979,559
Operating expenses (94,437,788) - (79,148,134) (153,622) - (4,318,113) (1,613,133) (1,049,293) (1,964,410) (1,024,983) (664,482) (4,501,618)
Loan impairment charges (7,098,448) - (6,184,289) - - (238,386) (206,300) (29,403) - (53,122) - (386,948)
Profit before tax from continuing
operations 116,385,843 (2,477,876) 110,367,851 (273,695) - 5,742,125 1,289,751 331,984 66,603 702,851 (454,744) 1,090,993
Taxation (17,690,924) 1,848,010 (16,936,247) - - (1,764,910) (399,271) - - (239,283) - (199,223)
Profit after tax from continuing
operations 98,694,919 (629,866) 93,431,604 (273,695) - 3,977,215 890,480 331,984 66,603 463,568 (454,744) 891,770
Profit after tax from discontinued
operations - - - - - - - - - - - -
Profit after tax 98,694,919 (629,866) 93,431,604 (273,695) - 3,977,215 890,480 331,984 66,603 463,568 (454,744) 891,770
260
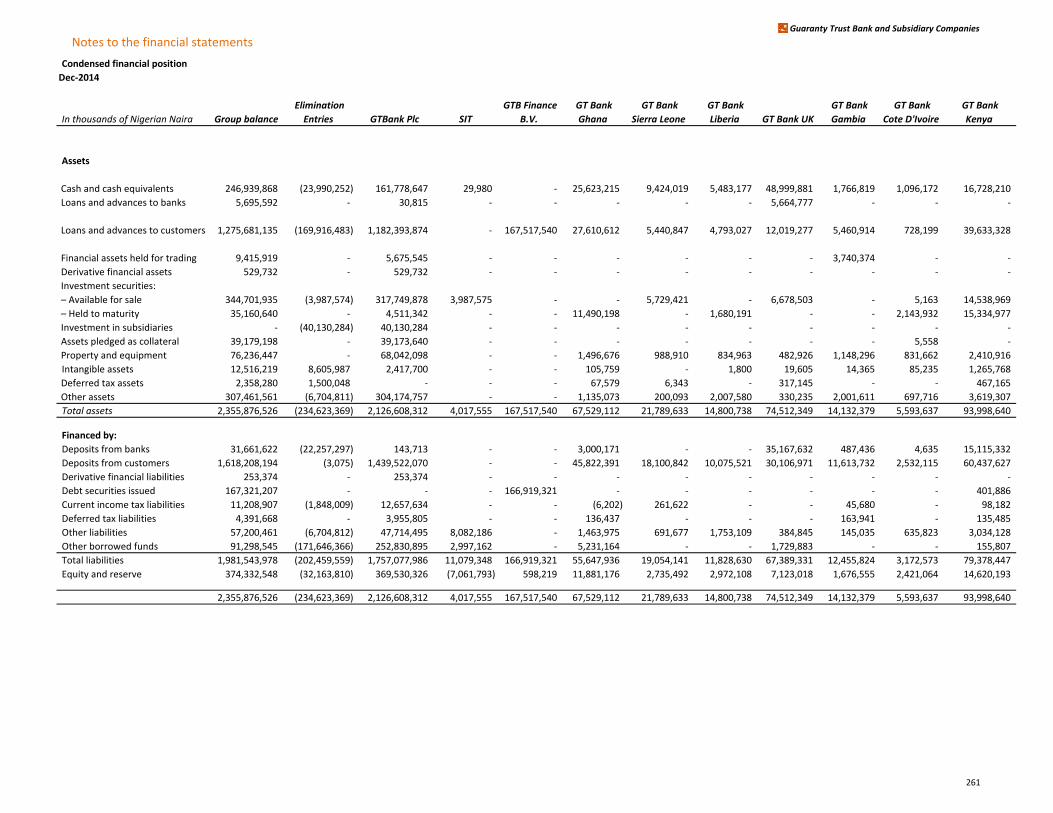
Notes to the financial statementsGuaranty Trust Bank and Subsidiary Companies
Condensed financial position
Dec-2014
In thousands of Nigerian Naira Group balance
Elimination
Entries GTBank Plc SIT
GTB Finance
B.V.
GT Bank
Ghana
GT Bank
Sierra Leone
GT Bank
Liberia GT Bank UK
GT Bank
Gambia
GT Bank
Cote D'Ivoire
GT Bank
Kenya
Assets
Cash and cash equivalents 246,939,868 (23,990,252) 161,778,647 29,980 - 25,623,215 9,424,019 5,483,177 48,999,881 1,766,819 1,096,172 16,728,210
Loans and advances to banks 5,695,592 - 30,815 - - - - - 5,664,777 - - -
Loans and advances to customers 1,275,681,135 (169,916,483) 1,182,393,874 - 167,517,540 27,610,612 5,440,847 4,793,027 12,019,277 5,460,914 728,199 39,633,328
Financial assets held for trading 9,415,919 - 5,675,545 - - - - - - 3,740,374 - -
Derivative financial assets 529,732 - 529,732 - - - - - - - - -
Investment securities:
– Available for sale 344,701,935 (3,987,574) 317,749,878 3,987,575 - - 5,729,421 - 6,678,503 - 5,163 14,538,969
– Held to maturity 35,160,640 - 4,511,342 - - 11,490,198 - 1,680,191 - - 2,143,932 15,334,977
Investment in subsidiaries - (40,130,284) 40,130,284 - - - - - - - - -
Assets pledged as collateral 39,179,198 - 39,173,640 - - - - - - - 5,558 -
Property and equipment 76,236,447 - 68,042,098 - - 1,496,676 988,910 834,963 482,926 1,148,296 831,662 2,410,916
Intangible assets 12,516,219 8,605,987 2,417,700 - - 105,759 - 1,800 19,605 14,365 85,235 1,265,768
Deferred tax assets 2,358,280 1,500,048 - - - 67,579 6,343 - 317,145 - - 467,165
Other assets 307,461,561 (6,704,811) 304,174,757 - - 1,135,073 200,093 2,007,580 330,235 2,001,611 697,716 3,619,307
Total assets 2,355,876,526 (234,623,369) 2,126,608,312 4,017,555 167,517,540 67,529,112 21,789,633 14,800,738 74,512,349 14,132,379 5,593,637 93,998,640
Financed by:
Deposits from banks 31,661,622 (22,257,297) 143,713 - - 3,000,171 - - 35,167,632 487,436 4,635 15,115,332
Deposits from customers 1,618,208,194 (3,075) 1,439,522,070 - - 45,822,391 18,100,842 10,075,521 30,106,971 11,613,732 2,532,115 60,437,627
Derivative financial liabilities 253,374 - 253,374 - - - - - - - - -
Debt securities issued 167,321,207 - - - 166,919,321 - - - - - - 401,886
Current income tax liabilities 11,208,907 (1,848,009) 12,657,634 - - (6,202) 261,622 - - 45,680 - 98,182
Deferred tax liabilities 4,391,668 - 3,955,805 - - 136,437 - - - 163,941 - 135,485
Other liabilities 57,200,461 (6,704,812) 47,714,495 8,082,186 - 1,463,975 691,677 1,753,109 384,845 145,035 635,823 3,034,128
Other borrowed funds 91,298,545 (171,646,366) 252,830,895 2,997,162 - 5,231,164 - - 1,729,883 - - 155,807
Total liabilities 1,981,543,978 (202,459,559) 1,757,077,986 11,079,348 166,919,321 55,647,936 19,054,141 11,828,630 67,389,331 12,455,824 3,172,573 79,378,447
Equity and reserve 374,332,548 (32,163,810) 369,530,326 (7,061,793) 598,219 11,881,176 2,735,492 2,972,108 7,123,018 1,676,555 2,421,064 14,620,193
2,355,876,526 (234,623,369) 2,126,608,312 4,017,555 167,517,540 67,529,112 21,789,633 14,800,738 74,512,349 14,132,379 5,593,637 93,998,640
261
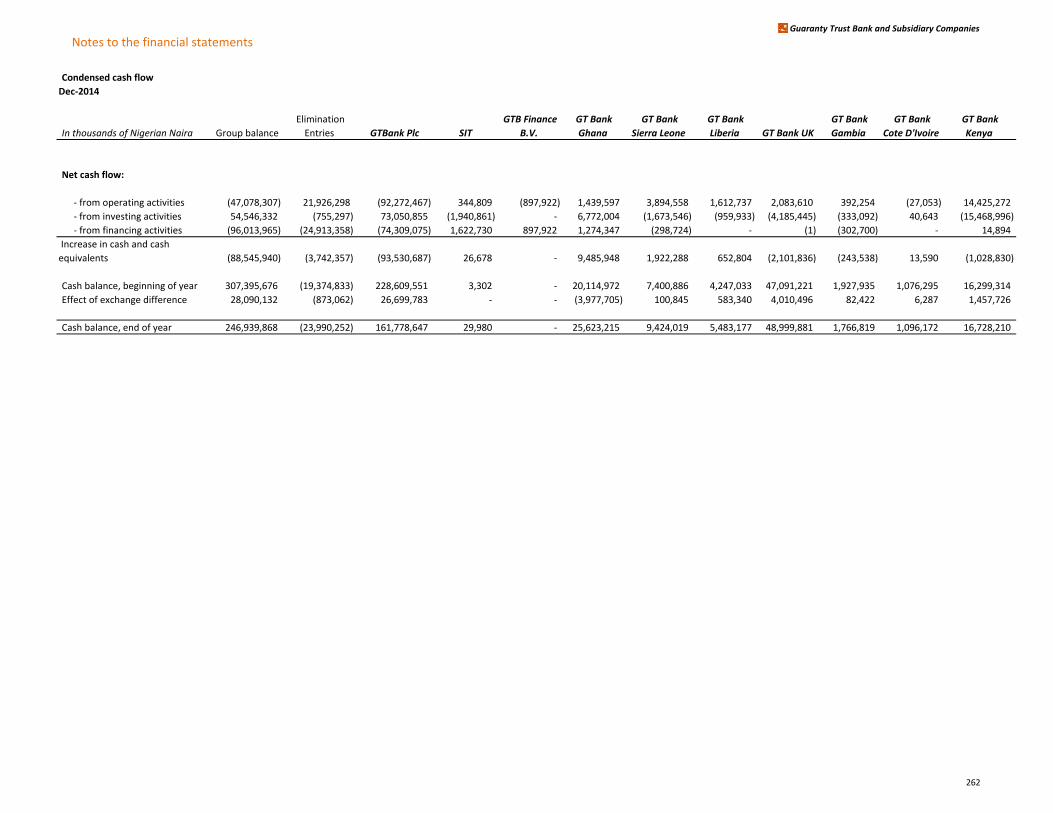
Notes to the financial statementsGuaranty Trust Bank and Subsidiary Companies
Condensed cash flow
Dec-2014
In thousands of Nigerian Naira Group balance
Elimination
Entries GTBank Plc SIT
GTB Finance
B.V.
GT Bank
Ghana
GT Bank
Sierra Leone
GT Bank
Liberia GT Bank UK
GT Bank
Gambia
GT Bank
Cote D'Ivoire
GT Bank
Kenya
Net cash flow:
- from operating activities (47,078,307) 21,926,298 (92,272,467) 344,809 (897,922) 1,439,597 3,894,558 1,612,737 2,083,610 392,254 (27,053) 14,425,272
- from investing activities 54,546,332 (755,297) 73,050,855 (1,940,861) - 6,772,004 (1,673,546) (959,933) (4,185,445) (333,092) 40,643 (15,468,996)
- from financing activities (96,013,965) (24,913,358) (74,309,075) 1,622,730 897,922 1,274,347 (298,724) - (1) (302,700) - 14,894
Increase in cash and cash
equivalents (88,545,940) (3,742,357) (93,530,687) 26,678 - 9,485,948 1,922,288 652,804 (2,101,836) (243,538) 13,590 (1,028,830)
Cash balance, beginning of year 307,395,676 (19,374,833) 228,609,551 3,302 - 20,114,972 7,400,886 4,247,033 47,091,221 1,927,935 1,076,295 16,299,314
Effect of exchange difference 28,090,132 (873,062) 26,699,783 - - (3,977,705) 100,845 583,340 4,010,496 82,422 6,287 1,457,726
Cash balance, end of year 246,939,868 (23,990,252) 161,778,647 29,980 - 25,623,215 9,424,019 5,483,177 48,999,881 1,766,819 1,096,172 16,728,210
262
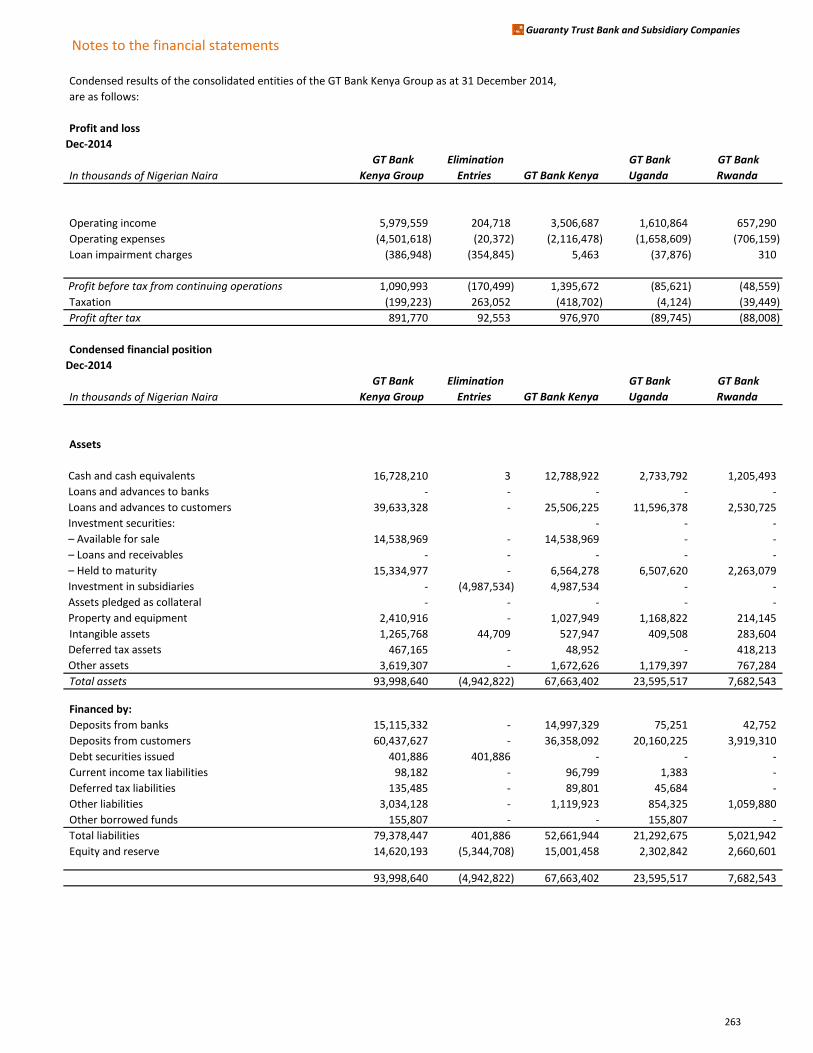
Notes to the financial statementsGuaranty Trust Bank and Subsidiary Companies
Condensed results of the consolidated entities of the GT Bank Kenya Group as at 31 December 2014,
are as follows:
Profit and loss
Dec-2014
In thousands of Nigerian Naira
GT Bank
Kenya Group
Elimination
Entries GT Bank Kenya
GT Bank
Uganda
GT Bank
Rwanda
Operating income 5,979,559 204,718 3,506,687 1,610,864 657,290
Operating expenses (4,501,618) (20,372) (2,116,478) (1,658,609) (706,159)
Loan impairment charges (386,948) (354,845) 5,463 (37,876) 310
Profit before tax from continuing operations 1,090,993 (170,499) 1,395,672 (85,621) (48,559)
Taxation (199,223) 263,052 (418,702) (4,124) (39,449)
Profit after tax 891,770 92,553 976,970 (89,745) (88,008)
Condensed financial position
Dec-2014
In thousands of Nigerian Naira
GT Bank
Kenya Group
Elimination
Entries GT Bank Kenya
GT Bank
Uganda
GT Bank
Rwanda
Assets
Cash and cash equivalents 16,728,210 3 12,788,922 2,733,792 1,205,493
Loans and advances to banks - - - - -
Loans and advances to customers 39,633,328 - 25,506,225 11,596,378 2,530,725
Investment securities: - - -
– Available for sale 14,538,969 - 14,538,969 - -
– Loans and receivables - - - - -
– Held to maturity 15,334,977 - 6,564,278 6,507,620 2,263,079
Investment in subsidiaries - (4,987,534) 4,987,534 - -
Assets pledged as collateral - - - - -
Property and equipment 2,410,916 - 1,027,949 1,168,822 214,145
Intangible assets 1,265,768 44,709 527,947 409,508 283,604
Deferred tax assets 467,165 - 48,952 - 418,213
Other assets 3,619,307 - 1,672,626 1,179,397 767,284
Total assets 93,998,640 (4,942,822) 67,663,402 23,595,517 7,682,543
Financed by:
Deposits from banks 15,115,332 - 14,997,329 75,251 42,752
Deposits from customers 60,437,627 - 36,358,092 20,160,225 3,919,310
Debt securities issued 401,886 401,886 - - -
Current income tax liabilities 98,182 - 96,799 1,383 -
Deferred tax liabilities 135,485 - 89,801 45,684 -
Other liabilities 3,034,128 - 1,119,923 854,325 1,059,880
Other borrowed funds 155,807 - - 155,807 -
Total liabilities 79,378,447 401,886 52,661,944 21,292,675 5,021,942
Equity and reserve 14,620,193 (5,344,708) 15,001,458 2,302,842 2,660,601
93,998,640 (4,942,822) 67,663,402 23,595,517 7,682,543
263
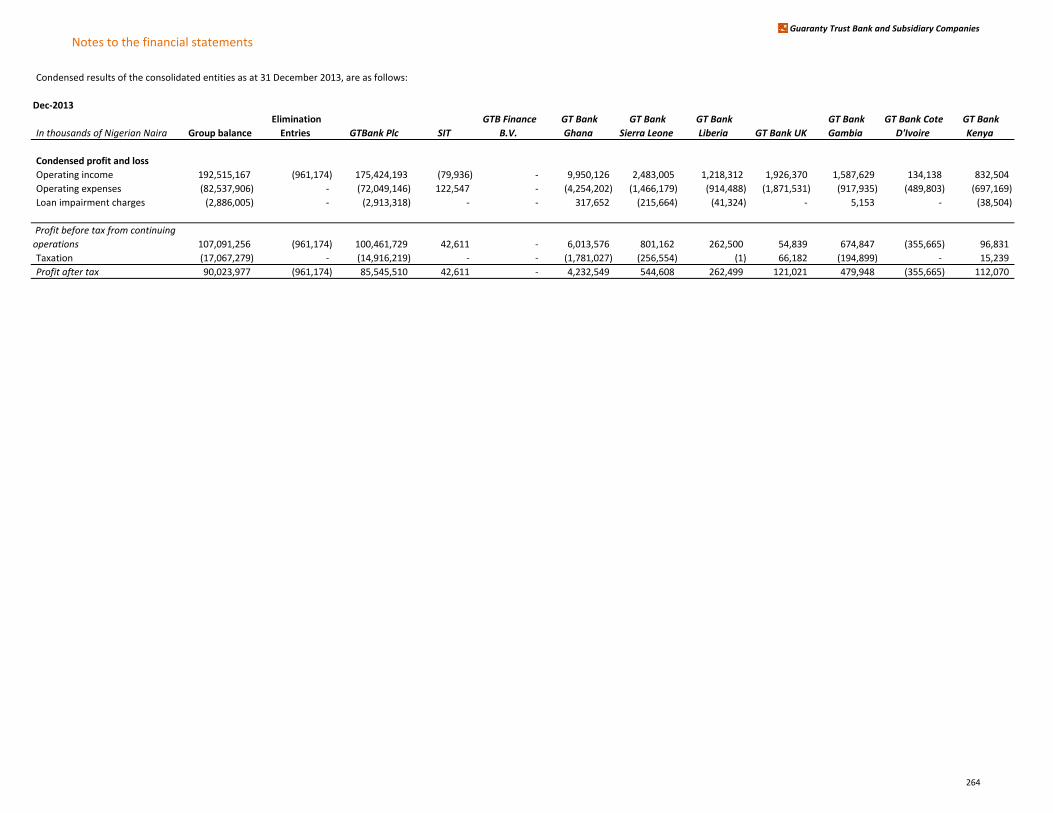
Notes to the financial statementsGuaranty Trust Bank and Subsidiary Companies
Condensed results of the consolidated entities as at 31 December 2013, are as follows:
Dec-2013
In thousands of Nigerian Naira Group balance
Elimination
Entries GTBank Plc SIT
GTB Finance
B.V.
GT Bank
Ghana
GT Bank
Sierra Leone
GT Bank
Liberia GT Bank UK
GT Bank
Gambia
GT Bank Cote
D'Ivoire
GT Bank
Kenya
Condensed profit and loss
Operating income 192,515,167 (961,174) 175,424,193 (79,936) - 9,950,126 2,483,005 1,218,312 1,926,370 1,587,629 134,138 832,504
Operating expenses (82,537,906) - (72,049,146) 122,547 - (4,254,202) (1,466,179) (914,488) (1,871,531) (917,935) (489,803) (697,169)
Loan impairment charges (2,886,005) - (2,913,318) - - 317,652 (215,664) (41,324) - 5,153 - (38,504)
Profit before tax from continuing
operations 107,091,256 (961,174) 100,461,729 42,611 - 6,013,576 801,162 262,500 54,839 674,847 (355,665) 96,831
Taxation (17,067,279) - (14,916,219) - - (1,781,027) (256,554) (1) 66,182 (194,899) - 15,239
Profit after tax 90,023,977 (961,174) 85,545,510 42,611 - 4,232,549 544,608 262,499 121,021 479,948 (355,665) 112,070
264
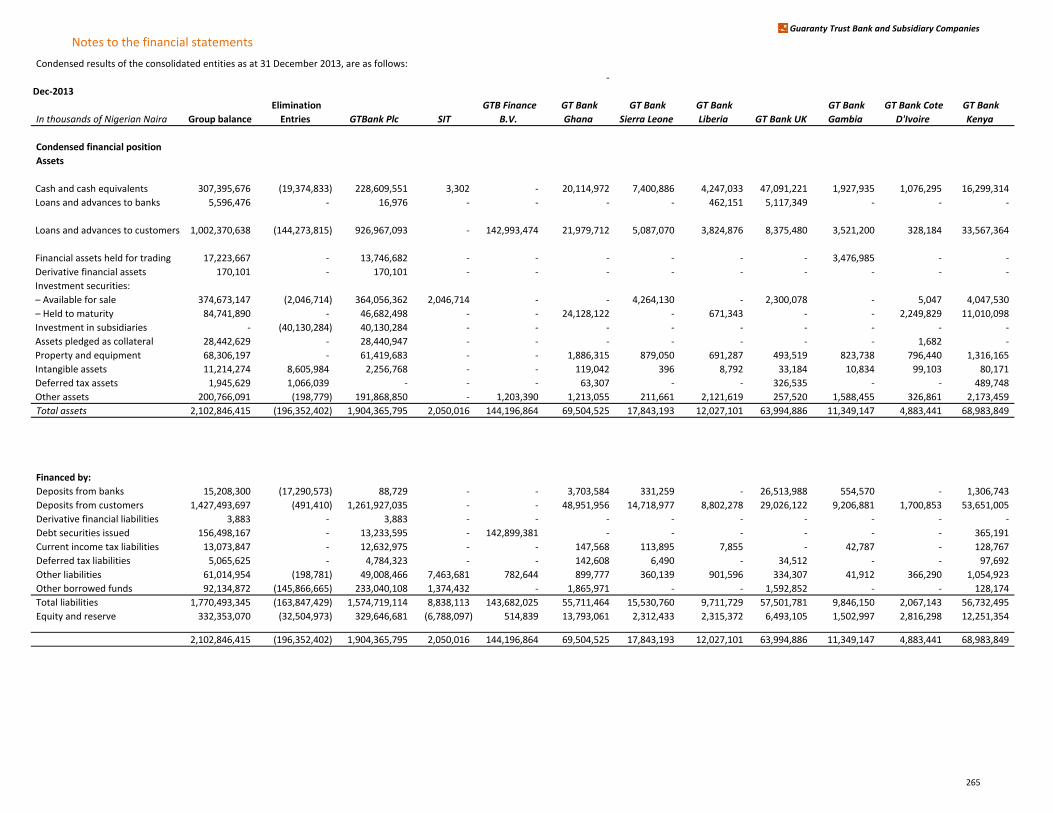
Notes to the financial statementsGuaranty Trust Bank and Subsidiary Companies
Condensed results of the consolidated entities as at 31 December 2013, are as follows:
-
Dec-2013
In thousands of Nigerian Naira Group balance
Elimination
Entries GTBank Plc SIT
GTB Finance
B.V.
GT Bank
Ghana
GT Bank
Sierra Leone
GT Bank
Liberia GT Bank UK
GT Bank
Gambia
GT Bank Cote
D'Ivoire
GT Bank
Kenya
Condensed financial position
Assets
Cash and cash equivalents 307,395,676 (19,374,833) 228,609,551 3,302 - 20,114,972 7,400,886 4,247,033 47,091,221 1,927,935 1,076,295 16,299,314
Loans and advances to banks 5,596,476 - 16,976 - - - - 462,151 5,117,349 - - -
Loans and advances to customers 1,002,370,638 (144,273,815) 926,967,093 - 142,993,474 21,979,712 5,087,070 3,824,876 8,375,480 3,521,200 328,184 33,567,364
Financial assets held for trading 17,223,667 - 13,746,682 - - - - - - 3,476,985 - -
Derivative financial assets 170,101 - 170,101 - - - - - - - - -
Investment securities:
– Available for sale 374,673,147 (2,046,714) 364,056,362 2,046,714 - - 4,264,130 - 2,300,078 - 5,047 4,047,530
– Held to maturity 84,741,890 - 46,682,498 - - 24,128,122 - 671,343 - - 2,249,829 11,010,098
Investment in subsidiaries - (40,130,284) 40,130,284 - - - - - - - - -
Assets pledged as collateral 28,442,629 - 28,440,947 - - - - - - - 1,682 -
Property and equipment 68,306,197 - 61,419,683 - - 1,886,315 879,050 691,287 493,519 823,738 796,440 1,316,165
Intangible assets 11,214,274 8,605,984 2,256,768 - - 119,042 396 8,792 33,184 10,834 99,103 80,171
Deferred tax assets 1,945,629 1,066,039 - - - 63,307 - - 326,535 - - 489,748
Other assets 200,766,091 (198,779) 191,868,850 - 1,203,390 1,213,055 211,661 2,121,619 257,520 1,588,455 326,861 2,173,459
Total assets 2,102,846,415 (196,352,402) 1,904,365,795 2,050,016 144,196,864 69,504,525 17,843,193 12,027,101 63,994,886 11,349,147 4,883,441 68,983,849
Financed by:
Deposits from banks 15,208,300 (17,290,573) 88,729 - - 3,703,584 331,259 - 26,513,988 554,570 - 1,306,743
Deposits from customers 1,427,493,697 (491,410) 1,261,927,035 - - 48,951,956 14,718,977 8,802,278 29,026,122 9,206,881 1,700,853 53,651,005
Derivative financial liabilities 3,883 - 3,883 - - - - - - - - -
Debt securities issued 156,498,167 - 13,233,595 - 142,899,381 - - - - - - 365,191
Current income tax liabilities 13,073,847 - 12,632,975 - - 147,568 113,895 7,855 - 42,787 - 128,767
Deferred tax liabilities 5,065,625 - 4,784,323 - - 142,608 6,490 - 34,512 - - 97,692
Other liabilities 61,014,954 (198,781) 49,008,466 7,463,681 782,644 899,777 360,139 901,596 334,307 41,912 366,290 1,054,923
Other borrowed funds 92,134,872 (145,866,665) 233,040,108 1,374,432 - 1,865,971 - - 1,592,852 - - 128,174
Total liabilities 1,770,493,345 (163,847,429) 1,574,719,114 8,838,113 143,682,025 55,711,464 15,530,760 9,711,729 57,501,781 9,846,150 2,067,143 56,732,495
Equity and reserve 332,353,070 (32,504,973) 329,646,681 (6,788,097) 514,839 13,793,061 2,312,433 2,315,372 6,493,105 1,502,997 2,816,298 12,251,354
2,102,846,415 (196,352,402) 1,904,365,795 2,050,016 144,196,864 69,504,525 17,843,193 12,027,101 63,994,886 11,349,147 4,883,441 68,983,849
265
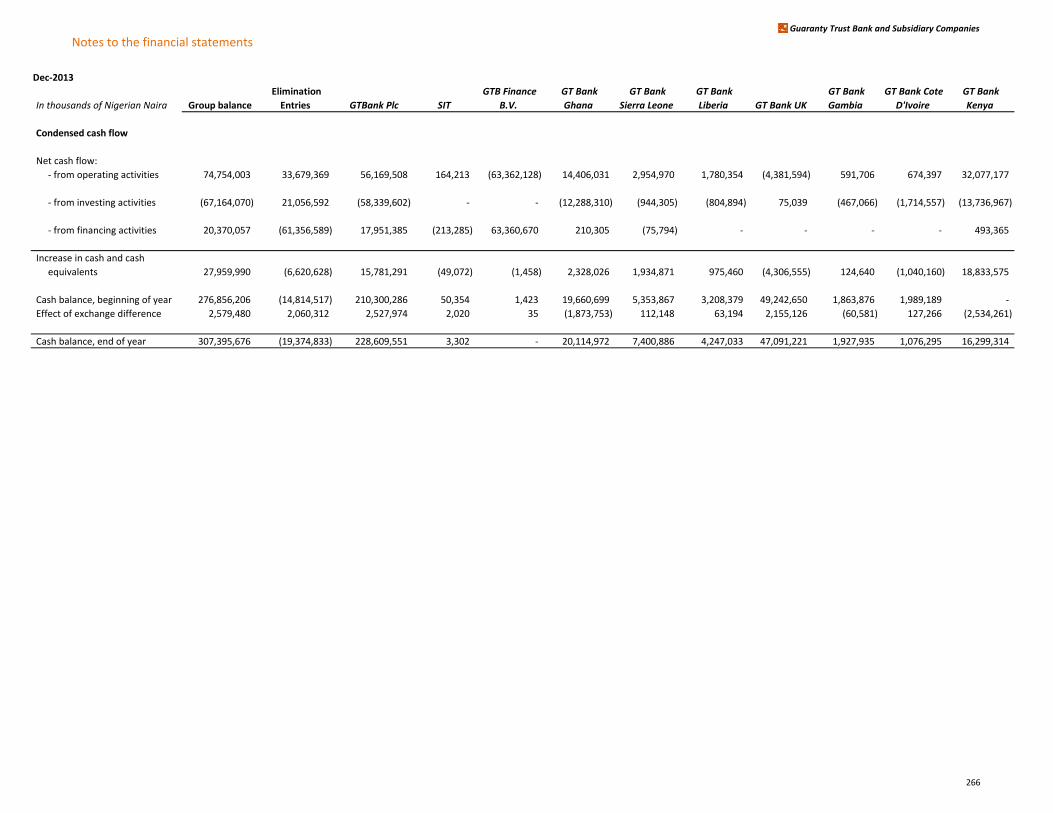
Notes to the financial statementsGuaranty Trust Bank and Subsidiary Companies
Dec-2013
In thousands of Nigerian Naira Group balance
Elimination
Entries GTBank Plc SIT
GTB Finance
B.V.
GT Bank
Ghana
GT Bank
Sierra Leone
GT Bank
Liberia GT Bank UK
GT Bank
Gambia
GT Bank Cote
D'Ivoire
GT Bank
Kenya
Condensed cash flow
Net cash flow:
- from operating activities 74,754,003 33,679,369 56,169,508 164,213 (63,362,128) 14,406,031 2,954,970 1,780,354 (4,381,594) 591,706 674,397 32,077,177
- from investing activities (67,164,070) 21,056,592 (58,339,602) - - (12,288,310) (944,305) (804,894) 75,039 (467,066) (1,714,557) (13,736,967)
- from financing activities 20,370,057 (61,356,589) 17,951,385 (213,285) 63,360,670 210,305 (75,794) - - - - 493,365
Increase in cash and cash
equivalents 27,959,990 (6,620,628) 15,781,291 (49,072) (1,458) 2,328,026 1,934,871 975,460 (4,306,555) 124,640 (1,040,160) 18,833,575
Cash balance, beginning of year 276,856,206 (14,814,517) 210,300,286 50,354 1,423 19,660,699 5,353,867 3,208,379 49,242,650 1,863,876 1,989,189 -
Effect of exchange difference 2,579,480 2,060,312 2,527,974 2,020 35 (1,873,753) 112,148 63,194 2,155,126 (60,581) 127,266 (2,534,261)
Cash balance, end of year 307,395,676 (19,374,833) 228,609,551 3,302 - 20,114,972 7,400,886 4,247,033 47,091,221 1,927,935 1,076,295 16,299,314
266
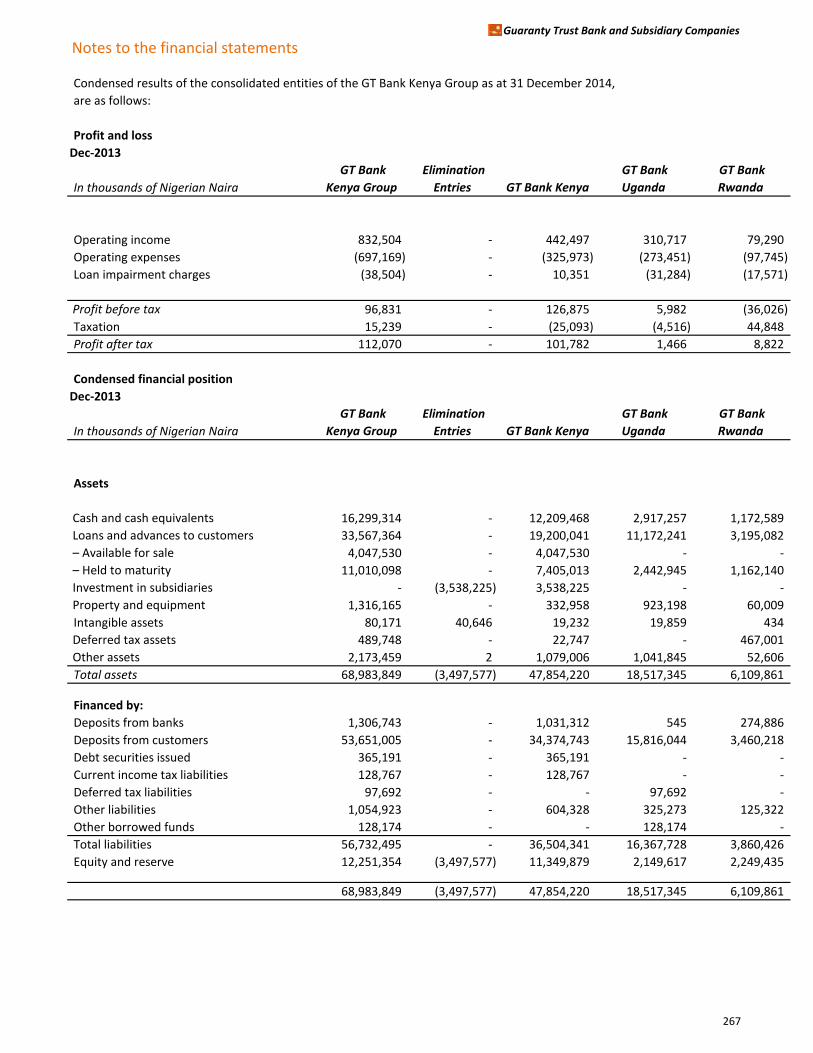
Notes to the financial statementsGuaranty Trust Bank and Subsidiary Companies
Condensed results of the consolidated entities of the GT Bank Kenya Group as at 31 December 2014,
are as follows:
Profit and loss
Dec-2013
In thousands of Nigerian Naira
GT Bank
Kenya Group
Elimination
Entries GT Bank Kenya
GT Bank
Uganda
GT Bank
Rwanda
Operating income 832,504 - 442,497 310,717 79,290
Operating expenses (697,169) - (325,973) (273,451) (97,745)
Loan impairment charges (38,504) - 10,351 (31,284) (17,571)
Profit before tax 96,831 - 126,875 5,982 (36,026)
Taxation 15,239 - (25,093) (4,516) 44,848
Profit after tax 112,070 - 101,782 1,466 8,822
Condensed financial position
Dec-2013
In thousands of Nigerian Naira
GT Bank
Kenya Group
Elimination
Entries GT Bank Kenya
GT Bank
Uganda
GT Bank
Rwanda
Assets
Cash and cash equivalents 16,299,314 - 12,209,468 2,917,257 1,172,589
Loans and advances to customers 33,567,364 - 19,200,041 11,172,241 3,195,082
– Available for sale 4,047,530 - 4,047,530 - -
– Held to maturity 11,010,098 - 7,405,013 2,442,945 1,162,140
Investment in subsidiaries - (3,538,225) 3,538,225 - -
Property and equipment 1,316,165 - 332,958 923,198 60,009
Intangible assets 80,171 40,646 19,232 19,859 434
Deferred tax assets 489,748 - 22,747 - 467,001
Other assets 2,173,459 2 1,079,006 1,041,845 52,606
Total assets 68,983,849 (3,497,577) 47,854,220 18,517,345 6,109,861
Financed by:
Deposits from banks 1,306,743 - 1,031,312 545 274,886
Deposits from customers 53,651,005 - 34,374,743 15,816,044 3,460,218
Debt securities issued 365,191 - 365,191 - -
Current income tax liabilities 128,767 - 128,767 - -
Deferred tax liabilities 97,692 - - 97,692 -
Other liabilities 1,054,923 - 604,328 325,273 125,322
Other borrowed funds 128,174 - - 128,174 -
Total liabilities 56,732,495 - 36,504,341 16,367,728 3,860,426
Equity and reserve 12,251,354 (3,497,577) 11,349,879 2,149,617 2,249,435
68,983,849 (3,497,577) 47,854,220 18,517,345 6,109,861
267
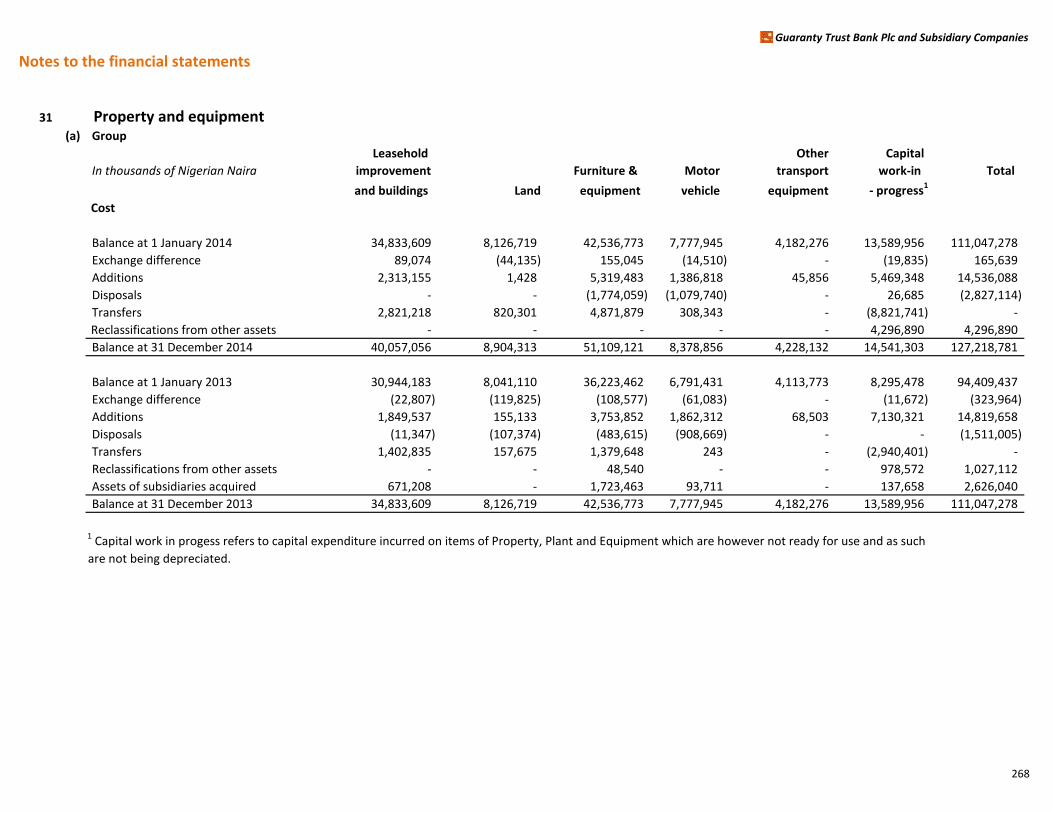
Notes to the financial statements
Guaranty Trust Bank Plc and Subsidiary Companies
31 Property and equipment(a) Group
Leasehold Other Capital
In thousands of Nigerian Naira improvement Furniture & Motor transport work-in Total
and buildings Land equipment vehicle equipment - progress1
Cost
Balance at 1 January 2014 34,833,609 8,126,719 42,536,773 7,777,945 4,182,276 13,589,956 111,047,278
Exchange difference 89,074 (44,135) 155,045 (14,510) - (19,835) 165,639
Additions 2,313,155 1,428 5,319,483 1,386,818 45,856 5,469,348 14,536,088
Disposals - - (1,774,059) (1,079,740) - 26,685 (2,827,114)
Transfers 2,821,218 820,301 4,871,879 308,343 - (8,821,741) -
Reclassifications from other assets - - - - - 4,296,890 4,296,890
Balance at 31 December 2014 40,057,056 8,904,313 51,109,121 8,378,856 4,228,132 14,541,303 127,218,781
Balance at 1 January 2013 30,944,183 8,041,110 36,223,462 6,791,431 4,113,773 8,295,478 94,409,437
Exchange difference (22,807) (119,825) (108,577) (61,083) - (11,672) (323,964)
Additions 1,849,537 155,133 3,753,852 1,862,312 68,503 7,130,321 14,819,658
Disposals (11,347) (107,374) (483,615) (908,669) - - (1,511,005)
Transfers 1,402,835 157,675 1,379,648 243 - (2,940,401) -
Reclassifications from other assets - - 48,540 - - 978,572 1,027,112
Assets of subsidiaries acquired 671,208 - 1,723,463 93,711 - 137,658 2,626,040
Balance at 31 December 2013 34,833,609 8,126,719 42,536,773 7,777,945 4,182,276 13,589,956 111,047,278
1 Capital work in progess refers to capital expenditure incurred on items of Property, Plant and Equipment which are however not ready for use and as such
are not being depreciated.
268

Notes to the financial statements
Guaranty Trust Bank Plc and Subsidiary Companies
Property and equipment (continued)Group
Depreciation Leasehold Other Capital
In thousands of Nigerian Naira improvement Furniture & Motor transport work-in Total
and buildings Land equipment vehicle equipment - progress
Balance at 1 January 2014 5,608,145 511,759 29,649,935 4,845,724 2,125,518 - 42,741,081
Exchange difference 21,545 818 56,658 (13,637) - - 65,384
Charge for the year 1,763,571 103,211 7,214,573 1,410,096 507,664 - 10,999,115
Disposal - - (1,796,475) (1,026,771) - - (2,823,246)
Balance at 31 December 2014 7,393,261 615,788 35,124,691 5,215,412 2,633,182 - 50,982,334
Balance at 1 January 2013 4,022,731 538,069 22,939,717 4,389,515 1,632,677 - 33,522,709
Exchange difference (5,866) (15,025) (122,744) (32,414) - - (176,049)
Charge for the year 1,506,792 96,089 6,021,577 1,215,291 492,841 - 9,332,590
Disposal (80,302) (107,374) (361,408) (789,437) - - (1,338,521)
Assets of subsidiaries acquired 164,790 - 1,172,793 62,769 - - 1,400,352
Balance at 31 December 2013 5,608,145 511,759 29,649,935 4,845,724 2,125,518 - 42,741,081
Carrying amounts:
Balance at 31 December 2014 32,663,795 8,288,525 15,984,430 3,163,444 1,594,950 14,541,303 76,236,447
Balance at 31 December 2013 29,225,464 7,614,960 12,886,838 2,932,221 2,056,758 13,589,956 68,306,197
269

Notes to the financial statements
Guaranty Trust Bank Plc and Subsidiary Companies
Property and equipment (continued)(b) Parent
Leasehold Other Capital
In thousands of Nigerian Naira improvement Furniture & Motor transport work-in Total
and buildings Land equipment vehicle equipment - progress1
Cost
Balance at 1 January 2014 30,619,466 7,480,315 37,731,140 6,778,445 4,182,276 12,947,373 99,739,015
Exchange difference - - - - - - -
Additions 1,998,333 - 3,873,763 1,082,626 45,856 5,163,325 12,163,903
Disposals - - (1,631,625) (1,008,981) - - (2,640,606)
Transfers 2,614,401 820,301 4,765,194 308,343 - (8,508,239) -
Reclassifications from other assets - - - - - 4,296,890 4,296,890
Balance at 31 December 2014 35,232,200 8,300,616 44,738,472 7,160,433 4,228,132 13,899,349 113,559,202
Balance at 1 January 2013 27,597,533 7,270,014 33,145,122 5,963,590 4,113,773 7,920,000 86,010,032
Exchange difference - - - - - - -
Additions 1,862,876 160,000 3,298,246 1,608,653 68,503 6,676,561 13,674,839
Disposals (40) (107,374) (23,216) (793,798) - - (924,428)
Transfers 1,159,097 157,675 1,310,988 - - (2,627,760) -
Reclassifications from other assets - - - - - 978,572 978,572
Balance at 31 December 2013 30,619,466 7,480,315 37,731,140 6,778,445 4,182,276 12,947,373 99,739,015
1 Capital work in progess refers to capital expenditure incurred on items of Property, Plant and Equipment which are however not ready for use and as such
are not being depreciated.
270
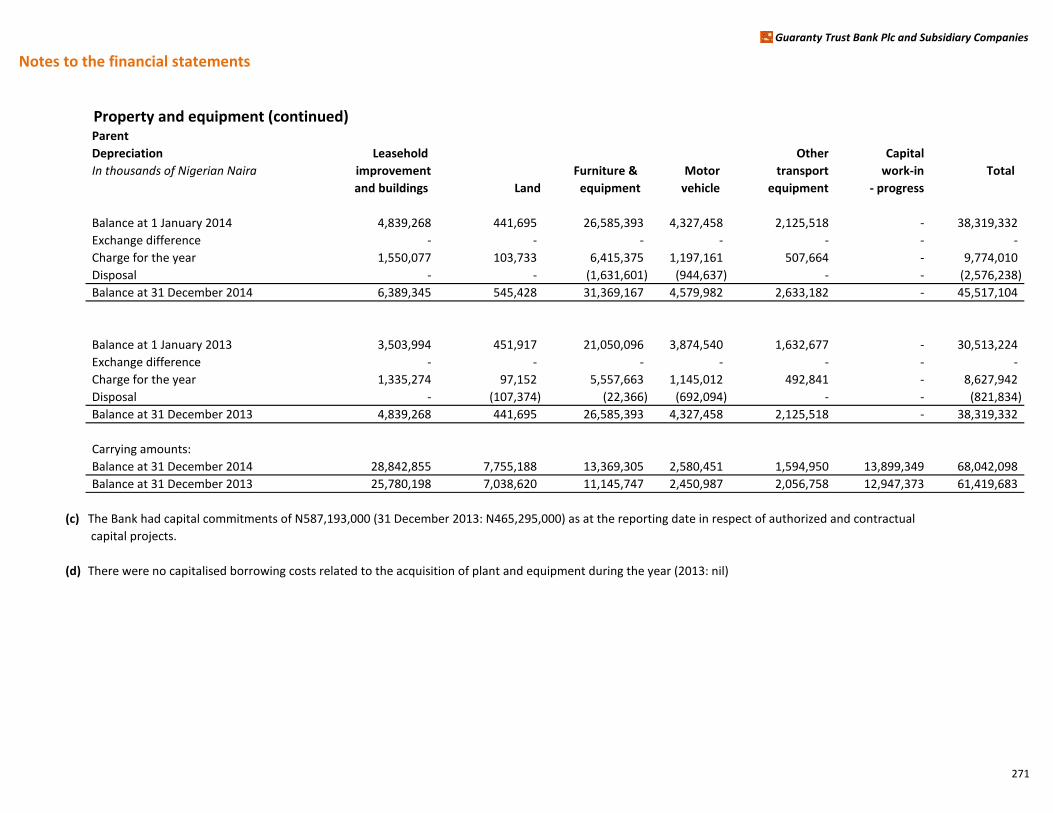
Notes to the financial statements
Guaranty Trust Bank Plc and Subsidiary Companies
Property and equipment (continued)Parent
Depreciation Leasehold Other Capital
In thousands of Nigerian Naira improvement Furniture & Motor transport work-in Total
and buildings Land equipment vehicle equipment - progress
Balance at 1 January 2014 4,839,268 441,695 26,585,393 4,327,458 2,125,518 - 38,319,332
Exchange difference - - - - - - -
Charge for the year 1,550,077 103,733 6,415,375 1,197,161 507,664 - 9,774,010
Disposal - - (1,631,601) (944,637) - - (2,576,238)
Balance at 31 December 2014 6,389,345 545,428 31,369,167 4,579,982 2,633,182 - 45,517,104
Balance at 1 January 2013 3,503,994 451,917 21,050,096 3,874,540 1,632,677 - 30,513,224
Exchange difference - - - - - - -
Charge for the year 1,335,274 97,152 5,557,663 1,145,012 492,841 - 8,627,942
Disposal - (107,374) (22,366) (692,094) - - (821,834)
Balance at 31 December 2013 4,839,268 441,695 26,585,393 4,327,458 2,125,518 - 38,319,332
Carrying amounts:
Balance at 31 December 2014 28,842,855 7,755,188 13,369,305 2,580,451 1,594,950 13,899,349 68,042,098
Balance at 31 December 2013 25,780,198 7,038,620 11,145,747 2,450,987 2,056,758 12,947,373 61,419,683
(c) The Bank had capital commitments of N587,193,000 (31 December 2013: N465,295,000) as at the reporting date in respect of authorized and contractual
capital projects.
(d) There were no capitalised borrowing costs related to the acquisition of plant and equipment during the year (2013: nil)
271
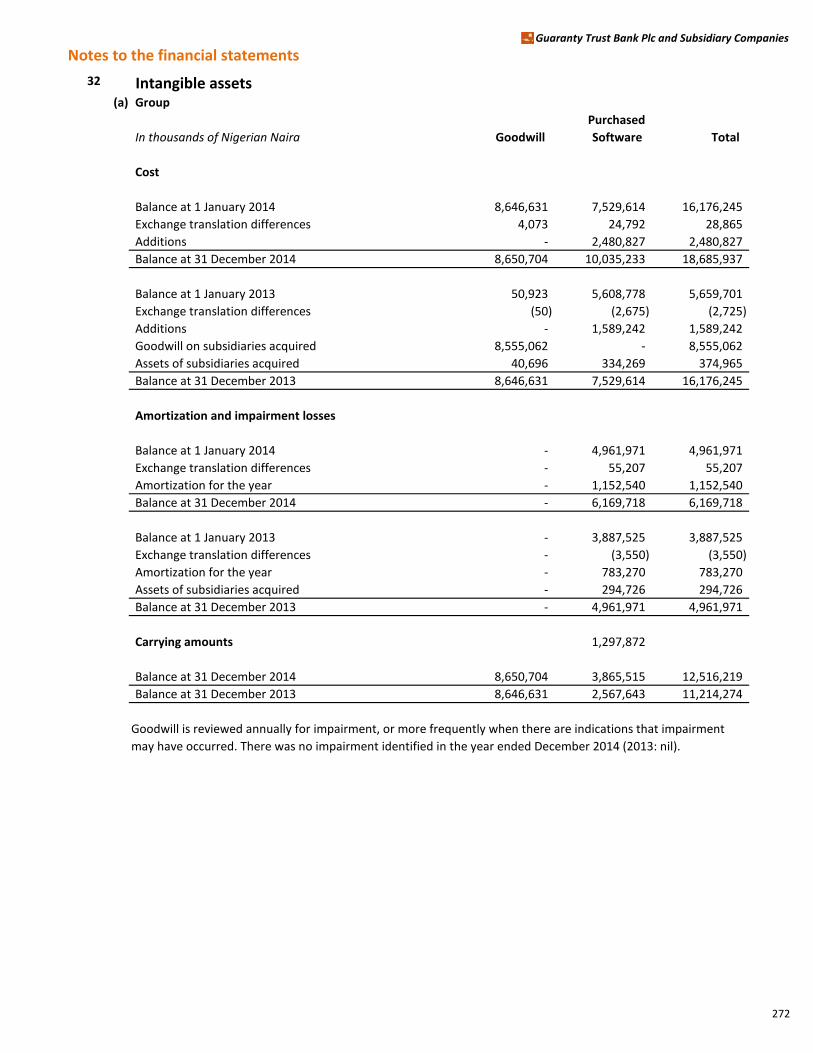
Notes to the financial statementsGuaranty Trust Bank Plc and Subsidiary Companies
32 Intangible assets (a) Group
Purchased
In thousands of Nigerian Naira Goodwill Software Total
Cost
Balance at 1 January 2014 8,646,631 7,529,614 16,176,245
Exchange translation differences 4,073 24,792 28,865
Additions - 2,480,827 2,480,827
Balance at 31 December 2014 8,650,704 10,035,233 18,685,937
Balance at 1 January 2013 50,923 5,608,778 5,659,701
Exchange translation differences (50) (2,675) (2,725)
Additions - 1,589,242 1,589,242
Goodwill on subsidiaries acquired 8,555,062 - 8,555,062
Assets of subsidiaries acquired 40,696 334,269 374,965
Balance at 31 December 2013 8,646,631 7,529,614 16,176,245
Amortization and impairment losses
Balance at 1 January 2014 - 4,961,971 4,961,971
Exchange translation differences - 55,207 55,207
Amortization for the year - 1,152,540 1,152,540
Balance at 31 December 2014 - 6,169,718 6,169,718
Balance at 1 January 2013 - 3,887,525 3,887,525
Exchange translation differences - (3,550) (3,550)
Amortization for the year - 783,270 783,270
Assets of subsidiaries acquired - 294,726 294,726
Balance at 31 December 2013 - 4,961,971 4,961,971
Carrying amounts 1,297,872
Balance at 31 December 2014 8,650,704 3,865,515 12,516,219
Balance at 31 December 2013 8,646,631 2,567,643 11,214,274
Goodwill is reviewed annually for impairment, or more frequently when there are indications that impairment
may have occurred. There was no impairment identified in the year ended December 2014 (2013: nil).
272
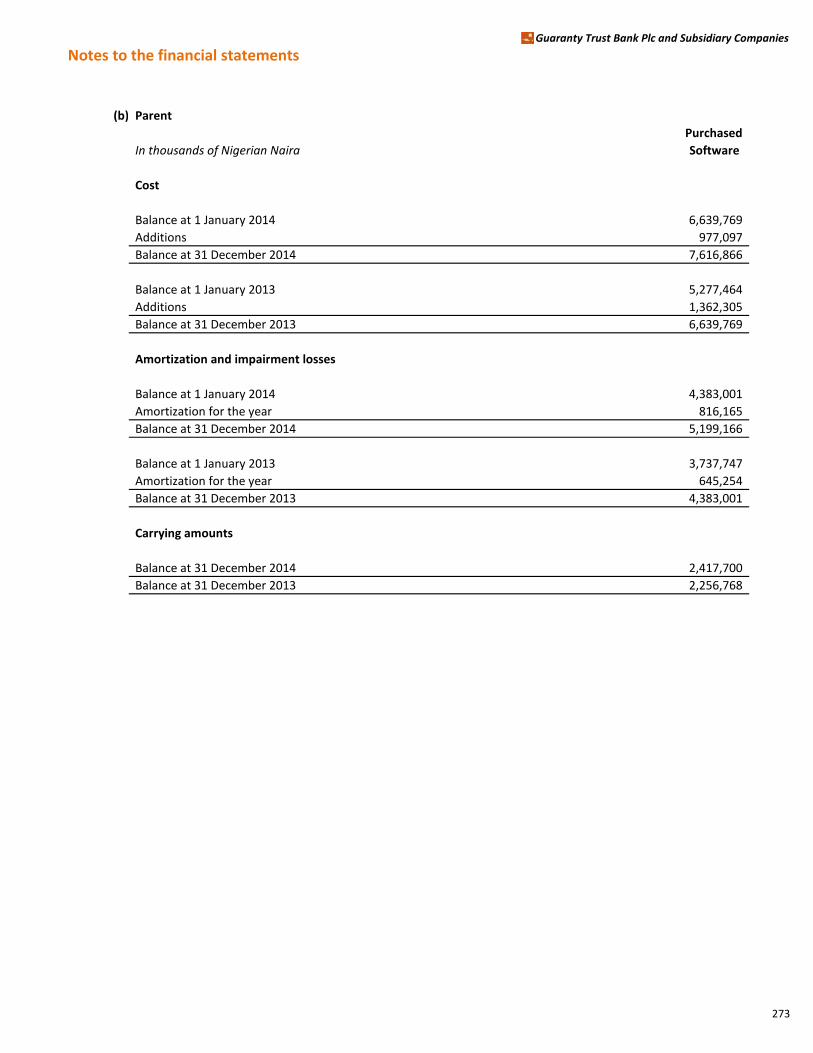
Notes to the financial statementsGuaranty Trust Bank Plc and Subsidiary Companies
(b) Parent
Purchased Purchased
In thousands of Nigerian Naira Goodwill Software Software
Cost
Balance at 1 January 2014 - 6,639,769 6,639,769
Additions - 977,097 977,097
Balance at 31 December 2014 - 7,616,866 7,616,866
Balance at 1 January 2013 - 5,277,464 5,277,464
Additions - 1,362,305 1,362,305
Balance at 31 December 2013 - 6,639,769 6,639,769
Amortization and impairment losses
Balance at 1 January 2014 - 4,383,001 4,383,001
Amortization for the year - 816,165 816,165
Balance at 31 December 2014 - 5,199,166 5,199,166
Balance at 1 January 2013 - 3,737,747 3,737,747
Amortization for the year - 645,254 645,254
Balance at 31 December 2013 - 4,383,001 4,383,001
Carrying amounts
Balance at 31 December 2014 - 2,417,700 2,417,700
Balance at 31 December 2013 - 2,256,768 2,256,768
273
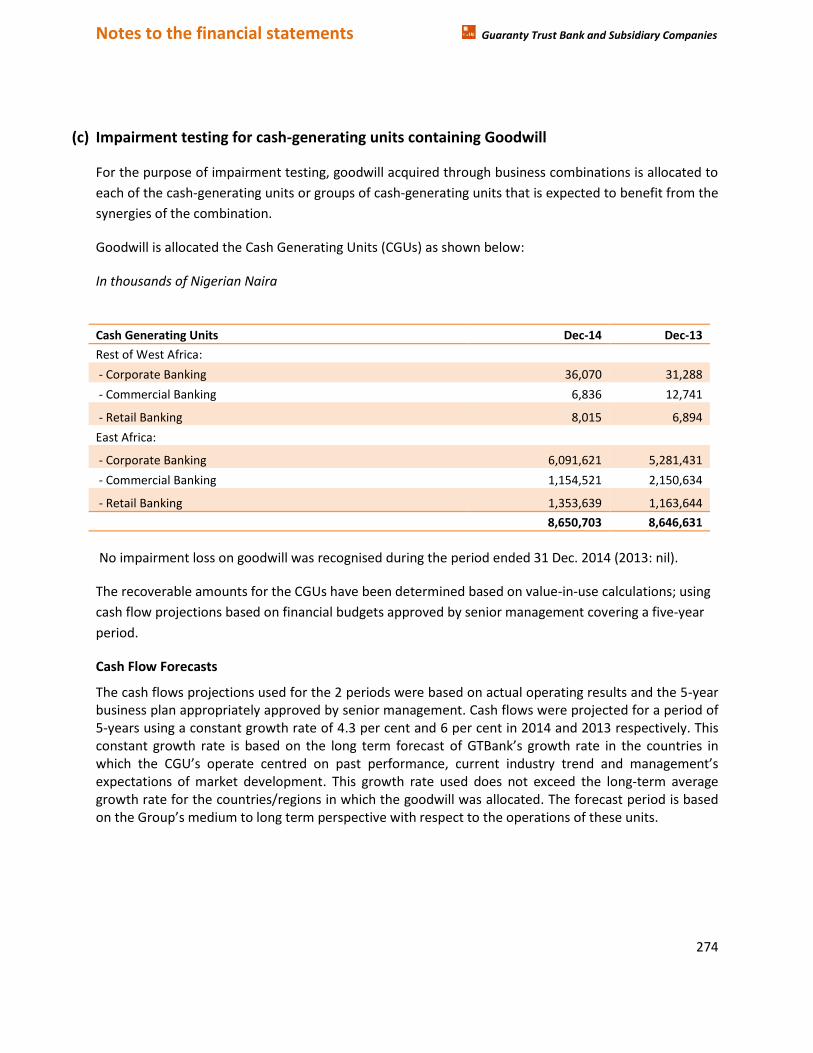
Notes to the financial statements Guaranty Trust Bank and Subsidiary Companies
274
(c) Impairment testing for cash-generating units containing Goodwill
For the purpose of impairment testing, goodwill acquired through business combinations is allocated to
each of the cash-generating units or groups of cash-generating units that is expected to benefit from the
synergies of the combination.
Goodwill is allocated the Cash Generating Units (CGUs) as shown below:
In thousands of Nigerian Naira
Cash Generating Units Dec-14 Dec-13
Rest of West Africa: - Corporate Banking 36,070 31,288
- Commercial Banking 6,836 12,741
- Retail Banking 8,015 6,894
East Africa:
- Corporate Banking 6,091,621 5,281,431
- Commercial Banking 1,154,521 2,150,634
- Retail Banking 1,353,639 1,163,644
8,650,703 8,646,631
No impairment loss on goodwill was recognised during the period ended 31 Dec. 2014 (2013: nil).
The recoverable amounts for the CGUs have been determined based on value-in-use calculations; using
cash flow projections based on financial budgets approved by senior management covering a five-year
period.
Cash Flow Forecasts
The cash flows projections used for the 2 periods were based on actual operating results and the 5-year business plan appropriately approved by senior management. Cash flows were projected for a period of 5-years using a constant growth rate of 4.3 per cent and 6 per cent in 2014 and 2013 respectively. This constant growth rate is based on the long term forecast of GTBank’s growth rate in the countries in which the CGU’s operate centred on past performance, current industry trend and management’s expectations of market development. This growth rate used does not exceed the long-term average growth rate for the countries/regions in which the goodwill was allocated. The forecast period is based on the Group’s medium to long term perspective with respect to the operations of these units.

Notes to the financial statements Guaranty Trust Bank and Subsidiary Companies
275
Valuation Assumptions and Other Disclosures
For each of the CGUs for which the goodwill was allocated, the key assumptions used in Value-in-use calculations are as follows:
The recoverable amount of the regions for which goodwill was allocated has been based on their value in use which was determined by discounting the projected cash flows generated by the segments with an average discount rate of 10.4% derived using earnings yield approach. It would require over N2.17billion change in the recoverable amount of the most vulnerable CGU (East Africa – Commercial) before goodwill allocated the CGU can be assumed impaired.
2014-Key Assumptions Rest of West Africa
East Africa
Corporate Commercial Retail
Corporate Commercial Retail
Revenue Growth Rate (%) 10.5% 10.5% 10.5%
9.5% 9.5% 9.5% Operating Income Growth Rate (%) 10.0% 10.0% 10.0%
10.0% 10.0% 10.0%
Other Operating Costs (₦'Million) 2,006 2,585 4,177
1,118 1,441 2,329
Annual Capital Expenditure (₦'Million) 64.1 12.2 14.3
443 313.9 59.5
Recoverable Amount (₦'Million) 102,109 19,222 39,608
13,556 4,080 8,855
Long Term Growth Rate (%) 4%-7.3% 4%-7.3% 4%-7.3%
4%-7.3% 4%-7.3% 4%-7.3%
Discount Rate (%) 10.42% 10.42% 10.42%
10.42% 10.42% 10.42%
2013-Key Assumptions Rest of West Africa
East Africa
Corporate Commercial Retail
Corporate Commercial Retail
Revenue Growth Rate (%) 10% 10% 10%
10% 10% 10% Operating Income Growth Rate (%) 10% 10% 10%
10% 10% 10%
Other Operating Costs (₦'Million) 1,645 2,163 3,828
158 208 369
Annual Capital Expenditure (₦'Million) 66 27 15
323 132 71
Recoverable Amount (₦'Million) 93,662 34,715 29,399
6,734 3,611 6,061
Long Term Growth Rate (%) 6%-7.3% 6%-7.3% 6%-7.3%
6%-7.3% 6%-7.3% 6%-7.3%
Discount Rate (%) 11.64% 11.64% 11.64%
11.64% 11.64% 11.64%
The key assumptions described above may change as economic and market conditions change. The Group estimates that reasonably possible changes in these assumptions are not expected to cause the recoverable amount of the subsidiaries (from which the goodwill arose) to decline below their carrying amount.
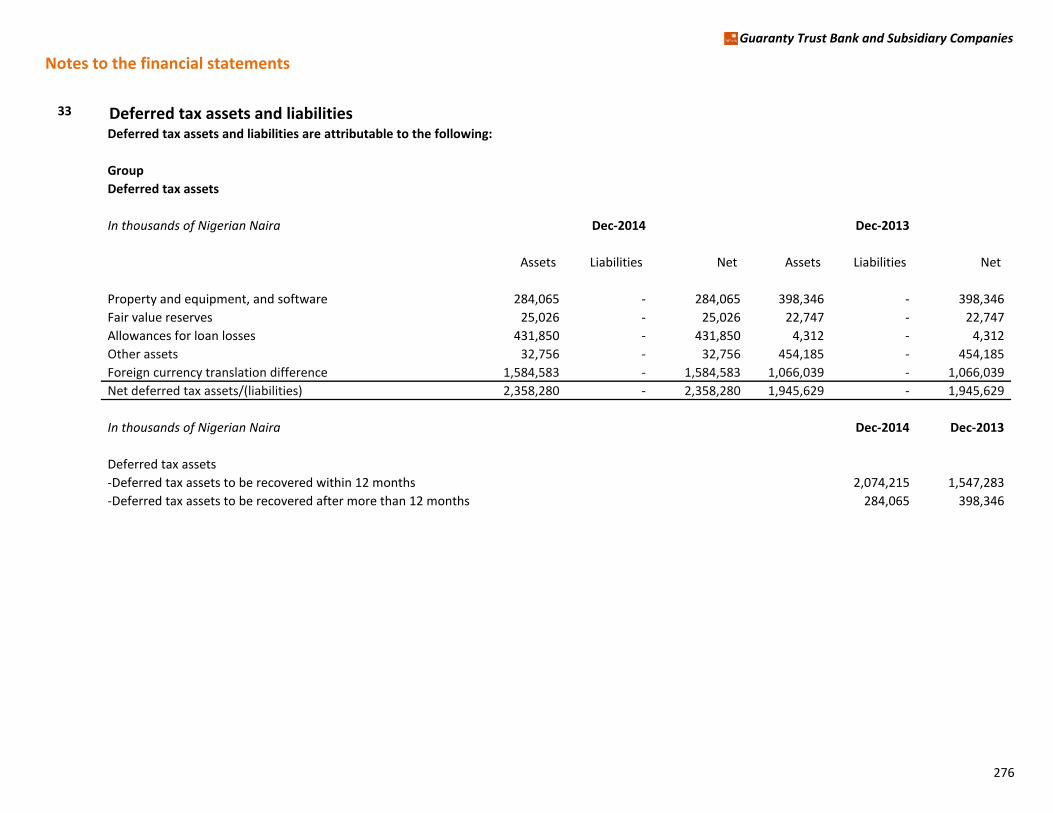
Notes to the financial statements
Guaranty Trust Bank and Subsidiary Companies
33 Deferred tax assets and liabilitiesDeferred tax assets and liabilities are attributable to the following:
Group
Deferred tax assets
In thousands of Nigerian Naira Dec-2014 Dec-2013
Assets Liabilities Net Assets Liabilities Net
Property and equipment, and software 284,065 - 284,065 398,346 - 398,346
Fair value reserves 25,026 - 25,026 22,747 - 22,747
Allowances for loan losses 431,850 - 431,850 4,312 - 4,312
Other assets 32,756 - 32,756 454,185 - 454,185
Foreign currency translation difference 1,584,583 - 1,584,583 1,066,039 - 1,066,039
Net deferred tax assets/(liabilities) 2,358,280 - 2,358,280 1,945,629 - 1,945,629
In thousands of Nigerian Naira Dec-2014 Dec-2013
Deferred tax assets
-Deferred tax assets to be recovered within 12 months 2,074,215 1,547,283
-Deferred tax assets to be recovered after more than 12 months 284,065 398,346
276
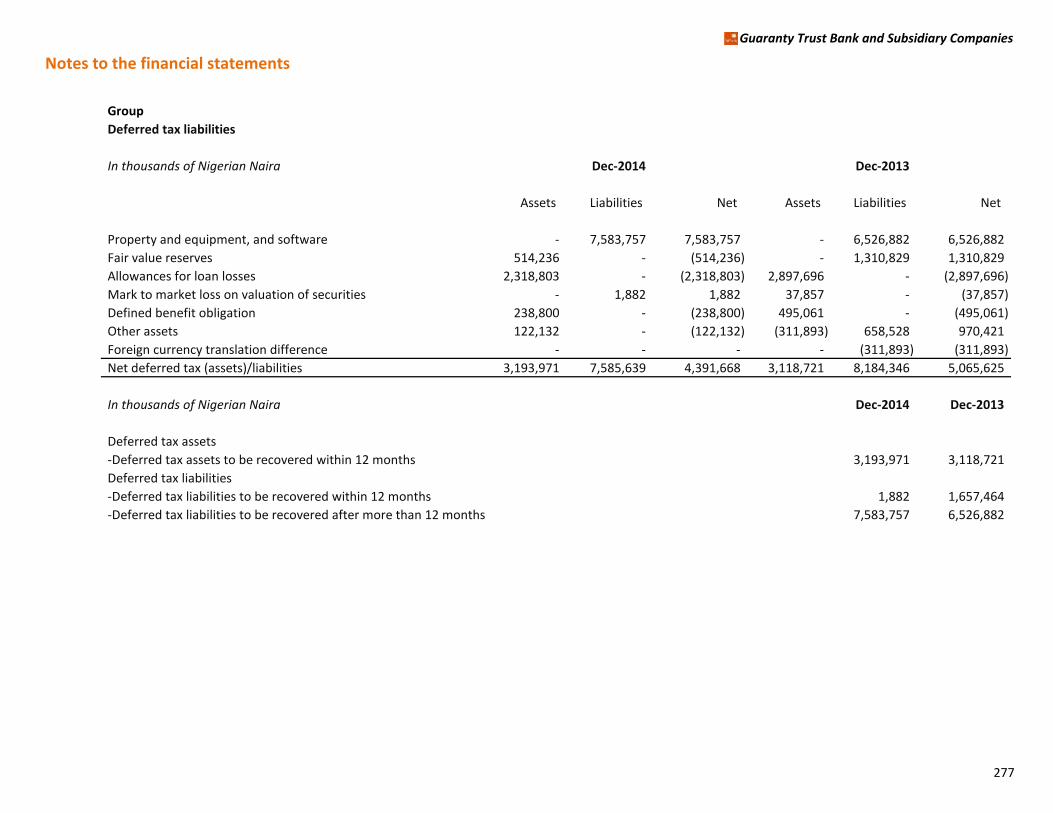
Notes to the financial statements
Guaranty Trust Bank and Subsidiary Companies
Group
Deferred tax liabilities
In thousands of Nigerian Naira Dec-2014 Dec-2013
Assets Liabilities Net Assets Liabilities Net
Property and equipment, and software - 7,583,757 7,583,757 - 6,526,882 6,526,882
Fair value reserves 514,236 - (514,236) - 1,310,829 1,310,829
Allowances for loan losses 2,318,803 - (2,318,803) 2,897,696 - (2,897,696)
Mark to market loss on valuation of securities - 1,882 1,882 37,857 - (37,857)
Defined benefit obligation 238,800 - (238,800) 495,061 - (495,061)
Other assets 122,132 - (122,132) (311,893) 658,528 970,421
Foreign currency translation difference - - - - (311,893) (311,893)
Net deferred tax (assets)/liabilities 3,193,971 7,585,639 4,391,668 3,118,721 8,184,346 5,065,625
In thousands of Nigerian Naira Dec-2014 Dec-2013
Deferred tax assets
-Deferred tax assets to be recovered within 12 months 3,193,971 3,118,721
Deferred tax liabilities
-Deferred tax liabilities to be recovered within 12 months 1,882 1,657,464
-Deferred tax liabilities to be recovered after more than 12 months 7,583,757 6,526,882
277

Notes to the financial statements
Guaranty Trust Bank and Subsidiary Companies
Parent
Deferred Tax Liabilities
In thousands of Nigerian Naira Dec-2014 Dec-2013
Assets Liabilities Net Assets Liabilities Net
Property and equipment, and software - 7,147,894 7,147,894 - 6,219,780 6,219,780
Fair value reserves 514,236 - (514,236) - 1,238,836 1,238,836
Allowances for loan losses 2,318,803 - (2,318,803) 2,808,099 - (2,808,099)
Mark to market loss on valuation of securities - 1,882 1,882 37,857 - (37,857)
Defined benefit obligation 238,800 - (238,800) 495,061 - (495,061)
Other assets 122,132 - (122,132) 91,667 758,391 666,724
Net deferred tax (assets)/liabilities 3,193,971 7,149,776 3,955,805 3,432,684 8,217,007 4,784,323
In thousands of Nigerian Naira Dec-2014 Dec-2013
Deferred tax assets
-Deferred tax assets to be recovered within 12 months 3,193,971 3,432,684
Deferred tax liabilities
-Deferred tax liabilities to be recovered within 12 months 1,882 1,997,227
-Deferred tax liabilities to be recovered after more than 12 months 7,147,894 6,219,780
278
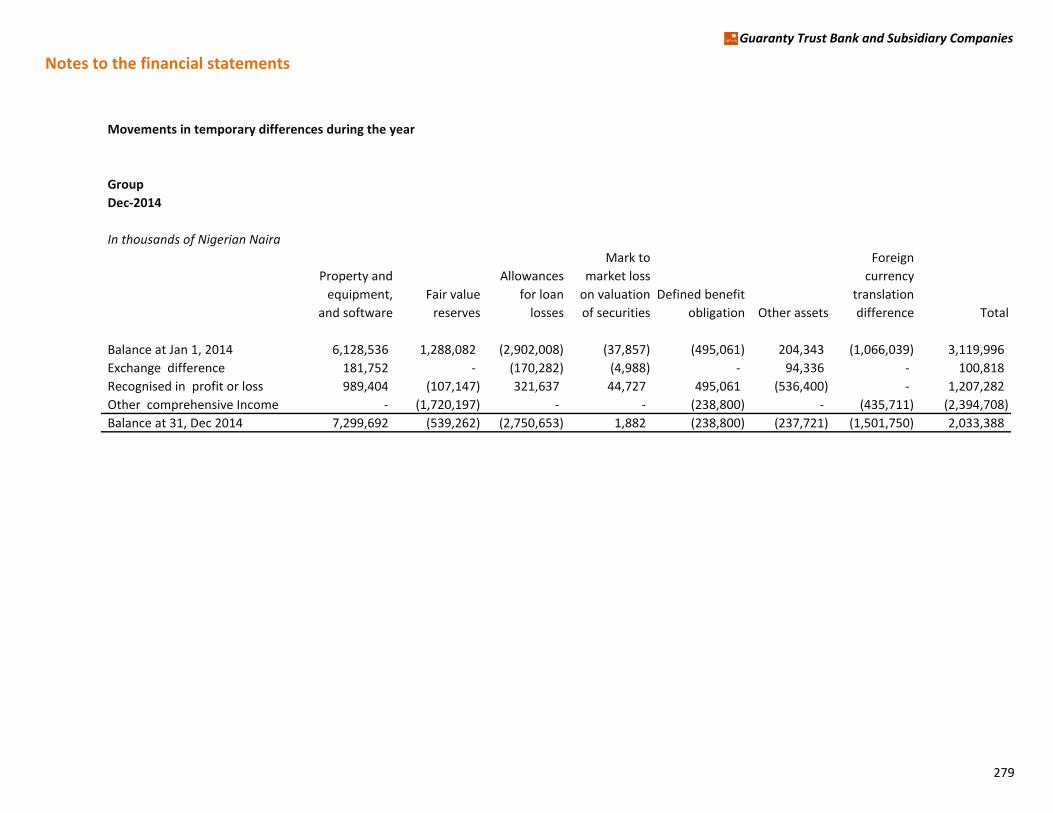
Notes to the financial statements
Guaranty Trust Bank and Subsidiary Companies
Movements in temporary differences during the year
Group
Dec-2014
In thousands of Nigerian Naira
Property and
equipment,
and software
Fair value
reserves
Allowances
for loan
losses
Mark to
market loss
on valuation
of securities
Defined benefit
obligation Other assets
Foreign
currency
translation
difference Total
Balance at Jan 1, 2014 6,128,536 1,288,082 (2,902,008) (37,857) (495,061) 204,343 (1,066,039) 3,119,996
Exchange difference 181,752 - (170,282) (4,988) - 94,336 - 100,818
Recognised in profit or loss 989,404 (107,147) 321,637 44,727 495,061 (536,400) - 1,207,282
Other comprehensive Income - (1,720,197) - - (238,800) - (435,711) (2,394,708)
Balance at 31, Dec 2014 7,299,692 (539,262) (2,750,653) 1,882 (238,800) (237,721) (1,501,750) 2,033,388
279
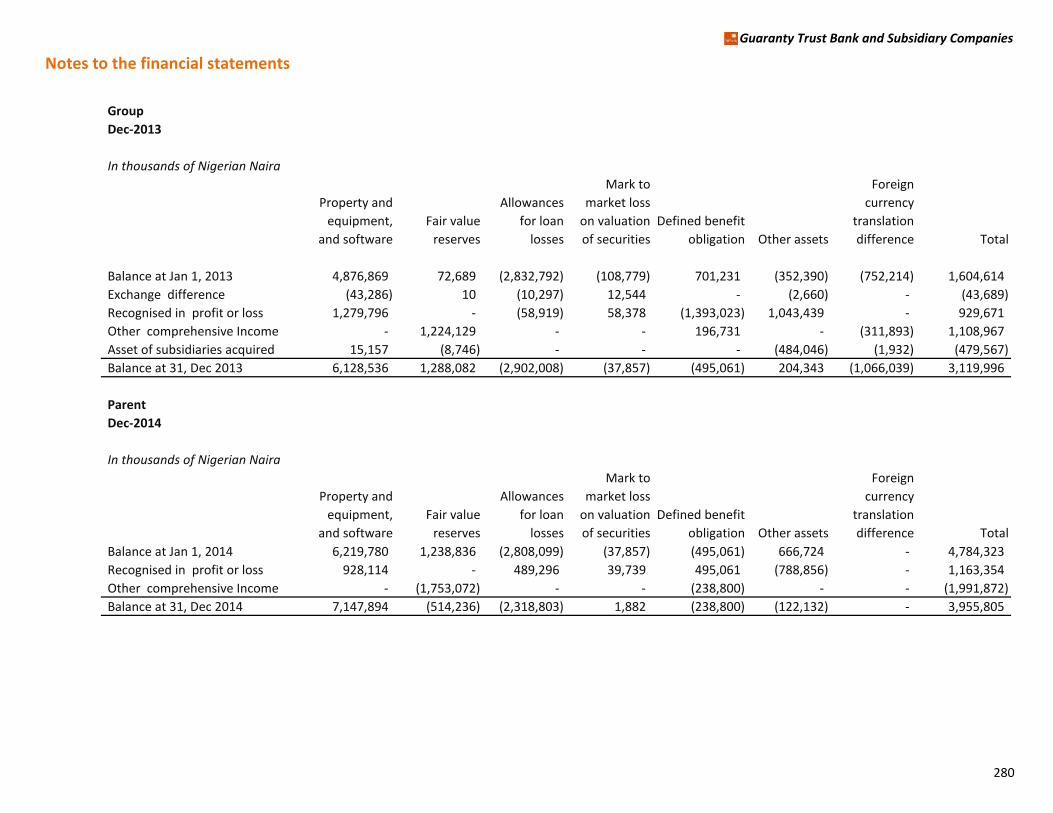
Notes to the financial statements
Guaranty Trust Bank and Subsidiary Companies
Group
Dec-2013
In thousands of Nigerian Naira
Property and
equipment,
and software
Fair value
reserves
Allowances
for loan
losses
Mark to
market loss
on valuation
of securities
Defined benefit
obligation Other assets
Foreign
currency
translation
difference Total
Balance at Jan 1, 2013 4,876,869 72,689 (2,832,792) (108,779) 701,231 (352,390) (752,214) 1,604,614
Exchange difference (43,286) 10 (10,297) 12,544 - (2,660) - (43,689)
Recognised in profit or loss 1,279,796 - (58,919) 58,378 (1,393,023) 1,043,439 - 929,671
Other comprehensive Income - 1,224,129 - - 196,731 - (311,893) 1,108,967
Asset of subsidiaries acquired 15,157 (8,746) - - - (484,046) (1,932) (479,567)
Balance at 31, Dec 2013 6,128,536 1,288,082 (2,902,008) (37,857) (495,061) 204,343 (1,066,039) 3,119,996
Parent
Dec-2014
In thousands of Nigerian Naira
Property and
equipment,
and software
Fair value
reserves
Allowances
for loan
losses
Mark to
market loss
on valuation
of securities
Defined benefit
obligation Other assets
Foreign
currency
translation
difference Total
Balance at Jan 1, 2014 6,219,780 1,238,836 (2,808,099) (37,857) (495,061) 666,724 - 4,784,323
Recognised in profit or loss 928,114 - 489,296 39,739 495,061 (788,856) - 1,163,354
Other comprehensive Income - (1,753,072) - - (238,800) - - (1,991,872)
Balance at 31, Dec 2014 7,147,894 (514,236) (2,318,803) 1,882 (238,800) (122,132) - 3,955,805
280
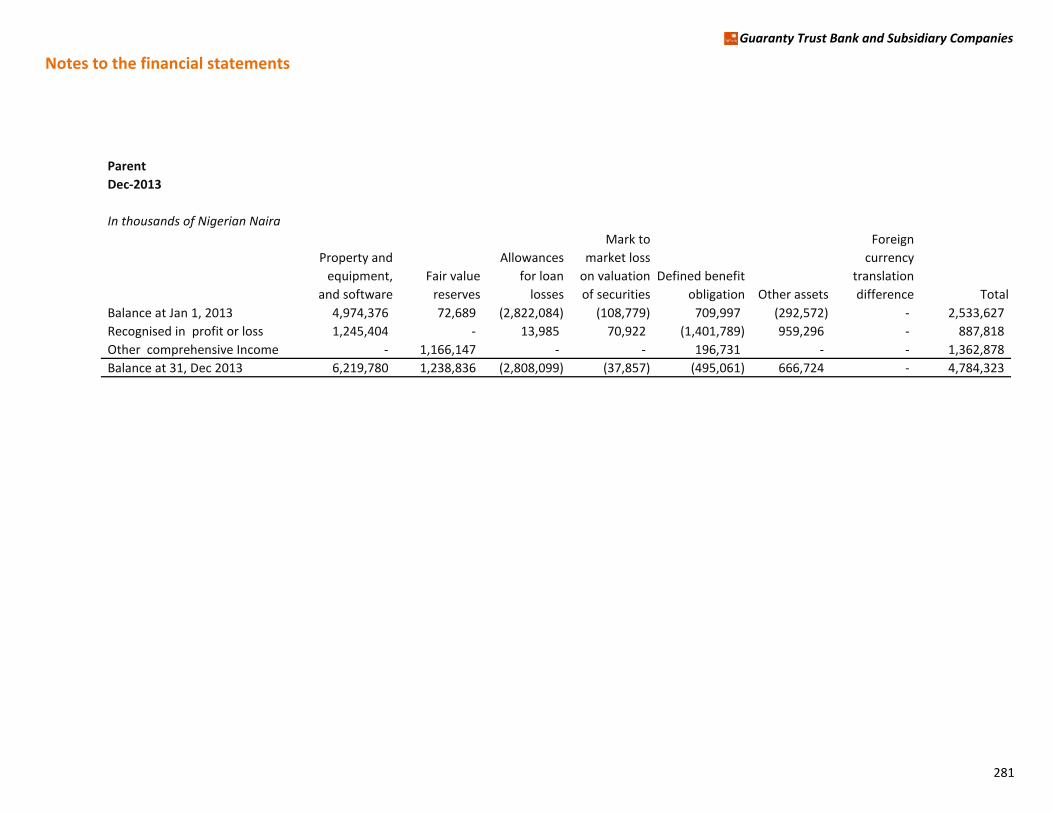
Notes to the financial statements
Guaranty Trust Bank and Subsidiary Companies
Parent
Dec-2013
In thousands of Nigerian Naira
Property and
equipment,
and software
Fair value
reserves
Allowances
for loan
losses
Mark to
market loss
on valuation
of securities
Defined benefit
obligation Other assets
Foreign
currency
translation
difference Total
Balance at Jan 1, 2013 4,974,376 72,689 (2,822,084) (108,779) 709,997 (292,572) - 2,533,627
Recognised in profit or loss 1,245,404 - 13,985 70,922 (1,401,789) 959,296 - 887,818
Other comprehensive Income - 1,166,147 - - 196,731 - - 1,362,878
Balance at 31, Dec 2013 6,219,780 1,238,836 (2,808,099) (37,857) (495,061) 666,724 - 4,784,323
281
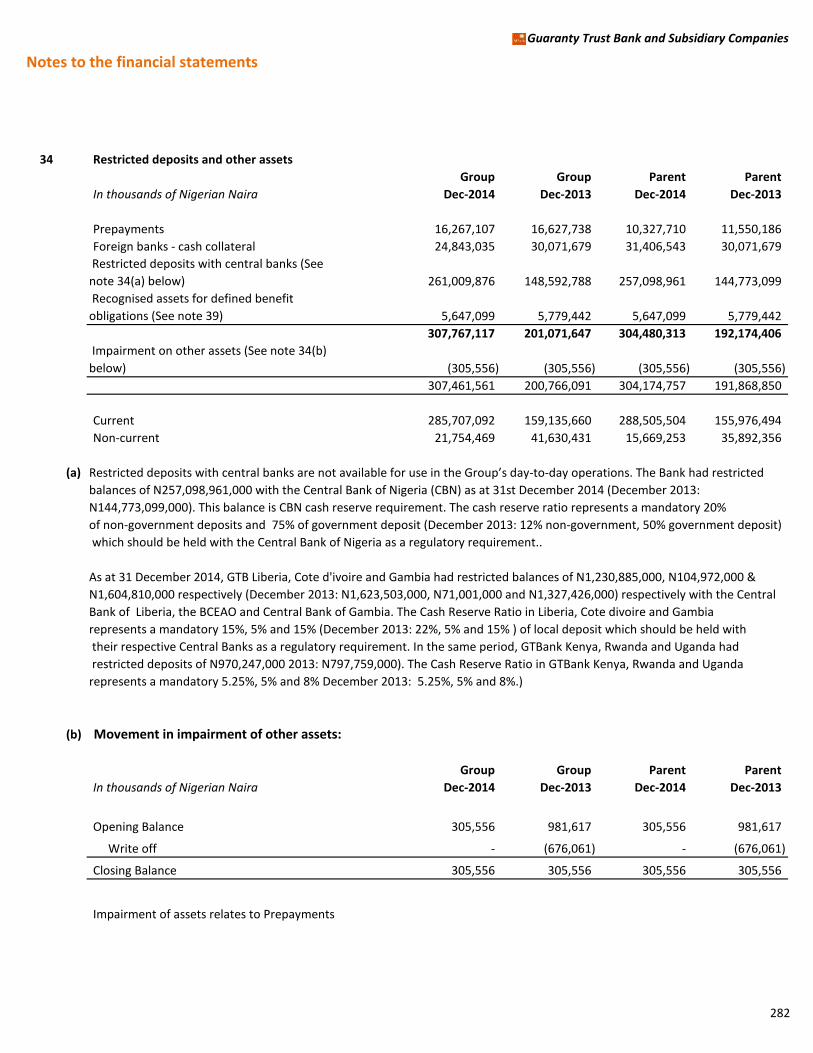
Notes to the financial statements
Guaranty Trust Bank and Subsidiary Companies
34 Restricted deposits and other assets
Group Group Parent Parent
In thousands of Nigerian Naira Dec-2014 Dec-2013 Dec-2014 Dec-2013
Prepayments 16,267,107 16,627,738 10,327,710 11,550,186
Foreign banks - cash collateral 24,843,035 30,071,679 31,406,543 30,071,679
Restricted deposits with central banks (See
note 34(a) below) 261,009,876 148,592,788 257,098,961 144,773,099
Recognised assets for defined benefit
obligations (See note 39) 5,647,099 5,779,442 5,647,099 5,779,442
307,767,117 201,071,647 304,480,313 192,174,406
Impairment on other assets (See note 34(b)
below) (305,556) (305,556) (305,556) (305,556)
307,461,561 200,766,091 304,174,757 191,868,850
Current 285,707,092 159,135,660 288,505,504 155,976,494
Non-current 21,754,469 41,630,431 15,669,253 35,892,356
(a) Restricted deposits with central banks are not available for use in the Group’s day-to-day operations. The Bank had restricted
balances of N257,098,961,000 with the Central Bank of Nigeria (CBN) as at 31st December 2014 (December 2013:
N144,773,099,000). This balance is CBN cash reserve requirement. The cash reserve ratio represents a mandatory 20%
of non-government deposits and 75% of government deposit (December 2013: 12% non-government, 50% government deposit)
which should be held with the Central Bank of Nigeria as a regulatory requirement..
As at 31 December 2014, GTB Liberia, Cote d'ivoire and Gambia had restricted balances of N1,230,885,000, N104,972,000 &
N1,604,810,000 respectively (December 2013: N1,623,503,000, N71,001,000 and N1,327,426,000) respectively with the Central
Bank of Liberia, the BCEAO and Central Bank of Gambia. The Cash Reserve Ratio in Liberia, Cote divoire and Gambia
represents a mandatory 15%, 5% and 15% (December 2013: 22%, 5% and 15% ) of local deposit which should be held with
their respective Central Banks as a regulatory requirement. In the same period, GTBank Kenya, Rwanda and Uganda had
restricted deposits of N970,247,000 2013: N797,759,000). The Cash Reserve Ratio in GTBank Kenya, Rwanda and Uganda
represents a mandatory 5.25%, 5% and 8% December 2013: 5.25%, 5% and 8%.)
(b) Movement in impairment of other assets:
Group Group Parent Parent
In thousands of Nigerian Naira Dec-2014 Dec-2013 Dec-2014 Dec-2013
Opening Balance 305,556 981,617 305,556 981,617
Write off - (676,061) - (676,061)
Closing Balance 305,556 305,556 305,556 305,556
Impairment of assets relates to Prepayments
282
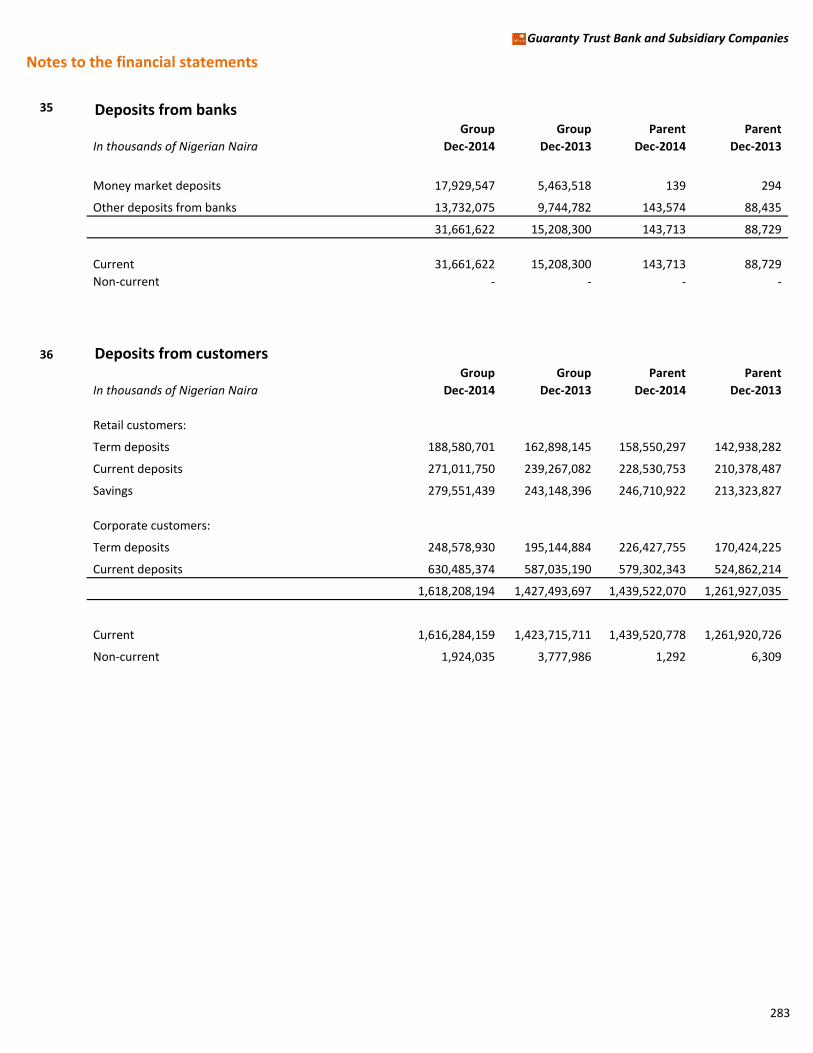
Notes to the financial statements
Guaranty Trust Bank and Subsidiary Companies
35 Deposits from banksGroup Group Parent Parent
In thousands of Nigerian Naira Dec-2014 Dec-2013 Dec-2014 Dec-2013
Money market deposits 17,929,547 5,463,518 139 294
Other deposits from banks 13,732,075 9,744,782 143,574 88,435
31,661,622 15,208,300 143,713 88,729
Current 31,661,622 15,208,300 143,713 88,729
Non-current - - - -
36 Deposits from customersGroup Group Parent Parent
In thousands of Nigerian Naira Dec-2014 Dec-2013 Dec-2014 Dec-2013
Retail customers:
Term deposits 188,580,701 162,898,145 158,550,297 142,938,282
Current deposits 271,011,750 239,267,082 228,530,753 210,378,487
Savings 279,551,439 243,148,396 246,710,922 213,323,827
Corporate customers:
Term deposits 248,578,930 195,144,884 226,427,755 170,424,225
Current deposits 630,485,374 587,035,190 579,302,343 524,862,214
1,618,208,194 1,427,493,697 1,439,522,070 1,261,927,035
Current 1,616,284,159 1,423,715,711 1,439,520,778 1,261,920,726
Non-current 1,924,035 3,777,986 1,292 6,309
283
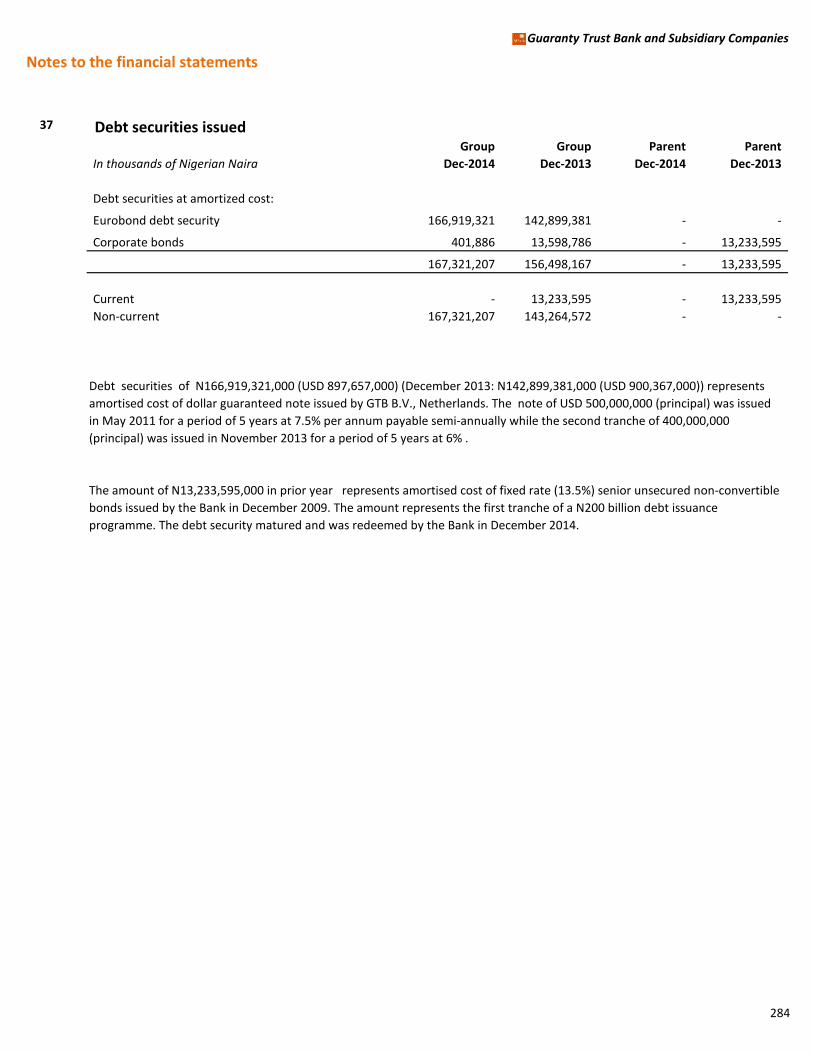
Notes to the financial statements
Guaranty Trust Bank and Subsidiary Companies
37 Debt securities issuedGroup Group Parent Parent
In thousands of Nigerian Naira Dec-2014 Dec-2013 Dec-2014 Dec-2013
Debt securities at amortized cost:
Eurobond debt security 166,919,321 142,899,381 - -
Corporate bonds 401,886 13,598,786 - 13,233,595
167,321,207 156,498,167 - 13,233,595
Current - 13,233,595 - 13,233,595
Non-current 167,321,207 143,264,572 - -
Debt securities of N166,919,321,000 (USD 897,657,000) (December 2013: N142,899,381,000 (USD 900,367,000)) represents
amortised cost of dollar guaranteed note issued by GTB B.V., Netherlands. The note of USD 500,000,000 (principal) was issued
in May 2011 for a period of 5 years at 7.5% per annum payable semi-annually while the second tranche of 400,000,000
(principal) was issued in November 2013 for a period of 5 years at 6% .
The amount of N13,233,595,000 in prior year represents amortised cost of fixed rate (13.5%) senior unsecured non-convertible
bonds issued by the Bank in December 2009. The amount represents the first tranche of a N200 billion debt issuance
programme. The debt security matured and was redeemed by the Bank in December 2014.
284
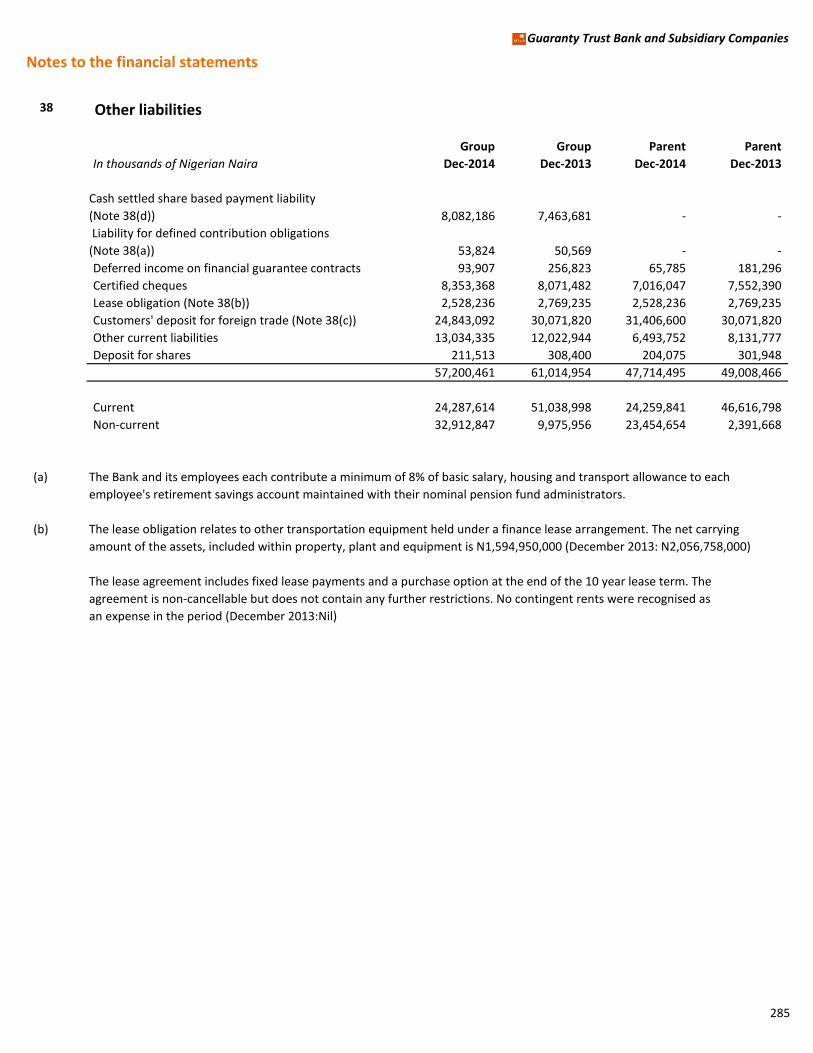
Notes to the financial statements
Guaranty Trust Bank and Subsidiary Companies
38 Other liabilities
Group Group Parent Parent
In thousands of Nigerian Naira Dec-2014 Dec-2013 Dec-2014 Dec-2013
Cash settled share based payment liability
(Note 38(d)) 8,082,186 7,463,681 - -
Liability for defined contribution obligations
(Note 38(a)) 53,824 50,569 - -
Deferred income on financial guarantee contracts 93,907 256,823 65,785 181,296
Certified cheques 8,353,368 8,071,482 7,016,047 7,552,390
Lease obligation (Note 38(b)) 2,528,236 2,769,235 2,528,236 2,769,235
Customers' deposit for foreign trade (Note 38(c)) 24,843,092 30,071,820 31,406,600 30,071,820
Other current liabilities 13,034,335 12,022,944 6,493,752 8,131,777
Deposit for shares 211,513 308,400 204,075 301,948
57,200,461 61,014,954 47,714,495 49,008,466
Current 24,287,614 51,038,998 24,259,841 46,616,798
Non-current 32,912,847 9,975,956 23,454,654 2,391,668
(a) The Bank and its employees each contribute a minimum of 8% of basic salary, housing and transport allowance to each
employee's retirement savings account maintained with their nominal pension fund administrators.
(b) The lease obligation relates to other transportation equipment held under a finance lease arrangement. The net carrying
amount of the assets, included within property, plant and equipment is N1,594,950,000 (December 2013: N2,056,758,000)
The lease agreement includes fixed lease payments and a purchase option at the end of the 10 year lease term. The
agreement is non-cancellable but does not contain any further restrictions. No contingent rents were recognised as
an expense in the period (December 2013:Nil)
285
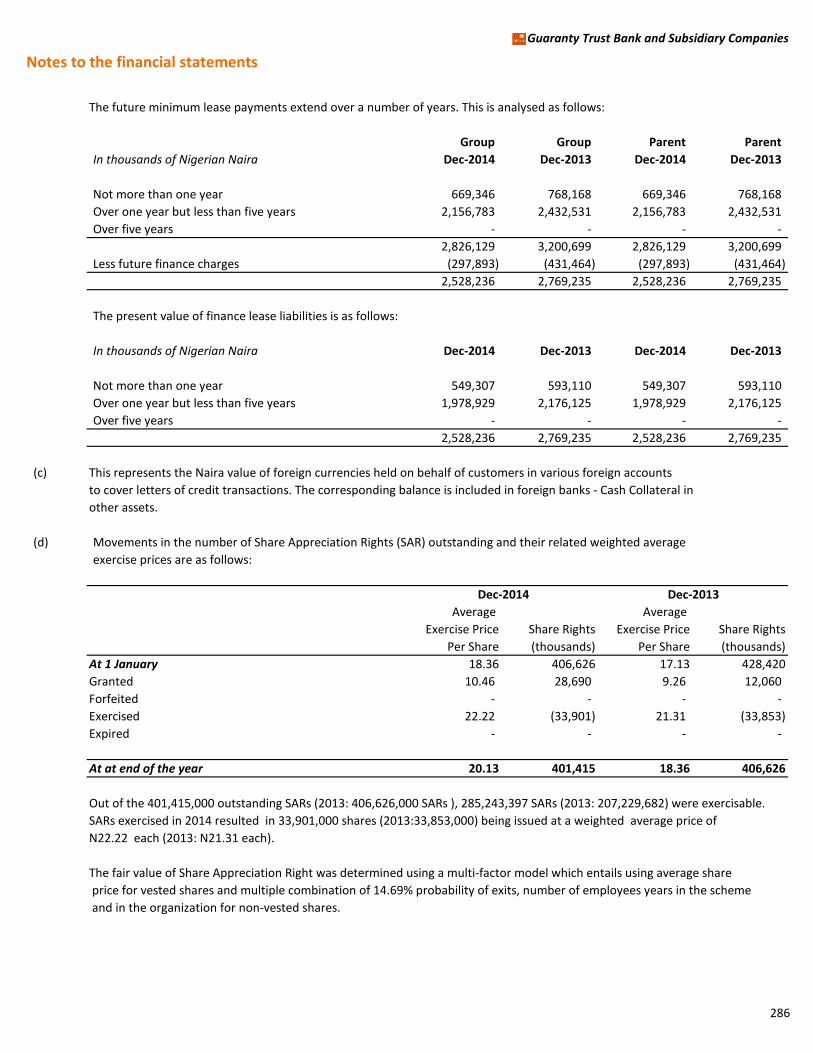
Notes to the financial statements
Guaranty Trust Bank and Subsidiary Companies
The future minimum lease payments extend over a number of years. This is analysed as follows:
Group Group Parent Parent
In thousands of Nigerian Naira Dec-2014 Dec-2013 Dec-2014 Dec-2013
Not more than one year 669,346 768,168 669,346 768,168
Over one year but less than five years 2,156,783 2,432,531 2,156,783 2,432,531
Over five years - - - -
2,826,129 3,200,699 2,826,129 3,200,699
Less future finance charges (297,893) (431,464) (297,893) (431,464)
2,528,236 2,769,235 2,528,236 2,769,235
The present value of finance lease liabilities is as follows:
In thousands of Nigerian Naira Dec-2014 Dec-2013 Dec-2014 Dec-2013
Not more than one year 549,307 593,110 549,307 593,110
Over one year but less than five years 1,978,929 2,176,125 1,978,929 2,176,125
Over five years - - - -
2,528,236 2,769,235 2,528,236 2,769,235
(c) This represents the Naira value of foreign currencies held on behalf of customers in various foreign accounts
to cover letters of credit transactions. The corresponding balance is included in foreign banks - Cash Collateral in
other assets.
(d) Movements in the number of Share Appreciation Rights (SAR) outstanding and their related weighted average
exercise prices are as follows:
Average Average
Exercise Price Share Rights Exercise Price Share Rights
Per Share (thousands) Per Share (thousands)
At 1 January 18.36 406,626 17.13 428,420
Granted 10.46 28,690 9.26 12,060
Forfeited - - - -
Exercised 22.22 (33,901) 21.31 (33,853)
Expired - - - -
At at end of the year 20.13 401,415 18.36 406,626
Out of the 401,415,000 outstanding SARs (2013: 406,626,000 SARs ), 285,243,397 SARs (2013: 207,229,682) were exercisable.
SARs exercised in 2014 resulted in 33,901,000 shares (2013:33,853,000) being issued at a weighted average price of
N22.22 each (2013: N21.31 each).
The fair value of Share Appreciation Right was determined using a multi-factor model which entails using average share
price for vested shares and multiple combination of 14.69% probability of exits, number of employees years in the scheme
and in the organization for non-vested shares.
Dec-2014 Dec-2013
286
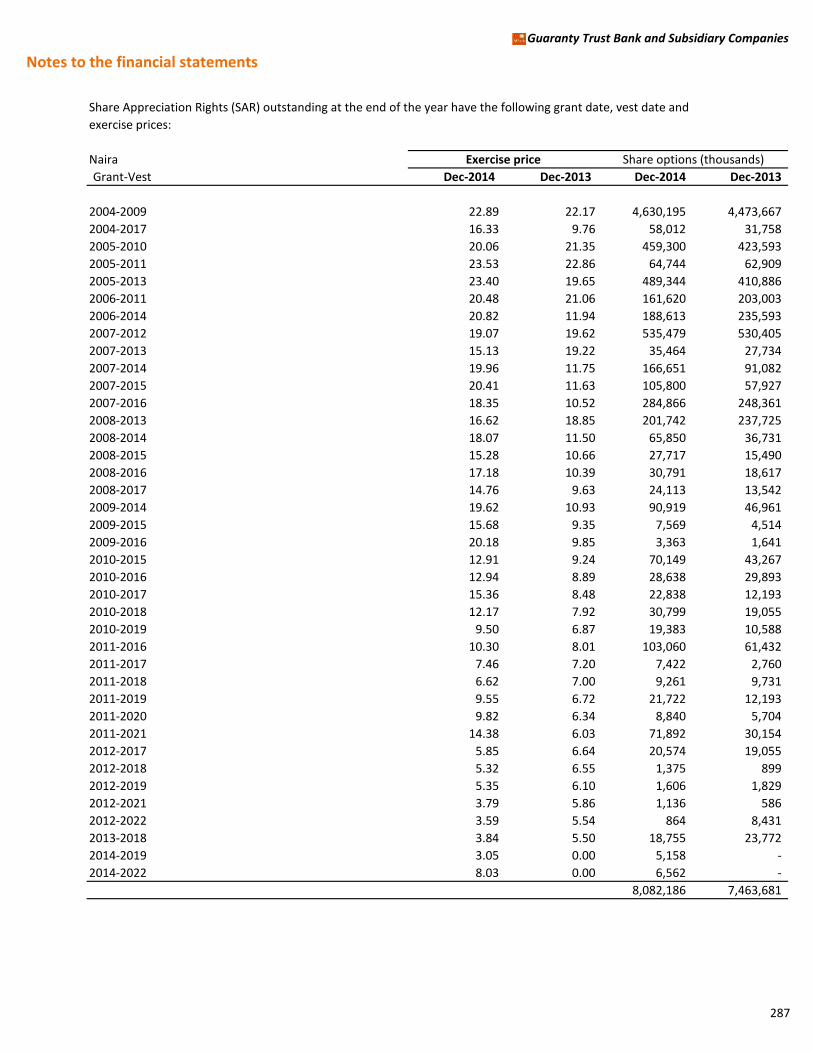
Notes to the financial statements
Guaranty Trust Bank and Subsidiary Companies
Share Appreciation Rights (SAR) outstanding at the end of the year have the following grant date, vest date and
exercise prices:
Naira
Grant-Vest Dec-2014 Dec-2013 Dec-2014 Dec-2013
2004-2009 22.89 22.17 4,630,195 4,473,667
2004-2017 16.33 9.76 58,012 31,758
2005-2010 20.06 21.35 459,300 423,593
2005-2011 23.53 22.86 64,744 62,909
2005-2013 23.40 19.65 489,344 410,886
2006-2011 20.48 21.06 161,620 203,003
2006-2014 20.82 11.94 188,613 235,593
2007-2012 19.07 19.62 535,479 530,405
2007-2013 15.13 19.22 35,464 27,734
2007-2014 19.96 11.75 166,651 91,082
2007-2015 20.41 11.63 105,800 57,927
2007-2016 18.35 10.52 284,866 248,361
2008-2013 16.62 18.85 201,742 237,725
2008-2014 18.07 11.50 65,850 36,731
2008-2015 15.28 10.66 27,717 15,490
2008-2016 17.18 10.39 30,791 18,617
2008-2017 14.76 9.63 24,113 13,542
2009-2014 19.62 10.93 90,919 46,961
2009-2015 15.68 9.35 7,569 4,514
2009-2016 20.18 9.85 3,363 1,641
2010-2015 12.91 9.24 70,149 43,267
2010-2016 12.94 8.89 28,638 29,893
2010-2017 15.36 8.48 22,838 12,193
2010-2018 12.17 7.92 30,799 19,055
2010-2019 9.50 6.87 19,383 10,588
2011-2016 10.30 8.01 103,060 61,432
2011-2017 7.46 7.20 7,422 2,760
2011-2018 6.62 7.00 9,261 9,731
2011-2019 9.55 6.72 21,722 12,193
2011-2020 9.82 6.34 8,840 5,704
2011-2021 14.38 6.03 71,892 30,154
2012-2017 5.85 6.64 20,574 19,055
2012-2018 5.32 6.55 1,375 899
2012-2019 5.35 6.10 1,606 1,829
2012-2021 3.79 5.86 1,136 586
2012-2022 3.59 5.54 864 8,431
2013-2018 3.84 5.50 18,755 23,772
2014-2019 3.05 0.00 5,158 -
2014-2022 8.03 0.00 6,562 -
8,082,186 7,463,681
Exercise price Share options (thousands)
287
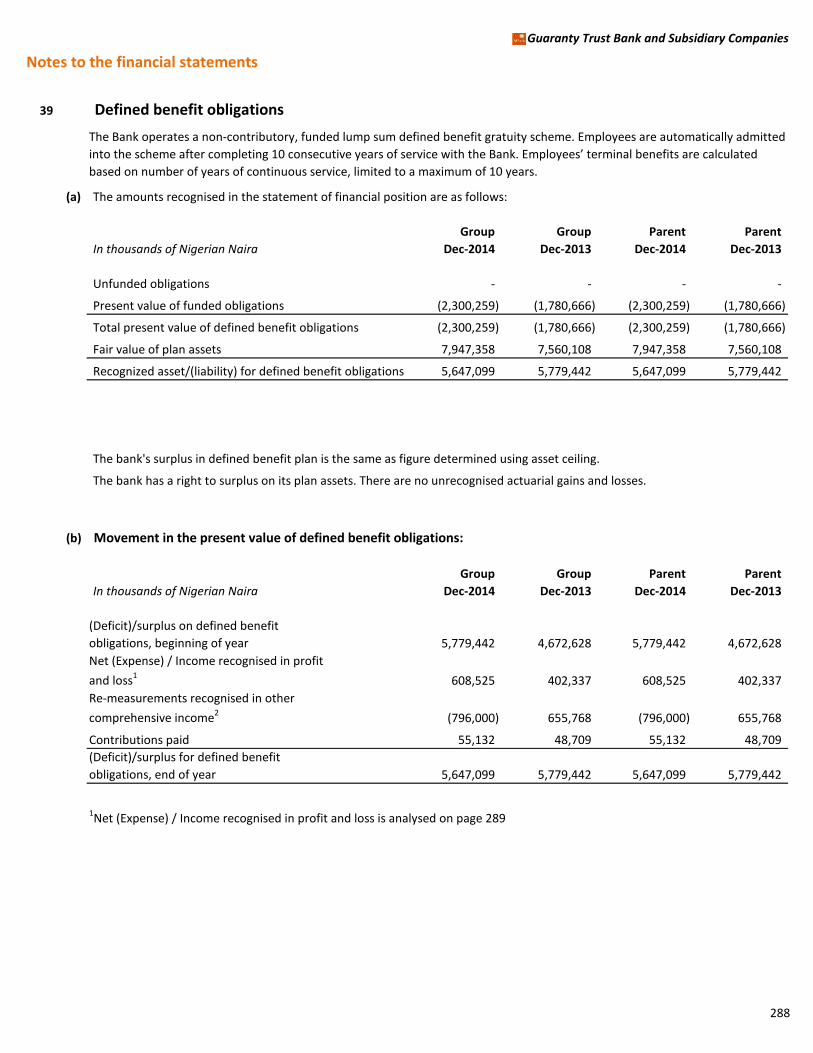
Notes to the financial statements
Guaranty Trust Bank and Subsidiary Companies
39 Defined benefit obligations
The Bank operates a non-contributory, funded lump sum defined benefit gratuity scheme. Employees are automatically admitted
into the scheme after completing 10 consecutive years of service with the Bank. Employees’ terminal benefits are calculated
based on number of years of continuous service, limited to a maximum of 10 years.
(a) The amounts recognised in the statement of financial position are as follows:
Group Group Parent Parent
In thousands of Nigerian Naira Dec-2014 Dec-2013 Dec-2014 Dec-2013
Unfunded obligations - - - -
Present value of funded obligations (2,300,259) (1,780,666) (2,300,259) (1,780,666)
Total present value of defined benefit obligations (2,300,259) (1,780,666) (2,300,259) (1,780,666)
Fair value of plan assets 7,947,358 7,560,108 7,947,358 7,560,108
Recognized asset/(liability) for defined benefit obligations 5,647,099 5,779,442 5,647,099 5,779,442
The bank's surplus in defined benefit plan is the same as figure determined using asset ceiling.
The bank has a right to surplus on its plan assets. There are no unrecognised actuarial gains and losses.
(b) Movement in the present value of defined benefit obligations:
Group Group Parent Parent
In thousands of Nigerian Naira Dec-2014 Dec-2013 Dec-2014 Dec-2013
(Deficit)/surplus on defined benefit
obligations, beginning of year 5,779,442 4,672,628 5,779,442 4,672,628
Net (Expense) / Income recognised in profit
and loss1608,525 402,337 608,525 402,337
Re-measurements recognised in other
comprehensive income2(796,000) 655,768 (796,000) 655,768
Contributions paid 55,132 48,709 55,132 48,709
(Deficit)/surplus for defined benefit
obligations, end of year 5,647,099 5,779,442 5,647,099 5,779,442
1Net (Expense) / Income recognised in profit and loss is analysed on page 289
288
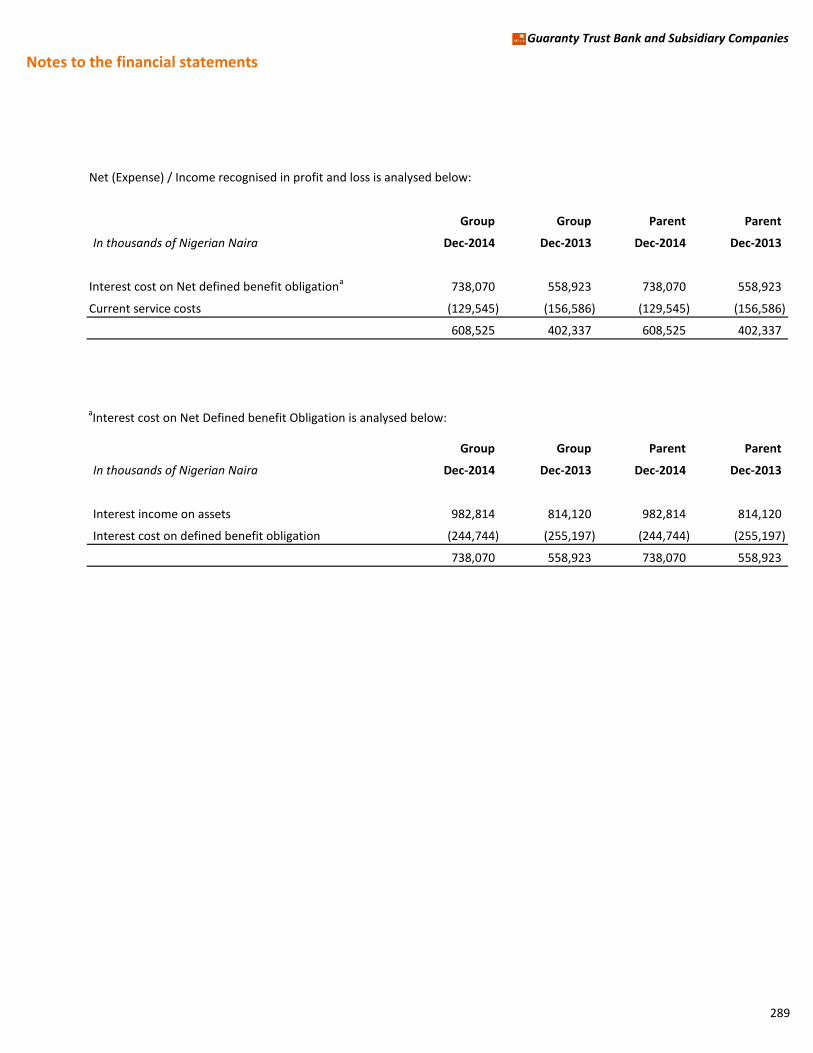
Notes to the financial statements
Guaranty Trust Bank and Subsidiary Companies
Net (Expense) / Income recognised in profit and loss is analysed below:
Group Group Parent Parent
In thousands of Nigerian Naira Dec-2014 Dec-2013 Dec-2014 Dec-2013
Interest cost on Net defined benefit obligationa738,070 558,923 738,070 558,923
Current service costs (129,545) (156,586) (129,545) (156,586)
608,525 402,337 608,525 402,337
aInterest cost on Net Defined benefit Obligation is analysed below:
Group Group Parent Parent
In thousands of Nigerian Naira Dec-2014 Dec-2013 Dec-2014 Dec-2013
Interest income on assets 982,814 814,120 982,814 814,120
Interest cost on defined benefit obligation (244,744) (255,197) (244,744) (255,197)
738,070 558,923 738,070 558,923
289
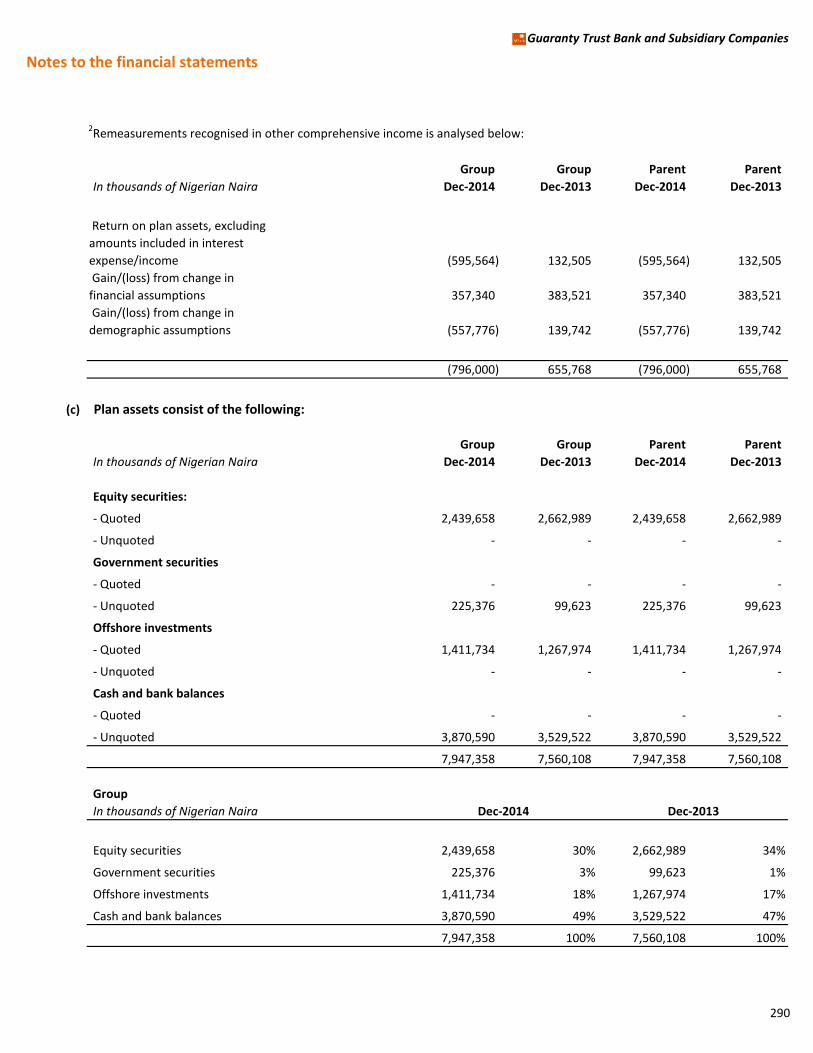
Notes to the financial statements
Guaranty Trust Bank and Subsidiary Companies
2Remeasurements recognised in other comprehensive income is analysed below:
Group Group Parent Parent
In thousands of Nigerian Naira Dec-2014 Dec-2013 Dec-2014 Dec-2013
Return on plan assets, excluding
amounts included in interest
expense/income (595,564) 132,505 (595,564) 132,505
Gain/(loss) from change in
financial assumptions 357,340 383,521 357,340 383,521
Gain/(loss) from change in
demographic assumptions (557,776) 139,742 (557,776) 139,742
(796,000) 655,768 (796,000) 655,768
(c) Plan assets consist of the following:
Group Group Parent Parent
In thousands of Nigerian Naira Dec-2014 Dec-2013 Dec-2014 Dec-2013
Equity securities:
- Quoted 2,439,658 2,662,989 2,439,658 2,662,989
- Unquoted - - - -
Government securities
- Quoted - - - -
- Unquoted 225,376 99,623 225,376 99,623
Offshore investments
- Quoted 1,411,734 1,267,974 1,411,734 1,267,974
- Unquoted - - - -
Cash and bank balances
- Quoted - - - -
- Unquoted 3,870,590 3,529,522 3,870,590 3,529,522
7,947,358 7,560,108 7,947,358 7,560,108
Group
In thousands of Nigerian Naira
Equity securities 2,439,658 30% 2,662,989 34%
Government securities 225,376 3% 99,623 1%
Offshore investments 1,411,734 18% 1,267,974 17%
Cash and bank balances 3,870,590 49% 3,529,522 47%
7,947,358 100% 7,560,108 100%
Dec-2014 Dec-2013
290
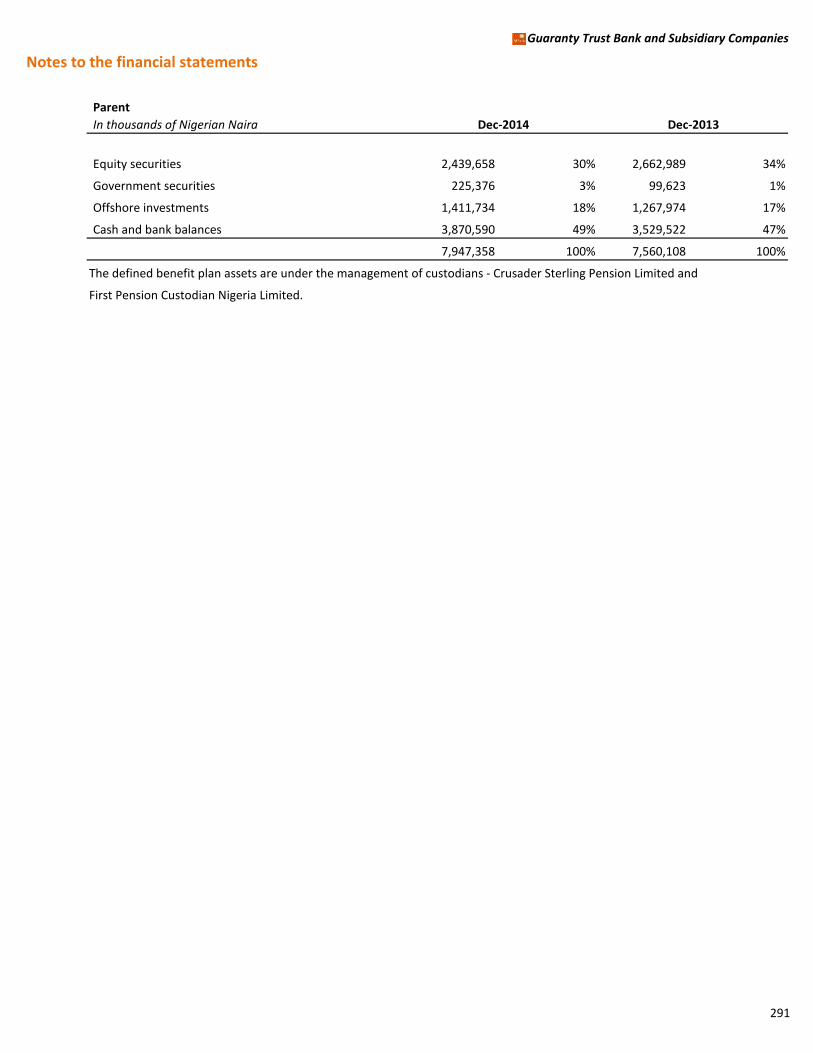
Notes to the financial statements
Guaranty Trust Bank and Subsidiary Companies
Parent
In thousands of Nigerian Naira
Equity securities 2,439,658 30% 2,662,989 34%
Government securities 225,376 3% 99,623 1%
Offshore investments 1,411,734 18% 1,267,974 17%
Cash and bank balances 3,870,590 49% 3,529,522 47%
7,947,358 100% 7,560,108 100%
The defined benefit plan assets are under the management of custodians - Crusader Sterling Pension Limited and
First Pension Custodian Nigeria Limited.
Dec-2014 Dec-2013
291
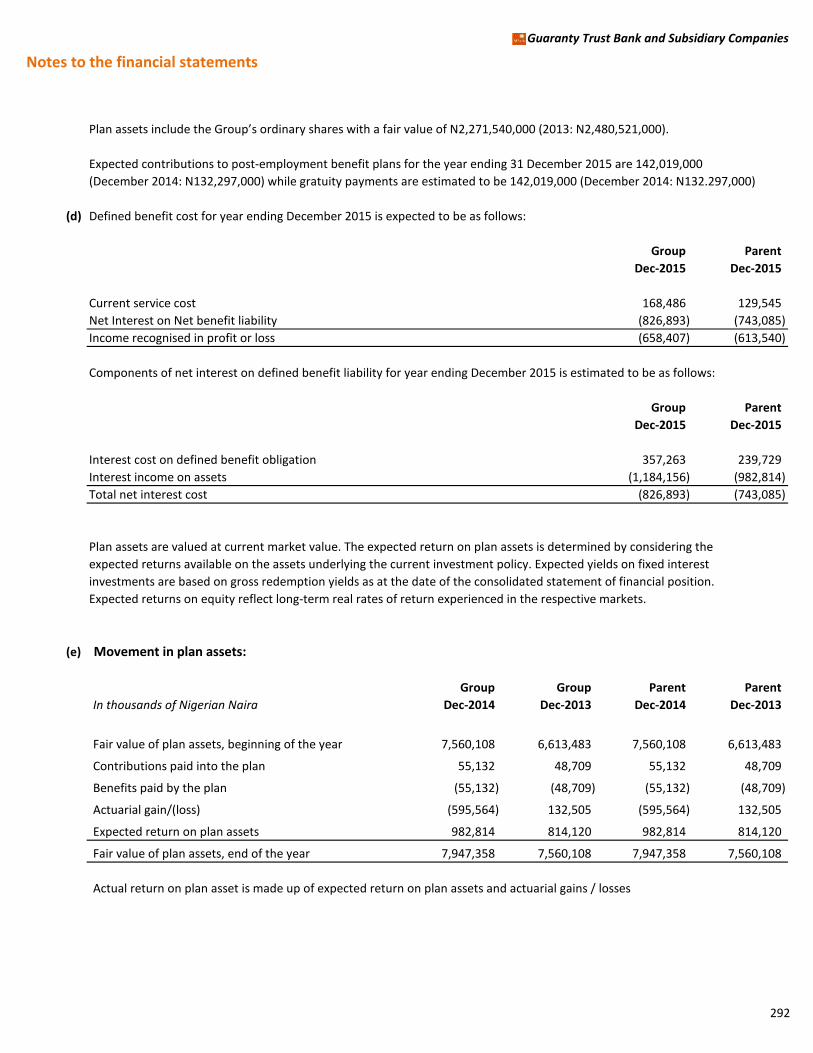
Notes to the financial statements
Guaranty Trust Bank and Subsidiary Companies
Plan assets include the Group’s ordinary shares with a fair value of N2,271,540,000 (2013: N2,480,521,000).
Expected contributions to post-employment benefit plans for the year ending 31 December 2015 are 142,019,000
(December 2014: N132,297,000) while gratuity payments are estimated to be 142,019,000 (December 2014: N132.297,000)
(d) Defined benefit cost for year ending December 2015 is expected to be as follows:
Group Parent
Dec-2015 Dec-2015
Current service cost 168,486 129,545
Net Interest on Net benefit liability (826,893) (743,085)
Income recognised in profit or loss (658,407) (613,540)
Components of net interest on defined benefit liability for year ending December 2015 is estimated to be as follows:
Group Parent
Dec-2015 Dec-2015
Interest cost on defined benefit obligation 357,263 239,729
Interest income on assets (1,184,156) (982,814)
Total net interest cost (826,893) (743,085)
Plan assets are valued at current market value. The expected return on plan assets is determined by considering the
expected returns available on the assets underlying the current investment policy. Expected yields on fixed interest
investments are based on gross redemption yields as at the date of the consolidated statement of financial position.
Expected returns on equity reflect long-term real rates of return experienced in the respective markets.
(e) Movement in plan assets:
Group Group Parent Parent
In thousands of Nigerian Naira Dec-2014 Dec-2013 Dec-2014 Dec-2013
Fair value of plan assets, beginning of the year 7,560,108 6,613,483 7,560,108 6,613,483
Contributions paid into the plan 55,132 48,709 55,132 48,709
Benefits paid by the plan (55,132) (48,709) (55,132) (48,709)
Actuarial gain/(loss) (595,564) 132,505 (595,564) 132,505
Expected return on plan assets 982,814 814,120 982,814 814,120
Fair value of plan assets, end of the year 7,947,358 7,560,108 7,947,358 7,560,108
Actual return on plan asset is made up of expected return on plan assets and actuarial gains / losses
292
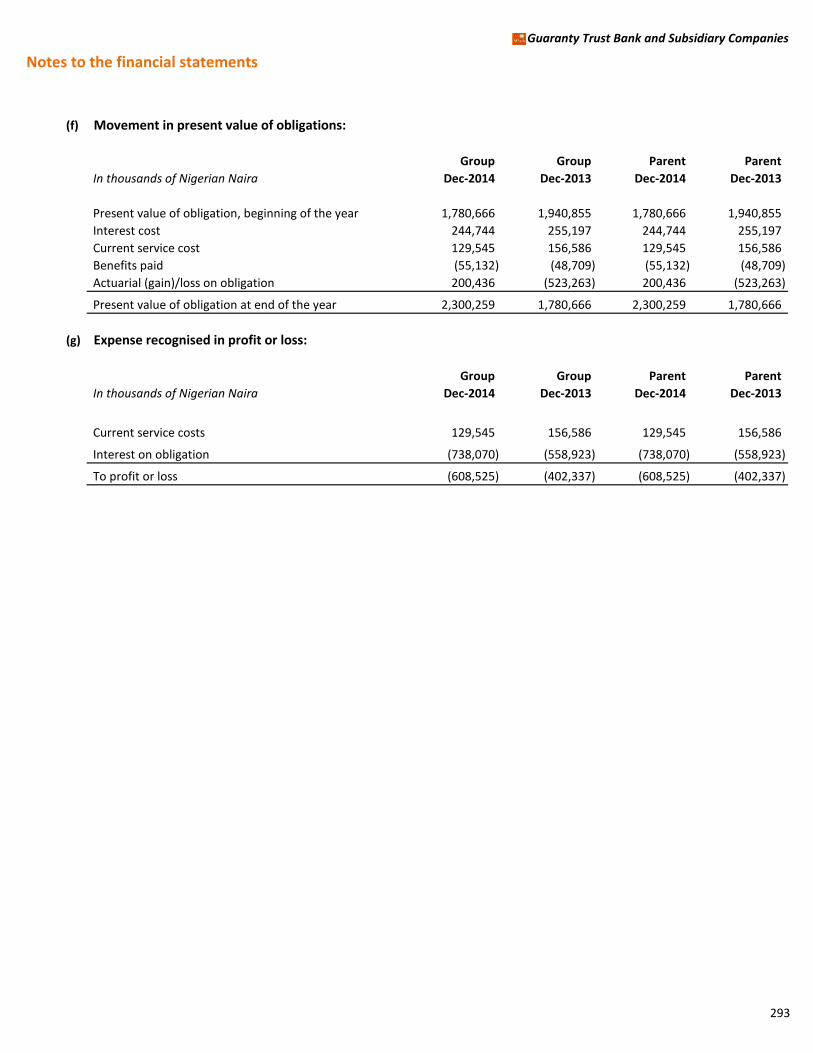
Notes to the financial statements
Guaranty Trust Bank and Subsidiary Companies
(f) Movement in present value of obligations:
Group Group Parent Parent
In thousands of Nigerian Naira Dec-2014 Dec-2013 Dec-2014 Dec-2013
Present value of obligation, beginning of the year 1,780,666 1,940,855 1,780,666 1,940,855
Interest cost 244,744 255,197 244,744 255,197
Current service cost 129,545 156,586 129,545 156,586
Benefits paid (55,132) (48,709) (55,132) (48,709)
Actuarial (gain)/loss on obligation 200,436 (523,263) 200,436 (523,263)
Present value of obligation at end of the year 2,300,259 1,780,666 2,300,259 1,780,666
(g) Expense recognised in profit or loss:
Group Group Parent Parent
In thousands of Nigerian Naira Dec-2014 Dec-2013 Dec-2014 Dec-2013
Current service costs 129,545 156,586 129,545 156,586
Interest on obligation (738,070) (558,923) (738,070) (558,923)
To profit or loss (608,525) (402,337) (608,525) (402,337)
293

Notes to the financial statements
Guaranty Trust Bank and Subsidiary Companies
(h) Actuarial assumptionsPrincipal actuarial assumptions at the reporting date (expressed as weighted averages):
2014 2013
Discount rate 14.90% 13.00%
Salary increase rate 10% 10%
Inflation 8% 10%
Retirement age for both male and female 60 years 60 years
Withdrawal Rate: 18 – 29 4.5% 4.5%
Withdrawal Rate: 30 – 44 6.0% 6.0%
Withdrawal Rate: 45 – 50 5.0% 5.0%
Withdrawal Rate: 51 4.5% 4.5%
Withdrawal Rate: 52 4.0% 4.0%
Withdrawal Rate: 53 3.5% 3.5%
Withdrawal Rate: 54 3.0% 3.0%
Withdrawal Rate: 55 2.5% 2.5%
Withdrawal Rate: 56 2.0% 2.0%
Withdrawal Rate: 57 1.5% 1.5%
Withdrawal Rate: 58 1.0% 1.0%
Withdrawal Rate: 59 0.5% 0.5%
Withdrawal Rate: 60 100.0% 100.0%
Assumptions regarding future mortality before retirement are based on A49/52 ultimate table published by the
Institute of Actuaries of United Kingdom.
The overall expected long-term rate of return on assets is 14%. The expected long-term rate of return is based
on the portfolio as a whole and not on the sum of the returns on individual asset categories. The return is based
entirely on current market yields on Nigerian Government Bonds. The component of the rate of remuneration
increase based on seniority and promotion is an average of 2% per annum. The inflation component has been
worked out at 10% per annum.
For members in active service as at the valuation date, the projected unit credit method of valuation as required
under the IFRS has been adopted.
(i) Reasonably possible changes at the reporting date of discount rate, salary increase rate and mortality rate
would have affected the defined benefit obligation by the amounts shown below:
Group Dec-2014
In thousands of Nigerian Naira except percentages Impact on defined benefit obligation
Change in Defined benefit obligation
assumption Increase Decrease
Discount rate 1.00% (2,141,016) 2,478,872
Salary increase rate 1.00% 2,489,285 (2,129,719)
Mortality rate 1 year 2,303,568 (2,297,239)
294
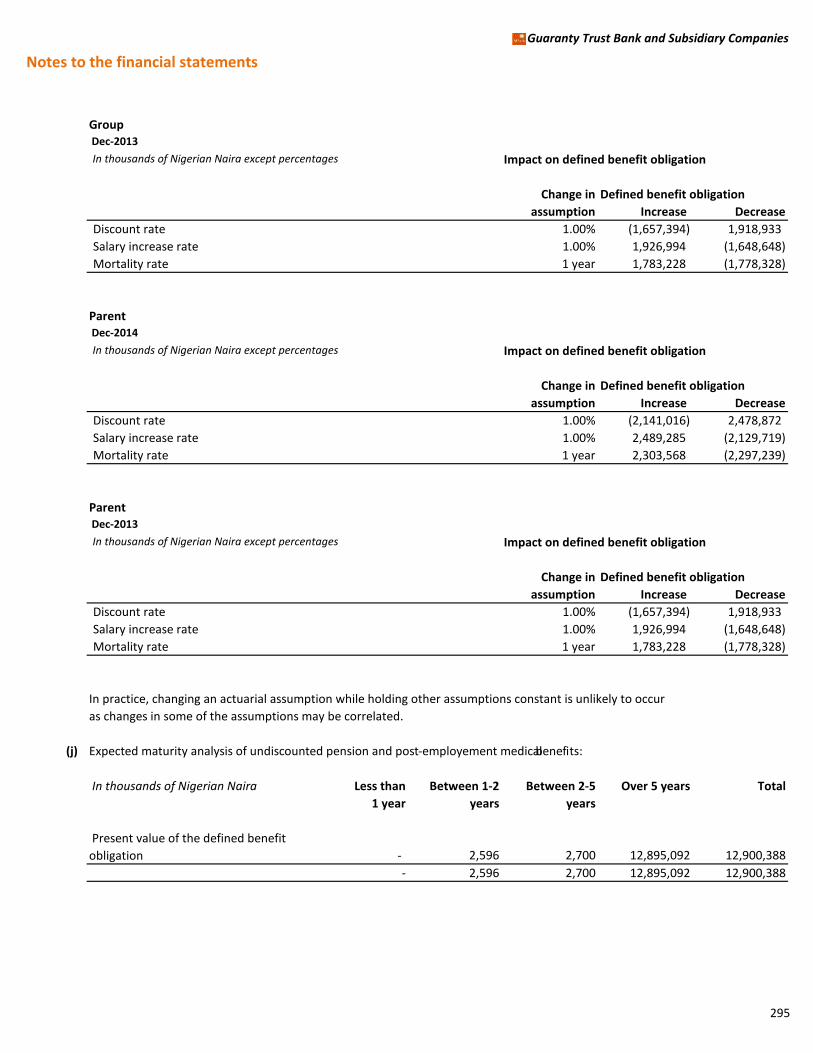
Notes to the financial statements
Guaranty Trust Bank and Subsidiary Companies
Group Dec-2013
In thousands of Nigerian Naira except percentages Impact on defined benefit obligation
Change in Defined benefit obligation
assumption Increase Decrease
Discount rate 1.00% (1,657,394) 1,918,933
Salary increase rate 1.00% 1,926,994 (1,648,648)
Mortality rate 1 year 1,783,228 (1,778,328)
Parent Dec-2014
In thousands of Nigerian Naira except percentages Impact on defined benefit obligation
Change in Defined benefit obligation
assumption Increase Decrease
Discount rate 1.00% (2,141,016) 2,478,872
Salary increase rate 1.00% 2,489,285 (2,129,719)
Mortality rate 1 year 2,303,568 (2,297,239)
Parent Dec-2013
In thousands of Nigerian Naira except percentages Impact on defined benefit obligation
Change in Defined benefit obligation
assumption Increase Decrease
Discount rate 1.00% (1,657,394) 1,918,933
Salary increase rate 1.00% 1,926,994 (1,648,648)
Mortality rate 1 year 1,783,228 (1,778,328)
In practice, changing an actuarial assumption while holding other assumptions constant is unlikely to occur
as changes in some of the assumptions may be correlated.
(j) Expected maturity analysis of undiscounted pension and post-employement medicalbenefits:
In thousands of Nigerian Naira Less than
1 year
Between 1-2
years
Between 2-5
years
Over 5 years Total
Present value of the defined benefit
obligation - 2,596 2,700 12,895,092 12,900,388
- 2,596 2,700 12,895,092 12,900,388
295
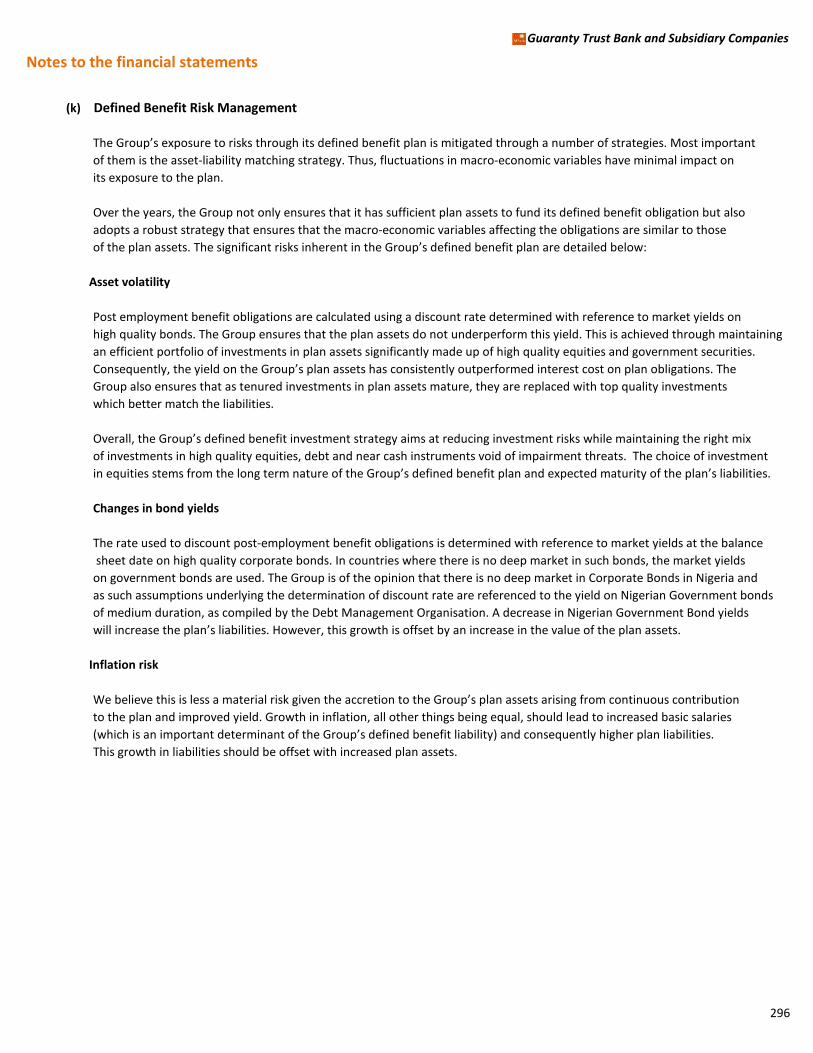
Notes to the financial statements
Guaranty Trust Bank and Subsidiary Companies
(k) Defined Benefit Risk Management
The Group’s exposure to risks through its defined benefit plan is mitigated through a number of strategies. Most important
of them is the asset-liability matching strategy. Thus, fluctuations in macro-economic variables have minimal impact on
its exposure to the plan.
Over the years, the Group not only ensures that it has sufficient plan assets to fund its defined benefit obligation but also
adopts a robust strategy that ensures that the macro-economic variables affecting the obligations are similar to those
of the plan assets. The significant risks inherent in the Group’s defined benefit plan are detailed below:
Asset volatility
Post employment benefit obligations are calculated using a discount rate determined with reference to market yields on
high quality bonds. The Group ensures that the plan assets do not underperform this yield. This is achieved through maintaining
an efficient portfolio of investments in plan assets significantly made up of high quality equities and government securities.
Consequently, the yield on the Group’s plan assets has consistently outperformed interest cost on plan obligations. The
Group also ensures that as tenured investments in plan assets mature, they are replaced with top quality investments
which better match the liabilities.
Overall, the Group’s defined benefit investment strategy aims at reducing investment risks while maintaining the right mix
of investments in high quality equities, debt and near cash instruments void of impairment threats. The choice of investment
in equities stems from the long term nature of the Group’s defined benefit plan and expected maturity of the plan’s liabilities.
Changes in bond yields
The rate used to discount post-employment benefit obligations is determined with reference to market yields at the balance
sheet date on high quality corporate bonds. In countries where there is no deep market in such bonds, the market yields
on government bonds are used. The Group is of the opinion that there is no deep market in Corporate Bonds in Nigeria and
as such assumptions underlying the determination of discount rate are referenced to the yield on Nigerian Government bonds
of medium duration, as compiled by the Debt Management Organisation. A decrease in Nigerian Government Bond yields
will increase the plan’s liabilities. However, this growth is offset by an increase in the value of the plan assets.
Inflation risk
We believe this is less a material risk given the accretion to the Group’s plan assets arising from continuous contribution
to the plan and improved yield. Growth in inflation, all other things being equal, should lead to increased basic salaries
(which is an important determinant of the Group’s defined benefit liability) and consequently higher plan liabilities.
This growth in liabilities should be offset with increased plan assets.
296
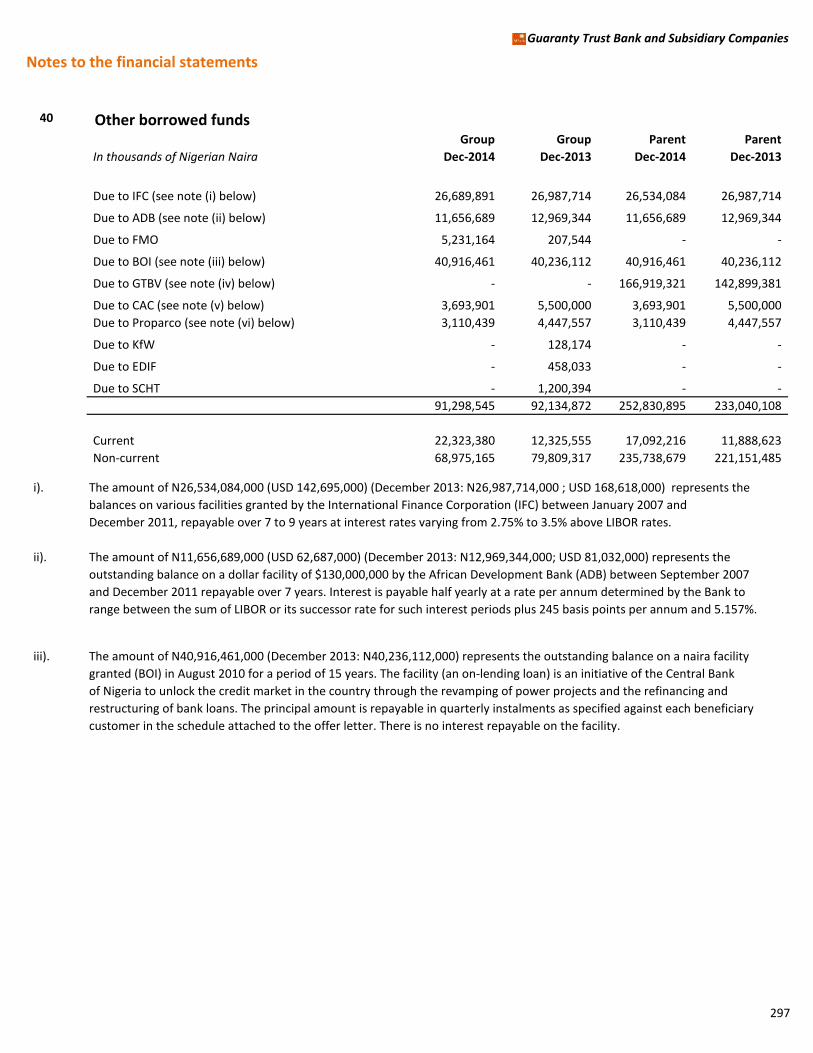
Notes to the financial statements
Guaranty Trust Bank and Subsidiary Companies
40 Other borrowed fundsGroup Group Parent Parent
In thousands of Nigerian Naira Dec-2014 Dec-2013 Dec-2014 Dec-2013
Due to IFC (see note (i) below) 26,689,891 26,987,714 26,534,084 26,987,714
Due to ADB (see note (ii) below) 11,656,689 12,969,344 11,656,689 12,969,344
Due to FMO 5,231,164 207,544 - -
Due to BOI (see note (iii) below) 40,916,461 40,236,112 40,916,461 40,236,112
Due to GTBV (see note (iv) below) - - 166,919,321 142,899,381
Due to CAC (see note (v) below) 3,693,901 5,500,000 3,693,901 5,500,000
Due to Proparco (see note (vi) below) 3,110,439 4,447,557 3,110,439 4,447,557
Due to KfW - 128,174 - -
Due to EDIF - 458,033 - -
Due to SCHT - 1,200,394 - -
91,298,545 92,134,872 252,830,895 233,040,108
Current 22,323,380 12,325,555 17,092,216 11,888,623
Non-current 68,975,165 79,809,317 235,738,679 221,151,485
i). The amount of N26,534,084,000 (USD 142,695,000) (December 2013: N26,987,714,000 ; USD 168,618,000) represents the
balances on various facilities granted by the International Finance Corporation (IFC) between January 2007 and
December 2011, repayable over 7 to 9 years at interest rates varying from 2.75% to 3.5% above LIBOR rates.
ii). The amount of N11,656,689,000 (USD 62,687,000) (December 2013: N12,969,344,000; USD 81,032,000) represents the
outstanding balance on a dollar facility of $130,000,000 by the African Development Bank (ADB) between September 2007
and December 2011 repayable over 7 years. Interest is payable half yearly at a rate per annum determined by the Bank to
range between the sum of LIBOR or its successor rate for such interest periods plus 245 basis points per annum and 5.157%.
iii). The amount of N40,916,461,000 (December 2013: N40,236,112,000) represents the outstanding balance on a naira facility
granted (BOI) in August 2010 for a period of 15 years. The facility (an on-lending loan) is an initiative of the Central Bank
of Nigeria to unlock the credit market in the country through the revamping of power projects and the refinancing and
restructuring of bank loans. The principal amount is repayable in quarterly instalments as specified against each beneficiary
customer in the schedule attached to the offer letter. There is no interest repayable on the facility.
297

Notes to the financial statements
Guaranty Trust Bank and Subsidiary Companies
iv). The amount of N166,919,321,000 (USD 897,657,000) (December 2013: N142,899,381,000; USD892,828,000) represents amortised
cost of dollar guaranteed notes issued by GTB Finance B.V., Netherlands. It represents the 2nd tranche of $500,000,000 issued
in May 2011 for a period of 5 years with the principal amount repayable at the end of the tenor while interest on the notes
is payable semi-annually at 7.5% per annum and . $400,000,000 (principal) was issued in November 2013 for a period of
5 years at 6% .
v). The amount of N3,693,901,000 (December 2013: N5,500,000,000) represents the outstanding balance on a facility
granted by the Debt Management Office in tranches between April and August 2010 for 7 years. It is an initiative of
Central Bank of Nigeria and Federal Ministry of Agriculture and Water resources aimed at the growth and development
of commercial agriculture enterprise in Nigeria. The funds are made available to participating banks at zero cost,
for on lending to commercial agriculture enterprise at a maximum rate of 9.00% p.a.
vi). The amount of N3,110,439,000 (USD 16,727,000 ) (December 2013: N4,447,557,000; USD27,788,000)represents the outstanding
balance on a dollar term loan facility granted by Proparco in December 2011 for a period of 5 years. Interest is payable half
yearly at 4.46% over the tenure of the facility.
41 Capital and reservesShare capital
benefits at meetings of the Group
Group Group Parent Parent
In thousands of Nigerian Naira Dec-2014 Dec-2013 Dec-2014 Dec-2013
(a) Authorised -
50,000,000,000 ordinary shares of 50k each
(31 December 2013: 50,000,000,000 of 50k each) 25,000,000 25,000,000 25,000,000 25,000,000
Group Group Parent Parent
In thousands of Nigerian Naira Dec-2014 Dec-2013 Dec-2014 Dec-2013
(b) Issued and fully paid:
29,431,179,224 ordinary shares of 50 kobo
each (31 December 2013: 29,431,179,224
ordinary shares of 50k each) 14,715,590 14,715,590 14,715,590 14,715,590
The holders of ordinary shares are entitled to receive dividends as declared from time to time and are entitled
to vote at meetings of the Group. All ordinary shares and GDR shares rank pari-passu with the same rights and
298

Notes to the financial statements
Guaranty Trust Bank and Subsidiary Companies
Group Group Parent Parent
In thousands of Nigerian Naira Dec-2014 Dec-2013 Dec-2014 Dec-2013
26,269,336,687 ordinary shares of 50k each
(31 December 2013: 26,046,264,387) 13,134,669 13,023,133 13,134,669 13,023,133
3,161,842,537 ordinary shares (GDR) of 50k
each (31 December 2013: 3,384,914,837) 1,580,921 1,692,457 1,580,921 1,692,457
14,715,590 14,715,590 14,715,590 14,715,590
The movement on the issued and fully paid-up share capital account during the year was as follows:
Group Group Parent Parent
In thousands of Nigerian Naira Dec-2014 Dec-2013 Dec-2014 Dec-2013
Balance, beginning of year 14,715,590 14,715,590 14,715,590 14,715,590
Increase in the year - - - -
Bonus shares capitalized - - - -
Balance, end of year 14,715,590 14,715,590 14,715,590 14,715,590
Share capital
Number of
shares
(thousands) Ordinary shares Share premium Treasury shares
At January 2013 29,431,180 14,715,590 123,471,114 (2,046,714)
Proceeds from shares issued - - - -
Bonus capitalised - - - -
(Purchases)/sales of treasury shares - - - -
At 31 December 2013/1 January 2014 29,431,180 14,715,590 123,471,114 (2,046,714)
Bonus capitalised - - - -
Proceeds from shares issued - - - -
(Purchases)/sales of treasury shares - - - (1,940,861)
At 31 December 2014 29,431,180 14,715,590 123,471,114 (3,987,575)
299
Notes to the financial statements
Guaranty Trust Bank and Subsidiary Companies
Share premium
Share premium is the excess paid by shareholders over the nominal value for their shares.
Other regulatory reserves
The other regulatory reserve includes movements in the statutory reserves and the small and medium enterprises equity
investment reserve.
(i) Statutory Reserves: Nigerian banking regulations require the Bank to make an annual appropriation to a statutory reserve.
As stipulated by S.16(1) of the Banks and Other Financial Institution Act of 1991 (amended), an appropriation of 30% of
profit after tax is made if the statutory reserve is less than paid-up share capital and 15% of profit after tax if the statutory
reserve is greater than the paid up share capital. The bank appropriated N28,029,481,000 representing 30% of its Profit after tax
to statutory reserve.
(ii) Small and medium enterprises equity investment reserve (SMEEIS): The SMEEIS reserve is maintained to comply with the
Central Bank of Nigeria (CBN) requirement that all licensed banks set aside a portion of the profit after tax in a fund to
be used to finance equity investment in qualifying small and medium scale enterprises. Under the terms of the
guideline (amended by CBN letter dated 11 July 2006), the contributions will be 10% of profit after tax and shall
continue after the first 5 years but banks’ contributions shall thereafter reduce to 5% of profit after tax. However,
this is no longer mandatory. The small and medium scale industries equity investment scheme reserves are
non-distributable. The bank did not make any appropriation to this reserve during the period.
(iii) Treasury shares
Treasury shares represent the Bank’s shares of 1,240,674,231 units (31 December 2013 : 1,170,674,231 units) held by the
Staff Investment Trust as at 31 December 2014.
(iv) Bonus reserves
Subsequent to the balance sheet date, the Board of Directors has approved the transfer of Nil (2013: Nil)
bonus shares.
(v) Fair value reserve
The fair value reserve includes the net cumulative change in the fair value of available-for-sale investments until the
investment is derecognised or impaired.
(vi) Regulatory risk reserve
The regulatory risk reserves warehouses the difference between the impairment balance on loans and advances as determined
in accordance with the provisions of Prudential guidelines of Central Bank of Nigeria as opposed to the requirement of IAS 39
Incurred loss model. The key component of CBN Prudential Guidelines is the inclusion of 1% General Loan Loss provisioning of
performing loans in the entity impairment figures, this 1% provision amounting to N11,510,805,000 is not required by IAS 39.
The total Parent's balance in regulatory risk reserve is N28,349,056,000
(vii) Retained earnings
Retained earnings are the carried forward recognised income net of expenses plus current period profit attributable to
shareholders.
(viii) Non-controlling interest
The entities accounting for the non-controlling interest balance is shown below:
300
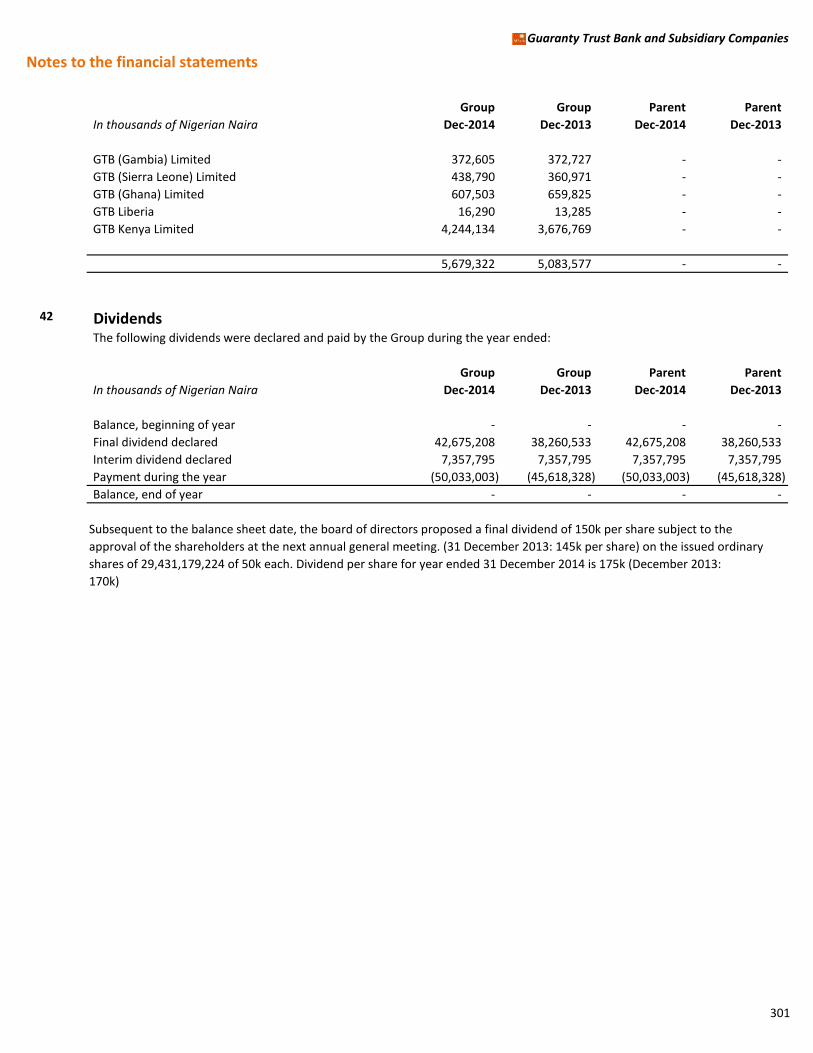
Notes to the financial statements
Guaranty Trust Bank and Subsidiary Companies
Group Group Parent Parent
In thousands of Nigerian Naira Dec-2014 Dec-2013 Dec-2014 Dec-2013
GTB (Gambia) Limited 372,605 372,727 - -
GTB (Sierra Leone) Limited 438,790 360,971 - -
GTB (Ghana) Limited 607,503 659,825 - -
GTB Liberia 16,290 13,285 - -
GTB Kenya Limited 4,244,134 3,676,769 - -
5,679,322 5,083,577 - -
42 Dividends The following dividends were declared and paid by the Group during the year ended:
Group Group Parent Parent
In thousands of Nigerian Naira Dec-2014 Dec-2013 Dec-2014 Dec-2013
Balance, beginning of year - - - -
Final dividend declared 42,675,208 38,260,533 42,675,208 38,260,533
Interim dividend declared 7,357,795 7,357,795 7,357,795 7,357,795
Payment during the year (50,033,003) (45,618,328) (50,033,003) (45,618,328)
Balance, end of year - - - -
Subsequent to the balance sheet date, the board of directors proposed a final dividend of 150k per share subject to the
approval of the shareholders at the next annual general meeting. (31 December 2013: 145k per share) on the issued ordinary
shares of 29,431,179,224 of 50k each. Dividend per share for year ended 31 December 2014 is 175k (December 2013:
170k)
301
NOTES TO THE FINANCIAL STATEMENT Guaranty Trust Bank and Subsidiary Companies
302
43. Leasing
As lessor
The Group acts as lessor under finance leases, providing financing for its customers and leasing assets
for their own use. In addition, assets leased by the Group may be sublet to other parties.
The income from the lease is recognized as interest income on the Group’s income statement,
representing the Group’s return on investment in the capital lease while a receivable is recognized for
the Lease amount outstanding at the reporting period.
As lessee
The Group leases offices, branches and other premises under operating lease arrangements. The
leases have various terms and renewal rights. The lease rentals are paid in advance and recognized on
straight line basis over the lease period. The outstanding balance is accounted for as prepaid lease
rentals. There are no contingent rents payable.
For finance lease agreements in which the group is lessee, details of the resulting commitments have
been included in other liabilities.
44. Contingencies
Claims and litigation
The Bank, in its ordinary course of business, is presently involved in 394 cases as a defendant (31
December 2013: 310) and 176 cases as a plaintiff (31 December 2013: 133). The total amount claimed
in the 394 cases against the Bank is estimated at N469,469,029,610.76K and $135,418,536.23 (31
December 2013: N304,620,174,907 and $133,520,449) while the total amount claimed in the 176
cases instituted by the Bank is N66.4 Billion (31 December 2013: N50.24 Billion). However, the
solicitors of the Bank are of the view that the probable liability arising from the cases pending against
the Bank is not likely to exceed N93,601,044.81K (31 December 2013: N27,310,000).
Based on the advice of the solicitors, the Directors of the Bank are of the opinion that none of the
aforementioned cases is likely to have a material adverse effect on the Bank and they are not aware of
any other pending and or threatened claims or litigation which may be material to the financial
statements.
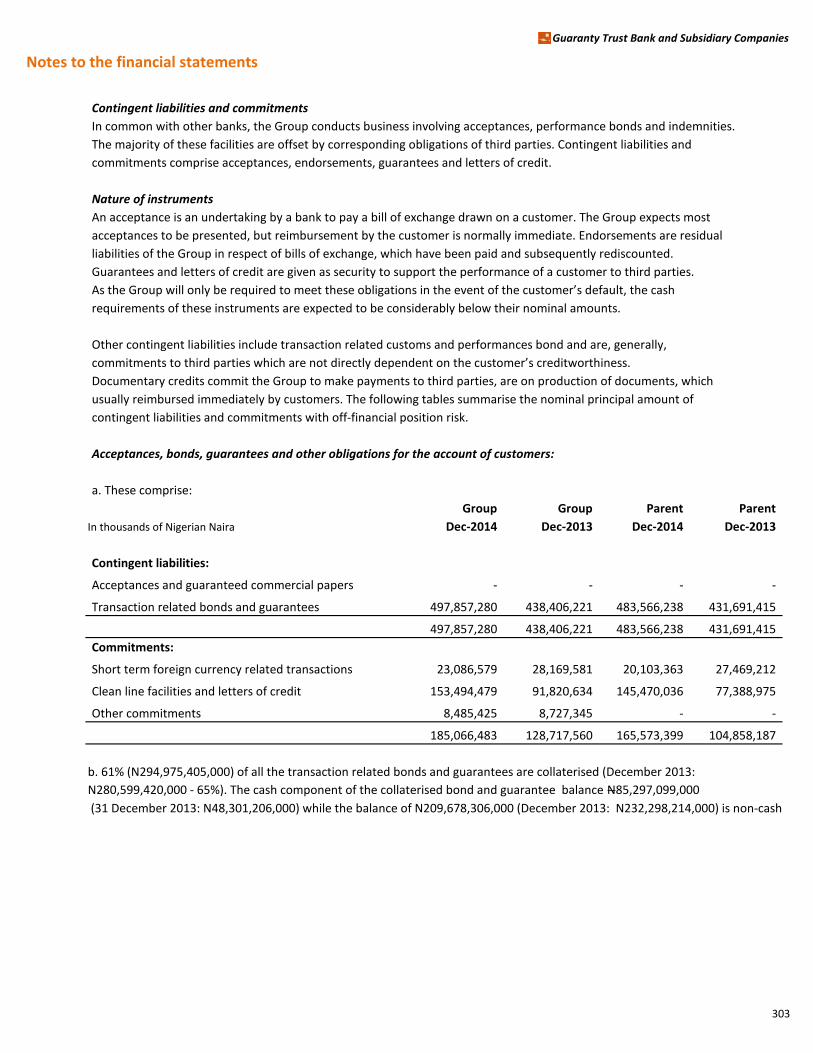
Notes to the financial statements
Guaranty Trust Bank and Subsidiary Companies
Contingent liabilities and commitments
In common with other banks, the Group conducts business involving acceptances, performance bonds and indemnities.
The majority of these facilities are offset by corresponding obligations of third parties. Contingent liabilities and
commitments comprise acceptances, endorsements, guarantees and letters of credit.
Nature of instruments
An acceptance is an undertaking by a bank to pay a bill of exchange drawn on a customer. The Group expects most
acceptances to be presented, but reimbursement by the customer is normally immediate. Endorsements are residual
liabilities of the Group in respect of bills of exchange, which have been paid and subsequently rediscounted.
Guarantees and letters of credit are given as security to support the performance of a customer to third parties.
As the Group will only be required to meet these obligations in the event of the customer’s default, the cash
requirements of these instruments are expected to be considerably below their nominal amounts.
Other contingent liabilities include transaction related customs and performances bond and are, generally,
commitments to third parties which are not directly dependent on the customer’s creditworthiness.
Documentary credits commit the Group to make payments to third parties, are on production of documents, which
usually reimbursed immediately by customers. The following tables summarise the nominal principal amount of
contingent liabilities and commitments with off-financial position risk.
Acceptances, bonds, guarantees and other obligations for the account of customers:
a. These comprise:
Group Group Parent Parent
In thousands of Nigerian Naira Dec-2014 Dec-2013 Dec-2014 Dec-2013
Contingent liabilities:
Acceptances and guaranteed commercial papers - - - -
Transaction related bonds and guarantees 497,857,280 438,406,221 483,566,238 431,691,415
497,857,280 438,406,221 483,566,238 431,691,415
Commitments:
Short term foreign currency related transactions 23,086,579 28,169,581 20,103,363 27,469,212
Clean line facilities and letters of credit 153,494,479 91,820,634 145,470,036 77,388,975
Other commitments 8,485,425 8,727,345 - -
185,066,483 128,717,560 165,573,399 104,858,187
b. 61% (N294,975,405,000) of all the transaction related bonds and guarantees are collaterised (December 2013:
N280,599,420,000 - 65%). The cash component of the collaterised bond and guarantee balance N85,297,099,000
(31 December 2013: N48,301,206,000) while the balance of N209,678,306,000 (December 2013: N232,298,214,000) is non-cash..
303
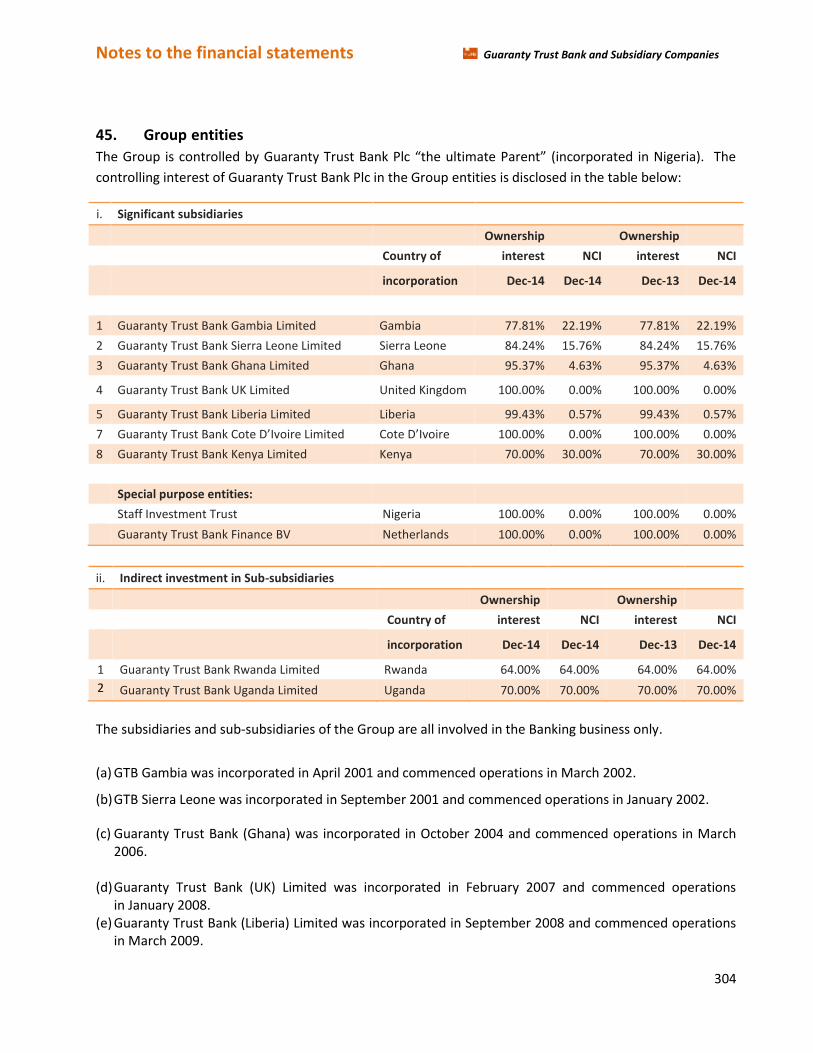
Notes to the financial statements Guaranty Trust Bank and Subsidiary Companies
304
45. Group entities
The Group is controlled by Guaranty Trust Bank Plc “the ultimate Parent” (incorporated in Nigeria). The
controlling interest of Guaranty Trust Bank Plc in the Group entities is disclosed in the table below:
i. Significant subsidiaries
Ownership Ownership
Country of interest NCI interest NCI
incorporation Dec-14 Dec-14 Dec-13 Dec-14
1 Guaranty Trust Bank Gambia Limited Gambia 77.81% 22.19% 77.81% 22.19%
2 Guaranty Trust Bank Sierra Leone Limited Sierra Leone 84.24% 15.76% 84.24% 15.76%
3 Guaranty Trust Bank Ghana Limited Ghana 95.37% 4.63% 95.37% 4.63%
4 Guaranty Trust Bank UK Limited United Kingdom 100.00% 0.00% 100.00% 0.00%
5 Guaranty Trust Bank Liberia Limited Liberia 99.43% 0.57% 99.43% 0.57%
7 Guaranty Trust Bank Cote D’Ivoire Limited Cote D’Ivoire 100.00% 0.00% 100.00% 0.00%
8 Guaranty Trust Bank Kenya Limited Kenya 70.00% 30.00% 70.00% 30.00%
Special purpose entities:
Staff Investment Trust Nigeria 100.00% 0.00% 100.00% 0.00%
Guaranty Trust Bank Finance BV Netherlands 100.00% 0.00% 100.00% 0.00%
ii. Indirect investment in Sub-subsidiaries
Ownership Ownership
Country of interest NCI interest NCI
incorporation Dec-14 Dec-14 Dec-13 Dec-14
1 Guaranty Trust Bank Rwanda Limited Rwanda 64.00% 64.00% 64.00% 64.00%
2 Guaranty Trust Bank Uganda Limited Uganda 70.00% 70.00% 70.00% 70.00%
The subsidiaries and sub-subsidiaries of the Group are all involved in the Banking business only. (a) GTB Gambia was incorporated in April 2001 and commenced operations in March 2002. (b) GTB Sierra Leone was incorporated in September 2001 and commenced operations in January 2002. (c) Guaranty Trust Bank (Ghana) was incorporated in October 2004 and commenced operations in March
2006. (d) Guaranty Trust Bank (UK) Limited was incorporated in February 2007 and commenced operations
in January 2008. (e) Guaranty Trust Bank (Liberia) Limited was incorporated in September 2008 and commenced operations
in March 2009.
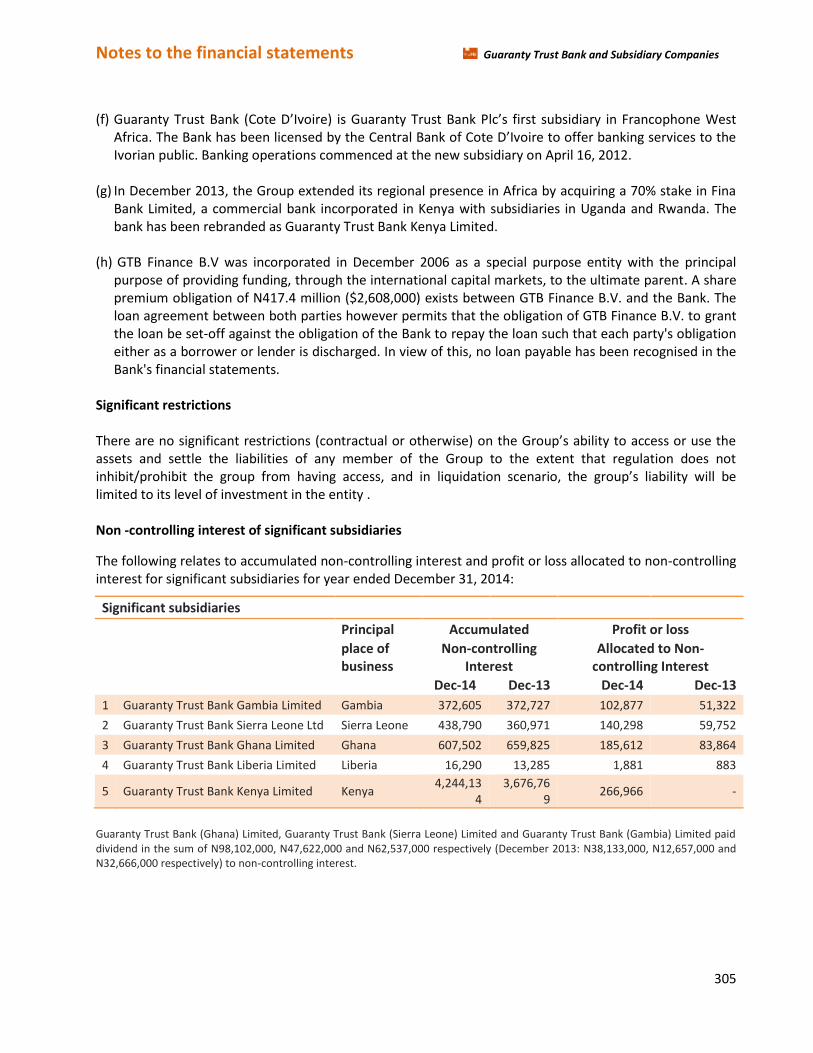
Notes to the financial statements Guaranty Trust Bank and Subsidiary Companies
305
(f) Guaranty Trust Bank (Cote D’Ivoire) is Guaranty Trust Bank Plc’s first subsidiary in Francophone West
Africa. The Bank has been licensed by the Central Bank of Cote D’Ivoire to offer banking services to the Ivorian public. Banking operations commenced at the new subsidiary on April 16, 2012.
(g) In December 2013, the Group extended its regional presence in Africa by acquiring a 70% stake in Fina Bank Limited, a commercial bank incorporated in Kenya with subsidiaries in Uganda and Rwanda. The bank has been rebranded as Guaranty Trust Bank Kenya Limited.
(h) GTB Finance B.V was incorporated in December 2006 as a special purpose entity with the principal
purpose of providing funding, through the international capital markets, to the ultimate parent. A share premium obligation of N417.4 million ($2,608,000) exists between GTB Finance B.V. and the Bank. The loan agreement between both parties however permits that the obligation of GTB Finance B.V. to grant the loan be set-off against the obligation of the Bank to repay the loan such that each party's obligation either as a borrower or lender is discharged. In view of this, no loan payable has been recognised in the Bank's financial statements.
Significant restrictions There are no significant restrictions (contractual or otherwise) on the Group’s ability to access or use the assets and settle the liabilities of any member of the Group to the extent that regulation does not inhibit/prohibit the group from having access, and in liquidation scenario, the group’s liability will be limited to its level of investment in the entity . Non -controlling interest of significant subsidiaries
The following relates to accumulated non-controlling interest and profit or loss allocated to non-controlling interest for significant subsidiaries for year ended December 31, 2014:
Significant subsidiaries
Principal Accumulated Profit or loss
place of business
Non-controlling Interest
Allocated to Non-controlling Interest
Dec-14 Dec-13 Dec-14 Dec-13
1 Guaranty Trust Bank Gambia Limited Gambia 372,605 372,727 102,877 51,322
2 Guaranty Trust Bank Sierra Leone Ltd Sierra Leone 438,790 360,971 140,298 59,752
3 Guaranty Trust Bank Ghana Limited Ghana 607,502 659,825 185,612 83,864
4 Guaranty Trust Bank Liberia Limited Liberia 16,290 13,285 1,881 883
5 Guaranty Trust Bank Kenya Limited Kenya 4,244,13
4 3,676,76
9 266,966 -
Guaranty Trust Bank (Ghana) Limited, Guaranty Trust Bank (Sierra Leone) Limited and Guaranty Trust Bank (Gambia) Limited paid dividend in the sum of N98,102,000, N47,622,000 and N62,537,000 respectively (December 2013: N38,133,000, N12,657,000 and N32,666,000 respectively) to non-controlling interest.
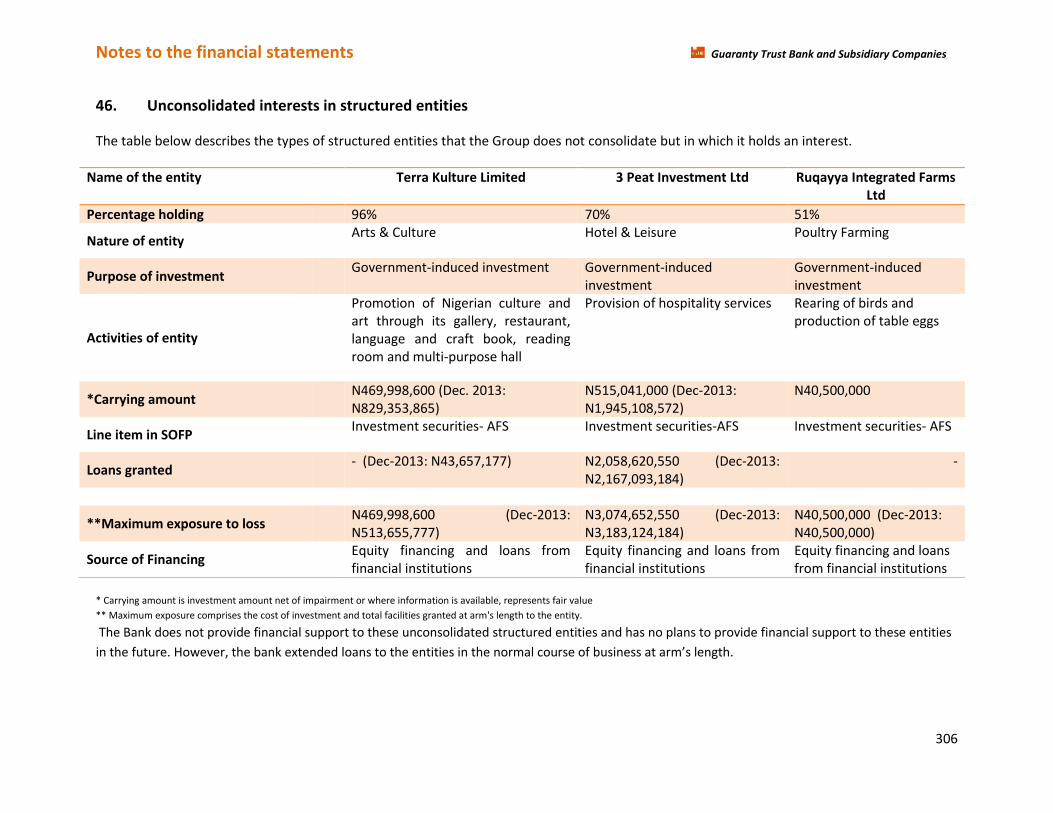
Notes to the financial statements Guaranty Trust Bank and Subsidiary Companies
306
46. Unconsolidated interests in structured entities
The table below describes the types of structured entities that the Group does not consolidate but in which it holds an interest.
* Carrying amount is investment amount net of impairment or where information is available, represents fair value
** Maximum exposure comprises the cost of investment and total facilities granted at arm's length to the entity.
The Bank does not provide financial support to these unconsolidated structured entities and has no plans to provide financial support to these entities
in the future. However, the bank extended loans to the entities in the normal course of business at arm’s length.
Name of the entity Terra Kulture Limited 3 Peat Investment Ltd Ruqayya Integrated Farms Ltd
Percentage holding 96% 70% 51%
Nature of entity Arts & Culture Hotel & Leisure Poultry Farming
Purpose of investment Government-induced investment Government-induced
investment Government-induced investment
Activities of entity
Promotion of Nigerian culture and art through its gallery, restaurant, language and craft book, reading room and multi-purpose hall
Provision of hospitality services Rearing of birds and production of table eggs
*Carrying amount N469,998,600 (Dec. 2013:
N829,353,865) N515,041,000 (Dec-2013: N1,945,108,572)
N40,500,000
Line item in SOFP Investment securities- AFS Investment securities-AFS Investment securities- AFS
Loans granted - (Dec-2013: N43,657,177) N2,058,620,550 (Dec-2013:
N2,167,093,184) -
**Maximum exposure to loss N469,998,600 (Dec-2013:
N513,655,777) N3,074,652,550 (Dec-2013: N3,183,124,184)
N40,500,000 (Dec-2013: N40,500,000)
Source of Financing Equity financing and loans from
financial institutions Equity financing and loans from financial institutions
Equity financing and loans from financial institutions
Notes to the financial statements Guaranty Trust Bank and Subsidiary Companies
307
47. Fina Bank Acquisition
In the prior year, GTBank Plc acquired a 70% shareholding in Fina Bank Limited, a commercial bank incorporated
in Kenya which operates two subsidiaries in Rwanda and Uganda.
The acquisition was based on completion accounts as of October 31, 2013 and represents a stepping stone to the
Group’s entry into the East African market through a multi-country platform thus achieving a significant presence
in the region. In addition, this acquisition would help in further diversifying the Group’s revenue stream by
leveraging on the growth potential of the East African banking industry fuelled by rapid GDP expansion.
The transaction took the form of an offer for subscription resulting in a capital injection of USD30 million and an
offer for sale from existing shareholders resulting in GTBank acquiring a 70% stake.
The allocation of the consideration to the carrying value of net assets resulted to a positive goodwill of N8.5 billion; this goodwill is not deductible for tax purposes. The main reasons for the recognition of this goodwill are the expected synergies, anticipated additional income as well as market presence in the commercial banking landscape in Kenya, Rwanda and Uganda. The goodwill has been allocated first, by geography and thereafter to GTBank’s business operating segments which constitute cash generating units that are likely to benefit from the synergies of the business combination. The goodwill was allocated as follows: Corporate Banking – 50 per cent, Commercial Banking – 24 per cent, Retail Banking – 17 per cent, SME Banking – 5 per cent and Public sector – 4 per cent. Non controlling interest (NCI) in the acquiree at the acquisition date has been determined as NCI’ proportionate share in the recognized amounts of the acquiree’s identifiable net assets. Differences in accounting policies were deemed immaterial to the GTBank Group. The fair value of assets and liabilities arising from the acquisition are as shown below:

Notes to the financial statements Guaranty Trust Bank and Subsidiary Companies
308
In thousands of Nigerian naira
Assets acquired
Fair Value
Cash and cash equivalents 6,509,601
Investment securities: – Available for sale 10,667,896
– Held to maturity 4,754,108
Loans and advances to customers 31,633,118
Current income tax assets 21,626
Property and equipment 1,225,687
Intangible assets 80,238
Deferred tax assets 515,075
Other assets 805,336
Assets 56,212,685
Liabilities assumed:
Deposits from banks 1,192,160
Deposits from customers 46,295,649
Other borrowed funds 502,072
Deferred tax liabilities 35,509
Current income tax liabilities 58,667
Other liabilities 756,415
Liabilities 48,840,472
Net assets 7,372,213
Cash on subscription shares 4,868,729
Net assets acquired 12,240,942
Non-controlling interest (@ approx. 30 per cent) 3,664,522
Net assets acquired (@ approx. 70 per cent) 8,576,420
Contingent assets and liabilities as at acquisition date amounted to N4.69 billion. These relate to Acceptances and letter of credit and Guarantees in the sum of N1.95 billion and Guarantees and performance bonds in the sum of N2.73 billion. As part of the acquisition, the Group acquired loans and advances with a fair value of N31, 633,118,000 with
gross contractual amount receivable of N35, 290,715,000. Discounting this contractual cash flows receivable
to present value, management’s estimate an amount in the sum of N828, 271,000 might not be collectible.
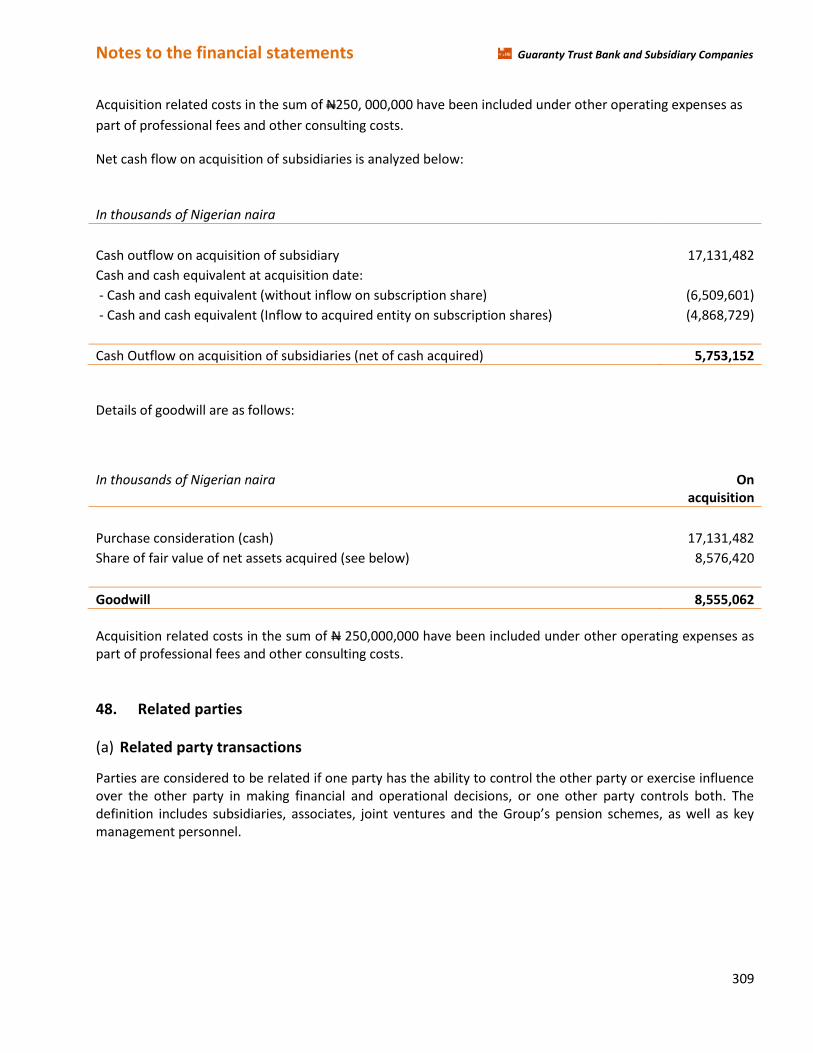
Notes to the financial statements Guaranty Trust Bank and Subsidiary Companies
309
Acquisition related costs in the sum of N250, 000,000 have been included under other operating expenses as
part of professional fees and other consulting costs.
Net cash flow on acquisition of subsidiaries is analyzed below:
In thousands of Nigerian naira
Cash outflow on acquisition of subsidiary 17,131,482
Cash and cash equivalent at acquisition date: - Cash and cash equivalent (without inflow on subscription share) (6,509,601)
- Cash and cash equivalent (Inflow to acquired entity on subscription shares) (4,868,729)
Cash Outflow on acquisition of subsidiaries (net of cash acquired) 5,753,152
Details of goodwill are as follows:
In thousands of Nigerian naira On
acquisition
Purchase consideration (cash) 17,131,482
Share of fair value of net assets acquired (see below) 8,576,420
Goodwill 8,555,062
Acquisition related costs in the sum of N 250,000,000 have been included under other operating expenses as part of professional fees and other consulting costs.
48. Related parties
(a) Related party transactions
Parties are considered to be related if one party has the ability to control the other party or exercise influence over the other party in making financial and operational decisions, or one other party controls both. The definition includes subsidiaries, associates, joint ventures and the Group’s pension schemes, as well as key management personnel.
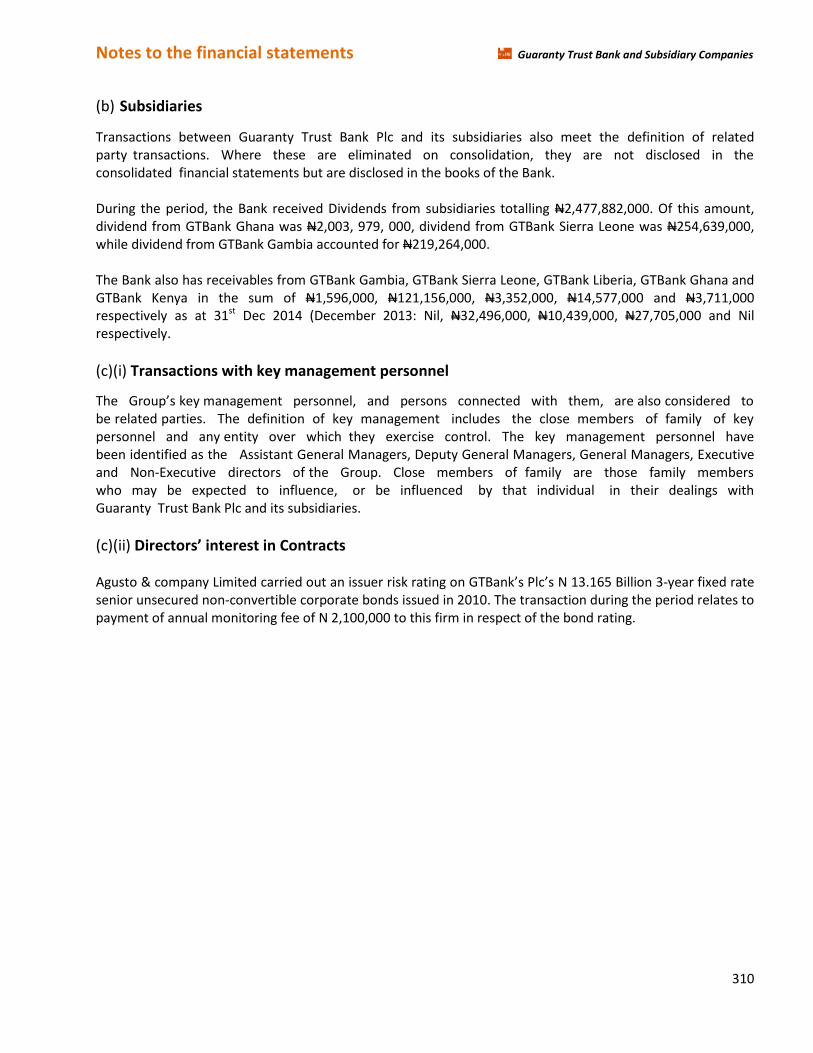
Notes to the financial statements Guaranty Trust Bank and Subsidiary Companies
310
(b) Subsidiaries
Transactions between Guaranty Trust Bank Plc and its subsidiaries also meet the definition of related party transactions. Where these are eliminated on consolidation, they are not disclosed in the consolidated financial statements but are disclosed in the books of the Bank. During the period, the Bank received Dividends from subsidiaries totalling N2,477,882,000. Of this amount, dividend from GTBank Ghana was N2,003, 979, 000, dividend from GTBank Sierra Leone was N254,639,000, while dividend from GTBank Gambia accounted for N219,264,000. The Bank also has receivables from GTBank Gambia, GTBank Sierra Leone, GTBank Liberia, GTBank Ghana and GTBank Kenya in the sum of N1,596,000, N121,156,000, N3,352,000, N14,577,000 and N3,711,000 respectively as at 31st Dec 2014 (December 2013: Nil, N32,496,000, N10,439,000, N27,705,000 and Nil respectively.
(c)(i) Transactions with key management personnel
The Group’s key management personnel, and persons connected with them, are also considered to be related parties. The definition of key management includes the close members of family of key personnel and any entity over which they exercise control. The key management personnel have been identified as the Assistant General Managers, Deputy General Managers, General Managers, Executive and Non-Executive directors of the Group. Close members of family are those family members who may be expected to influence, or be influenced by that individual in their dealings with Guaranty Trust Bank Plc and its subsidiaries.
(c)(ii) Directors’ interest in Contracts Agusto & company Limited carried out an issuer risk rating on GTBank’s Plc’s N 13.165 Billion 3-year fixed rate senior unsecured non-convertible corporate bonds issued in 2010. The transaction during the period relates to payment of annual monitoring fee of N 2,100,000 to this firm in respect of the bond rating.
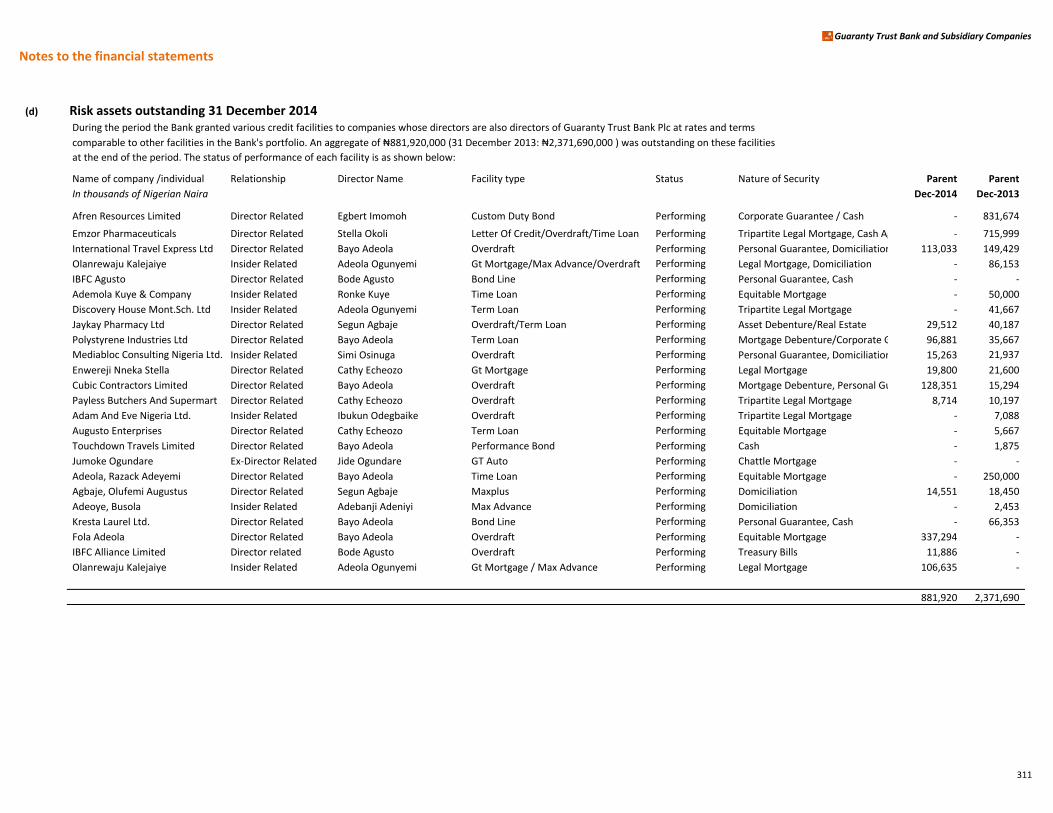
Notes to the financial statements
Guaranty Trust Bank and Subsidiary Companies
(d) Risk assets outstanding 31 December 2014During the period the Bank granted various credit facilities to companies whose directors are also directors of Guaranty Trust Bank Plc at rates and terms
comparable to other facilities in the Bank's portfolio. An aggregate of ₦881,920,000 (31 December 2013: ₦2,371,690,000 ) was outstanding on these facilities
at the end of the period. The status of performance of each facility is as shown below:
Name of company /individual Relationship Director Name Facility type Status Nature of Security Parent Parent
In thousands of Nigerian Naira Dec-2014 Dec-2013
Afren Resources Limited Director Related Egbert Imomoh Custom Duty Bond Performing Corporate Guarantee / Cash - 831,674
Emzor Pharmaceuticals Director Related Stella Okoli Letter Of Credit/Overdraft/Time Loan Performing Tripartite Legal Mortgage, Cash Against Shipping Document, Counter Indemnity, Personal Guarantee- 715,999
International Travel Express Ltd Director Related Bayo Adeola Overdraft Performing Personal Guarantee, Domiciliation 113,033 149,429
Olanrewaju Kalejaiye Insider Related Adeola Ogunyemi Gt Mortgage/Max Advance/Overdraft Performing Legal Mortgage, Domiciliation - 86,153
IBFC Agusto Director Related Bode Agusto Bond Line Performing Personal Guarantee, Cash - -
Ademola Kuye & Company Insider Related Ronke Kuye Time Loan Performing Equitable Mortgage - 50,000
Discovery House Mont.Sch. Ltd Insider Related Adeola Ogunyemi Term Loan Performing Tripartite Legal Mortgage - 41,667
Jaykay Pharmacy Ltd Director Related Segun Agbaje Overdraft/Term Loan Performing Asset Debenture/Real Estate 29,512 40,187
Polystyrene Industries Ltd Director Related Bayo Adeola Term Loan Performing Mortgage Debenture/Corporate Guarantee96,881 35,667
Mediabloc Consulting Nigeria Ltd. Insider Related Simi Osinuga Overdraft Performing Personal Guarantee, Domiciliation 15,263 21,937
Enwereji Nneka Stella Director Related Cathy Echeozo Gt Mortgage Performing Legal Mortgage 19,800 21,600
Cubic Contractors Limited Director Related Bayo Adeola Overdraft Performing Mortgage Debenture, Personal Guarantee 128,351 15,294
Payless Butchers And Supermart Director Related Cathy Echeozo Overdraft Performing Tripartite Legal Mortgage 8,714 10,197
Adam And Eve Nigeria Ltd. Insider Related Ibukun Odegbaike Overdraft Performing Tripartite Legal Mortgage - 7,088
Augusto Enterprises Director Related Cathy Echeozo Term Loan Performing Equitable Mortgage - 5,667
Touchdown Travels Limited Director Related Bayo Adeola Performance Bond Performing Cash - 1,875
Jumoke Ogundare Ex-Director Related Jide Ogundare GT Auto Performing Chattle Mortgage - -
Adeola, Razack Adeyemi Director Related Bayo Adeola Time Loan Performing Equitable Mortgage - 250,000
Agbaje, Olufemi Augustus Director Related Segun Agbaje Maxplus Performing Domiciliation 14,551 18,450
Adeoye, Busola Insider Related Adebanji Adeniyi Max Advance Performing Domiciliation - 2,453
Kresta Laurel Ltd. Director Related Bayo Adeola Bond Line Performing Personal Guarantee, Cash - 66,353
Fola Adeola Director Related Bayo Adeola Overdraft Performing Equitable Mortgage 337,294 -
IBFC Alliance Limited Director related Bode Agusto Overdraft Performing Treasury Bills 11,886 -
Olanrewaju Kalejaiye Insider Related Adeola Ogunyemi Gt Mortgage / Max Advance Performing Legal Mortgage 106,635 -
881,920 2,371,690
311

Notes to the financial statements
Guaranty Trust Bank and Subsidiary Companies
(e) Director/insiders related deposit liabiilties
Name of company/Individual Relationship Type of Deposit Parent Parent
In thousands of Nigerian Naira Dec-2014 Dec-2013
Agusto & Co. Limited Director related Demand Deposit 48,634 33,695
Alliance Consulting Director related Demand Deposit 318 761
Comprehensive Project Mgt. ServicesDirector related Demand Deposit 15,260 8,466
Cubic Contractors Limited Director related Demand Deposit 2,315 2,625
Eterna Plc Director related Demand Deposit 3,522 7,411
F & C Securities Limited Director related Demand Deposit 51,054 11,540
IBFC Agusto Training Director related Demand Deposit - 4,975
IBFC Limited Director related Demand Deposit 6 6
Jaykay Pharmacy Limited Director related Demand Deposit 11 14
Kresta Laurel Limited Director related Demand Deposit and Time Deposit 6,559 11,661
Main One Cable Company Ltd Director related Demand Deposit 2,778 39,986
Mayfield Finance Company Director related Demand Deposit 58 85
Mayfield Ventures Limited Director related Demand Deposit 93 11
Payless Butchers & Supermart Ltd Director related Demand Deposit 91 210
Sikilu Petroleum & Gas Co Ltd Director related Demand Deposit 3 3
WSTC Financial Services Ltd Director related Demand Deposit and Time Deposit 1,286,798 190,692
WSTC Nominee Limited Director related Demand Deposit 431 431
Zito Phranzlo Int'L Limited Director related Demand Deposit 61 53
International Travel Express Ltd Director related Demand Deposit 10 9
Afren Onshore Ltd Director related Demand Deposit 1 1
Afren Resources Limited Director related Demand Deposit and Time Deposit 13,249 12,428
Mediabloc Consulting Nig Ltd Insider Related - - -
Ademola Kuye & Company Insider Related Demand Deposit and Time Deposit 9,948 61,322
Adam And Eve Nigeria Limited Insider Related Demand Deposit 100 71
Augusto Enterprises Nig. Ltd Director related Demand Deposit 3,526 794
Polystyrene Industries Ltd Director related Demand Deposit 8,422 21,853
Touchdown Travels Limited Insider Related Demand Deposit and Time Deposit 11,870 13,297
Discovery House Mont.Sch. Ltd Insider Related Demand Deposit 14,861 7,925
Mediabloc Consulting Nigeria Ltd. Insider Related Demand Deposits 5 2
Agbaje, Olufemi Augustus Director related Demand Deposit 7,222 -
312
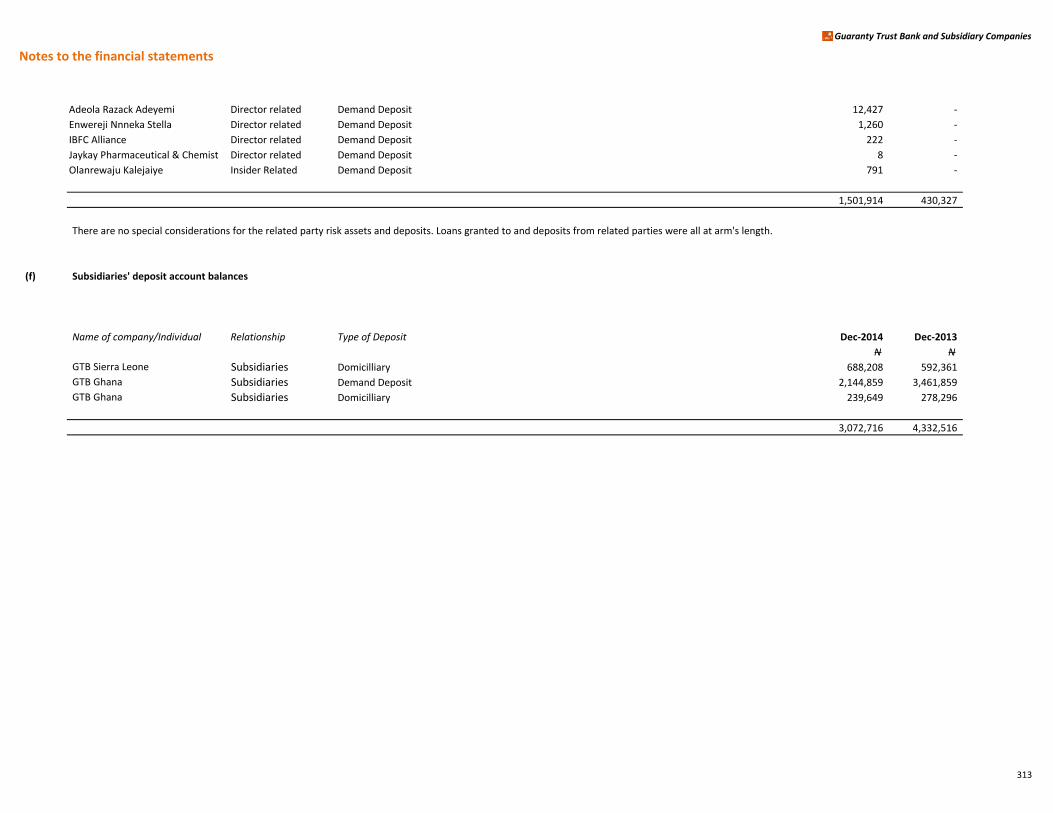
Notes to the financial statements
Guaranty Trust Bank and Subsidiary Companies
Adeola Razack Adeyemi Director related Demand Deposit 12,427 -
Enwereji Nnneka Stella Director related Demand Deposit 1,260 -
IBFC Alliance Director related Demand Deposit 222 -
Jaykay Pharmaceutical & Chemist Director related Demand Deposit 8 -
Olanrewaju Kalejaiye Insider Related Demand Deposit 791 -
1,501,914 430,327
There are no special considerations for the related party risk assets and deposits. Loans granted to and deposits from related parties were all at arm's length.
(f) Subsidiaries' deposit account balances
Name of company/Individual Relationship Type of Deposit Dec-2014 Dec-2013
N N
GTB Sierra Leone Subsidiaries Domicilliary 688,208 592,361
GTB Ghana Subsidiaries Demand Deposit 2,144,859 3,461,859
GTB Ghana Subsidiaries Domicilliary 239,649 278,296
3,072,716 4,332,516
313
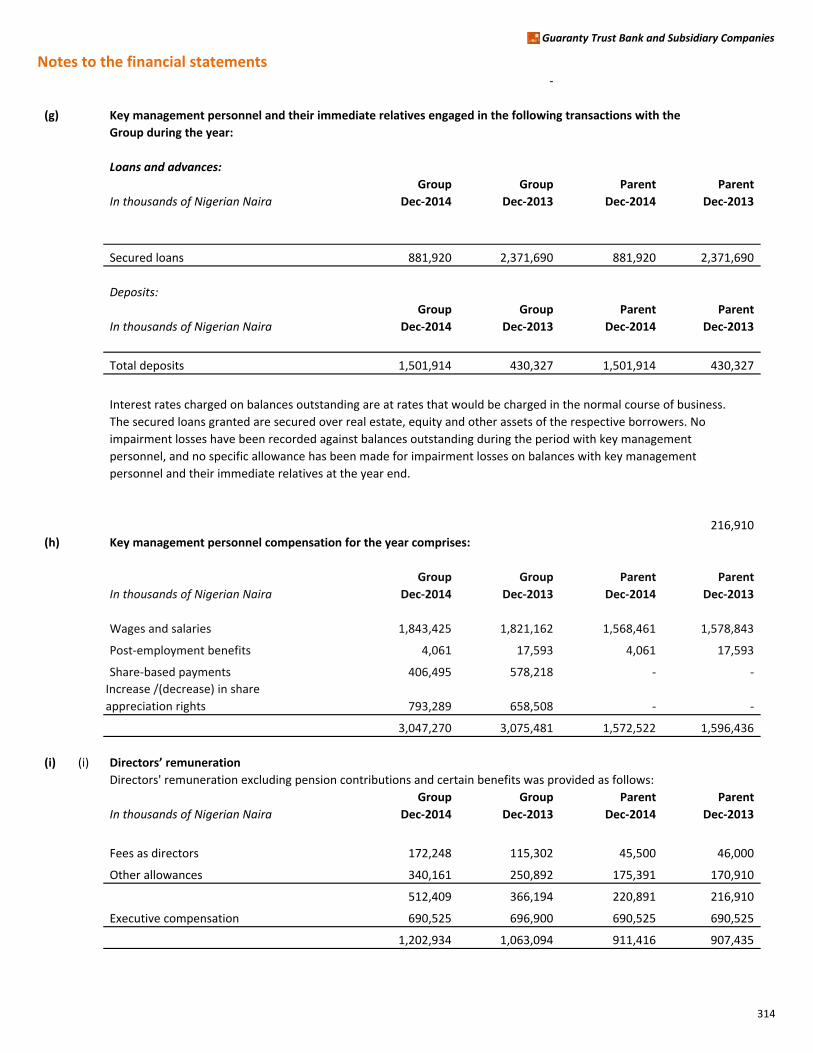
Notes to the financial statements
Guaranty Trust Bank and Subsidiary Companies
-
(g) Key management personnel and their immediate relatives engaged in the following transactions with the
Group during the year:
Loans and advances:
Group Group Parent Parent
In thousands of Nigerian Naira Dec-2014 Dec-2013 Dec-2014 Dec-2013
Secured loans 881,920 2,371,690 881,920 2,371,690
Deposits:
Group Group Parent Parent
In thousands of Nigerian Naira Dec-2014 Dec-2013 Dec-2014 Dec-2013
Total deposits 1,501,914 430,327 1,501,914 430,327
Interest rates charged on balances outstanding are at rates that would be charged in the normal course of business.
The secured loans granted are secured over real estate, equity and other assets of the respective borrowers. No
impairment losses have been recorded against balances outstanding during the period with key management
personnel, and no specific allowance has been made for impairment losses on balances with key management
personnel and their immediate relatives at the year end.
216,910
(h) Key management personnel compensation for the year comprises:
Group Group Parent Parent
In thousands of Nigerian Naira Dec-2014 Dec-2013 Dec-2014 Dec-2013
Wages and salaries 1,843,425 1,821,162 1,568,461 1,578,843
Post-employment benefits 4,061 17,593 4,061 17,593
Share-based payments 406,495 578,218 - -
Increase /(decrease) in share
appreciation rights 793,289 658,508 - -
3,047,270 3,075,481 1,572,522 1,596,436
(i) (i) Directors’ remuneration
Directors' remuneration excluding pension contributions and certain benefits was provided as follows:
Group Group Parent Parent
In thousands of Nigerian Naira Dec-2014 Dec-2013 Dec-2014 Dec-2013
Fees as directors 172,248 115,302 45,500 46,000
Other allowances 340,161 250,892 175,391 170,910
512,409 366,194 220,891 216,910
Executive compensation 690,525 696,900 690,525 690,525
1,202,934 1,063,094 911,416 907,435
314
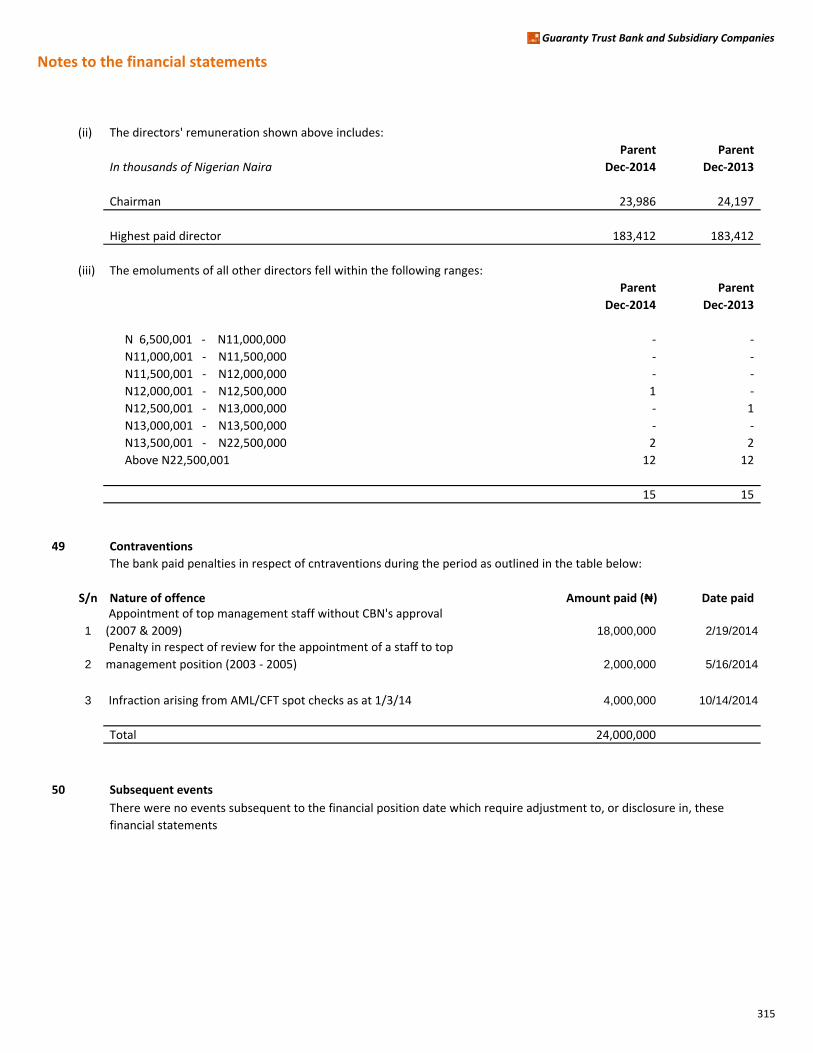
Notes to the financial statements
Guaranty Trust Bank and Subsidiary Companies
(ii) The directors' remuneration shown above includes:
Parent Parent
In thousands of Nigerian Naira Dec-2014 Dec-2013
Chairman 23,986 24,197
Highest paid director 183,412 183,412
(iii) The emoluments of all other directors fell within the following ranges:
Parent Parent
Dec-2014 Dec-2013
N 6,500,001 - N11,000,000 - -
N11,000,001 - N11,500,000 - -
N11,500,001 - N12,000,000 - -
N12,000,001 - N12,500,000 1 -
N12,500,001 - N13,000,000 - 1
N13,000,001 - N13,500,000 - -
N13,500,001 - N22,500,000 2 2
Above N22,500,001 12 12
15 15
49 Contraventions
The bank paid penalties in respect of cntraventions during the period as outlined in the table below:
S/n Nature of offence Amount paid (₦) Date paid
1 18,000,000 2/19/2014
2 2,000,000 5/16/2014
3 4,000,000 10/14/2014
Total 24,000,000
50 Subsequent events
There were no events subsequent to the financial position date which require adjustment to, or disclosure in, these
financial statements
Appointment of top management staff without CBN's approval
(2007 & 2009) Penalty in respect of review for the appointment of a staff to top
management position (2003 - 2005)
Infraction arising from AML/CFT spot checks as at 1/3/14
315
Regulatory Requirements under IFRS Guaranty Trust Bank and Subsidiary Companies
316
Regulatory Requirements under the IFRS Regime In addressing the challenges faced by the Nigerian Banking industry which was at the brink of a crisis as a result of spiral effects of the global financial meltdown, the CBN undertook a review of the prudential guidelines. In the revised guidelines, which became effective 1st of July, 2010, the CBN provided for the adaptation of the prudential guidelines to IFRS after it has been adopted in Nigeria. Paragraph 12.4 of the revised Prudential Guidelines for Deposit Money Banks in Nigeria stipulates that Banks would be required to make provisions for loans as prescribed in the relevant IFRS Standards when IFRS is adopted. However, Banks would be required to comply with the following: (a) Provisions for loans recognized in the profit and loss account should be determined based on the
requirements of IFRS. However, the IFRS provisions should be compared with provisions determined under prudential guidelines and the expected impact/changes in general reserve should be treated as follows:
i. Prudential Provisions is greater than IFRS provisions; transfer the difference from the
general reserve to a non-distributable regulatory reserve.
ii. Prudential Provisions is less than IFRS provisions; the excess charges resulting should be transferred from the regulatory reserve account to the general reserve to the extent of the non-distributable reserve previously recognized.
(b) The non-distributable reserve should be classified under Tier 1 as part of core capital.
The group has fully complied with the requirements of the guidelines.
Provisioning as recommended by Prudential Guideline Loan provisioning is segregated along two (2) categories as detailed below:
1. Loans other than Specialized Loans
The provisioning policy for ‘loans other than specialized loans’ covers the following:
i. Commercial Loans ii. Commodities Financing
iii. Corporate Loans iv. Retail & Consumer Credits v. Neither past due nor impaired
vi. Facilities granted to Federal, State and Local governments and their parastatals. vii. Facilities not specifically classified as specialized loans by the CBN.
The bank’s provisioning benchmark for ‘loans other than specialized loans’ is highlighted in the table below:

Regulatory Requirements under IFRS Guaranty Trust Bank and Subsidiary Companies
317
No of Days Overdrawn Classification % Provision taken
90 – 180 Substandard 10
180 – 360 Doubtful 50
Over 360 Lost 100
As soon as an account is classified as non-performing, the interest is accounted for on non-accrual basis i.e. interest is not recognized as income but suspended. Furthermore, if the occurrence of a loss event is certain, appropriate provisions will be made regardless of the fact that such loans does not fall in any of the above categories.
2. Specialized Loans The provisioning policy for specialized loans covers the following:
i. Agriculture Finance ii. Margin Loans
iii. Project Finance iv. Object Finance v. Real Estate Loans (Commercial and Residential)
vi. SME Loans
The bank’s provisioning benchmarks are spelt out below under each of the specialized loan types:
i. Agriculture Finance a. Agriculture Finance - short term facilities (purchase of seeds, fertilizers, WC, and other
Inputs)
Category Classification Days past due % provision
1 Watchlist
Markup / interest or principal past due by 90days
0% of total outstanding balance
1A Substandard
Markup / interest or principal past due by 90days to 1year
25% of total outstanding balance
2 Doubtful
Markup / interest or principal past due by 1 to 1.5 years
50% of total outstanding balance
3 Very Doubtful
Markup / interest or principal past due by 1.5 to 2 years
75% of total outstanding balance
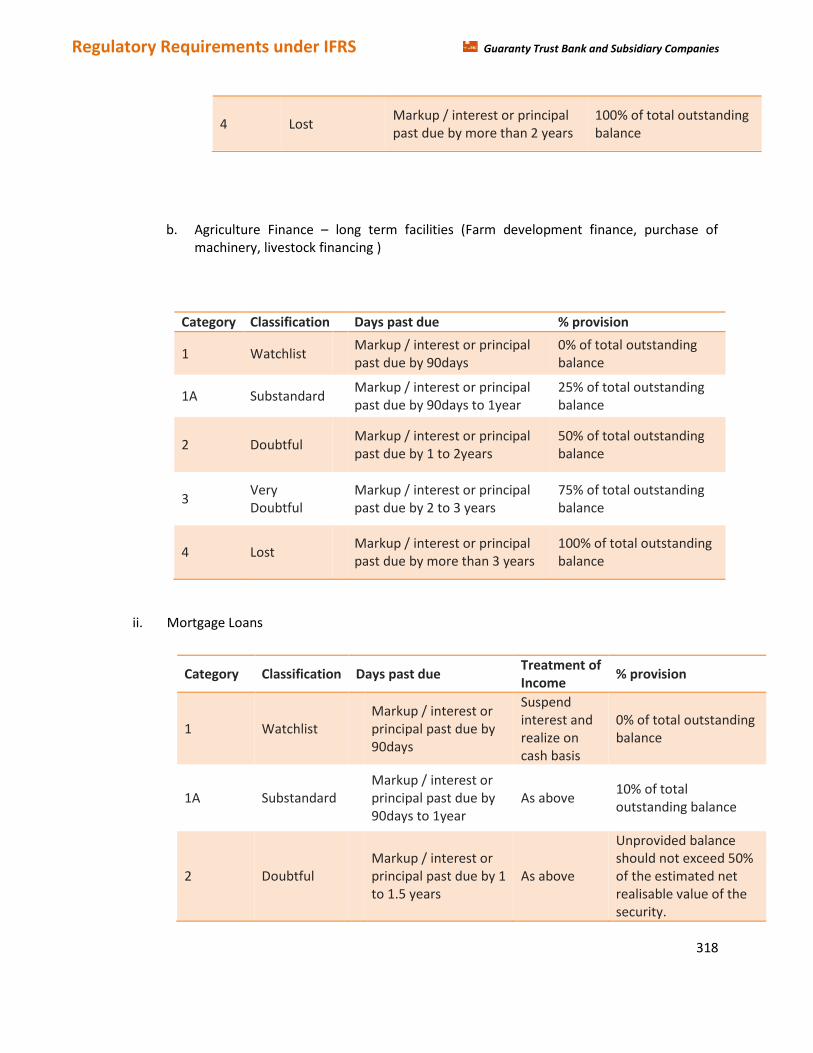
Regulatory Requirements under IFRS Guaranty Trust Bank and Subsidiary Companies
318
b. Agriculture Finance – long term facilities (Farm development finance, purchase of machinery, livestock financing )
ii. Mortgage Loans
4 Lost
Markup / interest or principal past due by more than 2 years
100% of total outstanding balance
Category Classification Days past due % provision
1 Watchlist
Markup / interest or principal past due by 90days
0% of total outstanding balance
1A Substandard
Markup / interest or principal past due by 90days to 1year
25% of total outstanding balance
2 Doubtful
Markup / interest or principal past due by 1 to 2years
50% of total outstanding balance
3 Very Doubtful
Markup / interest or principal past due by 2 to 3 years
75% of total outstanding balance
4 Lost
Markup / interest or principal past due by more than 3 years
100% of total outstanding balance
Category Classification Days past due Treatment of Income
% provision
1 Watchlist
Markup / interest or principal past due by 90days
Suspend interest and realize on cash basis
0% of total outstanding balance
1A Substandard
Markup / interest or principal past due by 90days to 1year
As above 10% of total outstanding balance
2 Doubtful
Markup / interest or principal past due by 1 to 1.5 years
As above
Unprovided balance should not exceed 50% of the estimated net realisable value of the security.
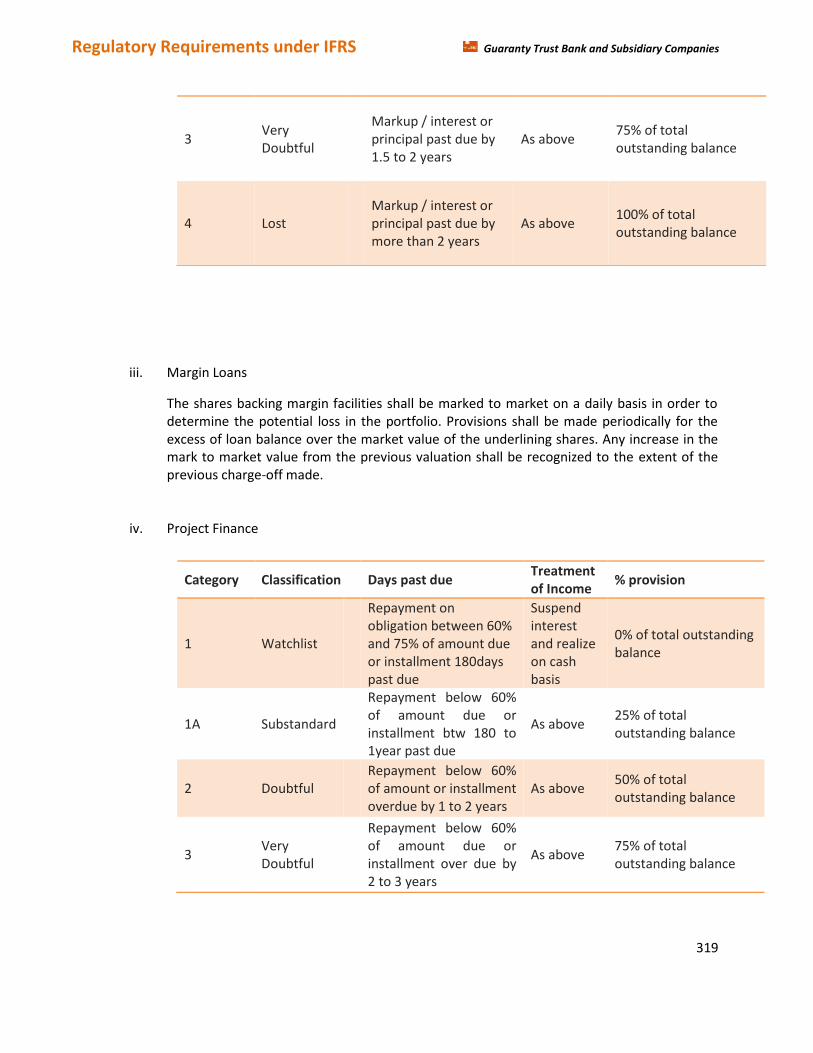
Regulatory Requirements under IFRS Guaranty Trust Bank and Subsidiary Companies
319
iii. Margin Loans
The shares backing margin facilities shall be marked to market on a daily basis in order to determine the potential loss in the portfolio. Provisions shall be made periodically for the excess of loan balance over the market value of the underlining shares. Any increase in the mark to market value from the previous valuation shall be recognized to the extent of the previous charge-off made.
iv. Project Finance
3 Very Doubtful
Markup / interest or principal past due by 1.5 to 2 years
As above 75% of total outstanding balance
4 Lost
Markup / interest or principal past due by more than 2 years
As above 100% of total outstanding balance
Category Classification Days past due Treatment of Income
% provision
1 Watchlist
Repayment on obligation between 60% and 75% of amount due or installment 180days past due
Suspend interest and realize on cash basis
0% of total outstanding balance
1A Substandard
Repayment below 60% of amount due or installment btw 180 to 1year past due
As above 25% of total outstanding balance
2 Doubtful
Repayment below 60% of amount or installment overdue by 1 to 2 years
As above 50% of total outstanding balance
3 Very Doubtful
Repayment below 60% of amount due or installment over due by 2 to 3 years
As above 75% of total outstanding balance
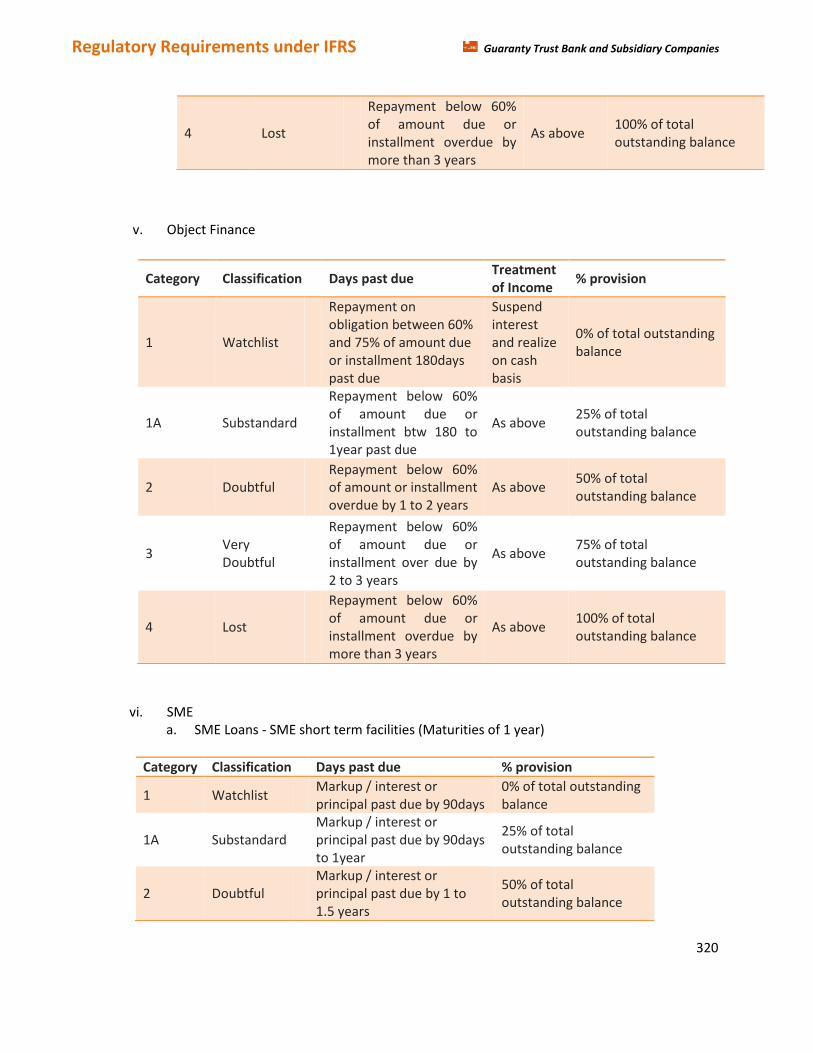
Regulatory Requirements under IFRS Guaranty Trust Bank and Subsidiary Companies
320
v. Object Finance
vi. SME a. SME Loans - SME short term facilities (Maturities of 1 year)
4 Lost
Repayment below 60% of amount due or installment overdue by more than 3 years
As above 100% of total outstanding balance
Category Classification Days past due Treatment of Income
% provision
1 Watchlist
Repayment on obligation between 60% and 75% of amount due or installment 180days past due
Suspend interest and realize on cash basis
0% of total outstanding balance
1A Substandard
Repayment below 60% of amount due or installment btw 180 to 1year past due
As above 25% of total outstanding balance
2 Doubtful
Repayment below 60% of amount or installment overdue by 1 to 2 years
As above 50% of total outstanding balance
3 Very Doubtful
Repayment below 60% of amount due or installment over due by 2 to 3 years
As above 75% of total outstanding balance
4 Lost
Repayment below 60% of amount due or installment overdue by more than 3 years
As above 100% of total outstanding balance
Category Classification Days past due % provision
1 Watchlist
Markup / interest or principal past due by 90days
0% of total outstanding balance
1A Substandard
Markup / interest or principal past due by 90days to 1year
25% of total outstanding balance
2 Doubtful
Markup / interest or principal past due by 1 to 1.5 years
50% of total outstanding balance

Regulatory Requirements under IFRS Guaranty Trust Bank and Subsidiary Companies
321
b. SME Loans - SME Long term facilities (Maturities of more than 1 year)
3 Very Doubtful
Markup / interest or principal past due by 1.5 to 2 years
75% of total outstanding balance
4 Lost
Markup / interest or principal past due by more than 2 years
100% of total outstanding balance
Category Classification Days past due % provision
1 Watchlist
Markup / interest or principal past due by 90days
0% of total outstanding balance
1A Substandard
Markup / interest or principal past due by 90days to 1year
25% of total outstanding balance
2 Doubtful
Markup / interest or principal past due by 1 to 2years
50% of total outstanding balance
3 Very Doubtful
Markup / interest or principal past due by 2 to 3 years
75% of total outstanding balance
4 Lost
Markup / interest or principal past due by more than 3 years
100% of total outstanding balance
Regulatory Requirements under IFRS Guaranty Trust Bank and Subsidiary Companies
322
Operational risk Management
Guaranty Trust Bank defines Operational Risk Management (OpRisk) as “the direct or indirect risk of
loss resulting from inadequate and/or failed internal processes, people, and systems or from external
events”. This definition requires the review and monitoring of all strategies and initiatives deployed in
its people management, process engineering and re-engineering, technology investment and
deployment, management of all regulatory responsibilities, and response to major disruptions and
external threats.
To ensure a holistic framework is implemented, Operational Risk Management also monitors Strategic
and Reputational Risks from a broad perspective.
The following practices, tools and methodologies have been implemented for this purpose:
Loss Incident Reporting – Loss incidents are reported to OpRisk Group by all business areas in the
Bank. All staff are encouraged to report operational risk events as they occur in their respective business spaces whether these risks crystallize into actual losses or not. As a result, the Bank has a robust OpRisk loss database detailing relevant OpRisk loss data for four years. Information collated is analyzed for identification of risk concentrations and appropriate OpRisk risk profiling and capital estimation.
Risk and Control Self Assessments (RCSAs) – This is a qualitative risk identification tool deployed bank-wide. All branches and Head-Office departments are required to complete related templates at least once a year. A risk-based approach has been adopted for the frequency of RCSAs to be conducted by branches, departments, groups and divisions of the Bank. These assessments enable risk profiling and risk mapping of prevalent operational risks.
Risk Assessments of the Bank’s new and existing products and services are also carried out. This process also tests the quality of controls the Bank has in place to mitigate likely risks; a detailed risk register cataloguing key risks identified and controls for implementation is also developed and maintained from this process.
Other Risk Assessments conducted include Process Risk Assessments, Product Risk Assessments, Vendor Risk Assessments, and Fraud Risk Assessments.
Key Risk Indicators (KRI) – These are quantitative parameters defined for the purpose of monitoring operational risk trends across the Bank. A comprehensive KRI Dashboard is in place and it is supported by specific KRIs for key departments in the Bank. Medium – High risk trends are reported in the Monthly Operational Risk Status reports circulated to Management and key stakeholders.
Fraud Risk Management Initiatives – Causal analysis of key fraud and forgeries trends identified in the Bank or prevalent in local and global business environments are carried out and reported on a monthly basis. Likely and unlikely loss estimations are also determined in the process as input in the OpRisk capital calculation process. The focus in Fraud Risk Management is to ensure that processes
Regulatory Requirements under IFRS Guaranty Trust Bank and Subsidiary Companies
323
for preventing, deterring, detecting fraud and forgeries incidents, and sanctioning offenders are effective.
Business Continuity Management (BCM) in line with BS 25999 Standards – To ensure the resilience of our business to any disruptive eventuality, the Bank has in place a robust Business Continuity Plan (BCP). This plan assures timely resumption of its business with minimal financial losses or reputational damage and continuity of service to its customers, vendors and regulators. Desktop Walkthrough Tests are being conducted bank-wide to ensure that recovery co-ordinators are aware of their roles and responsibilities. It is reviewed monthly and when necessary, it is updated to ensure reliability and relevance of information contained. The bank is currently in the process of being certified by the globally recognized by British Standards
Institute.
Compliance and Legal Risk Management – Compliance Risk Management involves close monitoring of KYC compliance by the Bank, escalation of Audit Non-conformances, Complaints Management, and observance of the Bank’s zero-tolerance culture for regulatory breaches. It also entails an oversight role for monitoring adherence to regulatory guidelines and global best practices on an on-going basis. Legal Risk Management involves the monitoring of litigations against the Bank to ascertain likely financial or non-financial loss exposures. It also involves conduct of causal analysis on identified points of failure that occasioned these litigations. Medium – High risk factors identified are duly reported and escalated for appropriate treatment where necessary.
Occupational Health and Safety procedures and initiatives – Global best practices for ensuring the health and safety of all staff, customers and visitors to the Bank’s premises are advised, reported on to relevant stakeholders and monitored for implementation. Related incidents are recorded bank-wide for identification of causal factors As a result, the following are conducted and monitored: Fire Risk Assessments, Quarterly Fire Drills, Burglaries and Injuries that occur within the Bank’s premises.
Operational Risk Capital Calculation – The Bank has adopted the Basel II Pillar 1 defined “Standardized Approach” for the calculation of its Operational Risk Economic Capital for internal risk monitoring and decision-making. Whilst the Bank has the required OpRisk loss data to migrate to the Advanced Measurement Approach, it is mindful of investing in the additional resources required especially as the Central Bank of Nigeria has recommended the Basic Indicator Approach for all banks in Nigeria. The Estimated OpRisk Capital Charge is reported to the Board and Management for guidance in Capital Planning and decision making.
Operational Risk Reporting – Monthly, quarterly, and annual reports highlighting key operational risks identified are circulated to relevant stakeholders for awareness and timely implementation of mitigation strategies. Reports are also generated and circulated on a need-basis. To aid timely and comprehensive reporting of prevalent OpRisk exposures in the Bank, an OpRisk application – OFSAA, has been acquired by the Bank, and has been successfully implemented to aid
Regulatory Requirements under IFRS Guaranty Trust Bank and Subsidiary Companies
324
data collation and information gathering, analysis, escalation and reporting of key OpRisk incidents or emerging trends observed.
Operational Risk Management Philosophy and Principles
Governance Structure
The Board through its Board Risk Committee (BRC) oversees the operational risk function in the Bank. It ensures that the OpRisk policy is robust and provides a framework on the Bank’s OpRisk profile and limits. It also determines the adequacy and completeness of the Bank’s risk detection, and measurement systems, assesses the adequacy of risk mitigants, reviews and approves contingency plans for Specific Risks and lays down the principles on how operational risk incidents are to be identified, assessed, controlled, monitored and measured. The BRC reviews OpRisk Reports on a quarterly basis.
The Management Risk Committee monitors the activities of OpRisk and approves key decisions made before presentation to the Board. It ensures the implementation of the guiding OpRisk framework bank-wide, and ensures that all departments in the Bank are fully aware of the risks embedded in respective process flows and business activities.
All process owners are responsible for the day-to-day management of OpRisks prevalent in
respective Departments, Groups, Divisions and Regions of the Bank.
The Internal Audit function conducts independent reviews on the implementation of OpRisk Policies and Procedures bank-wide.
Approach to Managing OpRisk
Guaranty Trust Bank adopts operational risk procedures and practices that are “fit for purpose” and will increase the efficiency and effectiveness of the bank's resources, minimise losses and utilize opportunities.
This outlook embeds OpRisk practices in the bank's day-to-day business activities.
It also aligns with the Bank's Operational Risk Management framework with sound practices recommended by various local and globally-accepted regulatory agencies such as Basel II Accord's "Sound Practices for the Management and Supervision of Operational Risk", Committee of Sponsoring Organisations (COSO) / Sarbanes-Oxley (SOX) standards, and some internationally accepted British Standards such as the BS 25999 for Business Continuity Management.

Regulatory Requirements under IFRS Guaranty Trust Bank and Subsidiary Companies
325
Principles
Operational risks inherent in all products, activities, processes and systems are assessed periodically for timely identification of new risks and trending of prevalent risks. The Bank ensures that before any new products, processes, activities and systems are introduced or undertaken, the operational risks inherent are assessed and likely risks mitigated.
In accordance with this, the Bank ensures regular monitoring of its operational risk profile and material exposure to losses.
Pertinent information is reported regularly to Senior Management and the Board to ensure proactive management of operational risk bankwide.
Furthermore, the Bank’s Business Continuity Plan outlines the Bank’s requirements for contingency
and business continuity procedures to ensure its ability to operate on an ongoing basis and limit losses in the event of severe business disruption.
Treatment of Operational Risks
The OpRisk identification and assessment process provides a guide on the decision-making process for the extent and nature of risk treatment to be employed by the Bank. In line with best practices, the cost of risk treatments introduced must not exceed the reward.
The following comprise the OpRisk treatments adopted by the Bank: Risk Acceptance and Reduction: The Bank accepts the risk because the reward of engaging in
the business activity far outweighs the cost of mitigating the risk. Residual risks retained by the business after deploying suitable mitigants are accepted
Risk Transfer (Insurance): This involves another party or parties bearing the risk, by mutual consent. Relationships are guided by the use of contracts and insurance arrangements
Risk Sharing (Outsourcing): Risk is shared with other parties that provide expert solutions required to mitigate risk or reduce risk burden whether operationally or financially
Risk Avoidance: Requires discontinuance of the business activity that gives rise to the risk Strategy Risk Management
Strategic Risk Management is the process for identifying, assessing and managing risks and uncertainties, affected by internal and external events or scenarios, that could inhibit the Bank’s ability to achieve its strategy and strategic objectives with the ultimate goal of creating and protecting shareholder and stakeholder value. In Guaranty Trust Bank, it is also regarded as the possibility that the Bank’s strategy may be inappropriate to support its long-term corporate goals due to the inadequacy of its strategic planning and/or decision-making
Regulatory Requirements under IFRS Guaranty Trust Bank and Subsidiary Companies
326
process or the inadequate implementation of such strategies. This could include the risk that the strategy is unclear, clear but not viable or clear and viable but badly implemented, or strategy failure due to unexpected circumstances. A specialized template for monitoring Strategic Risk is deployed for tracking key business activities designed
or defined by the Bank to monitor performance in the achievement of its strategic intent in the short,
medium and long term.
Reputational Risk Management
Guaranty Trust Bank considers Reputational Risk to be the current and prospective adverse impact on
earnings and capital arising from negative public opinion. It measures the change in perception of the Bank
by its stakeholders. It is linked with customers’ expectations regarding the Bank’s ability to conduct business
securely and responsibly.
A detailed template with internal and external factors that might impact the Bank adversely is used to
monitor the Bank’s exposure to reputational risk. All adverse trends identified are reported to relevant
stakeholders for timely redress.
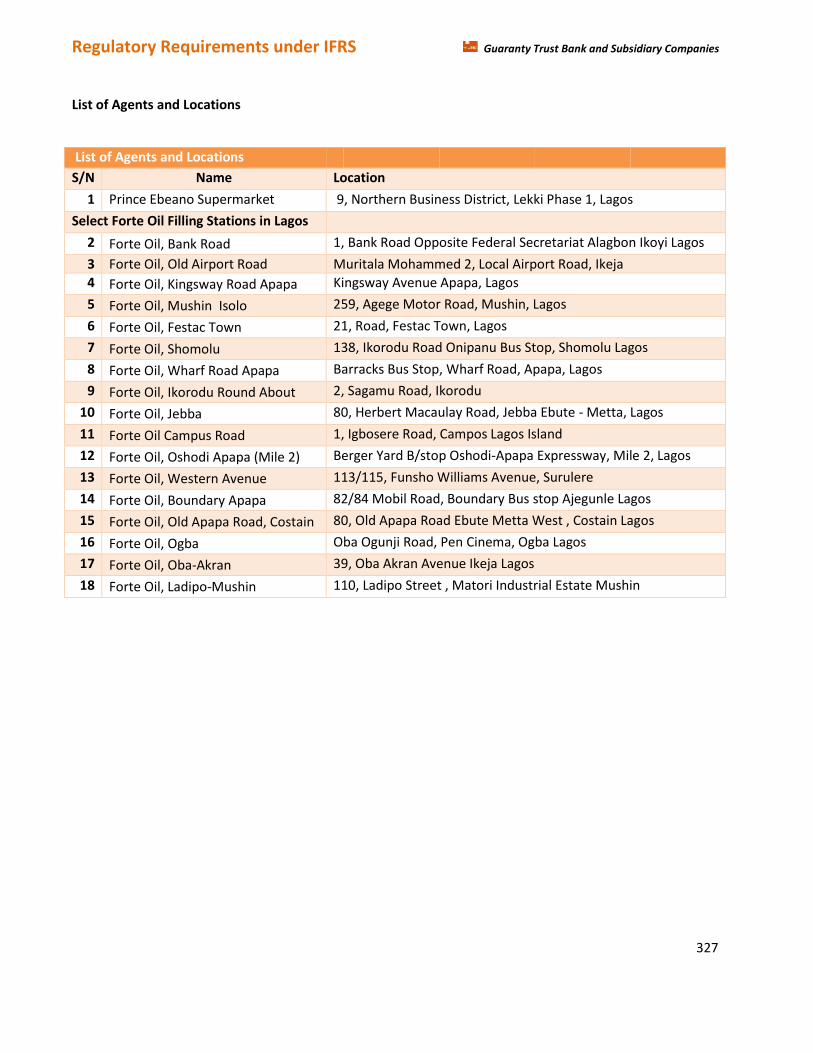
Regulatory Requirements under IFRS Guaranty Trust Bank and Subsidiary Companies
327
List of Agents and Locations
List of Agents and Locations
S/N Name Location
1 Prince Ebeano Supermarket 9, Northern Business District, Lekki Phase 1, Lagos
Select Forte Oil Filling Stations in Lagos
2 Forte Oil, Bank Road 1, Bank Road Opposite Federal Secretariat Alagbon Ikoyi Lagos
3 Forte Oil, Old Airport Road Muritala Mohammed 2, Local Airport Road, Ikeja
4 Forte Oil, Kingsway Road Apapa Kingsway Avenue Apapa, Lagos
5 Forte Oil, Mushin Isolo 259, Agege Motor Road, Mushin, Lagos
6 Forte Oil, Festac Town 21, Road, Festac Town, Lagos
7 Forte Oil, Shomolu 138, Ikorodu Road Onipanu Bus Stop, Shomolu Lagos
8 Forte Oil, Wharf Road Apapa Barracks Bus Stop, Wharf Road, Apapa, Lagos
9 Forte Oil, Ikorodu Round About 2, Sagamu Road, Ikorodu
10 Forte Oil, Jebba 80, Herbert Macaulay Road, Jebba Ebute - Metta, Lagos
11 Forte Oil Campus Road 1, Igbosere Road, Campos Lagos Island
12 Forte Oil, Oshodi Apapa (Mile 2) Berger Yard B/stop Oshodi-Apapa Expressway, Mile 2, Lagos
13 Forte Oil, Western Avenue 113/115, Funsho Williams Avenue, Surulere
14 Forte Oil, Boundary Apapa 82/84 Mobil Road, Boundary Bus stop Ajegunle Lagos
15 Forte Oil, Old Apapa Road, Costain 80, Old Apapa Road Ebute Metta West , Costain Lagos
16 Forte Oil, Ogba Oba Ogunji Road, Pen Cinema, Ogba Lagos
17 Forte Oil, Oba-Akran 39, Oba Akran Avenue Ikeja Lagos
18 Forte Oil, Ladipo-Mushin 110, Ladipo Street , Matori Industrial Estate Mushin
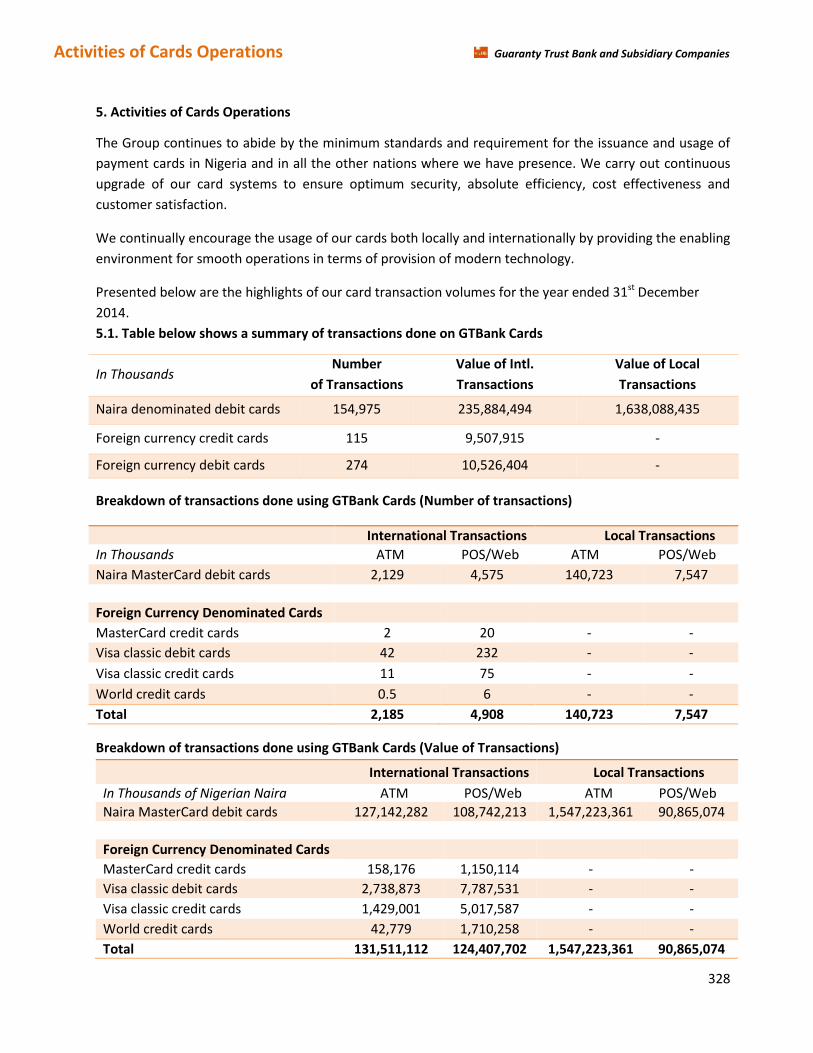
Activities of Cards Operations Guaranty Trust Bank and Subsidiary Companies
328
5. Activities of Cards Operations
The Group continues to abide by the minimum standards and requirement for the issuance and usage of
payment cards in Nigeria and in all the other nations where we have presence. We carry out continuous
upgrade of our card systems to ensure optimum security, absolute efficiency, cost effectiveness and
customer satisfaction.
We continually encourage the usage of our cards both locally and internationally by providing the enabling
environment for smooth operations in terms of provision of modern technology.
Presented below are the highlights of our card transaction volumes for the year ended 31st December
2014.
5.1. Table below shows a summary of transactions done on GTBank Cards
In Thousands Number
of Transactions
Value of Intl.
Transactions
Value of Local
Transactions
Naira denominated debit cards 154,975 235,884,494 1,638,088,435
Foreign currency credit cards 115 9,507,915 -
Foreign currency debit cards 274 10,526,404 -
Breakdown of transactions done using GTBank Cards (Number of transactions)
International Transactions Local Transactions
In Thousands ATM POS/Web ATM POS/Web
Naira MasterCard debit cards 2,129 4,575 140,723 7,547
Foreign Currency Denominated Cards
MasterCard credit cards 2 20 - -
Visa classic debit cards 42 232 - -
Visa classic credit cards 11 75 - -
World credit cards 0.5 6 - -
Total 2,185 4,908 140,723 7,547
Breakdown of transactions done using GTBank Cards (Value of Transactions)
International Transactions Local Transactions
In Thousands of Nigerian Naira ATM POS/Web ATM POS/Web
Naira MasterCard debit cards 127,142,282 108,742,213 1,547,223,361 90,865,074
Foreign Currency Denominated Cards
MasterCard credit cards 158,176 1,150,114 - -
Visa classic debit cards 2,738,873 7,787,531 - -
Visa classic credit cards 1,429,001 5,017,587 - -
World credit cards 42,779 1,710,258 - -
Total 131,511,112 124,407,702 1,547,223,361 90,865,074

Activities of Cards Operations Guaranty Trust Bank and Subsidiary Companies
329
5.2 Type of customers’ complaints and remedial measures taken
COMPLAINTS CATEGORY OF
COMPLAINT
REASONS REMEDIAL MEASURES
Secure Code/ Online Registration (Required for Card Safety and Fraud Prevention)
Inability to generate secure code.
Wrong Input of Secure code.
Card Activation Code not uploaded.
Redesign of the Secure Code Platform on Internet Banking. Daily Reconciliation of
activation code records.
Commenced development of
dynamic 3D authentication
system
Settlement Issues
with Card
Transactions.
Debited and Blocked
Funds
Funds not released
after settlement of
transaction.
Implementation of in-house transaction processing. Daily reconciliation of settled
transactions
Dispense Error Cash Not Dispensed Cash not presented
due to network
issues.
Implement Acquirer Initiated
Refunds
Declined
transactions due to
Network
fluctuations from
Third Party
Processors
Declined
Transactions
Network
Fluctuation
Implementation of in-house transaction processing. Continue to engage Technology for improved network up-time.
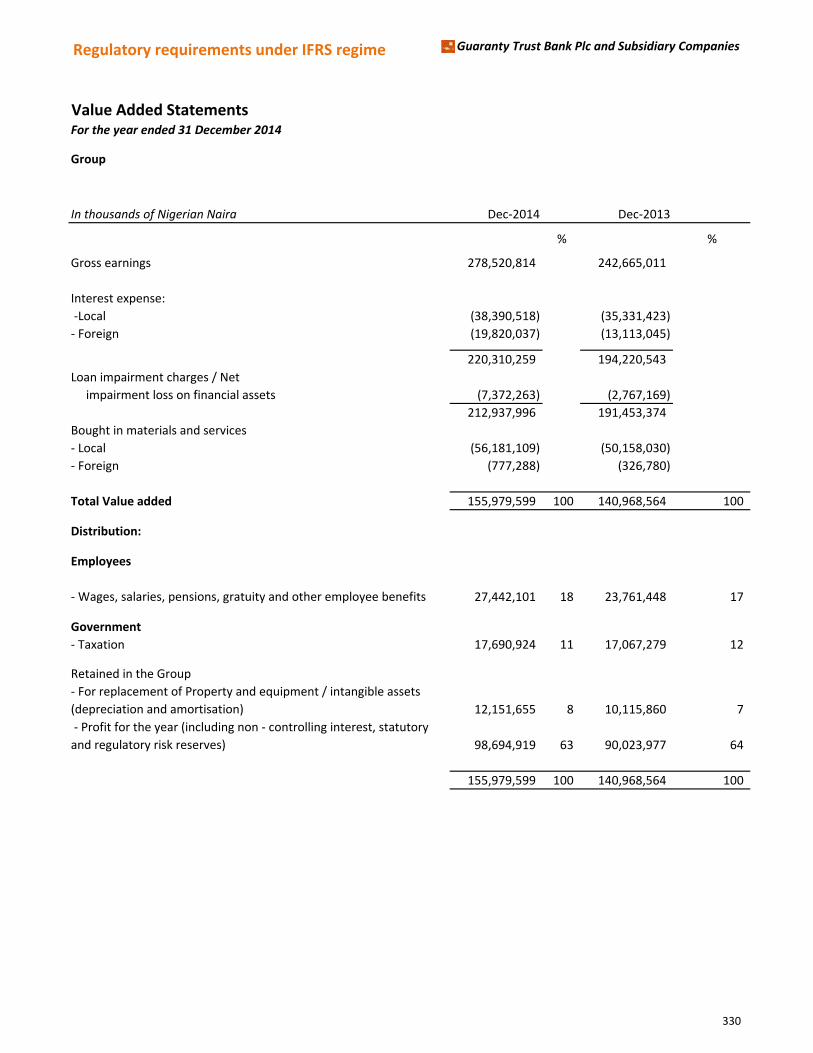
Regulatory requirements under IFRS regime Guaranty Trust Bank Plc and Subsidiary Companies
Value Added Statements For the year ended 31 December 2014
Group
In thousands of Nigerian Naira Dec-2014 Dec-2013
% %
Gross earnings 278,520,814 242,665,011
Interest expense:
-Local (38,390,518) (35,331,423)
- Foreign (19,820,037) (13,113,045)
220,310,259 194,220,543
Loan impairment charges / Net
impairment loss on financial assets (7,372,263) (2,767,169)
212,937,996 191,453,374
Bought in materials and services
- Local (56,181,109) (50,158,030)
- Foreign (777,288) (326,780)
Total Value added 155,979,599 100 140,968,564 100
Distribution:
Employees
- Wages, salaries, pensions, gratuity and other employee benefits 27,442,101 18 23,761,448 17
Government
- Taxation 17,690,924 11 17,067,279 12
Retained in the Group
- For replacement of Property and equipment / intangible assets
(depreciation and amortisation) 12,151,655 8 10,115,860 7
- Profit for the year (including non - controlling interest, statutory
and regulatory risk reserves) 98,694,919 63 90,023,977 64
155,979,599 100 140,968,564 100
330

Regulatory requirements under IFRS regime Guaranty Trust Bank Plc and Subsidiary Companies
Value Added Statements For the period ended 31 December 2014
Parent
In thousands of Nigerian Naira Dec-2014 Dec-2013
% %
Gross earnings 249,007,051 221,600,284
Interest expense:
-Local (38,361,555) (35,323,994)
- Foreign (12,923,889) (9,251,958)
197,721,607 177,024,332
Loan impairment charges / Net
impairment loss on financial assets (6,458,104) (2,794,482)
191,263,503 174,229,850
Bought in materials and services
- Local (48,491,646) (44,542,876)
- Foreign (777,288) (326,780)
Total Value added 141,994,569 100 129,360,194 100
Distribution:
Employees
- Wages, salaries, pensions, gratuity and other employee benefits 21,036,543 15 19,625,269 15
Government
- Taxation 16,936,247 12 14,916,219 12
Retained in the Bank
- For replacement of Property and equipment / intangible assets
(depreciation and amortisation) 10,590,175 7 9,273,196 6
- Profit for the year (including statutory and regulatory risk reserves) 93,431,604 66 85,545,510 67
141,994,569 100 129,360,194 100
331
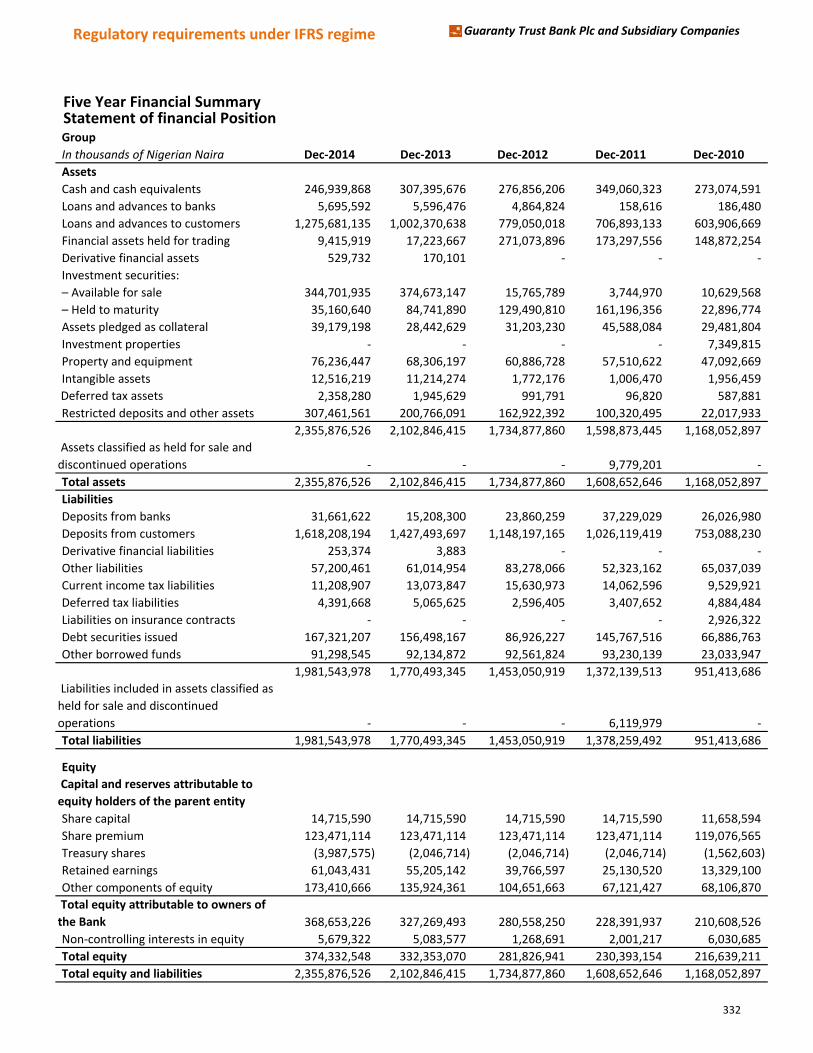
Regulatory requirements under IFRS regime Guaranty Trust Bank Plc and Subsidiary Companies
Five Year Financial SummaryStatement of financial PositionGroup
In thousands of Nigerian Naira Dec-2014 Dec-2013 Dec-2012 Dec-2011 Dec-2010
Assets
Cash and cash equivalents 246,939,868 307,395,676 276,856,206 349,060,323 273,074,591
Loans and advances to banks 5,695,592 5,596,476 4,864,824 158,616 186,480
Loans and advances to customers 1,275,681,135 1,002,370,638 779,050,018 706,893,133 603,906,669
Financial assets held for trading 9,415,919 17,223,667 271,073,896 173,297,556 148,872,254
Derivative financial assets 529,732 170,101 - - -
Investment securities:
– Available for sale 344,701,935 374,673,147 15,765,789 3,744,970 10,629,568
– Held to maturity 35,160,640 84,741,890 129,490,810 161,196,356 22,896,774
Assets pledged as collateral 39,179,198 28,442,629 31,203,230 45,588,084 29,481,804
Investment properties - - - - 7,349,815
Property and equipment 76,236,447 68,306,197 60,886,728 57,510,622 47,092,669
Intangible assets 12,516,219 11,214,274 1,772,176 1,006,470 1,956,459
Deferred tax assets 2,358,280 1,945,629 991,791 96,820 587,881
Restricted deposits and other assets 307,461,561 200,766,091 162,922,392 100,320,495 22,017,933
2,355,876,526 2,102,846,415 1,734,877,860 1,598,873,445 1,168,052,897
Assets classified as held for sale and
discontinued operations - - - 9,779,201 -
Total assets 2,355,876,526 2,102,846,415 1,734,877,860 1,608,652,646 1,168,052,897
Liabilities
Deposits from banks 31,661,622 15,208,300 23,860,259 37,229,029 26,026,980
Deposits from customers 1,618,208,194 1,427,493,697 1,148,197,165 1,026,119,419 753,088,230
Derivative financial liabilities 253,374 3,883 - - -
Other liabilities 57,200,461 61,014,954 83,278,066 52,323,162 65,037,039
Current income tax liabilities 11,208,907 13,073,847 15,630,973 14,062,596 9,529,921
Deferred tax liabilities 4,391,668 5,065,625 2,596,405 3,407,652 4,884,484
Liabilities on insurance contracts - - - - 2,926,322
Debt securities issued 167,321,207 156,498,167 86,926,227 145,767,516 66,886,763
Other borrowed funds 91,298,545 92,134,872 92,561,824 93,230,139 23,033,947
1,981,543,978 1,770,493,345 1,453,050,919 1,372,139,513 951,413,686
Liabilities included in assets classified as
held for sale and discontinued
operations - - - 6,119,979 -
Total liabilities 1,981,543,978 1,770,493,345 1,453,050,919 1,378,259,492 951,413,686
Equity
Capital and reserves attributable to
equity holders of the parent entity
Share capital 14,715,590 14,715,590 14,715,590 14,715,590 11,658,594
Share premium 123,471,114 123,471,114 123,471,114 123,471,114 119,076,565
Treasury shares (3,987,575) (2,046,714) (2,046,714) (2,046,714) (1,562,603)
Retained earnings 61,043,431 55,205,142 39,766,597 25,130,520 13,329,100
Other components of equity 173,410,666 135,924,361 104,651,663 67,121,427 68,106,870
Total equity attributable to owners of
the Bank 368,653,226 327,269,493 280,558,250 228,391,937 210,608,526
Non-controlling interests in equity 5,679,322 5,083,577 1,268,691 2,001,217 6,030,685
Total equity 374,332,548 332,353,070 281,826,941 230,393,154 216,639,211
Total equity and liabilities 2,355,876,526 2,102,846,415 1,734,877,860 1,608,652,646 1,168,052,897
332
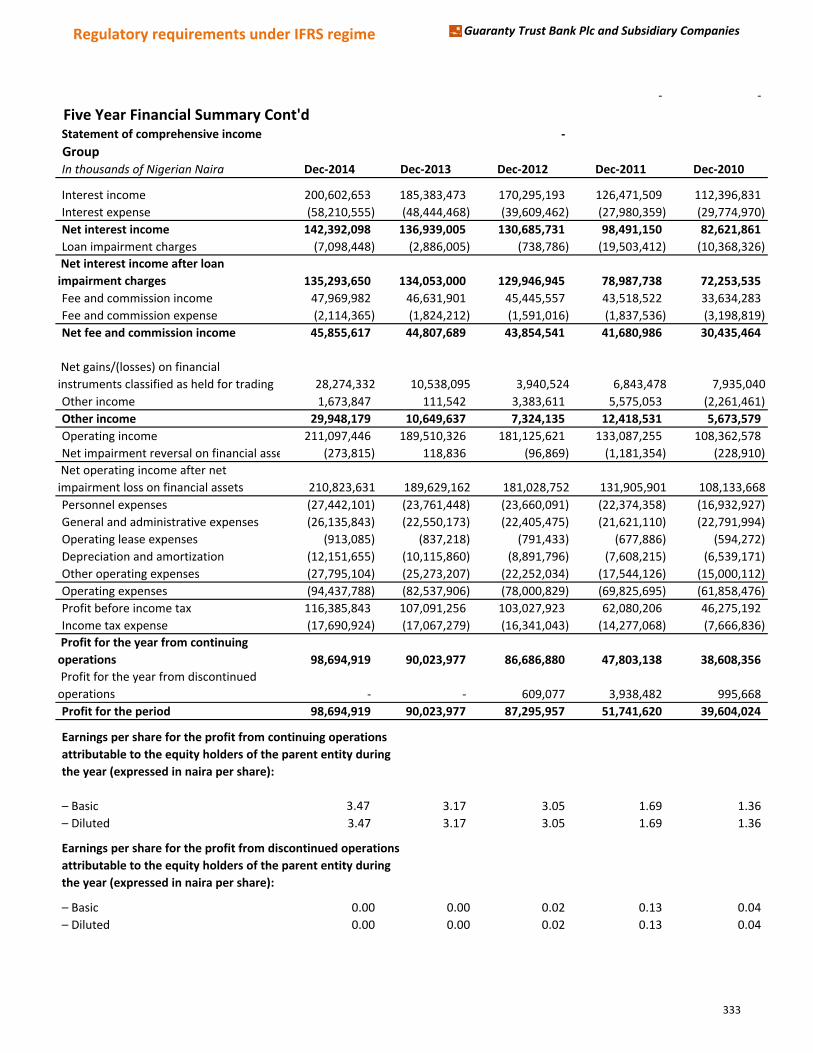
Regulatory requirements under IFRS regime Guaranty Trust Bank Plc and Subsidiary Companies
- - - - -
Five Year Financial Summary Cont'dStatement of comprehensive income -
Group In thousands of Nigerian Naira Dec-2014 Dec-2013 Dec-2012 Dec-2011 Dec-2010
Interest income 200,602,653 185,383,473 170,295,193 126,471,509 112,396,831
Interest expense (58,210,555) (48,444,468) (39,609,462) (27,980,359) (29,774,970)
Net interest income 142,392,098 136,939,005 130,685,731 98,491,150 82,621,861
Loan impairment charges (7,098,448) (2,886,005) (738,786) (19,503,412) (10,368,326)
Net interest income after loan
impairment charges 135,293,650 134,053,000 129,946,945 78,987,738 72,253,535
Fee and commission income 47,969,982 46,631,901 45,445,557 43,518,522 33,634,283
Fee and commission expense (2,114,365) (1,824,212) (1,591,016) (1,837,536) (3,198,819)
Net fee and commission income 45,855,617 44,807,689 43,854,541 41,680,986 30,435,464
Net gains/(losses) on financial
instruments classified as held for trading 28,274,332 10,538,095 3,940,524 6,843,478 7,935,040
Other income 1,673,847 111,542 3,383,611 5,575,053 (2,261,461)
Other income 29,948,179 10,649,637 7,324,135 12,418,531 5,673,579
Operating income 211,097,446 189,510,326 181,125,621 133,087,255 108,362,578
Net impairment reversal on financial assets (273,815) 118,836 (96,869) (1,181,354) (228,910)
Net operating income after net
impairment loss on financial assets 210,823,631 189,629,162 181,028,752 131,905,901 108,133,668
Personnel expenses (27,442,101) (23,761,448) (23,660,091) (22,374,358) (16,932,927)
General and administrative expenses (26,135,843) (22,550,173) (22,405,475) (21,621,110) (22,791,994)
Operating lease expenses (913,085) (837,218) (791,433) (677,886) (594,272)
Depreciation and amortization (12,151,655) (10,115,860) (8,891,796) (7,608,215) (6,539,171)
Other operating expenses (27,795,104) (25,273,207) (22,252,034) (17,544,126) (15,000,112)
Operating expenses (94,437,788) (82,537,906) (78,000,829) (69,825,695) (61,858,476)
Profit before income tax 116,385,843 107,091,256 103,027,923 62,080,206 46,275,192
Income tax expense (17,690,924) (17,067,279) (16,341,043) (14,277,068) (7,666,836)
Profit for the year from continuing
operations 98,694,919 90,023,977 86,686,880 47,803,138 38,608,356
Profit for the year from discontinued
operations - - 609,077 3,938,482 995,668
Profit for the period 98,694,919 90,023,977 87,295,957 51,741,620 39,604,024
Earnings per share for the profit from continuing operations
attributable to the equity holders of the parent entity during
the year (expressed in naira per share):
– Basic 3.47 3.17 3.05 1.69 1.36
– Diluted 3.47 3.17 3.05 1.69 1.36
Earnings per share for the profit from discontinued operations
attributable to the equity holders of the parent entity during
the year (expressed in naira per share):
– Basic 0.00 0.00 0.02 0.13 0.04
– Diluted 0.00 0.00 0.02 0.13 0.04
333
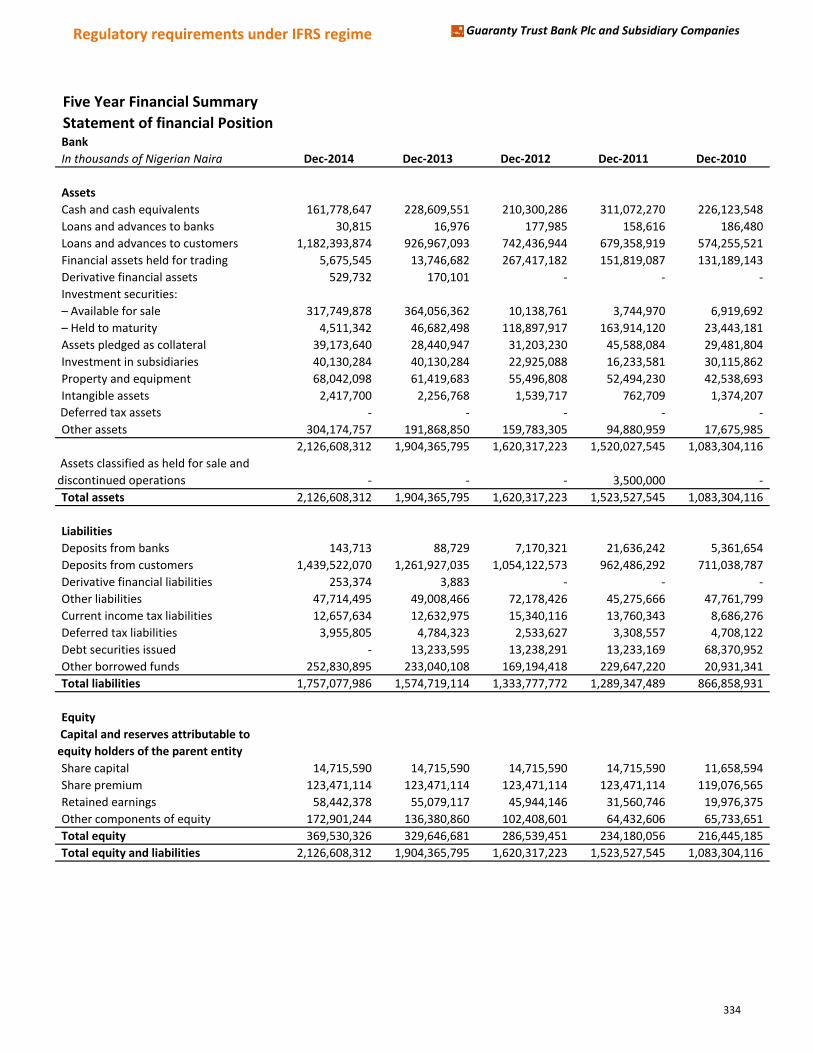
Regulatory requirements under IFRS regime Guaranty Trust Bank Plc and Subsidiary Companies
Five Year Financial Summary
Statement of financial PositionBank
In thousands of Nigerian Naira Dec-2014 Dec-2013 Dec-2012 Dec-2011 Dec-2010
Assets
Cash and cash equivalents 161,778,647 228,609,551 210,300,286 311,072,270 226,123,548
Loans and advances to banks 30,815 16,976 177,985 158,616 186,480
Loans and advances to customers 1,182,393,874 926,967,093 742,436,944 679,358,919 574,255,521
Financial assets held for trading 5,675,545 13,746,682 267,417,182 151,819,087 131,189,143
Derivative financial assets 529,732 170,101 - - -
Investment securities:
– Available for sale 317,749,878 364,056,362 10,138,761 3,744,970 6,919,692
– Held to maturity 4,511,342 46,682,498 118,897,917 163,914,120 23,443,181
Assets pledged as collateral 39,173,640 28,440,947 31,203,230 45,588,084 29,481,804
Investment in subsidiaries 40,130,284 40,130,284 22,925,088 16,233,581 30,115,862
Property and equipment 68,042,098 61,419,683 55,496,808 52,494,230 42,538,693
Intangible assets 2,417,700 2,256,768 1,539,717 762,709 1,374,207
Deferred tax assets - - - - -
Other assets 304,174,757 191,868,850 159,783,305 94,880,959 17,675,985
2,126,608,312 1,904,365,795 1,620,317,223 1,520,027,545 1,083,304,116
Assets classified as held for sale and
discontinued operations - - - 3,500,000 -
Total assets 2,126,608,312 1,904,365,795 1,620,317,223 1,523,527,545 1,083,304,116
Liabilities
Deposits from banks 143,713 88,729 7,170,321 21,636,242 5,361,654
Deposits from customers 1,439,522,070 1,261,927,035 1,054,122,573 962,486,292 711,038,787
Derivative financial liabilities 253,374 3,883 - - -
Other liabilities 47,714,495 49,008,466 72,178,426 45,275,666 47,761,799
Current income tax liabilities 12,657,634 12,632,975 15,340,116 13,760,343 8,686,276
Deferred tax liabilities 3,955,805 4,784,323 2,533,627 3,308,557 4,708,122
Debt securities issued - 13,233,595 13,238,291 13,233,169 68,370,952
Other borrowed funds 252,830,895 233,040,108 169,194,418 229,647,220 20,931,341
Total liabilities 1,757,077,986 1,574,719,114 1,333,777,772 1,289,347,489 866,858,931
Equity
Capital and reserves attributable to
equity holders of the parent entity
Share capital 14,715,590 14,715,590 14,715,590 14,715,590 11,658,594
Share premium 123,471,114 123,471,114 123,471,114 123,471,114 119,076,565
Retained earnings 58,442,378 55,079,117 45,944,146 31,560,746 19,976,375
Other components of equity 172,901,244 136,380,860 102,408,601 64,432,606 65,733,651
Total equity 369,530,326 329,646,681 286,539,451 234,180,056 216,445,185
Total equity and liabilities 2,126,608,312 1,904,365,795 1,620,317,223 1,523,527,545 1,083,304,116
334
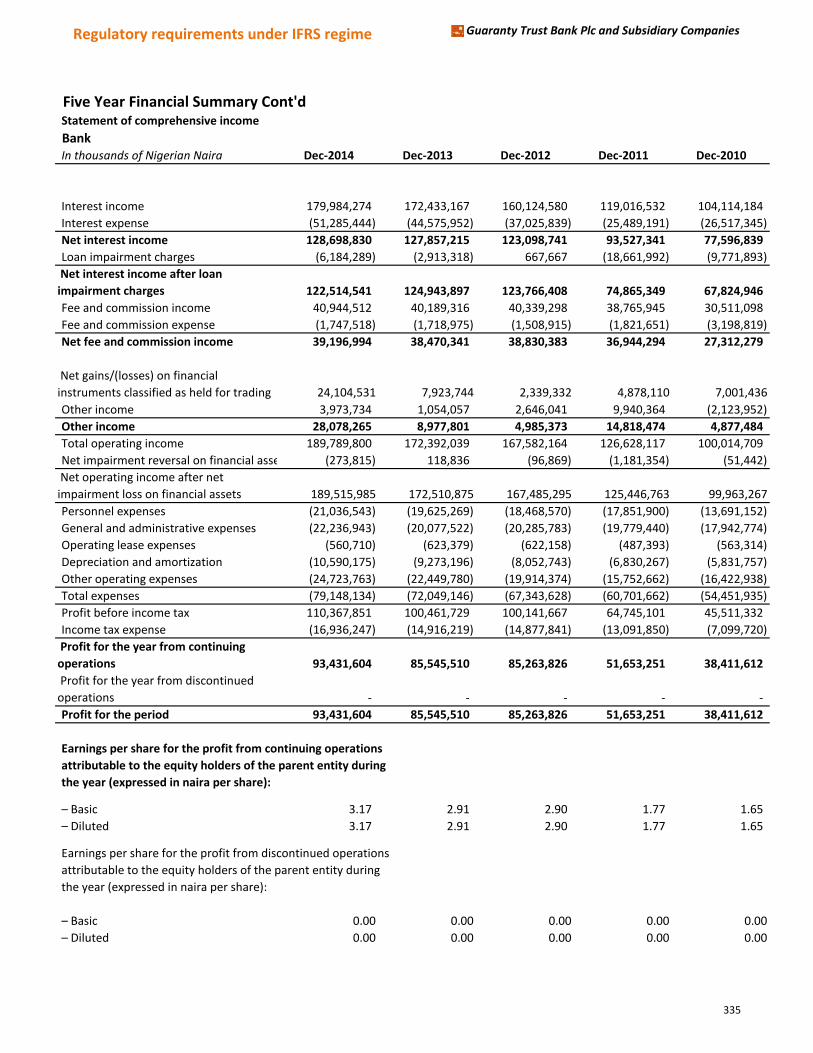
Regulatory requirements under IFRS regime Guaranty Trust Bank Plc and Subsidiary Companies
Five Year Financial Summary Cont'dStatement of comprehensive income
BankIn thousands of Nigerian Naira Dec-2014 Dec-2013 Dec-2012 Dec-2011 Dec-2010
Interest income 179,984,274 172,433,167 160,124,580 119,016,532 104,114,184
Interest expense (51,285,444) (44,575,952) (37,025,839) (25,489,191) (26,517,345)
Net interest income 128,698,830 127,857,215 123,098,741 93,527,341 77,596,839
Loan impairment charges (6,184,289) (2,913,318) 667,667 (18,661,992) (9,771,893)
Net interest income after loan
impairment charges 122,514,541 124,943,897 123,766,408 74,865,349 67,824,946
Fee and commission income 40,944,512 40,189,316 40,339,298 38,765,945 30,511,098
Fee and commission expense (1,747,518) (1,718,975) (1,508,915) (1,821,651) (3,198,819)
Net fee and commission income 39,196,994 38,470,341 38,830,383 36,944,294 27,312,279
Net gains/(losses) on financial
instruments classified as held for trading 24,104,531 7,923,744 2,339,332 4,878,110 7,001,436
Other income 3,973,734 1,054,057 2,646,041 9,940,364 (2,123,952)
Other income 28,078,265 8,977,801 4,985,373 14,818,474 4,877,484
Total operating income 189,789,800 172,392,039 167,582,164 126,628,117 100,014,709
Net impairment reversal on financial assets (273,815) 118,836 (96,869) (1,181,354) (51,442)
Net operating income after net
impairment loss on financial assets 189,515,985 172,510,875 167,485,295 125,446,763 99,963,267
Personnel expenses (21,036,543) (19,625,269) (18,468,570) (17,851,900) (13,691,152)
General and administrative expenses (22,236,943) (20,077,522) (20,285,783) (19,779,440) (17,942,774)
Operating lease expenses (560,710) (623,379) (622,158) (487,393) (563,314)
Depreciation and amortization (10,590,175) (9,273,196) (8,052,743) (6,830,267) (5,831,757)
Other operating expenses (24,723,763) (22,449,780) (19,914,374) (15,752,662) (16,422,938)
Total expenses (79,148,134) (72,049,146) (67,343,628) (60,701,662) (54,451,935)
Profit before income tax 110,367,851 100,461,729 100,141,667 64,745,101 45,511,332
Income tax expense (16,936,247) (14,916,219) (14,877,841) (13,091,850) (7,099,720)
Profit for the year from continuing
operations 93,431,604 85,545,510 85,263,826 51,653,251 38,411,612
Profit for the year from discontinued
operations - - - - -
Profit for the period 93,431,604 85,545,510 85,263,826 51,653,251 38,411,612
Earnings per share for the profit from continuing operations
attributable to the equity holders of the parent entity during
the year (expressed in naira per share):
– Basic 3.17 2.91 2.90 1.77 1.65
– Diluted 3.17 2.91 2.90 1.77 1.65
Earnings per share for the profit from discontinued operations
attributable to the equity holders of the parent entity during
the year (expressed in naira per share):
– Basic 0.00 0.00 0.00 0.00 0.00
– Diluted 0.00 0.00 0.00 0.00 0.00
335

Shareholders Information Guaranty Trust Bank and Subsidiary Companies
336
Share Capitalisation History
YEAR AUTHORISED ISSUED INCREASE CUMULATIVE INCREASE CUMMULATIVE NO. OF SHARES CONSIDERATION 1991 25,000,000 25,000,000 25,000,000 25,000,000 25,000,000 CASH 1992 35,000,000 60,000,000 NIL 25,000,000 25,000,000 NIL 1993 NIL 60,000,000 25,000,000 50,000,000 50,000,000 SCRIP 1994 40,000,000 100,000,000 NIL 50,000,000 50,000,000 NIL 1995 NIL 100,000,000 50,000,000 100,000,000 100,000,000 SCRIP 1996 100,000,000 200,000,000 300,000,000 400,000,000 400,000,000 CASH 1997 300,000,000 500,000,000 600,000,000 1,000,000,000 1,000,000,000 SCRIP 1998 250,000,000 750,000,000 500,000,000 1,500,000,000 1,500,000,000 SCRIP 1999 NIL 750,000,000 NIL 1,500,000,000 1,500,000,000 NIL 2000 NIL 750,000,000 NIL 1,500,000,000 1,500,000,000 NIL 2001 250,000,000 1,000,000,000 500,000,000 2,000,000,000 2,000,000,000 Initial Public Offer 2002 1,000,000,000 2,000,000,000 500,000,000 2,500,000,000 2,500,000,000 SCRIP 2003 NIL 2,000,000,000 500,000,000 3,000,000,000 3,000,000,000 SCRIP 2004 1,000,000,000 3,000,000,000 1,000,000,000 4,000,000,000 4,000,000,000 SCRIP 2004 NIL 3,000,000,000 2,000,000,000 6,000,000,000 6,000,000,000 PUBLIC OFFER 2005 2,000,000,000 5,000,000,000 NIL 6,000,000,000 6,000,000,000 NIL 2006 NIL 5,000,000,000 2,000,000,000 8,000,000,000 8,000,000,000 SCRIP 2007 2,500,000,000 7,500,000,000 2,000,000,000 10,000,000,000 10,000,000,000 SCRIP 2007 NIL 7,500,000,000 3,679,415,650 13,679,415,650 13,679,415,650 GDR Underlying Shares 2008 7,500,000,000 15,000,000,000 1,243,583,241 14,922,998,890 14,922,998,890 SCRIP 2008 NIL 15,000,000,000 3,730,749,723 18,653,748,613 18,653,748,613 SCRIP 2009 NIL 15,000,000,000 4,663,437,153 23,317,185,766 23,317,185,766 SCRIP 2010 15,000,000,000 30,000,000,000 NIL 23,317,185,766 23,317,185,766 NIL 2010 20,000,000,000 50,000,000,000 5,829,296,442 29,146,482,207 29,146,482,207 SCRIP 2011 NIL 50,000,000,000 284,697,017 29,431,179,224 29,431,179,224 IFC Special Placement 2012 NIL 50,000,000,000 NIL 29,431,179,224 29,431,179,224 NIL 2013 NIL 50,000,000,000 NIL 29,431,179,224 29,431,179,224 NIL 2014 NIL 50,000,000,000 NIL 29,431,179,224 29,431,179,224 NIL
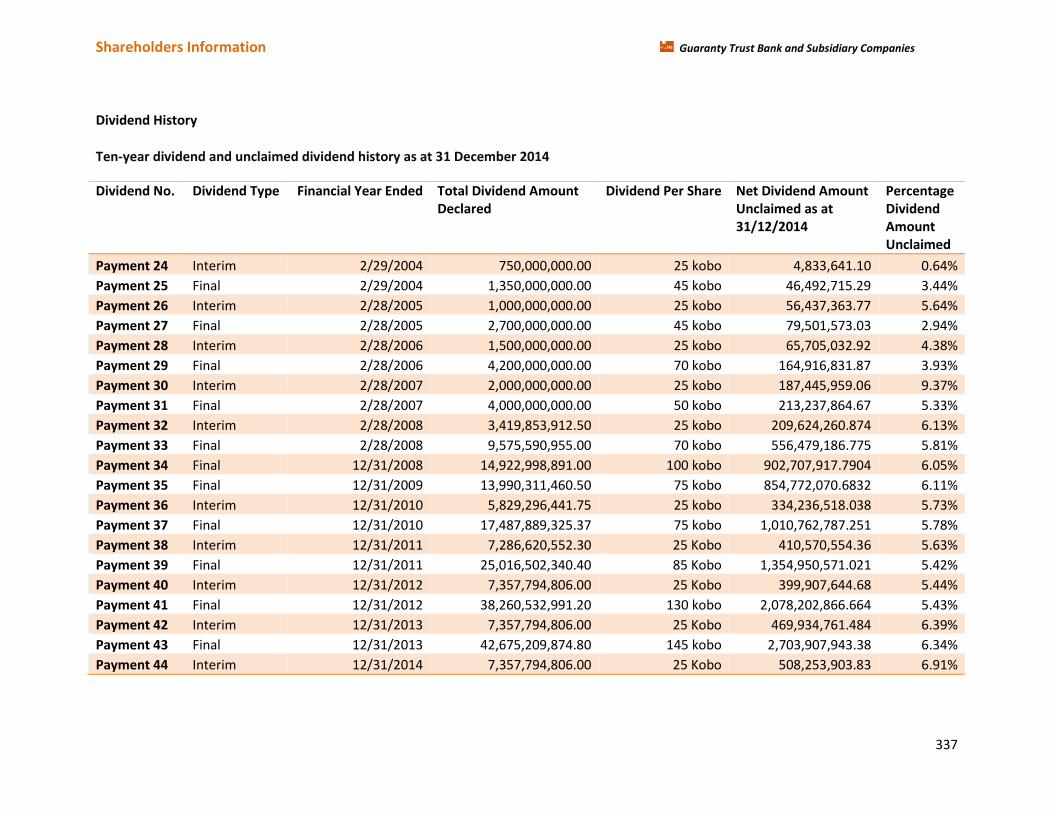
Shareholders Information Guaranty Trust Bank and Subsidiary Companies
337
Dividend History
Ten-year dividend and unclaimed dividend history as at 31 December 2014
Dividend No. Dividend Type Financial Year Ended Total Dividend Amount Declared
Dividend Per Share Net Dividend Amount Unclaimed as at 31/12/2014
Percentage Dividend Amount Unclaimed
Payment 24 Interim 2/29/2004 750,000,000.00 25 kobo 4,833,641.10 0.64%
Payment 25 Final 2/29/2004 1,350,000,000.00 45 kobo 46,492,715.29 3.44%
Payment 26 Interim 2/28/2005 1,000,000,000.00 25 kobo 56,437,363.77 5.64%
Payment 27 Final 2/28/2005 2,700,000,000.00 45 kobo 79,501,573.03 2.94%
Payment 28 Interim 2/28/2006 1,500,000,000.00 25 kobo 65,705,032.92 4.38%
Payment 29 Final 2/28/2006 4,200,000,000.00 70 kobo 164,916,831.87 3.93%
Payment 30 Interim 2/28/2007 2,000,000,000.00 25 kobo 187,445,959.06 9.37%
Payment 31 Final 2/28/2007 4,000,000,000.00 50 kobo 213,237,864.67 5.33%
Payment 32 Interim 2/28/2008 3,419,853,912.50 25 kobo 209,624,260.874 6.13%
Payment 33 Final 2/28/2008 9,575,590,955.00 70 kobo 556,479,186.775 5.81%
Payment 34 Final 12/31/2008 14,922,998,891.00 100 kobo 902,707,917.7904 6.05%
Payment 35 Final 12/31/2009 13,990,311,460.50 75 kobo 854,772,070.6832 6.11%
Payment 36 Interim 12/31/2010 5,829,296,441.75 25 kobo 334,236,518.038 5.73%
Payment 37 Final 12/31/2010 17,487,889,325.37 75 kobo 1,010,762,787.251 5.78%
Payment 38 Interim 12/31/2011 7,286,620,552.30 25 Kobo 410,570,554.36 5.63%
Payment 39 Final 12/31/2011 25,016,502,340.40 85 Kobo 1,354,950,571.021 5.42%
Payment 40 Interim 12/31/2012 7,357,794,806.00 25 Kobo 399,907,644.68 5.44%
Payment 41 Final 12/31/2012 38,260,532,991.20 130 kobo 2,078,202,866.664 5.43%
Payment 42 Interim 12/31/2013 7,357,794,806.00 25 Kobo 469,934,761.484 6.39%
Payment 43 Final 12/31/2013 42,675,209,874.80 145 kobo 2,703,907,943.38 6.34%
Payment 44 Interim 12/31/2014 7,357,794,806.00 25 Kobo 508,253,903.83 6.91%
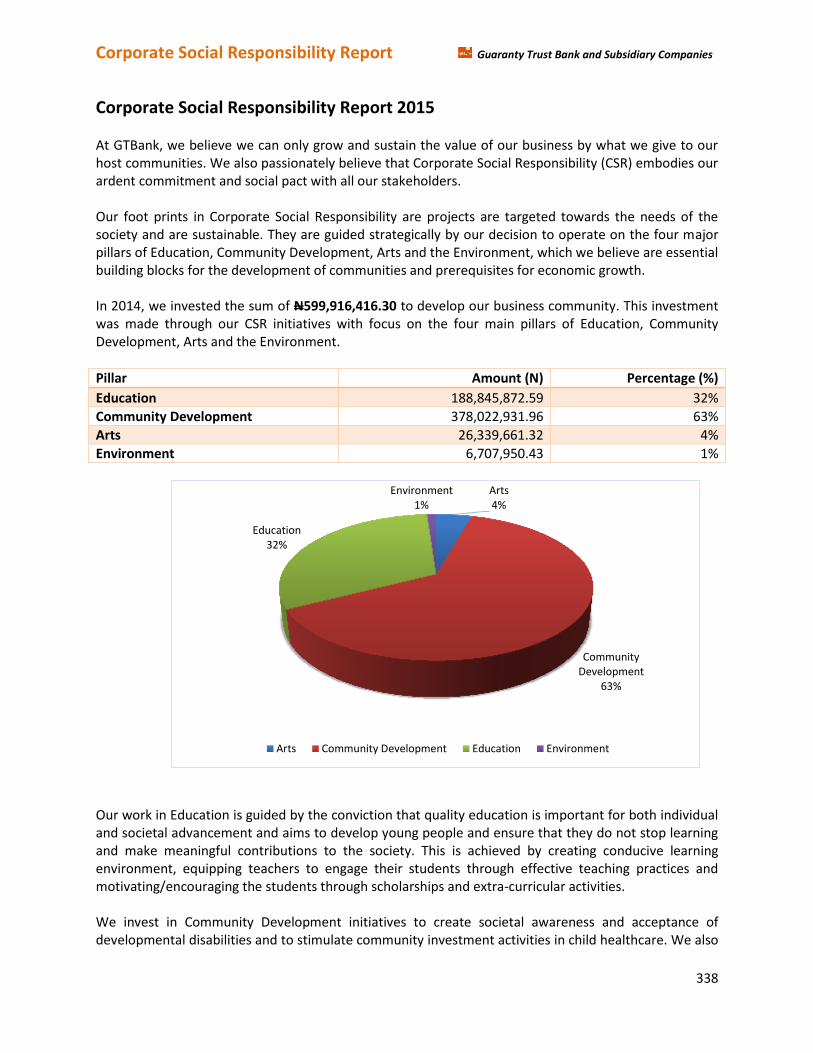
Corporate Social Responsibility Report Guaranty Trust Bank and Subsidiary Companies
338
Corporate Social Responsibility Report 2015
At GTBank, we believe we can only grow and sustain the value of our business by what we give to our host communities. We also passionately believe that Corporate Social Responsibility (CSR) embodies our ardent commitment and social pact with all our stakeholders. Our foot prints in Corporate Social Responsibility are projects are targeted towards the needs of the society and are sustainable. They are guided strategically by our decision to operate on the four major pillars of Education, Community Development, Arts and the Environment, which we believe are essential building blocks for the development of communities and prerequisites for economic growth. In 2014, we invested the sum of N599,916,416.30 to develop our business community. This investment was made through our CSR initiatives with focus on the four main pillars of Education, Community Development, Arts and the Environment.
Pillar Amount (N) Percentage (%)
Education 188,845,872.59 32%
Community Development 378,022,931.96 63%
Arts 26,339,661.32 4%
Environment 6,707,950.43 1%
Our work in Education is guided by the conviction that quality education is important for both individual and societal advancement and aims to develop young people and ensure that they do not stop learning and make meaningful contributions to the society. This is achieved by creating conducive learning environment, equipping teachers to engage their students through effective teaching practices and motivating/encouraging the students through scholarships and extra-curricular activities. We invest in Community Development initiatives to create societal awareness and acceptance of developmental disabilities and to stimulate community investment activities in child healthcare. We also
Arts 4%
Community Development
63%
Education 32%
Environment 1%
Arts Community Development Education Environment

Corporate Social Responsibility Report Guaranty Trust Bank and Subsidiary Companies
339
work with in partnership with Non-Governmental Organizations and charity organizations that share our vision and values, to support victims of natural disasters and other humanitarian issues in the world. We are a strong advocate of the Arts as a means of unlocking personal and professional innovation and creativity. We support Art in all forms which include painting, drama, poetry and music. At its most basic level we buy art work from talented Nigerian artists and display them at our offices and branches to promote the works of indigenous artists. The effect of climate change being felt all over the world with debilitating consequences has called for concerted effort to address environmental issues. We take steps to safeguard our environment by ensuring the sustainable use of our resources.
(1) EDUCATION Highlights for 2014 Adopt-a-school Initiative
Renovated Government Day Secondary School, Bauchi in North East Nigeria. Awarded scholarships, which cover tuition, school uniform and textbooks to 38 students in 6
adopted schools across 5 geo-political zones in Nigeria. Donated 12,000 exercise books to school children on Children’s Day. 612 hours of weekend coaching by GTBank staff through the GTBank Staff Volunteer Program.
Sports Education
Sports Education for 613 schools in South West Nigeria through the Principals Cup and Masters Cup Program.
Cash prize of N10,000,000 to 8 schools (winners of Principals Cup) for facility upgrade Cash prize of N3,200,000 to 3 schools (winners of Masters Cup) for facility upgrade
Other School Support
Donated of 4 desktop computers to the top 2 schools in 2014 SSCE examination Supported extra-curricular activity such as athletics and vocations in schools Donated 1,350,000 optical marker readers forms to 16 universities across Nigeria Cash Prizes of N300,000 to outstanding students in Science and Mathematics in Nigeria.
Education Projects Adopt-a-School Programme: The GTBank Adopt-a-School project is a child focused programme introduced by the Bank in 2004, to improve the quality of public education available to the Nigerian Child. This programme is designed to support schools in high density areas across the nation. There are currently 6 schools across 5 geo-political zones, adopted by the Bank. The programme covers provision and/or upgrade of Infrastructure such as buildings, basic amenities, furniture and beautification of the environment; Capacity building for teachers and Students through trainings, scholarship programme for students, weekend coaching classes and extra-curricular education.

Corporate Social Responsibility Report Guaranty Trust Bank and Subsidiary Companies
340
The scholarship programme (Orange Excellence Scholarship Award) is awarded to the best pupil in all
class categories in all adopted schools. The award covers tuition fees, textbooks, school uniforms and
entrance examination fees for the academic session.
Children’s Day Initiative: This initiative is geared towards the celebration of children on children’s day.
This year, 12,000 Smart Kids Save (SKS) exercise books were distributed to students.
Sports Education through Football Tournaments: We are a major sponsor of sports education in Nigeria
and our interest in supporting sport is borne out of our understanding that sport plays a major role in
the development of life skills.
Our football programme include; The Principals Cup tournament, The Masters Cup (formerly known as Heritage Cup) tournament, The Super Cup tournament, Players Development Programme (known as CAMP GTBank) and Tournament Ambassadors Programme (TAP). These competitions are aimed at actively engaging the youths through sports whilst promoting the values of excellence and fair play. It fosters camaraderie and provides a platform for identifying, nurturing and grooming young and talented players amongst students of Secondary Schools in both male and female categories.
The Principals Cup football tournament: This competition currently runs in Lagos and Ogun and they are in their 6th and 3rd seasons respectively. The sports is for all Secondary Schools in the participating States and is coordinated in partnership with the State Ministry of Youth, Sports & Social development and the Ministry of Education. The winners of Lagos State 2014 Competition are Government Girls Secondary School, Agege and Dairy Farm Senior Secondary School, Agege in the female and male categories respectively while Alamuwa Grammar School, Ado Odo and Remo Divisional High School, Sagamu emerged victorious in the female and male categories in Ogun State.
The Masters Cup football tournament: This tournament which was formerly known as the Heritage Cup tournament, was introduced in 2012 for non-Government managed schools which are under the Lagos State First Generation Colleges Association (LAFGECA). 24 schools participated in the 2014 season and the winners at the finals were Eko Boys High School, Mushin and Queen’s College Yaba in male and female categories respectively.
Other School Support: These are education programmes targeted at other groups that are not under the adopt-a-school category. Projects carried out in 2014 in this category include; Donation of 1,350,000 Optimal Marker Reader (OMR) forms to 16 Universities; Olabisi Onabanjo University, University of Lagos, Lagos State University, Adekunle Ajasin University, Osun State University, University of Ibadan, Imo State University, Abia State University, Nnamdi Azikiwe University, University of Nigeria, Nsukka, Ahmadu Bello University, Bayero University Kano, University of Benin, Kano State University of Science & Technology and Ondo State University of Science & Technology, in Nigeria. The OMR forms are used in conducting general studies and Post-JAMB examinations.
Corporate Social Responsibility Report Guaranty Trust Bank and Subsidiary Companies
341
Financial and material support to schools and special homes is also a critical aspect of other school support.
(2) COMMUNITY DEVELOPMENT Highlights for 2014 Orange Ribbon Initiative
- Trained 1,200 health practitioners, care givers, teachers and parents on the management and care for children living with autism.
- Provided free consultation service for 100 children living with autism. - Strategic partnership with Special Olympics to support intellectually and physically challenged
athletes. Maternal and Child health Initiative
- Staff donation of N1,388,890.00 to support Sickle Cell Anaemia patients across Nigeria. - Support for 40 children of Massey Children Hospital in Lagos. - Supported displaced victims of terrorism in Northern Nigeria.
GTBank Orange Ribbon Initiative: The Orange Ribbon Initiative is an advocacy program designed to support children with developmental disabilities in Nigeria especially Autism Spectrum Disorders (ASD). Our aim is to create awareness about ASD, ensure autism is diagnosed early in children and provide the required support for caregivers, health practitioners, parents, teachers, and the society to help in proper management of ASD.
Our 2014 program involved a series of initiatives. ASD professionals from the United States and the College of Medicine, University of Lagos were available for a 5 day period (24th – 28th March) to give one-on-one consultation to children living with Autism. Also, 2-day seminar (31st March – 1st April) was held at MUSON, to teach and discuss focal and topical areas in the management of autism and demonstrate time tested techniques in areas such as Behaviour Modification, Education, Nutrition, Social support, Assessment and Psychology. A radio talk series ‘Let’s talk Autism’ was also aired on various radio stations to further enlighten the general public. In addition, ASD practitioners that participated at the seminar were offered the opportunity to enroll for an online certificate programme in collaboration with the University of Texas, Arlington. The certificate programme requires the completion of four core courses and a portfolio project and provides ASD practitioners with the introduction, background, aptitude and skills needed to work effectively with this growing ‘special needs’ population. Maternal and Child health Initiative: This targets the Millennium Development Goals 4 (reducing child mortality), 5 (improving maternal health) and 6 (combating HIV, malaria and other diseases). We supported sick children in Massey Children’s Hospital Lagos and victims of terror in Northern Nigeria. Staff Charity Initiative: GTBank Staff have adopted a support for Sickle Cell project under the Staff Charity Initiative, where staff make voluntary donation on 14th February of every year to support this cause.
Corporate Social Responsibility Report Guaranty Trust Bank and Subsidiary Companies
342
(3) ARTS Highlights of 2014
- Strategic partnership with Tate Modern, UK to acquire and showcase the works of African Artist at the Tate Gallery and Deutsche Bank Museum.
- Trained African artists in Lagos, Nigeria on the series of programmes, through the Across the Board Project, to further expose them to the international community and current trends of contemporary art.
GTBank-TATE Partnership: The GTBank and Tate partnership was announced in 2011 to promote the value of African Art and Artists at local and international levels by bringing the works of African artists to the attention of new audiences both in Africa and international market, through a project-lead initiative.
The partnership includes; The creation of a dedicated curatorial post at Tate Modern to focus on African art, an Acquisition Fund to enable the Tate Gallery to enhance its holdings of work by African artists and the ‘Across the Board’ project that enables continuous exchanges between young artists, curators, collectors and cultural institutions in Africa and the rest of the world.
The projects held across four cities (London, Accra, Douala and Lagos) from 2012 to 2014, with each city inspiring the art event in which it is held. The Lagos event held on 18th April, 2014.
(4) ENVIRONMENT Highlights of 2014
- Beautification and conservation of the environment through roundabout adoption in Kano and Lagos
- Adoption of a new roundabout in Sokoto. Beautification and conservation: We take steps to safeguard our environment by ensuring the sustainable use of our resources through our concerted efforts to address environmental issues and take actions such as; Greening i.e planting of flowers to keep the environment as verdant as possible and putting up structures e.g roundabout, to beautify the environment. We also invest in energy efficient solutions as part of our contribution to mitigating the effect of climate change in our environment, through renewable energy and resource efficient ways of conducting our business. Solar Energy is used to power our e-branches and customers are encouraged to adopt the alternative channels such as point of sales (PoS), internet banking, mobile App, Automated Teller Machines (ATMs), to ensure time and energy conservation. The social banking service as well as e-savers accounts are operated through electronic channels and reduces the filling of paper forms and there is a mandatory generator shut down time of 8pm in all branches nationwide to reduce fossil fuel consumption, hence carbon print reduction and transition to a low carbon economy.