gtr9-2-09 flex pli gtr – fe v2.0 ig flex gtr9-ph2 · flex pli gtr v2.0 summary the consortium...
TRANSCRIPT
FLEX PLI GTR – FE v2.0IG FLEX GTR9-PH2
28 March 2012 Robert Kant
GTR9-2-09
FLEX PLI GTR v2.0 Summary� The Consortium responsible for the FLEX-PLI in LS-DYNA,
PAM-CRASH, RADIOSS and ABAQUS code has recently approved and released version 2.0 – Version 2.0 is available through the Humanetics distribution network
� The models have been validated against a well-controlled experimental data set
� Models meet the targets that were set at the start of the project.
GTR9-2-09
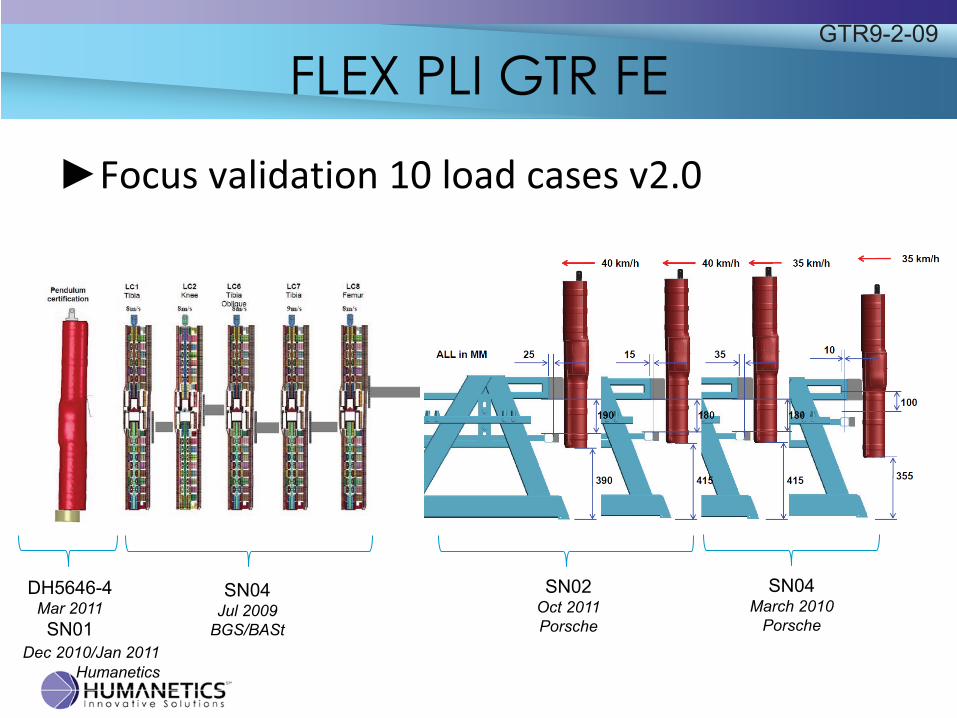
�Focus validation 10 load cases v2.0
FLEX PLI GTR FE
SN04Jul 2009
BGS/BASt
SN04March 2010
Porsche
DH5646-4 Mar 2011SN01
Dec 2010/Jan 2011Humanetics
SN02Oct 2011Porsche
GTR9-2-09
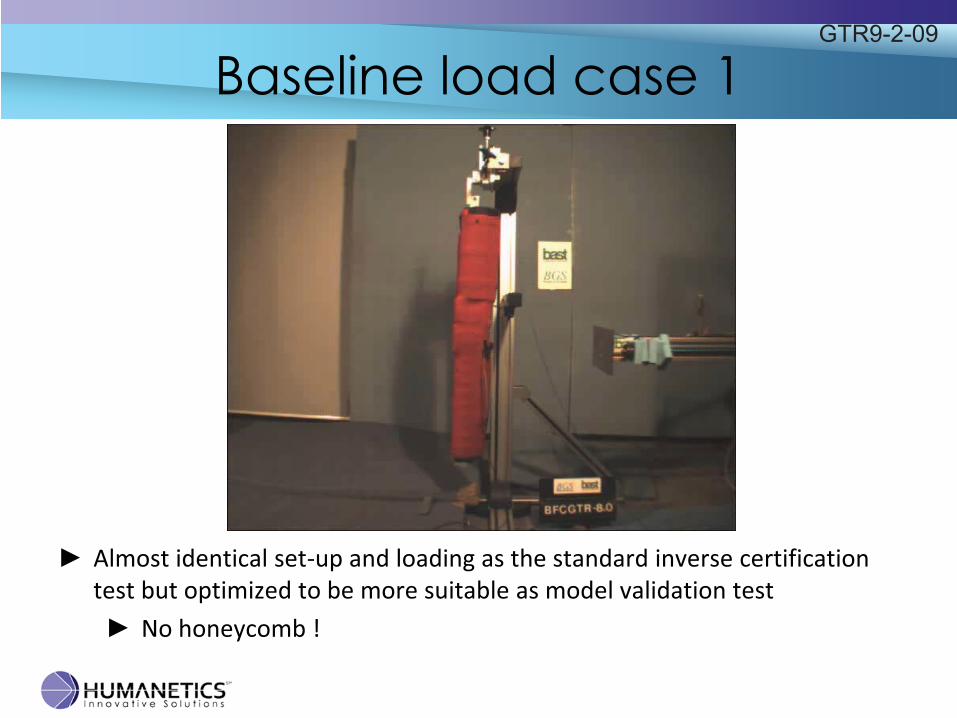
Baseline load case 1
� Almost identical set-up and loading as the standard inverse certification test but optimized to be more suitable as model validation test � No honeycomb !
GTR9-2-09
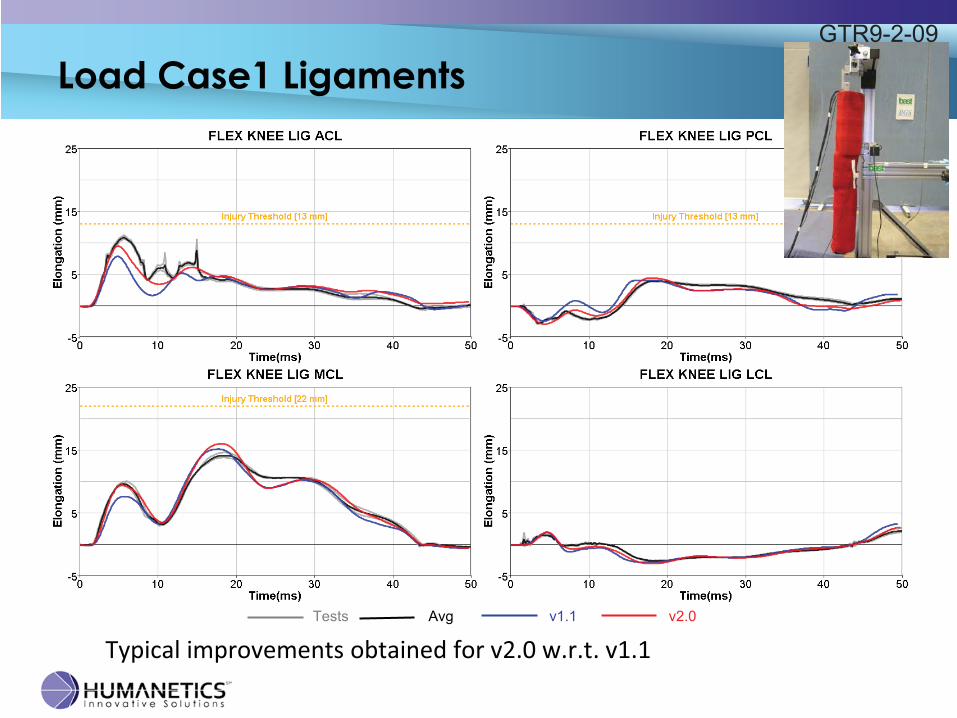
Load Case1 Ligaments
Tests Avg v1.1 v2.0
Typical improvements obtained for v2.0 w.r.t. v1.1
GTR9-2-09
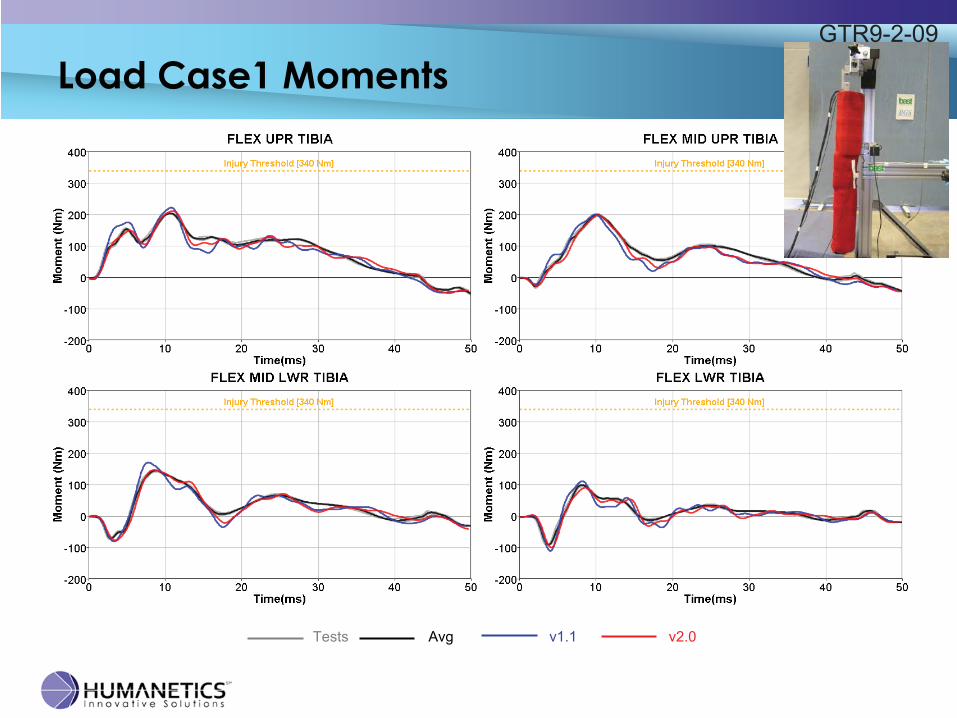
Load Case1 Moments
Tests Avg v1.1 v2.0
GTR9-2-09
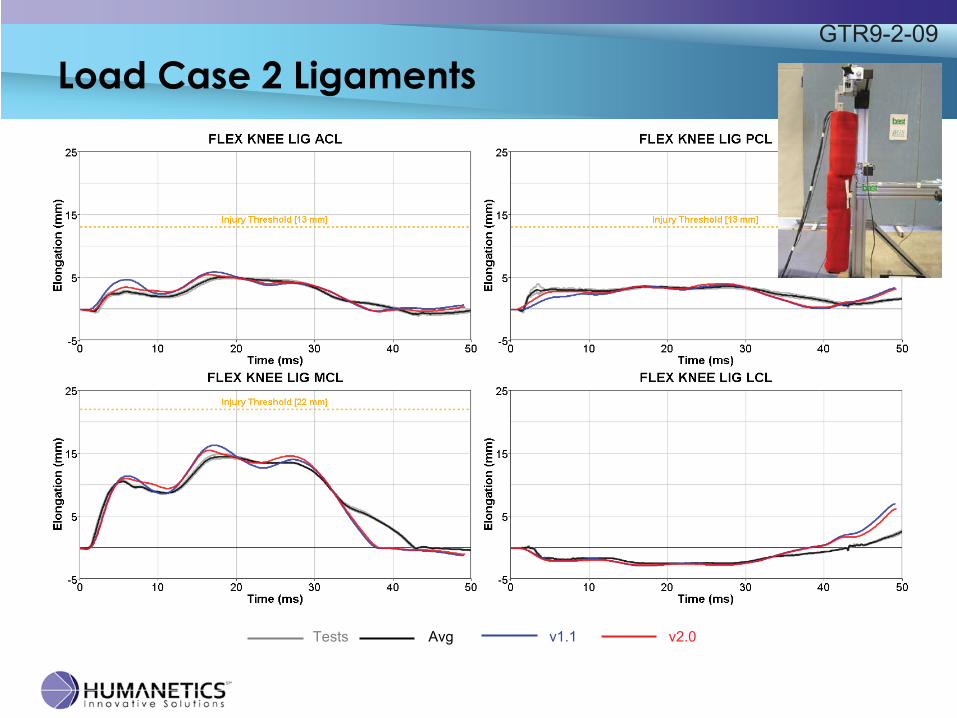
Load Case 2 Ligaments
Tests Avg v1.1 v2.0
GTR9-2-09
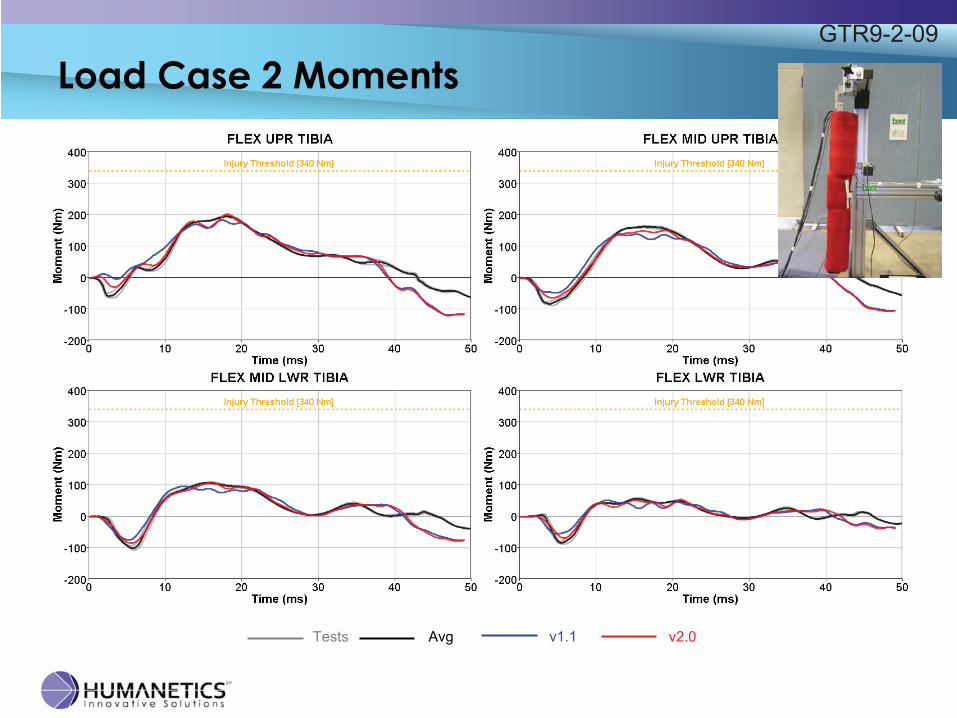
Load Case 2 Moments
Tests Avg v1.1 v2.0
GTR9-2-09
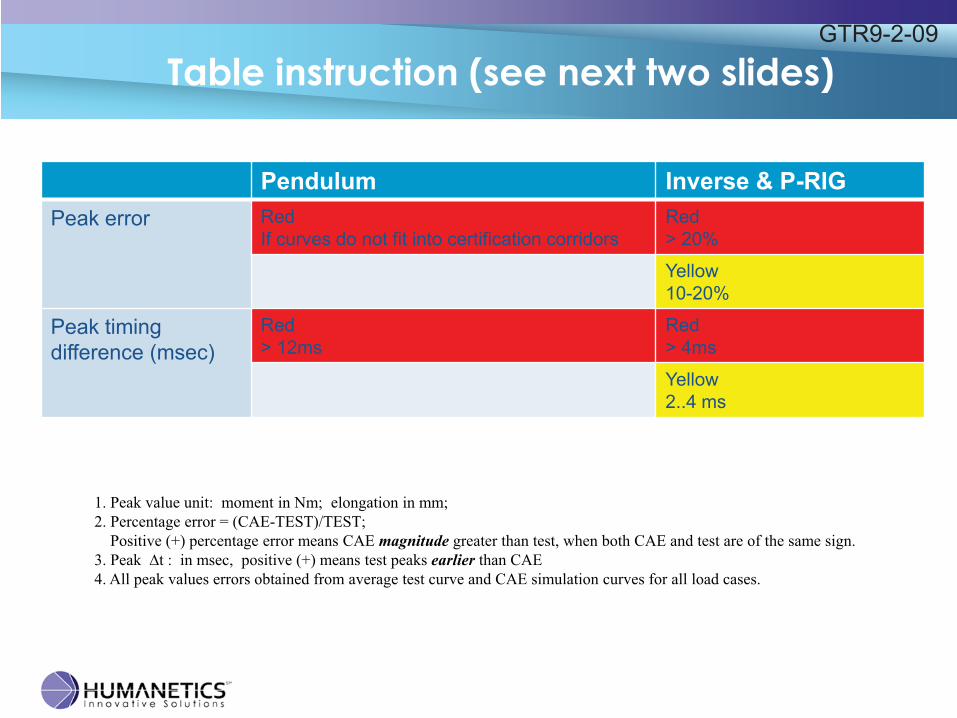
1. Peak value unit: moment in Nm; elongation in mm; 2. Percentage error = (CAE-TEST)/TEST; Positive (+) percentage error means CAE magnitude greater than test, when both CAE and test are of the same sign.�������������� ��������������������means test peaks earlier than CAE 4. All peak values errors obtained from average test curve and CAE simulation curves for all load cases.
Pendulum Inverse & P-RIG Peak error Red
If curves do not fit into certification corridorsRed > 20%
Yellow 10-20%
Peak timing difference (msec)
Red > 12ms
Red> 4ms
Yellow2..4 ms
Table instruction (see next two slides)GTR9-2-09
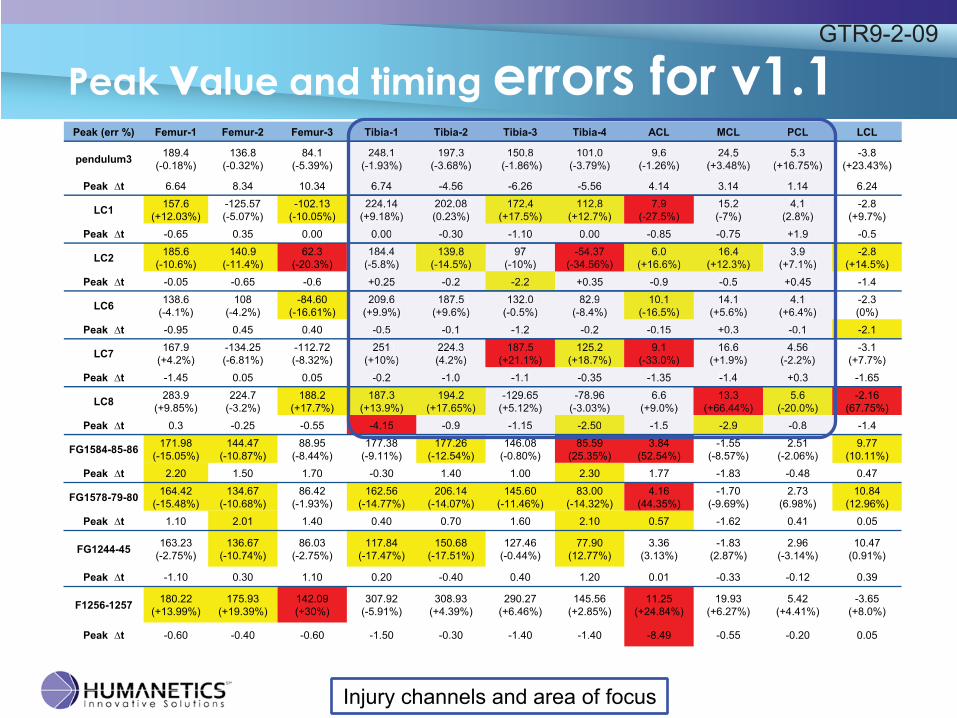
Peak (err %) Femur-1 Femur-2 Femur-3 Tibia-1 Tibia-2 Tibia-3 Tibia-4 ACL MCL PCL LCL
pendulum3 189.4(-0.18%)
136.8 (-0.32%)
84.1 (-5.39%)
248.1 (-1.93%)
197.3 (-3.68%)
150.8 (-1.86%)
101.0 (-3.79%)
9.6 (-1.26%)
24.5 (+3.48%)
5.3 (+16.75%)
-3.8 (+23.43%)
Peak �t 6.64 8.34 10.34 6.74 -4.56 -6.26 -5.56 4.14 3.14 1.14 6.24
LC1 157.6(+12.03%)
-125.57 (-5.07%)
-102.13 (-10.05%)
224.14 (+9.18%)
202.08 (0.23%)
172.4(+17.5%)
112.8 (+12.7%)
7.9 (-27.5%)
15.2 (-7%)
4.1 (2.8%)
-2.8 (+9.7%)
Peak �t -0.65 0.35 0.00 0.00 -0.30 -1.10 0.00 -0.85 -0.75 +1.9 -0.5
LC2 185.6 (-10.6%)
140.9 (-11.4%)
62.3 (-20.3%)
184.4(-5.8%)
139.8 (-14.5%)
97 (-10%)
-54.37 (-34.56%)
6.0 (+16.6%)
16.4 (+12.3%)
3.9 (+7.1%)
-2.8 (+14.5%)
Peak �t -0.05 -0.65 -0.6 +0.25 -0.2 -2.2 +0.35 -0.9 -0.5 +0.45 -1.4
LC6 138.6 (-4.1%)
108 (-4.2%)
-84.60 (-16.61%)
209.6 (+9.9%)
187.5 (+9.6%)
132.0 (-0.5%)
82.9(-8.4%)
10.1 (-16.5%)
14.1 (+5.6%)
4.1 (+6.4%)
-2.3 (0%)
Peak �t -0.95 0.45 0.40 -0.5 -0.1 -1.2 -0.2 -0.15 +0.3 -0.1 -2.1
LC7 167.9(+4.2%)
-134.25 (-6.81%)
-112.72 (-8.32%)
251 (+10%)
224.3(4.2%)
187.5(+21.1%)
125.2 (+18.7%)
9.1 (-33.0%)
16.6 (+1.9%)
4.56 (-2.2%)
-3.1 (+7.7%)
Peak �t -1.45 0.05 0.05 -0.2 -1.0 -1.1 -0.35 -1.35 -1.4 +0.3 -1.65
LC8 283.9(+9.85%)
224.7 (-3.2%)
188.2 (+17.7%)
187.3 (+13.9%)
194.2 (+17.65%)
-129.65 (+5.12%)
-78.96 (-3.03%)
6.6 (+9.0%)
13.3 (+66.44%)
5.6 (-20.0%)
-2.16 (67.75%)
Peak �t 0.3 -0.25 -0.55 -4.15 -0.9 -1.15 -2.50 -1.5 -2.9 -0.8 -1.4
FG1584-85-86 171.98 (-15.05%)
144.47 (-10.87%)
88.95(-8.44%)
177.38 (-9.11%)
177.26 (-12.54%)
146.08 (-0.80%)
85.59(25.35%)
3.84(52.54%)
-1.55 (-8.57%)
2.51(-2.06%)
9.77(10.11%)
Peak �t 2.20 1.50 1.70 -0.30 1.40 1.00 2.30 1.77 -1.83 -0.48 0.47
FG1578-79-80 164.42 (-15.48%)
134.67(-10.68%)
86.42(-1.93%)
162.56 (-14.77%)
206.14 (-14.07%)
145.60 (-11.46%)
83.00(-14.32%)
4.16(44.35%)
-1.70 (-9.69%)
2.73(6.98%)
10.84(12.96%)
Peak �t 1.10 2.01 1.40 0.40 0.70 1.60 2.10 0.57 -1.62 0.41 0.05
FG1244-45 163.23 (-2.75%)
136.67 (-10.74%)
86.03(-2.75%)
117.84 (-17.47%)
150.68 (-17.51%)
127.46 (-0.44%)
77.90(12.77%)
3.36(3.13%)
-1.83 (2.87%)
2.96(-3.14%)
10.47(0.91%)
Peak �t -1.10 0.30 1.10 0.20 -0.40 0.40 1.20 0.01 -0.33 -0.12 0.39
F1256-1257 180.22 (+13.99%)
175.93 (+19.39%)
142.09 (+30%)
307.92 (-5.91%)
308.93 (+4.39%)
290.27 (+6.46%)
145.56 (+2.85%)
11.25 (+24.84%)
19.93 (+6.27%)
5.42 (+4.41%)
-3.65 (+8.0%)
Peak �t -0.60 -0.40 -0.60 -1.50 -0.30 -1.40 -1.40 -8.49 -0.55 -0.20 0.05
Peak value and timing errors for v1.1Tibia-1 Tibia-2 Tibia-3 Tibia-4 ACL MCL PCL
248.1 (-1.93%)
197.3 (-3.68%)
150.8 (-1.86%)
101.0 (-3.79%)
9.6 (-1.26%)
24.5 (+3.48%)
5.3 (+16.75%)
6.74 -4.56 -6.26 -5.56 4.14 3.14 1.14224.14
(+9.18%) 202.08 (0.23%)
172.4(+17.5%)
112.8 (+12.7%)
7.9 (-27.5%)
15.2 (-7%)
4.1 (2.8%)
0.00 -0.30 -1.10 0.00 -0.85 -0.75 +1.9 184.4
(-5.8%)139.8
(-14.5%)97
(-10%) -54.37
(-34.56%)6.0
(+16.6%)16.4
(+12.3%) 3.9
(+7.1%)+0.25 -0.2 -2.2 +0.35 -0.9 -0.5 +0.45209.6
(+9.9%) 187.5
(+9.6%)132.0
(-0.5%) 82.9
(-8.4%)10.1
(-16.5%)14.1
(+5.6%)4.1
(+6.4%)-0.5 -0.1 -1.2 -0.2 -0.15 +0.3 -0.1251
(+10%)224.3(4.2%)
187.5(+21.1%)
125.2 (+18.7%)
9.1 (-33.0%)
16.6 (+1.9%)
4.56 (-2.2%)
-0.2 -1.0 -1.1 -0.35 -1.35 -1.4 +0.3 187.3
(+13.9%)194.2
(+17.65%)-129.65
(+5.12%) -78.96
(-3.03%) 6.6
(+9.0%)13.3
(+66.44%)5.6
(-20.0%) -4.15 -0.9 -1.15 -2.50 -1.5 -2.9 -0.8
Injury channels and area of focus
GTR9-2-09
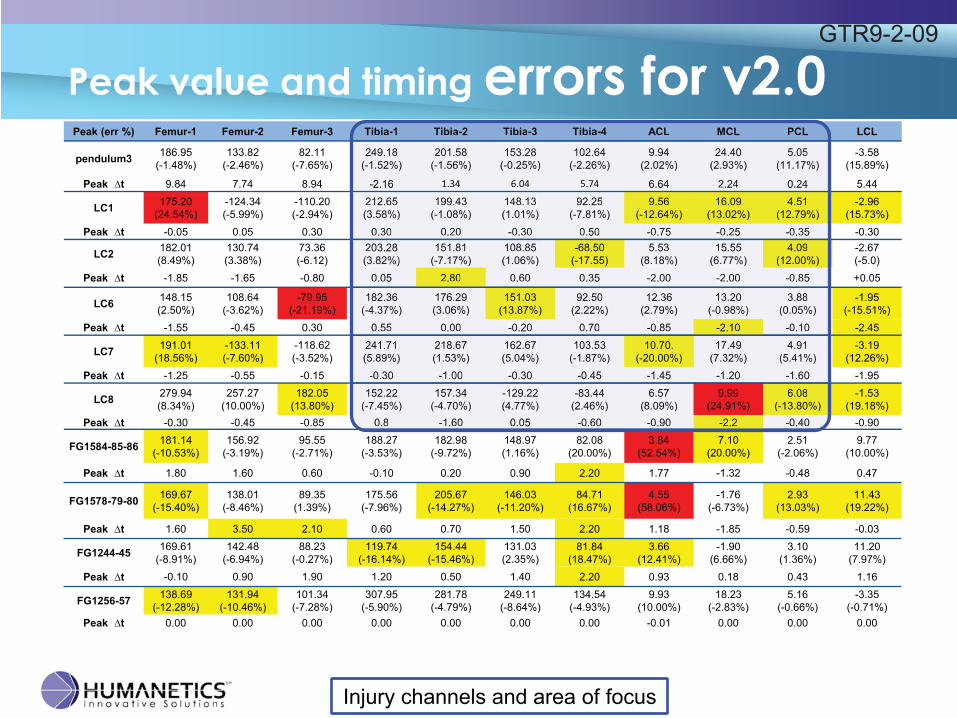
Peak (err %) Femur-1 Femur-2 Femur-3 Tibia-1 Tibia-2 Tibia-3 Tibia-4 ACL MCL PCL LCL
pendulum3 186.95 (-1.48%)
133.82 (-2.46%)
82.11 (-7.65%)
249.18 (-1.52%)
201.58 (-1.56%)
153.28 (-0.25%)
102.64 (-2.26%)
9.94(2.02%)
24.40(2.93%)
5.05(11.17%)
-3.58 (15.89%)
Peak �t 9.84 7.74 8.94 -2.16 1.34 6.04 5.74 6.64 2.24 0.24 5.44
LC1 175.20 (24.54%)
-124.34 (-5.99%)
-110.20 (-2.94%)
212.65 (3.58%)
199.43 (-1.08%)
148.13 (1.01%)
92.25(-7.81%)
9.56(-12.64%)
16.09(13.02%)
4.51(12.79%)
-2.96 (15.73%)
Peak �t -0.05 0.05 0.30 0.30 0.20 -0.30 0.50 -0.75 -0.25 -0.35 -0.30
LC2 182.01 (8.49%)
130.74 (3.38%)
73.36(-6.12)
203.28 (3.82%)
151.81 (-7.17%)
108.85 (1.06%)
-68.50 (-17.55)
5.53(8.18%)
15.55(6.77%)
4.09(12.00%)
-2.67 (-5.0)
Peak �t -1.85 -1.65 -0.80 0.05 2.80 0.60 0.35 -2.00 -2.00 -0.85 +0.05
LC6 148.15 (2.50%)
108.64 (-3.62%)
-79.95 (-21.19%)
182.36 (-4.37%)
176.29 (3.06%)
151.03 (13.87%)
92.50(2.22%)
12.36(2.79%)
13.20(-0.98%)
3.88(0.05%)
-1.95 (-15.51%)
Peak �t -1.55 -0.45 0.30 0.55 0.00 -0.20 0.70 -0.85 -2.10 -0.10 -2.45
LC7 191.01 (18.56%)
-133.11 (-7.60%)
-118.62 (-3.52%)
241.71 (5.89%)
218.67 (1.53%)
162.67 (5.04%)
103.53 (-1.87%)
10.70.(-20.00%)
17.49(7.32%)
4.91(5.41%)
-3.19 (12.26%)
Peak �t -1.25 -0.55 -0.15 -0.30 -1.00 -0.30 -0.45 -1.45 -1.20 -1.60 -1.95
LC8 279.94 (8.34%)
257.27 (10.00%)
182.05 (13.80%)
152.22 (-7.45%)
157.34 (-4.70%)
-129.22 (4.77%)
-83.44 (2.46%)
6.57(8.09%)
9.99(24.91%)
6.08(-13.80%)
-1.53 (19.18%)
Peak �t -0.30 -0.45 -0.85 0.8 -1.60 0.05 -0.60 -0.90 -2.2 -0.40 -0.90
FG1584-85-86 181.14 (-10.53%)
156.92 (-3.19%)
95.55(-2.71%)
188.27 (-3.53%)
182.98 (-9.72%)
148.97 (1.16%)
82.08(20.00%)
3.84(52.54%)
7.10(20.00%)
2.51(-2.06%)
9.77(10.00%)
Peak �t 1.80 1.60 0.60 -0.10 0.20 0.90 2.20 1.77 -1.32 -0.48 0.47
FG1578-79-80 169.67 (-15.40%)
138.01 (-8.46%)
89.35(1.39%)
175.56 (-7.96%)
205.67 (-14.27%)
146.03 (-11.20%)
84.71(16.67%)
4.55(58.06%)
-1.76 (-6.73%)
2.93(13.03%)
11.43(19.22%)
Peak �t 1.60 3.50 2.10 0.60 0.70 1.50 2.20 1.18 -1.85 -0.59 -0.03
FG1244-45 169.61 (-8.91%)
142.48 (-6.94%)
88.23(-0.27%)
119.74 (-16.14%)
154.44 (-15.46%)
131.03 (2.35%)
81.84(18.47%)
3.66(12.41%)
-1.90 (6.66%)
3.10(1.36%)
11.20(7.97%)
Peak �t -0.10 0.90 1.90 1.20 0.50 1.40 2.20 0.93 0.18 0.43 1.16
FG1256-57 138.69 (-12.28%)
131.94 (-10.46%)
101.34 (-7.28%)
307.95 (-5.90%)
281.78 (-4.79%)
249.11 (-8.64%)
134.54 (-4.93%)
9.93(10.00%)
18.23(-2.83%)
5.16(-0.66%)
-3.35 (-0.71%)
Peak �t 0.00 0.00 0.00 0.00 0.00 0.00 0.00 -0.01 0.00 0.00 0.00
Tibia-1 Tibia-2 Tibia-3 Tibia-4 ACL MCL PCL
249.18 (-1.52%)
201.58 (-1.56%)
153.28 (-0.25%)
102.64 (-2.26%)
9.94(2.02%)
24.40(2.93%)
5.05(11.17%)
-2.16 1.34 6.04 5.74 6.64 2.24 0.24212.65 (3.58%)
199.43 (-1.08%)
148.13 (1.01%)
92.25(-7.81%)
9.56(-12.64%)
16.09(13.02%)
4.51(12.79%)
0.30 0.20 -0.30 0.50 -0.75 -0.25 -0.35203.28 (3.82%)
151.81 (-7.17%)
108.85 (1.06%)
-68.50(-17.55)
5.53(8.18%)
15.55(6.77%)
4.09(12.00%)
0.05 2.80 0.60 0.35 -2.00 -2.00 -0.85
182.36 (-4.37%)
176.29 (3.06%)
151.03 (13.87%)
92.50(2.22%)
12.36(2.79%)
13.20(-0.98%)
3.88(0.05%)
0.55 0.00 -0.20 0.70 -0.85 -2.10 -0.10241.71 (5.89%)
218.67 (1.53%)
162.67 (5.04%)
103.53 (-1.87%)
10.70.(-20.00%)
17.49(7.32%)
4.91(5.41%)
-0.30 -1.00 -0.30 -0.45 -1.45 -1.20 -1.60 152.22
(-7.45%) 157.34
(-4.70%) -129.22 (4.77%)
-83.44 (2.46%)
6.57(8.09%)
9.99(24.91%)
6.08(-13.80%)
0.8 -1.60 0.05 -0.60 -0.90 -2.2 -0.40
Peak value and timing errors for v2.0
Injury channels and area of focus
GTR9-2-09
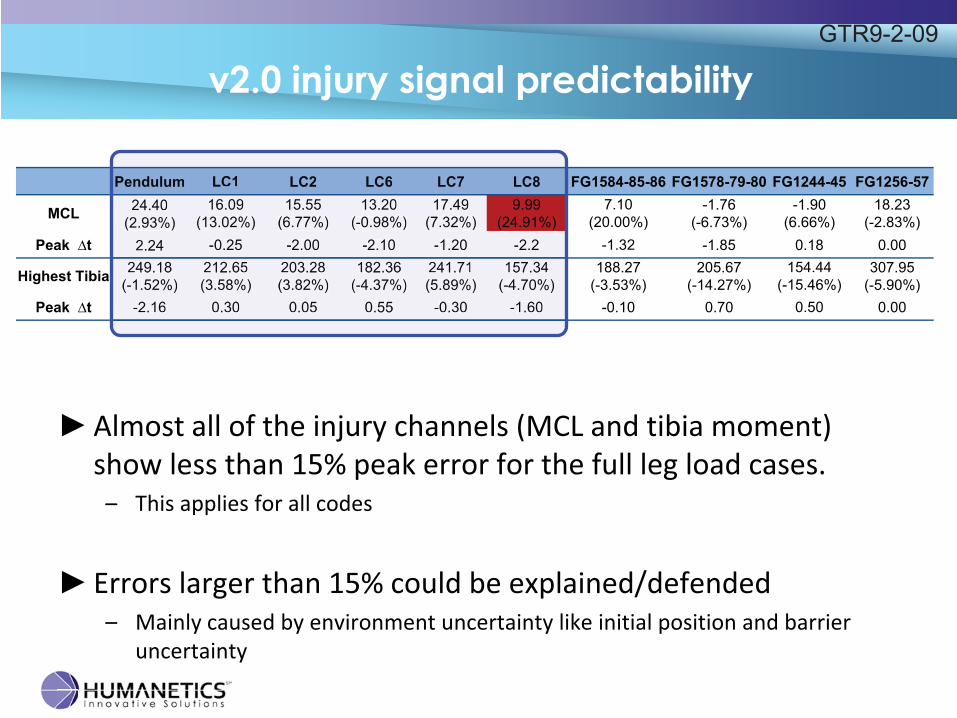
v2.0 injury signal predictability
� Almost all of the injury channels (MCL and tibia moment) show less than 15% peak error for the full leg load cases.
– This applies for all codes
� Errors larger than 15% could be explained/defended – Mainly caused by environment uncertainty like initial position and barrier
uncertainty
Pendulum LC1 LC2 LC6 LC7 LC8 FG1584-85-86 FG1578-79-80 FG1244-45 FG1256-57
MCL 24.40(2.93%)
16.09(13.02%)
15.55(6.77%)
13.20(-0.98%)
17.49(7.32%)
9.99(24.91%)
7.10(20.00%)
-1.76(-6.73%)
-1.90(6.66%)
18.23(-2.83%)
Peak �t 2.24 -0.25 -2.00 -2.10 -1.20 -2.2 -1.32 -1.85 0.18 0.00
Highest Tibia 249.18 (-1.52%)
212.65(3.58%)
203.28(3.82%)
182.36(-4.37%)
241.71(5.89%)
157.34(-4.70%)
188.27(-3.53%)
205.67(-14.27%)
154.44(-15.46%)
307.95(-5.90%)
Peak �t -2.16 0.30 0.05 0.55 -0.30 -1.60 -0.10 0.70 0.50 0.00
Pendulum LC1 LC2 LC6 LC7 LC824.40
(2.93%)16.09
(13.02%)15.55
(6.77%)13.20
(-0.98%)17.49
(7.32%)9.99
(24.91%)2.24 -0.25 -2.00 -2.10 -1.20 -2.2
249.18 (-1.52%)
212.65(3.58%)
203.28(3.82%)
182.36(-4.37%)
241.71(5.89%)
157.34(-4.70%)
-2.16 0.30 0.05 0.55 -0.30 -1.60
GTR9-2-09
Future work� The Group wishes to proceed as soon as the hardware and
corresponding certification conditions are frozen and approved by the committees involved. – Guarantee that the model represents the finalized hardware.
� A second future goal is to validate the models against new test data that is generated with several hardware legs at different test labs, in order to better understand potential variability.
GTR9-2-09