martinspeechdebate.wikispaces.commartinspeechdebate.wikispaces.com/file/view/35+gt... · web...
TRANSCRIPT

Federal Buildings AffDDI 2008 GT Mia, Grace, Alex R
1AC .......................................................................... 2
1AC .......................................................................... 4
1AC .......................................................................... 6
***BUILDINGS*** ............................................. 16
Inherency – Current Policies .............................. 17
Inherency – Coal and Oil .................................... 21
No Switch Now – Costs ........................................ 22
AT: XO Makes Not Inherent .............................. 23
AT: White House Makes Not Inherent .............. 24
Lots o’ Buildings .................................................. 25
Fed Buildings Emissions ................................... 27
US Buildings Emissions .................................... 28
USFG Emissions ................................................ 30
***SOLVENCY*** ............................................. 31
Federal Buildings Key - Emissions ..................... 32
Buildings Key - Emissions ................................... 33
Federal Buildings Key – Private Sector ............. 34
Buildings Key – Environment/Economy ........... 35
Federal Buildings Key – Spillover ...................... 36
Federal Gov’t Key - Spillover ............................. 38
Funding Key ......................................................... 41
Solvency – Renewables Solve Emissions ............ 42
Solvency - Regulations ......................................... 43
Solvency – FEMP ................................................. 44
Solvency – NTDP ................................................. 46
Plan Mechanism ................................................... 47
Renewables List ................................................... 48
Emissions Numbers Lie ....................................... 49
***ANSWERS TO*** ......................................... 51
Politics – Plan Popular (Public) .......................... 52
Elections – Obama Supports ............................... 53
Elections – McCain Supports ............................. 54
LALCrabs!1

Federal Buildings AffDDI 2008 GT Mia, Grace, Alex R
AT: Efficiency CP ................................................ 55
AT: Negative Incentives CP – Perm ................... 63
***CDC*** ........................................................... 64
Blackouts Coming Now ....................................... 65
CDC Inherency - Backup Power Failing ........... 66
BSL-4 Power Key to Virus Containment .......... 68
BLS-4 – Lots of Diseases ..................................... 69
BSL-4 Key – Select Agents .................................. 70
BSL-4 Key – Ebola ............................................... 71
CDC Key - Smallpox ........................................... 72
CDC Key – Bird Flu ............................................ 73
CDC Key – 1918 Flu ............................................ 74
CDC Outage Biohazards .................................. 75
Smallpox Sucks .................................................... 76
Smallpox Sucks – Military .................................. 79
Bird Flu Sucks ...................................................... 80
1918 Flu ................................................................. 82
Ebola Made Me Cry (Blood) ............................... 83
Renewables Solve Power Outages ...................... 86
CDC Smallpox Add-on ........................................ 88
***AIR POLLUTION** ..................................... 90
DC Air Pollution .................................................. 91
Pollution Hurts Honeybees ................................. 92
Honeybees Biodiversity .................................... 93
Pollution Hurts Chesapeake Bay ........................ 96
Chesapeake Bay Enviro ................................... 97
Fed Buildings Solve Chesapeake ........................ 99
AIR POLLUTION KILLS 2 MILLION .......... 100
AIR POLLUTION IN CALIFORNIA KILLS 24,000 101
AIR POLLUTION KILLS BABIES ................ 102
AIR POLLUTION CAUSES HEART ATTACKS AND STROKES 103
HEART DISEASE IS LEADING CAUSE OF DEATH IN WORLD 104
LALCrabs!2

Federal Buildings AffDDI 2008 GT Mia, Grace, Alex R
YOU WILL DIE BECAUSE OF AIR POLLUTION 105
AIR POLLUTION CAUSES RESPIRATORY DISEASES 106
AIR POLLUTION RESULTS IN ACID RAIN 107
EVEN SHORT TERM EXPOSURE LEADS TO PREMATURE DEATH 108
***NEG*** ......................................................... 110
Efficiency CP - Solvency ................................... 111
Efficiency CP - Spillover ................................... 112
Efficiency CP – Saves Money ............................ 113
Alt Cause – Transportation .............................. 114
No Disease From BSL-4 .................................... 115
AT: 1918 Flu ........................................................ 116
1AC Observation one -- Inherency
Status quo federal building policies fail – government doesn’t comply, doesn’t know of regulations and wastes trillions BTU and tax payer’s moneyNils Petermann and Jeffrey Harris ;Alliance to Save Energy With support from the Federal Energy Management Program ‘Deploying New Technologies to Increase Energy Savings in the Federal Sector” http://www.ase.org/content/article/detail/4789] April 2008
The Energy Policy Act of 2005 (EPAct 2005) required federal agencies to purchase energy-efficient products. These requirements were not new, but rather a codification into law of existing Executive Orders. Nevertheless, the Alliance to Save Energy’s research suggests compliance remains extremely low. In fact, of 164 examined government solicitations that included requests for products covered by this legislation, only seven percent appeared to be fully compliant . The Alliance also talked to 25 government procurement officials, many of whom were listed as contacts on solicitations for products covered by the EPAct regulation. Only two of those 25 government employees knew about the energy-efficient procurement requirement in detail and believed they were partly responsible for ensuring the requirement was followed . The General Services Administration (GSA) and the Defense Logistics Agency (DLA), the two main government-run websites that sell exclusively to government agencies, showed similar levels of non-compliance, failing to sell any compliant models in 65 percent and 80 percent of the covered product categories, respectively. Failure to fully comply with federal requirements for energy-efficient purchasing wastes money and increases emissions of carbon and other pollutants. Non-compliance with the energy-efficiency procurement regulations could be wasting as much as 25 trillion Btu of site energy per year.1 In 2006, on average, federal buildings paid $16.62 per million Btu they used,2 so 25 trillion Btu represents $415 million of wasted taxpayer money at 2006 prices (about $435 million at today’s prices.3) That wasted energy also results in the emission of about 840 thousand metric tons of carbon equivalent annually (about 3 million metric tons of carbon dioxide).
LALCrabs!3

Federal Buildings AffDDI ’08 GTKunst/Labriola/Resar
Status quo regulations fail – because of a lack of incentives.ASE (Alliance to save energy) [a coalition of prominent business, government, environmental, and consumer leaders who promote the efficient and clean use of energy worldwide to benefit consumers, the environment, the economy, and national security. “Leading by Example: Improving Energy Productivity in Federal Government Facilities” www.ase.org] 1998 Federal agencies have clearly made a lot of progress, but they have only started to tap the opportunities. Federal government buildings still consume about 32 percent more energy per square foot than the nation’s building stock at large.14 A cumulative investment of $4.7 billion over the next eight years would save taxpayers an additional $1 billion annually. Those investments would pay for themselves in just four to five years, after which the annual energy cost savings could be given back to taxpayers, or used to reduce debt or mend Social Security.15 Why Energy-Saving Projects Get Stalled The enormous savings potential is not enough in itself to make energy-efficiency improvements happen in federal buildings and facilities. Energy-efficiency investments are continually stalled or prevented for a host of reasons. n Energy efficiency is not part of agencies’ core missions—Energy efficiency is generally not a priority within the agencies. It is often perceived as a distraction and an added burden. Very rarely do senior officials within the agencies bring attention to the issue, leaving the responsibility to federal workers who would make the improvements unsupported and unguided. Especially when agencies are forced to cut staff, personnel are pulled away from energy management to focus more on activities related to agencies’ core missions. n Agencies don’t have enough money— Agencies have not received adequate funding from Congress to permit them to invest in the many remaining cost effective energy-efficiency projects. Agencies are caught in a double-bind in that they are required by law and executive order (as discussed below) to reduce energy use and purchase energy-efficient equipment, but they are not given sufficient resources to meet those requirements. Simply put, they face unfunded mandates. Due to constraints in other areas of their budgets, agencies sometimes reallocate energy-efficiency monies for other activities or don’t request energy-efficiency funding at all. n Agencies receive little oversight and are given few incentives—While agencies are required by law and executive order to reduce energy use and purchase energy-efficient equipment, there is little (if any) pressure from Congress and the president to do so. Agencies also recognize that reducing energy costs will simply result in reductions in their energy budgets. n Lack of awareness and knowledge— Implementing energy-efficiency projects requires knowledge of the opportunities and technologies that are currently available and the cost and performance of those technologies in similar applications. It also requires that facility managers consider the life-cycle cost of operating a facility rather than just the first cost of a building system or a piece of equipment. More training and education of federal government personnel about energy-efficiency opportunities and implementation are needed. Over the last two decades, a considerable amount of legislation, executive orders, rule making, and programs have been developed and implemented to encourage investments in energy efficiency. Congress and presidents have established various goals and requirements related to federal energy management. Billions of dollars have been spent Leading by Example: Improving Energy Productivity in Federal Government Facilities 10 Introduction 11 to support agencies’ efforts to reduce their energy use. Federal personnel have spent countless hours in classrooms learning about energy-efficiency opportunities. Efforts made over the last two decades have resulted in heightened awareness of energy efficiency opportunities, greater incentives to implement energy-saving measures, and increased investment resources. Nevertheless, many obstacles still need to be overcome if the federal government is to maximize the productivity of its energy use. The following chapters describe various efforts currently under way, discuss problems, and suggest solutions.
Even the most aggressive efficiency measures fail to effectively reduce federal building carbon emissions – only renewable energy solves
Joe Loper, Vice President of Policy and Research – Alliance to Save Energy, et al, 4/2008. “Reducing Greenhouse Gas Emissions In Federal Buildings, Facilities and Vehicles,” For the Presidential Climate Action Project [Steve Capanna and Jeffrey Harris] climateactionproject.com%2Fdocs%2FPCAP_Final_FEMP_Chapter_4-18-08.pdf
In order to achieve 80 percent reductions compared to 1990 emissions levels, federal buildings would need to reduce their emissions by considerably more than even very aggressive efficiency measures could lower them. Implementing all cost-effective and achievable efficiency improvements only achieves about 60 percent of the goal – an additional 10 million metric ton reduction would be required by 2050. To achieve this through energy efficiency would require reductions in federal energy use of nearly 2 percent of 2007 emissions annually through 2050. Achieving these levels of reductions through efficiency alone would be an enormous feat. More realistically, aggressive energy-efficiency reductions will need to be supplemented by increased use of renewable and other low-carbon energy resources.33 Once efficiency reductions are realized, low-carbon energy would need to supply about 65 percent of 2050 energy consumption to achieve overall emissions of 80 percent below 1990 levels.34
LALCrabs!4

Federal Buildings AffDDI ’08 GTKunst/Labriola/Resar
1AC Observation two -- CDC
Blackouts coming now – aging power plants can’t supply increasing power needsBloomberg News. Bloomberg News in UK, 4/18/08. “More Power Blackouts Are Likely on Lack of Investment, PwC Says,” http://www.bloomberg.com/apps/news?pid=email_us&refer=europe&sid=a6L1TI_U75ws
Power blackouts similar to those in the U.S. East Coast, Italy and the U.K. two years ago are likely to be repeated around the world because of insufficient investment and aging power plants, PriceWaterhouseCoopers said. About $12.7 trillion of investment, greater than the U.S. annual economic output, is needed through 2030 to meet an expected doubling in electricity consumption, a report by consultants at PriceWaterhouseCoopers said. That total is higher than the estimated $10 trillion spending on electricity called for by the International Energy Agency during the same period. ``Blackouts are expected to become more frequent,'' according to the report, which was based on a survey of 119 investors and executives at utilities in 36 countries. ``Two-thirds of utility respondents believe the likelihood of blackouts will increase or remain the same. Only a quarter think it will reduce.''
Current safeguards on BSL-4 insufficient to contain biohazards in a blackout - recent outage provesGAO, US Government Accountability Office, 10/4/07. “Testimony: Before the Subcommittee on Oversight and Investigations, Committee on Energy and Commerce, House of Representatives,” http://www.gao.gov/htext/d08108t.html
On June 8, 2007, the CDC campus in Atlanta experienced lightning strikes in and around its new BSL-4 facility, and both primary and backup power to that facility were unavailable. The facility was left with only battery power--a condition that provides limited power for functions such as emergency lighting to aid in evacuation. Among other things, the outage shut down the negative air pressure system, one of the important components in place to keep dangerous agents from escaping the containment areas. In looking into the power outage, the CDC determined that, some time earlier, a critical grounding cable buried in the ground outside the building had been cut by construction workers digging at an adjacent site. The cutting of the grounding cable, which had gone unnoticed by CDC facility managers, compromised the electrical system of the facility that housed the BSL-4 lab.[Footnote 15] According to CDC officials, the new BSL-4 facility is still in preparation to become fully operational and no live agents were inside the facility at the time of the power outage. However, given that the cable was cut, it is apparent that the construction was not supervised to ensure the integrity of necessary safeguards that had been put in place.
LALCrabs!5

Only the CDC’s BSL-4 labs contain Ebola viruses that are capable of reproducing
Lisa Schnirring, CIDRAP Staff Writer, 9/25/07. “Wisconsin lab broke Ebola rules, watchdog group says,” Association for Professionals in Infection Control and Epidemiologyhttp://www.cidrap.umn.edu/apic/bt/vhf/news/sep2507ebola(2).html
UW-Madison's institutional biosafety committee (IBC) wrongly allowed well-known influenza researcher Yoshihiro Kawaoka to work with Ebola genetic material in a biosafety level 3 (BSL-3) lab, though federal rules require use of a BSL-4 lab for such work, the Sunshine Project, based in Austin, Tex., reported on Sep 19. BSL-4 is the highest biosecurity rating.The university stopped the research in October 2006 after the National Institutes of Health (NIH) said a BSL-4 lab was required, even though the university disagreed, according to UW-Madison officials. The NIH was funding the research.Ebola is a highly contagious virus that causes a hemorrhagic fever and is lethal in about 50% to 90% of cases. Because the Ebola virus is so dangerous, the US government lists it as a category A bioterrorism agent. There is no vaccine or specific treatment for the disease.The Web site for Kawaoka's lab says that in addition to work on influenza viruses, researchers are exploring the molecular pathogenesis of the Ebola virus and have established a reverse-genetics system for generating the virus, which they hope to use for vaccine production and the identification of antiviral medication targets.The Web site emphasizes that the lab has developed a novel complement system that allows researchers to study Ebola virus glycoproteins without having to do the work in a BSL-4 lab.Researcher sought lighter restrictionsThe Sunshine Project's report makes it clear that Kawaoka and his colleagues weren't working with live Ebola virus, but rather full-length copies of Ebola DNA (complementary DNA, or cDNA) that lacks two critical proteins that could trigger growth of an infectious virus. However, the group says that federal rules require use of a BSL-4 lab for handling Ebola virus genetic material "that has not been rendered irreversibly incapable of reproducing."
Ebola is one step away from mutating into a global killer – containment is keyC. William Fox, MD, Commander of Bayne-Jones Army Hospital, 6/24/97. “Military Medical Operations in Sub-Saharan Africa” http://www.strategicstudiesinstitute.army.mil/pubs/display.cfm?PubID=639Ebola-Zaire virus, first discovered in 1976, is the stereotype of the virulent, almost invulnerable "Hot-Zone" virus. It strikes with great suddenness and lethality, then disappears until the next outbreak. At the very least, in each of the four recorded mass outbreaks, the 90 percent death rate is a stark reminder of the vulnerability of the human species. 29 No one yet knows where the virus resides in nature, how the human epidemics get started or why they are so rare. In the recorded outbreaks in Zaire and the Sudan, flu-like symptoms typically appear within three days of infection and death soon occurs from generalized organ failure preceded by a hemorrhagic diathesis from every orifice. In its present form, ebola is unlikely to become a world pandemic disease due to its means of spread (by infected secretions) and its extreme sensitivity to ultraviolet light. However, given a simple alteration to its genetic structure that provides for more protection during transmission, it could suddenly become a threat of global proportions. This virus does serve to spotlight the very real horrors that epidemic and pandemic diseases can easily produce in today's interconnected world. A genetically altered ebola virus is just one of several lethal viruses found in Africa that could be utilized as biological weapons with cataclysmic lethality. Others, like Marburg virus and Congo-Crimean Hemorrhagic fever virus, require further investigation and research. These diseases are sufficiently threatening now to warrant an aggressive surveillance program and an expanded capability for isolation and containment of further outbreaks.
An Ebola outbreak is equivalent to a deliberate full-scale WMD attackC. William Fox, MD, Commander of Bayne-Jones Army Hospital, 6/24/97. “Military Medical Operations in Sub-Saharan Africa” http://www.strategicstudiesinstitute.army.mil/pubs/display.cfm?PubID=639
HIV is a pandemic killer without a cure, and viruses such as Ebola-Zaire are merely a plane ride away from the population centers of the developed world. Viruses like ebola, which are endemic to Africa, have the potential to inflict morbidity and mortality on a scale not seen in the world since the Black Plague epidemics of medieval Europe (which killed a full quarter of Europe's population in the 13th and 14th centuries.) These diseases are not merely African problems, they present a real threat to mankind. They should be taken every bit as seriously as the concern for deliberate use of weapons of mass destruction.

1AC Renewables in federal facilities are key to reliable energy – on-site electricity generation protects against power disruptionsDoE, US Department of Energy, 11/10/06. “FEMP Renewable Energy Overview,” Federal Energy Management Program, http://www1.eere.energy.gov/femp/pdfs/30800.pdf
Abundant energy from the sun, the wind, plants, and the Earth itself—renewable energy—can provide some or all of your Federal facility’s needs for heating, cooling, and electricity. The U.S. Department of Energy’s Federal Energy Management Program (FEMP) has developed ways to help you tap into these clean, secure energy resources. FEMP provides agencies with information, guidance, and assistance in using renewable energy. Using renewable energy reduces the nation’s need for imported fuels, which enhances our energy security. Renewable energy also helps to conserve the nation’s natural resources, and it has almost no adverse effect on the environment. It also provides fuel diversification, which serves as a hedge against volatile utility prices. Where renewable resources are available, they can contribute significantly to the energy security of an individual Federal facility. They provide a naturally occurring, continual flow of energy, at or near the place where the energy is used. They are thus distributed rather than centralized resources. This can be important to energy managers who have to make sure their facility will keep operating even if utility power is disrupted by reductions in supplies or national emergencies.
Solar power solves emergency health situations and vaccine storageGreen Energy Ohio, not-for-profit organization dedicated to promoting environmentally and economically sustainable energy policies and practices in Ohio, 4/21/04. “Shell Solar to Provide Backup Power for Athens City-County Health Department,” http://www.greenenergyohio.org/page.cfm?pageId=71
Shell Solar and one of its solar contractors, Third Sun Solar and Wind Power, announced that they have completed installation of 20 photovoltaic (solar) panels at the Athens City-County Health Department in Ohio. The installation of the solar panels will provide critical backup power to the health department during emergency situations, thus helping to insure the safety of vaccines stored at controlled temperatures during potential power outages. The newly installed solar electric system will generate sufficient power to operate critical loads in the Athens City-County Health Department, including refrigerators that store vaccines and key communications equipment, such as computers and telephone/fax machines. The system will therefore improve the Health Department’s ability to respond to public health threats and emergencies, as well as reduce their dependence on the local electrical grid.

Observation three – air pollution
Federal buildings account for 37% of the government’s energy usage, use 1.5% of US electricity, and emit 2% of pollutionDAVID L. WINSTEAD, Commissioner, Public Buildings Service, U.S. General Services Administration, 4/17/08. Testimony on the Greening of Federal Buildings before the US House of Representatives. http://gsa.gov/Portal/gsa/ep/contentView.do?pageTypeId=8199&channelId=-18801&P=&contentId=24402&contentType=GSA_BASIC
The Federal government is the largest single consumer of energy in the United States. According to the Department of Energy, Federal buildings account for 37% of the government’s energy usage, use as much as 1.5 percent of the Nation’s electricity and emit about 2 percent of all U.S. building-related greenhouse gases. Since 1985, Federal agencies reduced their energy intensity in Federal buildings by 23 percent in 2005 (for standard buildings). Agencies cut their carbon emissions from facility energy use by 3.3 million metric tons in 2005 compared to 1990. At GSA, since 1985, we have cut our energy consumption by 30 percent and carbon emissions by 281 thousand metric tons (comparable to removing 210 thousand vehicles from the road in one year) in our public buildings. We are using green principles and leading by example in the efficient use of energy, water and materials, as well as promoting space that enhances productivity and the work environment.

Sub point a is DC Bees
Air pollution in the District of Columbia is destroying honeybees’ ability to pollinate – killing both bees and flowersWashington Post, 5/5/08. “Air Pollution Impedes Bees' Ability to Find Flowers.” http://www.washingtonpost.com/wp-dyn/content/article/2008/05/04/AR2008050401737.html?referrer=emailarticle
Their findings may help unlock part of the mystery surrounding the current pollination crisis that is affecting a wide variety of crops. Scientists are seeking to determine why honeybees and bumblebees are dying off in the United States and in other countries, and the new study indicates that emissions from power plants and automobiles may play a part in the insects' demise.Scientists already knew that scent-bearing hydrocarbon molecules released by flowers can be destroyed when they come into contact with ozone and other pollutants. Environmental sciences professor Jose D. Fuentes at the University of Virginia -- working with graduate students Quinn S. McFrederick and James C. Kathilankal -- used a mathematical model to determine how flowers' scents travel with the wind and how quickly they come into contact with pollutants that can destroy them. They described their results in the March issue of the journal Atmospheric Environment.In the prevailing conditions before the 1800s, the researchers calculated that a flower's scent could travel between 3,280 feet and 4,000 feet, Fuentes said in an interview, but today, that scent might travel 650 feet to 1,000 feet in highly polluted areas such as the District of Columbia, Los Angeles or Houston."That's where we basically have all the problems," Fuentes said, adding that ozone levels are particularly high during summer. "The impacts of pollution on pollinator activity are pronounced during the summer months."This phenomenon triggers a cycle, the authors noted, in which the pollinators have trouble finding sufficient food, and as a result their populations decline. That, in turn, translates into decreased pollination and keeps flowering plants, including many fruits and vegetables, from proliferating. Fuentes said scientists now have a more sophisticated understanding of the signals for which insects are searching, and that air pollution rapidly eliminates as much as 90 percent of flowers' aroma.
A continued decrease in bee populations causes a ripple effect of species extinction – pollination is key to biodiversityThe Independent, 4/1/97. “Once upon a time in the West; Amid the rocks, canyons and cactus of Arizona, an Englishman is laying down gardens. The object? To put an end to zoos.” Lexis
"Pollination", explains Hancocks, is "one of the simplest stories of interconnectedness." The new gardens are to be a living testimony to a "Forgotten Pollinators" campaign, co-ordinated from the Desert Museum. The campaign is a call to arms and national policy in the face of what Gary Nabhan, the museum's director of science, calls an impending ecological crisis. He explains that human-induced changes in populations of pollinators, which include bees, butterflies, moths and bats, threaten a ripple effect on disparate species, ultimately leading to a "cascade of linked extinctions". The causes are overuse of chemical pesticides, unbridled development, and conversion of natural areas into cropland where a single crop is planted - that is, monocultured. Already, he says, "the once-abundant honey bee is suffering dramatic population declines throughout North America". The ramifications for farming are potentially grave: crops such as tomatoes and alfalfa, a basic livestock feed, depend on pollination.
Species loss outweighs nuclear war – takes millions of years to recover fromRichard Tobin, The Expendable Future, 1990, p. 22
Norman Meyers observes, no other form of environmental degradation “is anywhere so significant as the fallout of species.” Harvard biologist Edward O. Wilson is less modest in assessing the relative consequences of human-caused extinctions. To Wilson, the worst thing that will happen to earth is not economic collapse, the depletion of energy supplies, or even nuclear war. As frightful as these events might be, Wilson reasons that they can “be repaired within a few generations. The one process ongoing…that will take millions of years to correct is the loss of genetic and species diversity by destruction of natural habitats.

Subpoint B is horseshoe crabs
Air pollution is a major factor in killing aquatic wildlife in the bay.
Chesapeake Bay Program, 2008 ( A Watershed Partnership, February “ Air Pollution”, http://www.chesapeakebay.net/air_pollution.htm)
Air pollution not only affects the quality of the air we breathe; it also impacts the land and the water. What goes up must come down Just like anything else, pollutants released into the air will eventually make their way down to the earth's surface. In particular, airborne nitrogen is a major contributor to poor water quality in the Bay and its tributaries . What types of air pollution impact water quality? Nitrogen and chemical contaminants are two groups of pollutants that are of concern to water qualit y and are known to be emitted into the air. Nitrogen compounds include nitrogen oxides (NOx), ammonia and organic nitrogen. Scientists estimate that one-quarter to one-third of the nitrogen that enters the Bay comes from air deposition: nitrogen released into the air that falls onto the land and runs off into the water, or falls onto the water itself. Nitrogen oxides (NOx) are primarily released into the air as a by-product of combustion: the burning of fossil fuels like oil, gas or coal.Ammonia is primarily released into the air by evaporation and emissions from industry processes. Every living creature—including humans—releases wastes that include ammonia. Organic nitrogen is released through organic nitrogen compounds (like pollen, nicotine and caffeine) that contain carbon.Chemical contaminants include mercury and other metals, and organic contaminants such as PCBs and PAHs. Mercury is released into the air when coal, oil, natural gas and hazardous wastes are burned. PCBs can pass into the atmosphere as a vapor from old electrical equipment. PAHs are primarily released into the air when fuel is burned. Where does air pollution come from? The Bay's NOx airshed—the area where emission sources contributing the most airborne nitrates to the Bay originate—is about 570,000 square miles, or seven times the size of the Bay's watershed. Close to 50 percent of the nitrate deposition to the Bay is from air emission sources located in Bay watershed states. The other half comes from sources located as far away as Ohio, Canada and South Carolina. The nitrogen emitted throughout the airshed eventually reaches the Bay watershed's rivers, forests and wetlands. Within the airshed, there are four main sources of airborne pollutants: stationary and area sources, mobile sources, agricultural sources and natural sources. Stationary and area sources do not move; they have a fixed location. Stationary sources are usually large point sources that release relatively consistent amounts of pollutants, such as power plants and chemical and manufacturing facilities. Area sources are smaller, clustered sources that collectively produce significant amounts of pollutants. These include dry cleaners and gas stations, which are located close to one another in urban and suburban areas. Mobile sources move. Cars, trucks and other on-road vehicles are part of this category. Non-road sources, such as boats, airplanes, gas-powered lawn tools and farm and construction equipment, are also mobile sources. Collectively, mobile sources contribute significantly to air pollution. Agricultural sources are farm operations that can generate emissions of gases, particulate matter and chemical compounds. The main pollutant is ammonia, which emits from manure that is produced in animal houses, stored in holding areas an applied to the land as fertilizer. Natural sources are not caused by human activities. These include lightning, dust storms, forest fires, plants and trees, erupting volcanoes and wild animals in their natural habitat. How does air pollution impact water quality? Pollutants released into the air are carried by winds and fall back to the earth's surface via rain, snow, fog or dry particles. Airborne pollutants that fall on the land can be transported by runoff or groundwater into streams and rivers , adding to excessive nutrient loads to the Bay. In addition to its impacts on the Bay itself, nitrogen released into the air can contribute to: Increased acidity of surface waters and soils. This can impact growth, reproduction and survival of trees and aquatic life. Formation of ground-level ozone, which is known to cause serious human respiratory problems and damage to plants, animals, and materials. Contamination of drinking water sources as it filters down through the ground and accumulates in groundwater. Chemical contaminants released into the air can have the same effect as those released on the ground. They can persist in the environment and accumulate in the tissues of plants and animals, moving up the food web and impacting growth and reproduction in living creatures of all sizes.
The interdependence of many industries caused by the horseshoe crabs makes this creature a unique focus for many
Jim Berkson and Carl N. Shuster [ members of the HCRC-horseshoe crab research center- “The horseshoe crab : battle for a true multiple-use resource” http://www.nmfs.vt.edu/Jim%20Berkson/Research/Publications/The%20Horseshoe%20Crab.%20The%20Battle%20for%20a%20True.pdf] 1999
QuickTime™ and a decompressor
are needed to see this picture.

horseshoe crabs allow scientists to develop all vaccines including those for threats like small pox VPI (Virginia Polytechnic Institute)[CHEMICAL FROM THE CONTROVERSIAL HORSESHOE CRAB VITAL TO HUMAN HEALTH http://www.newmaterials.com/news/7169.asp]30 January 2002 Berkson notes that the HCRC is quickly becoming recognized as the country’s premiere horseshoe crab research institution with ongoing research funded by BioWhittaker, Inc; Virginia Sea Grant, the National Fish and Wildlife Foundation, the Atlantic States Marine Fisheries Commission, and the states of New Jersey, Delaware, and Maryland. "Since September 11 the center has received a lot of attention because of the work we're doing with horseshoe crabs indirectly relating to counter-terrorism," Berkson points out. The chemical that comes from the blood of horseshoe crabs, LAL, is used to test for the presence of endotoxins in injectable drugs and implantable devices. That means all vaccines, including the anthrax and small pox vaccines, have to be tested using LAL to prevent any contamination, whether intentional or unintentional. "The recent rush to produce sufficient anthrax and smallpox vaccine really shows how much we depend on LAL and the horseshoe crabs needed to produce it," Berkson explains. "At our new Horseshoe Crab Research Center we are working to develop alternative ways to produce LAL to ensure its ongoing supply. This is extremely important because we still do not have the information we need to develop effective management regimes and the population of horseshoe crabs may be in a long term decline."
Smallpox is the greatest biological threat – it spreads quickly and is difficult to diagnose and treat
Ned Stuckey-French, U.S. Public Health Service, 10/26/01. “Bioterror, Then and Now,” In These Times. http://www.inthesetimes.com/issue/25/26/feature4.shtml
It’s also deadly. Smallpox has killed more people than any other disease in history, including bubonic plague. At least 300 million people died of smallpox in the 20th century alone. Even with modern medical care, smallpox kills about a third of the unvaccinated people it strikes. There are no mild cases. Survivors are left scarred, and sometimes blind or with deformed bones. But one of the great victories of 20th century science was the eradication of smallpox. The last known case occurred in 1978. The hitch is that once the disease was wiped out, routine vaccinations stopped. Virtually no one has been vaccinated in the United States since 1972, and most of us who were vaccinated back in the ’60s could now contract the disease because immunity does not persist permanently. It’s estimated that only 10 to 15 percent of the U.S. population has residual immunity. In June 1999, experts meeting at the Centers for Disease Control and Prevention in Atlanta unanimously agreed that, followed by anthrax, smallpox was the greatest bioterrorist threat to the United States.It is some comfort that Secretary Tommy Thompson recently named Dr. D.A. Henderson to chair the Health and Human Services advisory council on bioterrorism. Henderson is the Johns Hopkins researcher who led the World Health Organization’s successful campaign to eradicate smallpox, and no one understands smallpox better than he does. For many years, he has been writing about the real and immediate dangers posed by bioterrorism. He has argued for the stockpiling of drugs and vaccines, the training and mobilization of health workers, the education of the public, and the need to build an international consensus against the use of biological weapons. “We are ill-prepared to deal with a terrorist attack that employs biological weapons,” Henderson declared in a 1998 article in the journal Emerging Infectious Diseases. “The specter of biological weapons use is an ugly one, every bit as grim and foreboding as that of a nuclear winter.”Regarding smallpox specifically, Henderson warned: “If some modest volume of virus were to be released (perhaps by exploding a light bulb containing virus in a Washington subway), the event would go unnoticed until the first cases with rash began to appear 9 or 10 days later.” Because hardly any doctors have ever seen smallpox, and so few laboratories can test for it, several more days might go by before the first diagnosis was made. If only 100 people were originally infected, Henderson wrote, tens of thousands, including many unsuspecting hospital personnel, could have been exposed by the time the epidemic was identified. Hospital isolation wards and our national stores of vaccine would at that point be sorely tested.
“Greening” of buildings helps save the Chesapeake watershed CBF [(Chesapeake bay foundation) “Merrill Center proves "green" buildings work to Save the Bay”; C.D. Dollar February 23, http://www.cbf.org/site/News2?page=NewsArticle&id=10141] 2005
I've always been fascinated with how things work — from the complex engineering it takes to build bridges to the subtle connectedness between plants and animals within the Chesapeake ecosystem. Obviously, I lean hard toward the workings of the natural world, and although I sit tethered to a computer pounding on a keyboard to earn most of my living, I am fortunate that I can walk around the grounds of the Chesapeake Bay Foundation's Philip Merrill Environmental Center, which has much of the Bay in microcosm. Along the tidal shorelines I've spied immature bald eagles perch aloft, eyeing up canvasbacks as they feed inside Tolley's Point. Among the stand of hardwoods, pileated woodpeckers dart through the branches. A heron stalks the marsh shallows with its dagger-like bill at the ready. I also have to remind myself that, if I must be inside, I'm fortunate to work at a place that has great open space, is made of natural materials, and, as much as possible, is highly Bay-friendly. Since I've had an office within the building since it opened in December 2000, I felt a bit odd tagging along with a small group of visitors

from Wisconsin, Missouri, and Louisiana who were touring the Center recently. Yet, as CBF volunteer guide Ed Wintermute expertly explained the highly innovative features of the “green building,” I was soon reminded that the Merrill Center is far more complex than meets the eye. That fact wasn't lost on Jesse Mchling, however, who asked, “Why aren't all buildings built like this?” Another visitor, Victoria Bryant of St. Louis (MO), remarked, “If I build, I will build green.” Years prior to CBF opening the doors, tremendous thought and planning went into making the headquarters a global model of energy conservation, pollution reduction, and sustainable building techniques. In its nearly four years of operation, that attention to detail and sustainable building has paid off many times over. The 32,000-square foot office building — named for CBF donor and former trustee Philip Merrill — and its numerous sophisticated systems have kept thousands of pounds of polluting nitrogen from entering the Bay while saving huge amounts of energy and water. Overall, Merrill Center pollutes less than a typical office building of comparable size. One feature that elicits chuckles from visitors is the flushless, composting toilets, which are serious pollution reducers. Each day, these “green johns” prevent the equivalent of the waste generated by 100 people from entering the local sewage treatment plant and eventually area waters. In terms of energy conservation, Merrill Center uses 40% less energy than a typical office building while preventing roughly 2,500 pounds of polluting nitrogen and 1.6 million pounds of carbon dioxide from entering the Bay and the environment each year. CBF also saves nearly $22,000 per year in energy costs. To reduce electricity needs, the building faces south to get the maximum exposure for sun and the proper angle to take advantage of prevailing winds for natural lighting and ventilation. As a result, the Merrill Center's heating and cooling systems do not run 33% of the year. The Merrill Center is constructed of the most environmentally responsible building materials available, a “cradle-to-cradle philosophy,” meaning that construction materials are recycled, recyclable, and/or created through sustainable means that don't harm the environment. Building materials that do not contain VOCs (Volatile Organic Compounds), such as natural linoleum, paints, and adhesives, were used during construction. Indoor air quality is monitored by carbon monoxide and VOC sensors, and natural ventilation pumps fresh into the building. The stout posts, beams, and trusses are Parallam — strand lumber made from second-growth trees using the entire tree. This means no part of the tree is wasted. The galvanized steel siding and roofing, called Galvalume, is recycled. For flooring, cork and bamboo were used; cork can be stripped from a living tree without harm and bamboo can be harvested every three to five years and replenishes itself naturally. The building and the 31-acre parcel of land upon which it sits serve as an environmental education and exceeds the requirements of Maryland's Smart Growth criteria and Critical Areas Act. The facility is a training center for students, citizen volunteers, environmental groups, and decision makers. The grounds have been restored using native plants and trees, another way to prevent polluted runoff from entering nearby Black Walnut Creek and the Bay. Equally important is that scores of business organizations, architects, and government agencies have toured the building. Many of these governmental groups and businesses have become inspired to renovate and construct environmentally beneficial buildings, which will help save the Bay while saving money. It functions beautifully as the nerve center for CBF's programs and staff, and no one wants for comfort or efficiency. Yet more importantly, it is a global environmental model that operates in harmony with the land, natural resources, and the Chesapeake Bay. Simply, the Merrill Center proves ‘green' buildings work to help save the Chesapeake Bay watershed.

Observation four – solvency
FEMP can coordinate renewable development and dissemination in federal buildings Vestal Tutterow, Alexander Filippov, and Jeffrey Harris [Alliance to Save Energy- “Energy-Efficient New Federal Buildings: Awareness and Implementation of Federal Building Standards &Case Studies With support from the Federal Energy Management Program” http://www.ase.org/content/article/detail/478] April 2008
FEMP can play a leading role in addressing the issues and concerns expressed by the federal personnel we interviewed. FEMP’s experience in outreach and training within the federal sector can be tapped to educate federal personnel involved in building design and construction process. FEMP also has the opportunity to work closely with GSA through its new Office of High Performance Green Buildings to jointly develop guidance, training, and other resources related to the EISA requirements. The educational forum mentioned in the Recommendations section can provide a good opportunity to establish a working relationship with this new GSA office. FEMP is also positioned well to inform federal building design and construction personnel of emerging technologies and the roles these technologies can play in improving building energy efficiency. FEMP’s efforts to inform federal agencies of the new metering requirements can be expanded to encourage measurement and verification at federal facilities. Existing M&V protocols can be adopted, so the government does not need to develop any new standards or protocols. The new EISA requirements will significantly alter the way federal buildings are designed and constructed. The federal agencies will look to FEMP for guidance and clarifications, and this will likely require a rigorous, sustained effort to address. The recommended demonstration program can be a part of this effort. Some specific activities to consider that address EISA requirements include: - Working with the American Institute of Architects and others (coordinating with the Commercial Buildings Initiative) to develop operational guidance, by building type, on requirements for 55% reduction in fossil fuel-generated energy consumption, - Assisting DoD, Energy Star, GSA, and others in developing criteria that insures sustainable, energy-efficient design of DoD privatized military housing and leased buildings, - Developing guidance on incorporating energy-efficiency into the design of large capital investments that may not meet the definition of “major renovation”, and also developing a process for reviewing the capital investment decisions, - Developing guidelines for metering natural gas and steam, - Initiate a scoping study for meeting 30% of domestic hot water loads from solar water heating, - Developing guidelines, tools, and training (coordinated with the Commercial Buildings Initiative) related to building performance assurance, benchmarking, and web-based training.

Tax credits from FEMP – would reconcile issues with the EPAct of 05 and help federal agencies organize renovation. Vestal Tutterow, Alexander Filippov, and Jeffrey Harris [Alliance to Save Energy- “Energy-Efficient New Federal Buildings: Awareness and Implementation of Federal Building Standards &Case Studies With support from the Federal Energy Management Program” http://www.ase.org/content/article/detail/478] April 2008
FEMP should consider collaborating with the DOE Building Technologies Program and federal agencies to establish a long-term demonstration program that engages the architectural and engineering community, suppliers, and other stakeholders. The objective will be to design and build a series of demonstration projects that, with the EISA-directed zero energy buildings in mind, highlight the leading edge design strategies and technologies that demonstrate what will become standard practice 10 years out. Such a program will require a dedicated funding source, but the federal cost can be minimized if the program is leveraged with utility companies or other parties. FEMP should work to assure that the re-authorization of commercial tax credits includes the provision which allows the credits to go to the architectural and engineering firms designing high performance federal buildings. Additionally, FEMP should encourage the development of IRS guidelines that clearly describe baselines and scenarios in which the architectural and engineering firms are eligible for the tax credits. The new EISA requirements need to be reconciled with EPAct 2005 and the FEMP Final Rule, so that federal agencies can properly plan and budget for new construction and renovation projects. This will require considerable attention from FEMP and the agencies since CBECS and RECS have not been used as baselines in the past. For example, how will DOE determine the average energy consumption for each building type? What is the CBECS and RECS data include plug and other equipment loads, whereas the current energy-efficiency requirements exempt plug and equipment loads from the calculations
Only action on the part of federal government on buildings can reduce fossil-fuel generated energy and lead the private sector by exampleRK STEWART, President of the American Institute of Architects, 2/12/07. “ENERGY EFFICIENT FEDERAL BUILDINGS,” Testimony before the US Senate Committee on Energy and Natural Resources Subcommittee on Energy, http://www.aia.org/SiteObjects/files/RKStewart_WrittenTestimony_SenateEnergy.pdf
To reduce energy consumption in the building sector, the AIA believes that architects must advocate for the sustainable use of our earth’s resources through their work for clients. To support this principle, in December 2005, the AIA Board of Directors approved an official Institute position stating that all new buildings and major renovations to existing buildings be designed to meet an immediate 50 percent reduction in fossil fuel-generated energy (compared to a 2003 baseline) and that at five year intervals, that reduction target be increased by at least 10 percent until new and renovated buildings achieve carbon neutrality in 2030. Architects across the country have embraced this principle and are currently utilizing design practices that integrate built and natural systems that enhance both the design quality and environmental performance of the built environment. But in order to truly revolutionize the way our nation designs buildings, the public sector, especially the federal government, must also play a role. The federal government alone has jurisdiction over a significant portion of all buildings in the U.S. Through a combination of both regulation and incentives, we can achieve the goals of greatly reducing fossil fuel generated energy and improving energy efficiency nationwide. It is important for the federal government to show that energy efficient buildings are both realistic and cost-efficient. Requiring significant energy reduction targets in new and renovated federal buildings will demonstrate to the private sector that the federal government is leading by example. It would help spur the development of new materials, construction techniques, and technologies to make buildings more energy efficient. And it will help show that significant energy reductions are both practical and cost-effective. The AIA strongly urges Congress to take the lead in the fight against global warming by establishing new energy consumption standards for federal buildings. As Congress has jurisdiction over all federal buildings, Congress can literally show the way for the private sector to attain energy consumption reductions by the built environment.

FEMP does renewables – Arizona proves Nancy Carlisle [presented at the Association of Energy Engineers GlobalCon 2000 Conference Dallas, Texas “Renewable Energy Deployment in the Federal Sector: A Status Report Preprint” http://www.nrel.gov/docs/fy00osti/27958.pdf April 19–20,] 2000
Some representative examples (out of the tens of projects assisted) of design assistance last year included a water-heating system for the Phoenix Federal Correctional Institute, a photovoltaic project at Joshua Tree National Park, and assistance to the EPA in the procurement of 100% green power for their Richmond, CA laboratory. • FEMP helped the Phoenix Federal Correctional Institute to design and install an 18,000-square foot-solar parabolic water heating system to preheat 50,000 gallons of water needed for the laundry, showers and kitchen system at the facility. The system was financed using an Energy Savings Performance Contract (ESPC). The system will reduce annual electrical energy usage by 1.3 million KWh, saving taxpayers $72,000 annually. FEMP helped the National Park Service to buy and install photovoltaic system for many of their facilities. One recent example is the replacement of two 32-kilowatt (kW) diesel generators with photovoltaics to provide power to the Cottonwood Spring Area at Joshua Tree National Park. The PV system cuts the $50,000 annual operating cost by 90% and the new system has a simple payback under 6 years. • FEMP worked with the GSA to assist the Environmental Protection Agency in purchasing 100% renewable power for its Richmond, California, laboratory. The lab’s load is 1,800 MWh/year. Their average annual cost of power is approximately $154,000. The premium for the power from renewable energy systems is 10% more per year.

***BUILDINGS***

Inherency – Current Policies Regulations fail – because of a lack of incentives.ASE (Alliance to save energy) [a coalition of prominent business, government, environmental, and consumer leaders who promote the efficient and clean use of energy worldwide to benefit consumers, the environment, the economy, and national security. “Leading by Example: Improving Energy Productivity in Federal Government Facilities” www.ase.org] 1998 Federal agencies have clearly made a lot of progress, but they have only started to tap the opportunities. Federal government buildings still consume about 32 percent more energy per square foot than the nation’s building stock at large.14 A cumulative investment of $4.7 billion over the next eight years would save taxpayers an additional $1 billion annually. Those investments would pay for themselves in just four to five years, after which the annual energy cost savings could be given back to taxpayers, or used to reduce debt or mend Social Security.15 Why Energy-Saving Projects Get Stalled The enormous savings potential is not enough in itself to make energy-efficiency improvements happen in federal buildings and facilities. Energy-efficiency investments are continually stalled or prevented for a host of reasons. n Energy efficiency is not part of agencies’ core missions—Energy efficiency is generally not a priority within the agencies. It is often perceived as a distraction and an added burden. Very rarely do senior officials within the agencies bring attention to the issue, leaving the responsibility to federal workers who would make the improvements unsupported and unguided. Especially when agencies are forced to cut staff, personnel are pulled away from energy management to focus more on activities related to agencies’ core missions. n Agencies don’t have enough money— Agencies have not received adequate funding from Congress to permit them to invest in the many remaining cost effective energy-efficiency projects. Agencies are caught in a double-bind in that they are required by law and executive order (as discussed below) to reduce energy use and purchase energy-efficient equipment, but they are not given sufficient resources to meet those requirements. Simply put, they face unfunded mandates. Due to constraints in other areas of their budgets, agencies sometimes reallocate energy-efficiency monies for other activities or don’t request energy-efficiency funding at all. n Agencies receive little oversight and are given few incentives—While agencies are required by law and executive order to reduce energy use and purchase energy-efficient equipment, there is little (if any) pressure from Congress and the president to do so. Agencies also recognize that reducing energy costs will simply result in reductions in their energy budgets. n Lack of awareness and knowledge— Implementing energy-efficiency projects requires knowledge of the opportunities and technologies that are currently available and the cost and performance of those technologies in similar applications. It also requires that facility managers consider the life-cycle cost of operating a facility rather than just the first cost of a building system or a piece of equipment. More training and education of federal government personnel about energy-efficiency opportunities and implementation are needed. Over the last two decades, a considerable amount of legislation, executive orders, rule making, and programs have been developed and implemented to encourage investments in energy efficiency. Congress and presidents have established various goals and requirements related to federal energy management. Billions of dollars have been spent Leading by Example: Improving Energy Productivity in Federal Government Facilities 10 Introduction 11 to support agencies’ efforts to reduce their energy use. Federal personnel have spent countless hours in classrooms learning about energy-efficiency opportunities. Efforts made over the last two decades have resulted in heightened awareness of energy efficiency opportunities, greater incentives to implement energy-saving measures, and increased investment resources. Nevertheless, many obstacles still need to be overcome if the federal government is to maximize the productivity of its energy use. The following chapters describe various efforts currently under way, discuss problems, and suggest solutions.
Bush has instituted “green” policies for federal buildings. – but more needs to be done Washington post [Juliet Eilperin and Lyndsey Layton McCain Pledges Greener Government Washington Post: Republican Candidate Says Federal Government Would Buy Fuel-Efficient Vehicles, Retrofit Office Space Comments 56http://www.cbsnews.com/stories/2008/06/25/politics/washingtonpost/main4206931.shtml?source=RSS&attr=_4206931] June 25, 2008
President Bush has already instituted energy-efficiency measures for the White House and the government. The changes are not as dramatic as the proposals Obama has outlined, though they are more specific than McCain's. In January 2007, the president issued an executive order calling on the government to "increase purchase of alternative fuel, hybrid, and plug-in hybrid electric vehicles when commercially available" and to "reduce petroleum consumption in fleet vehicles by 2 percent annually through 2015," among other measures. He and Laura Bush have also made changes in the White House, replacing all incandescent bulbs in hallways with compact florescent lights, installing low-consumption toilets in many places and putting in energy-efficient cooling units. Speaking at a town hall meeting yesterday in a nature preserve near the Las Vegas Strip, Obama criticized his rival's energy plans, though he did not mention McCain's proposal to "green" the federal government. Referring to a McCain statement Monday in which the senator from Arizona acknowledged that new offshore U.S. drilling would not affect oil prices for years, Obama said that the presumptive GOP nominee is focused on extolling the "psychological" benefits of drilling. He called McCain's proposed $300 million prize for a new electric car battery a "bounty" for "some rocket scientist to win." Obama described the nation's current high gasoline prices as the product of "false promises and irresponsible policies" that have prevented new technology and energy sources from replacing fossil fuels. "For decades, John McCain has been part of this failure in Washington," Obama said. The McCain campaign responded by saying that "Barack Obama has become the 'Dr. No' of energy, refusing to accept any idea that will contribute to solving America's energy crisis." Outside groups yesterday praised both candidates for seeking to curb the government's carbon emissions. Julia Bovey, spokeswoman for the Natural Resources Defense Council, said municipal governments have made similar changes and cut back on their energy use as a result. "We have seen cities and towns across America make a point to start buying efficient cars and trucks, and it can really make a difference," she said. "There's no reason the federal government should continue to buy dinosaurs." Steve Ellis, vice president of the budget watchdog group Taxpayers for Common Sense, said the government should pursue "a generic approach, meaning certain companies or favored individuals aren't getting huge windfalls." "As the federal government tries to pursue strategies to make its operation more efficient, as long as you do it in a cost-efficient manner, you're helping lead the way," he said.
The federal government has been leading by example in energy efficiency, but needs to promote renewables
DoE, US Department of Energy, 11/10/06. “Federal Energy Management Program, - About the Program” Energy Efficiency and Renewable Energy. http://www1.eere.energy.gov/femp/about/index.html
As the largest single energy consumer in the United States, the Federal government has both a tremendous opportunity and a clear responsibility to lead by example with smart energy management.While the government has made considerable progress improving its use of energy, much more can be done to save energy, promote the use of renewable technologies, and reduce our dependence on foreign oil.

Current federal policies fail – more needs to be done Joe Loper, Steve Capanna and Jeffrey Harris [“Reducing Greenhouse Gas Emissions In Federal Buildings, Facilities and Vehicles Alliance to Save Energy For the Presidential Climate Action Project” www.ase.org/files/3996_file_ghg_emissions_pcap.pdf] April 2008
To reflect the uncertainties related to federal government energy use and carbon emissions, we developed three scenarios that encompass the likely range of future federal government emissions given current policies. From those baselines, we calculated emissions that would result from the implementation of achievable cost-effective energy-efficiency improvements. We then show what additional carbon emissions reductions would be needed to attain emissions levels 80 percent below 1990 in 2050. All three baseline scenarios assume that total building and facility square footage will remain the same through 2050 and that after 2015 (when existing energy reduction requirements end), building energy consumption will be stable. This is consistent with historical trends – from 1996 to 2006, building and facility space actually decreased slightly.30
Status quo policies fail – government doesn’t comply, doesn’t know of regulations and wastes trillions in BTU and tax payer’s moneyNils Petermann and Jeffrey Harris ;Alliance to Save Energy With support from the Federal Energy Management Program ‘Deploying New Technologies to Increase Energy Savings in the Federal Sector” http://www.ase.org/content/article/detail/4789] April 2008
The Energy Policy Act of 2005 (EPAct 2005) required federal agencies to purchase energy-efficient products. These requirements were not new, but rather a codification into law of existing Executive Orders. Nevertheless, the Alliance to Save Energy’s research suggests compliance remains extremely low. In fact, of 164 examined government solicitations that included requests for products covered by this legislation, only seven percent appeared to be fully compliant . The Alliance also talked to 25 government procurement officials, many of whom were listed as contacts on solicitations for products covered by the EPAct regulation. Only two of those 25 government employees knew about the energy-efficient procurement requirement in detail and believed they were partly responsible for ensuring the requirement was followed . The General Services Administration (GSA) and the Defense Logistics Agency (DLA), the two main government-run websites that sell exclusively to government agencies, showed similar levels of non-compliance, failing to sell any compliant models in 65 percent and 80 percent of the covered product categories, respectively. Failure to fully comply with federal requirements for energy-efficient purchasing wastes money and increases emissions of carbon and other pollutants. Non-compliance with the energy-efficiency procurement regulations could be wasting as much as 25 trillion Btu of site energy per year.1 In 2006, on average, federal buildings paid $16.62 per million Btu they used,2 so 25 trillion Btu represents $415 million of wasted taxpayer money at 2006 prices (about $435 million at today’s prices.3) That wasted energy also results in the emission of about 840 thousand metric tons of carbon equivalent annually (about 3 million metric tons of carbon dioxide).4

No way for third parties to determine if status quo energy management works – lack of transparency prevents determination of efficiency of products Nils Petermann and Jeffrey Harris [;Alliance to Save Energy With support from the Federal Energy Management Program ‘Deploying New Technologies to Increase Energy Savings in the Federal Sector” http://www.ase.org/content/article/detail/4789] April 2008
Although the numbers in our sample are small for any single government agency, no agency had higher than a 33 percent compliance rate in the solicitations examined. The Department of Justice only listed three relevant solicitations, one of which complied. The Department of Commerce (one of four) and the Environmental Protection Agency (two of 10) had the next highest compliance rates. Several agencies did not have any compliant solicitations among the limited number we studied. Furthermore, it proved impossible for us to verify that vendors were supplying compliant products even where solicitations clearly stated the requirements (or, conversely, whether the products supplied in response to non-compliant solicitations might have been energy-efficient and compliant, anyway). While FEDBIZOPPS posts very detailed solicitations from every agency, lists which vendor has been awarded which contract, and reports how much the agency is paying for the products, it does not specify which products the vendor is supplying to meet a contract. This lack of transparency could be a serious concern. Since familiarity with the regulation by government officials is low (see the “Procurement Staff” section, below), procurement agents may not be able to double-check winning bids to ensure compliance with the regulations, even when compliant products are specified in a solicitation. Unless there is an easy way for third-parties (like FEMP, the Office of Federal Procurement Policy (OFPP), advocacy agencies, or other vendors) to review the specifications of winning bids, it will be very difficult to estimate compliance with any confidence. 17
USFG needs more renewable energy. The current amount is not enough.Joe Loper, Steve Capanna and Jeffrey Harris Alliance to Save Energy For the Presidential Climate Action Project April 2008
DOE’s guidance on renewable energy credits, released in January 2008, phases out the use of RECs for meeting energy intensity requirements, allowing agencies to meet 60 percent of their 2008 goal through RECs, 40 percent of the 2009 goal, 20 percent of the 2010 goal, and 10 percent of the 2011 goal. RECs are not allowed to be counted towards agency energy intensity goals for any subsequent years. Long-term renewable energy purchases of 10 years or more that contribute to developing new renewable energy generation are allowed to meet a slightly higher percentage of the energy intensity requirements through 2011, but their eligibility also expires in 2012. The use of on-site renewable generation to meet the energy intensity requirements is not restricted.124 Counting RECs toward energy intensity targets (and even renewable energy requirements) is somewhat controversial. For one, there is a question whether the RECs stimulate additional renewable energy generation or if they simply take credit for renewable generation that already is occurring. If the latter is the case, then the RECs may represent little or no real value in terms of emissions reductions. However, once the demand for RECs exceeds the amount of existing renewable energy then they could induce additional investments in renewable generation. Recommendation: On-site generation of renewable energy – but not renewable energy credits – should be allowed to count towards the energy intensity requirement.

Inherency – Coal and Oil Bush’s sexy interns include king coal and BIG oil AMANDA GRISCOM [Grist writer; Grist is based in the Emerald City of Seattle, in the Evergreen State of Washington (see the green theme?), with contributors scattered the world 'round. a nonprofit organization funded by foundation grants puts a light spin on gloom and doom; “Alternative Energy Crisis When it comes to renewable energy, the DOE is DOA”; http://www.grist.org/news/powers/2002/06/11/alternative/] 11 Jun 2002The question isn't whether the Bush administration is in bed with the old-school energy industry; most of us have pretty much accepted that Big Oil and King Coal are the current sexy interns in the White House. Nor is the question whether we should be bracing for another oil shock; given the Iraqi oil boycott and political turbulence in Venezuela and Nigeria (two of the biggest oil suppliers to the U.S.), the likelihood of a third oil crisis heightens with every passing headline. The question is not even whether Washington should accelerate the shift toward a new-school energy system based on clean technologies and energy efficiency; thanks to a combination of the current political tensions and ever-worsening symptoms of global warming, the need for that shift has never loomed larger in the public mind.

No Switch Now – Costs
The biggest barrier to green buildings is cost – can’t afford to renovate
RK Stewart, President of the American Institute of Architects, 4/25/08. “Drawing on Experience,” Interview by Sarah van Shagen. http://www.grist.org/feature/2008/04/25/
Perhaps the biggest impediment that we run into on a regular basis is the issue of cost. On the one hand, there are a lot of things we can do that really have no cost or are transparent in cost, so we should be picking those things up and doing them day in and day out. Don't even think about it; it's just what you do. But it's changing what you do that's really important.
One of the biggest problems we've got in the real-estate industry right now is that people tend to separate capital costs to build or renovate a building from the operations and maintenance cost. ... [We think it's important to] have the folks who are going to be running the building at the table during the design process so you know things that will have the impact are considered, and make that change.

AT: XO Makes Not Inherent
Executive orders are failing now – long term solutions are key
RK Stewart, president of American Institute of Architects, 2/12/07 (“Energy Efficient Federal Buildings” http://www.aia.org/SiteObjects/files/RKStewart_WrittenTestimony_SenateEnergy.pdf)
Setting declining caps on energy usage is not a new idea. In 1999, President Clinton issued an executive order requiring energy consumption reductions in all federal buildings; The Energy Policy Act of 2005 extended and deepened these reduction goals, and last year, Governor Bill Richardson of New Mexico signed an executive order calling for a 50 percent reduction in energy consumption for new and renovated public buildings in the state. And just last month, President Bush issued an executive order requiring federal agencies to reduce energy use by almost a third over a 2003 baseline by 2015. These are important first steps, but we need an aggressive commitment to long term energy reductions for new buildings and major renovations, well into the future.

AT: White House Makes Not Inherent
White House solar panels were built “under the radar” – no public perception
Cooler Planet, Renewable energy blog, 3/8/08. “Solar Panels at the White House,” http://blog.coolerplanet.com/2008/03/08/solar-panels-at-the-white-house/
The Park Service, who oversees White House maintenance, decided to install a new set of solar panels on a maintenance building adjacent to the main house because as James Doherty, an architect with the National Park Service told Environmental Building News in 2003, “we are always looking for opportunities to promote renewable energy and sustainable design and we decided to take advantage of this next opportunity to pursue that mission at the White House.”
Although the White House has never revealed (for security reasons) how much energy each system generates, it acknowledges the system is modest and more a symbol of the Park Service’s commitment to renewable energy than an all-out power system. The Bush Administration itself never really announced the project. Instead the installation was completed “under the radar;” industry trade journals were the media that picked up the story.

Lots o’ Buildings The federal government owns hundreds of thousands of buildings – the most are located in California
Insight on the News, News World Communication publication, 4/19/99. “How Big is Big?,” http://findarticles.com/p/articles/mi_m1571/is_14_15/ai_54442608
As of September 1997, the federal government owned 430,186 buildings, totaling nearly 3 billion square feet of floor space and costing more than $207 billion annually to maintain. California has the most federal buildings, with nearly 60,000; Vermont has the fewest, with 311.
And the feds rent another 76,761 buildings, with a combined 300 million square feet of floor space, at an annual cost of around $3.2 billion -- an amount of space roughly equal to the state of Delaware. Nearly 130 million square feet of that rented space is used for general purposes and 80 million is used by post offices, while just over 3.2 million square feet is used for schools and 2.2 million square feet for research and development.

The federal government is the largest consumer of energy in the US AMANDA GRISCOM [Grist writer; Grist is based in the Emerald City of Seattle, in the Evergreen State of Washington (see the green theme?), with contributors scattered the world 'round. a nonprofit organization funded by foundation grants puts a light spin on gloom and doom; “Alternative Energy Crisis When it comes to renewable energy, the DOE is DOA”; http://www.grist.org/news/powers/2002/06/11/alternative/] 11 Jun 2002Would the Bush administration, then, consider something less binding -- like using renewable energy to power federal buildings? With more than 500,000 buildings and a much larger number of vehicles, the federal government uses 2 percent of all U.S. energy, making it the largest single energy consumer in the nation. If the Bush administration invested in a bulk purchase of solar and wind technology for federal buildings, the argument goes, it would stimulate economies of scale and reduce prices for mainstream consumers. Garman says he is working on it, but as it stands, not even the DOE headquarters has a solar panel rigged to its roof

Fed Buildings Emissions Federal buildings account for 37% of the government’s energy usage, use 1.5% of US electricity, and emit 2% of building emissions
DAVID L. WINSTEAD, Commissioner, Public Buildings Service, U.S. General Services Administration, 4/17/08. Testimony on the Greening of Federal Buildings before the US House of Representatives. http://gsa.gov/Portal/gsa/ep/contentView.do?pageTypeId=8199&channelId=-18801&P=&contentId=24402&contentType=GSA_BASIC
The Federal government is the largest single consumer of energy in the United States. According to the Department of Energy, Federal buildings account for 37% of the government’s energy usage, use as much as 1.5 percent of the Nation’s electricity and emit about 2 percent of all U.S. building-related greenhouse gases. Since 1985, Federal agencies reduced their energy intensity in Federal buildings by 23 percent in 2005 (for standard buildings). Agencies cut their carbon emissions from facility energy use by 3.3 million metric tons in 2005 compared to 1990. At GSA, since 1985, we have cut our energy consumption by 30 percent and carbon emissions by 281 thousand metric tons (comparable to removing 210 thousand vehicles from the road in one year) in our public buildings. We are using green principles and leading by example in the efficient use of energy, water and materials, as well as promoting space that enhances productivity and the work environment.

US Buildings Emissions US buildings alone emit more than every country in the world but China and are likely to increase
James E. McMahon, Head of Energy Analysis Department Lawrence Berkeley National Laboratory, 5/06. [“Chapter 9. Buildings,” Technical/Peer Review draft]
The buildings sector of North America was responsible for the annual emission of 2,712 Mt CO2 in 2003, which is 36% of total North American CO2 emissions and 9% of global emissions. U.S. 11 buildings alone are responsible for more CO2 emissions than total CO2 emissions of any country in the world, except China. 13 • Carbon dioxide missions from energy use in buildings in the United States and Canada has increased by 30% since 1990, an annual growth rate of 2.1% per year. 15 • Carbon dioxide emissions from buildings have grown with energy consumption, which in turn is increasing with population and income. Rising incomes have led to larger residential buildings, with 17 the amount of living area per capita increasing in all three countries of North America. 18 • These trends are likely to continue in the future, with increased energy efficiency of building materials 19 and equipment and slowing population growth, especially in Mexico, only partially offsetting the 20 general growth in population and income.
US buildings emit 10 times as much as Canadian and Mexican buildings combined
James E. McMahon, Head of Energy Analysis Department Lawrence Berkeley National Laboratory, 5/06. [“Chapter 9. Buildings,” Technical/Peer Review draft]
Residential and commercial buildings in the United States are responsible for 38% of CO 2 emissions from energy nationally and 33% of emissions from energy in North America as a whole. Total emissions from buildings in the United States are ten times as high as in the other two countries combined, due to a 25 large population compared to Canada, and high per capita consumption compared to Mexico. On a per 26 capita basis, building energy consumption in the United States is comparable with that of Canada, about 27 40 GJ equivalent per person per year. This is about six times higher than in Mexico, where 7 GJ is 28 consumed per person per year.
US buildings emit tons of GHGRK Stewart, president of American Institute of Architects, 2/12/07 (“Energy Efficient Federal Buildings” http://www.aia.org/SiteObjects/files/RKStewart_WrittenTestimony_SenateEnergy.pdf)
According to the Department of Energy’s Energy Information Administration, buildings and their construction are responsible for nearly half of all greenhouse gas emissions produced in the U.S. every year. DOE’s recently released Building Energy Data Book reveals that the building sector accounts for 39 percent of total U.S. energy consumption, more than both the transportation and industry sectors.1 The same study found that buildings are responsible for 71 percent of U.S. electricity consumption and that buildings in the United States alone account for 9.8 percent of carbon dioxide emissions worldwide.2 In fact, according to the Department of Energy, U.S. buildings account for nearly the same amount of carbon emissions as all sectors of the economies of Japan, France, and the United Kingdom combined.3

Building GHG emissions key to warming – emit half of all emissions
Architecture 2030, non-profit organization advocating low-emission buildings, 2008. “Global Warming, Climate Change, and the Built Environment.” http://www.architecture2030.com/
Rapidly accelerating climate change (global warming), which is caused by greenhouse gas (GHG) emissions, is now fueling dangerous regional and global environmental events. Data from the U.S. Energy Information Administration illustrates that buildings are responsible for almost half (48%) of all GHG emissions annually. Seventy-six percent of all electricity generated by US power plants goes to supply the Building Sector. Therefore, immediate action in the Building Sector is essential if we are to avoid hazardous climate change.

USFG Emissions USFG accounts for 96 million tons of CO2 emissions Joe Loper, Steve Capanna and Jeffrey Harris [“Reducing Greenhouse Gas Emissions In Federal Buildings, Facilities and Vehicles Alliance to Save Energy For the Presidential Climate Action Project” www.ase.org/files/3996_file_ghg_emissions_pcap.pdf] April 2008
The United States government is the single largest consumer of energy in the world. In 2006 thefederal government used 1.5 quadrillion Btu (quads) of “primary” energy (including the fuelused to generate electricity at the power plant),1 or 1.5 percent of total energy use in the UnitedStates.2 Taxpayers in the U.S. paid $17.7 billion for that energy,3 which was responsible forsome 96 million metric tons of carbon dioxide (CO2) emissions4 – 1.6 percent of U.S. emissions.5About 55 percent of the energy used by the federal government and 37 percent of its energy costs(about .85 quadrillion Btu and $6.5 billion) is for heating, cooling and powering more than500,000 federal buildings around the country.6 The rest is for vehicles and equipment, primarilymilitary planes, ships and land vehicles.

***SOLVENCY***

Federal Buildings Key - Emissions US buildings consume huge amounts of energy and emit as much carbon as Japan, France, and the UK combined – Federal action on buildings is key to changing future energy use and decreasing national emissions
RK STEWART, President of the American Institute of Architects, 2/12/07. “ENERGY EFFICIENT FEDERAL BUILDINGS,” Testimony before the US Senate Committee on Energy and Natural Resources Subcommittee on Energy, http://www.aia.org/SiteObjects/files/RKStewart_WrittenTestimony_SenateEnergy.pdf
According to the Department of Energy’s Energy Information Administration, buildings and their construction are responsible for nearly half of all greenhouse gas emissions produced in the U.S. every year. DOE’s recently released Building Energy Data Book reveals that the building sector accounts for 39 percent of total U.S. energy consumption, more than both the transportation and industry sectors. 1 The same study found that buildings are responsible for 71 percent of U.S. electricity consumption and that buildings in the United States alone account for 9.8 percent of carbon dioxide emissions worldwide. 2 In fact, according to the Department of Energy, U.S. buildings account for nearly the same amount of carbon emissions as all sectors of the economies of Japan, France, and the United Kingdom combined. Therefore, if we in the United States want to be serious about energy efficiency and energy reductions, buildings must become a significant part of the discussion. The data shows that the building sector is only going to become more critical to the discussion. Annual U.S. energy consumption is projected to increase by 32 percent over the next twenty five years 4 . The AIA believes strongly that now is the time to act to reverse this course and start making significant reductions in the amount of fossil-fuel generated energy our nation consumes through its buildings. Over the next 30 years, the character of the built environment will change dramatically. Currently, U.S. building stock sits at 300 billion square feet. Experts predict that between now and 2035, 52 billion square feet will be demolished, 150 billion square feet will be remodeled, and another 150 billion square feet will be newly constructed. 5 Because buildings are such a major producer of greenhouse gases, the AIA believes that if Congress and our nation want to reduce greenhouse gas emissions, addressing energy consumption in the next generation of buildings is a vital endeavor. We believe that the federal government can and must take the lead to change the way our buildings use energy.
Buildings Key - Emissions
Buildings are key to reduce emissionsRK Stewart, president of American Institute of Architects, 2/12/07 (“Energy Efficient Federal Buildings” http://www.aia.org/SiteObjects/files/RKStewart_WrittenTestimony_SenateEnergy.pdf)
Therefore, if we in the United States want to be serious about energy efficiency and energy reductions, buildings must become a significant part of the discussion. The data shows that the building sector is only going to become more critical to the discussion. Annual U.S. energy consumption is projected to increase by 32 percent over the next twenty five years4. The AIA believes strongly that now is the time to act to reverse this course and start making significant reductions in the amount of fossil-fuel generated energy our nation consumes through its buildings. Over the next 30 years, the character of the built environment will change dramatically. Currently, U.S. building stock sits at 300 billion square feet. Experts predict that between now and 2035, 52 billion square feet will be demolished, 150 billion square feet will be remodeled, and another 150 billion square feet will be newly constructed.5 Because buildings are such a major producer of greenhouse gases, the AIA believes that if Congress and our nation want to reduce greenhouse gas emissions, addressing energy consumption in the next generation of buildings is a vital endeavor. We believe that the federal government can and must take the lead to change the way our buildings use energy.

Federal Buildings Key – Private Sector

Buildings Key – Environment/Economy
Federal buildings are key to the environment and the economy – Canada proves
Loretta Legault Director of Environmental Operations for Government - Environment Canada, 2000. “TOWARDS GREENER GOVERNMENT PROCUREMENT: AN ENVIRONMENT CANADA CASE STUDY,” Executive Summary. http://www.apo-tokyo.org/gp/e_publi/gsc/0305RES_PAPERS.pdf
Building management represents an important greener procurement opportunity where a coordinated federal program can result in significant environmental and economic savings. The Federal Buildings Initiative (FBI), designed by the federal department of Natural Resources Canada (NRCan) in 1991, helps managers to take advantage of long-term cost savings of greener building operations. The FBI involves an innovative partnership between the public and private sector to improve the energy efficiency in federal-owned facilities without financial investment or risk on the part of the Government of Canada. The FBI program uses private capital, resulting from longer-term cost savings, to finance building energy, water, and air system retrofits. Environment Canada issued the first energy performance contract awarded under the FBI in 1993 to retrofit the Canada Centre for Inland Waters in Burlington. The FBI retrofit program included upgrades to the building electrical and mechanical systems; targeted reductions in water consumption; and the installation of a new electricity and heating production system. These initiatives have resulted in an annual reduction of carbon dioxide emissions by 12,700 metric tons and yearly savings of CDN$ 930,000 after a 7.2 year pay back period. Following the expiration of the contract, these savings will be retained by the Department. Opportunities to implement the FBI program for other Environment Canada sites across the country have also been undertaken. One such opportunity was Place Vincent Massey. It was selected as the site to launch the FBI model in a leased building, the first project of its kind initiated by the federal government. The project was initially proposed by Environment Canada to NRCan, Public Works and Government Services Canada (PWGSC) and the landlord which resulted in a “buy-in” from all parties involved. The potential for energy savings is estimated at CDN$ 150,000 annually. The FBI is considered to be one of the most successful environmental programs for federal operations as it has resulted in significant environmental and financial savings, and supports Canada’s environmental industry.

Federal Buildings Key – Spillover Renewable energy in federal buildings key to renewables market – largest energy consumer
Amanda Griscom, energy analyst at the environmental consulting firm GreenOrder, 6/11/02. “Alternative Energy Crisis,” Grist Magazine. http://www.grist.org/news/powers/2002/06/11/alternative/
Would the Bush administration, then, consider something less binding -- like using renewable energy to power federal buildings? With more than 500,000 buildings and a much larger number of vehicles, the federal government uses 2 percent of all U.S. energy, making it the largest single energy consumer in the nation. If the Bush administration invested in a bulk purchase of solar and wind technology for federal buildings, the argument goes, it would stimulate economies of scale and reduce prices for mainstream consumers. Garman says he is working on it, but as it stands, not even the DOE headquarters has a solar panel rigged to its roof.
Sustainable federal buildings spill over – educate people about environmental solutions
John L. Howard, Jr., Federal Environmental Executive- The Office of the Federal Environmental Executive, 2003. “The Federal Commitment to Green Building: Experiences and Expectations,” OFEE, http://www.ofee.gov/sb/fgb_report.pdf
First, buildings affect land use, energy use, communities, and the indoor and outdoor environment. Given the size and scope of Federal buildings – the government owns nearly 500,000 buildings covering 3.1 billion square feet, accounting for 0.4 percent of the nation’s energy usage, and emitting about 2 percent of all U.S. building-related greenhouse gases – we have the opportunity and responsibility to reduce these impacts. Using sustainable principles in buildings can reduce these impacts and also improve worker conditions and productivity, increase energy, water, and material efficiency, and reduce costs and risks.
Second, sustainable buildings can be showcases to educate people about environmental issues, possible solutions, partnerships, creativity, and opportunities for reducing environmental impacts in our everyday lives. Hundreds of millions of people visit and work in Federal facilities each year. And third, green buildings represent the application in one place of many of the sustainable concepts the Federal government is working on – such as environmental management systems, waste prevention and recycling, and green product purchases.
Federal buildings key to sustainable development globally – communicate environmental ideals
John L. Howard, Jr., Federal Environmental Executive- The Office of the Federal Environmental Executive, 2003. “The Federal Commitment to Green Building: Experiences and Expectations,” OFEE, http://www.ofee.gov/sb/fgb_report.pdf
Federal buildings not only provide space for Federal activities and workers—they also serve as symbols of the country’s ideals and priorities. Given that these structures and their sites have tremendous impacts on our natural environment, our economy, and worker productivity and health, the Federal government is rethinking how it builds today to enhance the future. Federal building professionals are exploring opportunities to minimize habitat disturbance and optimize energy, water, and materials use during the siting, construction, renovation, and operation of buildings. In addition, the Federal government is striving to create healthier indoor environments by specifying environmentally preferable building products and designing buildings to maximize natural daylighting and ventilation. The Federal government should provide leadership in environmental design and construction in order to ensure America’s future prosperity and resource independence and lay the foundation for environmentally, socially, and economically sustainable development throughout the U.S. and the world.
Only action on the part of federal government on buildings can reduce fossil-fuel generated energy and lead the private sector by example
RK STEWART, President of the American Institute of Architects, 2/12/07. “ENERGY EFFICIENT FEDERAL BUILDINGS,” Testimony before the US Senate Committee on Energy and Natural Resources Subcommittee on Energy, http://www.aia.org/SiteObjects/files/RKStewart_WrittenTestimony_SenateEnergy.pdf
To reduce energy consumption in the building sector, the AIA believes that architects must advocate for the sustainable use of our earth’s resources through their work for clients. To support this principle, in December 2005, the AIA Board of Directors approved an

official Institute position stating that all new buildings and major renovations to existing buildings be designed to meet an immediate 50 percent reduction in fossil fuel-generated energy (compared to a 2003 baseline) and that at five year intervals, that reduction target be increased by at least 10 percent until new and renovated buildings achieve carbon neutrality in 2030. Architects across the country have embraced this principle and are currently utilizing design practices that integrate built and natural systems that enhance both the design quality and environmental performance of the built environment. But in order to truly revolutionize the way our nation designs buildings, the public sector, especially the federal government, must also play a role. The federal government alone has jurisdiction over a significant portion of all buildings in the U.S. Through a combination of both regulation and incentives, we can achieve the goals of greatly reducing fossil fuel generated energy and improving energy efficiency nationwide. It is important for the federal government to show that energy efficient buildings are both realistic and cost-efficient. Requiring significant energy reduction targets in new and renovated federal buildings will demonstrate to the private sector that the federal government is leading by example. It would help spur the development of new materials, construction techniques, and technologies to make buildings more energy efficient. And it will help show that significant energy reductions are both practical and cost-effective. The AIA strongly urges Congress to take the lead in the fight against global warming by establishing new energy consumption standards for federal buildings. As Congress has jurisdiction over all federal buildings, Congress can literally show the way for the private sector to attain energy consumption reductions by the built environment.
Regulations needed on future buildings (spillover)
RK Stewart, president of American Institute of Architects, 2/12/07 (“Energy Efficient Federal Buildings” http://www.aia.org/SiteObjects/files/RKStewart_WrittenTestimony_SenateEnergy.pdf)
We encourage Congress to build upon these sound policy steps by taking an even more aggressive stance. A number of Senators have recently introduced legislation that sets new energy reduction goals in existing federal buildings. In most cases, these proposals would require federal agencies to retrofit their facilities to meet the energy savings targets. While the AIA is happy to see Congress address the issue, we recommend that instead of mandating retrofits, Congress should also focus energy reduction goals on new construction and buildings undergoing significant renovations as it is easier and more cost-effective to address energy usage issues beginning with the design stage of the building process. Requiring all new and significantly renovated federal buildings to consume significantly less fossil-fuel generated energy is a bold idea, but one whose time has come. It would show the world and the private sector that the United States government believes that climate change is real and that aggressive action is needed in order to reverse its course. It demonstrates that the AIA-recommended energy reduction targets are achievable in new and significantly renovated buildings, often through little or no additional life cycle costs.

Federal Gov’t Key - Spillover
A green government is key to environmentally-friendly policy and market – involves policy-makers
Loretta Legault Director of Environmental Operations for Government - Environment Canada, 2000. “TOWARDS GREENER GOVERNMENT PROCUREMENT: AN ENVIRONMENT CANADA CASE STUDY,” Executive Summary. http://www.apo-tokyo.org/gp/e_publi/gsc/0305RES_PAPERS.pdf
Effective use of federal spending power also helps to strengthen market demand for environmental goods, services, and technologies, thus supporting development of and innovation in Canada’s environmental industry. The environmental industries sector in Canada is large and growing. It is composed of 5,950 firms employing 159,932 workers and has annual sales of $11.6 billion.4 Canada’s environmental industry is largely an enabling sector that provides expertise, technologies, and services to meet the environmental needs of traditional industrial sectors. While strong environmental regulations are one of the most important drivers for the demand of environmental services, federal spending can certainly add to overall market demand for these services. Finally, the process of implementing a greener government procurement strategy is an effective means to foster positive cultural change and improve employee commitment within individual departments. This is due to the fact that greener government action- plans and training programs engage employees in the change process, increase organizational awareness, and encourage personal responsibility for the environment.
Federal action on the environment spills over – feds manage the most resources
DoE, US Department of Energy, 5/01. “GREENING FEDERAL FACILITIES, Section 1.2: Purpose” http://www1.eere.energy.gov/femp/pdfs/29267-1.2.pdf
The bottom line is this: Federal facility managers probably manage more resources and have more im- pact on the environment than any other group in the world. Entire changes in direction relative to energy and environmental quality are possible through their collective action. This guide is designed to provide facility managers with the information they need to make wise energy and environmental decisions that not only reduce energy consumption and protect the environment, but also save money and improve the productivity of Federal workers.
Federal use of renewables key to the green market – high-visibility
DoE, US Department of Energy, 5/01. “GREENING FEDERAL FACILITIES” http://www.osti.gov/energycitations/servlets/purl/783403-E80ZoR/native/783403.pdf
The Federal government is the world’s largest single buyer of many products. By providing a large, reliable market for green products and services, Federal pur- chasing helps to lower the costs of these products and services for all consumers. In addition, by demonstrat- ing the effectiveness, feasibility, and value of these products and services, Federal agencies provide a model for other government purchasers as well as the private sector. As a result, Federal facility managers play a vital role in developing the market for green products and services. The Federal government also plays an important role in encouraging A&E firms to build their capabilities in green design; several Fed- eral agencies have built expertise in sustainable de- sign into their procurement criteria, thus bringing mainstream firms into the green building field. Pro- curing “green electricity” (which is generated from re- newable energy sources) provides a high-visibility and relatively easy way to help make a facility greener. Some utility companies are now offering green elec- tricity at a relatively modest premium that many Fed- eral facility managers will find affordable. Deregulation is expected to significantly expand green electric- ity options.

Federal purchase of renewables develops industries, creates jobs and spurs economic growth
Jim Fulton, Executive Director – David Suzuki Foundation (non-profit environmental organization), 11/23/99. [“From Crisis to Opportunity: Climate Change, Ecological Sustainability & Economic Security,”] http://www.davidsuzuki.org/files/brief1009.pdf
By providing leadership through managing their own operations sustainably and through direct support for energy efficiency and renewables, the federal government can help develop infant Canadian industries, create meaningful, long term, high-tech jobs, increase productivity, and foster a knowledge-based economy. 1.1 Green Energy Procurement for Federal Operations A federal green energy procurement program would see the federal government commit to purchasing 20% of its electricity by the year 2005 from low-impact renewable energy sources such as wind, solar and micro-hydro. 8 The $18 million annually required for such programs would cover the incremental costs incurred by substituting low-impact renewables for power currently obtained from existing conventional energy sources.
Federal purchasing power and influence spillsover – reduces GHG emissions, creates new markets, and drives down prices. Nils Petermann and Jeffrey Harris [;Alliance to Save Energy With support from the Federal Energy Management Program ‘Deploying New Technologies to Increase Energy Savings in the Federal Sector” http://www.ase.org/content/article/detail/4789] April 2008
The federal government is the single largest purchaser of energy-consuming products in the world,5 purchasing at least $10 billion worth each year,6 representing 10 percent of total energy-consuming product sales.7 As such, it is in a unique position to influence the market through its purchasing behavior. By purchasing energy-efficient products, it can save money, moderate its energy consumption and reduce its greenhouse gas (GHG) emissions. A 2000 study estimated that if the federal government purchased exclusively energy-efficient products, it would save approximately 25 trillion Btu per year of site energy consumption in 2010, about six percent of 2002 federal building energy consumption.8 Moreover, it can significantly boost sales of energy-efficient equipment – both through its demand and by demonstrating to consumers that Energy Star qualified and Federal Energy Management Program (FEMP)-designated products are both cost-effective and reliable – creating economies of scale for manufacturers of those products and lowering production and distribution costs. And since the government is such an important customer, companies will be more likely to develop, market, and sell energy-efficient products at competitive prices to capitalize on the enormous sales opportunity.

The federal government accounts 888 trillion BTUS of primary energy – reduction solves ghg emissions, improves the economy and reduces reliance on energy.
Vestal Tutterow, Alexander Filippov, and Jeffrey Harris [Alliance to Save Energy- “Energy-Efficient New Federal Buildings: Awareness and Implementation of Federal Building Standards &Case Studies With support from the Federal Energy Management Program” http://www.ase.org/content/article/detail/478] April 2008
The federal government annually consumes 888 trillion Btus of primary energy and spends $4.2 billion to power and fuel half a million buildings and facilities.4 Federal government buildings alone are responsible for 1 percent of the United States’ 1.4 billion metric tons of carbon dioxide emissions.5 Effective federal energy management demonstrates the nation’s commitment to clean up the environment, reduce greenhouse gas emissions, improve economic productivity, reduce reliance on imported energy, and lower budget deficits. As the president calls on the nation’s industries and the leaders of the world’s developed and developing nations to reduce emissions of climate change gases, it is imperative that the federal government lead the way. 6
USFG is single largest purchaser of energy Joe Loper, Steve Capanna and Jeffrey Harris [“Reducing Greenhouse Gas Emissions In Federal Buildings, Facilities and Vehicles Alliance to Save Energy For the Presidential Climate Action Project” www.ase.org/files/3996_file_ghg_emissions_pcap.pdf] April 2008
The federal government is the single largest purchaser of energy-consuming products in the world,66 purchasing about $10 billion-worth annually,67 representing 10 percent of total energy consuming product sales.68 The efficiency of the computers, exit signs, air conditioners, motors and other equipment purchased today will be a factor in determining the overall efficiency of the federal government for years to come. Furthermore, the federal government’s enormous presence in the marketplace allows it to transform markets for efficient products. Through its purchasing choices, the federal government helps manufacturers realize economies of scale for their emerging technologies, thus bringing down their costs.

Funding Key FEMP funding is being cut at a key time. Kateri Callahan [president of Alliance to Save Energy, , “ Testimony; Reducing Government Energy Waste”, http://www.ase.org/content/article/detail/3680 ] March 28, 2007
Energy-efficiency measures save taxpayers money in lower federal energy bills, but usually require an up-front cost. The government should look at total life-cycle cost, i.e., equipment/product purchase price plus estimated costs of energy use over the life of the product, not just first cost, when making decisions on new buildings, retrofits, equipment and vehicle purchases, weapon design, and more. This life-cycle-cost perspective is used for some large capital and military systems procurements, but not all. And agencies trying to use this approach face hard limits on the availability of appropriated funds to pay the up-front costs for energy efficiency, and many competing priorities. Billions of dollars of investment will be needed to meet the current energy targets and reap the associated energy savings. However, in recent years annual appropriations for energy efficiency, water conservation, and renewable energy projects in existing federal buildings have ranged from only about $100 million to $300 million. Funding for energy efficiency through appropriations must be increased. If we do not provide more funding for energy-efficiency measures, not only will we risk not meeting the energy targets, but also agencies will spend even more money on energy bills. We must invest more to save more.Increased funding also is needed for DOE's Federal Energy Management Program (FEMP), the primary expert resource and coordinator for energy managers throughout the federal agencies, and the office responsible for rules, guidelines, and reports to implement the many legal mandates. FEMP funding has been cut for years, despite increasing responsibilities, and its technical resource base of expert contractors has been greatly curtailed. More funding and more management attention are needed to restore this vital program.
Funding is key Joe Loper, Steve Capanna and Jeffrey Harris [“Reducing Greenhouse Gas Emissions In Federal Buildings, Facilities and Vehicles Alliance to Save Energy For the Presidential Climate Action Project” www.ase.org/files/3996_file_ghg_emissions_pcap.pdf] April 2008 An investment of almost $11 billion through 2015, or about $1.3 billion per year over the next eight years, likely will be needed to meet current energy targets and reap the associated energy and carbon savings.128 This investment is far greater than recent annual appropriations for energy efficiency, water conservation and renewable energy projects in existing federal buildings, which have ranged from only about $100 million to $300 million. Through 2015, at existing appropriations, the federal government would therefore be facing a cumulative budget shortfall of up to $8 billion.129 While agencies are required to include appropriations requests for energy efficiency investments in their annual budgets, they often fail to do so.

Solvency – Renewables Solve Emissions Renewable energy solves carbon-neutral buildings and the 50% fossil fuel standard
Architecture 2030, non-profit organization advocating low-emission buildings, 2008. “The 2030 Challenge,” http://www.architecture2030.org/2030_challenge/index.html
Buildings are the major source of demand for energy and materials that produce by-product greenhouse gases (GHG). Slowing the growth rate of GHG emissions and then reversing it over the next ten years is the key to keeping global warming under one degree centigrade (°C) above today's level. It will require immediate action and a concerted global effort. To accomplish this, Architecture 2030 has issued The 2030 Challenge asking the global architecture and building community to adopt the following targets: * All new buildings, developments and major renovations shall be designed to meet a fossil fuel, GHG-emitting, energy consumption performance standard of 50% of the regional (or country) average for that building type. * At a minimum, an equal amount of existing building area shall be renovated annually to meet a fossil fuel, GHG-emitting, energy consumption performance standard of 50% of the regional (or country) average for that building type. * The fossil fuel reduction standard for all new buildings shall be increased to: 60% in 2010 70% in 2015 80% in 2020 90% in 2025 Carbon-neutral in 2030 (using no fossil fuel GHG emitting energy to operate). These targets may be accomplished by implementing innovative sustainable design strategies, generating on-site renewable power and/or purchasing (20% maximum) renewable energy and/or certified renewable energy credits.
Renewable energy can dramatically reduce a building’s carbon emissions
James E. McMahon, Head of Energy Analysis Department Lawrence Berkeley National Laboratory, 5/06. [“Chapter 9. Buildings,” Technical/Peer Review draft]
Many options are available for reducing the carbon impacts of new and existing buildings, such as increasing equipment efficiency and implementing alternative design, construction, and operational measures to provide thermal comfort and lighting with reduced energy. Current best practices can reduce carbon emissions by at least 60% for offices 4 and 30% for homes. 5 Residential and commercial buildings in the United States and Canada contain 27 billion m 2 (2.7 million hectares) of floor space, providing a large area available for siting non-carbon-emitting on-site energy supplies (e.g., photovoltaic panels on roofs). With the most cutting-edge technology, at the least, emissions can be dramatically reduced, and, at best, buildings can produce electricity without carbon emissions by means of on-site renewable electricity generation.

Solvency - Regulations
Regulations solve – empirical proof
RK Stewart, president of American Institute of Architects, 2/12/07 (“Energy Efficient Federal Buildings” http://www.aia.org/SiteObjects/files/RKStewart_WrittenTestimony_SenateEnergy.pdf)
Energy reduction requirements like these have shown a record of success, as demonstrated by DOE’s recently submitted annual report to Congress on Energy Management and Conservation programs. DOE’s report found that in 2005, federal agencies responding to President Clinton’s 1999 Executive Order had reduced their consumption levels by 29.6 percent, narrowly missing the goal established by President Clinton’s Executive Order by only .4 (point 4) percent [see graph below]. This makes it clear that when they are required to do so, federal agencies have the ability to meet reduced energy consumption targets.

Solvency – FEMP FEMP can coordinate renewable development and dissemination in federal buildings Vestal Tutterow, Alexander Filippov, and Jeffrey Harris [Alliance to Save Energy- “Energy-Efficient New Federal Buildings: Awareness and Implementation of Federal Building Standards &Case Studies With support from the Federal Energy Management Program” http://www.ase.org/content/article/detail/478] April 2008
FEMP can play a leading role in addressing the issues and concerns expressed by the federal personnel we interviewed. FEMP’s experience in outreach and training within the federal sector can be tapped to educate federal personnel involved in building design and construction process. FEMP also has the opportunity to work closely with GSA through its new Office of High Performance Green Buildings to jointly develop guidance, training, and other resources related to the EISA requirements. The educational forum mentioned in the Recommendations section can provide a good opportunity to establish a working relationship with this new GSA office. FEMP is also positioned well to inform federal building design and construction personnel of emerging technologies and the roles these technologies can play in improving building energy efficiency. FEMP’s efforts to inform federal agencies of the new metering requirements can be expanded to encourage measurement and verification at federal facilities. Existing M&V protocols can be adopted, so the government does not need to develop any new standards or protocols. The new EISA requirements will significantly alter the way federal buildings are designed and constructed. The federal agencies will look to FEMP for guidance and clarifications, and this will likely require a rigorous, sustained effort to address. The recommended demonstration program can be a part of this effort. Some specific activities to consider that address EISA requirements include: - Working with the American Institute of Architects and others (coordinating with the Commercial Buildings Initiative) to develop operational guidance, by building type, on requirements for 55% reduction in fossil fuel-generated energy consumption, - Assisting DoD, Energy Star, GSA, and others in developing criteria that insures sustainable, energy-efficient design of DoD privatized military housing and leased buildings, - Developing guidance on incorporating energy-efficiency into the design of large capital investments that may not meet the definition of “major renovation”, and also developing a process for reviewing the capital investment decisions, - Developing guidelines for metering natural gas and steam, - Initiate a scoping study for meeting 30% of domestic hot water loads from solar water heating, - Developing guidelines, tools, and training (coordinated with the Commercial Buildings Initiative) related to building performance assurance, benchmarking, and web-based training.
Tax credits from FEMP – would reconcile issues with the EPAct of 05 and help federal agencies organize renovation. Vestal Tutterow, Alexander Filippov, and Jeffrey Harris [Alliance to Save Energy- “Energy-Efficient New Federal Buildings: Awareness and Implementation of Federal Building Standards &Case Studies With support from the Federal Energy Management Program” http://www.ase.org/content/article/detail/478] April 2008
FEMP should consider collaborating with the DOE Building Technologies Program and federal agencies to establish a long-term demonstration program that engages the architectural and engineering community, suppliers, and other stakeholders. The objective will be to design and build a series of demonstration projects that, with the EISA-directed zero energy buildings in mind, highlight the leading edge design strategies and technologies that demonstrate what will become standard practice 10 years out. Such a program will require a dedicated funding source, but the federal cost can be minimized if the program is leveraged with utility companies or other parties. FEMP should work to assure that the re-authorization of commercial tax credits includes the provision which allows the credits to go to the architectural and engineering firms designing high performance federal buildings. Additionally, FEMP should encourage the development of IRS guidelines that clearly describe baselines and scenarios in which the architectural and engineering firms are eligible for the tax credits. The new EISA requirements need to be reconciled with EPAct 2005 and the FEMP Final Rule, so that federal agencies can properly plan and budget for new construction and renovation projects. This will require considerable attention from FEMP and the agencies since CBECS and RECS have not been used as baselines in the past. For example, how will DOE determine the average energy consumption for each building type? What is the CBECS and RECS data include plug and other equipment loads, whereas the current energy-efficiency requirements exempt plug and equipment loads from the calculations.

FEMP does renewables – Arizona proves Nancy Carlisle [presented at the Association of Energy Engineers GlobalCon 2000 Conference Dallas, Texas “Renewable Energy Deployment in the Federal Sector: A Status Report Preprint” http://www.nrel.gov/docs/fy00osti/27958.pdf April 19–20,] 2000
Some representative examples (out of the tens of projects assisted) of design assistance last year included a water-heating system for the Phoenix Federal Correctional Institute, a photovoltaic project at Joshua Tree National Park, and assistance to the EPA in the procurement of 100% green power for their Richmond, CA laboratory. • FEMP helped the Phoenix Federal Correctional Institute to design and install an 18,000-square foot-solar parabolic water heating system to preheat 50,000 gallons of water needed for the laundry, showers and kitchen system at the facility. The system was financed using an Energy Savings Performance Contract (ESPC). The system will reduce annual electrical energy usage by 1.3 million KWh, saving taxpayers $72,000 annually. FEMP helped the National Park Service to buy and install photovoltaic system for many of their facilities. One recent example is the replacement of two 32-kilowatt (kW) diesel generators with photovoltaics to provide power to the Cottonwood Spring Area at Joshua Tree National Park. The PV system cuts the $50,000 annual operating cost by 90% and the new system has a simple payback under 6 years. • FEMP worked with the GSA to assist the Environmental Protection Agency in purchasing 100% renewable power for its Richmond, California, laboratory. The lab’s load is 1,800 MWh/year. Their average annual cost of power is approximately $154,000. The premium for the power from renewable energy systems is 10% more per year.
Solvency – NTDP NTDP like coordination could improve consistent deployment of federal regulations . Nils Petermann and Jeffrey Harris [;Alliance to Save Energy With support from the Federal Energy Management Program ‘Deploying New Technologies to Increase Energy Savings in the Federal Sector” http://www.ase.org/content/article/detail/4789] April 2008 FEMP would be a natural candidate for establishing an interagency coordination team. FEMP does already fulfill such a role to some extent, but a dedicated team within FEMP with the mandate to actively coordinate agency efforts would provide substantial benefits beyond FEMP’s present scope. It would respond to needs as they arise, track lessons learned, and disseminate results. Part of an interagency coordinating team’s role would be to continue the tasks of the New Technology Demonstration Program (NTDP), which was authorized by the Energy Policy Act of 1992 but has received little emphasis recently. The purpose of NTDP was to provide federal facility managers with information on new and underutilized technologies. NTDP not only released publications and responded to requests for information, it also identified and recommended technologies for demonstrations based on suggestions from federal agencies and laboratories. However, NTDP could not always provide consistent coordination of deployment efforts, since there was no network of permanent agency energy technology teams as we propose. The creation of such a network coordinated by a new interagency team could provide the needed consistency.
NTDP could coordinate a database for information sharing on issues of technology Nils Petermann and Jeffrey Harris [;Alliance to Save Energy With support from the Federal Energy Management Program ‘Deploying New Technologies to Increase Energy Savings in the Federal Sector” http://www.ase.org/content/article/detail/4789] April 2008Information dissemination can be provided through several channels. Of key importance is that a permanent team (ideally an interagency coordination team as discussed above) oversees the dissemination to ensure that information is up to date according to the latest findings from the different agency efforts. It would encourage agencies to demonstrate technologies and share lessons learned. Moreover, this team would not only reach out to partners but by also serve as a point of contact that can provide assistance when questions arise. Specific outreach and assistance items could include the following: o Workshops & training sessions – Set up by agency energy technology teams; o Booths and presentations at GSA or energy conferences – Energy conferences are a vital source for ESCOs that are interested in information on new technologies; o Share lessons learned with federal power authorities (BPA, TVA) and state technology research programs (e.g. by NYSERDA or the California Energy Commission); o Unified Facility Guide Specifications (UFGS) for new or underutilized technologies – Adding specifications to the UFGS, to provide simple models for replicable implementation of new technologies, may be a particularly valuable tool. The task of information dissemination has until recently been fulfilled by FEMP’s New Technology Demonstration Program (NTDP). It has been a challenge is to provide up-to-date information on new technologies. Technology assessments can change frequently due to new findings and market developments. Therefore it is recommended that the interagency coordinating team create and manage a database of technology information that provides brief summaries of evaluations which can easily be modified by stakeholders once new findings are available. Developing such a database would be a near-term task that could also be completed even before a full-fledged network of agency technology teams is established. The appendix includes a suggested outline for an accessible energy technology database.

Plan Mechanism FEMP uses energy savings performance contracting and direct appropriations funding
John Shonder, FEMP GHP Core Team leader, 3/03. “EVALUATION OF FEDERAL ENERGY SAVINGS PERFORMANCE CONTRACTING—METHODOLOGY FOR COMPARING PROCESSES AND COSTS OF ESPC AND APPROPRIATIONS-FUNDED ENERGY PROJECTS,” OAK RIDGE NATIONAL LABORATORY. http://www.ornl.gov/sci/femp/pdfs/espc_lcc.pdf
FEMP’s programs are designed to help and encourage agencies to improve their facilities’ energy efficiency and meet federal energy goals. FEMP provides energy management training and technical and design assistance through a number of programs, as well as guidelines to help agencies select the most efficient equipment available when making purchases. FEMP also conducts outreach, awareness campaigns, and awards programs. FEMP’s project financing efforts include the Super ESPC Program, a Utility Program to support agencies’ use of UESCs, and initiatives to help agencies use enhanced-use and other leasing authorities. FEMP supports agencies in using these financing mechanisms in keeping with the spirit of the legislation and executive orders that direct agencies to use them. FEMP uses every practical means at its disposal to support agencies’ efforts to reduce energy use and costs to the government. | In recent years a significant share of agencies’ progress toward meeting federal energy-use reduction goals has been the result of retrofitting buildings through the Air Force, Army, and DOE ESPCs; UESCs; and direct appropriations funding. Recent analysis indicates that significant cost-effective energy retrofit potential still exists at federal sites (Brown, Dirk, and Hunt, 2000).
Specific solvency numbers (possible plan mech)
RK Stewart, president of American Institute of Architects, 2/12/07 (“Energy Efficient Federal Buildings” http://www.aia.org/SiteObjects/files/RKStewart_WrittenTestimony_SenateEnergy.pdf)
The AIA proposes that federal agencies be required to ensure that new buildings and buildings undergoing major renovations today consume no more than half the fossil fuel generated energy that a similar federal building consumed in 2003. Beginning in 2010, the agencies should then follow a declining cap on energy consumption such that they meet a minimum energy performance reduction when compared to the 2003 baseline. We propose that by 2010, new and significantly renovated federal buildings be required to reduce fossil fuel generated energy by 60 percent. By 2015, the cap would lower to a 70 percent reduction, continuing until 2030 when we would achieve a 100 percent reduction in fossil fuel generated energy in all new federal buildings.

Renewables List Executive order 13423 mandates solar, biomass, geothermal, wind and hydro
DOE [under the U.S. Department of Energy Office of Energy Efficiency and Renewable Energy Federal Energy Management Program Renewable Energy Requirement Guidance for EPACT 2005 and Executive Order 13423 Final http://www1.eere.energy.gov/femp/] January 28, 2008
Electric energy from all of the renewable energy sources that satisfy the definitions and qualifications explained in sections 2.2.3 through 2.2.13 may be counted towards the EO13423 Requirement. Agencies may also count qualified non-electric energy from new renewable energy sources of the types detailed in sections 2.2.3 though 2.2.13. Examples include but are not limited to thermal energy from solar ventilation pre-heat systems, solar heating and cooling systems, solar water heating, ground source heat pumps, biomass heating and cooling, thermal uses of geothermal and ocean resources. Examples of mechanical energy include pumps driven by wind power and mechanical applications of qualified hydro resources. Lighting examples include daylighting technologies.
Biomass is renewable DOE [under the U.S. Department of Energy Office of Energy Efficiency and Renewable Energy Federal Energy Management Program Renewable Energy Requirement Guidance for EPACT 2005 and Executive Order 13423 Final http://www1.eere.energy.gov/femp/] January 28, 2008
Under the definition in section 203 of EPACT 2005, the term “biomass” means any lignin waste material that is segregated from other waste materials and is determined to be non-hazardous by the Administrator of the Environmental Protection Agency, and any solid, non-hazardous cellulosic material that is derived from the following: a) Any of the following forest-related resources: mill residues, precommercial thinnings, slash, and brush, or nonmerchantable material b) Solid wood waste materials, including waste pallets, crates, dunnage, manufacturing and construction wood wastes (other than pressure-treated, chemically treated, or painted wood wastes), and landscape or right-of-way tree trimmings, but not including municipal solid waste (garbage), gas derived from the bio-degradation of solid waste, or paper that is commonly recycled c) Agricultural wastes, including orchard tree crops, vineyard, grain, legumes, sugar, and other crop by-products or residues, and livestock waste nutrients d) A plant that is grown exclusively as a fuel for the production of electricity

Emissions Numbers Lie Current numbers lie – buildings can be excluded by agencies Joe Loper, Steve Capanna and Jeffrey Harris [“Reducing Greenhouse Gas Emissions In Federal Buildings, Facilities and Vehicles Alliance to Save Energy For the Presidential Climate Action Project” www.ase.org/files/3996_file_ghg_emissions_pcap.pdf] April 2008
At least part of agencies’ success meeting earlier reduction targets came from excluding certain facilities. Agencies were allowed to remove energy intensive operations, special use facilities and other types of facilities from their building mix. By doing so, at least one large agency was able to reduce energy consumption by more than the reduction in square footage, thus making it appear that energy intensity had been reduced when in fact some energy intensive buildings had merely been reclassified and excluded.49 This problem, which has been an issue since the first energy-intensity goals were implemented, finally may have been addressed by EPAct 2005, which directed DOE to clarify rules regarding exclusion of certain buildings and facilities from energy intensity targets.50 DOE’s guidance, issued in 2006, provided specific rules and definitions for different types of buildings and facilities along with conditions that must be met for agencies to exclude facilities from the energy intensity targets or classify them as energy-intensive facilities. Most importantly, agencies are required to implement all cost-effective energy-efficiency measures in excluded facilities and measure and report all energy use from those facilities. Agencies wishing to shield certain facilities from the energy intensity reduction requirements will still have some wiggle room. For one, DOE guidance allows agencies to establish alternative energy intensity measures for different types of facilities – thus allowing a manufacturing operation, for example, to measure intensity based on energy per unit of output rather than energy per square foot.51 This is a reasonable approach as long as agencies are required to establish and comply with alternative intensity measures. Alternative measures of energy intensity are not always clear – for example, opinions differ on the appropriate measure of energy intensity for data center operations.52 If agencies actually implement all cost-effective measures in buildings excluded from energyintensity requirements, as DOE’s guidance requires, then there is less reason for concern, since that is ultimately the objective of the intensity reduction requirements in the first place. But determining cost-effectiveness frequently hinges on what assumptions agencies make in their calculations. For instance, as discussed earlier, achieving the energy intensity reduction requirements in EO 13423 could require agencies to make improvements that are not costeffective given energy prices, but that would be cost-effective if prices increase and/or externality costs are considered in investment decisions. If future costs of energy are underestimated, agencies may fail to implement many measures that become cost-effective once the higher prices take effect.
Numbers are wrong – not total energy Joe Loper, Steve Capanna and Jeffrey Harris [“Reducing Greenhouse Gas Emissions In Federal Buildings, Facilities and Vehicles Alliance to Save Energy For the Presidential Climate Action Project” www.ase.org/files/3996_file_ghg_emissions_pcap.pdf] April 2008
Using site energy as the measure of energy consumption has made compliance with the energy intensity reduction requirements far easier than it would have been using total energy. The site energy metric has masked the massive growth in electric plug loads from computers and other office equipment that occurred in the 1990s, along with growth in air-conditioned federal floor space (especially in warmer climates) and the retiring or outsourcing of electricity and steam generation capacity. In sum, source energy intensity of federal goal buildings fell a paltry 0.1 percent between 1985 and 2005, nowhere near the site energy intensity reduction of 30 percent.53 The use of source energy has been opposed by agencies and other stakeholders (like electric utilities), arguing that agencies have no control over energy and emissions associated with offsite generation, transmission, and distribution of electricity or steam. While to a large extent this is true, the objective for energy-saving efforts in the federal government is primarily two-fold: reduce energy costs and reduce energy-related emissions. Using site energy intensity requirements could affect agencies energy management and investment decisions – by shifting from onsite to offsite production of electricity or steam, agencies can reduce site energy use, even though total “source” energy consumption (and costs and emissions) increase. Source energy corresponds more closely to energy costs and emissions.54
Site energy is misleading – doesn’t count emissions from source of energyJoe Loper, Steve Capanna and Jeffrey Harris Alliance to Save Energy For the Presidential Climate Action Project April 2008
Another problem with the energy intensity reduction requirements is that they are based on site instead of source energy consumption. Site energy includes only the energy consumed at a building or facility and ignores energy consumed by electric power plants to provide electricity to the site, as well as coal and other fuels used to deliver purchased steam. Source energy consumption accounts for both site energy and the energy used in generating and transmitting that energy. The use of site energy for determining reductions in energy intensity can be misleading, since roughly two-thirds of the energy used at a power plant to generate electricity is lost in the conversion and transmission of that electricity to the building where it is used. Site energy in effect counts only one out of every three Btus used in electricity consumption. Using site energy as the measure of energy consumption has made compliance with the energy intensity reduction requirements far easier than it would have been using total energy. The site energy metric has masked the massive

growth in electric plug loads from computers and other office equipment that occurred in the 1990s, along with growth in air-conditioned federal floor space (especially in warmer climates) and the retiring or outsourcing of electricity and steam generation capacity. In sum, source energy intensity of federal goal buildings fell a paltry 0.1 percent between 1985 and 2005, nowhere near the site energy intensity reduction of 30 percent.53 The use of source energy has been opposed by agencies and other stakeholders (like electric utilities), arguing that agencies have no control over energy and emissions associated with offsite generation, transmission, and distribution of electricity or steam. While to a large extent this is true, the objective for energy-saving efforts in the federal government is primarily two-fold: reduce energy costs and reduce energy-related emissions. Using site energy intensity requirementscould affect agencies energy management and investment decisions – by shifting from onsite to offsite production of electricity or steam, agencies can reduce site energy use, even though total “source” energy consumption (and costs and emissions) increase. Source energy corresponds more closely to energy costs and emissions.54

***ANSWERS TO***

Politics – Plan Popular (Public) Public loves the plan – polls prove
RK STEWART, President of the American Institute of Architects, 2/12/07. “ENERGY EFFICIENT FEDERAL BUILDINGS,” Testimony before the US Senate Committee on Energy and Natural Resources Subcommittee on Energy, http://www.aia.org/SiteObjects/files/RKStewart_WrittenTestimony_SenateEnergy.pdf
Finally, the American public believes the time is now to reduce energy usage and reduce the impacts of climate change. The Tarrance Group and Lake Research Partners recently conducted a nationwide poll of voters and found that 74 percent of those polled agreed that “the government should take the lead in promoting real estate development that conserves our natural resources.” In addition, 71 percent of voters agreed that “the government should immediately put into effect new energy policies that drastically reduce greenhouse gas emissions.” The American public supports conserving our precious resources, and believes that it is in the best interests of our nation and the world to reduce our reliance on fossil fuel produced energy and move towards a sustainable future. Reducing energy use in federal buildings would be a major step towards that goal.

Elections – Obama Supports A major part of Obama’s environmental policy is carbon neutral federal buildings
Concord Monitor, 10/9/07. “Obama rolls out energy plan” http://www.concordmonitor.com/apps/pbcs.dll/article?AID=/20071009/NEWS01/710090373/1217/NEWS98
Obama also said he would invest $150 billion over 10 years to develop clean energy, including corn ethanol and other advanced biofuels, such as cellulosic ethanol, which can be made from wood chips. He would invest $50 billion over five years in a new venture capital fund to bring clean energy technologies into the market through partnership between the public and private sectors.Obama said the increased investment will allow the U.S. to set standards requiring 25 percent of all the country's electricity to come from renewable sources by 2025. That figure is lower than the standards set in Richardson's plan, equal to those set by Edwards and higher than the other Democrats, according to the League of Conservation Voters.A third major component of the plan would be trying to make the country 50 percent more energy efficient by 2030 by updating building codes for efficiency, making federal buildings carbon neutral, offering efficiency incentives, updating the national utility grid and phasing out traditional incandescent light bulbs by 2014. The other Democrats have called for reducing energy consumption by 10 percent to 20 percent by 2020, but none has projected as aggressively as Obama.
If Obama wins he’s promised to set standards on buildings. Washington post [Juliet Eilperin and Lyndsey Layton McCain Pledges Greener Government Washington Post: Republican Candidate Says Federal Government Would Buy Fuel-Efficient Vehicles, Retrofit Office Space Comments 56 http://www.cbsnews.com/stories/2008/06/25/politics/washingtonpost/main4206931.shtml?source=RSS&attr=_4206931] June 25, 2008 Obama, who first set his targets last October, has promised that he would make all new federal buildings 40 percent more efficient than current ones within five years, and carbon-neutral by 2025. He has also pledged to increase efficiency of existing federal buildings by 25 percent within five years and to ensure that the government derives 30 percent of its electricity from renewable energy by 2020 -- none of which McCain has promised to do.

Elections – McCain Supports
McCain supports plan – vowed to decrease federal emissions Washington post [Juliet Eilperin and Lyndsey Layton McCain Pledges Greener Government Washington Post: Republican Candidate Says Federal Government Would Buy Fuel-Efficient Vehicles, Retrofit Office Space Comments 56] June 25, 2008 In a speech in Santa Barbara, Calif., McCain (R-Ariz.) vowed to "put the purchasing power of the United States government on the side of green technology" by buying fuel-efficient vehicles for its civilian fleet of cars and trucks and by retrofitting federal office space. The pledge comes months after Obama (D-Ill.) outlined a more detailed and ambitious proposal on the subject, virtually ensuring that the next administration will take significant steps to lower the government's output of energy and pollution. A greening of the government would probably have a major impact on the Washington region, as the modernizing of buildings would spark a mini-construction boom and ease energy demands. Cleaner vehicles would also reduce harmful auto emissions, environmentalists say. "Every year, the federal government buys upwards of 60,000 cars and other vehicles, not including military or law enforcement vehicles," McCain said as he campaigned with California Gov. Arnold Schwarzenegger, a prominent GOP environmentalist. "From now on, we're going to make those civilian vehicles flex-fuel capable, plug-in hybrid, or cars fueled by clean natural gas." Saying that the U.S. government ranks as "the single largest consumer of electricity in the world" because it holds sway over "3.3 billion square feet of federal office space" worldwide, McCain said he plans to reduce the government's carbon footprint by updating its buildings and demanding better standards in new ones.

AT: Efficiency CP Even the most aggressive efficiency measures fail to effectively reduce federal building carbon emissions – only renewable energy solves
Joe Loper, Vice President of Policy and Research – Alliance to Save Energy, et al, 4/2008. “Reducing Greenhouse Gas Emissions In Federal Buildings, Facilities and Vehicles,” For the Presidential Climate Action Project [Steve Capanna and Jeffrey Harris] climateactionproject.com%2Fdocs%2FPCAP_Final_FEMP_Chapter_4-18-08.pdf
In order to achieve 80 percent reductions compared to 1990 emissions levels, federal buildings would need to reduce their emissions by considerably more than even very aggressive efficiency measures could lower them. Implementing all cost-effective and achievable efficiency improvements only achieves about 60 percent of the goal – an additional 10 million metric ton reduction would be required by 2050. To achieve this through energy efficiency would require reductions in federal energy use of nearly 2 percent of 2007 emissions annually through 2050. Achieving these levels of reductions through efficiency alone would be an enormous feat. More realistically, aggressive energy-efficiency reductions will need to be supplemented by increased use of renewable and other low-carbon energy resources.33 Once efficiency reductions are realized, low-carbon energy would need to supply about 65 percent of 2050 energy consumption to achieve overall emissions of 80 percent below 1990 levels.34
Renewable energy credits are key to stopping federal building emissions – efficiency alone fails
Joe Loper, Vice President of Policy and Research – Alliance to Save Energy, et al, 4/2008. “Reducing Greenhouse Gas Emissions In Federal Buildings, Facilities and Vehicles,” For the Presidential Climate Action Project [Steve Capanna and Jeffrey Harris] climateactionproject.com%2Fdocs%2FPCAP_Final_FEMP_Chapter_4-18-08.pdf
It is unclear whether the government was on track to meet the previous goal for buildings (see Figure 12). While federal agencies on the whole were beating their target emissions targets for much of the 1990s, from 1999 to 2004, emissions levels were unchanged. So although the federal government was still more or less on pace to meet its buildings emission reduction goals in 2005, its emission rates over the previous six years create significant doubt as to whether it could have maintained that pace and achieved the 30 percent reduction target in 2010 without the extensive use of renewable energy credits (discussed below).61
Efficiency measures actually increases energy consumption – interpreted as a tax cut
Reuters, 11/27/07. “Energy efficiency fails to cut consumption: study,” http://www.enn.com/energy/article/25983
TORONTO (Reuters) - American consumers are driving bigger gas-guzzling cars and buying more air conditioners and refrigerators as the overall energy efficiency of such products improves, a report released on Tuesday found.In what the study calls "the efficiency paradox," consumers have taken money saved from greater energy efficiency and spent it on more and bigger appliances and vehicles, consuming even more energy in the process.This irony isn't just restricted to the United States, though. "The paradox is true for every developed country," said Benjamin Tal, senior economist at CIBC World Markets, which conducted the study.The study concludes that stricter energy efficiency regulations aren't the answer to concerns over climate change and the depletion of oil supplies because consumers treat greater energy efficiencies as a tax cut. "Because you get a 'tax cut,' you drive more," Tal said.The study found that energy use increased by 40 percent from 1975 to 2005 while energy efficiency improved in the same period. The sectors with the greatest increases in energy use -- transportation and residential -- are also the areas where the U.S. government is promoting energy efficiency the most.

When the federal government promotes efficiency, it fails. Stricter efficiency regulations are not the answer.Sharon Ho, Environmental News Network, Reporting by Sharon Ho; editing by Frank McGurty http://www.enn.com/energy/article/25983 27-11-07
American consumers are driving bigger gas-guzzling cars and buying more air conditioners and refrigerators as the overall energy efficiency of such products improves, a report found. In what the study calls "the efficiency paradox," consumers have taken money saved from greater energy efficiency and spent it on more and bigger appliances and vehicles, consuming even more energy in the process. While seemingly perverse, improvements in energy efficiency result in more of the good being consumed -- not less," said Jeff Rubin, chief economist and chief strategist at CIBC World Markets, which conducted the study. The study concludes that stricter energy efficiency regulations aren't the answer to concerns over climate change and the depletion of oil supplies. "The problem is, energy efficiency is not the final objective," Rubin said. "Reducing energy consumption must be the final objective to both the challenges of conventional oil depletion and to greenhouse gas emissions." The study found that energy use increased by 40 % from 1975 to 2005 while energy efficiency improved in the same period. The sectors with the greatest increases in energy use -- transportation and residential -- are also the areas where the US government is promoting energy efficiency the most.The average mileage per gallon of gasoline has increased since 1980, but Americans have responded by driving larger vehicles and further. The average American drove 9,500 miles annually in 1970. These days he or she drives more than 12,000 miles. The energy used to heat and cool homes is also rising as homes become larger. The study notes the area of the average home has increased from 1,000 sq feet in the 1950s to the current 2,500 sq feet. More households are also buying air conditioners. Rubin believes energy efficiency is needed more than ever, but that government's current initiatives won't help. "In order for efficiency to actually curb energy usage, as opposed to energy intensity, consumers must be kept from reaping the benefits of those initiatives in ever-greater energy consumption," he said.
Energy efficiency fails – it does nothing while exacerbating numerous problems.Ben Lieberman, Policy Analyst with the Competitive Enterprise Institute in Washington, D.C. April 1999 - http://www.fee.org/publications/the-freeman/article.asp?aid=4052
The energy crisis has long since faded away. The “experts” could not have been more wrong—oil supplies are so plentiful today that the price has reached a 25-year low. Nonetheless, the efficiency agenda lives on. These same statutes and regulations, and the army of bureaucrats and activists that make their living from them, are experiencing their second wind as one of the putative solutions to global warming. If consumers can be made to use less energy, the argument goes, then less carbon dioxide, the chief anthropogenic greenhouse gas, will be emitted into the atmosphere. Last November, when the Clinton administration signed the Kyoto Protocol, the international agreement to reduce emissions of greenhouse gases, Stuart Eizenstat, undersecretary of state for economic, business, and agricultural affairs, emphasized the role energy efficiency will play in its implementation. He announced new funding for research into more efficient automobiles and housing, and an effort to “begin setting new energy efficiency standards for major appliances.” Indeed, until the Kyoto Protocol is submitted to a skeptical Senate for approval, these already existing energy-efficiency statutes are among the few tools the Clinton administration can legally use to combat energy use. Before the nation embarks on new rounds of tougher efficiency standards for everything from washing machines to light bulbs to SUVs, it is worth examining what the first wave of such centrally planned austerity measures has done for us. Despite the positive publicity accorded measures enacted in the name of energy efficiency, they have accomplished nothing. However, they have raised the cost and reduced the quality of affected products, and have created or exacerbated several health and safety problems.

Energy Efficiency Increases Energy UseBen Lieberman, Policy Analyst with the Competitive Enterprise Institute in Washington, D.C. April 1999 - http://www.fee.org/publications/the-freeman/article.asp?aid=4052
An Ineffective Solution Even assuming the global warming crisis is not as spurious as the energy crisis (but see Jonathan Adler, “Global Warming: Hot Problem or Hot Air?” in The Freeman, April 1998) and that substantial environmental benefits will accrue from reduced energy use, there still are serious limitations on how much can be achieved through federally mandated energy efficiency measures. True, if consumers use less energy, then less carbon dioxide will be emitted into the atmosphere, either directly in the case of motor vehicles or fuel-burning appliances, or indirectly in the case of electrical appliances whose energy is generated through fossil-fuel combustion by utilities. But 25 years of energy efficiency measures have failed to stem the increases in national energy use. “People always seem to find more uses for energy,” says Herbert Inhaber, author of Why Energy Conservation Fails. Today’s refrigerators may require half the electricity of a comparable 1980 model, but people are more likely, given the lower operating costs, to own a larger one, or even have two. Better gas mileage has led to increases in vehicle miles traveled. Studies have shown that owners of high efficiency heating systems tend to set their thermostats a bit higher than others. Many consumers “spend” their savings from efficient appliances on other energy-using conveniences, like additional lighting. Ironic but true, a quarter century of federal energy-efficiency mandates has increased, not decreased, total energy use.
Energy Efficiency fails – it increases costs meaning they don’t access the money saved.Ben Lieberman, Policy Analyst with the Competitive Enterprise Institute in Washington, D.C. April 1999 - http://www.fee.org/publications/the-freeman/article.asp?aid=4052
Bad Deal for Consumers The level of consumer satisfaction with many things targeted by the energy-efficiency crusade has declined as a result of Washington’s dictates. This should not be surprising—in a free market, most technological improvements that allow efficiency gains without adverse side effects would be incorporated anyway. Manufacturers, responding to competitive forces, have plenty of incentives to provide the best available balance of price, performance, and operating costs. Efficiency mandates simply upset this balance, placing arbitrary energy-use standards above everything else. Alan Kessler, vice president of Raytheon Appliances, noted in congressional hearings on appliance standards that “from the perspective of DOE and standards advocates, the purpose of major appliances is solely to save energy,” and not to provide maximum overall consumer satisfaction. Energy efficiency, Washington-style, comes at a cost. For example, DOE estimates that the latest energy standard for refrigerators will add $80 to the cost of a new model when the standard takes effect in 2001. DOE is also considering regulations mandating certain highly efficient types of clothes washers that currently cost hundreds more than their conventional counterparts. One study estimates the total cost of appliance standards of $59 billion. True, these and other goods save on energy, but the payback periods are often very long.

Efficiency fails – historically it increases consumption.Robert Bryce, Robert Bryce will publish his third book, Gusher of Lies: The Dangerous Delusions of "Energy Independence," on March 10. February 29, 2008 - http://www.counterpunch.org/bryce02292008.html
That increased energy efficiency will save us has become an article of faith. Last year, Congress passed "The Energy Independence and Security Act of 2007." The text of the new law covers 310 pages. The word "efficiency" appears 331 times, and "efficient" appears 111 times. It mandates higher mileage standards for cars sold in the U.S., and will eventually outlaw the use of incandescent light bulbs in favor of more efficient compact fluorescent ones. For years, promoters like Amory Lovins of the Rocky Mountain Institute have been claiming that efficiency will save energy, lower carbon dioxide emissions, save money, and provide all comers, according to Lovins, with a "lunch you get paid to eat." But few of the faithful have acquainted themselves with William Stanley Jevons. In 1865, the British economist published a book called The Coal Question which contains what is now known as the Jevons Paradox: "It is wholly a confusion of ideas to suppose that the economical use of fuels is equivalent to a diminished consumption. The very contrary is the truth." Those two sentences contain what may be the most important yet least understood concept in the energy business: energy efficiency increases energy consumption. It's counterintuitive, and precious few energy analysts have bothered to investigate it. That's why a new book, The Jevons Paradox and the Myth of Resource Efficiency Improvements, by John M. Polimeni, Kozo Mayumi, Mario Giampetro, and Blake Alcott, should be welcomed and given wide attention. The authors waste little time in explaining their thesis. On page 3 they state, "We aim to show that increased energy efficiency leads to increased demand and consumption of energy." The book is one of several analyses that have been published in recent years that confirm Jevons's findings. Horace Herring of Britain's Open University is http://www.amazon.com/exec/obidos/ASIN/1586483218/counterpunchmagaamong the world's leading experts on the paradox. In 1998 he concluded that energy efficiency measures will, "by lowering the implicit price, result in increased, not decreased, energy use." In 2003, Vaclav Smil, a polymath, author and distinguished professor of geography at the University of Manitoba, corroborated Jevons's work in his book, Energy at the Crossroads. Smil wrote that history is "replete with examples demonstrating that substantial gains in conversion (or material use) efficiencies stimulated increases of fuel and electricity (or additional material) use that were far higher than the savings brought by these innovations." In 2005, Peter Huber and Mark Mills, in their provocative book, The Bottomless Well, declared that "Efficiency fails to curb demand because it lets more people do more, and do it faster and more/more/faster invariably swamps all the efficiency gains." Last October, the U.K. Energy Research Centre published what it claims is one of the most comprehensive analyses of the paradox. After a review of over 500 studies, the London-based outfit confirmed the existence of the Jevons Paradox (which it calls the "rebound effect") and concluded that the "potential contribution of energy efficiency policies needs to be reappraised."In the new book about the paradox, Polimeni, an assistant professor of economics at the Albany College of Pharmacy, writes the most compelling essay. He reviews numerous studies on the effects of energy efficiency, citing one Swedish study that found a 20 percent increase in efficiency would "increase carbon dioxide emissions by 5 percent." The same study estimated that to keep carbon dioxide emissions at their original level would require a 130 percent increase in carbon dioxide taxes. Polimeni looked at data from developed and underdeveloped countries. He notes that between 1960 and 2004, U.S. energy intensity decreased by 113 percent, but overall energy consumption increased by 100 percent. His conclusion: "Energy-efficient technology improvements are counterproductive, promoting energy consumption. Yet, energy efficiency improvements continue to be promoted as a panacea." So what is to be done? First, we must accept the fact that efficiency won't reduce consumption.
Energy efficiency fails – it does nothing while exacerbating numerous problems.Ben Lieberman, Policy Analyst with the Competitive Enterprise Institute in Washington, D.C. April 1999 - http://www.fee.org/publications/the-freeman/article.asp?aid=4052
The energy crisis has long since faded away. The “experts” could not have been more wrong—oil supplies are so plentiful today that the price has reached a 25-year low. Nonetheless, the efficiency agenda lives on. These same statutes and regulations, and the army of bureaucrats and activists that make their living from them, are experiencing their second wind as one of the putative solutions to global warming. If consumers can be made to use less energy, the argument goes, then less carbon dioxide, the chief anthropogenic greenhouse gas, will be emitted into the atmosphere. Last November, when the Clinton administration signed the Kyoto Protocol, the international agreement to reduce emissions of greenhouse gases, Stuart Eizenstat, undersecretary of state for economic, business, and agricultural affairs, emphasized the role energy efficiency will play in its implementation. He announced new funding for research into more efficient automobiles and housing, and an effort to “begin setting new energy efficiency standards for major appliances.” Indeed, until the Kyoto Protocol is submitted to a skeptical Senate for approval, these already existing energy-efficiency statutes are among the few tools the Clinton administration can legally use to combat energy use. Before the nation embarks on new rounds of tougher efficiency standards for everything from washing machines to light bulbs to SUVs, it is worth examining what the first wave of such centrally planned austerity measures has done for us. Despite the positive publicity accorded measures enacted in the name of energy efficiency, they have accomplished nothing. However, they have raised the cost and reduced the quality of affected products, and have created or exacerbated several health and safety problems.

Energy Efficiency Increases Energy UseBen Lieberman, Policy Analyst with the Competitive Enterprise Institute in Washington, D.C. April 1999 - http://www.fee.org/publications/the-freeman/article.asp?aid=4052
An Ineffective Solution Even assuming the global warming crisis is not as spurious as the energy crisis (but see Jonathan Adler, “Global Warming: Hot Problem or Hot Air?” in The Freeman, April 1998) and that substantial environmental benefits will accrue from reduced energy use, there still are serious limitations on how much can be achieved through federally mandated energy efficiency measures. True, if consumers use less energy, then less carbon dioxide will be emitted into the atmosphere, either directly in the case of motor vehicles or fuel-burning appliances, or indirectly in the case of electrical appliances whose energy is generated through fossil-fuel combustion by utilities. But 25 years of energy efficiency measures have failed to stem the increases in national energy use. “People always seem to find more uses for energy,” says Herbert Inhaber, author of Why Energy Conservation Fails. Today’s refrigerators may require half the electricity of a comparable 1980 model, but people are more likely, given the lower operating costs, to own a larger one, or even have two. Better gas mileage has led to increases in vehicle miles traveled. Studies have shown that owners of high efficiency heating systems tend to set their thermostats a bit higher than others. Many consumers “spend” their savings from efficient appliances on other energy-using conveniences, like additional lighting. Ironic but true, a quarter century of federal energy-efficiency mandates has increased, not decreased, total energy use.
Energy Efficiency fails – it increases costs meaning they don’t access the money saved.Ben Lieberman, Policy Analyst with the Competitive Enterprise Institute in Washington, D.C. April 1999 - http://www.fee.org/publications/the-freeman/article.asp?aid=4052
Bad Deal for Consumers The level of consumer satisfaction with many things targeted by the energy-efficiency crusade has declined as a result of Washington’s dictates. This should not be surprising—in a free market, most technological improvements that allow efficiency gains without adverse side effects would be incorporated anyway. Manufacturers, responding to competitive forces, have plenty of incentives to provide the best available balance of price, performance, and operating costs. Efficiency mandates simply upset this balance, placing arbitrary energy-use standards above everything else. Alan Kessler, vice president of Raytheon Appliances, noted in congressional hearings on appliance standards that “from the perspective of DOE and standards advocates, the purpose of major appliances is solely to save energy,” and not to provide maximum overall consumer satisfaction. Energy efficiency, Washington-style, comes at a cost. For example, DOE estimates that the latest energy standard for refrigerators will add $80 to the cost of a new model when the standard takes effect in 2001. DOE is also considering regulations mandating certain highly efficient types of clothes washers that currently cost hundreds more than their conventional counterparts. One study estimates the total cost of appliance standards of $59 billion. True, these and other goods save on energy, but the payback periods are often very long.

Energy efficiency initiatives result in a net increase in consumption.Environmental Protection Online, Energy Efficiency Leads to Increased Consumption, December 28, 2007 http://www.eponline.com/articles/58216/
Energy-efficiency initiatives and regulations do little to cut energy use and often end up increasing consumption, according to a new report from CIBC World Markets. "While seemingly perverse, improvements in energy efficiency result in more of the good being consumed -- not less," said Jeff Rubin, the chief economist and chief strategist at CIBC World Markets. He finds an efficiency paradox where consumers have taken the cost-savings gained through greater efficiency and turned around and spent those savings on more and bigger energy-guzzling products. Rubin notes that with the depletion of conventional oil supply becoming more and more evident and concerns growing over greenhouse gas emissions, energy-efficiency regulations have been widely viewed as the answer. Efficiency gains play a prominent role in most government plans to manage energy consumption, including the latest U.S. Energy Act. But his work finds that these programs are compounding rather than solving the problem. "The problem is that energy efficiency is not the final objective -- reducing energy consumption must be the final objective to both the challenges of conventional oil depletion and to greenhouse gas emissions," he said. "Despite the huge gains in energy efficiency, that is simply not happening. Instead, energy consumption is growing by ever increasing amounts." The report finds that while energy use per unit of U.S. GDP has fallen by almost 50 percent since 1975, total energy usage in the U.S. economy has risen by more than 40 percent in the same period. Most government efforts to promote greater energy efficiency have been targeted at the transportation and residential sectors which together account for half of total energy consumption in the American economy. "While these initiatives have largely been successful at promoting large increases in energy efficiency -- almost double the pace in the rest of the economy -- overall energy usage in the transportation and residential sectors has risen faster than in the rest of the economy," Rubin said. "In short, energy usage has risen fastest where energy efficiency gains have been the greatest." The situation is the same for carbon emissions where emissions from the transportation and residential sectors have risen by 40 percent, double the pace of emission growth in the rest of the economy over the last decade.
Energy efficiency initiatives offset the savings and undermine the rationale for such a policy.Steve Sorrell and John Dimitropoulos SPRU, University of Sussex, November 2005 - http://www.ukerc.ac.uk/Downloads/PDF/R/Rebound_Assessment_Protocol.pdf
The UKERC has consulted widely on the topics that the TPA should consider, through a workshop and a series of interviews with stakeholders (Sorrell and Gross, 2005). The so-called ‘rebound effect’ emerged as a popular topic during this consultation process and was considered a priority for a TPA assessment. The rebound effect results in part from an increased consumption of energy services following improvements in the technical efficiency of delivering those services. This increased consumption may offset the energy savings that may otherwise be achieved and may undermine the rationale for policy measures to encourage energy efficiency.
Energy efficiency fails – it doesn’t correspond in a similar reduction in consumption.Steve Sorrell and John Dimitropoulos SPRU, University of Sussex, November 2005 - http://www.ukerc.ac.uk/Downloads/PDF/R/Rebound_Assessment_Protocol.pdf
The rebound effect is the focus of a long-running dispute with energy economics. The question is whether improvements in the technical efficiency of energy use can be expected to reduce energy consumption by the amount predicted by simple engineering calculations. For example, will a 20% improvement in the thermal efficiency of a heating system lead to a corresponding 20% reduction in aggregate energy consumption? Economic theory suggests that it will not. Three separate mechanisms may offset the energy savings achieved:

The rebound effect means that there is a net increase in consumption.Steve Sorrell and John Dimitropoulos SPRU, University of Sussex, November 2005 - http://www.ukerc.ac.uk/Downloads/PDF/R/Rebound_Assessment_Protocol.pdf
• Direct rebound effects: Improved energy efficiency for a particular energy service will decrease the effective price of that service and should therefore lead to an increase in consumption of that service. This will tend to offset the expected reduction in energy consumption provided by the efficiency improvement. For consumers, the direct rebound effect may be decomposed into a substitution and income effect, while for producers it may be decomposed into a substitution and an output effect. In both cases, the direct rebound effect is confined to the energy required to provide the relevant energy service. • Indirect rebound effects: For consumers, the lower effective price of the energy service will lead to changes in the demand for other goods and services. To the extent that these require energy for their provision, there will be indirect effects on aggregate energy consumption. For example, the cost savings obtained from a more efficient central heating system may be put towards an overseas holiday, with a consequent impact on kerosene consumption. Analogous indirect effects apply to producers, where efficiency improvements lead to changes in demand for other factors of production. At the same time, the lower cost of outputs from one sector may lower the cost of inputs to another sector and thereby increase both production and consumption throughout the economy. For example, energy efficiency improvements in steel production may reduce the price of steel, which in turn may reduce the price of cars, increase the demand for cars and thereby increase the demand for gasoline.
Energy efficiency improvements create increase in energy demand while increasing economic output and investment resulting in a net increase in consumption and increasing climate change.Steve Sorrell and John Dimitropoulos SPRU, University of Sussex, November 2005 - http://www.ukerc.ac.uk/Downloads/PDF/R/Rebound_Assessment_Protocol.pdf
Economy wide rebound effects: The indirect effects from individual energy efficiency improvements may be relatively small. However, the cumulative impact of numerous energy efficiency improvements throughout the economy could potentially be large. A fall in the real price of energy services will reduce the price of intermediate and final goods throughout the economy, leading to a series of price and quantity adjustments, with energy-intensive goods and sectors gaining at the expense of less energy-intensive ones. In particular, energy efficiency improvements may be expected to reduce energy prices, which in turn should increase aggregate energy demand. Energy efficiency improvements may also increased economic output and encourage investment, which should itself increase energy consumption. Numerous empirical studies, principally from the US, suggest that these rebound effects are real and can be significant (Greening, Greene et al., 2000). However, while their basic mechanisms are widely accepted, their magnitude and importance are disputed. Some analysts argue that rebound effects are of minor importance for most energy services (Schipper and Grubb, 2000), while others argue that they are sufficiently important to completely offset the energy savings from improved energy efficiency - a situation termed ‘backfire’ (Brookes, 1990, ; Saunders, 1992). The policy implication is that non-price regulations to improve energy efficiency may neither reduce energy demand nor help to mitigate climate change.
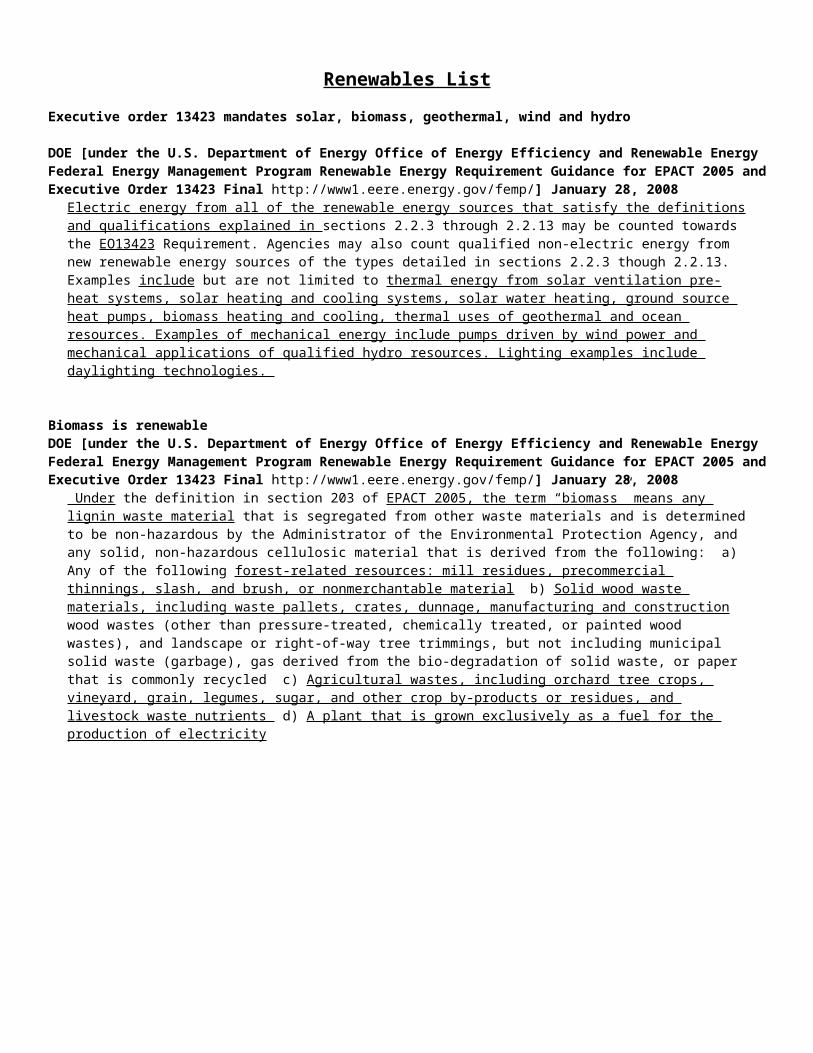
Rebound effect means net increase in consumption – empirically proven.Steve Sorrell and John Dimitropoulos SPRU, University of Sussex, November 2005 - http://www.ukerc.ac.uk/Downloads/PDF/R/Rebound_Assessment_Protocol.pdf
The majority of the empirical evidence relates to direct rebound effects. Generally speaking, there is considerably more evidence for rebound effects resulting from efficiency improvements by consumers than for those resulting from efficiency improvements by producers (Sorrell and Dimitropoulos, 2005). Similarly, there is considerably more evidence for rebound effects in passenger transport and household heating than for other types of energy service. In all cases, however, estimating the magnitude of direct rebound effects is methodologically challenging and raises a range of theoretical and empirical issues. There are fewer estimates of indirect rebound effects since these are harder to isolate empirically. Theory suggests, however, that the indirect rebound effect from an individual energy efficiency improvement should be smaller in magnitude than the direct effect. Economy wide effects are more difficult still to measure or capture, since the parameters involved are more complicated and their inter-dependence is less straightforward than in a partial equilibrium framework. However, it is at the economy-wide level (and over the longer term) where several authors claimthat ‘backfire’ is likely to occur (Brookes, 1990, ; Saunders, 1992). The understanding and quantification of economy wide effects may be of greater importance for climate policy than the more precise quantification of direct rebound effects for individual energy services. Evidence for the rebound effect derives from a range of sources, but only a portion of these have the primary objective of estimating the magnitude of the effect. An important consequence of this is that a keyword search for ‘rebound’ (or equivalent terms such as ‘takeback’) will only uncover a subset of the relevant evidence. At the same time, a comprehensive search that took into account all the relevant evidence (e.g. elasticities of substitution between energy and capital; own price elasticities for energy carriers; etc.) is likely to prove unmanageable. Table 2.1 lists the six methodological categories of evidence identified in the Scoping Note and shows how these relate to the direct, indirect and economy wide rebound effects. It also indicates the approximate size of the evidence base in each case, the internal diversity of this evidence and the relative importance of economic theory in understanding and interpreting this evidence .
Increased efficiency results in more consumption – empirically proven.Horace Herring, EERU, the Open University, Does Energy Efficiency Save Energy: The Implications of accepting the Khazzoom-Brookes Postulate Draft 3. April 1998
The Khazzoom-Brookes postulate, first put forward by the US economist Harry Saunders in 1992, says that energy efficiency improvements that, on the broadest considerations, are economically justified at the microlevel lead to higher levels of energy consumption at the macrolevel than in the absence of such improvements. It argues against the views of conservationists - those promoting energy efficiency as a means of reducing energy consumption- that one can identify every little benefit from each individual act of energy efficiency and then aggregate them all to produce a macroeconomic total. In essence it adopts a macroeconomic (top down) approach rather than the microeconomic (bottom up) approach used by conservationists.It warns that although it is possible to reduce energy consumption through improved energy efficiency it would be at the expense of loss of economic output. It thus argues that overzealous pursuit of energy efficiency per se would damage the economy through misallocation of resources. In other words reduced energy consumption is possible but at an economic cost. The effect of higher energy prices, either through taxes or producer-induced shortages, initially reduces demand but in the longer term encourages greater energy efficiency. This efficiency response amounts to a partial accommodation of the price rise and thus the reduction in demand is blunted. The end result is a new balance between supply and demand at a higher level of supply and consumption than if there had been no efficiency response. Under the economic conditions that have prevailed in the UK most of this century, of falling fuel prices and a free market approach, energy consumption has increased at the same time as energy efficiency has improved. During periods of high energy prices, such as 1973-4 and 1979-80, energy consumption fell. Whether this is due to the adverse consequences of higher fuel prices on economic activity or energy efficiency improvements was a matter of fierce dispute. The lower level of energy consumption at times of high energy price may be at the expense of reduced economic output. This in turn is due to the adverse effect on economic productivity as a whole of the high price of an important resource.

AT: Negative Incentives CP – Perm Mix of incentives and punishments key Joe Loper, Steve Capanna and Jeffrey Harris [“Reducing Greenhouse Gas Emissions In Federal Buildings, Facilities and Vehicles Alliance to Save Energy For the Presidential Climate Action Project” www.ase.org/files/3996_file_ghg_emissions_pcap.pdf] April 2008
Many legislative requirements have not been translated into agency implementation action plans, and administrative carrots and sticks have not been created to offer rewards for achieving or punishments for failing to achieve the requirements. While incentives and accountability are a vital part of implementing policies, the challenge is to reward and penalize people for things they have control over. It is difficult to hold people accountable for failure to implement efficiency projects if funding is not available, procurement rules impede actions, or supervisors give conflicting direction, for example.

***CDC*** FYI: The CDC (Centers for Disease Control and Prevention) is a part of the US Department of Health and Human Services (just in case somebody doesn’t believe it’s actually federal)

Blackouts Coming Now
Blackouts coming now – aging power plants can’t supply increasing power needs
Bloomberg News. Bloomberg News in UK, 4/18/08. “More Power Blackouts Are Likely on Lack of Investment, PwC Says,” http://www.bloomberg.com/apps/news?pid=email_us&refer=europe&sid=a6L1TI_U75ws
Power blackouts similar to those in the U.S. East Coast, Italy and the U.K. two years ago are likely to be repeated around the world because of insufficient investment and aging power plants, PriceWaterhouseCoopers said.
About $12.7 trillion of investment, greater than the U.S. annual economic output, is needed through 2030 to meet an expected doubling in electricity consumption, a report by consultants at PriceWaterhouseCoopers said. That total is higher than the estimated $10 trillion spending on electricity called for by the International Energy Agency during the same period.
``Blackouts are expected to become more frequent,'' according to the report, which was based on a survey of 119 investors and executives at utilities in 36 countries. ``Two-thirds of utility respondents believe the likelihood of blackouts will increase or remain the same. Only a quarter think it will reduce.''
Blackouts coming now – antiquated power system and Bush’s energy policy hurt grid reliability
Nafeez Mosaddeq Ahmed, Executive Director of the Institute for Policy Research & Development, 8/21/03. “The Coming Crisis :: Blackouts, Energy Policy and the New War.” http://usa.mediamonitors.net/content/view/full/260
The largest power blackout in US history hit 50 million people in the northeast of the United States and southern Canada, from New York City to Cleveland, Detroit and Toronto. Whole states and cities were shut down and paralyzed."It's a wake-up call," acknowledged President Bush during a tour of a California national park. "The grid needs to be modernized, the delivery systems need to be modernized".[1]An "antiquated system" as the President described it, however, is not the whole story. In fact, the blackout that swept across North America is only the latest manifestation of a much deeper, and murkier, web of issues relating to the Bush administration's energy policy - a policy intimately connected to national security and foreign policy.

CDC Inherency - Backup Power Failing Current safeguards on BSL-4 insufficient to contain biohazards in a blackout - recent outage proves
GAO, US Government Accountability Office, 10/4/07. “Testimony: Before the Subcommittee on Oversight and Investigations, Committee on Energy and Commerce, House of Representatives,” http://www.gao.gov/htext/d08108t.html
On June 8, 2007, the CDC campus in Atlanta experienced lightning strikes in and around its new BSL-4 facility, and both primary and backup power to that facility were unavailable. The facility was left with only battery power--a condition that provides limited power for functions such as emergency lighting to aid in evacuation. Among other things, the outage shut down the negative air pressure system, one of the important components in place to keep dangerous agents from escaping the containment areas. In looking into the power outage, the CDC determined that, some time earlier, a critical grounding cable buried in the ground outside the building had been cut by construction workers digging at an adjacent site. The cutting of the grounding cable, which had gone unnoticed by CDC facility managers, compromised the electrical system of the facility that housed the BSL-4 lab.[Footnote 15] According to CDC officials, the new BSL-4 facility is still in preparation to become fully operational and no live agents were inside the facility at the time of the power outage. However, given that the cable was cut, it is apparent that the construction was not supervised to ensure the integrity of necessary safeguards that had been put in place.
The CDC is experiencing more frequent power outages, which are in danger of leaving pandemic viruses uncontained
Marietta Daily Journal, 7/14/08. “Power outage at CDC lab not cause for concern, expert says.” http://www.mdjonline.com/content/index/showcontentitem/area/1/section/21/item/114876.html
ATLANTA - A backup generator system at the Centers for Disease Control and Prevention failed and left four buildings, including one that houses a deadly bird flu virus, without power for more than an hour.
The outage affected air flow systems in labs that contain germs such as the H5N1 virus, a strain of avian flu virus that some experts think could cause a pandemic. But neither agency employees nor the public were at risk of exposure to infectious agents, CDC spokesman Tom Skinner told The Atlanta Journal-Constitution.
The outage is the most recent in a series of mechanical and construction problems at labs on the agency's Clifton campus.
An hour-long power outage last summer at a different CDC lab building led to a congressional hearing. The Government Accountability Office, Congress' investigative arm, is still looking into safety at the agency's high-contaminant laboratories. Concerns were raised years ago by agency engineers that the backup power system could fail.

The CDC’s current backup generators are likely to fail – badly designed
Effect Measure, blog written by senior public health scientists and practitioners, 7/14/08. “Bush's CDC is a freak accident waiting to happen,” http://scienceblogs.com/effectmeasure/2008/07/bushs_cdc_is_a_freak_accident.php
You can protect against the consequences of power outages in how you design your power system. The safest designs have redundancies. They don't depend on a single power source for all the vulnerable facilities. CDC was told this by its chief engineer, Johnnie West: The AJC reported last summer that government construction engineers had warned since 2001 that CDC's planned design for its centralized backup power generation system would not keep crucial lab systems from failing in an outage. "I've been saying this for over three years now, but having the generators in this configuration gives us no protection whatsoever from many types of failures," CDC mechanical engineer Johnnie West wrote in an August 2003 e-mail to agency officials, one of several reviewed by the AJC.
Current BSL-4 generators fail in power outages – key to virus containment
Biot Report, Suburban Emergency Management Project publication, 10/4/07. “High-Containment Biosafety Laboratory Safety Breaches a Growing Concern,” http://www.semp.us/publications/biot_reader.php?BiotID=464
On June 15, 2007, lightening struck in and around the CDC’s new $214 million infectious disease building on Clifton Road, Atlanta, including the suite of six BSL-4 laboratories, causing a power surge that knocked out power. Remote backup generators never came on. The outage shut down negative air pressure systems, which keep select agents from escaping the containment areas. (12,13) The BSL-4 labs were uninhabited at the time of the lightning strike/power outage even though construction of the building, which had begun in 2001, had been completed in September 2005. (13) Thus, the public and CDC workers were not placed at any risk as a result of the power outage.Apparently, construction officials warned CDC since 2001 that its backup power system would not keep crucial lab systems from failing in an outage, according to internal documents obtained by The Atlanta Journal-Constitution.” (14) CDC determined that the cause of the failure of its power system servicing the BSL-4 laboratory suite was that “some time earlier, a critical grounding cable buried in the ground outside the building had been cut by construction workers digging at an adjacent site. The cutting of the grounding cable, which had gone unnoticed by CDC facility managers, compromised the electrical system of the facility that housed the BSL-4 lab.” (15) The irony of the situation is that it happened to CDC just as CDC was censuring TAMU for its BSL-3 safety violations.

BSL-4 Power Key to Virus Containment CDC’s pressurized air containment relies on electricity – key to stopping germ spread
Alison Young, Staff writer - Atlanta Journal-Constitution, 7/20/07. “OUTAGE EXPOSES FLAWS AT CDC LAB,” Atlanta Journal-Constitution. http://www.nhne.org/default.aspx?tabid=400&mid=864&articleId=3338&articleType=ArticleView&dnnprintmode=true&SkinSrc=%5BG%5DSkins%2F_default%2FNo+Skin&ContainerSrc=%5BG%5DContainers%2F_default%2FNo+Container
The generators run special negative air pressure systems, in lab rooms and work cabinets, that help trap high-risk germs. When power was lost, air stopped flowing inward but it didn't rush out, said Dr. Casey Chosewood, CDC's health and safety officer. Ebright, the Rutgers professor, said the loss of the pressurized air containment posed a risk. "In those cases, there could be potential exposure of the individuals carrying out the experiments," he said.
Power outages in BSL-4 labs shut off safety features that keep germs from flowing out
Atlanta Journal-Constitution, 5/15/08. “CDC biolab not ready after 2 1/2 years,” http://www.ajc.com/metro/content/printedition/2008/05/15/cdclabs.html
CDC officials dispute any major problems. Yet, last June, the building housing the CDC's unopened BSL-4 labs suffered an hourlong power outage when backup power failed after a lightning strike. The BSL-4 suite lost its negative air pressure, one of several safety features that prevent air and germs from flowing out. CDC officials say the backup power problem has been fixed.
Reliable electricity is key to negative airflow, a crucial germ containment technology in BSL-3 labs
Alison Young, staff writer – Atlanta Journal-Constitution, 7/12/08. “CDC lab containing deadly virus suffers power outage” http://www.ajc.com/news/content/metro/dekalb/stories/2008/07/12/cdc_power_outage.html
• Building 17, a newer infectious disease research lab building, where scientists work with rabies, HIV, influenza and tuberculosis, including extensively drug-resistant strains. The building has Biosafety Level 3 (BSL-3) labs, which need electricity to maintain negative airflow. This key safeguard helps contain germs by making sure air is always being drawn into the lab and through special HEPA filters before leaving the building. When power is lost, the lab has neutral air that neither flows in or out.

BLS-4 – Lots of Diseases Biosafety labs contain the most dangerous disease agents and are vulnerable to accidents and terrorism
GAO, US Government Accountability Office, 10/4/07. “HIGH-CONTAINMENT BIOSAFETY LABORATORIES,” http://www.gao.gov/new.items/d08108t.pdf
BSL-3 and BSL-4 labs often contain the most dangerous infectious disease agents (for example, Ebola, smallpox, avian influenza, and severe acute respiratory syndrome [SARS]), including those for which effective vaccines or treatment may not be available. Although high-containment labs are designed to promote the safety of researchers and the public, accidents and security breaches have occurred in the past. In addition, these labs can be used by terrorists or people with malicious intent to acquire or develop harmful biological agents,1 posing a severe national security and public health threat.
BSL-4s contain the most deadly diseases, such as smallpox or the plague
Biot Report, Suburban Emergency Management Project publication, 10/4/07. “High-Containment Biosafety Laboratory Safety Breaches a Growing Concern,” http://www.semp.us/publications/biot_reader.php?BiotID=464
BSL-3 and especially BSL-4 often contain the most hazardous biological agents, i.e., “any microorganism (including, but not limited to, bacteria, viruses, fungi, rickettsiae, or protozoa) or infectious substance or any naturally occurring, bioengineered, or synthesized component of any such microorganism or infection substance, capable of causing death, disease, or other biological malfunction in a human, an animal, a plant, or another living organism; deterioration of food, water, equipment, supplies, or material of any kind; or deleterious alteration of the environment.” (2) Examples of biological agents handled in BSL-4 laboratories are the small pox virus (Variola major) and the plague virus (Yersinia pestis). Most hospital laboratories are BSL-2 laboratories.

BSL-4 Key – Select Agents
BSL-4 facilities store select agents, which can only be regulated by the federal government
Hugh Auchincloss, M.D., Principal Deputy Director - National Institute of Allergy and Infectious Diseases, 10/4/07. “Protecting the Public Health: The Importance of NIH Biodefense Research Infrastructure,” before the US House of Representations, http://www.hhs.gov/asl/testify/2007/10/t20071004d.html
Monitoring adherence to good laboratory practices is a complex process because multiple agencies are involved. Much of the research in BSL-3 and BSL-4 facilities involves pathogens that have been designated as select agents. CDC and APHIS have the responsibility for regulating the possession, use, and transfer of select agents. For research that involves recombinant DNA, the select agent regulations incorporate the NIH Guidelines for Research Involving Recombinant DNA Molecules (Recombinant DNA Guidelines) as a consideration in the entity’s development of its biosafety plan. The NIH Office of Biotechnology Activities (OBA), with advice and guidance from the NIH Recombinant DNA Advisory Committee (RAC), is responsible for implementation of the Recombinant DNA Guidelines, which outlines biosafety and containment standards for research involving recombinant DNA. Also, the select agent regulations require that restricted experiments, such as the deliberate transfer of a drug-resistant trait to a select agent, must be approved by CDC or APHIS prior to initiation. However, some research conducted in BSL-3 facilities involves neither select agents nor recombinant DNA.

BSL-4 Key – Ebola
Only the CDC’s BSL-4 labs contain Ebola viruses that are capable of reproducing
Lisa Schnirring, CIDRAP Staff Writer, 9/25/07. “Wisconsin lab broke Ebola rules, watchdog group says,” Association for Professionals in Infection Control and Epidemiologyhttp://www.cidrap.umn.edu/apic/bt/vhf/news/sep2507ebola(2).html
UW-Madison's institutional biosafety committee (IBC) wrongly allowed well-known influenza researcher Yoshihiro Kawaoka to work with Ebola genetic material in a biosafety level 3 (BSL-3) lab, though federal rules require use of a BSL-4 lab for such work, the Sunshine Project, based in Austin, Tex., reported on Sep 19. BSL-4 is the highest biosecurity rating.The university stopped the research in October 2006 after the National Institutes of Health (NIH) said a BSL-4 lab was required, even though the university disagreed, according to UW-Madison officials. The NIH was funding the research.Ebola is a highly contagious virus that causes a hemorrhagic fever and is lethal in about 50% to 90% of cases. Because the Ebola virus is so dangerous, the US government lists it as a category A bioterrorism agent. There is no vaccine or specific treatment for the disease.The Web site for Kawaoka's lab says that in addition to work on influenza viruses, researchers are exploring the molecular pathogenesis of the Ebola virus and have established a reverse-genetics system for generating the virus, which they hope to use for vaccine production and the identification of antiviral medication targets.The Web site emphasizes that the lab has developed a novel complement system that allows researchers to study Ebola virus glycoproteins without having to do the work in a BSL-4 lab.Researcher sought lighter restrictionsThe Sunshine Project's report makes it clear that Kawaoka and his colleagues weren't working with live Ebola virus, but rather full-length copies of Ebola DNA (complementary DNA, or cDNA) that lacks two critical proteins that could trigger growth of an infectious virus. However, the group says that federal rules require use of a BSL-4 lab for handling Ebola virus genetic material "that has not been rendered irreversibly incapable of reproducing."

CDC Key - Smallpox The CDC stores the last remaining smallpox viruses in the world
Keay Davidson, Chronicle Science Writer, 6/8/02. “Taking stock of smallpox viruses,” San Francisco Chronicle, http://www.ph.ucla.edu/EPI/bioter/takingstocksmallpox.html
In the late 1970s, smallpox was declared eradicated from the human population. At that time, the World Health Organization arranged for the United States, Soviet Union, Japan and Great Britain to store surviving viruses for medical research purposes.Now only two labs remain in business, in the United States and Russia.OFFICIALLY STORED IN U.S., RUSSIAThe surviving U.S. viruses are stored in secure freezers at the Centers for Disease Control and Prevention, in a suburban Atlanta lab run by Dr. James Hughes, the CDC chief of infectious diseases. The Russians say their last smallpox viruses are stored at a lab in Novosibirsk operated by Dr. Lev Sandakhchiev.

CDC Key – Bird Flu The CDC has engineered a strain of bird flu that is capable of easily infecting humans
New Scientist, 2/28/04. “Superflu is being brewed in the lab,” Lexis
We already know that the H5N1 bird flu virus ravaging poultry farms in Asia can be lethal on the rare occasions when it infects people. Now a team is tinkering with its genes to see if it can turn into a strain capable of spreading from human to human. If they manage this, they will have created a virus that could kill tens of millions if it got out of the lab. Many researchers say experiments like this are needed to answer crucial questions. Why can a few animal flu viruses infect humans? What makes the viruses deadly? And what changes, if any, would enable them to spread from person to person and cause pandemics that might prove far worse than that of 1918? Once we know this, they argue, we will be better prepared for whatever nature throws at us. Others disagree. It is not clear how much we can learn from such work, they argue. And they point out that it is already possible to create a vaccine by other means . The work is simply too dangerous, they say. "I'm getting bombarded from both sides," says Ronald Atlas, head of the Center for Deterrence of Biowarfare and Bioterrorism at the University of Louisville in Kentucky. "Some say that this sort of research is dangerous because of the risk of the virus escaping or being using in bioterrorism, and others that it's good science." Some researchers refuse to discuss their plans. But Jacqueline Katz at the US Centers for Disease Control (CDC) in Atlanta, Georgia, told New Scientist her team is already tweaking the genes of the H5N1 bird flu virus that killed several people in Hong Kong in 1997, and those of the human flu virus H3N2. She is testing the ability of the new viruses to spread by air and cause disease in ferrets, whose susceptibility to flu appears to be remarkably similar to ours.

CDC Key – 1918 Flu
The CDC has recreated the 1918 flu virus in order to study it
CDC, Centers for Disease Control and Prevention, 11/2/05. “Reconstruction of the 1918 Influenza Pandemic Virus,” http://www.cdc.gov/FLU/ABOUT/QA/1918flupandemic.htm
Work with the reconstructed 1918 virus was conducted at and supported by CDC. The U.S. Department of Agriculture (USDA), the National Institutes of Health (NIH), and the Armed Forces Institute of Pathology (AFIP) all provided support for many other aspects of this research. When did CDC begin research on the 1918 virus? CDC studies of the 1918 influenza virus were begun in 2004 with the initiation of testing of viruses containing subsets of the eight genes of the 1918 virus. Previous articles describing the properties of such viruses were published before 2005. Reconstruction of the entire 1918 virus was begun in August 2005. What are the next steps for research on the 1918 pandemic influenza strain at CDC? CDC will evaluate the biological properties of the other individual genes that make up this virus (CDC has examined four of the virus' eight genes so far). Scientists will continue to study the hemagglutinin (HA) gene for potential treatments and other interventions for use against this virus. Researchers also want to gain a better understanding of the role of HA in causing inflammation of the lung, a factor that may contribute to the overall increased levels of illness and death associated with this virus.
The CDC has created the 1918 virus from scratch and is now storing it
Mike Stobbe, Associated Press Writer, 11/10/05. “CDC May Send 1918 Flu To Various US Labs,” http://www.rense.com/general68/dal.htm
Last month, U.S. scientists announced they had created - from scratch - the 1918 virus. It was the first time an infectious agent behind a historic global epidemic had ever been reconstructed.Researchers said they believed it would help them develop defenses against the threat of a future pandemic evolving from bird flu, which was found to have similar characteristics as the 1918 virus.About 10 vials of virus were created, each containing about 10 million infectious virus particles. CDC officials said at the time the particles would be stored at a CDC facility in Atlanta, and that there were no plans to send samples off campus.
CDC scientists have sequenced and rebuilt the deadly 1918 flu virus
New Scientist, 10/5/05. “US scientists resurrect deadly 1918 flu,” http://www.newscientist.com/article.ns?id=dn8103
In a surprise announcement, scientists in the US say they have recreated the influenza virus that killed at least 50 million people in 1918, and they have infected mice with it. They say the need to understand how flu viruses cause lethal pandemics outweighs any safety risks. But the risks may not be negligible. By painstakingly piecing together viral fragments from hospital specimens and a victim buried in Alaskan permafrost, Jeff Taubenberger and colleagues at the US Armed Forces Institute of Pathology in Rockville, Maryland, have now sequenced all eight coding regions of the 1918 flu virus’s genome. They published the last three - coding for the polymerase complex that allows the virus to replicate - on Wednesday (Nature DOI: 10.1038/nature04230). Meanwhile, Terrence Tumpey at the US Centers for Disease Control in Atlanta and colleagues used the sequences to rebuild the virus itself, and infect mice with it. They report this week that unlike other flu viruses, 1918 does not need a protein-splitting enzyme from its surroundings to replicate, instead using some hitherto-unknown mechanism. And as in 1918, it rapidly destroys lungs (Science, vol 310, p 77).

CDC Outage Biohazards
CDC power outagebiohazard6/15/99. http://greenspun.com/bboard/q-and-a-fetch-msg.tcl?msg_id=000xJZ
After a local power outage of three weeks, the CDC's backup generators fail. Cultures of smallpox and other biohazard materials stored within the electrically-operated containment facilities may or may not get released into the local environment. Government officials pass the word "All is well.", but the neighbors are evacuated to special hospital camps "As a precaution." Six months later, refugees who admit they're from a three-state vicinity of the CDC facility are shot on sight by a panicked population afraid of being infected by a now rampaging plague.
Far-fetched? Maybe. Then again, maybe more likely than a smallpox attack from abroad. After all, these stockpiles are already within our borders. Is it possible? Like much of Y2K, we don't know. We can only hope.
What is disturbing is this: there have been no firm statements that in case of serious Y2K-induced failures that the cultures at the CDC and other facilities will be contained. There has been no discussion of contingency plans for emergency destruction (incineration?) of the cultures in the event that loss of containment appears imminent.

Smallpox Sucks Smallpox is the greatest biological threat – it spreads quickly and is difficult to diagnose and treat
Ned Stuckey-French, U.S. Public Health Service, 10/26/01. “Bioterror, Then and Now,” In These Times. http://www.inthesetimes.com/issue/25/26/feature4.shtml
It’s also deadly. Smallpox has killed more people than any other disease in history, including bubonic plague. At least 300 million people died of smallpox in the 20th century alone. Even with modern medical care, smallpox kills about a third of the unvaccinated people it strikes. There are no mild cases. Survivors are left scarred, and sometimes blind or with deformed bones. But one of the great victories of 20th century science was the eradication of smallpox. The last known case occurred in 1978. The hitch is that once the disease was wiped out, routine vaccinations stopped. Virtually no one has been vaccinated in the United States since 1972, and most of us who were vaccinated back in the ’60s could now contract the disease because immunity does not persist permanently. It’s estimated that only 10 to 15 percent of the U.S. population has residual immunity. In June 1999, experts meeting at the Centers for Disease Control and Prevention in Atlanta unanimously agreed that, followed by anthrax, smallpox was the greatest bioterrorist threat to the United States.It is some comfort that Secretary Tommy Thompson recently named Dr. D.A. Henderson to chair the Health and Human Services advisory council on bioterrorism. Henderson is the Johns Hopkins researcher who led the World Health Organization’s successful campaign to eradicate smallpox, and no one understands smallpox better than he does. For many years, he has been writing about the real and immediate dangers posed by bioterrorism. He has argued for the stockpiling of drugs and vaccines, the training and mobilization of health workers, the education of the public, and the need to build an international consensus against the use of biological weapons. “We are ill-prepared to deal with a terrorist attack that employs biological weapons,” Henderson declared in a 1998 article in the journal Emerging Infectious Diseases. “The specter of biological weapons use is an ugly one, every bit as grim and foreboding as that of a nuclear winter.”Regarding smallpox specifically, Henderson warned: “If some modest volume of virus were to be released (perhaps by exploding a light bulb containing virus in a Washington subway), the event would go unnoticed until the first cases with rash began to appear 9 or 10 days later.” Because hardly any doctors have ever seen smallpox, and so few laboratories can test for it, several more days might go by before the first diagnosis was made. If only 100 people were originally infected, Henderson wrote, tens of thousands, including many unsuspecting hospital personnel, could have been exposed by the time the epidemic was identified. Hospital isolation wards and our national stores of vaccine would at that point be sorely tested.

Smallpox is the biggest threat to the civilian population – it is easily transmitted and few vaccines exist
U Pittsburgh Medical Center, 2001. “Dark Winter Scenario: Exercise Findings.” http://www.upmc-biosecurity.org/website/events/2001_darkwinter/findings.html
Smallpox, because of its high case-fatality rates and transmissibility, represents one of the most serious biological warfare threats to the civilian population. In 1980, the World Health Assembly announced that smallpox had been eradicated and recommended that all countries cease vaccination. Although labs in two countries still officially store smallpox samples (U.S. and Russia), its re-appearance would almost certainly indicate an intentional outbreak.Aerosol release of smallpox virus disseminated among a relatively small population could result in a significant epidemic. Evidence suggests the infectious dose is very small. Several factors are cause for concern: the disease has historically been feared as one of the most serious of all pestilential diseases; it is physically disfiguring; it bears a 30 percent case-fatality rate; there is no treatment; it is communicable from person to person. Vaccination ceased in this country in 1972, and vaccination immunity acquired before that time has undoubtedly waned. Prior to eradication, data on smallpox outbreaks in Europe indicated that victims had the potential to infect 10 to 20 others. However, there has never been a smallpox outbreak in such a densely populated, highly mobile, unvaccinated population such as exists today.In 1947, in response to a single case of smallpox in New York City, 6,350,000 people were immunized (500,000 in one day), including President Harry Truman. In 1972, after disappearing from Yugoslavia for four decades, a single case of smallpox emerged. There are two ways to control a smallpox epidemic – vaccine and isolation. Yugoslavia's Communist leader, Josip Tito, used both. He instituted a nation-wide quarantine, and immunized the entire country of 20 million people using vaccine supplied by the World Health Organization.Estimates of the current U.S. supply of smallpox vaccine range from 7 to 12 million doses. This stock cannot be immediately replenished, since all vaccine production facilities were dismantled after 1980, and renewed vaccine production is estimated to require at least 24-36 months. The Centers for Disease Control and Prevention recently contracted with Acambis Inc. of Cambridge MA to produce 40 million doses of new vaccine.
A smallpox resurgence would be more deadly than ever before – no natural immunity
New York Times, 6/15/99. “Smallpox: The Once and Future Scourge?” http://www.nytimes.com/library/national/science/061599sci-smallpox.html
Experts warn that if smallpox returns it could be more deadly than ever. The effects of the disease on an unprotected population were underscored by the experience of settlers who set sail from Plymouth, England, landed on the Massachusetts coast in 1620 and found the area remarkably free of Indians because a deadly epidemic had just swept through. Early explorers had already spread the virus.
Over the ages, immunities built up slowly as people survived the infection, with children usually faring better than adults. Later on, vaccinations helped keep the scourge at bay.
Today, experts say, such protections are all but gone and people are generally more vulnerable to the disease, underscoring the need for intelligent debate and possibly protective action.
"We're all Indians," said Elizabeth A. Fenn, a smallpox historian at George Washington University. "We're approaching 100 percent susceptibility."

Existing smallpox vaccinations fail – FDA regulations prevent administration
New York Times, 6/15/99. “Smallpox: The Once and Future Scourge?” http://www.nytimes.com/library/national/science/061599sci-smallpox.html
In 1972, the United States stopped routine vaccinations of civilians against smallpox, nearly a decade ahead of much of the world. Thus, about 114 million Americans born since then, 42 percent of the population, are completely vulnerable.For people age 27 and older who were vaccinated, the degree of protection is unclear because scientists have never systematically measured the duration of immunity. Protection probably drops with time, but how much is unknown. Lifelong immunity is unlikely, some experts say. But old vaccinations may lead to milder attacks.At the end of the eradication program, W.H.O. and a number of countries independently stored enough smallpox vaccine for 60 million people and kept a safeguarded supply of the vaccinia virus to make vaccine in case more was needed.With its cache, the United States in theory could protect up to 14 million people if each vial of stored vaccine was used to its maximum potential of 100 doses. The manufacturer, Wyeth Laboratories, holds the supply of vaccine in Marietta, Pa., under the control of the Centers for Disease Control and Prevention in Atlanta.Smallpox vaccine is still needed at C.D.C. for scientists who work with the virus. But serious problems with quality control have stopped vaccinations, creating an acute problem for a very select group of scientists in the United States and, in the event of an emergency, a much wider group of people.Crumbling rubber stoppers on vials are letting in moisture, and a brilliant green dye is inexplicably losing its color, but the vaccine remains near normal potency, Federal experts say. The bigger problem is that the American supply of a colorless liquid medicine, known as vaccinia immune globulin, which is needed to counteract adverse reactions to the vaccine, has turned pink for reasons no one understands. Federal rules say the medicine must be on hand before vaccinations are given, and the Food and Drug Administration has barred its use until the mystery is solved.
Only an accidental release can cause a smallpox outbreak – no longer exists naturally
Home Office, UK Science & Research Group, 3/28/06. “Prophylaxis & Therapy for Intracellular Pathogens,” http://scienceandresearch.homeoffice.gov.uk/animal-research/publications-and-reference/001-abstracts/abstracts2-2006/feb-2006/045?view=Html
Smallpox kills about 40% of the people who get it, and it spreads very easily. It is a very serious disease. The current vaccine is not offered to people who have eczema or who have immune system problems such as HIV or who have had chemotherapy. It is a live vaccine, and so can spread from people who have been given the vaccine by their doctor to people who have not. Due to the bio-warfare and bio-terrorism threat of smallpox and the risks associated with the current vaccine, there is a need to develop a new, safer smallpox vaccine for protection against a release of the smallpox virus.The safety problems with the current vaccine mean that it is not routinely given to people living in areas where they may contract monkeypox (a closely related virus), which kills between one-in–ten and one-in-a-hundred people who contract it. A safer vaccine may allow steps to be taken to protect people from that disease as well.A new smallpox vaccine cannot be properly tested in people because the only way to catch smallpox is through an accidental or bio-warfare/bio-terrorism release (the World Health Organisation managed to eliminate wild smallpox in the 1970s). As a result, a very strong animal model must be used to test new smallpox vaccines.

Smallpox Sucks – Military A US smallpox outbreak kills military readiness – limited troop movement
Pamela Hess, UPI Pentagon Correspondent, 2/13/02. “Pentagon plans for smallpox outbreak,” United Press International
Military personnel would generally not be carrying weapons to enforce the quarantine in the event of a biological weapons attack. However, they could be deployed to the affected area with weapons, and the weapons would be secured in a warehouse in case they are needed. Weapons would only be carried with the express order by the secretary of defense and the attorney general, according to a Defense Department smallpox response plan released in September.
Local military commanders may use troops at local civilian authority request without approval from the Pentagon to save lives, prevent human suffering and mitigate great property damage, according to the plan.
An outbreak of smallpox in the United States could seriously infringe on military activities, as flights and troop movement would be cut to a minimum to slow the potential spread of the disease. Those within one hour of ground transportation -- or one leg of a commercial flight originating at an airport within an hour ground transport of an infected area -- would be considered the most likely to have been exposed.

Bird Flu Sucks Bird flu outweighs AIDS and global warming times 10 – could kill 150 million
BBC News, 9/30/05. “Bird flu 'could kill 150m people,’” http://news.bbc.co.uk/2/hi/asia-pacific/4292426.stm
David Nabarro, who is charged with co-ordinating responses to bird flu, said a mutation of the virus affecting Asia could trigger new outbreaks. "It's like a combination of global warming and HIV/Aids 10 times faster than it's running at the moment," Dr Nabarro told the BBC. But the World Health Organisation has distanced itself from the figure. The WHO spokesman on influenza, Dick Thompson, told a news conference in Geneva that the WHO's official estimate of the number of people who could die was between two million and 7.4 million. QUICK GUIDE Bird flu "There is obvious confusion, and I think that has to be straightened out. I don't think you will hear Dr Nabarro say the same sort of thing again," Mr Thompson said. Bird flu has swept through poultry and wild birds in Asia since 2003. It has killed huge numbers of birds and led to more than 60 human deaths. Prepared for worst "The range of deaths could be anything between 5m and 150m," the UN's new co-ordinator for avian and human influenza said in his BBC interview. Dr Nabarro said he stood by the figure drawn from the work of epidemiologists around the world. "My reason for giving the higher figure is simply that I want to be sure that when this next flu pandemic does come along, that we are prepared for the worst as well as for the mildest," he said. In an earlier interview with the BBC, he said the likelihood that the Asian virus could mutate and jump to humans was high. "The consequences in terms of human life when the pandemic does start are going to be extraordinary and very damaging," he said.
Avian flu will mutate to human-to-human transmission, causing to a deadly flu pandemic USA Today, 12/05. “Avian influenza virus could kill millions,” Society for the Advancement of Education. http://findarticles.com/p/articles/mi_m1272/is_2727_134/ai_n15975922/pg_2?tag=artBody;col1
Since 2003, about 60 people have died in Southeast Asia from H5N1, around half of those afflicted. Outbreaks in birds have been confirmed in 11 countries, and the disease is spreading north into regions outside of Southeast Asia and already has been reported in Russia. The disease's spread, occurrences of other bird flu types, and the already confirmed human cases provide added impetus for finding more effective vaccine protection, Mittal asserts. The CDC reported two human cases of another bird flu in the U.S. in recent years--H7N2 in Virginia (2002) and New York (2003).Viruses are classified according to the combination of two types of proteins found on the virus cell surface. The 15 types of hemagglutinin (H) protein and nine types of neuraminidase (N) protein form a large number of influenza viruses for which birds are the natural hosts. New, often more dangerous flu strains develop when the H and N combinations change. When the genes of a human or swine influenza mix with an avian variety, a highly pathogenic human flu likely will result.These virus alterations work a bit like a jigsaw puzzle: As two viruses grow in the same animal, they replicate and reassemble their genome. If one virus takes a piece of genome from the other virus to fill an empty spot, then a new virus is born. The potential for a pandemic exists when one of these new viruses is introduced into the human population. People with no previous exposure to this new flu strain have little or no immunity, making them highly susceptible to a virus that now easily can spread from person to person.The last pandemic was 1968-69 when 34,000 Americans died of the Hong Kong flu (H3N2), a disease still circulating. In 1957-58, Asian flu (H2N2) killed 70,000 people in the U.S. The worst flu pandemic was in 1918-19, when Spanish flu (H1N1) was fatal to 500,000 in the U.S. and as many as 50,000,000 worldwide. Unlike other influenza outbreaks, the origin of that virus remains unknown.Scientists believe that without the right vaccines and preparation, H5N1 has the potential to be one of the deadliest flu outbreaks if it mutates to human-to-human transmission. This flu strain was first identified in South Africa in 1961, with the first bird-to-human case recorded in 1997. "Many people believe that this virus will mutate and become more widespread," Mittal warns. "The question is when? Are we prepared? We hope that successful completion of this project will result in development of an adenovirus-based vaccine effective against pathogenic avian influenza viruses."

An avian flu outbreak would be devastating – no preparations
Jay Fraser, President of Tracer Detection Technology Corp., a company involved in document security, brand protection, and covert tracking technologies, 10/30/07. “The “Next” Step in Bird Flu Mutations,” http://threatswatch.org/rapidrecon/2007/10/
Based on the “Not if but when,” point of view, David Nabarro, a senior United Nations official in charge of the bird flu prevention effort warns that the world is not ready to deal with a potential Avian, or “bird” flu pandemic that could kill millions of people world-wide. The concern is that once the H5N1 or a variant mutates to the point where is can be transmitted from human to human, the spread around the globe will be quick, maybe outstripping the ability to develop and distribute a vaccine countermeasure.
Further, he concludes, that while some have actually been able to stockpile anti-viral vaccines, they have yet to plan for the enormous societal and economic impact a pandemic would bring. “Unfortunately, only a relatively small number are adequately prepared to keep going in the event that the pandemic has massive absenteeism associated with it, Nabarro said. We need hard work for at least two or three years more to make sure that the whole world is properly pandemic ready.”
How real is the threat of the Avian Flu making the jump to humans, and then mutating to a point where it can be spread from human to human? Back in February, I noted in a post, Preparing for a Natural Disaster of Pandemic Proportions that “the potential threat is that the difference between a flu virus that kills millions, and one that kills only a few comes down to just two amino acid changes, researchers say. In very technically medical terms:

1918 Flu
A 1918 outbreak would kill at least 62 million people – studies prove
Scientific American, 12/21/06. “Warning: A Flu Pandemic Today Could Kill As Many As 80 Million People,” The Lancet
If the 1918 flu pandemic broke out today, it would likely kill at least 62 million people, or slightly more than the number that die in a single year from all other causes combined. The estimate stems from a new tally of flu deaths from 1918 to 1920 in different countries, which varied widely. Based on their findings, authors of the study say that 96 percent of the victims of a present-day pandemic would be in the developing world.The report comes on the heels of fears that the H5N1 flu virus currently circulating among birds in Southeast Asia and Africa may be the precursor to a deadly global outbreak or pandemic. To gauge the potential threat, researchers reviewed the toll of the most severe previous case, which occurred in 1918 when a flu swept the world, claiming at least 20 million lives. "It's the benchmark against which we worry about future flu pandemics," says population health researcher Christopher Murray of the Harvard Initiative for Global Health.To determine the number of deaths from the 1918 flu, Murray and his colleagues reviewed the death registries from countries that kept good records between 1915 and 1923. They calculated the number of deaths from the flu in each country by subtracting the average death rate during the pandemic years from those of the years before and after. Most prior estimates relied on less credible figures, including eyewitness accounts, Murray says.The number of dead in a modern pandemic could range from 50 million to 80 million, the group reports in a paper published online by The Lancet. To estimate the death toll if a pandemic struck today, they applied each country's 1918 death rate to its 2004 population. Their figure sets a plausible upper limit on deaths from a similar virus, Murray says. Researchers do not know, however, if the virus that causes the next pandemic will be more or less deadly than the one in 1918. As of late November the H5N1 virus had killed 154 people out of 258 confirmed cases, suggesting to researchers that it may be particularly deadly.
A 1918 flu outbreak today would kill 81 million – empirical data proves
Christopher Murray, Adjunct Professor of Population Policy – Harvard, 12/23/06. “Estimation of potential global pandemic influenza mortality on the basis of vital registry data from the 1918–20 pandemic: a quantitative analysis,” The Lancet
Were a strain of influenza much the same as that which caused the 1918–20 pandemic to emerge in 2004, we estimate that it could kill 51–81 million individuals. This estimate is based strictly on recorded patterns of mortality in countries with nearly complete vital registration systems, rather than on theoretical models or assumptions about attack rates and case-fatality rates.

Ebola Made Me Cry (Blood) Ebola is one step away from mutating into a global killer – containment is key
C. William Fox, MD, Commander of Bayne-Jones Army Hospital, 6/24/97. “Military Medical Operations in Sub-Saharan Africa” http://www.strategicstudiesinstitute.army.mil/pubs/display.cfm?PubID=639
Ebola-Zaire virus, first discovered in 1976, is the stereotype of the virulent, almost invulnerable "Hot-Zone" virus. It strikes with great suddenness and lethality, then disappears until the next outbreak. At the very least, in each of the four recorded mass outbreaks, the 90 percent death rate is a stark reminder of the vulnerability of the human species. 29 No one yet knows where the virus resides in nature, how the human epidemics get started or why they are so rare. In the recorded outbreaks in Zaire and the Sudan, flu-like symptoms typically appear within three days of infection and death soon occurs from generalized organ failure preceded by a hemorrhagic diathesis from every orifice. In its present form, ebola is unlikely to become a world pandemic disease due to its means of spread (by infected secretions) and its extreme sensitivity to ultraviolet light. However, given a simple alteration to its genetic structure that provides for more protection during transmission, it could suddenly become a threat of global proportions. This virus does serve to spotlight the very real horrors that epidemic and pandemic diseases can easily produce in today's interconnected world. A genetically altered ebola virus is just one of several lethal viruses found in Africa that could be utilized as biological weapons with cataclysmic lethality. Others, like Marburg virus and Congo-Crimean Hemorrhagic fever virus, require further investigation and research. These diseases are sufficiently threatening now to warrant an aggressive surveillance program and an expanded capability for isolation and containment of further outbreaks.

An Ebola outbreak is equivalent to a deliberate full-scale WMD attack
C. William Fox, MD, Commander of Bayne-Jones Army Hospital, 6/24/97. “Military Medical Operations in Sub-Saharan Africa” http://www.strategicstudiesinstitute.army.mil/pubs/display.cfm?PubID=639
HIV is a pandemic killer without a cure, and viruses such as Ebola-Zaire are merely a plane ride away from the population centers of the developed world. Viruses like ebola, which are endemic to Africa, have the potential to inflict morbidity and mortality on a scale not seen in the world since the Black Plague epidemics of medieval Europe (which killed a full quarter of Europe's population in the 13th and 14th centuries.) These diseases are not merely African problems, they present a real threat to mankind. They should be taken every bit as seriously as the concern for deliberate use of weapons of mass destruction.
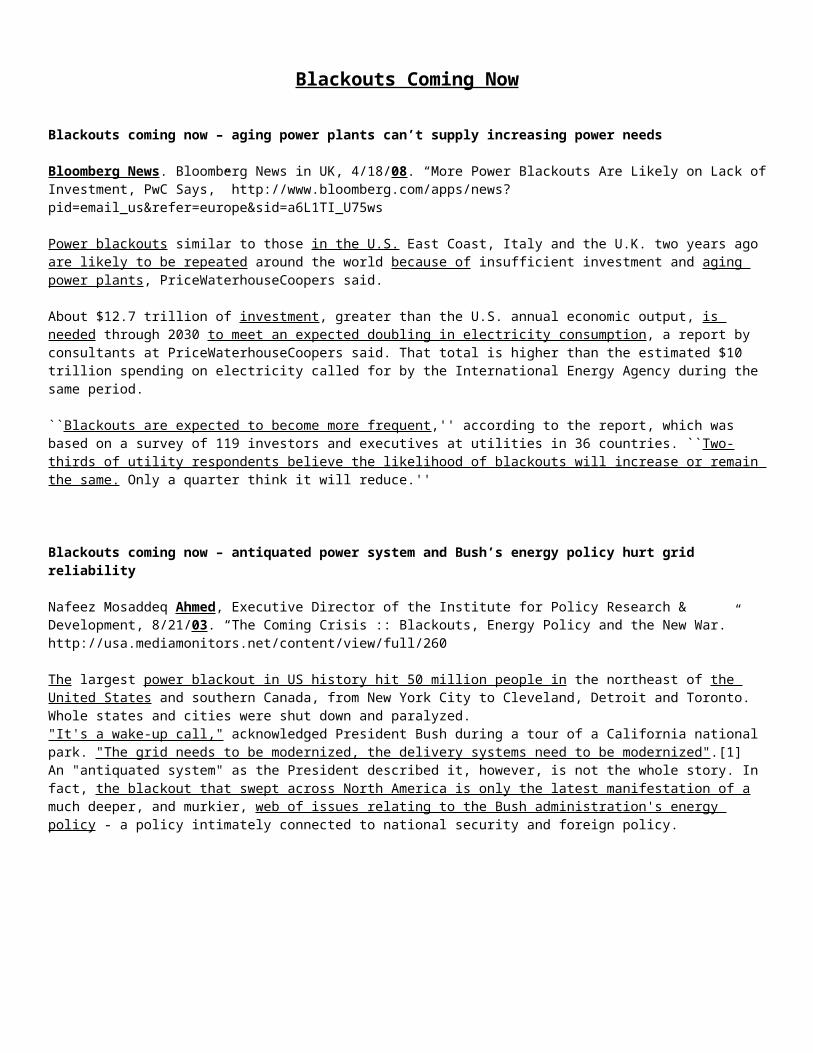
Ebola is the scariest shit in the entire world – you literally melt from inside (just FYI, you prob don’t want to read this in round…or ever)
Liveleak, online media source, 6/11/08. “Ebola Zaire virus - no cure - 88% mortality rate,” http://www.liveleak.com/view?i=fb1_1213196416
Ebola Zaire attacks every organ and tissue in the human body except skeletal muscle and bone. It is a perfect parasite because it transforms virtually every part of the body into a digested slime of virus particles. The seven mysterious proteins that, assembled together, make up the Ebola-virus particle, work as a relentless machine, a molecular shark, and they consume the body as the virus makes copies of itself. Small blood clots begin to appear in the bloodstream, and the blood thickens and slows, and clots begin to stick to the walls of blood vessels. This is known as pavementing, because the clots fit together in a mosaic. The mosaic thickens and throws more clots, and the clots drift through the blodstream into the small capillaries, where they get stuck. This shuts off the blood supply to various parts of the body, causing dead spots to appear in the brain, liver, kidneys, lungs, intestines, testicles, breast tissue (of men as well as women), and all through the skin. The skin develops red spots, called petechiae, which are hemorrhages under the skin. Ebola attacks connective tissue with particular ferocity; it multiplies in collegen, the chief constituent protein of the tissue that holds the organs togehter. (The seven Ebola proteins somehow chew up the body's structural proteins.) In this way, collagen in the body turns to mush, and the underlayers of the skin die and liquefy. The skin bubbles up into a sea of tiny white blisters mixed with red spots known as a maculopapular rash. This rash has been likened to tapioca pudding. Spontaneous rips appear in the skin, and hemmoraghic blood pours from the rips. The red spots on the skin grow and spread and merge to become huge, spontaneous bruises, and the skin goes soft and pulpy, and can tear off if it is touched with any kind of pressure. Your mouth bleeds, and you bleed around your teeth, and you may have hemorrhages from the salivary glands -- literally every opening in the body bleeds, no matter how small. The surface if the toungue turns brilliant red and the sloughs off, and is swallowed or spat out. It is said to be extraordinarily painful to lose the surface of one's tongue. The tongue's skin may be torn off during rushes of the black vomit. The back of the throat and the lining of the wind pipe may also slough off, and the dead tissue slides down the windpipe into the lungs or is coughed up with sputum. Your heart bleeds into itself; the heart muscle softens and has hemorrhages into its chambers, and blood squeezes out of the heart muscle as the heart beats, and it floods the chest cavity. The brain becomes clogged with dead blood cells, a conditions known as sludging of the brain. Ebola attacks the lining of the eyeball, and the eyeballs may fill up with blood: you may go blind. Droplets of blood stand out on the eyelids: you may weep blood. The blood runs from your eyes down your cheeks and refuses to coagulate. You may have a hemispherical stroke, in which one whole side of the body is paralyzed, which is invariably fatal in a case of Ebola. Even while the body's internal organs are becoming plugged with coagulated blood, the blood that streams out of the body cannot clot; it resembles whey being squeezed out of curds. The blood has been stripped of its clotting factors. If you put the runny Ebola blood in a test tube and look at it, you see that the blood is destroyed. Its red cells are broken and dead. The blood looks as if it has been buzzed in an electric blender.Ebola kills a great deal of tissue while the host is still alive. It triggers a creeping, spotty necrosis that spreads through all the internal organs. The liver bulges up and turns yellow, begins to liquefy, and then it cracks apart. The cracks run across the liver and deep inside it, and the liver completely dies and goes putrid. The kidneys becomes jammed with blood clots and dead cells, and cease functioning. As the kidneys fail, the blood becomes toxic with urine. The spleen turns into a single huge, hard blood clot the size of a baseball. The intestines may fill up completely with blood. The lining of the gut dies and sloughs off into the bowels and is defecated along with large amounts of blood. In men, the testicles bloat up and turns black-and-blue, the semen goes hot with Ebola, and the nipples may bleed. In women, the labia turn blue, livid, and protrusive, and there may be massive vaginal bleeding. The virus is a catastrophe for a pregnant woman: the child is aborted spontaneously and is usually infected with Ebola virus, born with red eyes and a bloody nose.Ebola destroys the brain more thoroughly than does Marburg, and Ebola victims often go into epileptic convulsions during the final stage. The convulsions are generalized grand mal seizures -- the whole body twitches and shakes, the arms and legs thrash around, and the eyes, sometimes bloody, roll up into the head. The tremors and convulsions of the patient may smear or splatter blood around. Possibly this epileptic splashing of blood is one of Ebola's strategies for success -- it makes the victim go into a flurry of seizures as he dies, spreading blood all over the place, thus giving the virus a chance to jump to a new host -- a kind of transmission through smearing.

Renewables Solve Power Outages
Renewables in federal facilities are key to reliable energy – on-site electricity generation protects against power disruptions
DoE, US Department of Energy, 11/10/06. “FEMP Renewable Energy Overview,” Federal Energy Management Program, http://www1.eere.energy.gov/femp/pdfs/30800.pdf
Abundant energy from the sun, the wind, plants, and the Earth itself—renewable energy—can provide some or all of your Federal facility’s needs for heating, cooling, and electricity. The U.S. Department of Energy’s Federal Energy Management Program (FEMP) has developed ways to help you tap into these clean, secure energy resources. FEMP provides agencies with information, guidance, and assistance in using renewable energy. Using renewable energy reduces the nation’s need for imported fuels, which enhances our energy security. Renewable energy also helps to conserve the nation’s natural resources, and it has almost no adverse effect on the environment. It also provides fuel diversification, which serves as a hedge against volatile utility prices. Where renewable resources are available, they can contribute significantly to the energy security of an individual Federal facility. They provide a naturally occurring, continual flow of energy, at or near the place where the energy is used. They are thus distributed rather than centralized resources. This can be important to energy managers who have to make sure their facility will keep operating even if utility power is disrupted by reductions in supplies or national emergencies.
Renewable energy systems are key to preventing power failures – on-site back-up power is most reliable
DoE, US Department of Energy, 10/95. “Nature's Power on Demand: Renewable Energy Systems as Emergency Power Sources,” http://www.freshstart.ncat.org/articles/enrgsyst.htm
Renewable energy systems can be significant contributors to energy emergency preparedness and can help to bolster the overall resilience of the U.S. electrical energy system.PV-powered warning and detection devices already help to prevent some disasters and ensure a rapid response to others. Once a disaster has occurred, portable PV systems can meet a number of small-scale emergency power needs.The emergency response community must now build on its experience with portable PV power. It is certain that the systems must be preassembled and ready to go when they arrive at disaster sites. Further field-testing and design work is needed to identify optimal system sizes and applications. Once completed, agencies such as FEMA, the Red Cross, and the U.S. Army Corps of Engineers may want to consider stockpiling PV systems and providing their energy staffs with advance training on how to install and use them.Beyond the emergency response realm, power failures in general can be prevented through increased use of on-site renewable energy systems using solar, wind, micro-hydro, or biomass energy. The need for highly reliable back-up power is greater than ever, considering that a major utility grid disruption in one location can not only cause power outages hundreds of miles away, but also result in costly contingent business interruption insurance claims from all over the country.Given this reality, businesses, utilities, insurance companies, and government and private emergency-response agencies should actively investigate the feasibility of on-site renewable energy systems. While they'll find that the purchase price of conventional fossil-fueled back-up generators is lower, they'll also discover that the costs of renewable energy technologies are becoming increasingly competitive. They also cost less to operate, free system owners of a worrisome dependence on fuel, and offer hard-to-quantify benefits such as silence and clean air.

Renewable energy solves power outages – Harmony resort in St. John proves
DoE, US Department of Energy, 10/95. “Nature's Power on Demand: Renewable Energy Systems as Emergency Power Sources,” http://www.freshstart.ncat.org/articles/enrgsyst.htm#preventing
Because they can be designed to continue working even when the utility grid fails, renewable energy systems can actually prevent power outages -- keeping homes and businesses functioning during black-outs, or amid the chaos following natural disasters.
A recent example of this benefit involves the Harmony resort facility at Maho Bay Campground on St. John, one of the U.S. Virgin Islands. In mid-September, Hurricane Marilyn swept 115 mile-per-hour winds across the island, tearing roofs off buildings and knocking out electricity and phone service. The recycled building materials used to construct the Harmony facility survived the winds, as did its PV systems. According to Stanley Selengut, president of Maho Bay Camps, Inc., the systems' battery banks never faltered and were once again replenished by the solar panels when the storm passed and sun reappeared. Campground staff remained at Harmony during the hurricane period and were among the few Virgin Islanders who had light, refrigeration, hot showers, flush toilets, and the ability to communicate with the outside world.
Solar power solves emergency health situations and vaccine storage
Green Energy Ohio, not-for-profit organization dedicated to promoting environmentally and economically sustainable energy policies and practices in Ohio, 4/21/04. “Shell Solar to Provide Backup Power for Athens City-County Health Department,” http://www.greenenergyohio.org/page.cfm?pageId=71
Shell Solar and one of its solar contractors, Third Sun Solar and Wind Power, announced that they have completed installation of 20 photovoltaic (solar) panels at the Athens City-County Health Department in Ohio. The installation of the solar panels will provide critical backup power to the health department during emergency situations, thus helping to insure the safety of vaccines stored at controlled temperatures during potential power outages.
The newly installed solar electric system will generate sufficient power to operate critical loads in the Athens City-County Health Department, including refrigerators that store vaccines and key communications equipment, such as computers and telephone/fax machines. The system will therefore improve the Health Department’s ability to respond to public health threats and emergencies, as well as reduce their dependence on the local electrical grid.

CDC Smallpox Add-on Smallpox only exists in CDC laboratories
American Academy of Pediatrics, 12/2001. “What you should know about anthrax, smallpox and other biological agents,” AAP News Vol. 19 No. 6 December 2001, p. 275. http://aapnews.aappublications.org/cgi/content/full/19/6/275
Smallpox is a viral illness that occurs only in humans. Thanks to a worldwide immunization program, smallpox is no longer a naturally occurring disease. The last known case occurred in Somalia in 1977, and in May 1980, the World Health Organization certified that the world was free of smallpox cases. During the smallpox era, about 30% of infected people died. The only known samples of smallpox virus are kept for research purposes in secure facilities at the CDC in Atlanta and the Institute for Viral Preparations in Russia. Although there is no proof, there is concern that terrorists might have acquired samples of smallpox as well.
Only an accidental release can cause a smallpox outbreak – no longer exists naturally
Home Office, UK Science & Research Group, 3/28/06. “Prophylaxis & Therapy for Intracellular Pathogens,” http://scienceandresearch.homeoffice.gov.uk/animal-research/publications-and-reference/001-abstracts/abstracts2-2006/feb-2006/045?view=Html
Smallpox kills about 40% of the people who get it, and it spreads very easily. It is a very serious disease. The current vaccine is not offered to people who have eczema or who have immune system problems such as HIV or who have had chemotherapy. It is a live vaccine, and so can spread from people who have been given the vaccine by their doctor to people who have not. Due to the bio-warfare and bio-terrorism threat of smallpox and the risks associated with the current vaccine, there is a need to develop a new, safer smallpox vaccine for protection against a release of the smallpox virus.The safety problems with the current vaccine mean that it is not routinely given to people living in areas where they may contract monkeypox (a closely related virus), which kills between one-in–ten and one-in-a-hundred people who contract it. A safer vaccine may allow steps to be taken to protect people from that disease as well.A new smallpox vaccine cannot be properly tested in people because the only way to catch smallpox is through an accidental or bio-warfare/bio-terrorism release (the World Health Organisation managed to eliminate wild smallpox in the 1970s). As a result, a very strong animal model must be used to test new smallpox vaccines.

Smallpox is the greatest biological threat – it spreads quickly and is difficult to diagnose and treat
Ned Stuckey-French, U.S. Public Health Service, 10/26/01. “Bioterror, Then and Now,” In These Times. http://www.inthesetimes.com/issue/25/26/feature4.shtml
It’s also deadly. Smallpox has killed more people than any other disease in history, including bubonic plague. At least 300 million people died of smallpox in the 20th century alone. Even with modern medical care, smallpox kills about a third of the unvaccinated people it strikes. There are no mild cases. Survivors are left scarred, and sometimes blind or with deformed bones. But one of the great victories of 20th century science was the eradication of smallpox. The last known case occurred in 1978. The hitch is that once the disease was wiped out, routine vaccinations stopped. Virtually no one has been vaccinated in the United States since 1972, and most of us who were vaccinated back in the ’60s could now contract the disease because immunity does not persist permanently. It’s estimated that only 10 to 15 percent of the U.S. population has residual immunity. In June 1999, experts meeting at the Centers for Disease Control and Prevention in Atlanta unanimously agreed that, followed by anthrax, smallpox was the greatest bioterrorist threat to the United States.It is some comfort that Secretary Tommy Thompson recently named Dr. D.A. Henderson to chair the Health and Human Services advisory council on bioterrorism. Henderson is the Johns Hopkins researcher who led the World Health Organization’s successful campaign to eradicate smallpox, and no one understands smallpox better than he does. For many years, he has been writing about the real and immediate dangers posed by bioterrorism. He has argued for the stockpiling of drugs and vaccines, the training and mobilization of health workers, the education of the public, and the need to build an international consensus against the use of biological weapons. “We are ill-prepared to deal with a terrorist attack that employs biological weapons,” Henderson declared in a 1998 article in the journal Emerging Infectious Diseases. “The specter of biological weapons use is an ugly one, every bit as grim and foreboding as that of a nuclear winter.”Regarding smallpox specifically, Henderson warned: “If some modest volume of virus were to be released (perhaps by exploding a light bulb containing virus in a Washington subway), the event would go unnoticed until the first cases with rash began to appear 9 or 10 days later.” Because hardly any doctors have ever seen smallpox, and so few laboratories can test for it, several more days might go by before the first diagnosis was made. If only 100 people were originally infected, Henderson wrote, tens of thousands, including many unsuspecting hospital personnel, could have been exposed by the time the epidemic was identified. Hospital isolation wards and our national stores of vaccine would at that point be sorely tested.

***AIR POLLUTION**

DC Air Pollution Washington, DC has extremely high levels of air pollution and smog
Sierra Club, 2008. “Air Pollution and Sprawl: A Major Threat to Our Health” http://www.sierraclub.org/dc/sprawl/air-quality/index.html
Thirty years after passage of the Clean Air Act, the Washington area still does not meet health standards for smog. Ground-level ozone, the primary ingredient of smog, is a severe lung irritant, and can cause shortness of breath, chest pain, wheezing, and coughing. Prolonged exposure can cause reductions in lung function, inflammation of the lung lining, and respiratory discomfort. One study in Los Angeles showed ozone pollution reduced the breathing capacity of non-smokers to the same level as pack-a-day smokers elsewhere.Air pollution poses a major health risk for everyone in our region. On every “Code Orange” or “Code Red” day—when ozone levels are high and the air is particularly unhealthy, people with asthma or other respiratory illnesses, children and the elderly are forced to stay inside. Approximately 50,000 children and 100,000 adults suffer from asthma in the Washington area. Children, who spend more time outdoors, are especially vulnerable to the harmful effects of ozone, and even healthy adults can feel exhausted and ill after exercising or spending prolonged periods outdoors. During the summer “ozone season,” the DC region is exceeded only by Los Angeles in respiratory related emergency room visits.
The federal government owns 500,000 buildings and accounts for a substantial amount of nationwide energy use and air pollution
OFEE, Office of the Federal Environmental Executive, 9/14/2003. “Marketing Yourself to an Environmentally Sensitive Owner” http://www.ofee.gov/whats/archive/AGC%209-03%20speech.pdf
First, a few basic facts. The federal government owns about 500,000 buildings covering 3.1 billion square feet – and more new buildings and renovations are on the way. And we help fund lots of other construction projects, too, as you know. Five agencies account for 95 percent of all the federal government’s square footage: Department of Defense most notably, followed by the Postal Service, the General Services Administration, the Department of Veterans Affairs, and the Department of Energy. Federal buildings account for 0.4% of the nation’s energy use, and have similar impacts regarding land use, water use, air emissions, and more.

Pollution Hurts Honeybees Air pollution in the District of Columbia is destroying honeybees’ ability to pollinate – killing both bees and flowers
Washington Post, 5/5/08. “Air Pollution Impedes Bees' Ability to Find Flowers.” http://www.washingtonpost.com/wp-dyn/content/article/2008/05/04/AR2008050401737.html?referrer=emailarticle
Their findings may help unlock part of the mystery surrounding the current pollination crisis that is affecting a wide variety of crops. Scientists are seeking to determine why honeybees and bumblebees are dying off in the United States and in other countries, and the new study indicates that emissions from power plants and automobiles may play a part in the insects' demise.Scientists already knew that scent-bearing hydrocarbon molecules released by flowers can be destroyed when they come into contact with ozone and other pollutants. Environmental sciences professor Jose D. Fuentes at the University of Virginia -- working with graduate students Quinn S. McFrederick and James C. Kathilankal -- used a mathematical model to determine how flowers' scents travel with the wind and how quickly they come into contact with pollutants that can destroy them. They described their results in the March issue of the journal Atmospheric Environment.In the prevailing conditions before the 1800s, the researchers calculated that a flower's scent could travel between 3,280 feet and 4,000 feet, Fuentes said in an interview, but today, that scent might travel 650 feet to 1,000 feet in highly polluted areas such as the District of Columbia, Los Angeles or Houston."That's where we basically have all the problems," Fuentes said, adding that ozone levels are particularly high during summer. "The impacts of pollution on pollinator activity are pronounced during the summer months."This phenomenon triggers a cycle, the authors noted, in which the pollinators have trouble finding sufficient food, and as a result their populations decline. That, in turn, translates into decreased pollination and keeps flowering plants, including many fruits and vegetables, from proliferating. Fuentes said scientists now have a more sophisticated understanding of the signals for which insects are searching, and that air pollution rapidly eliminates as much as 90 percent of flowers' aroma.
High amounts of air pollution kills bees by destroying their ability to pollinate flowers
The Washington Times, 4/14/08, [quals added] “Pollution faulted for fading scent of many flowers; Pollination may be obstructed” Lexis
"It quickly became apparent that air pollution destroys the aroma of flowers, by as much as 90 percent from the period before automobiles and heavy industry. The more air pollution in a region, the greater destruction of flower scents, " Mr. Fuentes said. Although he has sympathy for the human nose, Mr. Fuentes is far more concerned about the dampening effect of decreased flower fragrance on bees, butterflies and other pollinators. " The only way they can locate their food - the flower nectar - is to detect the flowers, " he said. The researchers charted the chemical effect of polluted air on the three organic compounds that make up most flower scents, creating a mathematical model that precisely tracked the dispersal of the scent over a given distance. They plugged in wind velocity, temperature, plant undergrowth and other data measured at a Virginia farm to reveal some distinct odor challenges. In relatively unpolluted areas, the scents retained more than 80 percent of their original concentrations 1,000 yards away. When the air was heavy with pollution, the scents were down to a quarter of their concentration just 600 feet from the flower. Mr. Fuentes [an environmental science professor at UVA] theorizes that the loss of these scent trails is contributing to the mysterious drop in the world's bee population in recent years - a loss blamed on everything from genetically engineered food crops to a virus. According to the U.S. Department of Agriculture, beekeepers in 24 states have reported that bees are simply " vanishing, " with some losing up to 90 percent of their honeybees. It is serious business. Agriculture officials appearing before the House Agriculture subcommittee last year reported the new phenomenon " colony collapse disorder, " in which bees vanished or perished - ultimately driving up honey prices. Three-quarters of the world's flowering plants require pollination from bees or butterflies to flourish, the lawmakers learned. " Humans will also be affected. That zucchini you get at the supermarket couldn't grow unless it was pollinated by a bee, " Mr. Fuentes said. " And those airborne pollutants can also potentially harm the plant which absorbs them. " He is also researching the possibility that " pheromone trails emitted by animals for defense or mate attraction " could also be compromised by air pollution, along with specific volatile compounds that flowers emit " to attract natural enemies of plant pests. "

Honeybees Biodiversity
Honeybees are responsible for the pollination of many food crops and serve as a harbinger for ecological crisis
The Guardian, 5/31/08. “Last flight of the honeybee?” http://www.guardian.co.uk/environment/2008/may/31/animalwelfare.environment
People’s initial response to the idea of a bee-less world is often either, “That’s a shame, I’ll have no honey to spread on my toast” or, “Good - one less insect that can sting me.” In fact, honeybees are vital for the pollination of around 90 crops worldwide. In addition to almonds, most fruits, vegetables, nuts and seeds are dependent on honeybees. Crops that are used as cattle and pig feed also rely on honeybee pollination, as does the cotton plant. So if all the honeybees disappeared, we would have to switch our diet to cereals and grain, and give our wardrobes a drastic makeover.According to Albert Einstein, our very existence is inextricably linked to bees - he is reputed to have said: “If the bee disappears off the surface of the globe, then man would only have four years of life left.”Bees are a barometer of what man is doing to the environment, say beekeepers; the canary in the coalmine. Just as animals behave weirdly before an earthquake or a hurricane, cowering in a corner or howling in the wind, so the silent, empty hives are a harbinger of a looming ecological crisis. But what is causing them to vanish - pesticides, parasites, pests, viruses? No one knows for sure. The more fanciful theories when CCD was first detected included an al-Qaida plot to wreck US agriculture, radiation from mobile phones and even celestial intervention in the form of honeybee rapture.
Honeybees are key to agriculture and the economy – they pollinate 60% of plant species
APIS, Apicultural Information and Issues, 3/1996. http://apis.ifas.ufl.edu/frame96.htm
"Agricultural production could be threatened if populations of bees and other pollinators continue to decline, according to the Forgotten Pollinators Campaign, a recently launched effort to educate the public about pollinators' critical economic and agricultural importance. The Campaign emphasizes North American agriculture and ecology, but advocates greater awareness and protection of pollinators worldwide. Most fruits and vegetables consumed globally grow as a result of pollination, the process by which pollen is carried from one flower to another, thereby increasing the chances for fertilization and fruit production. According to the campaign's literature, a recent survey of wild plants documented that over 60% of the plant species studied may suffer reduced seed set due to pollinator scarcity."The Campaign, initiated by the Arizona-Sonora Desert Museum (ASDM) in Tucson, Arizona, aims to create common cause among farmers, pesticide reform activists, beekeepers, plant and animal conservationists and green belt proponents, all of whom may be concerned about declining pollinators -- especially honey bees -- and the lack of policies aimed at protecting them. According to Gary Paul Nabhan, a crop ecologist and Director of Science for the Campaign, pesticide use, disease, habitat fragmentation, and the arrival of Africanized bees in North America have dramatically reduced honey bee populations in the U.S., by as much as 25% since 1990."Honey bees and the 4,000-5,000 species of wild bees native to North America pollinate 60 major crops in the U.S., including potatoes, melons, cotton, onions and almonds. According to the Forgotten Pollinators Campaign, the pollination services provided by wild and domestic bees are 40-50 times more valuable than the market price of all honey produced in the U.S. Steve Buchmann, a specialist with the U.S. Department of Agriculture (USDA) bee laboratory in Tucson, Arizona and a research associate at the Campaign, recently stated that the hidden value to crop pollination by bees could be as high as US $10 billion. Other significant pollinators include flies, butterflies, moths, beetles, hummingbirds and bats."To illustrate the impacts of declining pollinator populations on agricultural production, Nabhan points to cranberry bogs, where as many as 20 million flowers bloom on each acre, but less than a third of the flowers develop into ripened fruit in years when pollinators are scarce. In 1970 widespread organophosphate spraying (mostly fenitrothion) for spruce budworms decimated native bee populations, causing cranberry yields to plummet from 5.5 million pounds in 1969 to 1.5 million pounds in 1970. More recently, the California almond industry has begun borrowing bee hives from other states to compensate for pollinator scarcity, and the 1995 New York pumpkin crop suffered from a paucity of native bees.

Loss in bee population collapses biodiversity – key to pollinating commercial crops
New Scientist, the World's No.1 Science & Technology News Service2/14/98. “Birds do it, bees do it - Pollinators are vital for crop yields. But they are dying out,” http://www.newscientist.com/article/mg15721219.600-birds-do-it-bees-do-it--pollinators-are-vital-for-crop-yieldsbut-they-are-dying-out.html
A WORLDWIDE decline in bees, bats, butterflies, birds and other pollinators is threatening the yields of major food crops and the biodiversity of wild plants.A study published in this month's Conservation Biology (vol 12, p 240) says that the most immediate cause for concern is an epidemic of varroa mites. The mites have wiped out millions of colonies of honeybees in Europe and North America, where the bees are the prime method of pollination for more than a hundred commercial crops. A quarter of North America's wild and domesticated honeybees have disappeared over the past eight years, the report finds.According to Gary Nabhan of the Arizona Desert Museum near Tucson, the study's lead author, the disappearance of honeybees has increased production costs for many major American crops, notably California almonds. "Impacts may be felt more strongly in home gardens and on small farms that do not rent managed honeybees," he says. The paper puts the cost to American farmers of the declining honeybee population at $5.7 billion a year.The study also reports a "long-term decline" in other pollinators across the world, including 1200 wild vertebrate pollinators known to be at risk of extinction. The authors say these declines, often caused by pesticide use, explain depressed yields of blueberries in New Brunswick, cherries in Ontario, pumpkins in New York, cashew nuts in Borneo, and Brazil nuts in Bolivia and Brazil.Declining bat populations threaten the survival of many tropical fruit trees, including durians and wild bananas, as well as neem and eucalyptus. In Central America, many plants are pollinated by threatened species of hummingbirds. And the dextrous fingers of primates, such as the endangered black and white ruffed lemur of Madagascar, are uniquely fitted to open the buds of Ravenala madagascariensis, the traveller's tree. The researchers warn that, apart from honeybees, data on invertebrate pollinators are hard to come by.British ecologists agree that there are similar threats in Europe, where honeybees are also in decline because of varroa mites. According to David Sheppard of English Nature, the government's conservation agency, a quarter of Britain's 250 native bee species are now classified as rare or threatened. "These bees are responsible for most of the pollination of native wild plants, including fruit crops such as strawberries, apples and pears," he says.Wild plants around the world endangered by the lack of pollinators include the Japanese primrose, Arizona agave and Hawaiian silversword. In some case, the loss of a single pollinator species can cause the collapse of entire ecosystems. On some Pacific islands, Nabhan and his colleagues say, the loss of flying foxes could lead to cascades of linked extinctions, including mammals that depend on the fruit of trees pollinated by the bats.
A continued decrease in bee populations causes a ripple effect of species extinction – pollination is key to biodiversity
The Independent, 4/1/97. “Once upon a time in the West; Amid the rocks, canyons and cactus of Arizona, an Englishman is laying down gardens. The object? To put an end to zoos.” Lexis
"Pollination", explains Hancocks, is "one of the simplest stories of interconnectedness." The new gardens are to be a living testimony to a "Forgotten Pollinators" campaign, co-ordinated from the Desert Museum. The campaign is a call to arms and national policy in the face of what Gary Nabhan, the museum's director of science, calls an impending ecological crisis. He explains that human-induced changes in populations of pollinators, which include bees, butterflies, moths and bats, threaten a ripple effect on disparate species, ultimately leading to a "cascade of linked extinctions". The causes are overuse of chemical pesticides, unbridled development, and conversion of natural areas into cropland where a single crop is planted - that is, monocultured. Already, he says, "the once-abundant honey bee is suffering dramatic population declines throughout North America". The ramifications for farming are potentially grave: crops such as tomatoes and alfalfa, a basic livestock feed, depend on pollination.

Honeybees are key to human survival – without bees, food crops will disappear
John Clayton, expert beekeeper, 2002 "Castes: The many faces of the colony and communication of a social creature" www.beemaster.com/honeybee/caste.htm
Without the Honeybee, we too would die off eventually from critically low food resources of all kinds. Without crop pollination, the animals we eat, the fruit and vegetables we consume and the trees we get our air from would all disappear. Honeybee extinction could very well seal our own fate. It wouldn't take many generations for us to disappear either. Easily it could happen in our life time if honeybees are lost to their many parasites, diseases and element conditions. There is a REAL THREAT to the preservation of this important creature and mans intervention is crucial to their survival. Maybe someday, honeybees will have the success that they have had for millions of years.

Pollution Hurts Chesapeake Bay Air pollution is the greatest threat to Chesapeake survival Bob Maddox staff writer for the Baltimore Chronicle, February 28th 2001 “What Goes Up... Goes Into the Bay” http://baltimorechronicle.com/bay_mar01.html [A.Evans]
These practices, however, are not the only causes of the problem. Another major stressor to the health of the Bay is the air pollution that can originate nearby, and as far away as Indiana, Canada, and Georgia. In fact, the airshed of the Bay is six and a half times the size of its 64,000 square-mile watershed. “People have to realize that air is part of the whole ecosystem,” says Fran Flanigan, executive director for Alliance of the Chesapeake Bay. “Air quality is a big actor in the health of the Bay.” Nitrogen Pollution Years ago, water and air pollution were considered two separate problems. Only recently has research shown the close link between these environmental threats. For example, nitrogen oxides (NOx) are emitted when fossil fuels (coal, oil, gasoline, and natural gas) are burned. Emissions of NOx are created by automobiles, electric utility plants, factories, boats, lawn-cutting equipment, and construction equipment. The NOx eventually settle back to the surface and enter the water directly or are washed from soil and impervious surfaces during rain to a water source. Scientists estimate that about one-quarter of the nitrogen entering the Bay is from the air. These nitrogen compounds reach the surface through either dry deposition or wet deposition. Dry deposition is atmospheric deposition that occurs when particles settle to the earth’s surface and attach to a surface or are absorbed. Wet deposition is atmospheric deposition that occurs when rain or snow carries gases or particles to the earth’s surface. Excess nitrogen in the Bay’s water causes dense algal blooms which block out the sunlight needed by the submerged aquatic vegetation. It is the submerged vegetation, or bay grasses, that provides protection and habitat for fish and crabs. Also, when the algae dies and decomposes, it depletes the oxygen in the water needed by plants and animals. Other Pollutants Nitrogen deposition is not the only impact on the Bay from air pollution. Fossil fuels are also a source of polycyclic aromatic hydrocarbons (PAHs). These harmful chemicals, or toxics, can enter water through fuel spills, urban runoff, and atmospheric deposition. PAHs cover a variety of chemicals. Several of these are known carcinogens and are potentially harmful to aquatic life.

Chesapeake Bay Enviro Combating air pollution’s affect in the Chesapeake Bay is crucial to the global fight against environmental destruction and SAVING THE PLANET William Baker, [President Chesapeake Bay Foundation, noted thinker, author of “Turning the Tide” pg xiv-xvi; http://books.google.com/books?hl=en&id=3UvxWSfFF2AC&dq=Turning+the+Tide+%2B+chesapeake+bay&printsec=frontcover&source=web&ots=8gFH_0XESg&sig=mLUr7CItzokpEmr6yDcFbvzjqdc&sa=X&oi=book_result&resnum=1&ct=result#PPA31,M1] 2003,
But the Bay is not “dead,” at least not yet. For amid the toxic waste, filled wetlands, and oxygen-starved waters, there lies a body of water fighting for survival. And live it will, if we give it half a chance. Two decades of intense private and public efforts to save the bay have averted immediate disaster. In 1993, I wrote in this foreward that “there are signs that we may have seen the worst.” Sadly, the last decade has seen no improvement and many scientists believe that the bay may actually get worse over the next few decades unless we have the guts to make fundamental changes. Simply “treating” our wastes before discharging them in into the air and water, for example, will not be enough. We must alter the processes – both individually and collectively – in order to reduce the amount of pollution we create in the first place. Turning the Tide presents detailed recommendations on how to achieve such reductions, to stop the loss of valuable habitat, to improve fisheries management – in short, how to save the bay. These strategies to help save the Chesapeake Bay can serve other coastal bodies of water as well. They can be employed everywhere, from San Francisco Bay to Tampa Bay. Turning the Tide will be valuable to anyone who wants a better understanding of how nature words and how modern society works against her. In fact, the Chesapeake Bay is a superb model of the planet as a whole. Not only does the bay encompass a large and diverse geographic region that includes every possible environmental abuse, it is also a largely enclosed system in which most pollutants accumulate. The Chesapeake Bay is a microcosm of the planet, and our efforts to save it constitute a living experiment for the management and protection of the earth as a whole. Valuable scientific and political experience can be gained as we grapple with some of the more subtle forms of pollution – those that flow not from an easily identifiable source, such as an industrial discharge pipe, but rather from all the little things that each of us does on a day-to-day basis: the pollutants in car exhaust, the sediment released from a construction site, the manure that runs off a farm, the freshwater wetlands filled to build a new house, the trees cut down for road construction. Multiply these routine impacts by the 16 million people who live here (to say nothing of projected growth), and the tremendous stress on the system becomes apparent. Turning the Tide reminds us that progress on the environmental front must not be measured by the number of new programs in place or the amount of funding appropriated. We must look to the very resources we are trying to protect, such as wetlands, oysters, crabs, and water quality, and measure improvement or decline in them over time. Again, from my 1991 foreward, I wrote, “As we go to press our optimism is tempered by an all-too-predictable reaction to a faltering economy. Even though there has been general agreement that a healthy environment and a robust economy are simply two sides of the same coin – one cannot exist without the other – lines are now being drawn in the sand as adversarial feelings reemerge to replace cooperation and coalition-building. The rhetoric is heating up as environmental programs are being fought, clean water regulations are targeted by industry lawsuits, and funds dedicated for conservation projects are diverted to balance the government’s books.” Twelve years later, and as Yogi Berra once said, “It feels like déjà vu all over again.” In spite of the fact that as little as once cent of every tax dollar is spent on the environment, environmental programs are still being cut to “reduce the burden” on the taxpayer. What lunacy! Perhaps nowhere is the irony greater than in our approach to energy and transportation policies. This nation’s insatiable appetite for foreign oil (and lots of it!) only exacerbates the problems of terrorism and global instability. In spite of September 11th, an impending war with Iraq, and the clear linkage of fossil fuel combustion with air and water pollution, America has failed to take even the most basic steps toward energy conservation. Consider that in the twelve years since 1991, average gas mileage standards for automobiles and SUVs have gotten worse, not better, and individuals are driving more miles every year. To add insult to injury, automakers are still allowed to produce SUVs that emit far more pollution than cars of a similar horsepower under a loophole in the federal law that considers the SUV a “truck,” not a “car.” Legislation considered by the U.S. Senate in 2001 would have closed this loophole and raised minimum mileage standards. It was overwhelmingly defeated, including negative votes by every bay area senator except Maryland’s Paul Sarbanes. Environmentalists, however, will not give up now any more than we have in the past when ideologues masqueraded as fiscal conservative while trying to gut environmental protection and restoration policies. At the Chesapeake Bay Foundation, our membership is not only growing, but each member is giving more annually, demonstrating a resolve to save the bay that has never been greater. Our volunteer board of trustees and our full-time staff are dedicated to doing everything within their power to reduce pollution, restore habitat, and better manage the bay’s fisheries. History may yet record that a well-meaning buy ultimately timid society lost the Chesapeake Bay in the early years of the twenty-first century, but we don’t think so. Rather, we believe that wiser leaders will prevail, leaders who realize that saving the bay, a national treasure, is one of the best ways to demonstrate that humans can, in fact, learn to marry environmental and econmic prosperity for the good of all. To paraphrase the great Everglades conservationist Marjorie Stoneman Douglass, “Saving the Chesapeake Bay is a test. If we pass, we get to keep the planet.”

Fed Buildings Solve Chesapeake “Greening” of buildings helps save the Chesapeake watershed CBF [(Chesapeake bay foundation) “Merrill Center proves "green" buildings work to Save the Bay”; C.D. Dollar February 23, http://www.cbf.org/site/News2?page=NewsArticle&id=10141] 2005
I've always been fascinated with how things work — from the complex engineering it takes to build bridges to the subtle connectedness between plants and animals within the Chesapeake ecosystem. Obviously, I lean hard toward the workings of the natural world, and although I sit tethered to a computer pounding on a keyboard to earn most of my living, I am fortunate that I can walk around the grounds of the Chesapeake Bay Foundation's Philip Merrill Environmental Center, which has much of the Bay in microcosm. Along the tidal shorelines I've spied immature bald eagles perch aloft, eyeing up canvasbacks as they feed inside Tolley's Point. Among the stand of hardwoods, pileated woodpeckers dart through the branches. A heron stalks the marsh shallows with its dagger-like bill at the ready. I also have to remind myself that, if I must be inside, I'm fortunate to work at a place that has great open space, is made of natural materials, and, as much as possible, is highly Bay-friendly. Since I've had an office within the building since it opened in December 2000, I felt a bit odd tagging along with a small group of visitors from Wisconsin, Missouri, and Louisiana who were touring the Center recently. Yet, as CBF volunteer guide Ed Wintermute expertly explained the highly innovative features of the “green building,” I was soon reminded that the Merrill Center is far more complex than meets the eye. That fact wasn't lost on Jesse Mchling, however, who asked, “Why aren't all buildings built like this?” Another visitor, Victoria Bryant of St. Louis (MO), remarked, “If I build, I will build green.” Years prior to CBF opening the doors, tremendous thought and planning went into making the headquarters a global model of energy conservation, pollution reduction, and sustainable building techniques. In its nearly four years of operation, that attention to detail and sustainable building has paid off many times over. The 32,000-square foot office building — named for CBF donor and former trustee Philip Merrill — and its numerous sophisticated systems have kept thousands of pounds of polluting nitrogen from entering the Bay while saving huge amounts of energy and water. Overall, Merrill Center pollutes less than a typical office building of comparable size. One feature that elicits chuckles from visitors is the flushless, composting toilets, which are serious pollution reducers. Each day, these “green johns” prevent the equivalent of the waste generated by 100 people from entering the local sewage treatment plant and eventually area waters. In terms of energy conservation, Merrill Center uses 40% less energy than a typical office building while preventing roughly 2,500 pounds of polluting nitrogen and 1.6 million pounds of carbon dioxide from entering the Bay and the environment each year. CBF also saves nearly $22,000 per year in energy costs. To reduce electricity needs, the building faces south to get the maximum exposure for sun and the proper angle to take advantage of prevailing winds for natural lighting and ventilation. As a result, the Merrill Center's heating and cooling systems do not run 33% of the year. The Merrill Center is constructed of the most environmentally responsible building materials available, a “cradle-to-cradle philosophy,” meaning that construction materials are recycled, recyclable, and/or created through sustainable means that don't harm the environment. Building materials that do not contain VOCs (Volatile Organic Compounds), such as natural linoleum, paints, and adhesives, were used during construction. Indoor air quality is monitored by carbon monoxide and VOC sensors, and natural ventilation pumps fresh into the building. The stout posts, beams, and trusses are Parallam — strand lumber made from second-growth trees using the entire tree. This means no part of the tree is wasted. The galvanized steel siding and roofing, called Galvalume, is recycled. For flooring, cork and bamboo were used; cork can be stripped from a living tree without harm and bamboo can be harvested every three to five years and replenishes itself naturally. The building and the 31-acre parcel of land upon which it sits serve as an environmental education and exceeds the requirements of Maryland's Smart Growth criteria and Critical Areas Act. The facility is a training center for students, citizen volunteers, environmental groups, and decision makers. The grounds have been restored using native plants and trees, another way to prevent polluted runoff from entering nearby Black Walnut Creek and the Bay. Equally important is that scores of business organizations, architects, and government agencies have toured the building. Many of these governmental groups and businesses have become inspired to renovate and construct environmentally beneficial buildings, which will help save the Bay while saving money. It functions beautifully as the nerve center for CBF's programs and staff, and no one wants for comfort or efficiency. Yet more importantly, it is a global environmental model that operates in harmony with the land, natural resources, and the Chesapeake Bay. Simply, the Merrill Center proves ‘green' buildings work to help save the Chesapeake Bay watershed.

AIR POLLUTION KILLS 2 MILLION Air pollution kills over two million people every year and causes respiratory infections, heart disease, and lung cancer.ENS, Environmental News Service, http://www.ens-newswire.com/ens/oct2006/2006-10-06-01.asp, October 6, 2006.
World Health Experts Warn Air Pollution Kills Two Million a Year NEW YORK, New York, October 6, 2006 (ENS) - Air pollution in cities across the world is causing some two million premature deaths every year, the World Health Organization (WHO) said Thursday, urging nations to adopt stricter air pollution standards. The international health agency's new air quality guidelines call for nations to reduce the impact of air pollution by substantially cutting levels of particulate matter, ozone and sulfur dioxide. "By reducing air pollution levels, we can help countries to reduce the global burden of disease from respiratory infections, heart disease, and lung cancer which they otherwise would be facing," said Maria Neira, WHO director of public health and the environment. "Moreover, action to reduce the direct impact of air pollution will also cut emissions of gases which contribute to climate change and provide other health benefits." WHO cautioned that for some cities meeting the targets would require cutting current pollution levels more than three fold. The organization noted that many countries don't have any air pollution standards. Existing standards vary greatly, WHO said, and most fail to ensure sufficient protection of human health. Particulate matter is the major concern, WHO said, and cutting this type of air pollution can produce the greatest health benefits. Produced mainly by the burning of fossil fuels, particulate matter has been increasingly linked to respiratory illness and heart disease. Air pollution is a major concern for cities worldwide - none moreso than China's Beijing. (Photo by Edwin Ewing, Jr. courtesy CDC) Most cities currently have levels of coarse particulate matter - known as PM10 - in excess of 70 micrograms per cubic meter. The guidelines recommend cutting levels of PM10 to 20 micrograms, a reduction WHO says can reduce deaths from air pollution by 15 percent a year. WHO recommends cutting the daily limit for ozone, a key ingredient in smog, from 120 to 100 micrograms per cubic meter. The organization notes that this will pose a challenge for many cities, especially in developing countries, and particularly those with numerous sunny days when ozone concentrations are highest, causing respiratory problems and asthma attacks. The guidelines call for reducing levels of sulfur dioxide from 125 to 20 micrograms per cubic meter and note that cutting this pollutant will result in lower childhood death and disease rates. WHO first created air quality guidelines in 1987, but they were originally developed just to address pollution in Europe. The guidelines were originally created to address only Europe but were expanded to focus on all regions and provide standardized targets for air quality. WHO said the increasing evidence of the health impacts of air pollution prompted the organization to were expanded its guidelines to address all regions of the world and provide uniform targets for air quality The new guidelines ere established after consultation with more than 80 leading scientists and are based on review of thousands of recent studies from all regions of the world. Dr. Roberto Bertollini, European director of WHO's special program from health and environment, said the guidelines reflect the "most widely agreed and up-to-date assessment of health effects of air pollution, recommending targets for air quality at which the health risks are significantly reduced." "We look forward to working with all countries to ensure these guidelines become part of national law," Bertollini added.

AIR POLLUTION IN CALIFORNIA KILLS 24,000 Air pollution in California is responsible for 24,000 deaths every year and causes cancer, heart attack and respiratory diseases.Catherine Elsworth “California's dirty air 'kills 24,000 a year'” Last Updated: 11:45PM BST 22/05/2008 http://www.telegraph.co.uk/news/worldnews/northamerica/usa/2010595/USA-California%27s-dirty-air-%27kills-24%2C000-a-year%27.html
Air pollution in California is responsible for as many as 24,000 deaths a year, nearly triple the previous estimate, according to a study. Tiny particles from soot, smoke, metal and dust are to blame and inhaling even small amounts can be harmful. Breathing in the minute specks produced by diesel engines, agriculture and construction has been linked to health problems including lung cancer, heart attacks, strokes as well as asthma and other respiratory diseases. California is home to five of the eight most polluted metropolitan areas in America, including Los Angeles, Bakersfield and Fresno, according to the American Lung Association's new 2008 State of the Air report. The previous estimated number of deaths linked to particulate pollution was 8,200.

AIR POLLUTION KILLS BABIES Air pollution kills babies.Bobak M, Leon DA. Department of Epidemiology and Public Health, University College London, UK. http://www.ncbi.nlm.nih.gov/pubmed/10535778?ordinalpos=1&itool=EntrezSystem2.PEntrez.Pubmed.Pubmed_ResultsPanel.Pubmed_DiscoveryPanel.Pubmed_RVAbstractPlus Epidemiology. 1999 Nov;10(6):661-2.
To examine the association between individual lifetime measures of mean exposure to air pollution and postneonatal respiratory deaths, we have conducted a matched population-based case-control study covering all births registered in the Czech Republic from 1989 to 1991 that were linked to death records. For each case of infant death, we have randomly selected 20 controls from infants of the same sex born on the same day and alive when the case died. Exposure was assigned as the arithmetic mean of all 24-hour air pollution measurements in the district of residence of each case and control for the period between the birth and death of the index case. We used conditional logistic regression to estimate the effects of suspended particles, sulfur dioxide, and nitrogen oxides on risk of death in the neonatal and postneonatal period, controlling for maternal socioeconomic status and birth weight, birth length, and gestational age. There were 2,494 infant deaths with exposure data on at least one pollutant, 133 of them from respiratory causes. The effects of all pollutants were strongest in the postneonatal period and were specific for respiratory causes. For these, rate ratios for a 50 microg/m3 increase in particles, sulfur dioxide, and nitrogen oxides were 1.95 [95% confidence interval (CI) = 1.09-3.50], 1.74 (95% CI = 1.01-2.98), and 1.66 (95% CI = 0.98-2.81), respectively, after controlling for all covariates. Only particles showed a consistent association when all pollutants were entered in one model. We found no evidence of a relation between any pollutant and mortality from other causes. These results indicate that the effects of air pollution on infant mortality are specific for respiratory causes in the postneonatal period, are independent of socioeconomic factors, and are not mediated by birth weight or gestational age.

AIR POLLUTION CAUSES HEART ATTACKS AND STROKES Air pollution causes heart attacks and strokes.American Heart Association - Last Updated 2008 - http://www.americanheart.org/presenter.jhtml?identifier=4419
Air Pollution, Heart Disease and Stroke Exposure to air pollution contributes to the development of cardiovascular diseases (heart disease and stroke). A person’s relative risk due to air pollution is small compared with the impact of established cardiovascular risk factors such as smoking, obesity, or high blood pressure. However, this is a serious public health problem because an enormous number of people are exposed over an entire lifetime. Background Until May of 2004, the American Heart Association had not issued any expert reviewed statement about the short-term and long-term effects of chronic exposure to different pollutants. This was due to flaws in research design and methodology of many pollution studies. During the last decade, however, epidemiological studies conducted worldwide have shown a consistent, increased risk for cardiovascular events, including heart and stroke deaths, in relation to short- and long-term exposure to present-day concentrations of pollution, especially particulate matter. Elderly patients, people with underlying heart or lung disease, lower socioeconomic populations and diabetics may be at particularly increased risk. More research is needed to find out the differential toxicity of various constituents of air pollution. Components of Air Pollution Air pollution is composed of many environmental factors. They include carbon monoxide, nitrates, sulfur dioxide, ozone, lead, secondhand tobacco smoke and particulate matter. Particulate matter, also known as particle pollution, is composed of solid and liquid particles within the air. It can be generated from vehicle emissions, tire fragmentation and road dust, power generation and industrial combustion, smelting and other metal processing, construction and demolition activities, residential wood burning, windblown soil, pollens, molds, forest fires, volcanic emissions and sea spray. These particles vary considerably in size, composition and origin. Particulate Matter and Sulfur Dioxide The concentrations of both particulate matter and sulfur dioxide often change in parallel. The oxidation of sulfur dioxide in the atmosphere is linked with the formation of various particulate compounds, including acid sulfates. A 1994 report on the adverse effects of particulate air pollution, published in the Annual Reviews of Public Health, noted a 1 percent increase in total mortality for each 10 mg/m3 increase in particulate matter. Respiratory mortality increased 3.4 percent and cardiovascular mortality increased 1.4 percent. More recent research suggests that one possible link between acute exposure to particulate matter and sudden death may be related to sudden increases in heart rate or changes in heart rate variability. The Environmental Protection Agency (EPA) has declared that "tens of thousands of people die each year from breathing tiny particles in the environment." A recent report released by the nonprofit Health Effects Institute in Cambridge, Mass., agrees with the EPA assessment. This study was reviewed by Science magazine and clearly shows that death rates in the 90 largest U.S. cities rise by 0.5 percent with only a tiny increase – 10 micrograms (mcg) per cubic meter -- in particles less than 10 micrometers in diameter. This finding is similar to those of other studies throughout the world. The case is stronger with this study, because it eliminated several factors that could confound the interpretation of the data, such as temperature and other pollutants. The number of deaths due to cardiac and respiratory problems may be small when looking at individual cities with small particles in the environment. The combined long-term effect of studies in several large cities predicts 60,000 deaths each year caused by particulate matter. This is a staggering loss of life that can be eliminated by stricter emissions standards as proposed by the EPA

HEART DISEASE IS LEADING CAUSE OF DEATH IN WORLD Heart diseases cause 12% of all of the worlds deaths and more people die of heart attacks than anything else in the world. One person in this room (assuming there’s 5) will die from a heart disease.Eric Hartwell, Ezine Articles Expert, Heart Attack Statistics http://ezinearticles.com/?Heart-Attack-Statistics&id=461293 February 2007 Heart attacks are a common form of ischemic heart disease. The World Health Organization estimated in the year 2002 that over twelve percent of all worldwide deaths arose as a result of ischemic heart disease. In developed countries, it is the leading cause of death. In developing countries, however it comes third behind AIDS and lower respiratory infections. Heart attacks, known by their medical name of acute myocardial infarction, is a state of disease that involves the interruption of the bloody supply to part of the heart. The result is a shortage of oxygen that can damage the heart tissue and potentially kill. Heart attacks are the leading cause of death all over the world. Major heart attack risk factors include a history of angina or vascular disease, a previous stroke or heart attack, old age, excessive alcohol, the abuse of illegal drugs, smoking, episodes of abnormal heart beat, obesity, high levels of stress, high or low cholesterol, high triglyceride levels, high blood pressure, and diabetes. Heart disease forms the leading cause of death in the United States – it is even more common than cancer. An estimated one fifth of all deaths in America come as a result of coronary heart disease. Over thirteen million individuals across the nation suffer from coronary heart disease. Every year, over a million people suffer from coronary heart attacks; four out of every ten individuals die from their attacks. Symptoms of heart attacks include anxiety, a feeling of impending doom, chest pain, sweating, shortness of breath, palpitations, nausea, and vomiting. Oftentimes, heart attack patients will feel sick very suddenly. The symptoms for heart attacks in men are often different from the symptoms in women. Women most often experience fatigue, shortness of breath, and a feeling of weakness. About one third of all heart attacks are silent and do not consist of any chest pain or associated symptoms.
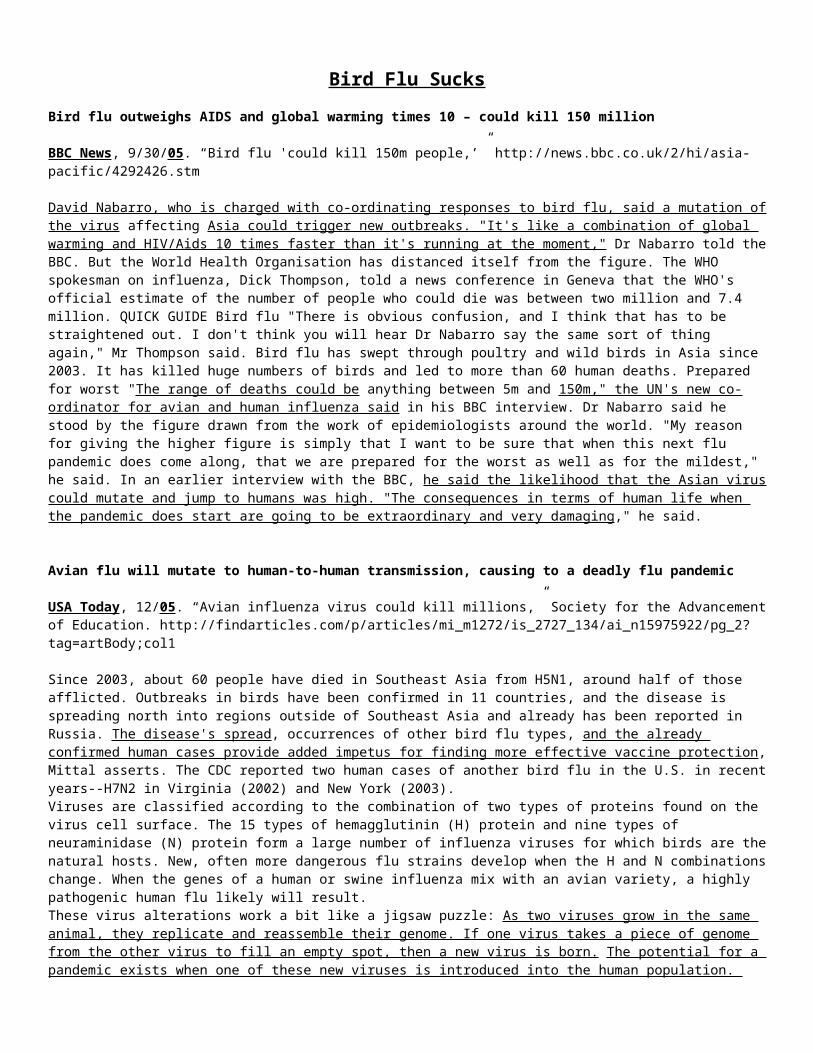
YOU WILL DIE BECAUSE OF AIR POLLUTION Even if you somehow escape the bird flu apocalypse from the CDC advantage, you will die eight months earlier because of air pollution.Lester Haines, Published Friday 7th April 2006 09:52 GMT, http://www.theregister.co.uk/2006/04/07/air_pollution_review/
Here's some bad news for those of you hoping to escape the forthcoming bird flu apocalypse which will, according to the usual cheerful prophets of doom, kill 98.7 per cent of the UK population by August: you're going to die eight months early anyway because of the UK's air pollution. That's the gloomy conclusion of a Defra press release issued this week heralding a review of the Air Quality Strategy for England, Scotland, Wales and Northern Ireland. Although Defra says the UK's air quality has improved over the last fifteen years - claiming that "from 1990 to 2001 the improvements have helped avoid 4,200 premature deaths per annum and 3,500 hospital admissions", and that it's meeting current objectives for "pollutants like carbon monoxide, 1,3-butadiene, benzene and lead" - there's still much to be done.Local Environment minister Ben Bradshaw said: "Although our air is cleaner in overall terms than at any time since the industrial revolution, air pollution is not declining as quickly as expected. We need to move faster and take further measures to move us closer to meeting our objectives. "Pollutants from our cars, ships and industrial plants are still having a marked affect on our health, reducing the average life expectancy in the UK by eight months. "This can't continue. The measures outlined in this review would – if implemented – be a significant step forward in improving public health and our environment." The plan? Well, the government wants "tighter European vehicle emissions standards", more incentives for less polluting vehicles, and less crap pumped out of small combustion plants and ships. If it succeeds, by 2020 the result will be a three-month reduction in the bit of your life you've already lost to air pollution. That's to say, you'll only die five months earlier than you would have done if you'd been living in the Himalayas. Defra is now conducting a consultation on the review of its Air Quality Strategy.

AIR POLLUTION CAUSES RESPIRATORY DISEASES Air pollution causes respiratory diseases.World Resource Institute - http://www.wri.org/publication/content/8254 1997
Citywide problems: Ambient air pollution In those cities with high air pollution levels and a combination of geography and weather that prevents pollutants from dispersing, ambient air pollution can pose a significant health risk to rich and poor alike. That risk is compounded in cities where air pollution regulations or enforcement is weak. Worldwide, an estimated 1.1 billion urban residents are exposed to particulate or sulfur dioxide levels in excess of the guidelines set by the World Health Organization (WHO)[1]. Although air pollution traditionally has been linked to industrial emissions, motor vehicles have now become a major source of pollution in many cities. The problem is particularly pronounced in cities with large numbers of poorly maintained vehicles and widespread use of leaded gasoline, which is still common in Latin America, Asia, and Eastern Europe. Studies confirm the ill effects of outdoor air pollution on health. Pollution at the levels typically found in the air of large cities has been implicated in both acute and chronic illnesses, such as asthma and chronic bronchitis. Those most vulnerable are children, the elderly, cigarette smokers, and those who already have respiratory difficulties. Most research has concentrated on particulate matter, sulfur dioxide, and nitrogen oxides. The most dangerous pollutants appear to be small particles under 10 microns in diameter, which can be easily breathed into the lungs[2][3]. These arise mostly from motor vehicle exhaust, coal-fired power plants and boilers, and certain manufacturing industries. Recent studies give strong evidence of the relationship between particulate air pollution and premature death[4][5]. One U.S. study that followed some 550,000 people in 151 cities over 7 years found that residents of the most polluted cities have a 15 to 17 percent higher risk of premature death from all causes than residents of the least polluted cities[6][7]. Since the late 1970s, epidemiological data from cities in the United States have consistently suggested that air pollution kills --primarily through respiratory or cardiovascular disease -- about 30,000 to 60,000 people per year, accou nting directly for 2 to 3 percent of all deaths[8][9]. Such results have been replicated in urban areas in other countries as well. Studies in the Czech Republic and in Poland, parts of which suffer from very high pollutant levels, suggest that, as in the United States, 2 to 3 percent of all deaths there could be attributed to air pollution[10][11]. A similar study in Jakarta, Indonesia, where concentrations of particulates are also very high, estimates that reducing airborne particulates to the level recommended by WHO could prevent 1,400 deaths, about 2 percent of annual deaths in the city[12][13]. Although these data suggest that air-pollution-related deaths are only a modest contributor to urban mortality rates, the role of air pollution in causing ill health among urbanites is much wider. For example, in Jakarta, researchers estimated that compliance with WHO guidelines could prevent some 600,000 asthma attacks and 125,000 cases of bronchitis in children each year[14].
Respiratory diseases kill 4 million every year and affect hundreds of millions as well as destroying societies.World Health Organization, http://www.who.int/gard/publications/GARD_Manual/en/index.html, 2006
Chronic respiratory diseases, such as asthma and chronic obstructive pulmonary disease, kill more than four million people every year and affect hundreds of millions more. These diseases erode the health and well-being of the patients and have a negative impact on families and societies. Women and children are particularly vulnerable.

AIR POLLUTION RESULTS IN ACID RAIN Air pollution results in acid rain – status quo electric power plants account for nearly 3/4ths of the damage.Clean Air Trust , http://www.cleanairtrust.org/acidrain.html, 1999
Acid rain (or acid deposition, as it's called in technical circles) is produced by the burning of fossil fuels. It is formed when emissions of sulfur dioxide and nitrogen oxides react in the atmosphere with water, oxygen and oxidants to form various acidic compounds. These compounds then fall to the ground in either wet or dry form. Acid rain acidifies lakes and streams and contributes to damage of trees at high elevations. (Check out Mount Mitchell in North Carolina if you want a graphic example of tree damage.) Hundreds of lakes in the Adirondacks have become too acidic to support sensitive fish species. In addition, acid rain accelerates the decay of paints and buildings. Electric power plants account for about 70 percent of sulfur dioxide emissions about 30 percent of nitrogen oxides emissions. Cars, trucks and buses also are major sources of nitrogen oxides.
Acid rain is a form of air pollution that causes massive environmental damage. It is primarily created by the burning if coal in the creation of electricity and causes premature deaths.MSN Encarta Online Encyclopedia Acid Rain," Microsoft® Encarta® Online Encyclopedia 2008 http://encarta.msn.com © 1997-2008 Microsoft Corporation. All Rights Reserved.
Acid Rain - a form of air pollution in which airborne acids produced by electric utility plants and other sources fall to Earth in distant regions. The corrosive nature of acid rain causes widespread damage to the environment. The problem begins with the production of sulfur dioxide and nitrogen oxides from the burning of fossil fuels , such as coal, natural gas, and oil, and from certain kinds of manufacturing. Sulfur dioxide and nitrogen oxides react with water and other chemicals in the air to form sulfuric acid, nitric acid, and other pollutants. These acid pollutants reach high into the atmosphere, travel with the wind for hundreds of miles, and eventually return to the ground by way of rain, snow, or fog, and as invisible “dry” forms. Damage from acid rain has been widespread in eastern North America and throughout Europe, and in Japan, China, and Southeast Asia. Acid rain leaches nutrients from soils, slows the growth of trees, and makes lakes uninhabitable for fish and other wildlife. In cities, acid pollutants corrode almost everything they touch, accelerating natural wear and tear on structures such as buildings and statues. Acids combine with other chemicals to form urban smog , which attacks the lungs, causing illness and premature deaths. The process that leads to acid rain begins with the burning of fossil fuels. Burning, or combustion, is a chemical reaction in which oxygen from the air combines with carbon, nitrogen, sulfur, and other elements in the substance being burned. The new compounds formed are gases called oxides. When sulfur and nitrogen are present in the fuel, their reaction with oxygen yields sulfur dioxide and various nitrogen oxide compounds. In the United States, 70 percent of sulfur dioxide pollution comes from power plants, especially those that burn coal. In Canada, industrial activities, including oil refining and metal smelting, account for 61 percent of sulfur dioxide pollution. Nitrogen oxides enter the atmosphere from many sources, with motor vehicles emitting the largest share—43 percent in the United States and 60 percent in Canada. Once in the atmosphere, sulfur dioxide and nitrogen oxides undergo complex reactions with water vapor and other chemicals to yield sulfuric acid, nitric acid, and other pollutants called nitrates and sulfates. The acid compounds are carried by air currents and the wind, sometimes over long distances. When clouds or fog form in acid-laden air, they too are acidic, and so is the rain or snow that falls from them.

EVEN SHORT TERM EXPOSURE LEADS TO PREMATURE DEATH Short-term exposure to status quo levels of ozone causes early death.The National Academies 2008, April 23. Link Between Ozone Air Pollution And Premature Death Confirmed. ScienceDaily. Retrieved July
ScienceDaily (Apr. 23, 2008) — Short-term exposure to current levels of ozone in many areas is likely to contribute to premature deaths, says a new National Research Council report, which adds that the evidence is strong enough that the U.S. Environmental Protection Agency should include ozone-related mortality in health-benefit analyses related to future ozone standards. The committee that wrote the report was not asked to consider how evidence has been used by EPA to set ozone standards, including the new public health standard set by the agency in March. Ozone, a key component of smog, can cause respiratory problems and other health effects. In addition, evidence of a relationship between short-term -- less than 24 hours -- exposure to ozone and mortality has been mounting, but interpretations of the evidence have differed, prompting EPA to request the Research Council report. In particular, the agency asked the committee to analyze the ozone-mortality link and assess methods for assigning a monetary value to lives saved for the health-benefits assessments. Based on a review of recent research, the committee found that deaths related to ozone exposure are more likely among individuals with pre-existing diseases and other factors that could increase their susceptibility. However, premature deaths are not limited to people who are already within a few days of dying. In addition, the committee examined research based on large population groups to find how changes in ozone air concentration could affect mortality, specifically to determine the existence of a threshold -- a concentration of ozone below which exposure poses no risk of death. The committee concluded that if a threshold exists, it is probably at a concentration below the current public health standard. As people have individual susceptibilities to ozone exposure, not everyone may experience an altered risk of death if ozone air concentration also changes. Further research should explore how personal thresholds may vary and the extent to which they depend on a person's frailty, the committee said.The research on short-term exposure does not account for all ozone-related mortality, and the estimated risk of death may be greater than if based solely on these studies, the committee noted. To better understand all the possible connections between ozone and mortality, future research should address whether exposure for more than 24 hours and long-term exposure -- weeks to years -- are associated with mortality, including how ozone exposure could impact life expectancy. For example, deaths related to short-term exposure may not occur until several days afterward or may be associated with multiple short-term exposures.
Even if we only solve some air pollution, we still lower nation-wide death rates.Nicholas Bakalar Published: March 21, 2006 New York Times Staff Writer, ‘Cleaner Air Brings Drop in Death Rate’
When air pollution in a city declines, the city benefits with a directly proportional drop in death rates, a new study has found. For each decrease of 1 microgram of soot per cubic meter of air, death rates from cardiovascular disease, respiratory illness and lung cancer decrease by 3 percent — extending the lives of 75,000 people a year in the United States. The association held even after controlling for smoking and body mass index. The work, described in a paper in the March 15 issue of The American Journal of Respiratory and Critical Care Medicine, was carried out in six metropolitan areas: Watertown, Mass.; Kingston and Harriman, Tenn.; St. Louis; Steubenville, Ohio; Portage, Wyocena and Pardeeville, Wis.; and Topeka, Kan. The participants, ages 25 to 74 at enrollment, were followed from 1974 through 1998. The scientists periodically measured concentrations of soot, or particulate air pollution, in each city. At the same time, they tracked disease and mortality among 8,096 residents. Particulate air pollution consists of a mixture of liquid and solid particles, mostly a result of fossil fuel combustion and high-temperature industrial processes. By definition, the particles have a diameter less than 2.5 microns, or about one ten-thousandth of an inch. "For the most part, pollution levels are lower in this country than they were in the 70's and 80's," said Francine Laden, the study's lead author, "and the message here is that if you continue to decrease them, you will save more lives." Further declines in air pollution are within reach, said Dr. Laden, an assistant professor of environmental epidemiology at Harvard. "The technology is out there," she said. "The cities that we've covered have cleaned up considerably over the course of the study." In Steubenville, for example, soot declined to 22 micrograms per cubic meter from 27 over the course of the study, and the city had a corresponding 25 percent decrease in mortality risk. "Consistently," Dr. Laden said, "in the cities where there was the most cleanup, there was also the greatest decrease in risk of death." Dr. Laden said the study supported what the federal scientific advisers had advocated: lowering the air quality standard below the present 15 micrograms per cubic meter. "There was discussion about lowering it to 12," she said, "and this study supports that."

***NEG***
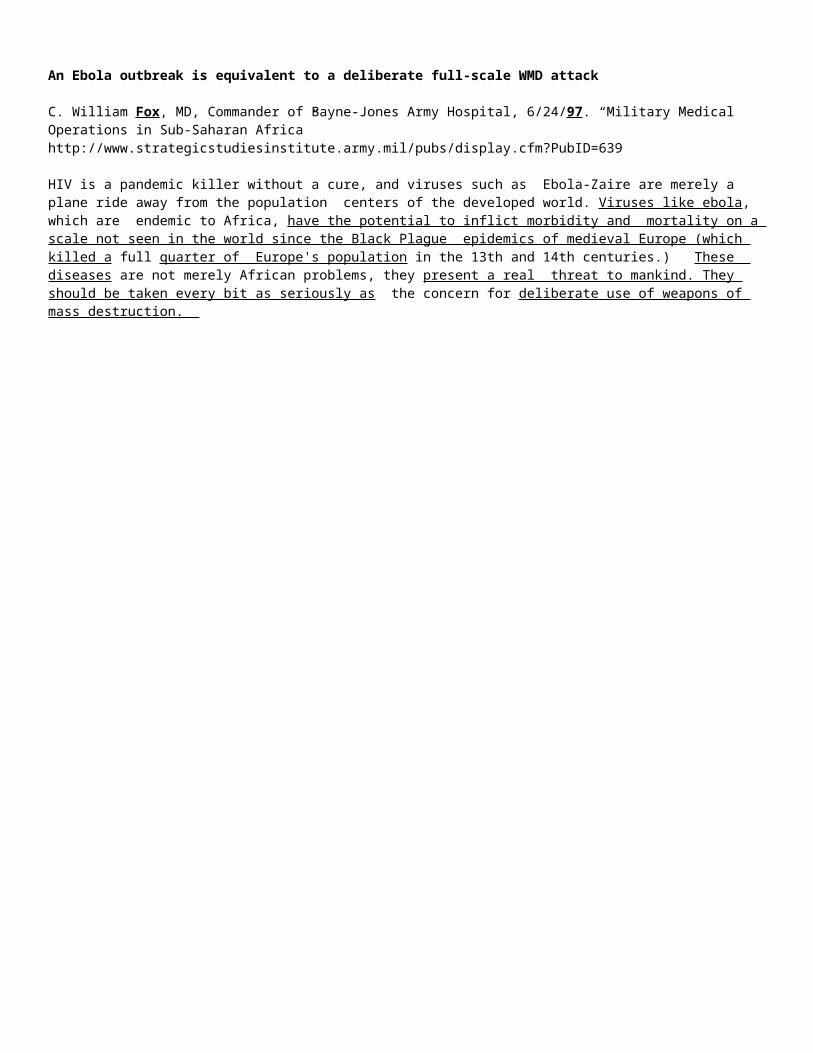
Efficiency CP - Solvency Energy reduction solves – Clinton’s executive order proves
RK STEWART, President of the American Institute of Architects, 2/12/07. “ENERGY EFFICIENT FEDERAL BUILDINGS,” Testimony before the US Senate Committee on Energy and Natural Resources Subcommittee on Energy, http://www.aia.org/SiteObjects/files/RKStewart_WrittenTestimony_SenateEnergy.pdf
Energy reduction requirements like these have shown a record of success, as demonstrated by DOE’s recently submitted annual report to Congress on Energy Management and Conservation programs. DOE’s report found that in 2005, federal agencies responding to President Clinton’s 1999 Executive Order had reduced their consumption levels by 29.6 percent, narrowly missing the goal established by President Clinton’s Executive Order by only .4 (point 4) percent [see graph below]. This makes it clear that when they are required to do so, federal agencies have the ability to meet reduced energy consumption targets.
Extension of federal energy efficiency policy could reduce emissions up to 80% from 1990 levels Joe Loper, Steve Capanna and Jeffrey Harris [“Reducing Greenhouse Gas Emissions In Federal Buildings, Facilities and Vehicles Alliance to Save Energy For the Presidential Climate Action Project” www.ase.org/files/3996_file_ghg_emissions_pcap.pdf] April 2008 The impacts of the federal government efforts to improve building and facility energy efficiency are not limited to the direct impacts on energy and CO2, but have broader market transforming benefits – the broader impacts of federal procurement activities could by some estimates be three times as great as the direct impacts.13 Large cost-effective savings opportunities remain. Recognizing this, Congress and the president have set aggressive requirements for future energy reductions in federal buildings and facilities that by 2015 could yield annual savings of an additional 0.1 quadrillion Btu of site energy, reduce the federal energy bill by more than $1.6 billion, and reduce CO2 emissions by almost 12 million metric tons.14 Cumulative emissions reductions associated with these energy savings could total 55 million metric tons of CO2 through 2015. At the same time, taxpayers would save $8 billion cumulatively through 2015.15 The existing energy intensity reduction requirements are not applicable to mobile sources of carbon emissions. If the requirements were extended to include all federal energy consumption and carbon emission sources, and were fully achieved, they could go a long way to pushing the federal government towards reducing its emissions by 80 percent by 2050 compared to 1990.

Efficiency CP - Spillover
Energy efficiency in government facilities spills over – encourages domestic buyers and suppliers
Laura Van Wie McGrory, Project manager - Energy Efficiency Standards Group, et al, 5/20/02. “Market Leadership by Example: Government Sector Energy Efficiency in Developing Countries,” http://www.osti.gov/energycitations/product.biblio.jsp?osti_id=821636
In every country there are important opportunities to improve energy efficiency in government facilities, operations, and public infrastructure and services. Benefits include lower government energy bills, reduced greenhouse gas emissions, less demand on electric utility systems, and reduced dependence on imported oil. Equally important, government sector buying power and active, visible leadership offer a powerful non-regulatory means to stimulate demand for energy-efficient products and services. By establishing a reliable entry market for more efficient products and services, government can encourage domestic suppliers to introduce more energy-efficient products at competitive prices. In other words, the government’s own energy efficiency initiatives can leverage other actions by both buyers and suppliers throughout the economy – as well as helping public agencies themselves save money and energy, and avoid pollution.
Federal energy efficiency policies spill over domestically – EnergyStar proves
Laura Van Wie McGrory, Project manager - Energy Efficiency Standards Group, et al, 5/20/02. “Market Leadership by Example: Government Sector Energy Efficiency in Developing Countries,” http://www.osti.gov/energycitations/product.biblio.jsp?osti_id=821636
Based on the government sector share of GDP or employment, what can we infer about the potential for energy-efficient government policies and practices to influence the broader market? While there are no established rules of thumb, it seems logical that where a customer segment represents 10% to 25% of the market, their openly stated policies, specifications, and purchasing criteria can have very substantial influence. One striking example of this was a 1993 policy directive that US federal agencies were to purchase only energy-efficient computers and office equipment that qualified for the Energy Star label; this had an immediate positive effect on manufacturer participation in the labeling program. Even though federal sales amounted to only 2-3% of the total market, Energy Star office equipment quickly achieved penetration rates of 90% or more for the entire US market.

Efficiency CP – Saves Money Energy efficiency programs empirically save $2.2 billion
RK STEWART, President of the American Institute of Architects, 2/12/07. “ENERGY EFFICIENT FEDERAL BUILDINGS,” Testimony before the US Senate Committee on Energy and Natural Resources Subcommittee on Energy, http://www.aia.org/SiteObjects/files/RKStewart_WrittenTestimony_SenateEnergy.pdf
The economic value of energy reductions from federal buildings can be seen by looking at previous energy reduction mandates in federal buildings. Because of federal legislation and President Clinton’s 1999 Executive Order, federal agencies consumed nearly 30 percent less energy per square foot in 2005 compared to 1985. As a result of this improved energy efficiency, the federal government saved approximately $2.2 billion on energy costs in standard federal buildings in 2005 when compared to 1985. While there are clearly other factors aside from federal energy management activities that go into this reduced spending, improved energy efficiency and energy reduction clearly played a large role.
Energy-efficient buildings save moneyRK Stewart, president of American Institute of Architects, 2/12/07 (“Energy Efficient Federal Buildings” http://www.aia.org/SiteObjects/files/RKStewart_WrittenTestimony_SenateEnergy.pdf)
In my professional experience, the primary concern I hear from clients about building “green” is cost. It is true that some energy efficient building systems may cost slightly more than their traditional counterparts. However once the building is in operation, the savings in energy expenditures alone often far outweigh the initial costs of installing “green” systems. While there have been some studies to date that show this, the AIA is currently working with a team of economists to research the economic benefits of energy efficient federal buildings. This study will analyze the estimated energy and dollar savings that federal government would realize by implementing our energy reduction goals for federal buildings over the lifespan of the building. We expect to have the study complete by this summer and we would be happy to submit it for the record. Other sources, most importantly the noted cost consultant Davis Langdon, argue that the cost of sustainability is statistically insignificant to a project’s total cost.7The economic value of energy reductions from federal buildings can be seen by looking at previous energy reduction mandates in federal buildings. Because of federal legislation and President Clinton’s 1999 Executive Order, federal agencies consumed nearly 30 percent less energy per square foot in 2005 compared to 1985. As a result of this improved energy efficiency, the federal government saved approximately $2.2 billion on energy costs in standard federal buildings in 2005 when compared to 1985. While there are clearly other factors aside from federal energy management activities that go into this reduced spending, improved energy efficiency and energy reduction clearly played a large role.
Even small steps have the ability to save a large amount of moneyJoe Loper, Steve Capanna and Jeffrey Harris Alliance to Save Energy For the Presidential Climate Action Project April 2008
Reducing federal building and facility energy intensity by 3 percent annually is achievable, but aggressive. The Energy Information Administration (EIA) projects private sector commercial building energy intensity will increase by 3.2 percent in 2015 compared to 2003,20 while residential building energy intensity is projected to decrease by 12 percent by 2015.21 Clearly, the energy intensity reduction requirements push agencies to achieve improvements that are far beyond the business-as-usual projections of EIA. No rigorous assessment of energy-efficiency potential in federal buildings and facilities has been conducted for at least the last decade. The most indicative public data are from audits of natural gas energy-saving opportunities in federal facilities by FEMP in the winter of 2005-2006 (see Figure 2). FEMP found natural gas savings potential of 2 to 60 percent from low and no-cost energy-saving measures in different facilities, with an average estimated energy savings potential of 9 percent.2216

Alt Cause – Transportation Federal transportation must be included
Joe Loper, Steve Capanna and Jeffrey Harris [“Reducing Greenhouse Gas Emissions In Federal Buildings, Facilities and Vehicles Alliance to Save Energy For the Presidential Climate Action Project” www.ase.org/files/3996_file_ghg_emissions_pcap.pdf] April 2008
Federal energy intensity reduction requirements and other policies are limited to buildings and other stationary facilities. That means that about 45 percent of federal energy use, 55 percent of DOD energy use, and half of federal CO2 emissions are exempted.24 This is also an important omission in terms of costs to taxpayers. According to a 2001 report by the Defense Science Board (DSB), the Air Force spends an average of $17.50 per gallon for “tanker-delivered” fuel and the delivered cost of fuel to Army forces on the forward edge of the battlefield can be hundreds of dollars per gallon.25 A more recent DSB report estimated that these estimates were low and failed to account for a good deal of the necessary force structure needed to transport the fuel.26 And military machinery consumes a lot of energy – fuel is 70 percent of Army tonnage shipped.27 Furthermore, delivery of fuel to “battle space” results in casualties, as fuel is delivered over hostile terrain. There are no reliable estimates of the overall potential for reducing energy use of weapons and other military systems, and estimating the potential is beyond the scope of this report. But even small percentage savings could mean big energy, cost and CO2 savings. If all federal energy use was subject to energy intensity reduction requirements roughly comparable to buildings and facilities, annual CO2 emissions would be reduced by nearly 19 million metric tons of additional savings below the baseline estimates in 2015. Energy use would be reduced by an additional 0.26 quads annually in 2015. Cumulative CO2 emissions reductions from vehicle and equipment efficiency improvements through 2015 could equal up to 86 million metric tons, and cumulative energy savings could reach 1.2 quads.28 While these reductions will not be easily achieved, they are less stringent than the modifications to private sector fuel economy standards passed in EISA, which requires vehicle manufacturers to achieve fleet average fuel economy of at least 35 miles per gallon in 2020, a 40 percent increase over current requirements.29

No Disease From BSL-4
Pathogens won’t escape from BSL-4 labs, and if they do, they won’t cause a widespread pandemic
Jocelyn Kaiser, staff writer – Science Magazine, 9/07. “BIOSAFETY BREACHES: Accidents Spur a Closer Look at Risks at Biodefense Labs,” Science 28, Vol. 317. no. 5846, pp. 1852 – 1854. http://www.sciencemag.org/cgi/content/full/317/5846/1852
One point of agreement among most scientists is that however scary these incidents sound--the mention of Ebola virus conjures the 1995 movie Outbreak, for example--the risk to the public is very low for most pathogens, for two reasons. First, there have been no known environmental escapes from BSL-4 labs since the early 1980s and only two workers are known to have become infected in BSL-4 labs, both outside the United States. Workers have many layers of protection, including positive-pressure "space suits," and realize the hazards of working with pathogens studied in BSL-4 labs, for which, by definition, there are no treatments.
Second, even if an agent studied in a BSL-4 lab did escape, most, with the exception of smallpox (which can only be studied at CDC), are not very transmissible. Anthrax doesn't spread person to person, for example. Ebola and other hemorrhagic fevers that have killed hundreds in Africa would likely never cause an outbreak in Western countries because hygiene and medical treatments are so much better, says Peters. (He also notes that many select agents, such as anthrax and Q fever, occur commonly in nature, so people can get infected without coming anywhere near a biodefense lab.

AT: 1918 Flu 1918 flu won’t kill many – modern science solves
Scientific American, 12/21/06. “Warning: A Flu Pandemic Today Could Kill As Many As 80 Million People,” The Lancet
Despite these fears, there are many cogent reasons to expect that the emergence today of a pandemic strain much the same as that which caused the 1918–20 pandemic strain would lead to much lower mortality than estimated here. First, symptomatic medical management is better now than in 1918–20. However, although individuals with access to health care in high-income and middle-income countries might benefit, health-care systems could become overwhelmed, which would attenuate this effect. Second, antivirals such as zanamivir and oseltamivir phosphate might have a positive effect on the reduction of transmission56,57 and case-fatality rates.58 Because we have not yet seen the next pandemic virus, the magnitude of this effect cannot be quantified. Third, vaccination with a lag of 4–6 months from the onset of a pandemic could reach a large fraction of the high-income populations.59 The speed of the epidemic, perhaps affected by various efforts at quarantine, will determine the potential benefit of vaccination. Strict quarantine in American Samoa seems to have avoided the 1918–20 pandemic;60 quarantine efforts in Australia are thought to have delayed but not avoided the pandemic,61 but strict quarantine measures in other settings failed.62 Mathematical models suggest that quarantine could be beneficial if highly effective and if administered in combination with prophylaxis under certain circumstances.63–65 In view of the restricted vaccine production capacity and the reality of health system coverage, vaccination would have little or no effect on the poorest populations. Fourth, in 1918–20, a large proportion of deaths was due to secondary bacterial pneumonia after primary viral pneumonitis.66 Antibiotics for pneumonia could have a substantial effect on case-fatality rates. In middle-income and low-income settings, prompt access to antibiotics could be the most affordable strategy that has the largest effect on mortality. One should note that all of these factors will lower mortality more in richer nations than in those with lower per-head income, which tends to strengthen the already observed inverse relation with per-head income.

Alphabetical List Of Updated Select Agents And ToxinsProposed List, 28 August 2007 - http://www.hms.harvard.edu/orsp/coms/BiosafetyResources/Bioterrorism/Select-Agent-Listing.docExcept for exclusions listed in the Appendix, the viruses, bacteria, fungi, toxins, genetic elements, recombinant nucleic acids, and recombinant organisms specified in this list are HHS, USDA or HHS/USDA overlap select agents and toxins. 1. Abrin (HHS) [See exclusion on last page] 2. African horse sickness virus (USDA, Animal) 3. African swine fever virus (USDA, Animal) 4. Akabane virus (USDA, Animal) 5. Avian influenza virus (highly pathogenic) (USDA, Animal) [See exclusions on last page] 6. Bacillus anthracis (Overlap) [See exclusions on last page] 7. Bluetongue virus (exotic) (USDA, Animal) 8. Botulinum neurotoxin producing species of Clostridium (HHS) 9. Botulinum neurotoxins (HHS) [See exclusion on last page] 10. Bovine spongiform encephalopathy agent (USDA, Animal) 11. Brucella abortus (Overlap) [See exclusions on last page] 12. Brucella melitensis (Overlap) 13. Brucella suis (Overlap) 14. Burkholderia mallei (formerly Pseudomonas mallei) (Overlap) 15. Burkholderia pseudomallei (formerly Pseudomonas pseudomallei) (Overlap) 16. Camel pox virus (USDA, Animal) 17. Candidatus Liberobacter africanus (USDA, Plant) 18. Candidatus Liberobacter asiaticus (USDA, Plant) 19. Central European Tick-borne encephalitis virus (HHS) 20. Cercopithecine herpesvirus 1 (Herpes B virus) (HHS) 21. Classical swine fever virus (USDA, Animal) 22. Clostridium perfringens epsilon toxin (HHS) [See exclusion on last page] 23. Coccidioides immitis (HHS) 24. Coccidioides posadasii (HHS) [See exclusion on last page] 25. Conotoxins (HHS) [See exclusions on last page] 26. Cowdria ruminantium (Heartwater) (USDA, Animal) 27. Coxiella burnetii (HHS) [See exclusion on last page] 28. Crimean-Congo haemorrhagic fever virus (HHS) 29. Diacetoxyscirpenol (HHS) [See exclusion on last page] 30. Eastern Equine Encephalitis virus (HHS) 31. Ebola viruses (HHS) 32. Far Eastern Tick-borne encephalitis (HHS) 33. Flexal virus (HHS) 34. Foot-and-mouse disease virus (USDA, Animal) 35. Francisella tularensis (HHS) [See exclusions on last page] 36. Goat pox virus (USDA, Animal) 37. Guanarito, virus (HHS) 38. Hendra virus (Overlap) 39. Japanese encephalitis virus (USDA, Animal) [See exclusion on last page] 40. Junin virus (HHS) [See exclusion on last page] 41. Kyasanur Forest disease (HHS) 42. Lassa fever virus (HHS) 43. Lumpy skin disease virus (USDA, Animal) 44. Machupo virus (HHS) 45. Malignant catarrhal fever virus (exotic) (Alcelaphine herpesvirus type 1) (USDA, Animal) 46. Marburg virus (HHS) 47. Menangle virus (USDA, Animal) 48. Monkeypox virus (HHS) 49. Mycoplasma capricolum/ M. F38/M. mycoides capri (contagious caprine pleuropneumonia) (USDA, Animal) 50. Mycoplasma mycoides mycoides (contagious bovine pleuropneumonia) (USDA, Animal) 51. Newcastle disease virus (velogenic) (USDA, Animal) 52. Nipah virus (Overlap) 53. Omsk Hemorrhagic Fever (HHS) 54. Peronosclerospora philippinensis (USDA, Plant) 55. Peste des petits ruminants virus (USDA, Animal) 56. Ralstonia solanacearum, race 3, biovar 2 (USDA, Plant) 57. Reconstructed replication competent forms of the 1918 pandemic influenza virus containing any portion of the coding regions of all eight gene segments (Reconstructed 1918 Influenza virus) (HHS) 58. Ricin (HHS) [See exclusion on last page] 59. Rickettsia prowazekii (HHS) 60. Rickettsia rickettsii (HHS) 61. Rift Valley fever virus (Overlap) [See exclusion on last page]

62. Rinderpest virus (USDA, Animal) 63. Russian Spring and Summer encephalitis (HHS) 64. Sabia virus (HHS) 65. Saxitoxin (HHS) [See exclusion on last page] 66. Sclerophthora rayssiae var. zeae (USDA, Plant) 67. Sheep pox virus (USDA, Animal) 68. Shiga-like ribosome inactivating proteins (HHS) [See exclusion on last page] 69. Shigatoxin (HHS) [See exclusion on last page] 70. Staphylococcal enterotoxins (HHS) [See exclusion on last page] 71. Swine vesicular disease virus (USDA, Animal) 72. Synchytrium endobioticum (USDA, Plant) 73. T-2 toxin (HHS) [See exclusion on last page] 74. Tetrodotoxin (HHS) [See exclusion on last page] 75. Variola major virus (Smallpox virus) (HHS) 76. Variola minor virus (Alastrim) (HHS) 77. Venezuelan Equine Encephalitis virus (Overlap) [See exclusions on last page] 78. Vesicular stomatitis virus (exotic) (USDA, Animal) 79. Xanthomonas oryzae pv. oryzicola (USDA, Plant) 80. Xylella fastidiosa (citrus variegated chlorosis strain) (USDA, Plant) 81. Yersinia pestis (HHS) [See exclusions on last page]