guardrail warrants for low volume roads
TRANSCRIPT
74
GUARDRAIL WARRANTS FOR LOW VOLUME ROADS
Louis B. Stephens, P.E.
INTRODUCTION
Low volume roads present many challenges to highway engineers and public administrators. Although, by definition, these facilities are not heavily traveled, the sheer magnitude of the inventory of low volume roads creates a significant accumulation of both agency and user costs. There are approximately 2 million miles of low volume roads in the United States, representing 52% of all public roads. These roads typically have restricted lane widths, poor pavements and shoulders ( 42% are unpaved), restricted rights-of-way, 14 bridges every 100 miles, and very low traffic volumes (under 2,000 ADT). They are most likely owned by local governments.
These 2 million miles of low volume roads attract approximately 1/10 of the funding per mile that is spent on higher volume roads. Needs for agency expenditures (federal, state or local) include maintenance, rehabilitation, safety and capacity improvements, and new construction. Unfortunately, agencies are frequently unable to cope with just routine maintenance costs. User costs can include travel time, vehicle operating costs, and, perhaps most significantly, losses due to accidents.
The estimated fatal accident rate (per million vehicle miles) is 75% higher on these roads than the U.S. total. It is estimated that in excess of one million accidents occur on these roads annually, resulting in 13,000 deaths and ti00,000 injuries. Approximately 40% of the one million accidents involve run-off-the-road incidents, which is about 0.2 roadside accidents per mile per year.
A great deal of research and development has gone into improved roadside design practices and safety hardware in recent years to improve highway safety. Despite these advances, the available technology has not been consistently applied to low volume roads because of the available funds in relation to the magnitude of the problem. Unfortunately, many of the roadside safety improvements found to be so successful on heavily traveled roads are unrealistically expensive when applied to low volume roads. Large clear zones require extensive right-of-way and long-term commitment of funds for maintenance in. The installation costs of crashworthy drainage devices, sign supports, utility poles, crashcushions, and guardrail limit the use of these devices.
The overwhelming needs and relative scarcity of funds clearly point out that highway agencies (particularly local governments) must have low-cost options, and they must
prioritize their programs well to ensure that the greatest benefits are received from the available funds. The first is a hardware issue and the second is a management issue. As the highway safety community struggles with the questions of how best to satisfy the mandated Highway Safety Management Systems, we should not overlook the needs of low volume roads. Management systems are proven most beneficial where the needs are large and the resources are small.
In recognition of these problems, the Transportation Research Board, through the National Cooperative Highway Research Program (NCHRP), developed crashworthy low service level guardrail systems for use on low volume roads (NCHRP Project 22-5). These systems are significantly less expensive than conventional guardrail systems, which should enhance their use on low volume roads. NCHRP Project 22-5A (conducted by Wilbur Smith Associates) researched and developed a systematic approach to identifying and classifying roadside hazards, analyzing alternate treatments, and selecting the best treatment. This research included the development of a User's Guide(J) that describes the new low service level guardrail and the recommended warranting procedure.
The procedures developed in NCHRP 22-5A consider the new low service level guardrail as well as conventional systems. This approach is flexible enough to allow for unique site, policy, and cost considerations. The analysis can employ the ROADSIDE computer program and detailed cost estimates if desired; otherwise, this guide provides a procedure that can be used without a computer. Although the resulting user's guide does not describe a Highway Safety Management System, it does present a logical, systematic process of identifying and classifying roadside safety hazards, identifying alternative treatments, and selecting the best treatment. Certainly, these procedures can be valuable components of a management system. Although this warranting process is intended for use on low volume roads, the methodology can be adapted to other facilities as well.
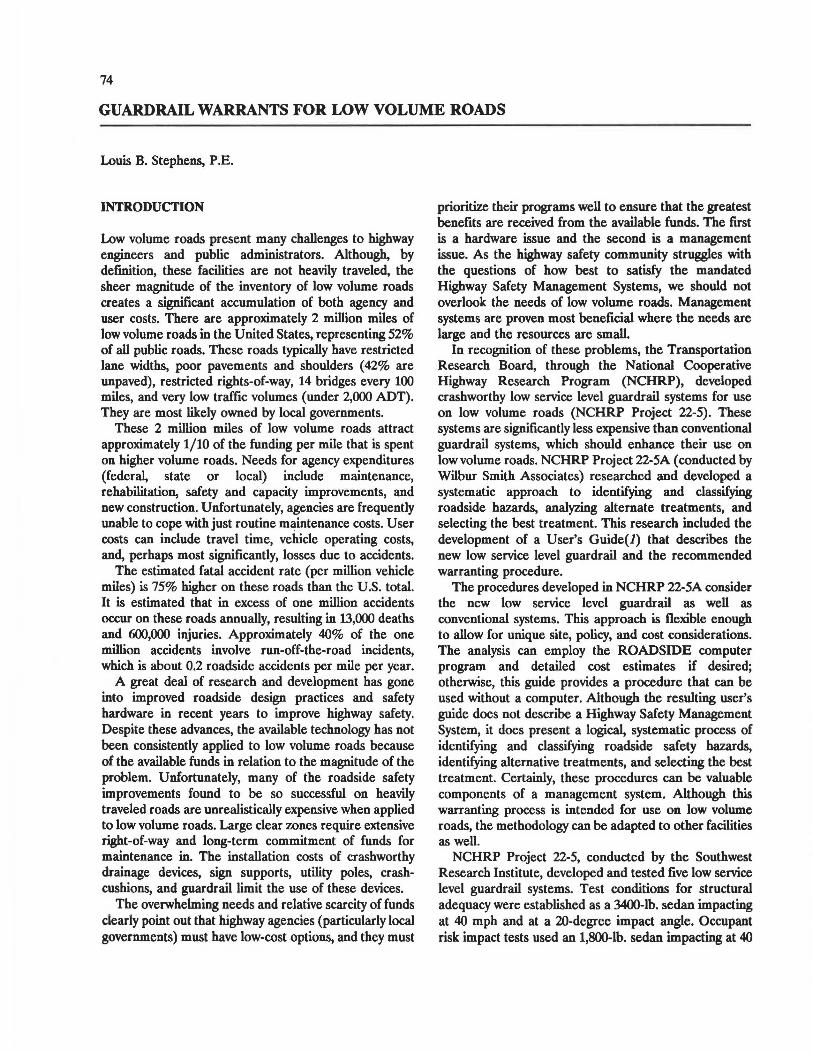
NCHRP Project 22-5, conducted by the Southwest Research Institute, developed and tested five low service level guardrail systems. Test conditions for structural adequacy were established as a 3400-lb. sedan impacting at 40 mph and at a 20-degree impact angle. Occupant risk impact tests used an 1,800-lb. sedan impacting at 40
1· 3•
Soil Plate
FIGURE 1 2 Strand Cable, GL 1
.. 11 2' :r
1· O"
FIGURE 2 2 Strand Cable, GL 2
Post Type: 4 lb./ft. steel "Hat" section Post Spacing: 16" Beam Type: 2 dia. Steel cables, 3/4" dia. Nominal Barrier Height: 27" Maximum Dynamic Deflection: approx. 7'
Post Type: S3 X S7 Steel steel "Hat" section Post Spacing: 16 ft. Beam Type: 2 dia. Steel cables, 3/4" dia. Nominal Barrier Height: 27" Maximum Dynamic Deflection: approx. 7'

2' ,.
.. o·
FIGURE 3 2 Strand Cable, GL 3
Soil Plate
FIGURE 4 W-Beam Weak Post GL 4
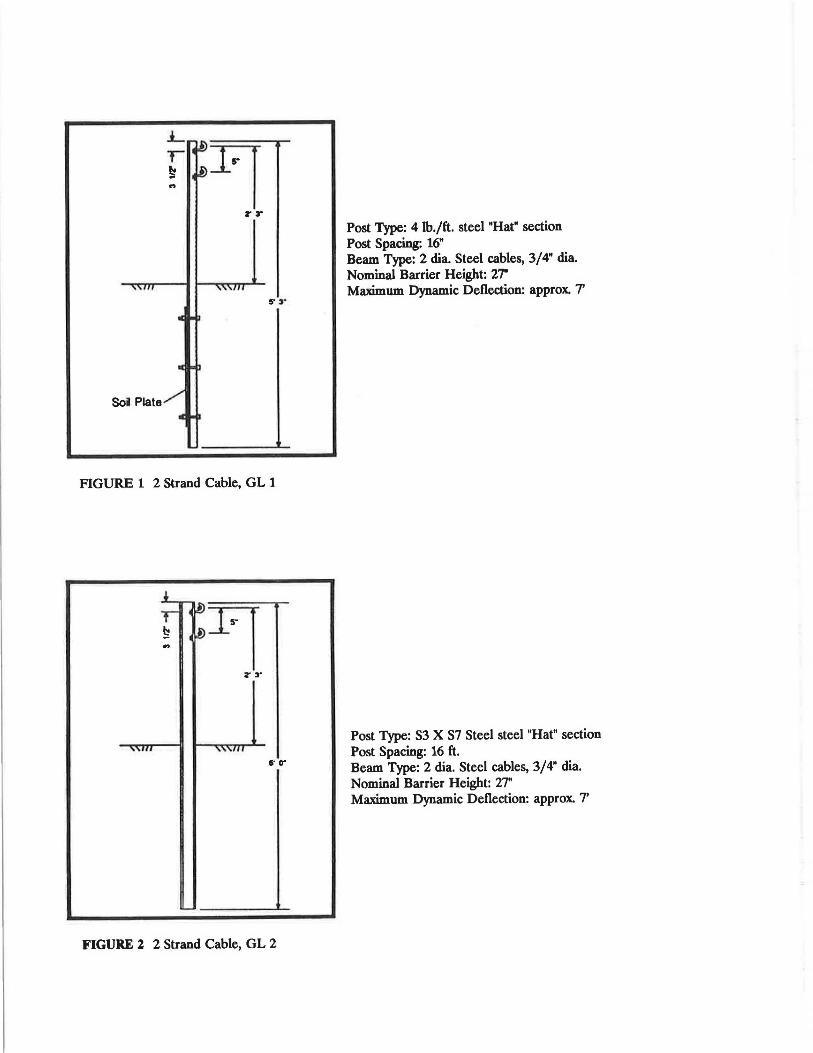
Post Type: 5 1/2" dia. Wood Post Spacing: 16" Beam Type: 2 Steel cables, 3/4" dia. Nominal Barrier Height: 27" Maximum Dynamic Deflection: approx. 7'
Post Type: 4 lb./ft. Steel "Hat" Section Post Spacing: 12'6" Beam Type: 12 gauge W-Beam Nominal Barrier Height: 27" Maximum Dynamic Deflection: approx. 6'
31•"
•
•-===== fT 77
2' 3•
Post Type: 5 1/2" dia. Wood Post Spacing: 12'6"
5' 3
Beam Type: 12 guage W-Beam Nominal Barrier Height: 27" Maximum Dynamic Deflection: approx. 3'
--FIGURE 5 W-Beam Weak Post GL 5
mph at 20 degrees. The five systems are variations of the Gl cable and G2 W-beam weak post systems, as shown in figures 1 through 5:
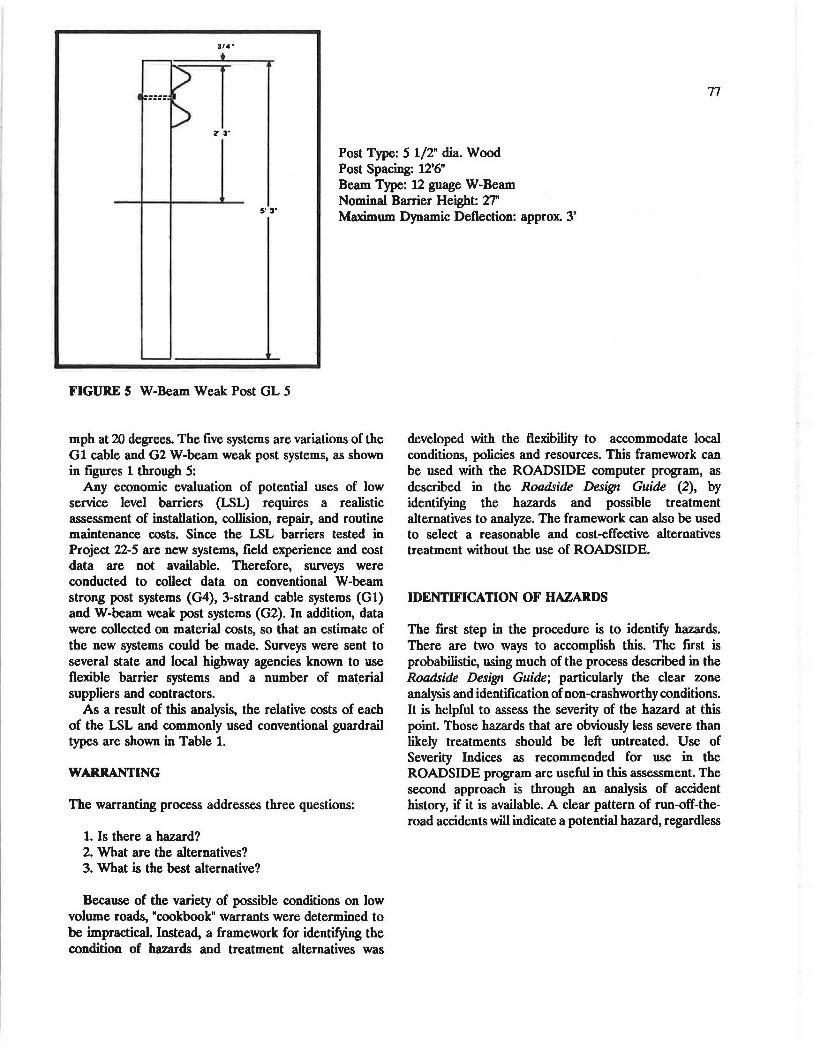
Any economic evaluation of potential uses of low service level barriers (LSL) requires a realistic assessment of installation, collision, repair, and routine maintenance costs. Since the LSL barriers tested in Project 22-5 are new systems, field experience and cost data are not available. Therefore, surveys were conducted to collect data on conventional W-beam strong post systems (G4), 3-strand cable systems (Gl) and W-beam weak post systems (G2). In addition, data were collected on material costs, so that an estimate of the new systems could be made. Surveys were sent to several state and local highway agencies known to use flexible barrier systems and a number of material suppliers and contractors.
As a result of this analysis, the relative costs of each of the LSL and commonly used conventional guardrail types are shown in Table 1.
WARRANTING
The warranting process addresses three questions:
1. Is there a hazard? 2. What are the alternatives? 3. What is the best alternative?
Because of the variety of possible conditions on low volume roads, "cookbook" warrants were determined to be impractical. Instead, a framework for identifying the condition of hazards and treatment alternatives was
developed with the flexibility to accommodate local conditions, policies and resources. This framework can be used with the ROADSIDE computer program, as described in the Roadside Design Guide (2), by identifying the hazards and possible treatment alternatives to analyze. The framework can also be used to select a reasonable and cost-effective alternatives treatment without the use of ROADSIDE.
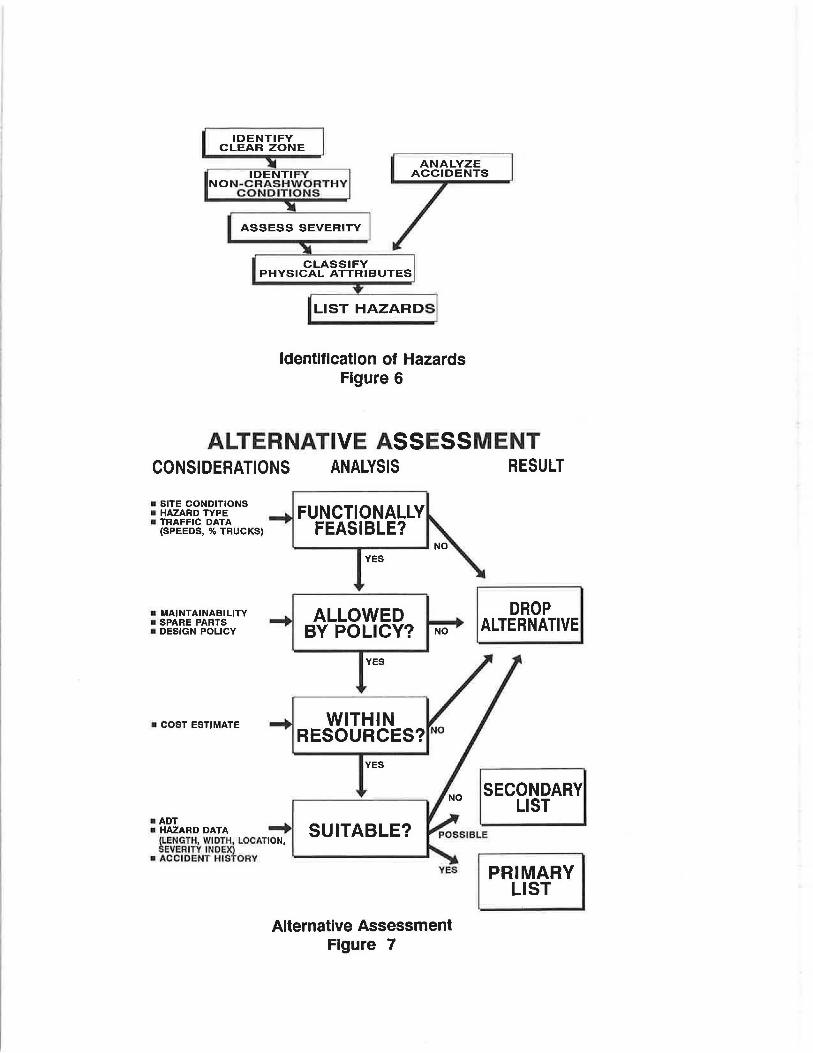
IDENTIFICATION OF HAZARDS
The first step in the procedure is to identify hazards. There are two ways to accomplish this. The first is probabilistic, using much of the process described in the Roadside Design Guide; particularly the clear zone analysis and identification of non-crashworthy conditions. It is helpful to assess the severity of the hazard at this point. Those hazards that are obviously less severe than likely treatments should be left untreated. Use of Severity Indices as recommended for use in the ROADSIDE program are useful in this assessment. The second approach is through an analysis of accident history, if it is available. A clear pattern of run-off-theroad accidents will indicate a potential hazard, regardless
78
TABLE 1 Guardrail systems installation costs.
RELATIVE INSTALLATION COSTS GUARDRAIL SYSTEMS
,..:: ~-: ·-,
System •< :....: ·- j}
·"' •' :-:-.. .«.:~--~ ~- .. , ··~ ·::-:. ;:~=-~-:::::: ~:-:~~ " ~
,-, --- ~~
-,
D~lii&!!~tiQD ~ .f2fil ·x:x 'costlFaGt••:: . ~'of•'Stroog ::z:~\. : :
l!!~l ·l:t,;~- ~)j ~
·.;; ..
GLl 2-Strand Cable 4 lb. Steel 3.68 31%
GL3 2-Strand Cable Wood 3.88 33%
GL2 2-Strand Cable S3X5.7 Steel 4.56 38%
Gl 3-Strand Cable S3X5.7 Steel 5.78 49%
GL4 w 4 lb. Steel 6.59 56%
GL5 w Wood 6.83 58%
G2 w S3X5.7 Steel 7.63 64%
G4 w Steel or Wood 11.85 100% ,, lYl)(J Dollars
A classification of the physical attributes of the potential hazards is necessary to evaluate treatment alternatives. This process is illustrated in Figure 6.
IDENTIFICATION OF ALTERNATIVES
The framework encourages the consideration of all possible treatment alternatives. These are:
• Change Clear Zone; • Remove or Relocate the Hazard; • Change the Hazard; • Shield the Hazard; and • Accept the Risk.
The Clear Zone can be changed by flattening slopes and horizontal curves. Obviously, this involves major geometric modifications and is usually very expensive. Shielding the hazard includes consideration of the LSL barriers developed in this research and commonly used conventional barriers (Gl, G2, and G4). Other systems could be evaluated, such as concrete barriers and crash cushions, but were not specifically provided for because their expense makes their use impractical in most low volume road applications, It is important to include risk
acceptance as an alternative because many safety-related actions are frequently not cost-effective.
ANALYSIS OF ALTERNATIVES
The framework for evaluating alternatives is illustrated in Figure 7. Each of the analysis steps are designed to allow the flexibility to account for local conditions, policies and resources.
The final step in this process is to prioritize the alternatives into three groups:
•Those obviously suitable (preferred); •Those that may possibly be suitable (secondary); and •Those that are obviously not suitable (drop).
Economic analysis is the primary consideration for suitability, but other factors may eliminate alternatives, such as functional feasibility, agency policy and available resources. For guardrail alternatives, the three groupings were arrived at by performing a series of economic analyses using ROADSIDE on typical low volume road conditions. Three procedures were developed; one for area hazards; one for point hazards and one for bridge approaches. Assumptions were made about most of the
IDENTIFY CLEAR ZONE
IDENTIFY NON~CRASHWORTHY
CONDITIONS
ANALYZE ACCIDENTS
ASSESS SEVERITY
CLASSIFY PHYSICAL ATTRIBUTES
LIST HAZARDS
Identification of Hazards Figure 6
ALTERNATIVE ASSESSMENT CONSIDERATIONS
• SITE CONDITIONS •HAZARD TYPE •TRAFFIC DATA
(SPEEDS, % TRUCKS)
•MAINTAINABILITY • SPARE PARTS • DESIGN POLICY
• COST ESTIMATE
ANALYSIS
FUNCTIONALLY FEASIBLE?
YES
ALLOWED BY POLICY? NO
YES
WITHIN RESOURCES? NO
YES
• ADT • HAZARD DATA ...... SUITABLE?
(LENGTH, WIDTH, LOCATION, SEVERITY INDEX)
•ACCIDENT HISTORY '---------'
RESULT
DROP ALTERNATIVE
SECONDARY LIST
YES PRIMARY
Alternative Assessment Figure 7
LIST
80
ROADSIDE inputs that allowed the analysis to be reduced to the following variables:
• Dimensions of the hazard; • Location of the hazard; • Severity index of the hazard; • Guardrail system; and •Average Daily Traffic.
Reasonable assumptions can be made about most low volume road conditions, with the anticipation that variations in actual field conditions will be compensating. The analysis is very sensitive to two variables that are certainly subject to debate: accident costs and encroachment rates.
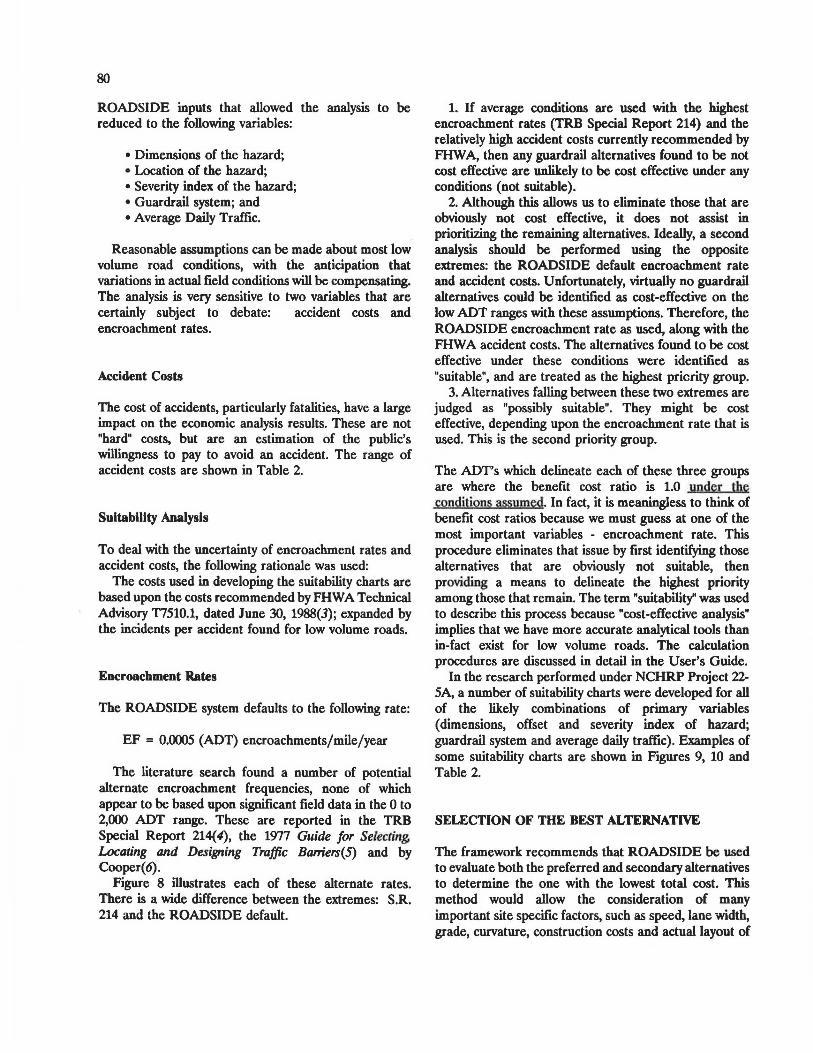
Accident Costs
The cost of accidents, particularly fatalities, have a large impact on the economic analysis results. These are not "hard" costs, but are an estimation of the public's willingness to pay to avoid an accident. The range of accident costs are shown in Table 2.
Suitability Analysis
To deal with the uncertainty of encroachment rates and accident costs, the following rationale was used:
The costs used in developing the suitability charts are based upon the costs recommended by FHW A Technical Advisory 17510.1, dated June 30, 1988(3); expanded by the incidents per accident found for low volume roads.
Encroachment Rates
The ROADSIDE system defaults to the following rate:
EF = 0.0005 (ADT) encroachments/mile/year
The literature search found a number of potential alternate encroachment frequencies, none of which appear to be based upon significant field data in the 0 to 2,000 ADT range. These are reported in the TRB Special Report 214(4), the 1977 Guide for Selecting, Locating and Designing Traffic Barriers(5) and by Cooper(6).
Figure 8 illustrates each of these alternate rates. There is a wide difference between the extremes: S.R. 214 and the ROADSIDE default.
1. If average conditions are used with the highest encroachment rates (TRB Special Report 214) and the relatively high accident costs currently recommended by FHW A, then any guardrail alternatives found to be not cost effective are unlikely to be cost effective under any conditions (not suitable).
2. Although this allows us to eliminate those that are obviously not cost effective, it does not assist in prioritizing the remaining alternatives. Ideally, a second analysis should be performed using the opposite extremes: the ROADSIDE default encroachment rate and accident costs. Unfortunately, virtually no guardrail alternatives could be identified as cost-effective on the low ADT ranges with these assumptions. Therefore, the ROADSIDE encroachment rate as used, along with the FHW A accident costs. The alternatives found to be cost effective under these conditions were identified as "suitable", and are treated as the highest pricrity group.
3. Alternatives falling between these two extremes are judged as "possibly suitable". They might be cost effective, depending upon the encroachment rate that is used. This is the second priority group.
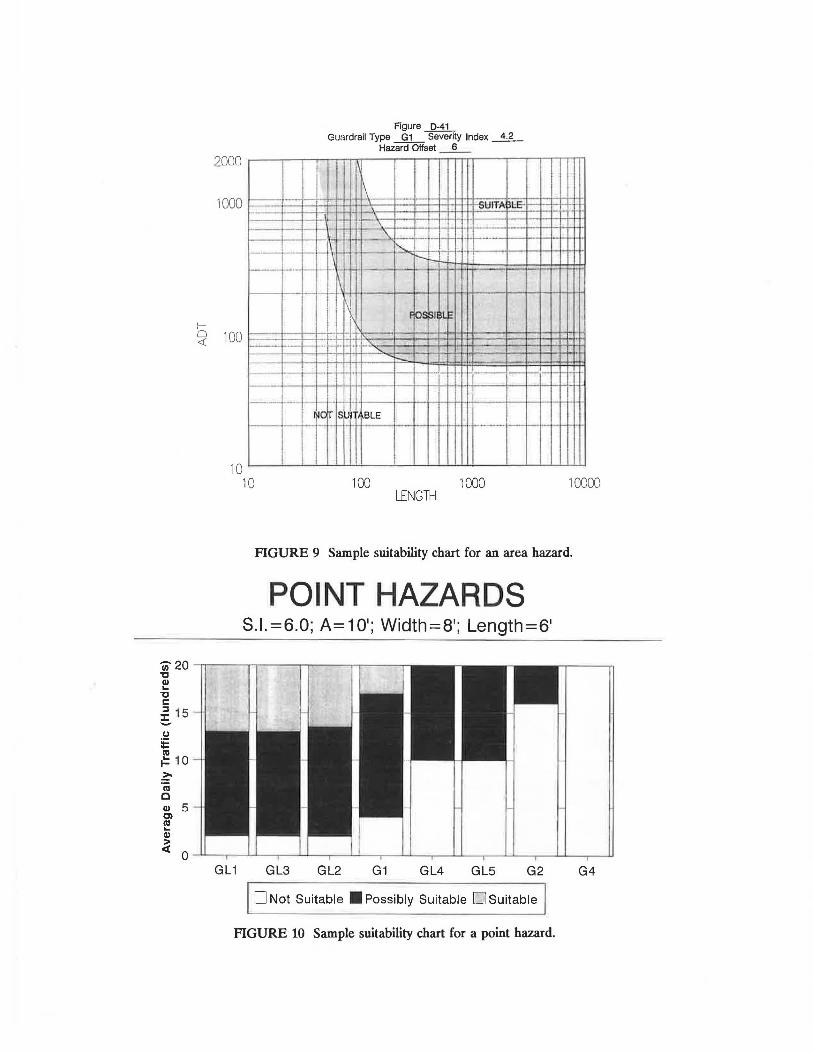
The ADT's which delineate each of these three groups are where the benefit cost ratio is 1.0 under the conditions assumed. In fact, it is meaningless to think of benefit cost ratios because we must guess at one of the most important variables - encroachment rate. This procedure eliminates that issue by ftrst identifying those alternatives that are obviously not suitable, then providing a means to delineate the highest priority among those that remain. The term "suitability" was used to describe this process because "cost-effective analysis" implies that we have more accurate analytical tools than in-fact exist for low volume roads. The calculation procedures are discussed in detail in the User's Guide.
In the research performed under NCHRP Project 22-SA, a number of suitability charts were developed for all of the likely combinations of primary variables (dimensions, offset and severity index of hazard; guardrail system and average daily traffic). Examples of some suitability charts are shown in Figures 9, 10 and Table 2.
SELECTION OF THE BEST ALTERNATIVE
The framework recommends that ROADSIDE be used to evaluate both the preferred and secondary alternatives to determine the one with the lowest total cost. This method would allow the consideration of many important site specific factors, such as speed, lane width, grade, curvature, construction costs and actual layout of
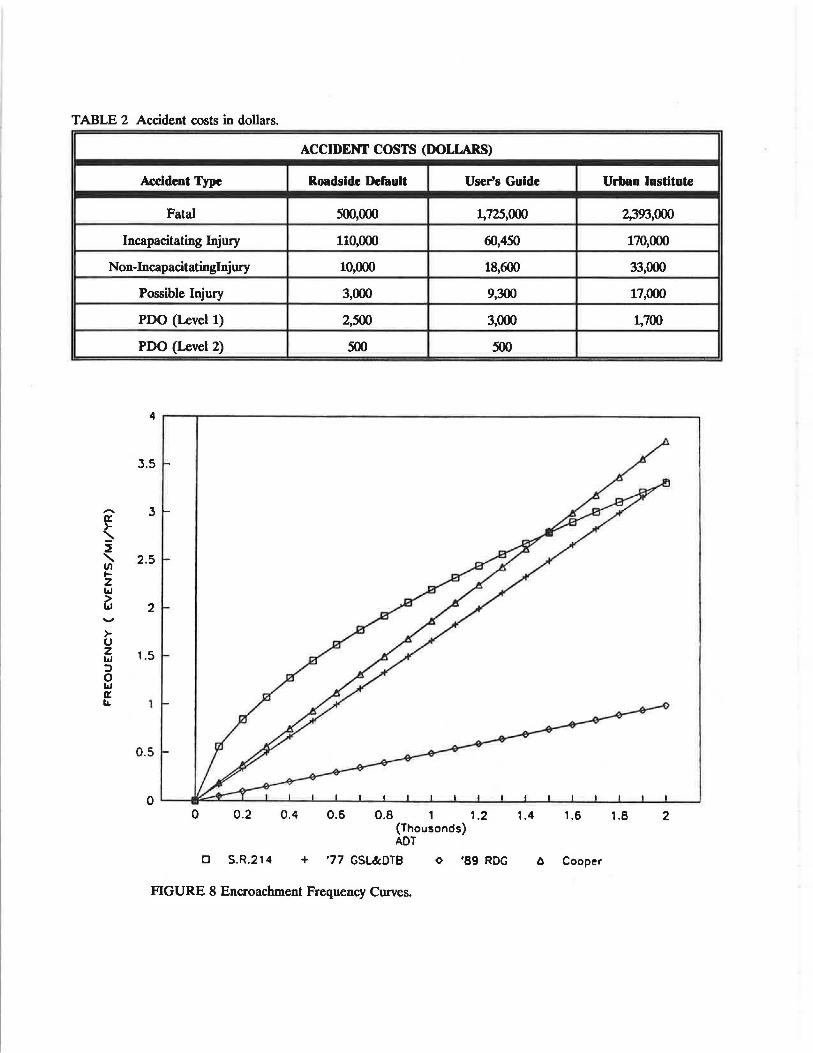
TABLE 2 Accident costs in dollars.
ACCIDENT COSTS (DOLLARS)
Accident Type Roadside Default User's Gulde Urban Institute
Fatal 500,000 1,725,000 2,393,000
Incapacitating Injury 110,000 <>0,450 170,000
Non-Incapacitatinglnjury 10,000 18,<>00 33,000
Possible Injury 3,000 9,300 17,000
PDQ (Level 1) 2,500 3,000 1,700
PDQ (Level 2) 500 500
4
3.5
...... 3
~ ~
' 2.5 Cf) ~ z w > w 2 ....., >-0 z 1.5 w :> 0 w 0:: &..
0 0.2 0.4 0.6 0.8 1 1.2 1.4 1.6 1.8 2 (Thousonds) AOT
D S.R.214 + '77 GSl&DTB o '89 ROG ll Cooper
FIGURE 8 Encroachment Frequency Curves.
f-
Figure D-41 Guardrail Type G1 Severity Index ~
Hazard Offset _ 6 _
1000 ==::: ;::_.,.,.1---+,_.--1...,i-J--J_ci~·i-f'\-\, ... --_::-_-...r~-·---,--+--+-_,,_1-H.+t-S-:t:lffA ~lf=·t--·--1·--1~H 1-\,-i~-+-+-+-t-++t+---t-·i--i-i . .. .... __ ,,\_,_____,_____. __ ,,_
------ - - - ·-1-1-1·-14--"<-t-·-+-t--+-t--H-i·+---i-- •t--t-r-....-t-...
----· -·- ,_ - .
\
- '\ 1--• ,_ ...... I- - .. - ·- ·-·- ·-t--t--r-1 ,,__ _ ;...._ __ j-t-i-i-i
........ _.
__ .. T ·1
I I \ FIOSSllBl E
~ 100 l--l-i-1- ....... '= ~~,:..,;::_ = :1=:t=:i:+::i:+m===i:=l=l:+1+1:1=1 ....
---l--~-1--•-+-
•· -~-1·-I'-""' -i-
- --- ...... ,_,__ -~ ...... -~cfr SI.: BLE
--1-......_;i-+-+l-H+--I- ·-1-i·-l-i_,- · · ....... -··-··· ,,_ .... t-- ··- ...
I 10
10 100 1000 10000 LENGTH
FIGURE 9 Sample suitability chart for an area hazard.
POINT HAZARDS S.l.=6.0; A=10'; Width=8'; Length=6'
GL1 GL3 GL2 G1 GL4 GL5 G2 G4
D Not Suitable •Possibly Suitable D Suitable
FIGURE 10 Sample suitability chart for a point hazard.
83
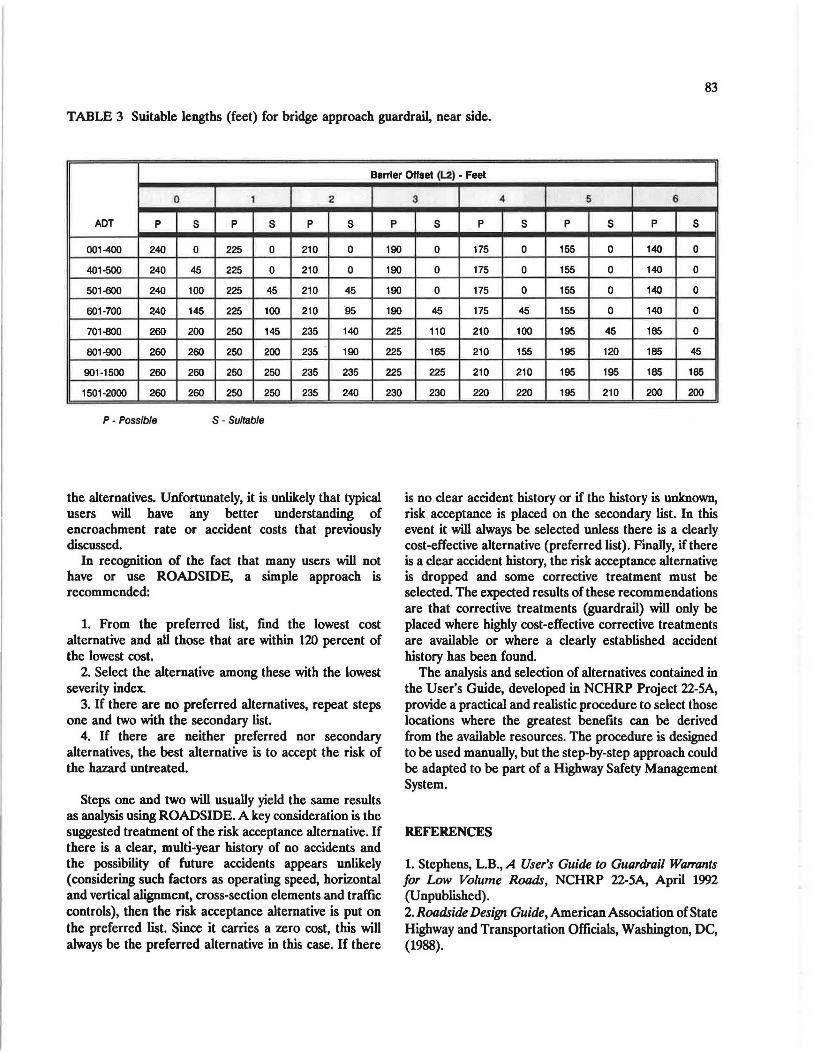
TABLE 3 Suitable lengths (feet) for bridge approach guardrail, near side.
Barrier Offset (L2) - Feet
0 1 2
ADT p s p s p s
001-400 240 0 225 0 210 0
401-500 240 45 225 0 210 0
501-800 240 100 225 45 210 45
601-700 240 145 225 100 210 ·95
701-800 260 200 250 145 235 140
801-900 260 260 250 200 235 190
901-1500 260 260 250 250 235 235
1501-2000 260 260 250 250 235 240
P- Possible S- Suitable
the alternatives. Unfortunately, it is unlikely that typical users will have any better understanding of encroachment rate or accident costs that previously discussed.
In recognition of the fact that many users will not have or use ROADSIDE, a simple approach is recommended:
1. From the preferred list, find the lowest cost alternative and all those that are within 120 percent of the lowest cost.
2. Select the alternative among these with the lowest severity index.
3. If there are no preferred alternatives, repeat steps one and two with the secondary list.
4. If there are neither preferred nor secondary alternatives, the best alternative is to accept the risk of the hazard untreated.
Steps one and two will usually yield the same results as analysis using ROADSIDE. A key consideration is the suggested treatment of the risk acceptance alternative. If there is a clear, multi-year history of no accidents and the possibility of future accidents appears unlikely (considering such factors as operating speed, horizontal and vertical alignment, cross-section elements and traffic controls), then the risk acceptance alternative is put on the preferred list. Since it carries a zero cost, this will always be the pref erred alternative in this case. If there
p
190
190
190
190
225
225
225
230
3 4 5 6
s p s p s p s
0 175 0 155 0 140 0
0 175 0 155 0 140 0
0 175 0 155 0 140 0
45 175 45 155 0 140 0
110 210 100 195 45 185 0
165 210 155 195 120 185 45
225 210 210 195 195 185 185
230 220 220 195 210 200 200
is no clear accident history or if the history is unknown, risk acceptance is placed on the secondary list. In this event it will always be selected unless there is a clearly cost-effective alternative (preferred list). Finally, if there is a clear accident history, the risk acceptance alternative is dropped and some corrective treatment must be selected. The expected results of these recommendations are that corrective treatments (guardrail) will only be placed where highly cost-effective corrective treatments are available or where a clearly established accident history has been found.
The analysis and selection of alternatives contained in the User's Guide, developed in NCHRP Project 22-5A, provide a practical and realistic procedure to select those locations where the greatest benefits can be derived from the available resources. The procedure is designed to be used manually, but the step-by-step approach could be adapted to be part of a Highway Safety Management System.
REFERENCES
1. Stephens, L.B., A User's Guide to Gual'drail Wa"ants for Low Volume Roads, NCHRP 22-5A, April 1992 (Unpublished). 2. Roadside Design Guide, American Association of State Highway and Transportation Officials, Washington, DC, (1988).

84
3. FHWA Technical Advisory T7510.1, (June 30, 1988). 4. Designing Safer Roads. Transportation Research Board Special Report 214, (1987). 5. Guide for Selecting, Locating and Designing Traffic Barriers, AASHTO, (1987). 6.Cooper, P.,Analysis of Roadside Encroachments, B.C. Research Report, Transport Canada Contract No. T8080-9-4562, (March 1980).