guatemalans in boston - 2017
TRANSCRIPT
Guatemalans
in Boston
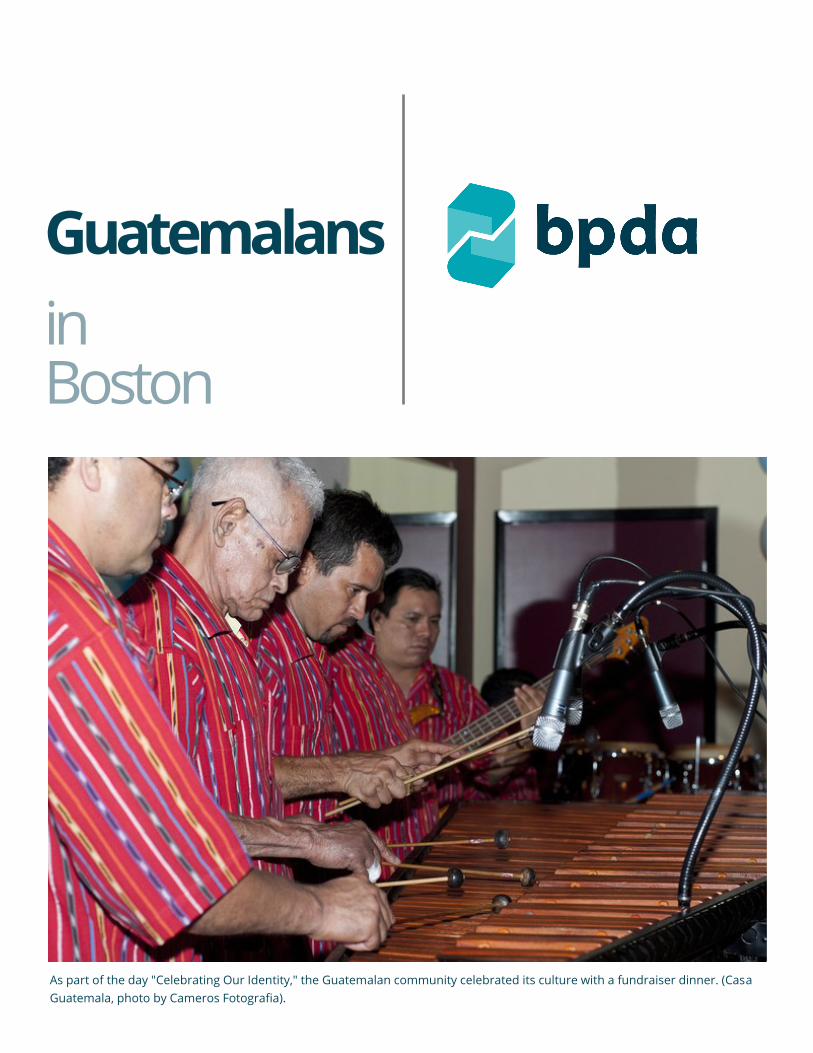
As part of the day "Celebrating Our Identity," the Guatemalan community celebrated its culture with a fundraiser dinner. (Casa
Guatemala, photo by Cameros Fotografia).
The Boston Planning & Development Agency
We strive to understand the current environment of the city to produce quality research and targeted
information that will inform and benefit the residents and businesses of Boston. Our Division conducts
research on Boston’s economy, population, and commercial markets for all departments of the BPDA,
the City of Boston, and related organizations.
The information provided in this report is the best available at the time of its publication. All or partial
use of this report must be cited.
Citation
Please cite this publication as: Boston Planning & Development Agency Research Division, April 2017
Information
For more information about research produced by the Boston Planning & Development Agency, please
see the BPDA Research website: http://www.bostonplans.org/research-maps/research/research-
publications
Requests
Research inquiries can be made through the BPDA research website: http://www.bostonplans.org/
research-maps/research/research-inquiries
Director Alvaro Lima Deputy Director Jonathan Lee Research Manager Christina Kim
Research Division
Senior Researcher Economist
Matthew Resseger
Senior Researcher Demographer
Phillip Granberry
Research Associate
Kevin Kang
Research Assistants
Kevin Wandrei
Avanti Krovi
Interns Ian Whitney Juan Rodriguez Cyan O’Garro
Data Notes
Unless otherwise noted data for this report come from the U.S. Census Bureau, 2011-2015 American Community Survey, Public Use Microdata Sample (PUMS), BPDA Research Division Analysis.
Percentages may not sum to 100% due to rounding.
“Latino” includes people who 1. self-describe their ethnicity as “Hispanic or Latino”, or 2. were born in Brazil, or 3. self-describe their ancestry as Brazilian.
3 | bostonplans.org
Even though Guatemalans migrated to the United States throughout the 20th century, their mi-
gration intensified in the 1980s and 1990s. Guatemala’s indigenous population, known as the
Maya Quiché, were the target of military repression and emigrated to the U.S. in the later years
of a decades-long civil war. The Maya Quiché population in Massachusetts can be found in
Southeastern Massachusetts around New Bedford. In Boston, the Guatemalan population is
more likely to be non-indigenous.
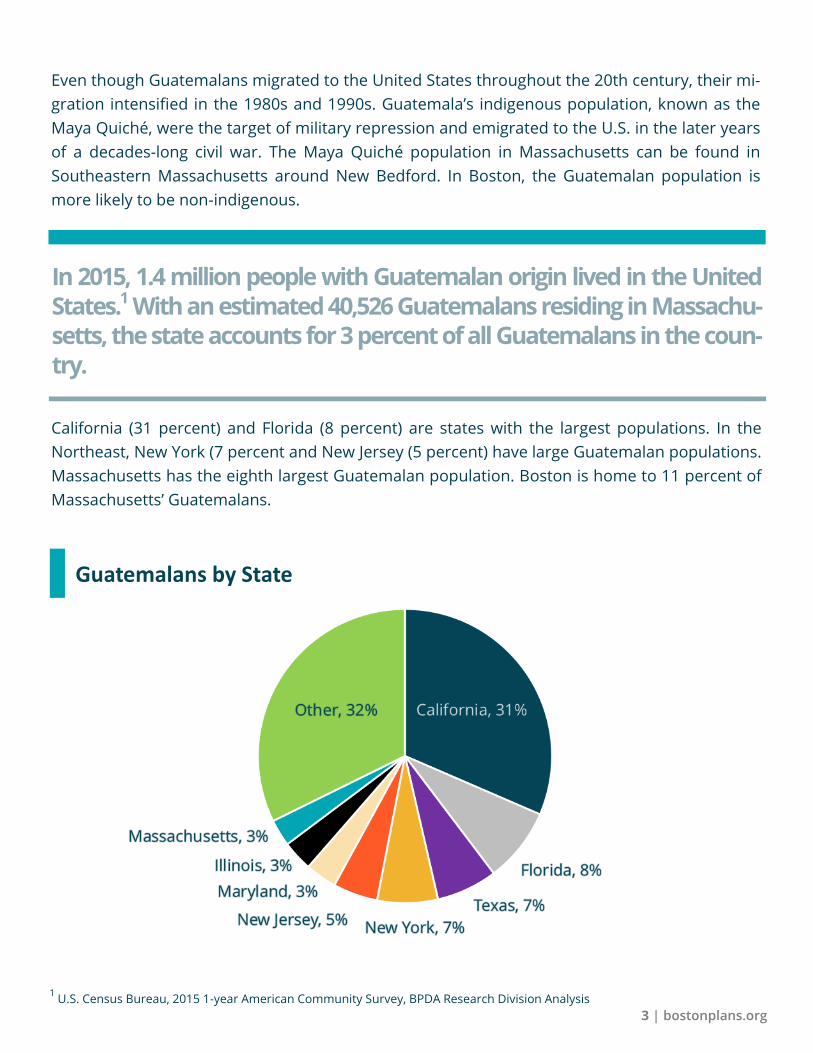
California (31 percent) and Florida (8 percent) are states with the largest populations. In the
Northeast, New York (7 percent and New Jersey (5 percent) have large Guatemalan populations.
Massachusetts has the eighth largest Guatemalan population. Boston is home to 11 percent of
Massachusetts’ Guatemalans.
Guatemalans by State
1 U.S. Census Bureau, 2015 1-year American Community Survey, BPDA Research Division Analysis
In 2015, 1.4 million people with Guatemalan origin lived in the United States.1 With an estimated 40,526 Guatemalans residing in Massachu-setts, the state accounts for 3 percent of all Guatemalans in the coun-try.
4 | Latinos In Boston
Guatemalans in Boston
According to the 2010 Census, Boston was home to 4,451 Guatemalans, up from 2,554 in the
2000 Census. The American Community Survey reports that the Guatemalan population of Bos-
ton Boston’s Guatemalan population in 2015 was about the same as in 2010. (4,435 +/-2,141).2
Guatemalans are the sixth largest Latino population in the city, accounting for 3 percent of Bos-
ton’s Latinos. Other larger Latino populations include Puerto Ricans (28 percent), Dominicans
(24 percent), Salvadorans (11 percent), Colombians (6 percent), and Mexicans (5 percent).
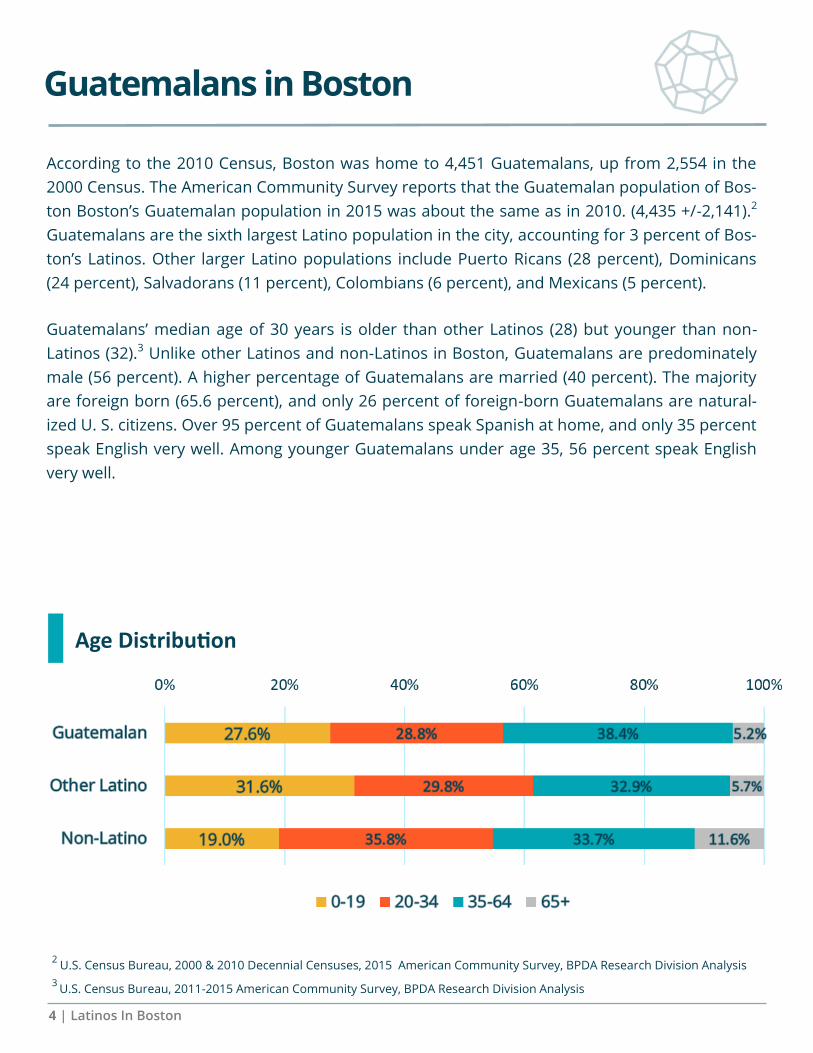
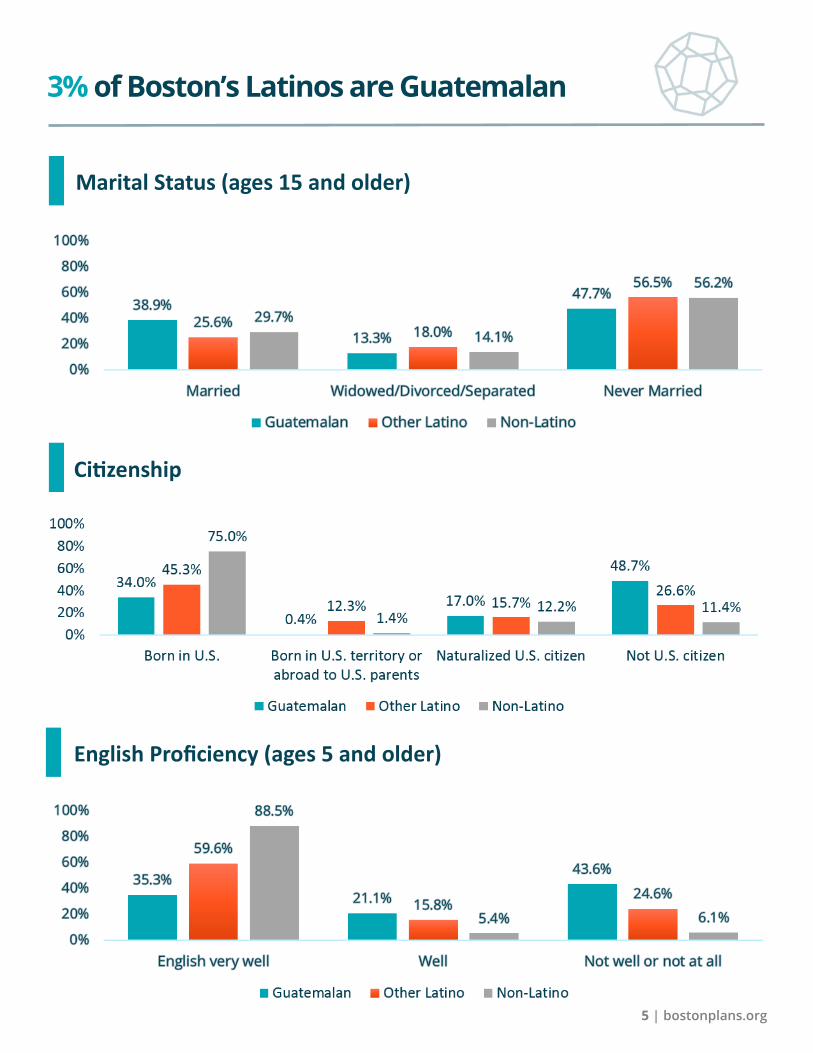
Guatemalans’ median age of 30 years is older than other Latinos (28) but younger than non-
Latinos (32).3 Unlike other Latinos and non-Latinos in Boston, Guatemalans are predominately
male (56 percent). A higher percentage of Guatemalans are married (40 percent). The majority
are foreign born (65.6 percent), and only 26 percent of foreign-born Guatemalans are natural-
ized U. S. citizens. Over 95 percent of Guatemalans speak Spanish at home, and only 35 percent
speak English very well. Among younger Guatemalans under age 35, 56 percent speak English
very well.
Age Distribution
2 U.S. Census Bureau, 2000 & 2010 Decennial Censuses, 2015 American Community Survey, BPDA Research Division Analysis
3 U.S. Census Bureau, 2011-2015 American Community Survey, BPDA Research Division Analysis
5 | bostonplans.org
Citizenship
English Proficiency (ages 5 and older)
Marital Status (ages 15 and older)
3% of Boston’s Latinos are Guatemalan
6 | Latinos In Boston
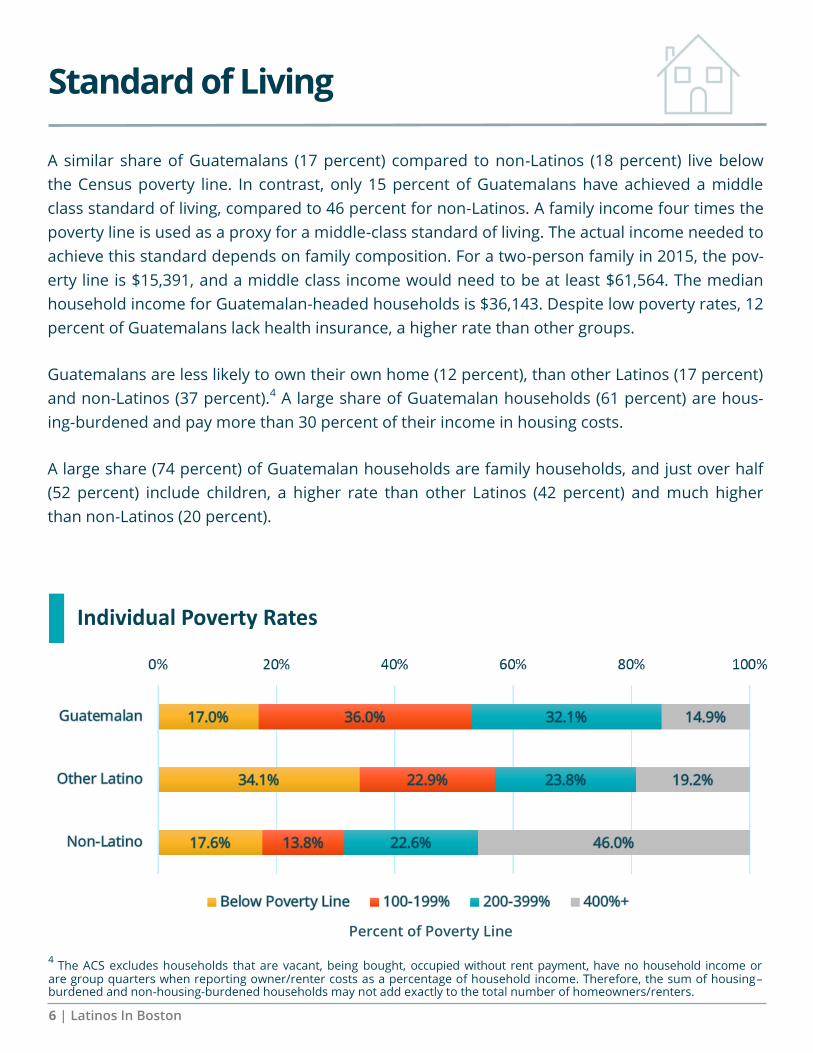
Standard of Living
A similar share of Guatemalans (17 percent) compared to non-Latinos (18 percent) live below
the Census poverty line. In contrast, only 15 percent of Guatemalans have achieved a middle
class standard of living, compared to 46 percent for non-Latinos. A family income four times the
poverty line is used as a proxy for a middle-class standard of living. The actual income needed to
achieve this standard depends on family composition. For a two-person family in 2015, the pov-
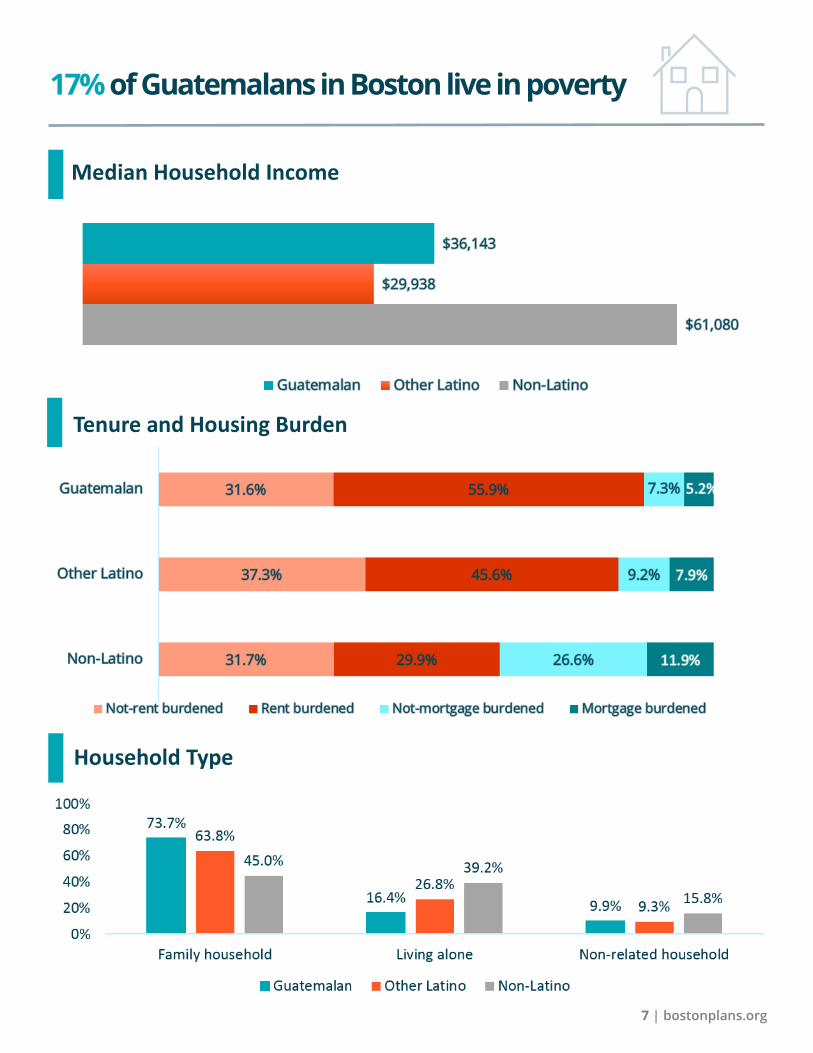
erty line is $15,391, and a middle class income would need to be at least $61,564. The median
household income for Guatemalan-headed households is $36,143. Despite low poverty rates, 12
percent of Guatemalans lack health insurance, a higher rate than other groups.
Guatemalans are less likely to own their own home (12 percent), than other Latinos (17 percent)
and non-Latinos (37 percent).4 A large share of Guatemalan households (61 percent) are hous-
ing-burdened and pay more than 30 percent of their income in housing costs.
A large share (74 percent) of Guatemalan households are family households, and just over half
(52 percent) include children, a higher rate than other Latinos (42 percent) and much higher
than non-Latinos (20 percent).
Individual Poverty Rates
Percent of Poverty Line
4 The ACS excludes households that are vacant, being bought, occupied without rent payment, have no household income or are group quarters when reporting owner/renter costs as a percentage of household income. Therefore, the sum of housing–burdened and non-housing-burdened households may not add exactly to the total number of homeowners/renters.
7 | bostonplans.org
17% of Guatemalans in Boston live in poverty
Tenure and Housing Burden
Median Household Income
Household Type
8 | Latinos In Boston
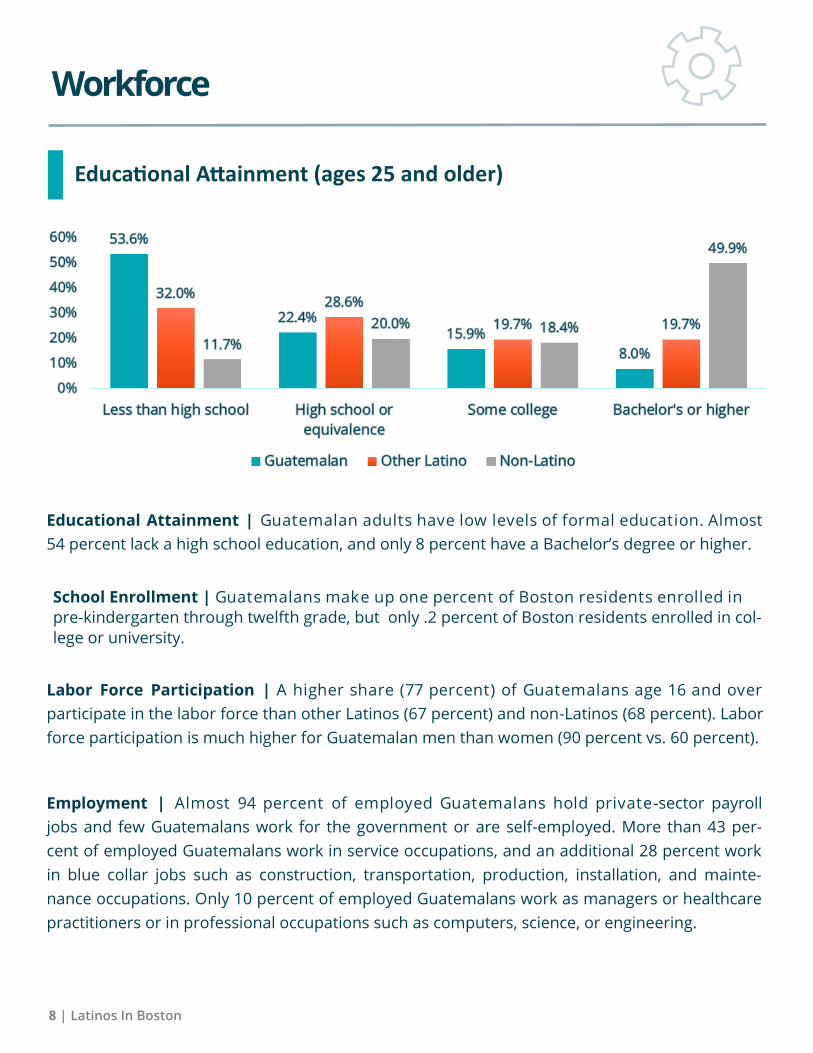
Workforce
Educational Attainment | Guatemalan adults have low levels of formal education. Almost
54 percent lack a high school education, and only 8 percent have a Bachelor’s degree or higher.
Educational Attainment (ages 25 and older)
Labor Force Participation | A higher share (77 percent) of Guatemalans age 16 and over
participate in the labor force than other Latinos (67 percent) and non-Latinos (68 percent). Labor
force participation is much higher for Guatemalan men than women (90 percent vs. 60 percent).
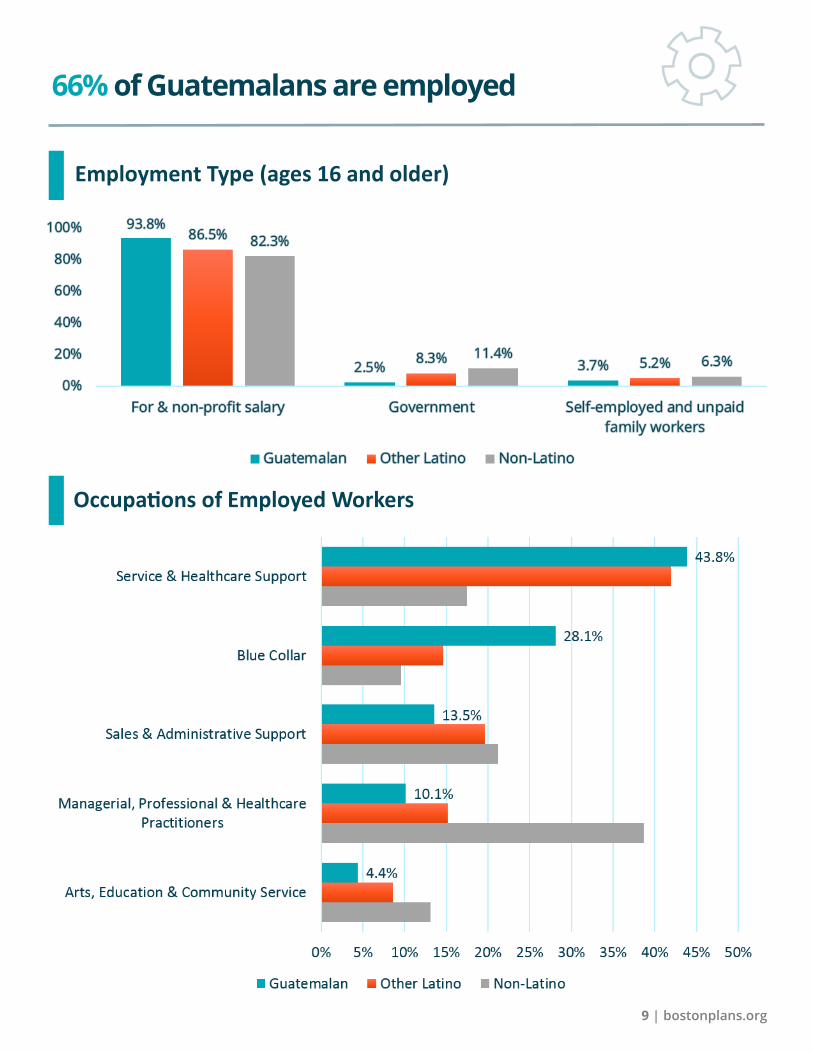
Employment | Almost 94 percent of employed Guatemalans hold private-sector payroll
jobs and few Guatemalans work for the government or are self-employed. More than 43 per-
cent of employed Guatemalans work in service occupations, and an additional 28 percent work
in blue collar jobs such as construction, transportation, production, installation, and mainte-
nance occupations. Only 10 percent of employed Guatemalans work as managers or healthcare
practitioners or in professional occupations such as computers, science, or engineering.
School Enrollment | Guatemalans make up one percent of Boston residents enrolled in
pre-kindergarten through twelfth grade, but only .2 percent of Boston residents enrolled in col-
lege or university.
9 | bostonplans.org
Occupations of Employed Workers
66% of Guatemalans are employed
Employment Type (ages 16 and older)
10 | Latinos In Boston
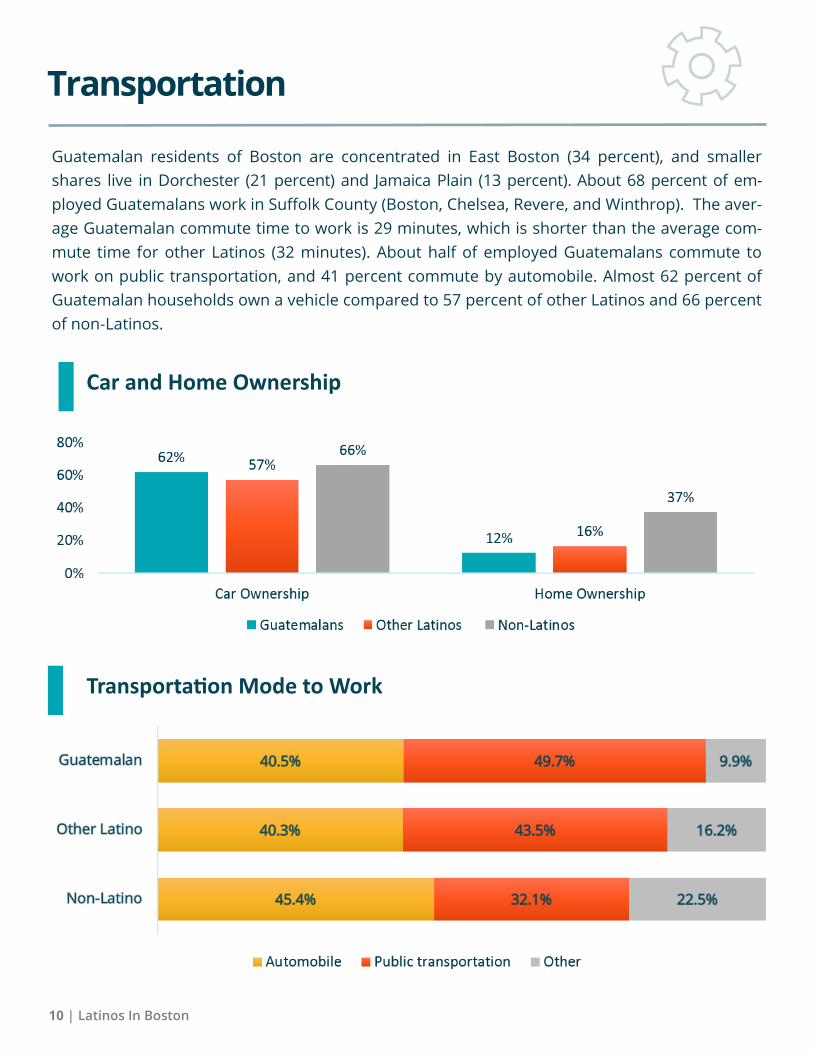
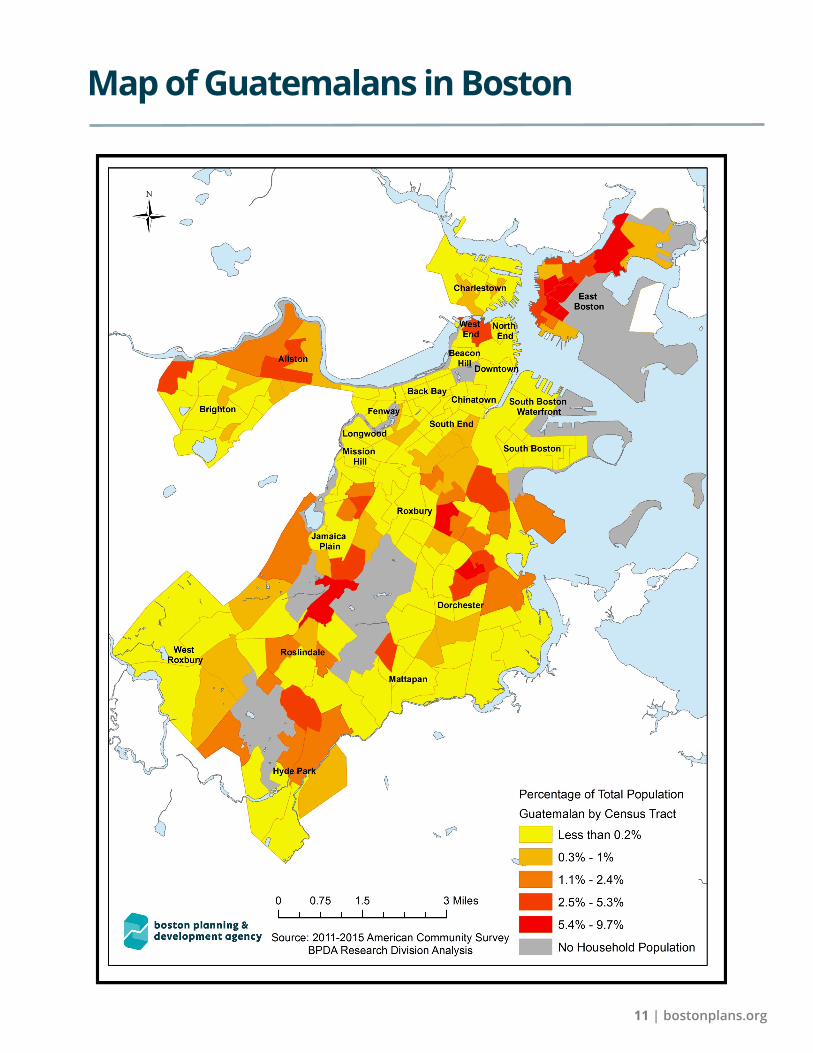
Guatemalan residents of Boston are concentrated in East Boston (34 percent), and smaller
shares live in Dorchester (21 percent) and Jamaica Plain (13 percent). About 68 percent of em-
ployed Guatemalans work in Suffolk County (Boston, Chelsea, Revere, and Winthrop). The aver-
age Guatemalan commute time to work is 29 minutes, which is shorter than the average com-
mute time for other Latinos (32 minutes). About half of employed Guatemalans commute to
work on public transportation, and 41 percent commute by automobile. Almost 62 percent of
Guatemalan households own a vehicle compared to 57 percent of other Latinos and 66 percent
of non-Latinos.
Transportation Mode to Work
Transportation
Car and Home Ownership
11 | bostonplans.org
Map of Guatemalans in Boston
Latinos in Boston
Puerto Ricans
Dominicans
Salvadorans
Colombians
Mexicans
Guatemalans
Brazilians
Research Division
June, 2017