guelb moghrein opper gold mine, inchiri, mauritania
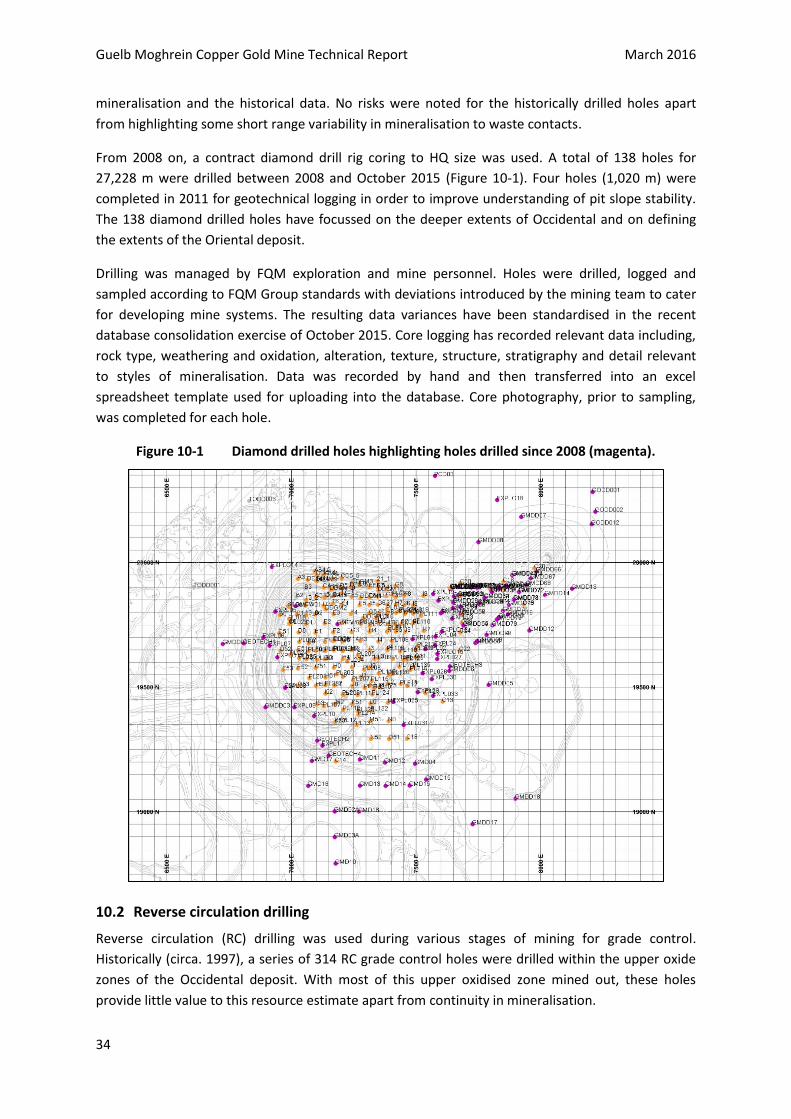
TRANSCRIPT

Guelb Moghrein Copper Gold Mine Technical Report March 2016
1
Guelb Moghrein Copper Gold Mine, Inchiri, Mauritania
NI 43-101 Technical Report
30th March 2016
David Gray BSc (Hons, Geology), MAusIMM, PrSciNat (SACNASP) (QP), FQM (Australia) Pty Ltd
Tony Cameron BEng (Min), Grad Dip Bus, M Comm Law, FAUSIMM, (QP), Cameron Mining Consulting Ltd
Andrew Briggs (QP) BSc(Eng), ARSM, FSAIMM, PEng(NAPEG), Group Consultant Metallurgist, FQM (Australia) Ltd

Guelb Moghrein Copper Gold Mine Technical Report March 2016
2
TABLE OF CONTENTS ITEM 1 SUMMARY ........................................................................................................ 9
Project Background ............................................................................................... 9 1.1
Property Location, Ownership and Approvals ...................................................... 9 1.2
Geology and Mineralisation .................................................................................. 9 1.3
Exploration Status ................................................................................................. 9 1.4
Mining and Production Status ............................................................................. 10 1.5
Mineral Resource Estimate ................................................................................. 10 1.6
Mineral Reserve Estimate ................................................................................... 11 1.7
Production Schedule ........................................................................................... 12 1.8
Processing ............................................................................................................ 13 1.9
Project Infrastructure .......................................................................................... 14 1.10
Environmental Status .......................................................................................... 14 1.11
Community and Social ......................................................................................... 14 1.12
Capital and Operating Cost Estimates ................................................................. 14 1.13
Economic Evaluation ........................................................................................... 14 1.14
Conclusions and Recommendations ................................................................... 15 1.15
ITEM 2 INTRODUCTION ............................................................................................... 18
Purpose of this Report ......................................................................................... 18 2.1
Terms of Reference ............................................................................................. 18 2.2
Qualified Persons and Authors ............................................................................ 18 2.3
Sources of Information ........................................................................................ 18 2.4
Personal Inspections ............................................................................................ 19 2.5
ITEM 3 RELIANCE ON OTHER EXPERTS ......................................................................... 20
ITEM 4 PROPERTY LOCATION, DESCRIPTION AND TENURE ........................................... 21
Project Ownership ............................................................................................... 21 4.1
Project Location and Description ........................................................................ 21 4.2
Tenure ................................................................................................................. 22 4.3
Rights and Surface Land Ownership .................................................................... 22 4.4
Royalties, Payments, Agreements ....................................................................... 23 4.5
Environmental Permitting and Liabilities ............................................................ 23 4.6
Potential Access and Exploitation Risks .............................................................. 23 4.7
ITEM 5 ACCESSIBILITY, CLIMATE, LOCAL RESOURCES, INFRASTRUCTURE & PHYSIOGRAPHY 24
Topography and Elevation ................................................................................... 24 5.1

Guelb Moghrein Copper Gold Mine Technical Report March 2016
3
Accessibility ......................................................................................................... 24 5.2
Climate ................................................................................................................. 24 5.3
Sufficiency of Surface Rights ............................................................................... 24 5.4
Infrastructure ...................................................................................................... 24 5.5
Availability of Power, Water and Personnel........................................................ 25 5.6
ITEM 6 HISTORY .......................................................................................................... 26
Prior Ownership................................................................................................... 26 6.1
Production History ............................................................................................... 26 6.2
Previous Mineral Resource Estimates ................................................................. 26 6.3
Production ........................................................................................................... 27 6.4
ITEM 7 GEOLOGICAL SETTING AND MINERALISATION .................................................. 28
Regional Geology ................................................................................................. 28 7.1
Local geology ....................................................................................................... 28 7.2
Mineralisation ..................................................................................................... 29 7.3
ITEM 8 DEPOSIT TYPE ................................................................................................. 30
ITEM 9 EXPLORATION ................................................................................................. 31
ITEM 10 DRILLING ......................................................................................................... 33
Diamond core drilling .......................................................................................... 33 10.1
Reverse circulation drilling .................................................................................. 34 10.2
Blast hole drilling ................................................................................................. 35 10.3
ITEM 11 SAMPLE PREPARATION, ANALYSES AND SECURITY ........................................... 36
Diamond drilled core sampling ........................................................................... 36 11.1
Reverse Circulation sampling .............................................................................. 37 11.2
Sample preparation and analysis ........................................................................ 37 11.3
Quality Assurance and Quality Control ............................................................... 38 11.4
ITEM 12 DATA VERIFICATION ........................................................................................ 42
ITEM 13 MINERAL PROCESSING AND METALLURGICAL TESTING .................................... 43
General ................................................................................................................ 43 13.1
Metallurgical Tests .............................................................................................. 43 13.2
Process Plant Design ............................................................................................ 43 13.3
Operational variations ......................................................................................... 44 13.4
ITEM 14 MINERAL RESOURCE ESTIMATES ...................................................................... 46
Introduction ......................................................................................................... 46 14.1
Geological and Mineralisation model ................................................................. 46 14.2
Guelb Moghrein Copper Gold Mine Technical Report March 2016
4
Available Data for Mineral Resource modelling .................................................. 49 14.3
Statistical Analysis ............................................................................................... 52 14.4
Boundary Analysis ............................................................................................... 54 14.5
Density Data ........................................................................................................ 55 14.6
Bivariate element relationships .......................................................................... 57 14.7
Top Cutting .......................................................................................................... 57 14.8
Variography ......................................................................................................... 57 14.9
Kriging Neighbourhood Analysis ......................................................................... 59 14.10
Block Model Setup and Limits ............................................................................. 60 14.11
Interpolation Parameters .................................................................................... 60 14.12
Post-processing by Localized Uniform Conditioning ........................................... 61 14.13
Background model............................................................................................... 62 14.14
Validation of Block Model Estimates ................................................................... 62 14.15
Mineral Resource Classification and Reporting................................................... 67 14.16
Mineral Resource Estimate Comparisons ........................................................... 70 14.17
ITEM 15 MINERAL RESERVE ESTIMATE .......................................................................... 71
Optimisation ........................................................................................................ 71 15.1
Marginal cut-off grades ....................................................................................... 73 15.2
Optimisation results ............................................................................................ 74 15.3
Pit Geotechnical and Design ................................................................................ 77 15.4
Mineral Reserve Estimate ................................................................................... 81 15.5
Life of Mine Production Schedule ....................................................................... 82 15.6
ITEM 16 MINING METHODS .......................................................................................... 83
Mining Methods .................................................................................................. 83 16.1
Mining Sequence ................................................................................................. 84 16.2
Mine Planning Considerations ............................................................................. 84 16.3
Mining and Processing Schedules ....................................................................... 85 16.4
ITEM 17 RECOVERY METHODS ...................................................................................... 86
Process Description ............................................................................................. 86 17.1
ITEM 18 PROJECT INFRASTRUCTURE ............................................................................. 90
Roads and Transport ........................................................................................... 90 18.1
Power................................................................................................................... 90 18.2
Water ................................................................................................................... 90 18.3
ITEM 19 MARKET STUDIES AND CONTRACTS ................................................................. 91
Guelb Moghrein Copper Gold Mine Technical Report March 2016
5
Contracts ............................................................................................................. 91 19.1
ITEM 20 ENVIRONMENTAL STUDIES, PERMITTING, SOCIAL AND COMMUNITY IMPACT .. 92
Approvals and Commitments .............................................................................. 92 20.1
Safety Performance ............................................................................................. 92 20.2
Social and Community Related Requirements .................................................... 93 20.3
Archaeology ......................................................................................................... 93 20.4
Mine Closure Provisions ...................................................................................... 93 20.5
Reclamation and Clean-up Activities ................................................................... 93 20.6
ITEM 21 CAPITAL AND OPERATING COSTS ..................................................................... 95
Capital Costs ........................................................................................................ 95 21.1
Operating Costs ................................................................................................... 95 21.2
ITEM 22 ECONOMIC ANALYSIS ...................................................................................... 97
ITEM 23 ADJACENT PROPERTIES ................................................................................... 99
ITEM 24 OTHER RELEVANT DATA AND INFORMATION ................................................. 100
ITEM 25 INTERPRETATIONS AND CONCLUSIONS .......................................................... 101
Mineral Resource Modelling and Estimation .................................................... 101 25.1
Mineral Reserve Estimation .............................................................................. 102 25.2
ITEM 26 RECOMMENDATIONS .................................................................................... 104
Geology and Mineral Resource estimation recommendations......................... 104 26.1
Mineral Reserve Estimation and Mining ........................................................... 104 26.2
Processing .......................................................................................................... 104 26.3
Environment ...................................................................................................... 104 26.4
Project Enhancement Studies ........................................................................... 105 26.5
ITEM 27 REFERENCES .................................................................................................. 106
ITEM 28 CERTIFICATES ................................................................................................ 107

Guelb Moghrein Copper Gold Mine Technical Report March 2016
6
TABLE OF FIGURES Figure 4-1 Location of Guelb Moghrein (after Bargman and Dominy, 2008) 21
Figure 7-1 A plan view of pit mapping illustrating key lithologies in relation to the FMC unit. 28
Figure 7-2 A plan view of the 3D volumes of mineralisation for the Occidental and Oriental
deposits of Guelb Moghrein 29
Figure 10-1 Diamond drilled holes highlighting holes drilled since 2008 (magenta). 34
Figure 10-2 RC drilled holes highlighting holes drilled since 2008 (dark green). 35
Figure 11-1 Recovery of diamond drilled core since 2008. 85% of drilled core had more than 90%
recovery. 37
Figure 11-2 A HARD plot of diamond drilled coarse crush duplicates illustrating good precision
results for copper analysis 38
Figure 11-3 A HARD plot of diamond drilled pulp duplicates illustrating good precision results for
copper analysis 39
Figure 11-4 A HARD plot of diamond drilled coarse crush duplicates illustrating moderate
precision results for gold analysis 39
Figure 11-5 A HARD plot of diamond drilled pulp duplicates illustrating reasonable precision
results for gold analysis 40
Figure 11-6 A QQ plot of twinned samples from pre and post 2008 drilling. Post 2008 drilled
samples were added for this resource estimate. 41
Figure 14-1 A vertical west to east cross section illustrating a mineralisation string envelope
snapped to the drillhole sample data. 47
Figure 14-2 A vertical section across Oriental mineralisation, highlighting elevated single acid
soluble copper (ASCUPCT) sample grades above the base of oxide (green string) with
sulphide mineralisation below. 48
Figure 14-3 A plan view of Guelb Moghrein mineralisation highlights distinct lens shaped domains
having thicker widths which were grouped into distinct fault blocks. 49
Figure 14-4 An oblique northerly 3D view of the prevailing surveyed topography used for
reporting the unmined Mineral Resources together with the available diamond drilled
holes (blue). 50
Figure 14-5 A plan view of the Guelb deposits and distribution of diamond and reverse circulation
drilled holes. 51
Figure 14-6 A log histogram and probability plot for Cu % in a key sulphide domain (421),
highlighting good distribution of values with minimal evidence for population mixing.
54
Figure 14-7 Copper grade profiles with increasing distance from the contact between respective
domains of ore and waste. 55
Figure 14-8 A histogram plot of all density data highlighting no outlier data and four key density
populations. 56
Figure 14-9 Variogram models for Domain 421 copper 59
Figure 14-10 Kriging neighbourhood analysis for domain 421 and highlighting optimal kriging
efficiency for the selected block size together with minimum and maximum number
of samples. 60
Figure 14-11 Vertical cross sections looking east and looking north illustrating good validation
between drillhole sample copper values and block copper estimates. 63

Guelb Moghrein Copper Gold Mine Technical Report March 2016
7
Figure 14-12 Grade and tonnage distribution of LUC (Blue) and OK (green) copper block estimates
for domain 121. 65
Figure 14-13 Validation slices comparing Domain 121 copper estimates and input data for easting,
northing and vertical directions. 66
Figure 14-14 A 3D plan view of the Mineral Resource classification. 67
Figure 14-15 A 3D plan view highlighting the 19,300m northing position (red line) where the
Mineral Resource (coloured blocks) was split for reporting at different cutoff grades.
68
Figure 15-1 Guelb optimisation results 74
Figure 15-2 Pit geotechnical domains 78
Figure 15-3 End of Month Survey – December 2015 79
Figure 15-4 Cut 2 Design 80
Figure 15-5 Guelb Ultimate Pit Design – December 2015 80
Figure 17-1 Flowsheet schematic 89
Guelb Moghrein Copper Gold Mine Technical Report March 2016
8
TABLE OF TABLES Table 1-1 March 2016 Guelb Moghrein Mineral Resource statement depleted of mined material
as at 31st December 2015 and using a CuEq cutoff of 0.5% for resources north of the
19,300m northing and a Cu cutoff of 0.5% for resources south of 19,300m northing. 11
Table 4-1 Coordinates of the 2C2 mining concession; UTM (Zone 28 North) .............................. 22
Table 6-1 Guelb Moghrein Mineral Resource estimate as per the March 2008 Technical Report.
Resources were reported using a Cu cutoff of 0.75%. .................................................. 27
Table 11-1 Diamond drillhole identities from which twinned samples were selected for
comparison ................................................................................................................... 40
Table 14-1 Guelb Moghrein mineralisation domains ..................................................................... 49
Table 14-2 Table of drillhole statistics per element of interest ...................................................... 51
Table 14-3 Summary statistics per metal and domain ................................................................... 53
Table 14-4 Summary of density measurement statistics per domain ............................................ 57
Table 14-5 Summary table of top cut values. ................................................................................. 57
Table 14-6 Variogram parameters per domain for copper............................................................. 58
Table 14-7 Mine coordinate system block model parameters – limits and dimensions ................ 60
Table 14-8 Copper, gold and arsenic estimate sample selection parameters per domain. The
second pass is 1.5 times the first search range and the third pass is 3 times the first
search range. ................................................................................................................. 61
Table 14-9 Validation of Parent block estimate with input composite data .................................. 64
Table 14-10 Mineral Resource north of the 19,300 m northing and depleted of mining as at 31
December 2015. A CuEq cut-off of 0.5% was used. ...................................................... 69
Table 14-11 Mineral Resource statement south of the 19,300 m northing and depleted of mining
as at 31 December 2015. A Cu cut-off of 0.5% was used. ............................................ 69
Table 14-12 Total Mineral Resource statement of combined cutoff areas and depleted of mining as
at 31 December 2015. A Cu cut-off of 0.5% was used for blocks south of the 19,300 m
northing and a CuEq cut-off of 0.5% was used for blocks north of the 19,300 m
northing. ........................................................................................................................ 69
Table 15-1 Overall pit slope angles for optimisation input............................................................. 71
Table 15-2 Metal recovery figures used for Pit Optimisation ......................................................... 72
Table 15-3 Metal cost parameters used for Pit Optimisation ........................................................ 73
Table 15-4 Marginal cut-off grades (indicative averages) .............................................................. 74
Table 15—5 Pit optimisation shell sizes and cashflow ...................................................................... 76
Table 15—6 Results of pit optimisation sensitivity analyses ........................................................... 77
Table 15—7 Updated Slope Design Guidelines (Turner, 2013) ......................................................... 78
Table 15—9 Guelb Moghrein Life-of-Mine Production Schedule ..................................................... 82
Table 16-2 Guelb Moghrein Life of Mine Schedule –December 31 2015 ....................................... 85
Table 22.1 Cash Flow Summary – Guelb Moghrein Project ........................................................... 97
Table 22.2 Sensitivity of Metal Prices and Operating Costs on Cashflow ...................................... 98

Guelb Moghrein Copper Gold Mine Technical Report March 2016
9
ITEM 1 SUMMARY
Project Background 1.1
This Technical Report on the Guelb Moghrein Mine (the Mine) has been prepared by Mr Tony
Cameron of Cameron Mining Consulting Ltd (CMC), and Messrs David Gray and Andrew Briggs of
First Quantum Minerals Ltd (the issuer or FQM or the Company) as Qualified Persons (QP’s) on
behalf of FQM. The QP’s have prepared this Technical Report to document updated Mineral
Resource and Mineral Reserve estimates, economic evaluations and supporting ancillary
documentation associated with FQM’s Guelb Moghrein mine in Mauritania, North West Africa.
This report and the resource/reserve estimates discussed therein represent the culmination of
results of a series of reviews and updates undertaken by FQM (the issuer) since mining startup in
April 2006.
This report supersedes the NI 43-101 Technical Report (previous TR) issued by FQM and dated
March 2008.
Property Location, Ownership and Approvals 1.2
The Guelb Moghrein copper-gold mine is 100% owned by Mauritanian Copper Mines (MCM), a
subsidiary of FQM. The mine is located 250 km northeast of the nation’s capital, Nouakchott, near
the town of Akjoujt. FQM acquired an 80% interest in the asset in 2004 and achieved commercial
production in 2006. In 2010, the Company increased its ownership in Guelb Moghrein to 100%.
In addition to the Guelb Moghrein mining concession of 81 km2, valid until 2042, the Company holds
five exploration concessions in the area totalling 5,581 km2 either directly through MCM or since
2011, through Mauritania Exploration SARL a wholly-owned entity.
Geology and Mineralisation 1.3
Guelb Moghrein mineralisation may be classed as a structurally modified iron ore copper gold (IOCG)
deposit that is hosted in a coarse grained ferro-magnesian carbonate (FMC) unit. Copper and gold
mineralisation is largely coincident with some evidence for elevated gold in the shallow mined out
upper zones. The main sulphide minerals are chalcopyrite and pyrrhotite with magnetite becoming
more abundant external to the sulphide bodies. The zones of mineralisation were strongly controlled
by tectonic shearing and faulting which resulted in topographic expressions of the deposit in the
form of two hills known as the Occidental and Oriental hills. Mineralisation below Occidental hill is
considerably larger than that at Oriental, and dips by about 20 degrees to the south with a strike
length close to 700 m and a dip extent of close to 1,000 m. The Occidental mineralised vertical width
varies according to structural controls and ranges from a few meters to several 10’s of metres. The
mineralisation below Oriental hill is limited to the shallow outcropping area of the hill and has an
ellipsoid shape with a strike length of around 250 m and a width of about 100 m.
Exploration Status 1.4
Exploration has been carried out on the Guelb deposit over several generations since the 1960s.
Since the previous TR, exploration completed by the issuer includes several campaigns focused on
targeting remaining mineralisation opportunities in the areas adjacent to Guelb. Exploration

Guelb Moghrein Copper Gold Mine Technical Report March 2016
10
personnel completed studies focussed on improving understanding about the geological controls of
Guelb Moghrein mineralisation. These findings were used to assist with targeting criteria. Infill and
extensional drilling, not classed as exploration, has been completed by the issuer across the Oriental
deposit and the deeper areas of the Occidental deposit. Results have sterilised these immediate
surrounds.
Mining and Production Status 1.5
Mining at Guelb Moghrein is carried out in a single open pit using hydraulic excavators and
mechanical drive haul trucks. Sulphide ore is treated in an adjacent processing plant producing a
copper-gold concentrate. During 2015 the plant produced approximately 17,000 tonnes of
concentrate per month at a grade of 22.5% Cu with credits received for gold in the concentrate.
Total production for the year was 45,001 tonnes of copper in concentrate with 47,322 oz of gold also
in the concentrate. A total of 27.5 Mt was mined 2015, made up of 3.8 Mt of ore and 23.7 Mt of
waste.
A magnetite plant was commissioned during first quarter of 2015. After successful commissioning,
operation of that plant was subsequently suspended due to low iron ore prices.
Mineral Resource Estimate 1.6
FQM has completed a Mineral Resource estimate (Table 1-1) update in March 2016 using the
available drillhole database, which included all diamond and reverse circulation drillhole sample
results together with an updated interpretation of the geological model relevant to the spatial
distribution of copper and gold mineralisation. Blast hole sample data was included in this estimate
for supporting the spatial distribution of mineralisation. Interpolation parameters were based upon
the geology, styles of mineralisation, drill hole spacing and geostatistical analysis of the data.
Mineral Resource estimates were classified according to geological continuity, QAQC, density data,
drillhole grid spacing, grade continuity and confidence in the panel grade estimate and have been
reported in accordance with the guidelines of the Australasian JORC Code (JORC, 2012), which in
turn complies with the Standards on Mineral Resources and Reserves of the Canadian Institute of
Mining, Metallurgy and Petroleum (the CIM Guidelines, 2014).

Guelb Moghrein Copper Gold Mine Technical Report March 2016
11
Table 1-1 March 2016 Guelb Moghrein Mineral Resource statement depleted of mined material as at 31st December 2015 and using a CuEq cutoff of 0.5% for resources north of the 19,300m northing and a Cu cutoff of 0.5% for resources south of 19,300m northing.
Material Classification Tonnes (Mt) Cu % Au g/t As % Cu t Au oz
Sulphide Measured 18.21 0.79 0.63 0.07 144,523 369,138
Sulphide Indicated 17.86 0.87 0.73 0.10 154,739 419,084
Measured & Indicated 36.07 0.83 0.68 0.09 299,262 788,222
Sulphide Inferred 0.63 0.88 0.66 0.11 5,598 13,496
Material Classification Tonnes (Mt) Cu % Au g/t As % Cu t Au oz
Oxide Measured 0.08 1.40 1.81 0.04 1,136 4,724
Oxide Indicated 7.42 0.86 0.73 0.10 63,622 174,239
Measured & Indicated 7.51 0.86 0.74 0.10 64,759 178,962
Oxide Inferred 1.76 0.72 2.41 0.18 12,625 136,889
Material Classification Tonnes (Mt) Cu % Au g/t As % Cu t Au oz
Total Measured & Indicated 43.57 0.84 0.69 0.09 364,021 967,184
Total Inferred 2.40 0.76 1.95 0.16 18,222 150,384
Measured and Indicated sulphide resources at Occidental, as relevant to the Mineral Reserves, were
compared to the previous estimate using the previous Cu cutoff grade of 0.5%. This resource update
has increased copper and gold metal available for mining due to a mineralised volume and density
increase of 6% each. Net tonnages increase by 12% with copper and gold grades also increasing. This
has supported this resource estimate, now being defined by a copper gold equivalent cutoff grade.
These changes have resulted from additional grade control drillhole data, improved geology
understanding, improved estimation methods and development of extensional opportunities.
As well as Occidental, this estimate update has incorporated further development of the adjacent
Oriental extension, which will continue to be the focus for further geological and economic
evaluation from 2016 onwards.
Currently, Guelb Moghrein’s mineralised volumes are still not closed off by drilling, suggesting
further potential for extensions, and hence mine life, from the planned infill and extensional drilling
of 2016.
Mineral Reserve Estimate 1.7
As at the 31st of December 2015, the Guelb Moghrein pit has 21.4 Mt of Mineral Reserve remaining.
This estimate uses the categories of Mineral Reserve estimates permitted under the CIM Guidelines,
2014, within the designed final pits based on Measured and Indicated Mineral Resources.
A further 1.9 Mt of ore is on the ROM stockpile and 6.6 Mt of Low Grade material is on the long term
stockpiles.
Guelb Moghrein Copper Gold Mine Technical Report March 2016
12
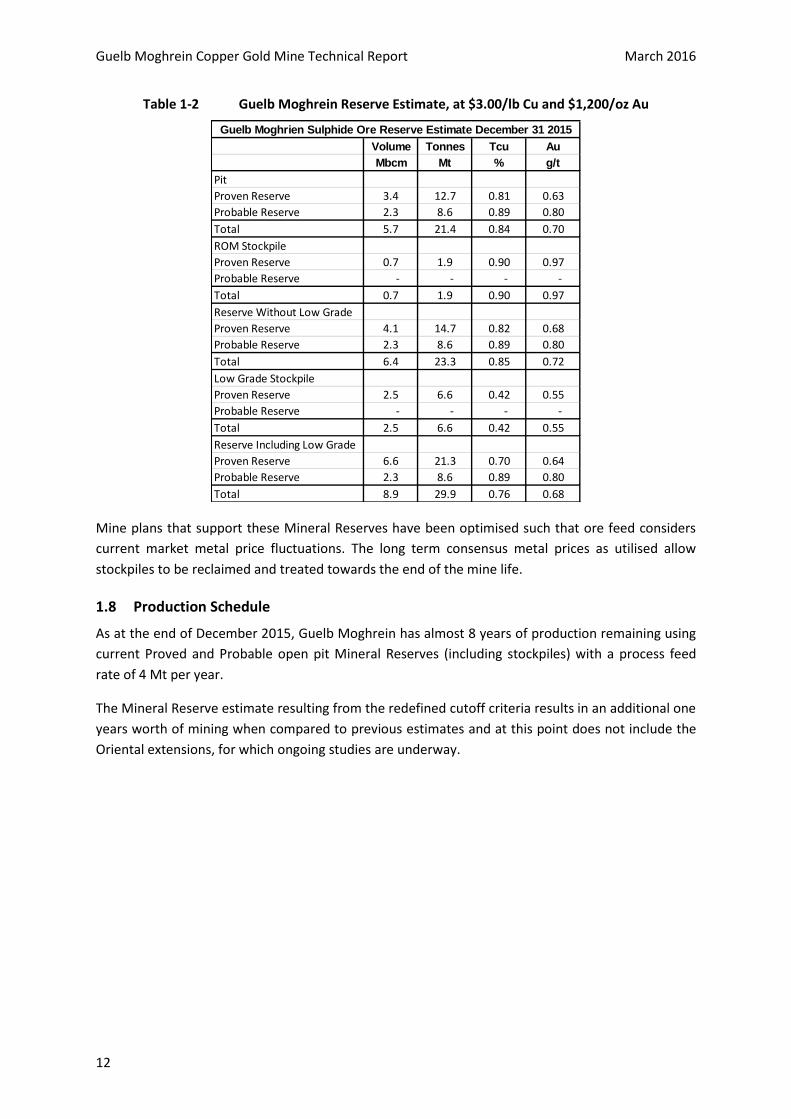
Table 1-2 Guelb Moghrein Reserve Estimate, at $3.00/lb Cu and $1,200/oz Au
Mine plans that support these Mineral Reserves have been optimised such that ore feed considers
current market metal price fluctuations. The long term consensus metal prices as utilised allow
stockpiles to be reclaimed and treated towards the end of the mine life.
Production Schedule 1.8
As at the end of December 2015, Guelb Moghrein has almost 8 years of production remaining using
current Proved and Probable open pit Mineral Reserves (including stockpiles) with a process feed
rate of 4 Mt per year.
The Mineral Reserve estimate resulting from the redefined cutoff criteria results in an additional one
years worth of mining when compared to previous estimates and at this point does not include the
Oriental extensions, for which ongoing studies are underway.
Volume Tonnes Tcu Au
Mbcm Mt % g/t
Pit
Proven Reserve 3.4 12.7 0.81 0.63
Probable Reserve 2.3 8.6 0.89 0.80
Total 5.7 21.4 0.84 0.70
ROM Stockpile
Proven Reserve 0.7 1.9 0.90 0.97
Probable Reserve - - - -
Total 0.7 1.9 0.90 0.97
Reserve Without Low Grade
Proven Reserve 4.1 14.7 0.82 0.68
Probable Reserve 2.3 8.6 0.89 0.80
Total 6.4 23.3 0.85 0.72
Low Grade Stockpile
Proven Reserve 2.5 6.6 0.42 0.55
Probable Reserve - - - -
Total 2.5 6.6 0.42 0.55
Reserve Including Low Grade
Proven Reserve 6.6 21.3 0.70 0.64
Probable Reserve 2.3 8.6 0.89 0.80
Total 8.9 29.9 0.76 0.68
Guelb Moghrien Sulphide Ore Reserve Estimate December 31 2015
Guelb Moghrein Copper Gold Mine Technical Report March 2016
13
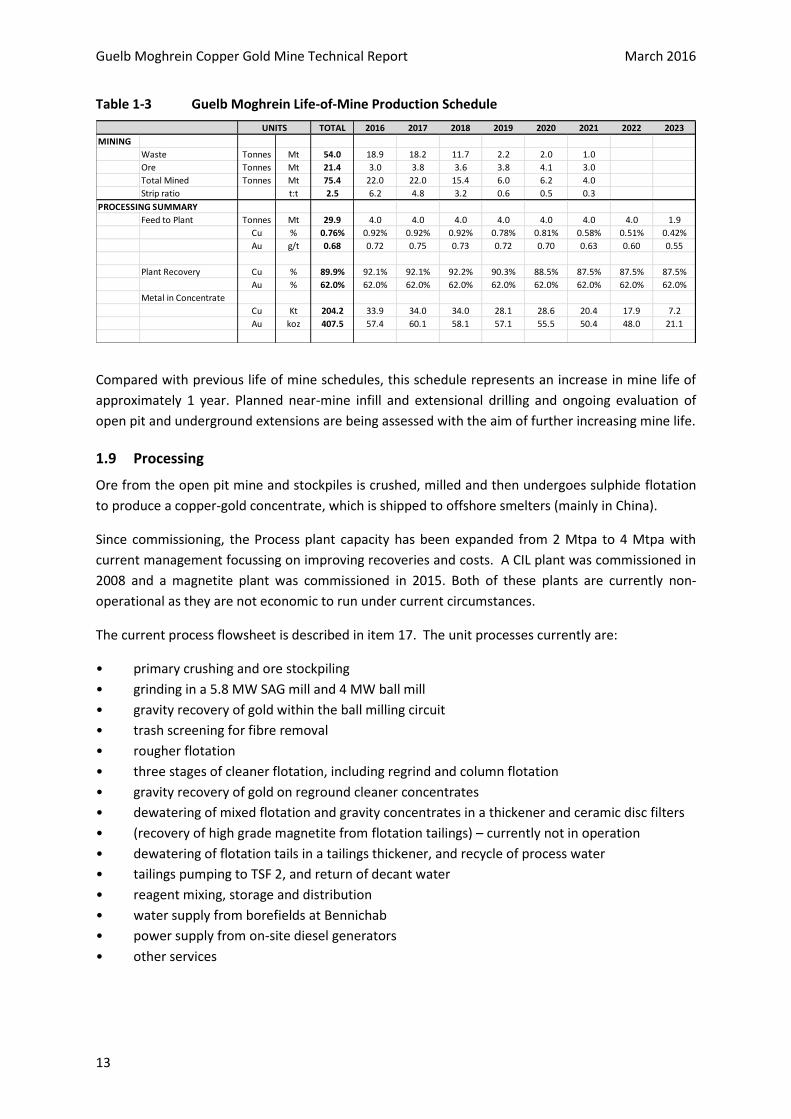
Table 1-3 Guelb Moghrein Life-of-Mine Production Schedule
Compared with previous life of mine schedules, this schedule represents an increase in mine life of
approximately 1 year. Planned near-mine infill and extensional drilling and ongoing evaluation of
open pit and underground extensions are being assessed with the aim of further increasing mine life.
Processing 1.9
Ore from the open pit mine and stockpiles is crushed, milled and then undergoes sulphide flotation
to produce a copper-gold concentrate, which is shipped to offshore smelters (mainly in China).
Since commissioning, the Process plant capacity has been expanded from 2 Mtpa to 4 Mtpa with
current management focussing on improving recoveries and costs. A CIL plant was commissioned in
2008 and a magnetite plant was commissioned in 2015. Both of these plants are currently non-
operational as they are not economic to run under current circumstances.
The current process flowsheet is described in item 17. The unit processes currently are:
• primary crushing and ore stockpiling
• grinding in a 5.8 MW SAG mill and 4 MW ball mill
• gravity recovery of gold within the ball milling circuit
• trash screening for fibre removal
• rougher flotation
• three stages of cleaner flotation, including regrind and column flotation
• gravity recovery of gold on reground cleaner concentrates
• dewatering of mixed flotation and gravity concentrates in a thickener and ceramic disc filters
• (recovery of high grade magnetite from flotation tailings) – currently not in operation
• dewatering of flotation tails in a tailings thickener, and recycle of process water
• tailings pumping to TSF 2, and return of decant water
• reagent mixing, storage and distribution
• water supply from borefields at Bennichab
• power supply from on-site diesel generators
• other services
TOTAL 2016 2017 2018 2019 2020 2021 2022 2023
MINING
Waste Tonnes Mt 54.0 18.9 18.2 11.7 2.2 2.0 1.0
Ore Tonnes Mt 21.4 3.0 3.8 3.6 3.8 4.1 3.0
Total Mined Tonnes Mt 75.4 22.0 22.0 15.4 6.0 6.2 4.0
Strip ratio t:t 2.5 6.2 4.8 3.2 0.6 0.5 0.3
PROCESSING SUMMARY
Feed to Plant Tonnes Mt 29.9 4.0 4.0 4.0 4.0 4.0 4.0 4.0 1.9
Cu % 0.76% 0.92% 0.92% 0.92% 0.78% 0.81% 0.58% 0.51% 0.42%
Au g/t 0.68 0.72 0.75 0.73 0.72 0.70 0.63 0.60 0.55
Plant Recovery Cu % 89.9% 92.1% 92.1% 92.2% 90.3% 88.5% 87.5% 87.5% 87.5%
Au % 62.0% 62.0% 62.0% 62.0% 62.0% 62.0% 62.0% 62.0% 62.0%
Metal in Concentrate
Cu Kt 204.2 33.9 34.0 34.0 28.1 28.6 20.4 17.9 7.2
Au koz 407.5 57.4 60.1 58.1 57.1 55.5 50.4 48.0 21.1
UNITS

Guelb Moghrein Copper Gold Mine Technical Report March 2016
14
Project Infrastructure 1.10
All infrastructure required by Geulb Moghrein is in place and has been successfully operating for
many years. These includes sealed access roads, security, power plant lines and transformers,
process plant, site offices, workshops, tailings dam, and waste storage facilities.
Environmental Status 1.11
MCM has submitted Environmental Impact Assessments to the authorities as required (the most
recent being in 2014) and is in compliance with all commitments made to date.
As part of the commitment to the environment, MCM have undertaken to clean up areas that were
left behind by previous owners. This includes: -
The Morak tailings dam and contaminated sub soil were removed and placed within the lined
CIL gold tailings storage facility. The Morak tailings footprint has since been rehabilitated with
indigenous vegetation;
Waste rock was dumped on the old TORCO tailings with the main objective being reduction of
dust pollution;
Significant non-hazardous and hazardous waste including scrap metal and hydrocarbons have
been removed from site and disposed of in accordance with acceptable standards.
Community and Social 1.12
The MCM team has developed good relationships with local communities as well as regional and
national authorities. MCM continues to pursue its aim to make its presence in the region an
opportunity for its host community and the country as whole. The Inchiry region is among the
poorest in the country and as well as providing employment opportunities, MCM is actively involved
in community development programs.
Capital and Operating Cost Estimates 1.13
The Guelb Moghrein copper mine has been operating for 10 years and there are no further major
capital expenditures planned at this point in time. Replacement of mining equipment and major
processing plant components have been incorporated into the operating costs used in mine planning
and cashflow models.
The operating costs listed in this report are based on actual costs from mining and processing
activities up to and including December 2015, and budget forecasts for 2016 onwards.
Economic Evaluation 1.14
Using the Reserves, the LOM Schedule, and the input parameters detailed in this report, the
undiscounted cashflow for the mine remains positive. Sensitivity analysis also confirmed that Guelb
Moghrein is profitable and robust. This supports using the copper gold equivalent grade as the basis
for reserve estimation.
Guelb Moghrein Copper Gold Mine Technical Report March 2016
15
Conclusions and Recommendations 1.15
Mineral Resource estimate 1.15.1
In respect of the Mineral Resource estimate, and on the opinion of David Gray (QP), the
classifications applied to the estimates of the Guelb Moghrein copper gold deposit accurately reflect
the confidences in the available sample data, the geological model and the resulting grade
estimates.
The understanding of close spaced geological and grade continuity has been improved by
considering in-pit geology exposures and the blast hole grade control drilled samples in developing
the mineralised volumes. In turn this has added confidence to definition of different domains of
mineralisation and the robustness of the resulting block estimates. The quality of the diamond and
reverse circulation data added since the previous TR has been assured through a sound program of
quality assurance and quality control (QAQC). No deviations or biases between these two data sets
were noted.
Inferred resource classification was limited to estimates located along the edges of mineralisation
having at least one drillhole intersection within 100 m.
Compared to the previous estimate, the 2016 Mineral Resource estimate has increased copper and
gold metal through increased grades and mineralised tonnages. This was guided by:
1. Additional diamond and reverse circulation drilling and sampling completed since the previous
TR estimate as infill and extension at Oriental and Occidental deeps
2. In-pit exposures and pit geology mapping of lithology and structure
3. Use of blast hole sample data for better definition of mineralised volumes
4. Improved understanding in geological and grade continuity has resulted in additional
mineralisation domains, which in turn allow for more robust variography and robust block
grade estimates
5. Improvement of estimation methods from improved geostatistics, block dimensions, sample
selection routines
Recommendations include:
Continue with planned infill and extensional drilling in the near pit and deeper extension areas
in order to improve confidence of Indicated Resources estimates and to develop
mineralisation extension opportunities including Oriental
Continue to improve upon QAQC routines for drilled samples
Develop the deposits 3D structural framework model for improved domaining and extensional
targeting
Metallurgical Testwork and Processing 1.15.2
With the operation currently at a mature stage the following areas for improvements are in
progress:
Alternative flotation reagent trials optimise pyrrhotite depression;
Additional Knelson by the Q3 2016;

Guelb Moghrein Copper Gold Mine Technical Report March 2016
16
Investigation into gravity concentrate processing options to produce bullion;
Testwork and subsequent plant trial is currently in progress to produce magnetite of high
quality that may be used for the dense media industry for cleaning of coal production – with a
significant price premium over standard magnetite pricing;
Investigation on additional column cell in the final cleaning state.
Geotechnical Engineering 1.15.3
Wall rock is competent and management systems are in place to monitor slope stability and to
periodically review new data. External geotechnical consultants are utilised to assist and advise the
MCM team.
Mineral Reserve Estimate 1.15.4
The data is adequate to support the Mineral Reserve estimates using the categories of Mineral
Reserve estimates permitted under NI 43-101 within the designed final pits and based upon
Measured and Indicated Resources only.
Recommendations include:
Continue to refine mine designs based on the results from ongoing grade control drilling,
reconciliation, and Resource model updates.
Monitor ore reconciliation to obtain data on the new model in relation to dilution and loss.
Update estimates if required.
Review the optimisation results for the Oriental deposit. Assess whether a sulphide only pit is
economically viable and should be added to the Reserve and LOM schedule.
Continue monitoring of pit slopes and using data so obtained to review design parameters. It
is noted that it may be possible to steepen some slopes and reduce waste stripping costs,
however, this needs to be evaluated carefully and weighed up against the risk of wall failure.
Mining 1.15.5
The mine footprint has expanded to the final pit limits and the final pushback is being developed in
order to maintain ore supply for the life of mine. Production targets are being met and MCM has
sufficient equipment on site to meet the future targets. The only issue in relation to mining is blast
performance. This has been found to be a product related issue and MCM is working with the
supplier to resolve the issue. With respect to slope stability, the wall rock is competent and
management systems are in place.
Recommendations include:
Consider replacing the explosives supplier if the current supplier cannot resolve the product
related issues.
Continue to follow geotechnical guidelines and monitor pit walls as per the management plan.
Environmental Compliance 1.15.6
The environmental compliance risk for Guelb Moghrein is considered to be low.

Guelb Moghrein Copper Gold Mine Technical Report March 2016
17
The Government of Mauritania has indemnified FQM and MCM from responsibility for any
environmental degradation or pollution caused by previous operators of the site. Nevertheless,
FQM has made a commitment to clean-up the mine site where it is practicable and viable.
Social Compliance 1.15.7
The MCM team has developed good relationships with local communities as well as regional and
national authorities. MCM continues to pursue its aim to make its presence in the region an
opportunity for its host community and the country as a whole. The Inchiry region is among the
poorest in the country, and as well as providing employment opportunities, MCM is actively involved
in community development programs.
Closure Plan 1.15.8
An independent Closure Plan was completed at the end of 2014. The Closure Plan included all
environmental liabilities and not only those associated with activities after the Company’s
acquisition of Guelb Moghrein in 2004.
Project Enhancement Studies 1.15.9
With near-mine infill and extensional drilling commencing in 2016, MCM is actively seeking to
extend the life of the Project. The primary aims are to further evaluate the Oriental deposit as well
as identify and assess open pit and underground opportunities (both as extensions to the current pit
or as satellite projects). A tailings retreatment project is also being investigated and is primarily
focussed on tailings from the early phases of mining and processing (i.e. prior to 2012).

Guelb Moghrein Copper Gold Mine Technical Report March 2016
18
ITEM 2 INTRODUCTION
Purpose of this Report 2.1
This Technical Report on Guelb Moghrein has been prepared by Qualified Persons, Tony Cameron of
Cameron Mining Consulting Ltd (CMC), David Gray of First Quantum Minerals Ltd (FQM), and
Andrew Briggs of First Quantum Minerals Ltd (FQM) for FQM.
The purpose of this Technical Report is to document updated Mineral Resource and Mineral Reserve
estimates for the Guelb Moghrein Mine, and to provide an updated commentary on the mining and
production status of the mine.
Terms of Reference 2.2
The Company has prepared this Technical Report to document updated Mineral Resource and
Mineral Reserve estimates, economic evaluations and supporting ancillary documentation
associated with the Guelb Moghrein site in Mauritania, North West Africa. The Technical Report
covers all mineralisation at the mine and has been written to comply with the reporting
requirements of the National Instrument 43-101: ‘Standards of Disclosure for Mineral Projects’ of
the Canadian Securities Administrators (the Instrument) and with the ‘guidelines of the Australasian
JORC Code (JORC, 2012), which in turn complies with the Standards on Mineral Resources and
Reserves of the Canadian Institute of Mining, Metallurgy and Petroleum (the CIM Guidelines, 2014).
This report and the resource and reserve estimates discussed therein represent the results of a
culmination of reviews and updates undertaken by FQM. This report supersedes the NI 43-101
Technical Report issued by FQM for Guelb Moghrein and dated March 2008 (Bargmann and Dominy,
2008).
The effective date for this Mineral Resource and Mineral Reserve estimate update is 31st March,
2016.
Qualified Persons and Authors 2.3
Name Position NI 43-101 Responsibility
David Gray Group Mine and Resource Geologist,
Author and Qualified Person
BSc (Geology), MAusIMM, PrSciNat(SACNASP) FQM (Australia) Pty Ltd Items 7 – 12, 14
Tony Cameron Consultant Mining Engineer, Author and Qualified Person
BEng Hons (Mining), MEngSc, FAusIMM Cameron Mining Consulting Ltd.
Items 1-6, 15 and 16, 18 to 28
Andrew Briggs Group Consulting Project Metallurgist
Author and Qualified Person
BSc(Eng), ARSM, FSAIMM, PEng (NAPEG) FQM (Australia) Ltd Items 13 and 17
Sources of Information 2.4
Geology and Mineral Resource sources of information are drilling logged and sample data, blast hole
sample data, in-pit geology mapping, as well as the relevant (current) information from the previous
Technical Reports on the property.
Guelb Moghrein Copper Gold Mine Technical Report March 2016
19
Personal Inspections 2.5
Authors David Gray, Tony Cameron and Andrew Briggs, each acting as a Qualified Person for this
Technical Report, have personally inspected the Guelb Moghrein site on several occasions since
2008, with the most recent visit by David Gray, being in November 2015.
Andrew Briggs, also a Qualified Person for this Technical Report, has visited site numerous times, the
last time being in mid 2014.

Guelb Moghrein Copper Gold Mine Technical Report March 2016
20
ITEM 3 RELIANCE ON OTHER EXPERTS
The authors of this Technical Report do not disclaim any responsibility for the content contained
herein.

Guelb Moghrein Copper Gold Mine Technical Report March 2016
21
ITEM 4 PROPERTY LOCATION, DESCRIPTION AND TENURE
Project Ownership 4.1
The Company currently holds a 100% interest in Guelb Moghrein through its subsidiary, MCM SA
(MCM). The Company held an 80% majority interest which it acquired in 2004 until the remaining
20% was acquired in February 2010 from GEMAK SA and General Gold Ltd.
Project Location and Description 4.2
Guelb Moghrein is located 250 km northeast of the nation’s capital, Nouakchott, near the town of
Akjoujt, and is accessible by paved highway (Figure 4-1). Akjoujt has a population of approximately
11,000 people.
Guelb Moghrein consists of an open pit copper and gold deposit located 141 m above sea level.
Mining started in April 2006, whilst commissioning of a copper flotation plant commenced in July
2006 and commercial production began in October 2006. A magnetite processing plant was
commissioned during the first quarter of 2015, but subsequently suspended due to prevailing low
iron ore process.
The mine provides its own diesel generated electric power. It has developed reliable sources of
fresh and saline water from a well field 120 km distant from the open pit. Guelb Moghrein has three
tailings management facilities; two of which are still operational for magnetite and magnetite-free
tailings.
Figure 4-1 Location of Guelb Moghrein (after Bargman and Dominy, 2008)
Guelb Moghrein Copper Gold Mine Technical Report March 2016
22
Tenure 4.3
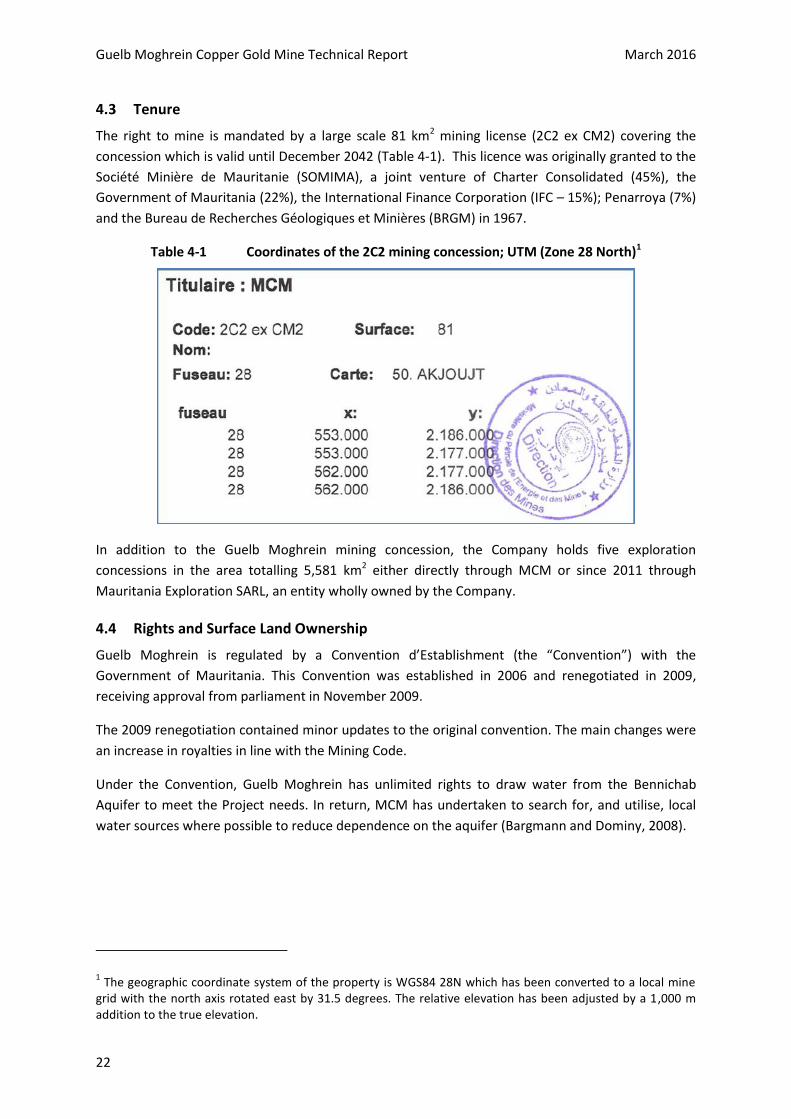
The right to mine is mandated by a large scale 81 km2 mining license (2C2 ex CM2) covering the
concession which is valid until December 2042 (Table 4-1). This licence was originally granted to the
Société Minière de Mauritanie (SOMIMA), a joint venture of Charter Consolidated (45%), the
Government of Mauritania (22%), the International Finance Corporation (IFC – 15%); Penarroya (7%)
and the Bureau de Recherches Géologiques et Minières (BRGM) in 1967.
Table 4-1 Coordinates of the 2C2 mining concession; UTM (Zone 28 North)1
In addition to the Guelb Moghrein mining concession, the Company holds five exploration
concessions in the area totalling 5,581 km2 either directly through MCM or since 2011 through
Mauritania Exploration SARL, an entity wholly owned by the Company.
Rights and Surface Land Ownership 4.4
Guelb Moghrein is regulated by a Convention d’Establishment (the “Convention”) with the
Government of Mauritania. This Convention was established in 2006 and renegotiated in 2009,
receiving approval from parliament in November 2009.
The 2009 renegotiation contained minor updates to the original convention. The main changes were
an increase in royalties in line with the Mining Code.
Under the Convention, Guelb Moghrein has unlimited rights to draw water from the Bennichab
Aquifer to meet the Project needs. In return, MCM has undertaken to search for, and utilise, local
water sources where possible to reduce dependence on the aquifer (Bargmann and Dominy, 2008).
1 The geographic coordinate system of the property is WGS84 28N which has been converted to a local mine
grid with the north axis rotated east by 31.5 degrees. The relative elevation has been adjusted by a 1,000 m addition to the true elevation.
Guelb Moghrein Copper Gold Mine Technical Report March 2016
23
Royalties, Payments, Agreements 4.5
A five year taxation relief period for MCM ended on February 20, 2012. The Company has since paid
tax on income at a rate of 25%. A mineral royalty of 3% copper and 4% gold on net sales is payable
quarterly.
Environmental Permitting and Liabilities 4.6
In November 2004, FQM acquired the Guelb Moghrein Mine. In a letter dated 22 August 2004 the
Government of Mauritania indemnified FQM and MCM from responsibility for any environmental
degradation or pollution caused by previous operators of the site. Despite the indemnity, FQM
made a commitment to clean-up the mine site where it was practicable and viable. Work to clean-
up and rehabilitate the legacy areas from previous owners is described in Item 0.
The most recent environmental impact study at Guelb Moghrein Mine assessed the impact of the
proposed magnetite circuit. The EIA was approved by the Mauritanian Government in June 2014.
Potential Access and Exploitation Risks 4.7
No significant factors and risks are known that may affect access, title, or the right or ability to
perform work on the property.
Guelb Moghrein Copper Gold Mine Technical Report March 2016
24
ITEM 5 ACCESSIBILITY, CLIMATE, LOCAL RESOURCES, INFRASTRUCTURE & PHYSIOGRAPHY
The following information is reproduced from the 2008 NI 43-101 Technical Report (Bargmann and
Dominy, 2008). The information remains relevant.
Topography and Elevation 5.1
The topography around the deposit forms a peneplain at around 130 m above sea level (1,130 m
elevation on the mine grid), with low hills further to the north. The siliceous gossan which marks the
outcrop of the deposit gives rise to two steep hills rising about 80 m and 90 m above the peneplain
(JICA, 2006).
Accessibility 5.2
The property is accessed via a 250 km paved road which connects the capital Nouakchott with the
town of Akjoujt. A 5 km gravel road connects Akjoujt with the mine site.
Nouakchott has an international airport with regular flights to Europe, and North and West Africa.
Port facilities are available at Nouakchott and Nouâdhibou, with the latter being the export facility
for Mauritania’s iron ore production.
Climate 5.3
The area is situated on the southwest fringe of the Sahara desert and has a desert climate. The
weather is generally hot and arid, with summer temperatures regularly exceeding 38°C (100°F)
during the day, but is made bearable by low humidity. Sandstorms occur throughout the year but
are less frequent during the summer and autumn.
Sufficiency of Surface Rights 5.4
There is more than adequate tenure area to support the location of mining waste dumps, process
tailings storage areas and the process plant site.
Infrastructure 5.5
The Guelb Moghrein mine has been in production since 2006. All infrastructure required is in place
and currently includes:
open pit mine
flotation processing facility
CIL tailings storage facility;
waste rock dump and ore stockpiles
mine workshops and administration building
two synchronised power generation stations
explosives mixing plant and storage facility
accommodation camp with messing facility
saline and potable water bore field at Bennichab, some 70Km away from the mine
water storage reservoirs at site
Guelb Moghrein Copper Gold Mine Technical Report March 2016
25
Availability of Power, Water and Personnel 5.6
The Guelb Moghrein mine has its own power station, using heavy fuel oil (HFO) as a fuel source.
Water is sourced from the Bennichab aquifer, 113 km to the southwest of the mine site. Water from
this source is also supplied to the town of Akjoujt.
Nationals personnel are recruited from throughout the country and from nearby Akjoujt. At the end
of 2015, Guelb Moghrein employed 1,082 persons directly and a further 355 contractors.

Guelb Moghrein Copper Gold Mine Technical Report March 2016
26
ITEM 6 HISTORY
Prior Ownership 6.1
Copper-made tools and arrowheads dating from approximately 4000 to 6000 BC have been found in
the Akjoujt area of Mauritania where Guelb Moghrein is located. Although exploitable quantities of
copper were recognized in the 1930s it was not until the 1950s when serious development plans
were undertaken. After the nation’s independence from France in 1960, companies such as Anglo
American Corporation attempted development of the Guelb Moghrein deposit.
In the 1970s an open pit was developed and a TORCO (a high temperature oxide roast operation)
commenced but had to close in 1977 due to technical difficulties and high fuel prices. The national
mining corporation, SNIM, through its subsidiary MORAK attempted to recover gold. In 1999, after
mining law reform, a Mauritanian chartered company (GEMAK) attempted to develop Guelb
Moghrein, but did not proceed beyond the production of a feasibility study in 1997.
In November 2004, the Company signed an asset sale agreement, the terms of which included a
series of payments totalling $10 million. Site establishment and construction commenced in March
2005. Guelb Moghrein achieved commercial production in October 2006.
Production History 6.2
Mining started in April 2006. Commissioning of the copper flotation plant commenced in July 2006
and commercial production began in October 2006. In October 2009, the mining rate was increased
to 3.8 million tonnes of ore per annum at a strip ratio of 3:1. The processing plant was further
upgraded during 2014 with the installation of a 5.8MW SAG Mill. The planned processing rate for
2015 was 4.0 million tonnes of ore per annum.
Previous Mineral Resource Estimates 6.3
Resources 6.3.1
For information, the previous Mineral Resource estimates were detailed in the NI 43-101 Technical
Report dated March 2008, and are restated in Table 6-1. At the time of reporting these Mineral
Resource estimates, FQM had been mining at Guelb Moghrein for two years. These Mineral
Resource estimates were determined and written to comply with the reporting requirements of the
National Instrument 43-101: ‘Standards of Disclosure for Mineral Projects’ of the Canadian
Securities Administrators (the Instrument) and in turn complies with the Standards on Mineral
Resources and Reserves of the Canadian Institute of Mining, Metallurgy and Petroleum (the CIM
Guidelines, 2005).
Guelb Moghrein Copper Gold Mine Technical Report March 2016
27
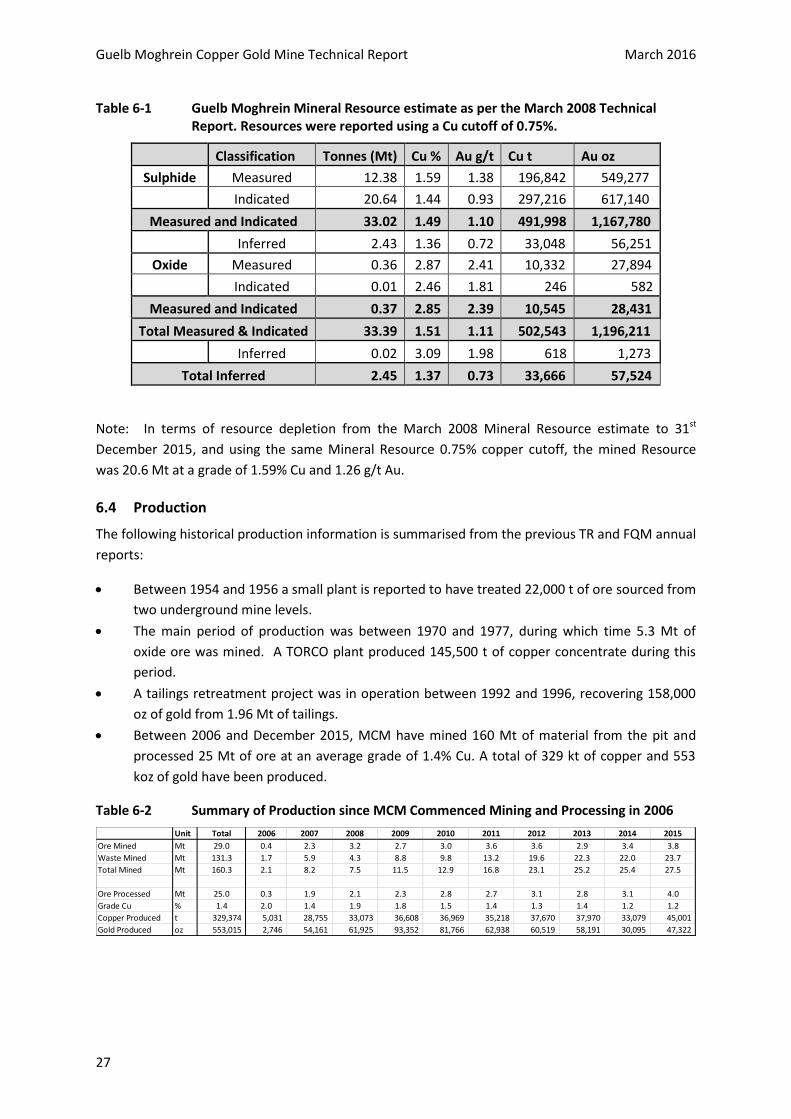
Table 6-1 Guelb Moghrein Mineral Resource estimate as per the March 2008 Technical Report. Resources were reported using a Cu cutoff of 0.75%.
Classification Tonnes (Mt) Cu % Au g/t Cu t Au oz
Sulphide Measured 12.38 1.59 1.38 196,842 549,277
Indicated 20.64 1.44 0.93 297,216 617,140
Measured and Indicated 33.02 1.49 1.10 491,998 1,167,780
Inferred 2.43 1.36 0.72 33,048 56,251
Oxide Measured 0.36 2.87 2.41 10,332 27,894
Indicated 0.01 2.46 1.81 246 582
Measured and Indicated 0.37 2.85 2.39 10,545 28,431
Total Measured & Indicated 33.39 1.51 1.11 502,543 1,196,211
Inferred 0.02 3.09 1.98 618 1,273
Total Inferred 2.45 1.37 0.73 33,666 57,524
Note: In terms of resource depletion from the March 2008 Mineral Resource estimate to 31st
December 2015, and using the same Mineral Resource 0.75% copper cutoff, the mined Resource
was 20.6 Mt at a grade of 1.59% Cu and 1.26 g/t Au.
Production 6.4
The following historical production information is summarised from the previous TR and FQM annual
reports:
Between 1954 and 1956 a small plant is reported to have treated 22,000 t of ore sourced from
two underground mine levels.
The main period of production was between 1970 and 1977, during which time 5.3 Mt of
oxide ore was mined. A TORCO plant produced 145,500 t of copper concentrate during this
period.
A tailings retreatment project was in operation between 1992 and 1996, recovering 158,000
oz of gold from 1.96 Mt of tailings.
Between 2006 and December 2015, MCM have mined 160 Mt of material from the pit and
processed 25 Mt of ore at an average grade of 1.4% Cu. A total of 329 kt of copper and 553
koz of gold have been produced.
Table 6-2 Summary of Production since MCM Commenced Mining and Processing in 2006
Unit Total 2006 2007 2008 2009 2010 2011 2012 2013 2014 2015
Ore Mined Mt 29.0 0.4 2.3 3.2 2.7 3.0 3.6 3.6 2.9 3.4 3.8
Waste Mined Mt 131.3 1.7 5.9 4.3 8.8 9.8 13.2 19.6 22.3 22.0 23.7
Total Mined Mt 160.3 2.1 8.2 7.5 11.5 12.9 16.8 23.1 25.2 25.4 27.5
Ore Processed Mt 25.0 0.3 1.9 2.1 2.3 2.8 2.7 3.1 2.8 3.1 4.0
Grade Cu % 1.4 2.0 1.4 1.9 1.8 1.5 1.4 1.3 1.4 1.2 1.2
Copper Produced t 329,374 5,031 28,755 33,073 36,608 36,969 35,218 37,670 37,970 33,079 45,001
Gold Produced oz 553,015 2,746 54,161 61,925 93,352 81,766 62,938 60,519 58,191 30,095 47,322

Guelb Moghrein Copper Gold Mine Technical Report March 2016
28
ITEM 7 GEOLOGICAL SETTING AND MINERALISATION
The geological setting and mineralisation has been detailed within the previous TR. The following is
an updated summary thereof.
Regional Geology 7.1
Guelb Moghrein is located within the Mauritanides Orogenic Belt which extends along the West
African coast from Senegal to Western Sahara. The Mauritanides are considered to be late
Proterozoic and the Akjoujt area lies within 30 km of the basal thrust that defines the eastern extent
of the Mauritanides. Within the Akjoujt area, the Mauritanides is characterised by a complex set of
thrust faulting resulting in several significant unconformaties affecting the local metabasalts and
metasediments (volcanics). The mineralised ferro-magnesian carbonates of Guelb Moghrein are
believed to be associated with some of the sediments and BIF layers of the Eizzene and
Oumanchoueima Groups.
Local geology 7.2
Guelb Moghrein’s Occidental and Oriental deposits are hosted in a ferro-magnesian carbonate unit
known as the FMC. The FMC unit is bound by thrust fault shearing, which in areas has stacked FMC
horizons, resulting in distinctly thicker FMC zones. Structurally this is considered to be part of the D3
structural event which is post mineralisation. The FMC unit has mostly meta-basalt either side of it
with mafic schists along the contacts. Further into the hangingwall of the FMC unit the meta-basalts
are overlain by mafic and felsic volcaniclastics (Figure 7-1). Metamorphic facies ranges from
amphibolite through to upper and lower greenschist facies which are commonly observed in the
meta-basalts mineral assemblages.
Figure 7-1 A plan view of pit mapping illustrating key lithologies in relation to the FMC unit.

Guelb Moghrein Copper Gold Mine Technical Report March 2016
29
Mineralisation 7.3
The FMC unit is the primary host of Guelb mineralisation and is comprised mainly of chalcopyrite
and pyrrhotite within the un-oxidised zone. Other minerals include iron-cobalt-nickel arsenides and
bismuth-gold-silver-tellurides. Gold is largely coincident and associated with chalcopyrite.
A shallow (<40 m) oxidised zone has resulted from surface weathering and oxidation of the deposits
primary sulphide mineralisation. Commonly, the oxidised zone has minerals such as native copper,
malachite, cuprite and chalcocite. Mineralisation of the carbonate units is suggested to be
hydrothermal and associated with the D2 deformation event, which was subsequently deformed by
faulting and thrusting of the D3 event. The siderite within the FMC is considered to have provided a
reactant for the hydrothermal Cu-Au bearing fluids. Sulphide mineralisation is often better
developed along the basal portions of the FMC and ranges from semi-massive to disseminated.
The topographic expression of the Guelb Moghrein mineralisation outcrops as two small hills of
notable FMC gossans. The two hills are known as Occidental and Oriental, below which
mineralisation is located as two distinctly different volumes. Occidental is characterised as a tabular
shaped body dipping to the south by approximately 20 degrees and has a strike length of 650 m and
dip extent of 1200 m. The width of Occidental mineralisation ranges from a few meters to 10’s of
meters. In contrast the Oriental deposit is much smaller and is restricted as an ellipsoid shaped body
immediately below the Oriental hill. Oriental has a strike length of 500 m and is approximately
200 m wide.
Figure 7-2 A plan view of the 3D volumes of mineralisation for the Occidental and Oriental deposits of Guelb Moghrein
The sulphide mineralisation at Occidental contains the bulk of Guelb Moghrein copper and gold
metal and is the still the focus of current mining activities.

Guelb Moghrein Copper Gold Mine Technical Report March 2016
30
ITEM 8 DEPOSIT TYPE
The Guelb Moghrein Occidental and Oriental deposits may be classed as structurally modified IOCG
deposits. Their diverse sulphide mineral assemblages are distinctive of IOCG deposits which are
believed to be the direct result of hydrothermal fluids that preferentially mineralised the iron rich
FMC carbonates. The deposits are believed to be structurally modified due to the apparent lack of
proximity to any contemporaneous igneous activity. Their association with iron rich carbonates
juxtaposed by post mineralisation deformation was a fundamental guide during the exploration
phase and continues to guide definition for control on the mineralised volumes. In-pit mapping and
continued 3D modelling of the Guelb Moghrein structural framework remains important to robust
delineation of mineralised volumes.

Guelb Moghrein Copper Gold Mine Technical Report March 2016
31
ITEM 9 EXPLORATION
Apart from sampling associated with ongoing drilling (detailed in Item 10), the following exploration
activities were conducted around Guelb Moghrein and its immediate surrounds by the issuer since
2008.
FQM conducted near mine exploration around Guelb Moghrein from 2008 to 2016 with the majority
of work conducted between 2009 and 2012. The exploration program targeted ferromagnesian
carbonate (FMC) hosted Cu-Au mineralisation, analogous to Guelb Moghrein, in a high strain portion
of the Oumachoueima Group rocks immediately adjacent to and along-strike from the mine.
Work included ground gravity and airborne gravity radiometry surveys with the intention of directly
detecting the dense FMC host rock as extensions to the deposit and in the surrounding district. The
survey clearly delineated the main Occidental and Oriental FMA lenses and identified several lower
tenor density anomalies in the district. The most prospective gravity targets were drill tested but
returned no significant mineralisation. In addition, several other geophysical studies were completed
including:
• Local ground magnetic surveys were completed over most geochemical and geophysical
targets, with the aim of better defining the geometry of magnetic FMC bodies.
• Ground magnetic and electrical resistivity surveys around the pit and mine infrastructure
areas in 2010 and 2015 have helped to interpret structures targeted for water bore
monitoring.
• Downhole EM at the El Joul prospect and around the pit in 2011 was trialled to locate
conductive mineralised FMC. Targets at the time were not compelling enough to drill.
• Petrophysical measurements on a selection of 39 core samples confirmed the high
conductivity and magnetic susceptibility of the ore and the FMC in general, but at the same
time returned much lower chargeability for ore samples than for barren FMC. The ore and
FMC do not have the highest seismic velocity Vp relative to all other rock units, although their
densities are far greater than any other units.
• Satellite aerial photographs (e.g. Worldview 2) have been acquired on an almost yearly basis
since 2009.
In addition, a 200 m to 500 m spaced multi-element soil geochemistry survey was conducted across
the extent of the Oumachoueima Group rocks surrounding the mine. The survey proved effective at
mapping geology and identifying anomalous concentrations of Cu, Au, As and other elements in the
soil. Numerous geochemical anomalies were identified and subsequently prioritised for drilling by
geological mapping and ground magnetic surveys. Drill testing of these anomalies returned only
minor grades of Cu-Au mineralisation in the bedrock.
Detailed geological mapping of the area surrounding the Guelb Moghrein Cu-Au deposit was
conducted at 1:2000 scale. The mapping identified critical ore-controlling structures and lithologies
and enhanced the understanding of the deposit. Subsequent drill-testing of these targets
demonstrated inconsistencies between the geology that is observed at surface and that which is
present in drill holes.

Guelb Moghrein Copper Gold Mine Technical Report March 2016
32
Pit-mapping and near-mine mapping together with re-logging of existing drill core has identified
several potential pit extensions which were investigated by drilling. Drilling at Oriental hill,
immediately east of Guelb Moghrein, demonstrated the presence of a large mineralised FMC body
which was largely oxidised. Several drill holes immediately adjacent to the pit walls effectively
closed-off the mineralisation to the east and west; to the north the mineralised FMC has been
eroded away or ‘skies-out’; and to the south the Cu and Au grades rapidly diminish with increasing
depth of the FMC.
A Reverse-Circulation lithogeochemistry drilling program involved the drilling of a 1000 m spaced
grid of holes to characterise the hydrothermal ‘footprint’ of the Guelb Moghrein deposit. The
program demonstrated that the deposit has a strong Cu-Au-As-W association. There is a strong
Albite halo (sodium enrichment) to the deposit in the order of 2-3 kilometres in extent.
Protocols for all exploration geochemical and drill hole sampling at Guelb Moghrein are carried out
in accordance with a detailed site procedure covering sampling methodology and QAQC. This
includes routine insertion of standards, blanks and duplicates with all laboratory submissions.
Samples are prepared on site under supervision of the independent laboratory services supplier,
before being despatched for analysis at the registered laboratory in Johannesburg or Vancouver.
Guelb Moghrein Copper Gold Mine Technical Report March 2016
33
ITEM 10 DRILLING
Since discovery, the Guelb Moghrein copper-gold deposit has been drilled using conventional
diamond and reverse circulation drilling methods. More recently, with mining, blast hole drilling has
added close spaced detail to the existing diamond and reverse circulation drilled grid. The overall
drilling approach has been to define ore body extents with follow-up infill drilling as required to
support geological detail, the rate of mining and prevailing mine design for defining Mineral
Reserves. The drill grid spacing ranges from around 5 m to 20 m in the active mining areas and is
between 70 m to 100 m in unmined Mineral Resource areas. This report focuses on the drillholes
drilled since the previous TR and that are within 1 km of the Guelb Moghrein deposits.
The reader is referred to the previous TR for details regarding drilling prior to 2008. Infill and
extensional drilling continued from 2008 by the issuer across the Guelb deposits. This drilling has
focussed on defining the Oriental deposit as well as for providing detail across the Occidental deep
areas.
The QP, David Gray, notes that all historical and recent drillhole data, including all grade control
drilling data has been consolidated (October 2015) into a single Guelb Moghrein SQL database which
uses DataShed software as a front end system. This consolidation process has focussed on ensuring
consistent data and format with improved security and quality of drillhole data as per FQM’s Group
standards. Verification and validation of historical data has taken place and old maps and plans were
utilised to verify the position of holes.
Pre-1990 (diamond drilling completed by SOMIMA), the downhole survey and source of collar survey
data were limited. Literature reviews identified that these holes were drilled vertically with
exception of C26 and C27 which were drilled at 70 degrees at Oriental hill. The updated database
reflects this information. In addition, the QC has verified that these collars match the topography
surface data and that geology and sampling data are aligned with surrounding holes. Diamond holes
drilled by MCM (between 2008 and 2013) across Oriental Hill used an inaccurate topography
elevation. These holes collar coordinates were correctly elevated to match the latest Oriental hill
surface survey data. Recent deeper vertical drilling has not detected significant downhole deviation.
This supports a low risk of incorrectly coordinated data for deeper vertically drilled historical holes
which had limited survey data. No other risks were noted apart from drillhole AB4.5, whose
mineralised intercept was deeper than surrounding holes and was removed from the data. Since
2008, downhole surveys were completed using the Reflex multi or single shot digital down-hole
instrument which recorded the hole’s dip, azimuth, temperature and magnetic susceptibility.
Measurements were taken approximately every 50 m down the hole and data was manually
transferred into an excel spreadsheet template for uploading into the database.
Diamond core drilling 10.1
Approximately 208 diamond holes were drilled from 1968 through to 2008 and were the subject of
the previous TR. Half of these holes were drilled between 1968 and 1973 by SOMIMA with the
remaining diamond holes drilled by GGI and MCM. Significantly, 8 holes were completed in 2006 by
MCM as a twin hole program used to verify historical (pre-1990) drilled results. These holes were
drilled across the extents of the Occidental mineralisation and therefore represent good coverage of
Guelb Moghrein Copper Gold Mine Technical Report March 2016
34
mineralisation and the historical data. No risks were noted for the historically drilled holes apart
from highlighting some short range variability in mineralisation to waste contacts.
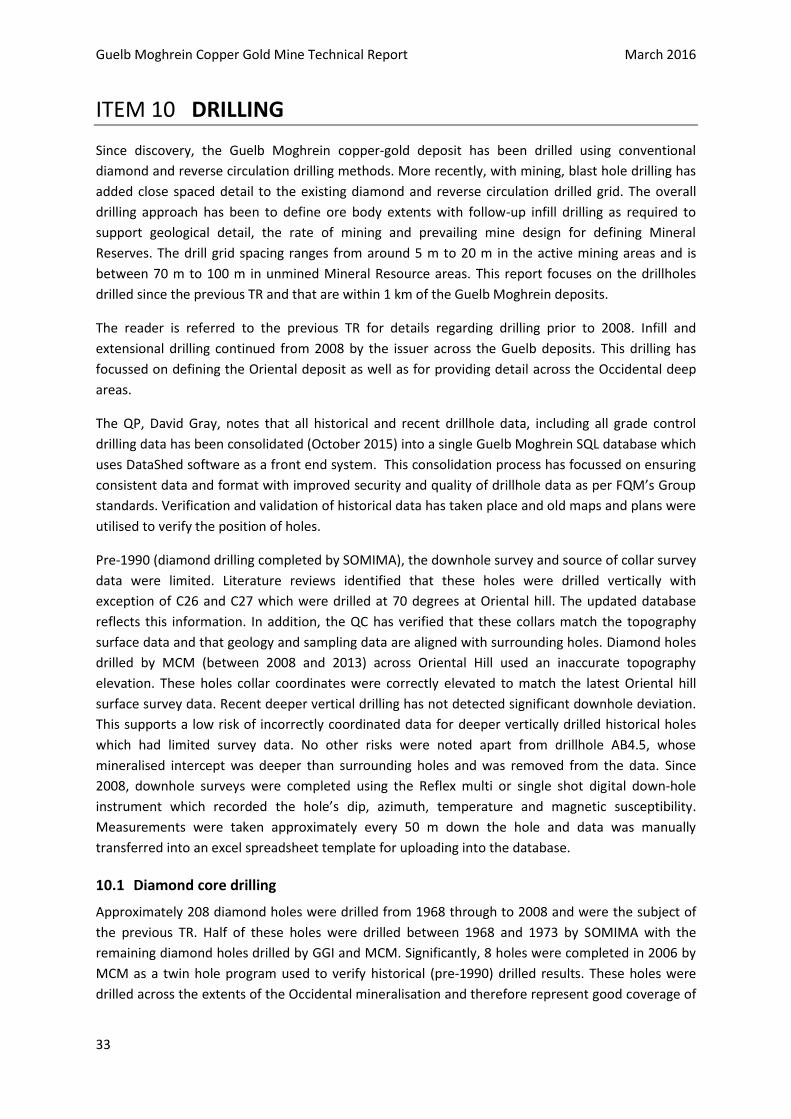
From 2008 on, a contract diamond drill rig coring to HQ size was used. A total of 138 holes for
27,228 m were drilled between 2008 and October 2015 (Figure 10-1). Four holes (1,020 m) were
completed in 2011 for geotechnical logging in order to improve understanding of pit slope stability.
The 138 diamond drilled holes have focussed on the deeper extents of Occidental and on defining
the extents of the Oriental deposit.
Drilling was managed by FQM exploration and mine personnel. Holes were drilled, logged and
sampled according to FQM Group standards with deviations introduced by the mining team to cater
for developing mine systems. The resulting data variances have been standardised in the recent
database consolidation exercise of October 2015. Core logging has recorded relevant data including,
rock type, weathering and oxidation, alteration, texture, structure, stratigraphy and detail relevant
to styles of mineralisation. Data was recorded by hand and then transferred into an excel
spreadsheet template used for uploading into the database. Core photography, prior to sampling,
was completed for each hole.
Figure 10-1 Diamond drilled holes highlighting holes drilled since 2008 (magenta).
Reverse circulation drilling 10.2
Reverse circulation (RC) drilling was used during various stages of mining for grade control.
Historically (circa. 1997), a series of 314 RC grade control holes were drilled within the upper oxide
zones of the Occidental deposit. With most of this upper oxidised zone mined out, these holes
provide little value to this resource estimate apart from continuity in mineralisation.
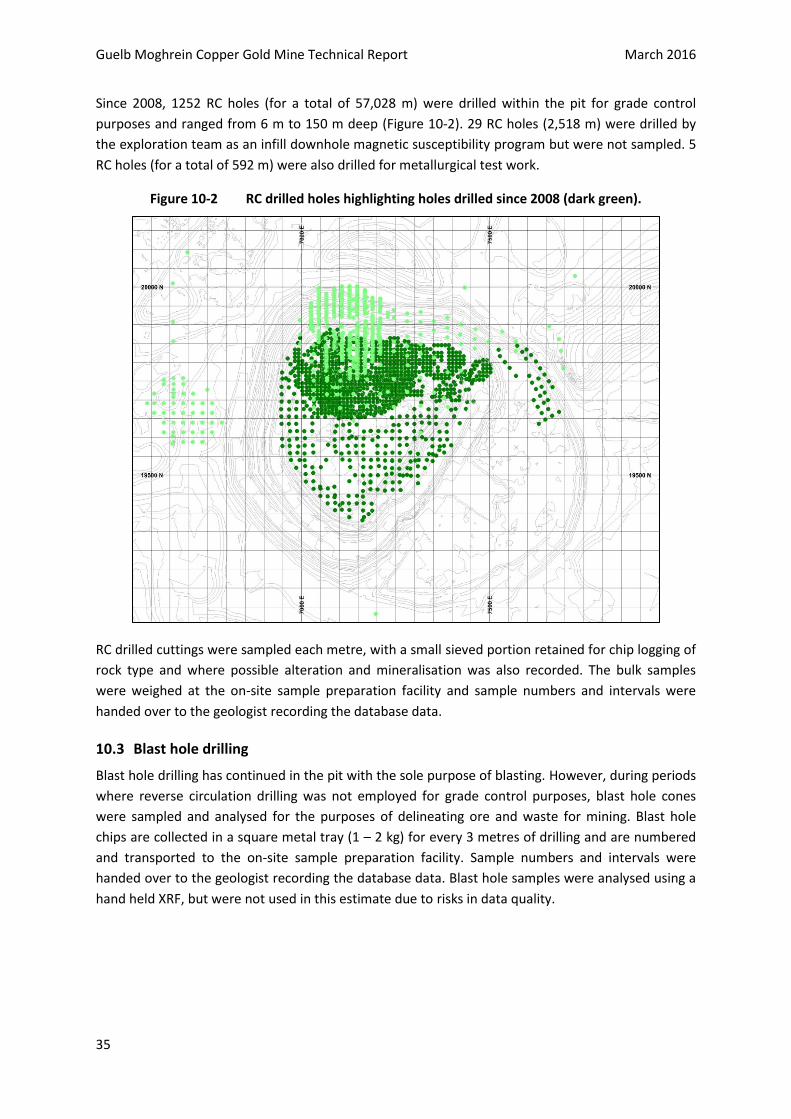
Guelb Moghrein Copper Gold Mine Technical Report March 2016
35
Since 2008, 1252 RC holes (for a total of 57,028 m) were drilled within the pit for grade control
purposes and ranged from 6 m to 150 m deep (Figure 10-2). 29 RC holes (2,518 m) were drilled by
the exploration team as an infill downhole magnetic susceptibility program but were not sampled. 5
RC holes (for a total of 592 m) were also drilled for metallurgical test work.
Figure 10-2 RC drilled holes highlighting holes drilled since 2008 (dark green).
RC drilled cuttings were sampled each metre, with a small sieved portion retained for chip logging of
rock type and where possible alteration and mineralisation was also recorded. The bulk samples
were weighed at the on-site sample preparation facility and sample numbers and intervals were
handed over to the geologist recording the database data.
Blast hole drilling 10.3
Blast hole drilling has continued in the pit with the sole purpose of blasting. However, during periods
where reverse circulation drilling was not employed for grade control purposes, blast hole cones
were sampled and analysed for the purposes of delineating ore and waste for mining. Blast hole
chips are collected in a square metal tray (1 – 2 kg) for every 3 metres of drilling and are numbered
and transported to the on-site sample preparation facility. Sample numbers and intervals were
handed over to the geologist recording the database data. Blast hole samples were analysed using a
hand held XRF, but were not used in this estimate due to risks in data quality.

Guelb Moghrein Copper Gold Mine Technical Report March 2016
36
ITEM 11 SAMPLE PREPARATION, ANALYSES AND SECURITY
The QP, Mr David Gray has investigated and verified the sample preparation, sample storage and
security practices during his recent site visit and through historical data review. The sampling
process was deemed appropriate for the analytical techniques employed. The respective laboratory
analytical techniques used for analyses of the prepared samples were similarly deemed as adequate
for the purposes of this Mineral Resource estimate. Database data, QAQC results, geostatistical
analysis and comparison of different generations of sample data highlighted very few risks to data
quality or the representative nature of sample results. The sample data was believed representative
of the prevailing styles of mineralisation and therefore suitable for use in this Mineral Resource
estimate update.
Sample preparation and analytical methods discussed herein relate to the drilling, sampling and
analysis since the previous TR. Sampling, analysis and security of results prior relevant to the
previous TR are summarised, but for a detailed description of sample preparation, analysis and
security pre-2008, the reader is referred to the previous TR.
Diamond drilled core sampling 11.1
Diamond drilling was completed with HQ sized core which was transported to the on-site
preparation facility where it was logged and marked out for sampling. Sample intervals were
generally between 0.4 m and 1.5 m with sampling across geological boundaries avoided. A diamond
saw cut line was marked on the core prior to cutting. This line used the core orientation line as a
guide and was offset by 2 cm to the right hand side looking down the hole. The left hand half core
containing the core orientation line was retained in the core tray for logging and reference purposes.
85% of drilled core had a recovery above 90% (Figure 11-1). Average core recovery was 93.3% with
poorer recoveries restricted to shallow weathered horizons. Core recovery is therefore deemed
appropriate and does not impact upon the representative nature of samples.

Guelb Moghrein Copper Gold Mine Technical Report March 2016
37
Figure 11-1 Recovery of diamond drilled core since 2008. 85% of drilled core had more than 90% recovery.
Reverse Circulation sampling 11.2
A bulk sample was collected at the RC drill rig by a mounted cyclone for every metre drilled. Samples
were collected in pre-labelled bags together with a permatag placed in each bag. Sampling started
from approximately 6 m down the hole and continued through the zone of mineralisation by an
additional 6 m. Hangingwall and footwall waste zones were often sampled using 2 m lengths.
Cyclone split samples were riffle split to reduce sample mass to between 2 – 4 kg and to ensure
samples were still representative. The occasional wet sample was allowed to dry prior to riffle
splitting.
Sample preparation and analysis 11.3
Samples were prepared at the on-mine ALS Chemex laboratory and preparation facilities. The cut
core and RC chip samples were oven dried and then crushed to P70 passing 2 mm. Crushed samples
were pulverised to P90 passing 75 μm. A pulp of 1 kg and 100 g for gold and copper were split
respectively and submitted for analysis. Prepared samples were sent to ALS Minerals laboratory in
Johannesburg, South Africa for analysis. The ALS Minerals laboratory in Johannesburg is an
internationally accredited ISO/IEC 17025:2005 laboratory and is entirely independent of the issuer.
Elements were analysed using a four acid digest followed by an ICP analysis or an AAS analysis. Gold
was analysed using AAS. Copper, arsenic, cobalt, silver, iron and sulphur were analysed using ICP. All
samples were analysed for copper, gold and arsenic. The Oriental samples were also analysed for
single acid soluble copper and cyanide soluble copper using an ICP instrument finish. Some samples,
having elevated copper grades were analysed for cobalt, silver, iron and sulphur. In addition, a

Guelb Moghrein Copper Gold Mine Technical Report March 2016
38
selection of samples, representing geological intervals, was measured for density using gravimetric
methods. Grade control blast hole samples were prepared on mine and were analysed using a hand
held Niton XRF or were sent off-site to SGS – Analabs laboratory in Kayes, Mali.
Quality Assurance and Quality Control 11.4
A comprehensive QAQC analysis was completed by CSA Global (UK) Ltd (CSA) in 2012. Results
highlighted that sample preparation and analysis may be accepted to be providing representative
results of the in-situ mineralisation. A degree of mis-labelling of standards and associated manual
data handling was noted, but not deemed as a risk to the representative nature of sample values.
For the sampling completed since the previous TR, standards or certified reference materials (CRM’s)
were inserted every 33rd sample. Duplicates and blanks were inserted for every 20th sample. Sample
bags were pre-numbered to include QAQC samples which ensured that QAQC inserts were blind to
the laboratory. QAQC blanks had limited to no evidence for contamination and standards, where
correctly labelled, suggest accurate results. Standard and blank deviations were noted and are most
likely due to mis-labeling.
Duplicate (field and pulp duplicates) results support good precision (Figure 11-2 and Figure 11-3) for
copper, but poorer precision for gold (Figure 11-4 and Figure 11-5) which is largely due to low
detection limit values and the fact that two different analytical techniques (4A_ICP and AAS) were
used. The lack of umpire duplicates is noted and recommended for any future infill or extensional
drilling.
Figure 11-2 A HARD plot of diamond drilled coarse crush duplicates illustrating good precision results for copper analysis

Guelb Moghrein Copper Gold Mine Technical Report March 2016
39
Figure 11-3 A HARD plot of diamond drilled pulp duplicates illustrating good precision results for copper analysis
Figure 11-4 A HARD plot of diamond drilled coarse crush duplicates illustrating moderate precision results for gold analysis

Guelb Moghrein Copper Gold Mine Technical Report March 2016
40
Figure 11-5 A HARD plot of diamond drilled pulp duplicates illustrating reasonable precision results for gold analysis
A comparison of the Cu grades from diamond and RC drilling completed before 2008 (Historic) and
after 2008 was undertaken to assess any evidence of material differences or potential biases
between these data sets. Aside from the 6 holes drilled for twinning in 2007, which were analysed
by Snowden in the previous TR, there is no other close spaced or twinhole drilling. As such a set of
“twinned” drilling data was prepared using the following approach:
The desurveyed Guelb drillhole file was clipped using the mineralisation wireframes to exclude
“waste” samples.
Samples with lengths less than 0.5 m or greater than 2 m were removed.
The PL series of twin drillholes completed in 2007 was excluded.
Samples with grades less than 0.08% Cu or greater than 5% Cu were excluded to focus on
mineralisation.
Data was flagged in terms of pre or post 2008 (Historic or FQM).
The post 2008 samples were formatted as a block model with each sample represented by 0.2
by 0.2 by 0.2 m block.
The historic drilling data was “estimated” into the FQM drilling block model using a nearest
neighbour approach and a search ellipse with the axis lengths of 50 m by 50 m by 2 m (X, Y and Z
directions respectively).
Samples were paired by block and the same search ellipse area. Cu grades from the two time periods
were checked visually to ensure the pairs of holes covered similar vertical extents. Resulting holes of
the selected twinned samples are listed in Table 11-1.
Table 11-1 Diamond drillhole identities from which twinned samples were selected for comparison
Company Hole numbers
Historic (Pre 2007) B0, C11, C12, C17, C51, G0, G51, H0, H2, H51, I2, J52,
FQM 2008 to 2013 EXPL02, EXPL033, EXPL05, EXPL29, META4RC, METD4RC, METE2RC, METF2RC
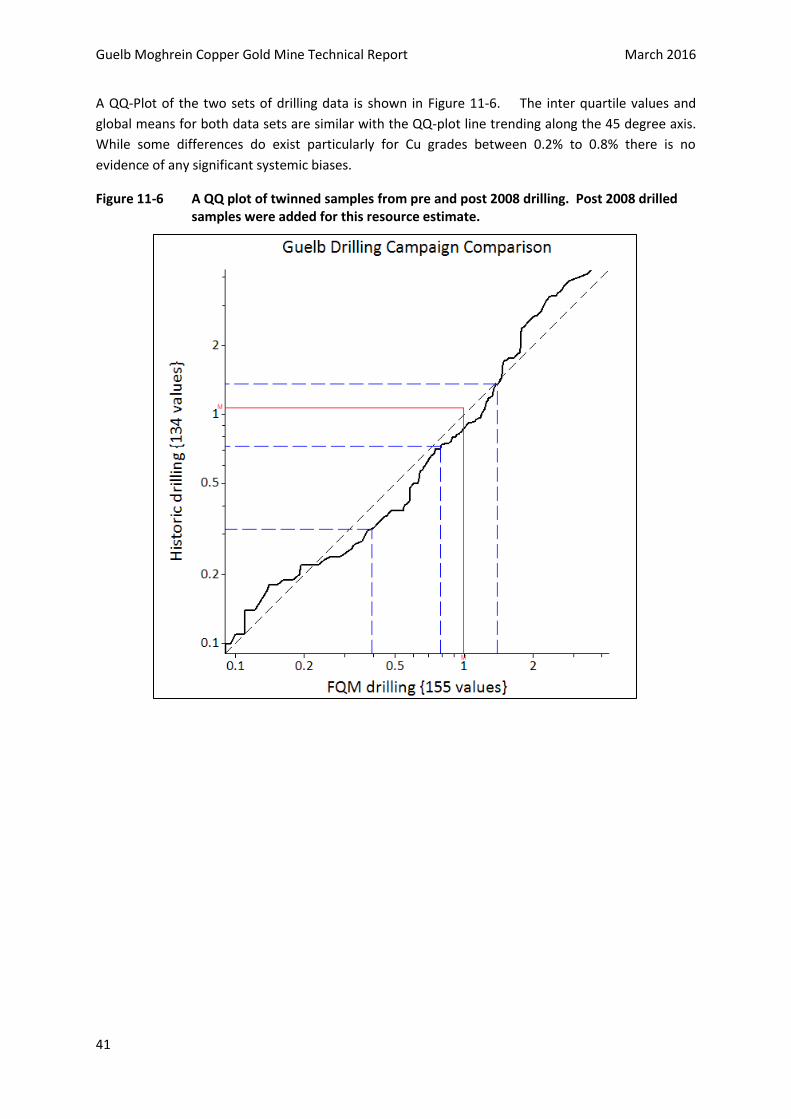
Guelb Moghrein Copper Gold Mine Technical Report March 2016
41
A QQ-Plot of the two sets of drilling data is shown in Figure 11-6. The inter quartile values and
global means for both data sets are similar with the QQ-plot line trending along the 45 degree axis.
While some differences do exist particularly for Cu grades between 0.2% to 0.8% there is no
evidence of any significant systemic biases.
Figure 11-6 A QQ plot of twinned samples from pre and post 2008 drilling. Post 2008 drilled samples were added for this resource estimate.
Guelb Moghrein Copper Gold Mine Technical Report March 2016
42
ITEM 12 DATA VERIFICATION
The Qualified Person, David Gray, visited Guelb Moghrein in November of 2015. During this visit and
subsequent studies including this resource estimate, the QP has gained good familiarity and
confidence in the available diamond and reverse circulation drillhole data, the geology models and
understanding of the prevailing mineralisation. Mr Gray believes the geological understanding and
data available for this Mineral Resource estimate update is of good quality and is representative of
the prevailing mineralisation relevant to the deposit.
In addition, the previous TR has documented several reviews (database data, QAQC, twin hole
drilling results and a coarse gold study) and verifications of the historical data. Findings of this work
supported the use of the historical data for Mineral Resource estimates.
Several verifications are hereby confirmed by David Gray.
1. Diamond and drillhole collar coordinates were verified through visual observation and digital
checks against database data and topography wireframe surfaces.
2. Sampling methods and data correspond to visual inspection of samples taken from stored
core and samples and are correctly represented against the original sample sheet records and
the stored database data.
3. QAQC data was investigated together with the process used for analysis and were verified as
robust for assuring assay accuracy, precision and controlling contamination.
4. In-pit observations served to verify the prevailing geology and its association with the
different styles of mineralisation as per the logged data and 3D geology models.
5. Reconciliation processes have developed since mining start-up. Reconciliation results and
final metal products have served to verify the accuracy of the Mineral Resource and Reserve
estimation process.
As an operating mine, reconciliation data supports results for the Mineral Resource, Mineral Reserve
and grade control models. It is the Qualified Person’s opinion that the data used for this Mineral
Resource estimate update is adequate for the purposes used in this technical report.

Guelb Moghrein Copper Gold Mine Technical Report March 2016
43
ITEM 13 MINERAL PROCESSING AND METALLURGICAL TESTING
General 13.1
The Guelb Moghrein plant was commissioned in October 2006 as a 2 Mtpa crushing and copper
floatation circuit. A gold carbon in leach (CIL) circuit including a regrind circuit were commissioned in
March 2008. The plant was expanded twice between 2009 and 2013 to the current 4 Mtpa process
capacity. A magnetite separation plant was also added in 2014. The cost of running the CIL plant
when compared to the additional gold recovery achieved were found to be too high and the iron ore
price dropped significantly in late 2014. Hence, currently the CIL and the Magnetite plants are not
being run.
Metallurgical Tests 13.2
Results from three sets of studies were used to assist the development of the flowsheet for the
current project, namely:
• Charter Consolidated Services Limited (Charter), 1973: included laboratory and pilot tests
carried out on both core and bulk samples of ore.
• KSLE, 1996-1997: included laboratory and pilot tests on both core and bulk samples of ore.
• IML, 2004: included a programme of comminution and flotation testing carried out in Perth.
Results of the mineralogical studies carried out as part of these tests were used by Snowden in the
2008 Technical Report and subsequently form the basis of the summary on Mineralogy in Item 7 of
this report. The metallurgical studies included comminution, flotation, gravity concentration,
leaching and solid/liquid separation testing.
Process Plant Design 13.3
Based on the results of previous metallurgical testing, MDM produced a proposed concentrator
design based on established technology. The process flowsheet consists of:
• crushing and ore stockpiling
• grinding
• flotation and gravity concentration
• cyanide leaching
• concentrate dewatering
• tailings discharge
• reagent mixing, storage and distribution
• water and power supply
• other services.
Some of the key design parameters that were used for production planning and cost estimation
during the feasibility phase are summarised below:
• a plant capacity of 2.0 Mtpa was selected
• mill availability of 91.3%, equating to a mill feed rate of 250 t/h;
Guelb Moghrein Copper Gold Mine Technical Report March 2016
44
• average feed grades of 1.82% Cu and 1.43 g/t Au;
• maximum design feed grades of 2.17% Cu and 2.19 g/t Au;
• minimum concentrate grade of 25% Cu;
• 85% copper recovery at an average feed grade of 1.82% Cu;
• 60% recovery of gold by flotation;
• an additional 15% of gold to be recovered by leaching of cleaner scavenger tailings and gravity
concentrate obtained from the flotation tailings;
• Details of the plant design, production forecasts, and cost estimates are given in the Project
Engineering Report referred to above (MDM, 2004).
Operational variations 13.4
As the project has matured there have been improvements in operation along with further changes
in the feed characteristics. By the end of 2015 the various operation parameters detailed above
which are summarised below;
• The average feed grade for Au is 0.84 g/t and is approximately on a 0.7:1 ratio with the Cu
grade with the Cu grade at approximately 1.22% Cu;
• The optimal Cu concentrate grade is 22.5% however in practice this figure is in a range
between 21.5% – 22.5%;
• Cu recovery is averaging 91.7%;
• Overall Au recovery is averaging 60% with approximately 44% recovery from flotation and 16%
from gravity.
To improve the overall gold recovery changes to the circuit have seen the introduction of a 48 inch
Knelson centrifugal concentrator in the ball mill grinding circuit along with two Falcon centrifugal
concentrators in the vertimill regrind circuit. In 2014 the installation of a new SAG Mill has seen the
throughput increase from approximately 375tph to approximately 500tph during which time there
was also a slight decrease in the feed grade. However, due to addition of a column cell to
supplement the final cleaner and produce final concentrate it has been possible to maintain overall
Cu recovery. This has been achieved by optimisation of various flotation reagents and minor changes
to the flotation circuit/operating philosophy. Namely, the changing from running the rougher
flotation bank previously in closed circuit to operating them in open circuit with the tailings going to
final tails along with the scavenger tailings.
The results of a recent gold deportment analysis are summarised in the following points:
99.5% of the gold occurs as discrete mineral phases.
Electrum carries 91.7% of the Au.
The remaining phases included Ag-Te that may contain low levels of Au, Au, Te (most likely
sylvanite), Au-Bi (most likely maldonite) and native, Au.
Only 0.5% of the Au is present in solid solution in arsenopyrite and cobaltite. No Au occurs in
solid solution in chalcopyrite or cubanite.
Guelb Moghrein Copper Gold Mine Technical Report March 2016
45
The Au distribution by size is bimodal occurring as fine inclusions much less than 10µm or as
discrete grains of electrum measuring ~25-40µm.
The 32.5% of the Au occurring as fine inclusions are distributed as follows:
o 19.6% of the Au occurs in magnetite,
o 7.8% of the Au occurs in sulphides (chalcopyrite, pyrrhotite, arsenopyrite, cobaltite)
o 5.1% of the Au occurs in carbonates.
o The 67.5% Au occurring as ~25-40µm grains of electrum is either liberated or locked
with arsenopyrite and cobaltite.
Au that can be targeted for recovery with gravity and flotation includes the 67.5% occurring as
~25-40µm grains of electrum and most of the 7.8% of the Au that occurs with sulphides totalling
approximately 75%.
Conclusions 13.4.1
In conclusion, the modifications to the copper processing plant at Guelb Moghrein since
commissioning have resulted in the following improvements:
increase in plant throughput from 2Mtpa to 4Mtpa, with throughput sustainable for the
hardest ores
copper recovery improved from 85 to 92%, despite a fall in head grade from 1.82% Cu to
1.15% Cu
gold recovery improvements from 40% in flotation concentrate alone, to 55% in flotation
concentrates and 65% overall recovery
reduction in arsenic content of concentrates from about 4,000ppm to less than 2,500ppm
control of the negative impacts of fibre within the circuit
Development work continues on site, with particular emphasis on:
further improvements in gold recovery
upgrading of flotation concentrates from 22.5% Cu to above 25% Cu
• milling circuit optimization to try and reduce losses of values in the coarse and fines in the
cyclone overflow stream
Guelb Moghrein Copper Gold Mine Technical Report March 2016
46
ITEM 14 MINERAL RESOURCE ESTIMATES
Introduction 14.1
This Mineral Resource estimate update was prepared in March 2016 by the Qualified Person, Mr
David Gray, together with assistance from the Guelb Moghrein mine personnel. Grade estimates
were interpolated into a 3-dimensional (3D) geology block model using ordinary kriging and
commercially available software packages (Datamine Studio version 3.0 and Snowden Supervisor
version 8.3). The project limits and coordinates were based upon the WGS84 28N geographic
coordinate system which was converted to a local mine grid where the north axis was rotated east
by 31.5 degrees. The relative elevation was also adjusted by adding 1000 m to the true elevation.
The deposit was delineated mostly with vertically drilled holes, but several fences of angled holes
have been drilled in specific areas for improving understanding of structure and ore body
orientation. Drill holes were spaced at close to 30 m intervals throughout most of the upper half of
the deposit whereas in the central and deep areas of the deposit they were variably spaced at 50 m
to 100 m intervals.
The resource estimate used an updated database as at 16 October 2015 which included all drill hole
sample assay results, blast hole sample results together with an interpretation of the geological
model that relates to the spatial distribution of copper mineralisation. Datamine software was used
to format the drillhole data into coordinated 3D space (a process known as desurveying).
Interpolation parameters were based upon the geology, styles of mineralisation, drill hole spacing
and geostatistical analysis of the data. Mineral Resource estimates were classified according to
geological continuity, QAQC, density data, drillhole grid spacing, grade continuity and confidence in
the panel grade estimate and have been reported in accordance with the guidelines of the
Australasian JORC Code (JORC, 2012), which in turn complies with the Standards on Mineral
Resources and Reserves of the Canadian Institute of Mining, Metallurgy and Petroleum (the CIM
Guidelines, 2014).
Geological and Mineralisation model 14.2
The Guelb Moghrein deposits are IOCG deposit styles that despite mining are still partly exposed on
surface. Sulphide mineralisation dominates and is comprised mainly of chalcopyrite and pyrrhotite.
On average, mineralisation within 40 m from surface has been oxidised through weathering, forming
typical oxide minerals such as native copper, malachite, cuprite and chalcocite. The mineralisation is
hosted by a coarse grained ferro-magnesian carbonate unit known as the FMC. Magnetite becomes
more abundant external to the sulphide zones as well as in the more oxidised volumes. Gold
coincides with the chalcopyrite sulphide mineralisation.
The deposit’s mineralisation is strongly confined to the FMC unit. FMC mineralisation has resulted
from several phases of structural deformation and metamorphism and is bound by upper and lower
shear zones. The unit is characterised internally by variable sized lenses of FMC that are roughly
parallel to the bounding shears. Structural deformation has therefore also created considerable
variation to the shape and volumes of higher and lower grade mineralisation within the FMC unit.
Three-dimensional wireframe volumes for the FMC mineralisation were interpreted across the
Occidental and Oriental deposits. Each deposit’s mineralisation was identified in the drillhole data

Guelb Moghrein Copper Gold Mine Technical Report March 2016
47
and defined using a string envelope digitised on each consecutive vertical section as per the
available drill grid spacing. Geology logging of FMC together with a total copper (Cu) mineralisation
cut-off of between 0.1 to 0.2% Cu was used to guide the position of string envelopes. The boundary
between mineralisation and waste is notably sharp. As a first pass to defining the mineralisation
volume, string envelopes were interpreted for vertical sections along the true dip orientation.
Thereafter, vertical sections along the strike direction (Figure 14-1), together with the interpreted
true dip strings, were used to guide a final set of detailed string envelopes. This approach minimises
sectional artefacts introduced by using only one direction of sections and ensures robust
representation of mineralisation volumes. Digitised string envelopes were snapped to the top or
bottom contacts of the 3D desurveyed drillhole sample data. In addition, blast hole data was used to
guide the position of string envelopes. The string envelopes were linked with consecutive wireframe
surfaces to form a 3D volume representing the volume of mineralisation.
Figure 14-1 A vertical west to east cross section illustrating a mineralisation string envelope snapped to the drillhole sample data.
Similarly, for the base of complete oxidation, a 3D wireframe surface was generated from
interpreted strings as identified in the drillhole logging data per consecutive vertical section. The
position of this surface is also guided by the presence of elevated single acid soluble copper assay
values. The resulting wireframe surface (Figure 14-2) for the base of complete oxidation subdivides
the upper oxide mineralisation from the underlying sulphide mineralisation.

Guelb Moghrein Copper Gold Mine Technical Report March 2016
48
Figure 14-2 A vertical section across Oriental mineralisation, highlighting elevated single acid soluble copper (ASCUPCT) sample grades above the base of oxide (green string) with sulphide mineralisation below.
Analysis of the resulting mineralisation wireframe volume highlights distinct lens shaped domains of
wider mineralisation (Figure 14-3). It is most likely that these are due to syn- and post-mineralisation
structural deformation/faulting. The thicker areas are likely to be zones where faulting has stacked
FMC horisons over each other. Accordingly, the mineralisation volume has been sub-divided into
these fault block domains (Figure 14-3) each having distinctly grouped lenses. It is noted that future
estimates may consider further fault sub-division as observed in the vertical dimension.
Mineralisation domains were developed according to deposit, oxidation and fault block. Resulting
domains reduce sample assay variability, improving grade continuity and form the basis for
geostatistical spatial analysis (variography) and estimation. Domains are detailed in Table 14-1.

Guelb Moghrein Copper Gold Mine Technical Report March 2016
49
Table 14-1 Guelb Moghrein mineralisation domains
Figure 14-3 A plan view of Guelb Moghrein mineralisation highlights distinct lens shaped domains having thicker widths which were grouped into distinct fault blocks.
Available Data for Mineral Resource modelling 14.3
Topography data 14.3.1
Upper limits to the 3D block model were defined by a pre-mining topographic surface. The surveyed
pit floor as at 31 December 2015 was used to define the upper limit of unmined Mineral Resources
(Figure 14-4).
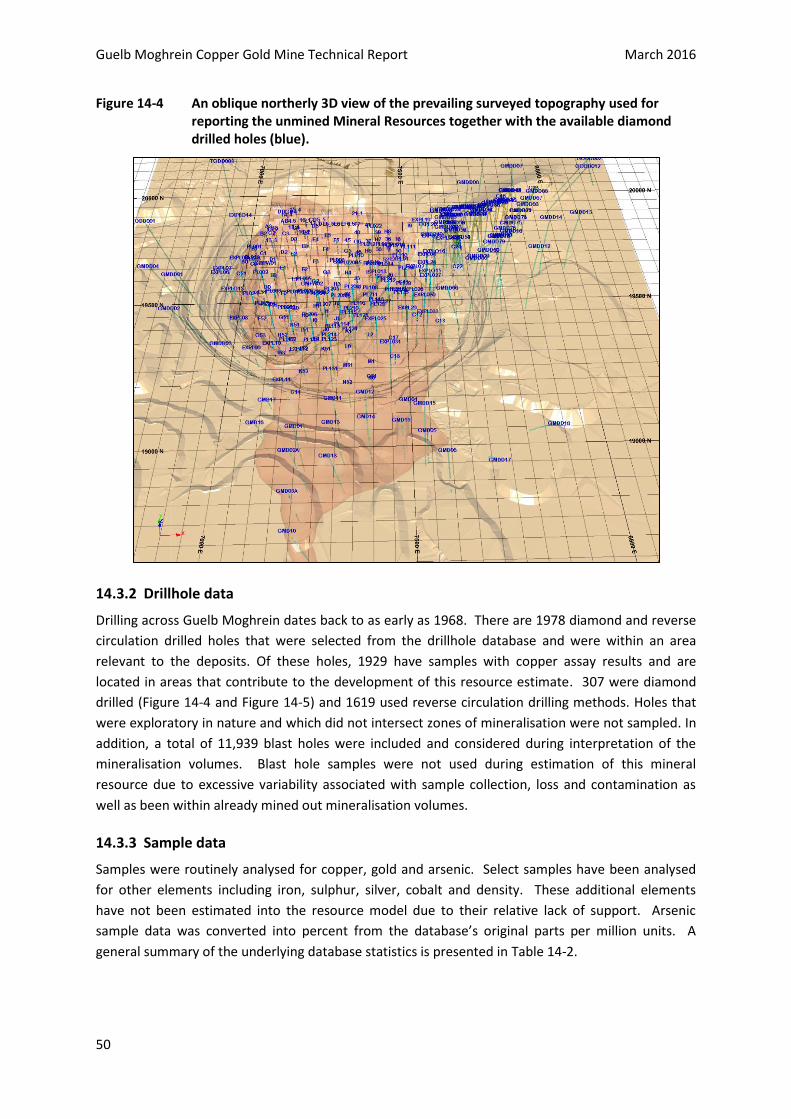
Guelb Moghrein Copper Gold Mine Technical Report March 2016
50
Figure 14-4 An oblique northerly 3D view of the prevailing surveyed topography used for reporting the unmined Mineral Resources together with the available diamond drilled holes (blue).
Drillhole data 14.3.2
Drilling across Guelb Moghrein dates back to as early as 1968. There are 1978 diamond and reverse
circulation drilled holes that were selected from the drillhole database and were within an area
relevant to the deposits. Of these holes, 1929 have samples with copper assay results and are
located in areas that contribute to the development of this resource estimate. 307 were diamond
drilled (Figure 14-4 and Figure 14-5) and 1619 used reverse circulation drilling methods. Holes that
were exploratory in nature and which did not intersect zones of mineralisation were not sampled. In
addition, a total of 11,939 blast holes were included and considered during interpretation of the
mineralisation volumes. Blast hole samples were not used during estimation of this mineral
resource due to excessive variability associated with sample collection, loss and contamination as
well as been within already mined out mineralisation volumes.
Sample data 14.3.3
Samples were routinely analysed for copper, gold and arsenic. Select samples have been analysed
for other elements including iron, sulphur, silver, cobalt and density. These additional elements
have not been estimated into the resource model due to their relative lack of support. Arsenic
sample data was converted into percent from the database’s original parts per million units. A
general summary of the underlying database statistics is presented in Table 14-2.

Guelb Moghrein Copper Gold Mine Technical Report March 2016
51
Figure 14-5 A plan view of the Guelb deposits and distribution of diamond and reverse circulation drilled holes.
Table 14-2 Table of drillhole statistics per element of interest
Element No of samples Total Length (m) Min Max Mean St Dev
copper (%) 48943 97103 0.001 15.0 0.73 1.11
gold (g/t) 46483 92199 0.001 34.5 0.64 1.25
arsenic (%) 37207 73928 0.0001 1.55 0.07 0.11
iron (%) 4031 7950 0.07 69.28 27.06 18.24
cobalt (ppm) 10712 21214 3.7 4000 134 236.27
silver (g/t) 5947 11797 0.005 8 0.89 0.71
sulphur (%) 7719 15259 0.001 21.41 1.08 2.29
Density (t/m3) 1975 3564 2.09 4.5 3.22 0.41
A series of data validations were completed prior to desurveying the drillhole data into a 3D format.
These included:
Visual checks of collar elevations against the pit floor survey and original topographic surface
digital terrain models. Corrections were required for 58 collar elevations according to the recent
topographic survey around Oriental Hill and then for a few historical holes drilled before mining
where collars were several metres above the surface. The position of FQM017 and AB4.5 were in
conflict with the geology and assays of their surrounding holes and were removed from the data
used in this estimate.

Guelb Moghrein Copper Gold Mine Technical Report March 2016
52
The logging, sampling and assay data were investigated for overlaps, gaps or duplication.
Duplicate samples having the same coordinates were identified for 11 of the blast holes. In
addition, MAGRC001, MAGRC002, MAGHRC007, MAGRC008, DDGM1, DDGM2, DDGM3,
RC050050, RC014045, RC014036 and RC014189 were similarly removed as holes having
duplicate coordinates. The MAGRC holes were not assayed and the RC holes were from a close
spaced original grade control program.
Sample lengths from some historical intercepts were in excess of 6 m. These were flagged and
not used during this estimate as they would result in too many 2 m composite samples having
the same value.
Assay value checks were completed for samples having values outside of expected limits. Top
capping was applied to minimise the risk of high grade samples influencing block estimates in
areas of low support.
Downhole survey data was investigated for excessive deviations. No risks were identified with
most holes drilled vertically.
Additionally, the database includes logged lithology codes and bulk density measurements.
Individual sample interval lengths range from 0.003 m to 236.6 m with an average sample length of
1.92 m. 99% of samples were taken at intervals between 0.1 m to 6 m, with less than 0.1% of
samples having very long lengths and were removed from the database. Core recovery
measurements were available for most diamond drilled sampling with details discussed in Item 10.
No sample lengths were adjusted or removed from the database data due to poor recovery.
The de-surveyed assay drillhole file was composited and then coded according to each of the
mineralisation domains (Table 14-1) for estimation. The de-surveyed and coded data was used for
statistical and geostatistical analysis, and in the grade estimation.
Sample Compositing 14.3.4
Downhole compositing of drillhole samples was completed in order to reduce the effect that varying
sample length may have on grade values. Compositing was completed in order to support robust
statistical analysis and estimates. A 2 m downhole composite length was chosen in order to honour
the dominant sample length and the current smallest mining unit bench height of 6 m. Drillhole
samples were composited according to their respective sample lengths (length weighted) by been
combined down-the-hole. Several holes were randomly selected and composite values validated
against the input sample data. Minimal metal loss resulted from the compositing process and no
errors were identified.
Statistical Analysis 14.4
Statistical data analysis was completed on the composite sample values in order to understand the
nature of each domains grade distribution. The purpose was to ensure minimal population mixing
per domain and so reduce internal variability which will assist spatial analysis and provide a more
robust estimate. If multiple populations were evident from the data analysis, further geological
separation and isolation of domains would be pursued. Summary statistics were assessed per
domain per element using descriptive statistics (Table 14-3), histograms and log probability curves.
An example of the distribution of copper is presented in Figure 14-6. High grades were observed for
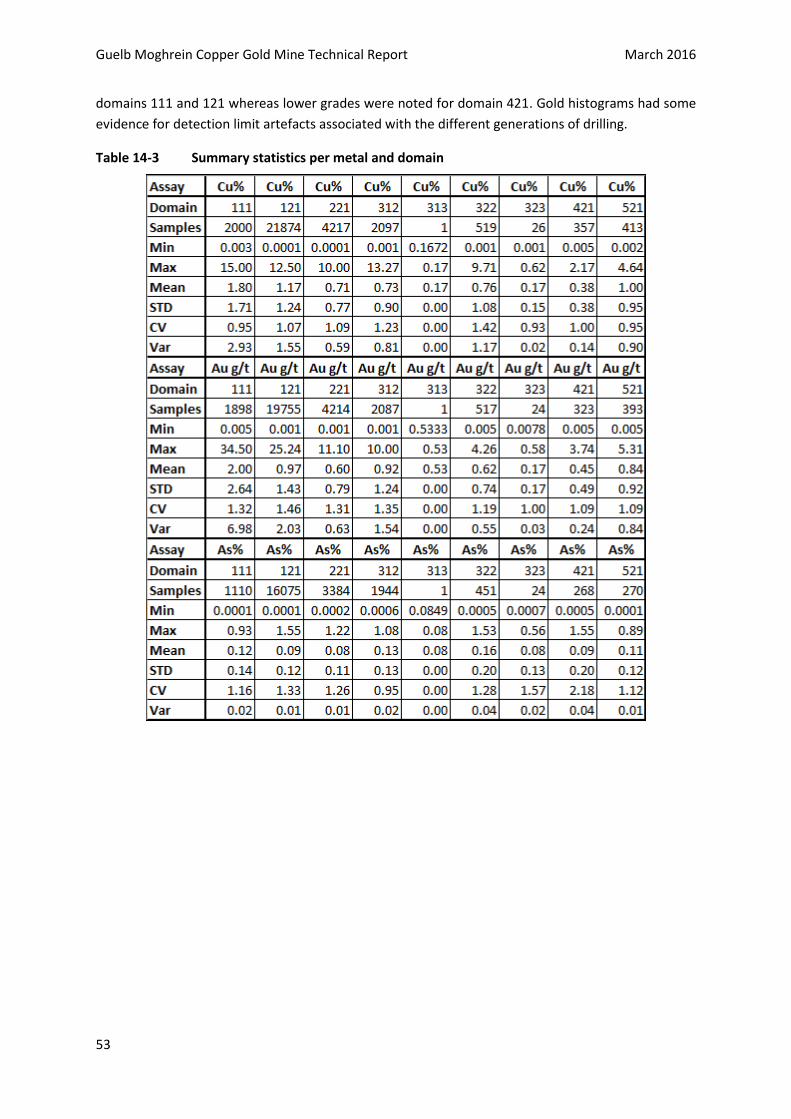
Guelb Moghrein Copper Gold Mine Technical Report March 2016
53
domains 111 and 121 whereas lower grades were noted for domain 421. Gold histograms had some
evidence for detection limit artefacts associated with the different generations of drilling.
Table 14-3 Summary statistics per metal and domain

Guelb Moghrein Copper Gold Mine Technical Report March 2016
54
Figure 14-6 A log histogram and probability plot for Cu % in a key sulphide domain (421), highlighting good distribution of values with minimal evidence for population mixing.
Statistical analysis supports the selected domains has been well defined with a minimal degree of
mixing. The coefficients of variation (CV) per metal and per domain were reasonable with very few
having values above 1.5.
Boundary Analysis 14.5
Boundary analysis examines the rate of grade change across the contact between waste and ore
domains. Graphically the average grade is plotted at increasing distances from the contact boundary.
Contact profiles with marked grade changes across the boundary suggest that the two domain
datasets should be isolated during interpolation. These are referred to as hard boundaries.
Conversely, boundaries having a gradual change in grade across the contact are referred to as soft.
Boundary analysis across ore and waste contacts highlight hard boundaries with marked grade
changes. Key examples are illustrated in Figure 14-7. There was relatively little change in grade
between the oxide and fresh sulphide mineralisation. It is worth noting that all oxide mineralisation
has been mined out from the Occidental deposit with only Oriental oxide mineralisation remaining.
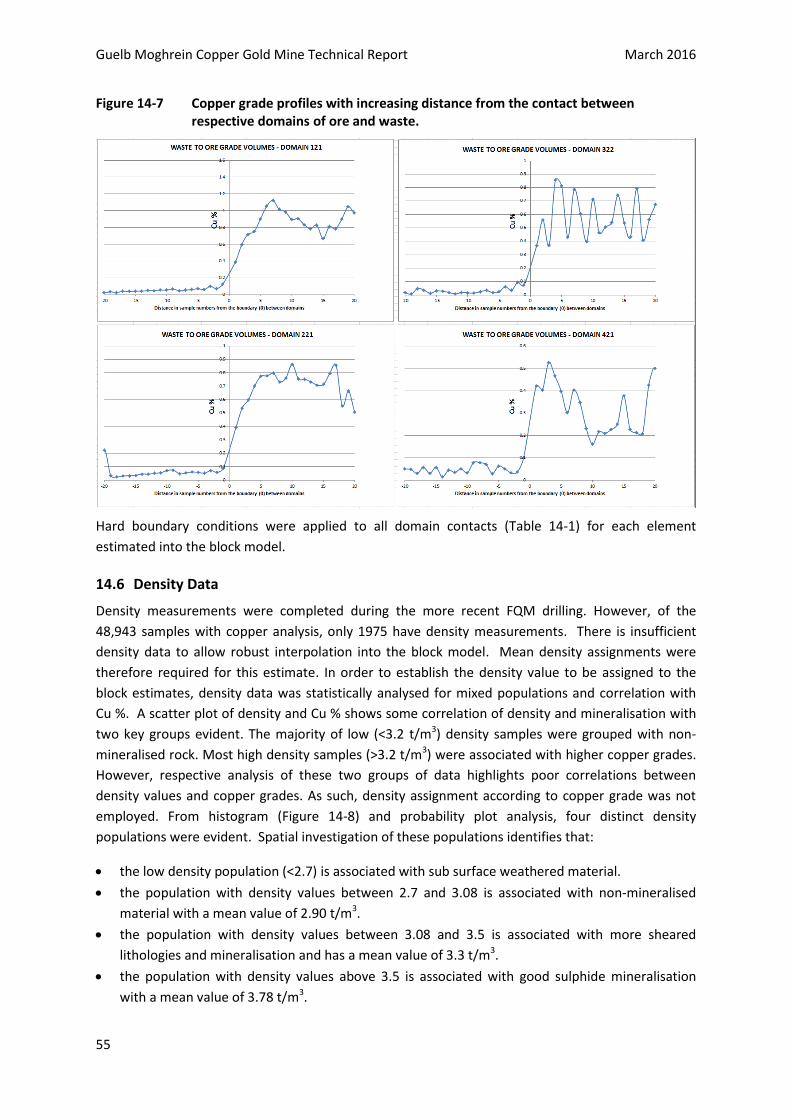
Guelb Moghrein Copper Gold Mine Technical Report March 2016
55
Figure 14-7 Copper grade profiles with increasing distance from the contact between respective domains of ore and waste.
Hard boundary conditions were applied to all domain contacts (Table 14-1) for each element
estimated into the block model.
Density Data 14.6
Density measurements were completed during the more recent FQM drilling. However, of the
48,943 samples with copper analysis, only 1975 have density measurements. There is insufficient
density data to allow robust interpolation into the block model. Mean density assignments were
therefore required for this estimate. In order to establish the density value to be assigned to the
block estimates, density data was statistically analysed for mixed populations and correlation with
Cu %. A scatter plot of density and Cu % shows some correlation of density and mineralisation with
two key groups evident. The majority of low (<3.2 t/m3) density samples were grouped with non-
mineralised rock. Most high density samples (>3.2 t/m3) were associated with higher copper grades.
However, respective analysis of these two groups of data highlights poor correlations between
density values and copper grades. As such, density assignment according to copper grade was not
employed. From histogram (Figure 14-8) and probability plot analysis, four distinct density
populations were evident. Spatial investigation of these populations identifies that:
the low density population (<2.7) is associated with sub surface weathered material.
the population with density values between 2.7 and 3.08 is associated with non-mineralised
material with a mean value of 2.90 t/m3.
the population with density values between 3.08 and 3.5 is associated with more sheared
lithologies and mineralisation and has a mean value of 3.3 t/m3.
the population with density values above 3.5 is associated with good sulphide mineralisation
with a mean value of 3.78 t/m3.

Guelb Moghrein Copper Gold Mine Technical Report March 2016
56
From the available density data there were insufficient (~14) density samples from the oxide zone
for determining a representative mean oxide density value. The historically assigned value of
3.2 t/m3 was used for oxide material at the Oriental deposit. Non-mineralised material external to
FMC was adjusted from the data mean of 2.9 to 2.95 t/m3 due to there been some sporadic low
grade mineralisation and that available density data does not cover this material. Historically a value
of 3.0 t/m3 was used for non-mineralised material. The mean density value for mineralised FMC was
decreased from the data mean of 3.78 to 3.76 t/m3 due to the presence of lower density sheared
material within these volumes. It is relevant to note that the degree of shearing is decreasing with
increasing depth. Domains 421 and 521 are narrower than domains 221 and 121. Hence the increase
in FMC sulphide mineralisation density values from previous estimates 3.7 to 3.76 t/m3.
Figure 14-8 A histogram plot of all density data highlighting no outlier data and four key density populations.
The assigned mean density values according to data analysis of the drillhole composites is listed in
Table 14-4.

Guelb Moghrein Copper Gold Mine Technical Report March 2016
57
Table 14-4 Summary of density measurement statistics per domain
Bivariate element relationships 14.7
The correlation coefficient between copper and gold is good for most domains. Correlation
coefficient between arsenic and copper is poor. The volumes of gold mineralisation are spatially
coincident with copper and were grouped into the same domains. Arsenic is a deleterious element
impacting upon processing and as such not of direct economic interest. Arsenic was estimated into
the respective domains as per the available sample data.
Top Cutting 14.8
The many different campaigns of drilling, sampling and analysis since 1968 warranted that top cuts
be assessed from histograms and log probability plots of original sample values per campaign. This
approach reduces the risk of outlier sample values been carried through to spatial analysis and
estimation. Top capping of outlier samples was employed in order to reduce the population variance
and so minimise the risk of high grade samples affecting poorly informed block estimates. Outlier
samples are commonly related to sampling, analytical or data handling errors. The following top
cuts were applied (Table 14-5). In each case the percentage of samples cut was less than 1% with
limited to no effect on the sample data mean values.
Table 14-5 Summary table of top cut values.
Variography 14.9
Variograms, representing 3D grade continuity, were generated for copper, gold and arsenic using
composite data per mineralised domains. Variograms were generated using Snowden Supervisor
v8.3. The following methodology was applied:

Guelb Moghrein Copper Gold Mine Technical Report March 2016
58
the principal axes of anisotropy were determined using variogram fans based on normal
scores variograms
directional normal scores variograms were calculated for each of the principal axes of
anisotropy
downhole normal scores variograms were modelled for each domain to determine the normal
scores nugget effect
variogram models were determined for each of the principal axes of anisotropy using the
nugget effect from the downhole variogram
the variogram parameters were standardised to a sill of one
the variogram models were back-transformed to the original distribution using a Gaussian
anamorphosis and used to guide search parameters and complete ordinary kriging estimation
the variogram parameters were re-calculated according to the population variance for each
domain to permit post-processing of the copper panel estimates to SMU estimates.
The multidirectional variogram model results are summarised in Table 14-6. Variogram model
nugget values were clearly defined (Figure 14-9) from the close spaced data with copper having low
values and gold slightly higher nugget values. Each domains variograms were modelled using two to
three spherical structures. The ranges of influence were clearly visible from the variograms,
providing confidence in domain data selections and grade continuity. Variogram models were
completed for copper, gold and arsenic per domain. Variograms for domain 313 and 323 were based
upon domain 312 and 322 respectively.
Table 14-6 Variogram parameters per domain for copper

Guelb Moghrein Copper Gold Mine Technical Report March 2016
59
Figure 14-9 Variogram models for Domain 421 copper
Kriging Neighbourhood Analysis 14.10
A kriging neighbourhood analysis (KNA) was completed to determine optimal block size, ellipse
dimensions, minimum and maximum numbers of samples to be used for grade estimation as well as
the discretization parameters. Correctly defined sample selection parameters are essential to
optimising the estimation process and help reduce the risk of conditional bias (overestimation of
high grades and underestimation of low grades). An optimum parent block size of 32 m by 32 m by
12 m was selected (Figure 14-10) together with a minimum of 10 samples and a maximum of 24 for
the estimation routine. KNA was completed using Snowden Supervisor’s KNA analysis tools.
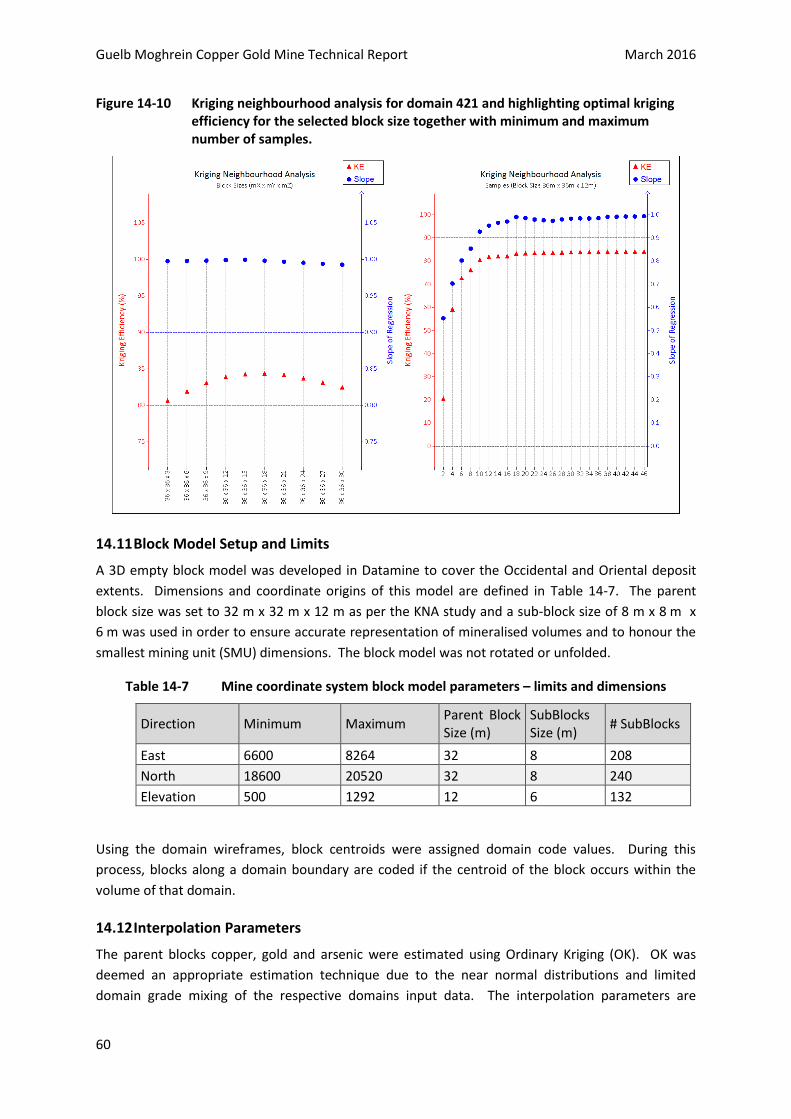
Guelb Moghrein Copper Gold Mine Technical Report March 2016
60
Figure 14-10 Kriging neighbourhood analysis for domain 421 and highlighting optimal kriging efficiency for the selected block size together with minimum and maximum number of samples.
Block Model Setup and Limits 14.11
A 3D empty block model was developed in Datamine to cover the Occidental and Oriental deposit
extents. Dimensions and coordinate origins of this model are defined in Table 14-7. The parent
block size was set to 32 m x 32 m x 12 m as per the KNA study and a sub-block size of 8 m x 8 m x
6 m was used in order to ensure accurate representation of mineralised volumes and to honour the
smallest mining unit (SMU) dimensions. The block model was not rotated or unfolded.
Table 14-7 Mine coordinate system block model parameters – limits and dimensions
Direction Minimum Maximum Parent Block Size (m)
SubBlocks Size (m)
# SubBlocks
East 6600 8264 32 8 208
North 18600 20520 32 8 240
Elevation 500 1292 12 6 132
Using the domain wireframes, block centroids were assigned domain code values. During this
process, blocks along a domain boundary are coded if the centroid of the block occurs within the
volume of that domain.
Interpolation Parameters 14.12
The parent blocks copper, gold and arsenic were estimated using Ordinary Kriging (OK). OK was
deemed an appropriate estimation technique due to the near normal distributions and limited
domain grade mixing of the respective domains input data. The interpolation parameters are
Guelb Moghrein Copper Gold Mine Technical Report March 2016
61
summarized by domain in the Table 14-8. Estimation into parent blocks used a discretisation of 3 (X
points) by 3 (Y points) by 2 (Z points) to better represent the block volume shape. Each domain was
estimated using hard boundaries.
Table 14-8 Copper, gold and arsenic estimate sample selection parameters per domain. The second pass is 1.5 times the first search range and the third pass is 3 times the first search range.
Domain
Search ellipse range (m)
No of composite samples
X Y Z Min/block Max/block Max/hole
111 110 110 50 10 24 3
121 150 150 50 10 24 3
221 200 150 50 10 24 3
312 180 120 40 10 24 3
322 150 90 40 10 24 3
421 200 170 30 10 24 3
521 120 100 35 10 24 3
Waste(999) 70 70 6 10 24 3
During grade estimations the sample selection criteria were the same per metal. This ensures that
copper and gold correlations were honoured per block estimate. 98% of mineralisation domain
blocks were estimated using the first search pass.
Post-processing by Localized Uniform Conditioning 14.13
A localised uniform conditioning estimate (LUC) was completed for copper, gold and arsenic across
the mineralised domains. Uniform conditioning (UC) provides an estimate of the proportion of
smallest mining unit blocks (SMU) inside the parent block that are above a cut-off grade and their
corresponding average grade. UC does not provide spatial information pertaining to these SMU
grades. LUC provides the spatial grade estimates of the blocks that are smaller (SMU) than the
parent block size. LUC results in an assessment of recoverable resources available per domain at the
scale of mining and is particularly relevant in the more widely drilled areas. The parent block size
used was 32 m by 32 m by 12 m and the SMU block size was 8 m by 8 m by 6 m. LUC models were
validated by:
Visual comparisons with drillhole sample grades and the OK sample grades
Checks that the SMU average grade is the same as the Parent grade
Checking that contained copper at a zero cut-off grade is the same for the OK estimates and
the LUC estimates.
LUC was only completed for those blocks not supported by RC grade control drilling. Blocks located
within the RC grade control drilled areas were estimated directly into the SMU block size. No
deviations or anomalies were noted by the QP, Mr David Gray.

Guelb Moghrein Copper Gold Mine Technical Report March 2016
62
Background model 14.14
A background model was generated across the Guelb Moghrein deposit area to capture all
mineralisation that was not included in the estimated domains. Grades (copper, gold and arsenic)
were estimated into each parent block using a single search and sample selection criteria as per
Table 14-8. In addition the background model was coded with oxidation, fault block and mined
material. Blocks located between the original topography and the 31 December 2015 pit floor
survey, were coded with a value of 1 in a MINED field. Blocks located within mine dumps and
stockpiles were coded with a value of 2 and blocks located within the final life of mine pitshell were
coded with a value of 3. All other block material was classified as unmined and was assigned a value
of 0.
Validation of Block Model Estimates 14.15
The results of the modeling process were validated through several methods including a visual
review of the model grades in relation to the underlying drillhole sample grades; comparisons with
the change of support model and grade distribution comparisons using swath plots.
Visual Validations 14.15.1
Detailed visual validations comparing block model and input data grades was conducted along
northsouth and eastwest vertical sections. The validation included confirmation of the correct
domain coding of blocks. Figure 14-11 illustrates two central vertical cross section validations
representing the LUC block (SMU) copper grades and the input drillhole composite copper grades.
Summary statistics 14.15.2
Summary statistics comparing each domain’s mean input composite grade, the mean parent block
estimate, highlights good results reflecting the respective domains mineralisation (Table 14-9). The
comparison between parent mean estimate and LUC mean estimate has no differences.

Guelb Moghrein Copper Gold Mine Technical Report March 2016
63
Figure 14-11 Vertical cross sections looking east and looking north illustrating good validation between drillhole sample copper values and block copper estimates.

Guelb Moghrein Copper Gold Mine Technical Report March 2016
64
Table 14-9 Validation of Parent block estimate with input composite data
Domain Metal Composite
grade Parent
estimate %
Variance
111 Cu % 1.60 1.65 3.1%
111 Au g/t 1.73 1.81 4.4%
121 Cu % 1.17 1.11 -5.0%
121 Au g/t 0.97 0.97 -0.4%
221 Cu % 0.71 0.70 -0.6%
221 Au g/t 0.61 0.60 -1.8%
312 Cu % 0.73 0.68 -6.0%
312 Au g/t 0.93 1.02 10.1%
322 Cu % 0.77 0.83 7.6%
322 Au g/t 0.64 0.70 9.6%
421 Cu % 0.37 0.37 -0.4%
421 Au g/t 0.44 0.45 0.9%
521 Cu % 0.89 0.81 -9.0%
521 Au g/t 0.74 0.72 -2.7%
Model Checks for Change of Support 14.15.3
The parent (OK) and the LUC (SMU) estimates were compared at various cut-off grades using
grade/tonnage curves (Figure 14-12). Overall, there is very good correlation between models and
overall copper metal was preserved (the same) in both model estimates at zero cut-off. As
expected, the LUC estimates provide greater resolution (more tonnes) at higher grades. The LUC
estimate better honours the input data grade distribution than the parent (OK) estimate, which
tends to be smoothed.
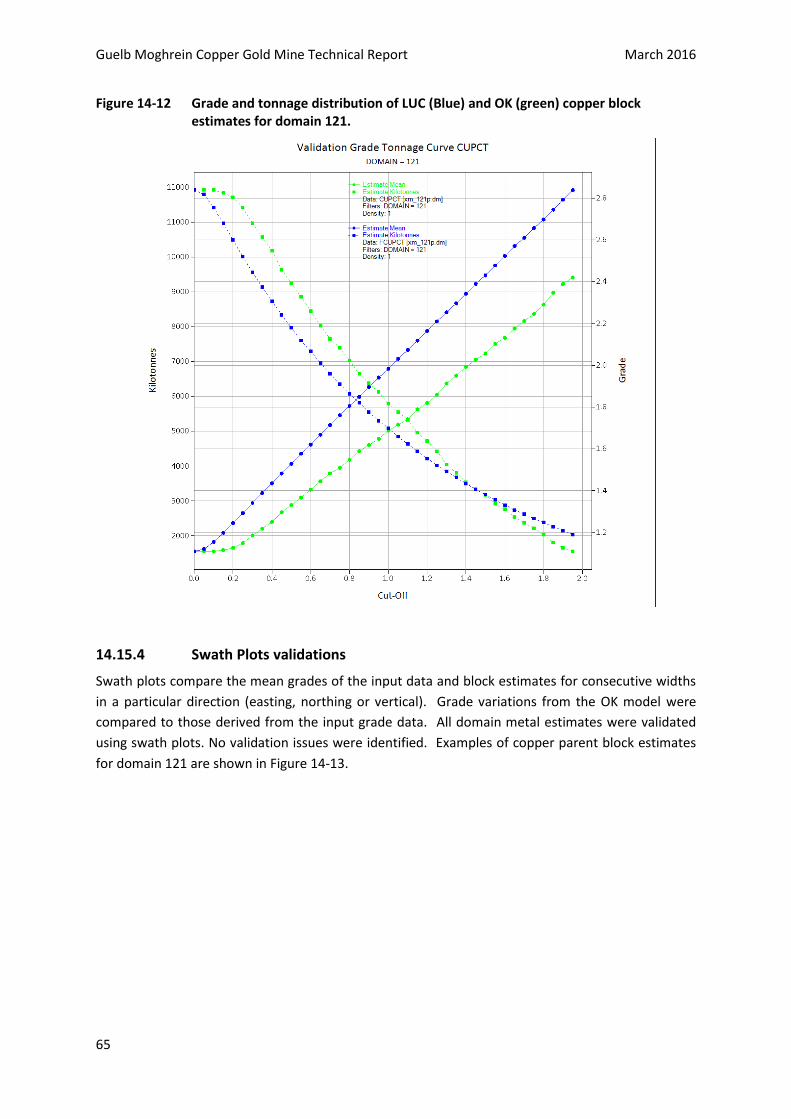
Guelb Moghrein Copper Gold Mine Technical Report March 2016
65
Figure 14-12 Grade and tonnage distribution of LUC (Blue) and OK (green) copper block estimates for domain 121.
Swath Plots validations 14.15.4
Swath plots compare the mean grades of the input data and block estimates for consecutive widths
in a particular direction (easting, northing or vertical). Grade variations from the OK model were
compared to those derived from the input grade data. All domain metal estimates were validated
using swath plots. No validation issues were identified. Examples of copper parent block estimates
for domain 121 are shown in Figure 14-13.

Guelb Moghrein Copper Gold Mine Technical Report March 2016
66
Figure 14-13 Validation slices comparing Domain 121 copper estimates and input data for easting, northing and vertical directions.
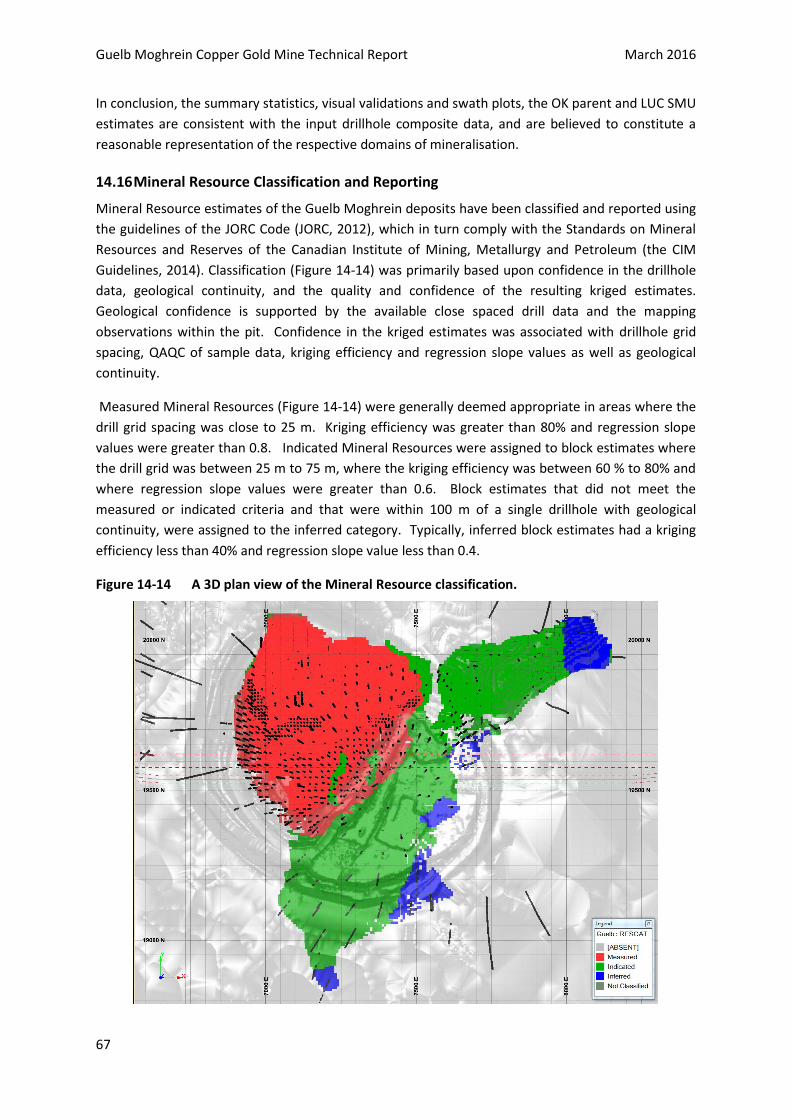
Guelb Moghrein Copper Gold Mine Technical Report March 2016
67
In conclusion, the summary statistics, visual validations and swath plots, the OK parent and LUC SMU
estimates are consistent with the input drillhole composite data, and are believed to constitute a
reasonable representation of the respective domains of mineralisation.
Mineral Resource Classification and Reporting 14.16
Mineral Resource estimates of the Guelb Moghrein deposits have been classified and reported using
the guidelines of the JORC Code (JORC, 2012), which in turn comply with the Standards on Mineral
Resources and Reserves of the Canadian Institute of Mining, Metallurgy and Petroleum (the CIM
Guidelines, 2014). Classification (Figure 14-14) was primarily based upon confidence in the drillhole
data, geological continuity, and the quality and confidence of the resulting kriged estimates.
Geological confidence is supported by the available close spaced drill data and the mapping
observations within the pit. Confidence in the kriged estimates was associated with drillhole grid
spacing, QAQC of sample data, kriging efficiency and regression slope values as well as geological
continuity.
Measured Mineral Resources (Figure 14-14) were generally deemed appropriate in areas where the
drill grid spacing was close to 25 m. Kriging efficiency was greater than 80% and regression slope
values were greater than 0.8. Indicated Mineral Resources were assigned to block estimates where
the drill grid was between 25 m to 75 m, where the kriging efficiency was between 60 % to 80% and
where regression slope values were greater than 0.6. Block estimates that did not meet the
measured or indicated criteria and that were within 100 m of a single drillhole with geological
continuity, were assigned to the inferred category. Typically, inferred block estimates had a kriging
efficiency less than 40% and regression slope value less than 0.4.
Figure 14-14 A 3D plan view of the Mineral Resource classification.

Guelb Moghrein Copper Gold Mine Technical Report March 2016
68
Indicated Mineral Resource areas (Figure 14-14), edges and deeper extents are recommended as
locations for planned infill and extensional drilling in order to assure geological and grade continuity
as well as to develop extensional opportunity for the open pit and underground mining.
The Mineral Resource statement as at the end of December 2015 was sub divided into two areas for
reporting purposes. A CuEq cut-off grade of 0.5% was used for reporting Mineral Resources proximal
to the final pit shell (Figure 14-15) and north of the 19,300 m northing (Table 14-10). Cutoff values
were guided by the Mineral Reserve study results. These Mineral Resources are inclusive of Mineral
Reserves. Mineral Resources that are not Mineral Reserves do not have demonstrated economic
viability. The copper equivalent formula uses feasibility level mining costs, recoveries and metal
prices, and is:
CuEq=TCu% + (Au ppm x 0.3741)
A total Cu cutoff grade of 0.5% (higher than the CuEq of 0.5%) was used for reporting the Mineral
Resources south of the 19300 m northing (Table 14-11). None of these Mineral Resources were
converted to Mineral Reserves. The deeper (south of 19,300m northing) Mineral Resources were
located in an area where alternate and more costly mining methods would need to be considered.
The total Guelb Moghrein Mineral resource statement is presented in Table 14-12.
Figure 14-15 A 3D plan view highlighting the 19,300m northing position (red line) where the Mineral Resource (coloured blocks) was split for reporting at different cutoff grades.
There are no known factors related to environmental, permitting, legal, title, taxation, socio-
economic, marketing or political issues which could materially affect this Mineral Resource
statement.

Guelb Moghrein Copper Gold Mine Technical Report March 2016
69
Table 14-10 Mineral Resource north of the 19,300 m northing and depleted of mining as at 31 December 2015. A CuEq cut-off of 0.5% was used.
Material Classification Tonnes (Mt) Cu % Au g/t As % Cu t Au oz
Sulphide Measured 18.21 0.79 0.63 0.07 144,523 369,138
Sulphide Indicated 13.64 0.89 0.77 0.10 120,838 338,529
Measured & Indicated 31.85 0.83 0.69 0.08 265,361 707,667
Sulphide Inferred 0.26 0.83 0.65 0.09 2,194 5,490
Material Classification Tonnes (Mt) Cu % Au g/t As % Cu t Au oz
Oxide Measured 0.08 1.40 1.81 0.04 1,136 4,724
Oxide Indicated 7.42 0.86 1.00 0.14 63,622 237,896
Measured & Indicated 7.51 0.86 1.01 0.13 64,759 242,620
Oxide Inferred 1.76 0.72 2.41 0.18 12,625 136,889
Classification Tonnes (Mt) Cu % Au g/t As % Cu t Au oz
Sub total Measured & Indicated 39.36 0.84 0.75 0.09 330,119 950,286
Total Inferred 2.03 0.73 2.18 0.17 14,819 142,379
Table 14-11 Mineral Resource statement south of the 19,300 m northing and depleted of mining as at 31 December 2015. A Cu cut-off of 0.5% was used.
Material Classification Tonnes (Mt) Cu % Au g/t As % Cu t Au oz
Sulphide Measured - - - - - -
Sulphide Indicated 4.22 0.80 0.59 0.10 33,901 80,555
Sub total Measured & Indicated 4.22 0.80 0.59 0.10 33,901 80,555
Sulphide Inferred 0.37 0.92 0.67 0.12 3,403 8,005
Table 14-12 Total Mineral Resource statement of combined cutoff areas and depleted of mining as at 31 December 2015. A Cu cut-off of 0.5% was used for blocks south of the 19,300 m northing and a CuEq cut-off of 0.5% was used for blocks north of the 19,300 m northing.
Material Classification Tonnes (Mt) Cu % Au g/t As % Cu t Au oz
Sulphide Measured 18.21 0.79 0.63 0.07 144,523 369,138
Sulphide Indicated 17.86 0.87 0.73 0.10 154,739 419,084
Measured & Indicated 36.07 0.83 0.68 0.09 299,262 788,222
Sulphide Inferred 0.63 0.88 0.66 0.11 5,598 13,496
Material Classification Tonnes (Mt) Cu % Au g/t As % Cu t Au oz
Oxide Measured 0.08 1.40 1.81 0.04 1,136 4,724
Oxide Indicated 7.42 0.86 0.73 0.10 63,622 174,239
Measured & Indicated 7.51 0.86 0.74 0.10 64,759 178,962
Oxide Inferred 1.76 0.72 2.41 0.18 12,625 136,889
Material Classification Tonnes (Mt) Cu % Au g/t As % Cu t Au oz
Total Measured & Indicated 43.57 0.84 0.69 0.09 364,021 967,184
Total Inferred 2.40 0.76 1.95 0.16 18,222 150,384

Guelb Moghrein Copper Gold Mine Technical Report March 2016
70
Mineral Resource Estimate Comparisons 14.17
The Guelb Moghrein Mineral Resource estimate update has considered the follow changes since the
previous estimate:
Inclusion of close spaced blast hole data, which together with diamond drill and reverse
circulation samples have been considered in interpretation of mineralisation wireframe volumes.
Inclusion of additional infill and extensional diamond drilling of deeper deposit areas.
Use of latest in-pit geology mapping and logging data in 3D geology modelling, as well as support
from mining, processing and reconciliation data.
Improved wireframing of mineralisation domains aided by the additional infill and extensional
drilling. Fault block geological domains have resulted, each having unique styles of
mineralisation thereby minimising domain mixing.
Estimation parameters were optimised with a kriging neighbourhood analysis, additional data
and improved variography.
Ordinary kriging was used to estimate grades into a parent block size. A change of support
routine (known as localised uniform conditioning or LUC) was applied to the parent block
estimates. LUC determines the grades of smaller blocks, relevant to the scale of mining (SMU
block size). This provides for a more representative resource grade and tonnage at the scale of
mining.
In comparing the results of this update to the previous estimate, both block models were depleted
of mining as at 31st December 2015 and reported using the previously adopted copper cutoff of
0.5%. The comparison highlights an increase (12%) in measured and indicated sulphide tonnages at
the Occidental sulphide deposit. Total copper grades have increased by 5% and gold grades have
increased by 27%. These grade and tonnage changes result in an increase in copper and gold metal
and have supported using a copper equivalent cutoff in order to increase potentially economic
material.
As well as Occidental, this estimate update has incorporated further development of the Oriental
extension, which will continue to be the focus for further geological and economic evaluation from
2016 onwards.
It is important to note that the Guelb deposits’ mineralisation is still largely open along its edges and
at depth (Figure 14-14), suggesting further extension opportunity from the recommended infill and
extensional drilling planned for 2016.

Guelb Moghrein Copper Gold Mine Technical Report March 2016
71
ITEM 15 MINERAL RESERVE ESTIMATE
Optimisation 15.1
Introduction 15.1.1
Pit optimisation was carried out using Whittle Four-X and the resource model developed in
December 2015. The optimisation was undertaken assuming flotation copper concentrates
produced from fresh mineralisation will continue to be shipped from site in containers. Oxide
material is treated as waste in this optimisation (as with all previous optimisations) but will continue
to be stockpiled separately in case a viable processing option arises.
The first objective of the pit optimisation was to define the economic limits and check these against
the current ultimate pit design. The second objective was to review the push-back strategy using the
current pit surface and a series of staged shells to smooth the stripping ratio and test that the final
stages of mining at Guelb Moghrein maximise the NPV. The stage pit shells output from Whittle
Four-X were used to check and where necessary, modify the dressed designs which incorporate haul
roads, ramps, and safety berms.
Actual project operating cost data was obtained from MCM’s production records up to the end of
2015 and the 2016 operating budget, but were adjusted to take account of projected improvements
from current projects. Load and haul costs were adjusted to take account of the different haul
profiles from now until the end of mining.
For the purposes of Reserve estimation, inferred mineralisation was ignored. However, it should be
noted that given the very low quantity of inferred mineralisation within the pit shells, the inclusion
or exclusion of inferred mineralisation in the economic analysis has negligible impact on the
optimisation results.
In addition to the selection of the ultimate pit and interim stages under base case conditions for pit
design, a suite of sensitivity analyses were carried out for ± 20 % variation in metal prices as well as
variable mining and process operating costs.
Pit Optimisation Input Parameters 15.1.2
Pit slope design criteria
Pit optimisation input included overall slope design angles as shown in Error! Reference source not
ound..
Table 15-1 Overall pit slope angles for optimisation input
Occidental Oriental
Footwall 30 degrees 30 degrees
Hangingwall 46.5 degrees 43 degrees
The detailed parameters for Occidental are listed in Item 15.4. The parameters for Oriental are
based on extrapolated design information.

Guelb Moghrein Copper Gold Mine Technical Report March 2016
72
Metal prices
The optimisation inputs for metal prices were as follows:
Copper = US$3.00/lb (US$6,615/t)
Gold = US$1,200/oz
Given the projected mine life is beyond 2020, the metal prices used were FQM long term outlook
prices based on the December 2015 consensus price forecasts.
Metal recoveries
Metal recovery figures adopted for pit optimisation are shown in Table 15-2.
Table 15-2 Metal recovery figures used for Pit Optimisation
Copper
Copper to Flotation Conc (%) 94.00%
Smelter Recovery (%) 96.60%
Overall Copper (%) 90.80%
Gold
Gold Bullion from CIP (%) 0.00%
Gold to Flotation Conc (%) 56.00%
Smelter Offtake Adjustment (%) 90.00%
Smelter Recovery (%) 98.00%
Overall Gold (%) 49.39%
The Copper recovery estimate in this table was based on an estimate developed in 2014. The gold
recovery estimate assumes gold recovery by flotation only. Smelter recoveries have been taken
from the current off-take agreements.
Operating costs
Since the Project will be mill constrained, the process operating costs are the sum of the fixed and
variable costs, and are as follows:
variable operating costs = $19.77/t processed
fixed costs (equivalent G&A costs in variable terms) = $7.53/t processed
total operating costs = $27.31/t processed
Details of these cost estimates and their derivation are outlined in Item 21 of this report.
Variable mining costs comprising drill, blast, load and haul costs, on a bench by bench basis, were
determined based upon a reference elevation at 1,032 RL. The mining cost was used for ore and
waste, and the overall average cost over the life of mine is as follows:
average mining cost = $2.06/t
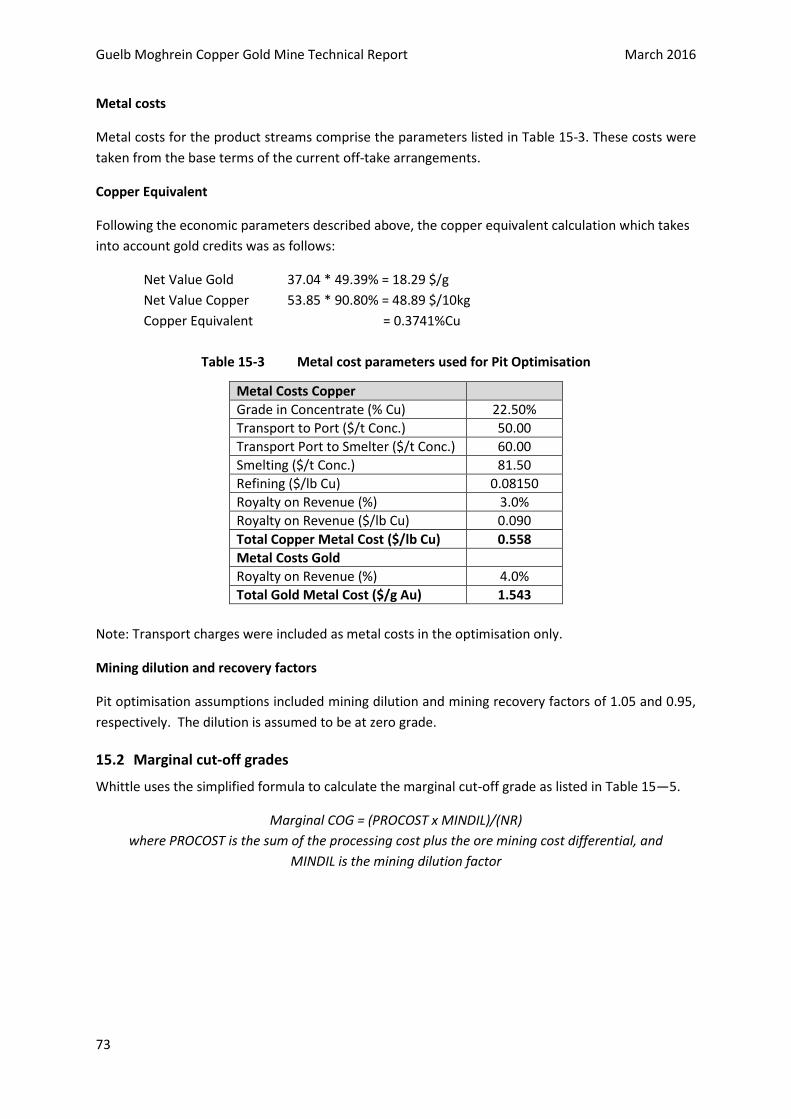
Guelb Moghrein Copper Gold Mine Technical Report March 2016
73
Metal costs
Metal costs for the product streams comprise the parameters listed in Table 15-3. These costs were
taken from the base terms of the current off-take arrangements.
Copper Equivalent
Following the economic parameters described above, the copper equivalent calculation which takes
into account gold credits was as follows:
Net Value Gold 37.04 * 49.39% = 18.29 $/g
Net Value Copper 53.85 * 90.80% = 48.89 $/10kg
Copper Equivalent = 0.3741%Cu
Table 15-3 Metal cost parameters used for Pit Optimisation
Metal Costs Copper
Grade in Concentrate (% Cu) 22.50%
Transport to Port ($/t Conc.) 50.00
Transport Port to Smelter ($/t Conc.) 60.00
Smelting ($/t Conc.) 81.50
Refining ($/lb Cu) 0.08150
Royalty on Revenue (%) 3.0%
Royalty on Revenue ($/lb Cu) 0.090
Total Copper Metal Cost ($/lb Cu) 0.558
Metal Costs Gold
Royalty on Revenue (%) 4.0%
Total Gold Metal Cost ($/g Au) 1.543
Note: Transport charges were included as metal costs in the optimisation only.
Mining dilution and recovery factors
Pit optimisation assumptions included mining dilution and mining recovery factors of 1.05 and 0.95,
respectively. The dilution is assumed to be at zero grade.
Marginal cut-off grades 15.2
Whittle uses the simplified formula to calculate the marginal cut-off grade as listed in Table 15—5.
Marginal COG = (PROCOST x MINDIL)/(NR)
where PROCOST is the sum of the processing cost plus the ore mining cost differential, and
MINDIL is the mining dilution factor

Guelb Moghrein Copper Gold Mine Technical Report March 2016
74
Table 15-4 Marginal cut-off grades (indicative averages)
Units Oxide
Marginal Cut-Off Grade:
PROCOST $/t ore 27.31
MINDIL factor
1.05
TOTAL NET RETURN $/10kg 53.85
Average Recovery % 90.8
C/O GRADE %Cu 0.586
It should be noted here that this Whittle cut-off grade calculation using the input parameters
described above, in particular the long term metal prices which were based on the December 2015
consensus forecasts, is the cut-off grade that was used for the reserves estimate.
Optimisation results 15.3
Figure 15-1 shows the graphical result of pit optimisation. The optimal shell (34) was selected on a
maximum net return (undiscounted) basis. Table 15—5 lists the complete inventory of shell sizes
and corresponding cashflows.
Figure 15-1 Guelb optimisation results
Initial analysis of pit optimisation with the base case parameters and comparison with the current pit
designs showed that the current Final Pit (Cut 3) matches reasonably well with the maximum net
return shell. Following detailed evaluation, the current final pit was modified and used to define this
Reserve update.
One thing that was noted during the review of the shells from the optimisation was that a new pit is
showing around the Oriental mineralisation which is adjacent to the north east crest of the final
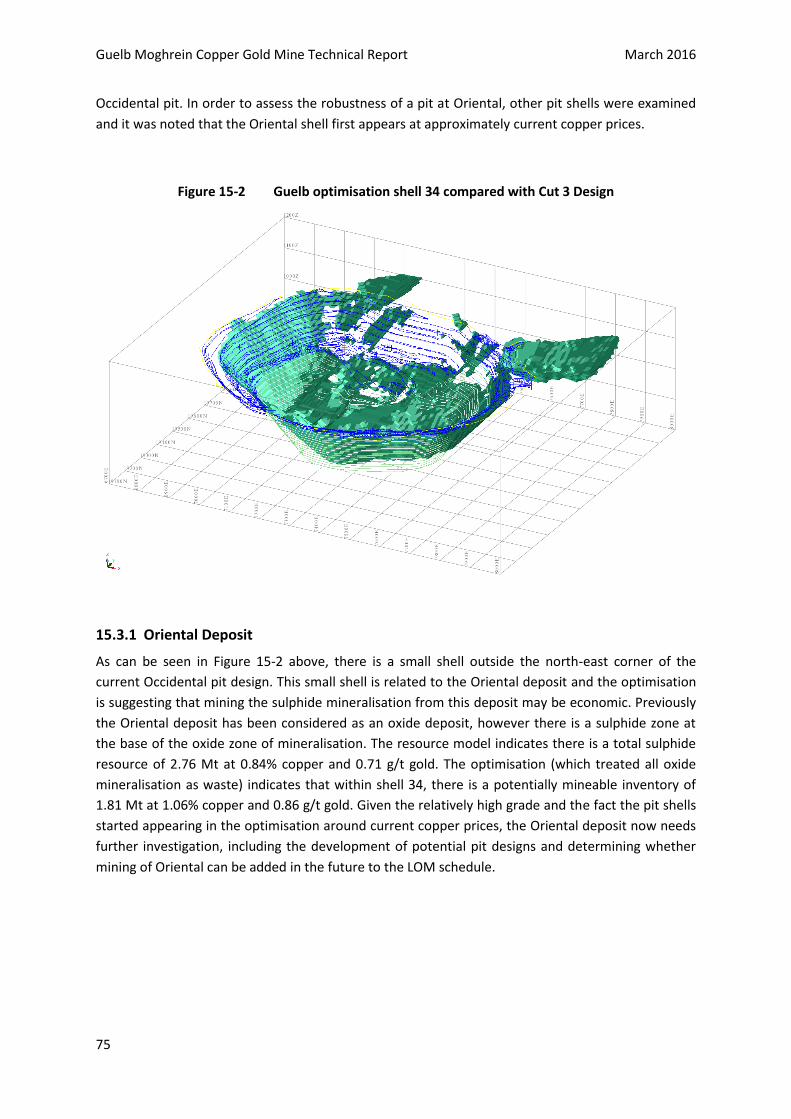
Guelb Moghrein Copper Gold Mine Technical Report March 2016
75
Occidental pit. In order to assess the robustness of a pit at Oriental, other pit shells were examined
and it was noted that the Oriental shell first appears at approximately current copper prices.
Figure 15-2 Guelb optimisation shell 34 compared with Cut 3 Design
Oriental Deposit 15.3.1
As can be seen in Figure 15-2 above, there is a small shell outside the north-east corner of the
current Occidental pit design. This small shell is related to the Oriental deposit and the optimisation
is suggesting that mining the sulphide mineralisation from this deposit may be economic. Previously
the Oriental deposit has been considered as an oxide deposit, however there is a sulphide zone at
the base of the oxide zone of mineralisation. The resource model indicates there is a total sulphide
resource of 2.76 Mt at 0.84% copper and 0.71 g/t gold. The optimisation (which treated all oxide
mineralisation as waste) indicates that within shell 34, there is a potentially mineable inventory of
1.81 Mt at 1.06% copper and 0.86 g/t gold. Given the relatively high grade and the fact the pit shells
started appearing in the optimisation around current copper prices, the Oriental deposit now needs
further investigation, including the development of potential pit designs and determining whether
mining of Oriental can be added in the future to the LOM schedule.

Guelb Moghrein Copper Gold Mine Technical Report March 2016
76
Table 15—5 Pit optimisation shell sizes and cashflow
Pit
Number
Revenue
Factor
Material
Mined
(Mt)
Total Ore
Processed
(Mt)
Strip Ratio
Waste:Ore
Grade
(%Cu)
Grade
(g/tAu)
Cu in
Conc
(kt)
Au in
Conc
(kt. Oz)
Pit Value
($M)
1 0.34 0.0 0.0 0.1 2.17 1.40 0.5 1.2 3.6
2 0.36 0.1 0.1 0.1 1.90 1.51 1.2 3.4 8.4
3 0.38 0.2 0.2 0.1 1.90 1.32 3.1 7.5 18.3
4 0.40 0.3 0.3 0.1 1.85 1.24 4.5 10.7 25.7
5 0.42 0.9 0.8 0.1 1.57 1.16 11.7 30.6 59.8
6 0.44 1.3 1.1 0.2 1.54 1.12 15.1 38.9 74.4
7 0.46 1.5 1.3 0.2 1.52 1.10 17.2 44.3 84.2
8 0.48 2.0 1.7 0.1 1.44 1.01 22.2 55.3 103.0
9 0.50 2.4 2.2 0.1 1.35 0.94 26.4 65.5 120.2
10 0.52 3.0 2.6 0.2 1.30 0.89 30.7 74.8 136.8
11 0.54 3.7 3.2 0.2 1.24 0.85 35.6 86.5 153.7
12 0.56 4.4 3.6 0.2 1.21 0.82 39.8 96.3 168.9
13 0.58 16.2 4.7 2.4 1.22 0.86 52.6 130.8 214.1
14 0.60 43.9 6.7 5.6 1.27 0.93 76.8 199.2 293.6
15 0.62 50.2 8.2 5.1 1.20 0.88 88.8 231.9 329.7
16 0.64 53.2 8.8 5.1 1.17 0.87 93.3 245.9 343.6
17 0.66 68.2 11.7 4.8 1.09 0.86 115.1 324.0 405.8
18 0.68 72.3 12.7 4.7 1.06 0.85 122.6 349.0 426.9
19 0.70 75.7 13.5 4.6 1.04 0.84 128.3 365.6 439.8
20 0.72 81.1 14.8 4.5 1.02 0.83 136.4 393.0 459.3
21 0.74 84.0 15.4 4.5 1.00 0.82 140.2 404.1 468.0
22 0.76 86.7 16.0 4.4 0.99 0.81 144.5 415.8 476.3
23 0.78 89.2 16.7 4.4 0.98 0.80 148.4 427.8 483.4
24 0.80 91.5 17.1 4.3 0.97 0.79 151.1 434.3 487.8
25 0.82 94.3 17.9 4.3 0.96 0.78 155.2 446.2 494.4
26 0.84 103.0 19.3 4.3 0.93 0.76 163.9 470.2 506.2
27 0.86 105.7 19.8 4.3 0.93 0.75 166.8 478.4 509.4
28 0.88 115.7 21.2 4.5 0.91 0.74 174.5 504.8 518.7
29 0.90 119.9 21.7 4.5 0.90 0.74 177.7 515.3 521.7
30 0.92 121.3 22.1 4.5 0.89 0.73 179.4 520.0 523.0
31 0.94 125.4 22.7 4.5 0.89 0.73 182.3 531.1 524.9
32 0.96 135.0 23.6 4.7 0.88 0.72 187.6 548.3 527.1
33 0.98 136.5 23.8 4.7 0.87 0.72 188.5 552.0 527.5
34 1.00 140.1 24.3 4.8 0.87 0.72 191.1 559.5 527.7
35 1.02 142.0 24.5 4.8 0.86 0.71 192.1 562.9 527.6
36 1.04 146.6 24.8 4.9 0.86 0.71 193.6 568.3 527.2
37 1.06 150.5 25.2 5.0 0.86 0.71 195.3 573.4 526.3
38 1.08 151.7 25.2 5.0 0.85 0.71 195.7 574.4 525.9
39 1.10 190.0 27.0 6.0 0.85 0.70 207.8 606.5 517.6
40 1.12 191.3 27.1 6.1 0.85 0.70 208.1 607.4 516.9
41 1.14 197.3 27.3 6.2 0.85 0.70 209.8 612.9 514.7
42 1.16 199.0 27.5 6.2 0.84 0.70 210.4 614.4 513.7
43 1.18 205.1 27.7 6.4 0.84 0.70 211.9 619.2 511.2
44 1.20 209.0 27.9 6.5 0.84 0.69 212.7 622.3 509.0
45 1.22 211.0 28.0 6.5 0.84 0.69 213.1 623.2 507.9
46 1.24 214.1 28.1 6.6 0.84 0.69 213.7 625.6 506.3
47 1.26 217.5 28.2 6.7 0.84 0.69 214.4 627.6 504.3
48 1.28 233.8 28.8 7.1 0.83 0.69 218.3 637.5 495.2
49 1.30 239.1 29.0 7.2 0.83 0.69 219.1 640.6 492.2
50 1.32 244.8 29.2 7.4 0.83 0.69 220.1 645.1 488.4
51 1.34 250.3 29.4 7.5 0.83 0.69 221.0 647.5 484.9
52 1.36 252.6 29.5 7.6 0.83 0.69 221.5 649.0 483.3
53 1.38 261.2 29.7 7.8 0.83 0.68 223.0 653.9 477.8
54 1.40 264.3 29.9 7.9 0.82 0.68 223.3 656.5 475.5
55 1.42 264.6 29.9 7.9 0.82 0.68 223.4 656.7 475.2
56 1.44 281.7 30.4 8.3 0.82 0.68 226.0 669.2 462.4
57 1.46 283.8 30.5 8.3 0.82 0.68 226.2 670.7 460.7
58 1.48 290.3 30.7 8.5 0.82 0.68 227.0 673.5 455.8
59 1.50 293.8 30.8 8.6 0.82 0.68 227.6 674.5 453.0
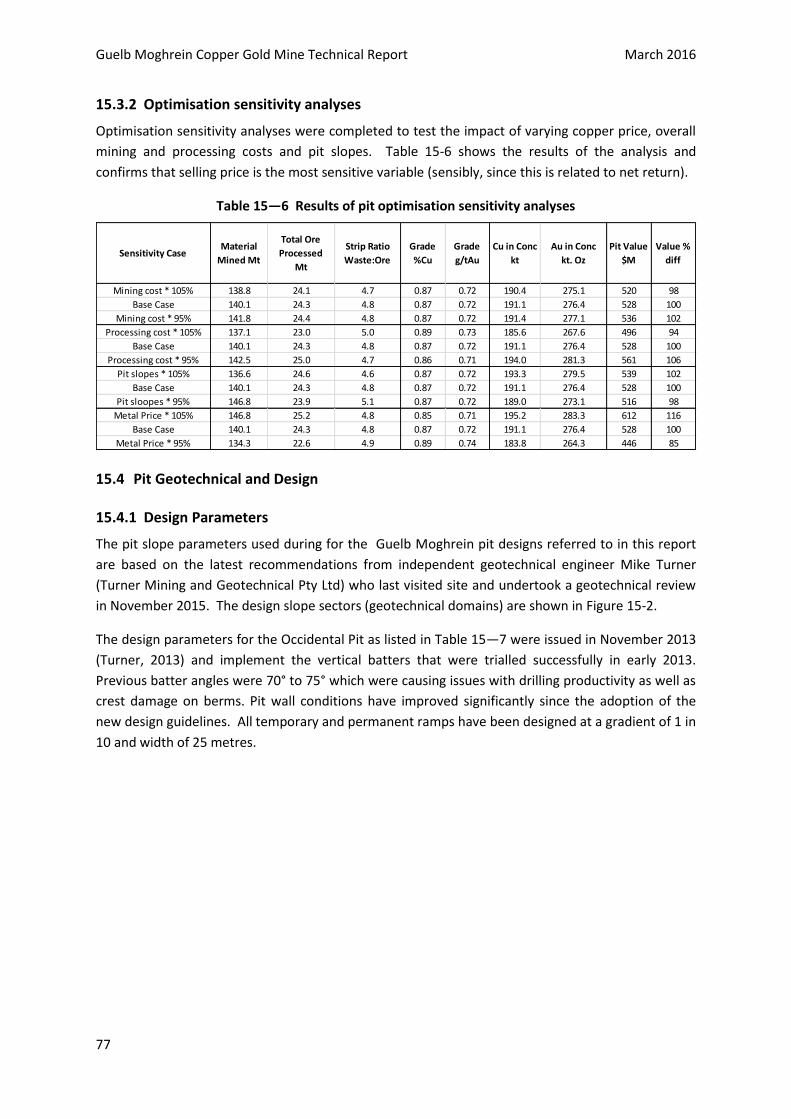
Guelb Moghrein Copper Gold Mine Technical Report March 2016
77
Optimisation sensitivity analyses 15.3.2
Optimisation sensitivity analyses were completed to test the impact of varying copper price, overall
mining and processing costs and pit slopes. Table 15-6 shows the results of the analysis and
confirms that selling price is the most sensitive variable (sensibly, since this is related to net return).
Table 15—6 Results of pit optimisation sensitivity analyses
Pit Geotechnical and Design 15.4
Design Parameters 15.4.1
The pit slope parameters used during for the Guelb Moghrein pit designs referred to in this report
are based on the latest recommendations from independent geotechnical engineer Mike Turner
(Turner Mining and Geotechnical Pty Ltd) who last visited site and undertook a geotechnical review
in November 2015. The design slope sectors (geotechnical domains) are shown in Figure 15-2.
The design parameters for the Occidental Pit as listed in Table 15—7 were issued in November 2013
(Turner, 2013) and implement the vertical batters that were trialled successfully in early 2013.
Previous batter angles were 70° to 75° which were causing issues with drilling productivity as well as
crest damage on berms. Pit wall conditions have improved significantly since the adoption of the
new design guidelines. All temporary and permanent ramps have been designed at a gradient of 1 in
10 and width of 25 metres.
Sensitivity CaseMaterial
Mined Mt
Total Ore
Processed
Mt
Strip Ratio
Waste:Ore
Grade
%Cu
Grade
g/tAu
Cu in Conc
kt
Au in Conc
kt. Oz
Pit Value
$M
Value %
diff
Mining cost * 105% 138.8 24.1 4.7 0.87 0.72 190.4 275.1 520 98
Base Case 140.1 24.3 4.8 0.87 0.72 191.1 276.4 528 100
Mining cost * 95% 141.8 24.4 4.8 0.87 0.72 191.4 277.1 536 102
Processing cost * 105% 137.1 23.0 5.0 0.89 0.73 185.6 267.6 496 94
Base Case 140.1 24.3 4.8 0.87 0.72 191.1 276.4 528 100
Processing cost * 95% 142.5 25.0 4.7 0.86 0.71 194.0 281.3 561 106
Pit slopes * 105% 136.6 24.6 4.6 0.87 0.72 193.3 279.5 539 102
Base Case 140.1 24.3 4.8 0.87 0.72 191.1 276.4 528 100
Pit sloopes * 95% 146.8 23.9 5.1 0.87 0.72 189.0 273.1 516 98
Metal Price * 105% 146.8 25.2 4.8 0.85 0.71 195.2 283.3 612 116
Base Case 140.1 24.3 4.8 0.87 0.72 191.1 276.4 528 100
Metal Price * 95% 134.3 22.6 4.9 0.89 0.74 183.8 264.3 446 85
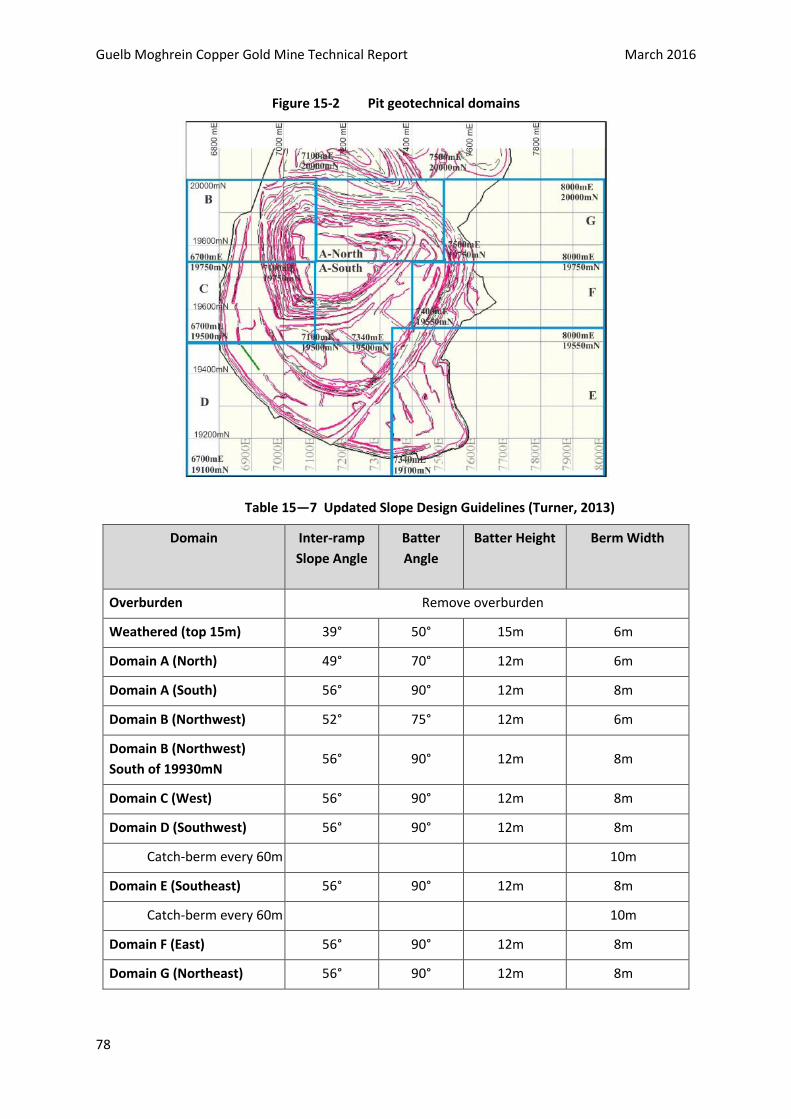
Guelb Moghrein Copper Gold Mine Technical Report March 2016
78
Figure 15-2 Pit geotechnical domains
Table 15—7 Updated Slope Design Guidelines (Turner, 2013)
Domain Inter-ramp
Slope Angle
Batter
Angle
Batter Height Berm Width
Overburden Remove overburden
Weathered (top 15m) 39° 50° 15m 6m
Domain A (North) 49° 70° 12m 6m
Domain A (South) 56° 90° 12m 8m
Domain B (Northwest) 52° 75° 12m 6m
Domain B (Northwest)
South of 19930mN 56° 90° 12m 8m
Domain C (West) 56° 90° 12m 8m
Domain D (Southwest) 56° 90° 12m 8m
Catch-berm every 60m 10m
Domain E (Southeast) 56° 90° 12m 8m
Catch-berm every 60m 10m
Domain F (East) 56° 90° 12m 8m
Domain G (Northeast) 56° 90° 12m 8m
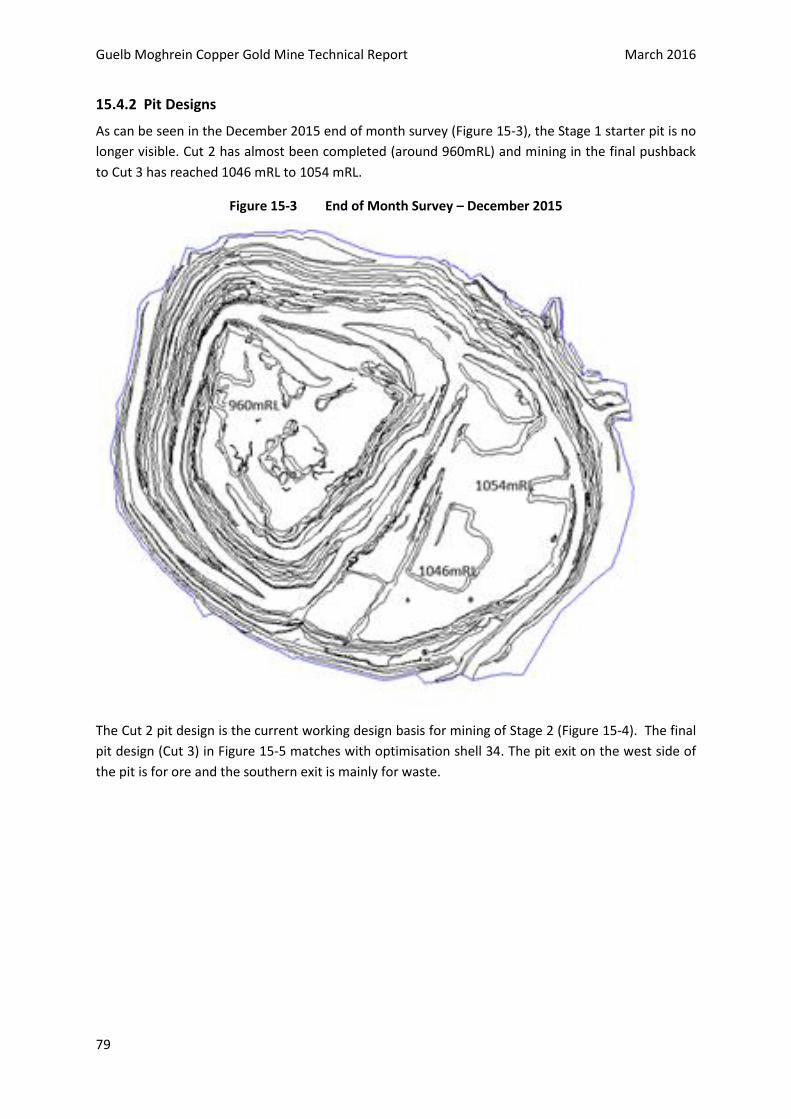
Guelb Moghrein Copper Gold Mine Technical Report March 2016
79
Pit Designs 15.4.2
As can be seen in the December 2015 end of month survey (Figure 15-3), the Stage 1 starter pit is no
longer visible. Cut 2 has almost been completed (around 960mRL) and mining in the final pushback
to Cut 3 has reached 1046 mRL to 1054 mRL.
Figure 15-3 End of Month Survey – December 2015
The Cut 2 pit design is the current working design basis for mining of Stage 2 (Figure 15-4). The final
pit design (Cut 3) in Figure 15-5 matches with optimisation shell 34. The pit exit on the west side of
the pit is for ore and the southern exit is mainly for waste.

Guelb Moghrein Copper Gold Mine Technical Report March 2016
80
Figure 15-4 Cut 2 Design
Figure 15-5 Guelb Ultimate Pit Design – December 2015

Guelb Moghrein Copper Gold Mine Technical Report March 2016
81
Mineral Reserve Estimate 15.5
Table 15.4 shows the NI 43-101 compliant reserve estimate for sulphide mineralisation contained
within the final pit (Figure 15.4) is 21.4 Mt after applying modifying factors to the Measured and
Indicated Resources as defined in the December 2015 Resource Statement (Table 14.1). A further 1.9
Mt of ore is on the ROM stockpile and 6.6 Mt of Low Grade material is on the long terms stockpiles.
Table 15-4 Guelb Moghrein Reserve Estimate, at $3.00/lb Cu and $1,200/oz Au
Guelb Moghrein Sulphide Ore Reserve Estimate December 31 2015
Volume Tonnes Tcu Au
Mbcm Mt % g/t
Pit
Proven Reserve 3.4 12.7 0.81 0.63
Probable Reserve 2.3 8.6 0.89 0.80
Total 5.7 21.4 0.84 0.70
ROM Stockpile
Proven Reserve 0.7 1.9 0.90 0.97
Probable Reserve - -
-
-
Total 0.7 1.9 0.90 0.97
Reserve Without Low Grade
Proven Reserve 4.1 14.7 0.82 0.68
Probable Reserve 2.3 8.6 0.89 0.80
Total 6.4 23.3 0.85 0.72
Low Grade Stockpile
Proven Reserve 2.5 6.6 0.42 0.55
Probable Reserve - -
-
-
Total 2.5 6.6 0.42 0.55
Reserve Including Low Grade
Proven Reserve 6.6 21.3 0.70 0.64
Probable Reserve 2.3 8.6 0.89 0.80
Total 8.9 29.9 0.76 0.68
The Low Grade Stockpile has a cu-equivalent grade of 0.63% which is above the cut-off grade of
0.586% Cu-eq. Therefore it is part of the Reserve at $3.00/lb Cu and $1200/oz Au.
It should be noted here that the Oriental mineralisation that is above cut-off grade but outside the
current pit has not been included in the Reserve estimate.
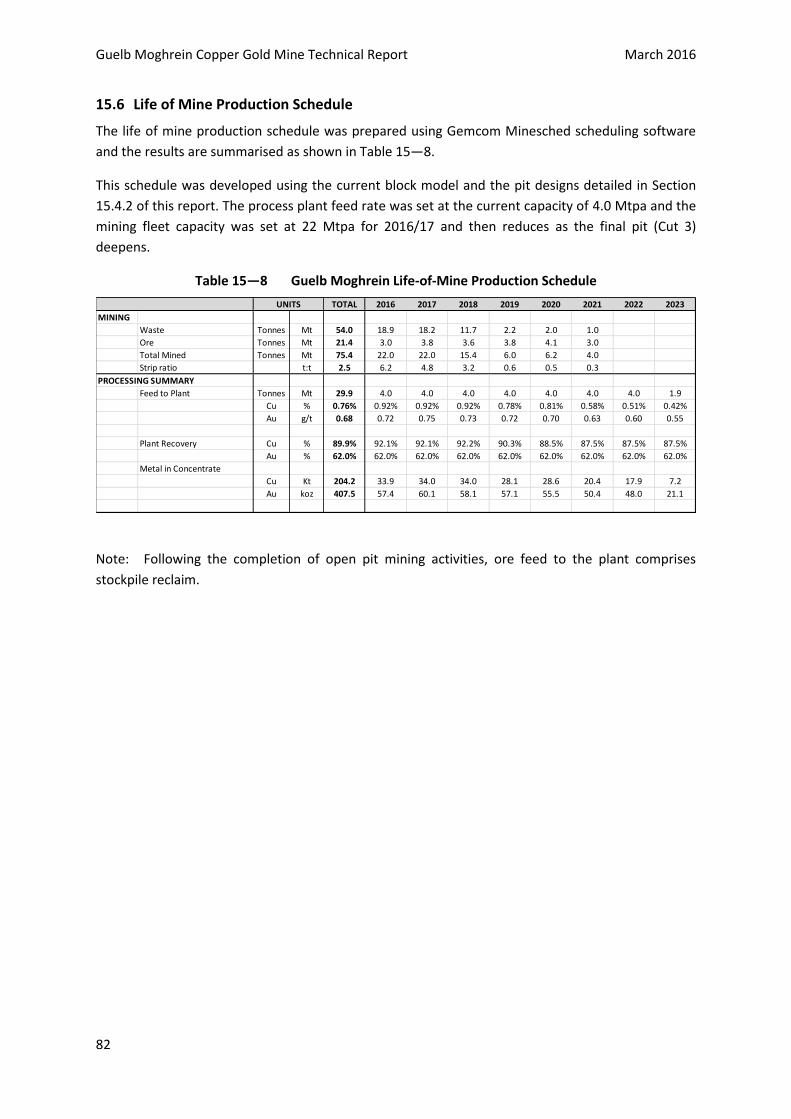
Guelb Moghrein Copper Gold Mine Technical Report March 2016
82
Life of Mine Production Schedule 15.6
The life of mine production schedule was prepared using Gemcom Minesched scheduling software
and the results are summarised as shown in Table 15—8.
This schedule was developed using the current block model and the pit designs detailed in Section
15.4.2 of this report. The process plant feed rate was set at the current capacity of 4.0 Mtpa and the
mining fleet capacity was set at 22 Mtpa for 2016/17 and then reduces as the final pit (Cut 3)
deepens.
Table 15—8 Guelb Moghrein Life-of-Mine Production Schedule
Note: Following the completion of open pit mining activities, ore feed to the plant comprises
stockpile reclaim.
TOTAL 2016 2017 2018 2019 2020 2021 2022 2023
MINING
Waste Tonnes Mt 54.0 18.9 18.2 11.7 2.2 2.0 1.0
Ore Tonnes Mt 21.4 3.0 3.8 3.6 3.8 4.1 3.0
Total Mined Tonnes Mt 75.4 22.0 22.0 15.4 6.0 6.2 4.0
Strip ratio t:t 2.5 6.2 4.8 3.2 0.6 0.5 0.3
PROCESSING SUMMARY
Feed to Plant Tonnes Mt 29.9 4.0 4.0 4.0 4.0 4.0 4.0 4.0 1.9
Cu % 0.76% 0.92% 0.92% 0.92% 0.78% 0.81% 0.58% 0.51% 0.42%
Au g/t 0.68 0.72 0.75 0.73 0.72 0.70 0.63 0.60 0.55
Plant Recovery Cu % 89.9% 92.1% 92.1% 92.2% 90.3% 88.5% 87.5% 87.5% 87.5%
Au % 62.0% 62.0% 62.0% 62.0% 62.0% 62.0% 62.0% 62.0% 62.0%
Metal in Concentrate
Cu Kt 204.2 33.9 34.0 34.0 28.1 28.6 20.4 17.9 7.2
Au koz 407.5 57.4 60.1 58.1 57.1 55.5 50.4 48.0 21.1
UNITS

Guelb Moghrein Copper Gold Mine Technical Report March 2016
83
ITEM 16 MINING METHODS
Mining Methods 16.1
Mining takes place in a single open pit which has been split into three stages. The mining is by
conventional drill/blast and load/haul activities. All of the materials currently mined require drilling
and blasting. The mine is an owner-operated site for its core activities with a contract for the supply
of explosives and blasting activities being undertaken by Bulk Mining Explosives from South Africa
(BME Pty). The explosives are emulsions and blends of emulsion and ammonium prills mixed on site
prior to loading.
MCM commenced mining in 2006 with a daily production rate of 17kt per day. The pit is currently
120 m deep and approximately 500 m x 800 m wide. The mining fleet was expanded twice to ramp
up the daily production to 22 kt in 2009 and again in 2013/14 with the addition of a second PC2000
excavator, to the current capacity of more than 70 kt per day. At this projected mining rate and
based on the latest updated Mineral Reserves as of December 2015 the pit will be completely mined
out by mid-2020. The mining will be scaled down for stockpile rehandle and processing until the end
of 2023, with minimum mining fleet and staff.
Table 16-1 Mining fleet as of December 2015
Qty Description of Unit Qty Make/model
9 Excavators 5 Komatsu PC1250-7 Hydraulic Excavator
1 Komatsu PC400-7 Rock breaker
1 Komatsu PC450-7 Rock Breaker
2 Komatsu PC2000-8
6 Drill Rigs 4 Cubex 1120
2 Furukawa DCR20
18 Dump Trucks 18 Komatsu HD785 -7
2 Water Trucks 1 Komatsu HD785 -7
1 Komatsu HD465-7
11 Ancillary Fleet 2 Komatsu 375A Track Dozer
1 Komatsu 275A Track Dozer
2 Komatsu WD600 Wheel Dozer
3 Komatsu GD705 Motor Grader
1 Caterpillar 14H Grader
1 Caterpillar D8R Track Dozer
Rehandle Fleet 1 Komatsu WA600 FEL

Guelb Moghrein Copper Gold Mine Technical Report March 2016
84
Mining Sequence 16.2
The mining sequence broadly follows the sequence of events as follows:
Grade control drilling will delineate the ore zones;
Blast patterns designed to reduce material throw and ore dilution along with a Blast Master
planning process controls sequence of operation;
Ore and waste are blasted and mined separately where possible as fragmentation requirements
vary significantly;
Waste is generally removed on each 6 metre bench prior to the mining of ore;
The removal of waste in the successive cut-backs utilises planned bulk systems of operation and
is generally done by the larger PC2000 excavators;
Trim blasts and perimeter blasting are utilised to ensure pit wall profiles are cut to the correct
angle and wall damage minimised;
120t class excavators (PC1250) load ore into the 90 tonne class truck (Komatsu 785) and ore is
hauled from the pit to the ROM area (and where possible tipped directly into the crusher).
Mine Planning Considerations 16.3
Mine Design Parameters 16.3.1
The Mine design parameters are discussed and presented in section 15.2 of this report.
Production Reconciliations 16.3.2
As per the grade control process, ore mark outs are assigned evaluated grades from the grade
control block model and are assigned to the digging and truck despatches for the respective ROM
stockpiles and waste dumps. Similarly, each ROM stockpile tonnage and grade is monitored via
depletions to the processing facility and additions from the mined material. Regular (monthly) pit
surveying allows for accurate assignment of tonnes and grades mined and despatched to the
respective destinations. Accordingly, feed to the plant is known and is verified with a milled
measurement for reconciliation of tonnes and grade. Final metal generated as concentrate is
reconciled back to the declared tonnes and grades. As the Resource model has recently been
updated, there has been no reconciliation of new production carried out however reconciliation of
the December 2015 Resource model against historical production indicates a reasonable correlation.
Mining Dilution and Recovery 16.3.3
Where possible, ore and waste are blasted and mined separately to minimise loss and dilution.
Planned loss and dilution has been built in to the geological model by the use of block sizes matched
to the SMU size. It has been estimated that this planned loss and dilution was approximately 3%. In
previous models and Reserves estimates a mining loss of 5% and dilution of 5% at zero grade had
been applied. As there is no valid method of determining unplanned loss and dilution and no new
mining/processing data to compare against the model, it was decided to maintain the overall 5% loss
and dilution estimates by adding a further 2% as unplanned loss and dilution. It is recommended
that these values be reviewed at the end of 2016 after checking 12 months’ worth of reconciliation
data between the December 2015 geological model and the actual mine and plant production.

Guelb Moghrein Copper Gold Mine Technical Report March 2016
85
Geotechnical Engineering 16.3.4
As noted in Section 15.3.1, the pit design parameters used during for the Guelb Moghrein pit
designs rare based on the latest update from independent Geotechnical Engineer Mike Turner of
Turner Mining Consulting who visits site annually and reviews data from site on a monthly basis.
Mine Dewatering 16.3.5
To date only minimal water has been encountered in the pit. Where water is encountered, the pit is
dewatered in advance using sumps in order to reduce pore pressures in the pit wall and maintain a
safe and efficient mining operation.
Mining and Processing Schedules 16.4
The Guelb Moghrein mine has been moving more than 25 Mtpa for the last three years (27 Mt in
2015). Ore production and processing commenced in late 2006 and in 2015 the plant achieved the
target production rate of 4 Mtpa.
The current LOM schedule runs until mid-2023 and has been developed using a series of 3 phases,
designed such that ore will be exposed without requiring excessive stripped waste inventories.
Currently ore is being mined from Phase 1 and Phase 2 is almost developed to the point that
sufficient ore is exposed and available to be able to target higher grade ore feed to the plant from
mid-2017 onwards. Waste movement in Phase 3 can also be delayed if necessary to conserve cash
now without adversely affecting the ore feed later on. The geometry of the deposit is sufficiently
well known that, provided waste mining is maintained in accordance with the schedules, ore
exposure is not likely to be a problem.
The primary drivers of the schedule are minimising grade variations and meeting the ore feed
targets. The mine and plant production schedule for the remaining life of the current pit, which is
approximately 8 years, is shown in Table 16-1.
Table 16-1 Guelb Moghrein Life of Mine Schedule –December 31 2015

Guelb Moghrein Copper Gold Mine Technical Report March 2016
86
ITEM 17 RECOVERY METHODS
Process Description 17.1
Ore from the open pit mine and stockpiles is crushed, milled and then undergoes sulphide flotation
to produce a copper-gold concentrate, which is shipped to offshore smelters (mainly in China).
Figure 17-1 is a schematic of the Guelb Moghrein flowsheet.
Crushing and grinding 17.1.1
Material from mining is received at the primary crusher feed dump pocket and feeds directly to the
primary gyratory crusher which is an Allis Chalmers 42-65 unit. Product material from the primary
crusher at a nominal size of 80% < 130 mm is conveyed to the covered dome stockpile with 7,000t
live capacity and a total capacity of more than 30,000 t. There is also an additional crushed ore
stockpile outside of the dome that may be fed with a front-end loader (FEL) when required. Crushed
ore is recovered from under the dome stockpile by two vibrating feeders onto a transfer conveyor
which feeds material to the crushed ore mill feed bin located in the mill area.
The primary SAG mill is a new Outotec mill that was commissioned in 2014 and is operated in open
circuit. It is fed by an apron feeder from the feed bin via two transfer conveyors to the SAG mill feed
chute The feed to SAG 1 is cascade controlled typically at about 500 wtph to 550 wtph on a mill
weight controller set at 240-260 tonnes.
From SAG 1 the ground material discharges onto a vibrating screen. The oversize has provision to be
routed to either a small stockpile area from where it is reclaimed by FEL or is conveyed back to the
mill surge bin feed conveyor. The undersize from SAG 1 discharge screen passes into a sump and
from there is pumped to the discharge sump of BM3.
The ball mill discharge sump is thus fed with SAG 1 discharge screen undersize, ball mill discharge
screen undersize and tailings from the Knelson concentrator circuit. This material is pumped to a 6
cyclones cluster, whose overflow reports to linear trash screens, whilst underflow reports to the ball
mill. The ball mill steel rejects report onto a conveyor then a bunker, where they are loaded out by
FEL.
Flotation 17.1.2
A Knelson concentrator is operated in the grinding circuit with the feed coming from the ball mill
discharge sump via a dedicated pump and the tailings being returned. The gravity concentrate is
transferred to the concentrate thickener.
The screened cyclone overflow pulp (P80 of minus 75µm) is then held in a rougher flotation feed
surge tank before being pumped to the rougher flotation conditioning tank with addition of the
sodium ethyl xanthate collector and frother. Rougher flotation consists of six 150 m3 flotation cells
where the concentrate subsequently undergoes three-levels of cleaning stages while the roughers
are operated in open circuit with the flotation tails discharged from the circuit.
Rougher concentrate is conditioned again and subjected to a series of six 50 m3 first cleaner flotation
cells where all the concentrate goes to the second cleaning stage while the tailings is fed to another

Guelb Moghrein Copper Gold Mine Technical Report March 2016
87
gold recovery gravity circuit with regrind. First cleaner concentrate is subjected to conditioning
before being fed to the second cleaner flotation consisting of seven 10 m3 flotation cells the
concentrate generally then goes to the final cleaning stage of a column cell and third cleaner
flotation, however the option is available to direct the concentrate from the first three cells direct to
the concentrate thickener. The third cleaners consist of three banks of two 3 m3 cells with the
concentrate combined with the column concentrate and pumped to the concentrate thickener.
Pyrrhotite is depressed at the cleaning stages by the addition of lime to increase the pH. Second and
third cleaner tails are pumped back to the first and second cleaner conditioning tanks, respectively.
First cleaner tails are pumped to a sump box coupled with two pumps going to two Falcon gravity
concentrators. The gravity gold concentrates are pumped to the concentrate thickener. The Falcon
tailings are pumped to hydrocyclones, with the underflow being reground using a vertimill to
liberate more of the gold particles, and subsequently goes back to the gravity concentrators while
the overflow is fed to further flotation in the scavenger circuit.
The feed to the scavenger flotation stage is first conditioned then goes to a series of seven scavenger
flotation cells – one of 150 m3 and six of 50 m3. The concentrate of the first three scavenger cells
goes back to the first cleaner conditioning tank while the rest of the concentrates is pumped back to
the rougher conditioning tank. Scavenger tailing is discharged from the circuit along with the
rougher tailings.
The plant is controlled using CITECT, an Outotec On Stream Analyser (OSA) with twelve streams
analysed and the recent (March 2016) commissioning of an SGS APC Flotation Expert System.
Concentrate 17.1.3
Final flotation concentrate is dewatered using a thickener and 2 disc filter presses. The copper gold
concentrate is then bagged into 2.1 tonne bulk bags and placed in containers. Twelve bags are
loaded in to each 6m container for trucking to the port at Nouakchott.
Magnetite Plant 17.1.4
The processing facility was extended in late 2014 early 2015 by adding a tailings processing plant for
the extraction of magnetite from the flotation plant tailings.
The flotation tailings is pumped from a surge tank with a 30 minute capacity and fed to four rougher
wet low-intensity magnetic separators (WLIMS) with two magnetic drums each. The rougher
magnetite concentrate is transferred to the magnetite regrind flotation circuit, whilst the non-
magnetic materials then go to the final tailings thickener.
Rougher magnetic concentrate is mixed with the regrind ball mill discharge slurry and pumped to
hydrocyclones for classification with an overflow P80 of minus 53µm and the underflow fed to the
regrind ball mill.
Hydrocyclone overflow reports to rougher flotation with three 100 m3 flotation cells. Flotation
reagents being the same as the copper-gold flotation plant (collector - sodium ethyl xanthate and
frother) are supplied by the current mixing and storage systems of the copper-gold plant.

Guelb Moghrein Copper Gold Mine Technical Report March 2016
88
The flotation cell concentrate is recycled back to the copper-gold flotation plant via the
Falcon/vertimill circuit.
The tails of the reverse-magnetite flotation circuit are pumped to the cleaner WLIMS consisting of
four modules of triple drums per unit with the magnetic product from the drums discharging into
magnetite concentrate filter feed tank.
All nonmagnetic tailings report to the tailings thickener feed box. Whilst operational, the plant
produced approximately 80tph of magnetite at a grade in excess of 69% Fe.
The water supply for the magnetite recovery plant utilises the existing operating facilities and does
not require additional water than that already in the circuit.
Unfortunately following commissioning and production of approximately 50,000 wt of magnetite the
plant was put on care and maintenance due to the significant fall in the iron ore price. Testwork is
currently in progress to produce magnetite of high quality that may be used for the dense media
industry for cleaning of coal production – with a significant price premium over standard magnetite
pricing.
Tailings disposal 17.1.5
Guelb Moghrein has two active tailings storage facilities, TSF2 and TSF3. TSF2 was commissioned in
September 2009, and TSF3 was commissioned in February 2015. Both are raised by the upstream
deposition method using spigoted tailings. The dam supernatant is recycled to the process plant by
means of a pump out decant.
Construction of a second TSF2 raise commenced in November 2012, however construction was
discontinued due to the limited storage capacity required prior to the deposition of magnetite free
tailings into a new TSF3 following commissioning of the magnetite processing plant in 2015. The
magnetite processing plant was eventually put on care and maintenance later in 2015 and the TSF2
raise resumed. The raising of TSF2 is scheduled to be completed during Q1 2016 and will continue to
be used as the main TSF for storage of magnetite-rich tailings.
As at the end of 2015, approximately 5.5 million tonnes of tailings had been deposited in the old
TSF1, 17.3 million tonnes in TSF2 and 0.16 million tonnes in the new TSF3. Planned tailings
production in 2016 is 3.80 million tonnes.

Guelb Moghrein Copper Gold Mine Technical Report March 2016
89
Figure 17-1 Flowsheet schematic

Guelb Moghrein Copper Gold Mine Technical Report March 2016
90
ITEM 18 PROJECT INFRASTRUCTURE
MCM have been operating the Guelb Moghrein mine since 2005 (over 10 years) and all the required
infrastructure is in place and has been in use for a number of years. In fact, much of the
Infrastructure was built by previous owners and operators of the mine and was in place prior to
MCM’s recommencement of mining and processing activities. Infrastructure currently includes:
Open pit mine
Flotation Processing facility
CIL tailings storage facility;
Waste rock dumps and ore stockpiles;
Mine workshops and administration building;
Two synchronised power generation stations;
Explosives mixing plant and storage facility;
Accommodation camp with messing facility as well as company owned housing in Akjoujt;
Saline and potable water bore field at Bennichab, some 70Km away from the mine;
Water storage reservoirs at site.
Roads and Transport 18.1
The property is accessed via a 250 km paved road which connects the capital Nouakchott with the
town of Akjoujt. A 5 km gravel road connects Akjoujt with the mine site.
Nouakchott has an international airport with regular flights to Europe, and North and West Africa.
Port facilities are available at Nouakchott and Nouâdhibou, with the latter being the export facility
for Mauritania’s iron ore production.
Power 18.2
The Guelb Moghrein mine has its own power station, using heavy fuel oil (HFO) as a fuel source.
Where possible (street lighting etc), solar panels are used to supplement the power station supply.
Water 18.3
Guelb Moghrein’s location in a dry region means that water is a critical supply item. Water is sourced
from MCM’s borefield in the Bennichab aquifer, 113 km to the southwest of the mine site. MCM
pipes the water from this source for use at Guelb Moghrein and also supplies water to the town of
Akjoujt.

Guelb Moghrein Copper Gold Mine Technical Report March 2016
91
ITEM 19 MARKET STUDIES AND CONTRACTS
MCM produces copper concentrate which also contains gold. The bulk of MCM product is sold to
smelters in China. Commercial and sales arrangements are handled by Metal Corp Trading, a
subsidiary of FQM. The off-take arrangements are subject to commercial confidentiality, however
the base terms of these agreements have been utilized to develop the long term Mineral Reserves
and cash flows.
Concentrate is bagged at site in 2t bags, then loaded in containers and trucked to the Port of
Nouakchott from where it is shipped by Maersk line to customers in China. When gold doré is
recovered through the CIL and/or gravity circuit, it is airfreighted from site via charters flight to
Nouakchott where international air liners are used for export to Switzerland.
Contracts 19.1
As an operating mine MCM has a series of on-going contracts for the supply of various services,
materials and consumables. These contracts are tendered and renewed as required on a regular
basis.
The concentrate off-take contracts identified in section 19.1 are re-tendered and negotiated as
needed to maintain an optimal commercial position for the mine.

Guelb Moghrein Copper Gold Mine Technical Report March 2016
92
ITEM 20 ENVIRONMENTAL STUDIES, PERMITTING, SOCIAL AND COMMUNITY IMPACT
MCM has operated to date and continues to operate under appropriate permits and regulation.
Environmental liabilities associated with the site are those that would be expected from a mining
site consisting of the open pit mine, process plant, waste dumps, tailing storage facilities, and
exploration drilling sites. The site was subject to an environmental impact assessment prior to the
commencement of the commercial production and has received all relevant permits and
authorization. An environmental management plan was adopted prior to commercial production.
Approvals and Commitments 20.1
In November 2004, First Quantum Minerals Limited (FQM) acquired the Guelb Moghrein Mine. In a
letter dated 22 August 2004 the Government of Mauritania indemnified FQM and MCM from
responsibility for any environmental degradation or pollution caused by previous operators of the
site.
In June 2005 all site environmental liabilities were documented by independent consultants in a
report titled ‘Guelb Moghrein Copper Gold Project, Environmental and Social Impact Assessment’.
The existing environmental liabilities were principally present in the physical form of an open pit
mine, waste rock dumps, magnetite tailings dump, redundant mill and gold plant, mining equipment,
non-operational generators and transformers, various tailings dumps and buried asbestos dump,
which appeared to have been abandoned by the previous mine operators without formal closure
procedures.
Despite the indemnity, FQM made a commitment to clean-up the mine site where it was practicable
and viable. A number of actions by FQM since 2004 have significantly reduced environmental
liabilities. The actions are summarised as follows:
The Morak tailings dam and contaminated sub soil were removed and placed within the lined
CIL gold tailings storage facility. The Morak tailings footprint has since been rehabilitated with
indigenous vegetation;
Waste rock was dumped on the old TORCO tailings with the main objective being reduction of
dust pollution;
Significant non-hazardous and hazardous waste including scrap metal and hydrocarbons have
been removed from site and disposed of in accordance with acceptable standards.
The most recent environmental impact study at Guelb Moghrein Mine assessed the impact of the
proposed magnetite circuit. This EIA was approved by the Mauritanian Government in June 2014.
Safety Performance 20.2
Generally the workforce requires education with respect to safety attitude, however and despite
this, MCM has developed and successfully implemented a good safety training system culminating in
a good safety record.

Guelb Moghrein Copper Gold Mine Technical Report March 2016
93
Social and Community Related Requirements 20.3
The mine continues to pursue its aim to make its presence in the region an opportunity for its host
community and the country as a whole. The Inchiry region is among the poorest in the country.
MCM has been actively involved in community development programs. Of high importance is the
restoration of the regional General Hospital, support to the community in the form of medicines,
hospital equipment staffing and maintenance, funding of an HIV/AIDS awareness campaign,
sponsoring national vaccination day, and many others.
In 2010 MCM commenced the renovation of some 260 km of the Nouakchott Akjoujt paved road.
The mine also supplies running water to the town of Akjoujt as well as to the nomad population who
keep livestock and live along the water supply pipeline from Bennichab.
As part of a capacity building program, MCM supports education in the region by funding the school
renovation program, sponsoring a bursary for a local graduate, and lately the construction of a
mining technician school in Akjout. Since 2005, MCM has spent more than $50 M on community
development and social programmes.
As noted in the Archaeology section below, the Company has agreed to work with French authorities
and academics in the CUPRUM project. One of the aims being to preserve the cultural patrimony of
the Inchiri region and to create further development sustainability support by encouraging activities
which can generate substantial incomes for people in the region. The first site visit related to the
project was completed in 2015 with another site visit planned in mid-2016.
Archaeology 20.4
All archaeological sites identified prior to the commencement of production by MCM in 2006 have
been investigated by a registered archaeological company. It is known that there was prehistorical
mining activity around the site and in 2015 a new project (CUPRUM) involving co-operation with
French archaeologists aims to investigate and highlight the mining history in the region.
Mine Closure Provisions 20.5
An independent Closure Plan was completed at the end of 2014. The Closure Plan included all
environmental liabilities and not only those associated with activities after 2004. The Closure Plan
for Guelb Moghrein Mine estimated that $ 15.7 million was required for planned closure and $ 20.2
million was required for rehabilitation.
Reclamation and Clean-up Activities 20.6
Prior to commissioning of TSF2, sulphide tailings were stored in a circular side-hill paddock type dam
covering an area of 1.2 km2 (TSF1). The tailings in this old storage facility will be reclaimed and
processed at the end of mine life to recover the contained gold, copper and magnetite.
Reclamation of the old Morak gold tailings dam was completed in 2015. The tailings and
contaminated sub soil was moved to the new CIL gold tailings storage facility. Rehabilitation of the
Morak Tailings Dam covering 10.8 hectares was also completed during 2015. About 150 trees of local
species (Acacia Flava) were planted in the area as part of the final rehabilitation plan. Acacia Flava
Guelb Moghrein Copper Gold Mine Technical Report March 2016
94
has an excellent tolerance to dry condition. This program of rehabilitation will be continue with the
additional planting of other local plant species.
Furthermore, rehabilitation of 7 ha of TORCO area (1970s processing; refer to Item 6.1) continued
during 2015 with the main objective being reduction of dust pollution. The rehabilitation work
entailed covering the area with waste rock.
Work to remove waste hydrocarbons produced by previous owners was also undertaken during
2015. 90% of the inventory and containers (mainly steel drums) has been removed from site by
contractors for treatment in Europe and Senegal; the balance will be completed in Q1 2016. A
rehabilitation of the area will then commence, with completion scheduled for Q3 2017.

Guelb Moghrein Copper Gold Mine Technical Report March 2016
95
ITEM 21 CAPITAL AND OPERATING COSTS
Capital Costs 21.1
The Guelb Moghrein copper mine has been operating for 10 years and there are no major capital
expenditures planned at this point in time. Replacement of mining equipment and major processing
plant components has been factored in to the operating costs used in this review.
As mentioned in other sections of this report, there are projects commencing in 2016 which may
result in extending the mine life. These projects are of too early a stage to have capital allocated to
them.
Operating Costs 21.2
The operating costs used in the cashflow summary in Item 22 of this report are based on actual costs
from mining and processing activities up to and including December 2015 as well forecast costs
taken from the MCM 2016 Budget/Five Year Forecast.
Table 21-2 Summary of Operating Costs by Cost Area for 2016 (basis for Life of Mine)
Ore processed 4.0 Mtpa
Copper produced 34,000 Tonnes
Gold produced 57,000 Ounces
Cost Area Annual Cost Unit Unit costs
(US$1,000’s)
Mining 26,700 US$/t mined 2.10
Processing 64,900 US$/t ore 16.24
G&A (incl Environment) 43,700 US$/t ore 10.92
Royalties 6,400 US$/t ore 1.59
US$/lb Cu 0.08
TC and RC 30,600 US$/t ore 6.76
US$/lb Cu 0.014
Note: Some numbers may not add up due to rounding
In pit optimisation terms, the Royalties along with the Treatement and Refining charges are referred
to as metal costs (Item 15.1.2). Also the optimisation specifically included product transport charges
as metal costs. In the cost model based on Actual and Budget cost items, the concentrate transport
charges are part of a haulage contract and included in operating costs (concentrate is back-hauled by
trucks bringing supplies to the mine).

Guelb Moghrein Copper Gold Mine Technical Report March 2016
96
Mining costs 21.2.1
The mining costs developed for the 2016 Budget were based on actual cost data (split by bench and
stage) as well as haul profiles developed monthly for 2016 and quarterly for the remoander of the
schedule. The budget mining cost takes account of:
fuel consumption for drilling rigs, shovels/excavators and trucks
tyre consumption for trucks
explosives and mining equipment maintenance consumables
operator wages
maintenance
trolley-assist waste haulage from mid-2016 onwards
Processing and G&A costs 21.2.2
Process and G&A operating cost inputs were also based on the detailed review of actual costs
incurred in 2015 as well as the 2016 Budget costs. Table 21-3 below lists the inputs for the fixed
component of the G&A costs.
Table 21-3 Fixed Cost Detail (basis for Optimisation and Life of Mine)
Cost Area Annual Cost Unit costs
(US$1,000’s) (US$/t ore)
Administration/Overhead 28,499
Dewatering 29
Grade Control 1,606
Total 30,133 7.53
Note: Some numbers may not add up due to rounding
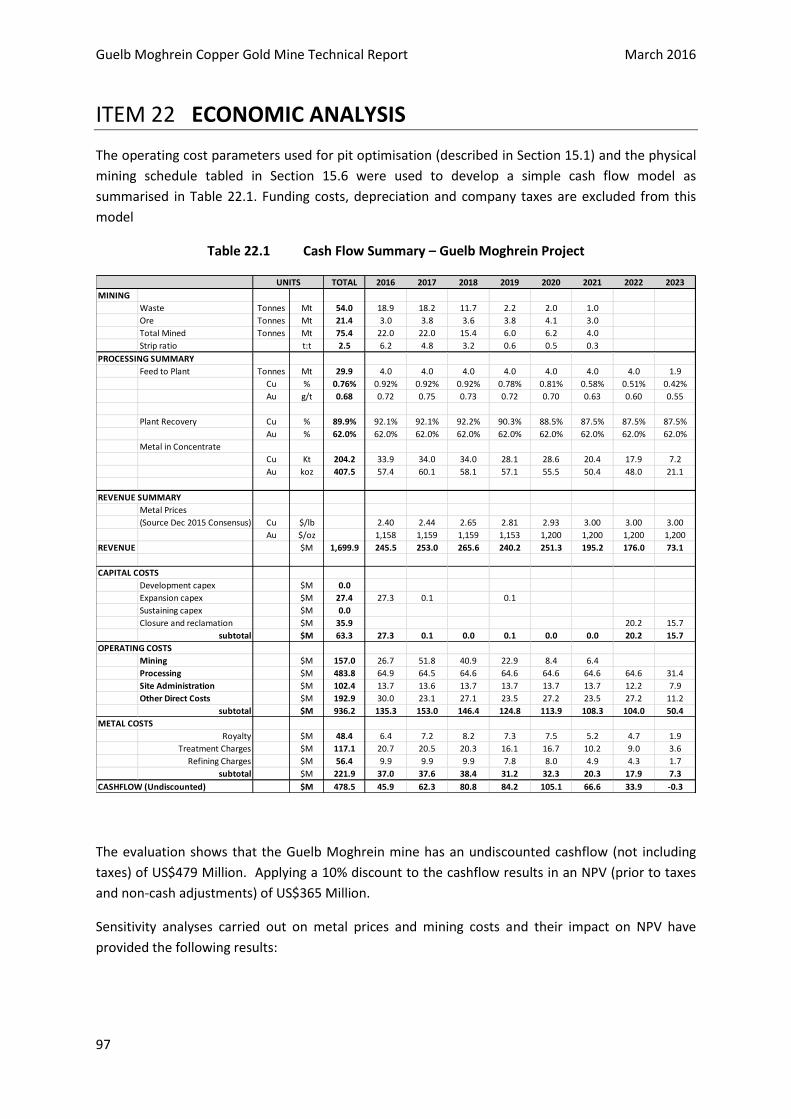
Guelb Moghrein Copper Gold Mine Technical Report March 2016
97
ITEM 22 ECONOMIC ANALYSIS
The operating cost parameters used for pit optimisation (described in Section 15.1) and the physical
mining schedule tabled in Section 15.6 were used to develop a simple cash flow model as
summarised in Table 22.1. Funding costs, depreciation and company taxes are excluded from this
model
Table 22.1 Cash Flow Summary – Guelb Moghrein Project
The evaluation shows that the Guelb Moghrein mine has an undiscounted cashflow (not including
taxes) of US$479 Million. Applying a 10% discount to the cashflow results in an NPV (prior to taxes
and non-cash adjustments) of US$365 Million.
Sensitivity analyses carried out on metal prices and mining costs and their impact on NPV have
provided the following results:
TOTAL 2016 2017 2018 2019 2020 2021 2022 2023
MINING
Waste Tonnes Mt 54.0 18.9 18.2 11.7 2.2 2.0 1.0
Ore Tonnes Mt 21.4 3.0 3.8 3.6 3.8 4.1 3.0
Total Mined Tonnes Mt 75.4 22.0 22.0 15.4 6.0 6.2 4.0
Strip ratio t:t 2.5 6.2 4.8 3.2 0.6 0.5 0.3
PROCESSING SUMMARY
Feed to Plant Tonnes Mt 29.9 4.0 4.0 4.0 4.0 4.0 4.0 4.0 1.9
Cu % 0.76% 0.92% 0.92% 0.92% 0.78% 0.81% 0.58% 0.51% 0.42%
Au g/t 0.68 0.72 0.75 0.73 0.72 0.70 0.63 0.60 0.55
Plant Recovery Cu % 89.9% 92.1% 92.1% 92.2% 90.3% 88.5% 87.5% 87.5% 87.5%
Au % 62.0% 62.0% 62.0% 62.0% 62.0% 62.0% 62.0% 62.0% 62.0%
Metal in Concentrate
Cu Kt 204.2 33.9 34.0 34.0 28.1 28.6 20.4 17.9 7.2
Au koz 407.5 57.4 60.1 58.1 57.1 55.5 50.4 48.0 21.1
REVENUE SUMMARY
Metal Prices
(Source Dec 2015 Consensus) Cu $/lb 2.40 2.44 2.65 2.81 2.93 3.00 3.00 3.00
Au $/oz 1,158 1,159 1,159 1,153 1,200 1,200 1,200 1,200
REVENUE $M 1,699.9 245.5 253.0 265.6 240.2 251.3 195.2 176.0 73.1
CAPITAL COSTS
Development capex $M 0.0
Expansion capex $M 27.4 27.3 0.1 0.1
Sustaining capex $M 0.0
Closure and reclamation $M 35.9 20.2 15.7
subtotal $M 63.3 27.3 0.1 0.0 0.1 0.0 0.0 20.2 15.7
OPERATING COSTS
Mining $M 157.0 26.7 51.8 40.9 22.9 8.4 6.4
Processing $M 483.8 64.9 64.5 64.6 64.6 64.6 64.6 64.6 31.4
Site Administration $M 102.4 13.7 13.6 13.7 13.7 13.7 13.7 12.2 7.9
Other Direct Costs $M 192.9 30.0 23.1 27.1 23.5 27.2 23.5 27.2 11.2
subtotal $M 936.2 135.3 153.0 146.4 124.8 113.9 108.3 104.0 50.4
METAL COSTS
Royalty $M 48.4 6.4 7.2 8.2 7.3 7.5 5.2 4.7 1.9
Treatment Charges $M 117.1 20.7 20.5 20.3 16.1 16.7 10.2 9.0 3.6
Refining Charges $M 56.4 9.9 9.9 9.9 7.8 8.0 4.9 4.3 1.7
subtotal $M 221.9 37.0 37.6 38.4 31.2 32.3 20.3 17.9 7.3
CASHFLOW (Undiscounted) $M 478.5 45.9 62.3 80.8 84.2 105.1 66.6 33.9 -0.3
UNITS
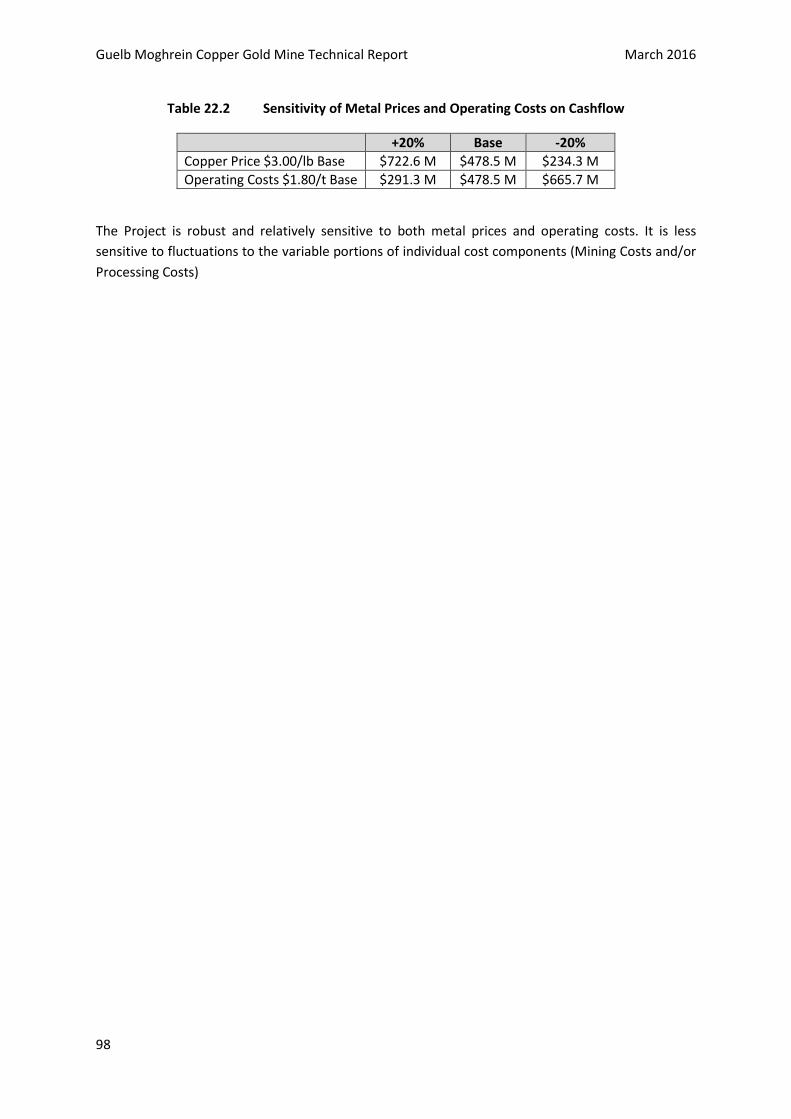
Guelb Moghrein Copper Gold Mine Technical Report March 2016
98
Table 22.2 Sensitivity of Metal Prices and Operating Costs on Cashflow
+20% Base -20%
Copper Price $3.00/lb Base $722.6 M $478.5 M $234.3 M
Operating Costs $1.80/t Base $291.3 M $478.5 M $665.7 M
The Project is robust and relatively sensitive to both metal prices and operating costs. It is less
sensitive to fluctuations to the variable portions of individual cost components (Mining Costs and/or
Processing Costs)

Guelb Moghrein Copper Gold Mine Technical Report March 2016
99
ITEM 23 ADJACENT PROPERTIES
Exploration completed by the Company includes several campaigns focused on targeting
mineralisation opportunities in the areas adjacent to the Guelb Moghrein deposit, within the
Concession area. Results have sterilised these immediate surrounds for any deposits of similar or
larger size to Guelb Moghrein. Hence, at the time of writing this report, there are no other projects
or any significant exploration programs on the ground immediately adjacent to Guelb Moghrein.
In relation to the additional five exploration concessions held by the Company and totalling 5,581
km2, the geology and mineralisation within these concessions is not considered to be material to the
subject of this Technical Report.

Guelb Moghrein Copper Gold Mine Technical Report March 2016
100
ITEM 24 OTHER RELEVANT DATA AND INFORMATION
The QP’s are not aware of any relevant data or information not already presented in this report.

Guelb Moghrein Copper Gold Mine Technical Report March 2016
101
ITEM 25 INTERPRETATIONS AND CONCLUSIONS
Mineral Resource Modelling and Estimation 25.1
The updated Guelb Moghrein Mineral Resource estimate, subject of this report, uses all available
drillhole data, including all diamond drill hole sample assay results, reverse circulation hole sample
results and with blast hole sample data used to guide mineralisation volumes. In addition, the
estimate is under-pinned by an improved interpretation of the prevailing geology that is now more
relevant to the spatial distribution of copper and gold mineralisation. In-pit exposure of the geology
and mineralisation has supported the local geology understanding and models. Interpolation
parameters used during block estimation were based upon geostatistical and spatial analysis
(variography) of the data coded to the geology domains and their volumes of mineralisation. The
updated Mineral Resource estimates were classified according to geological continuity, QAQC,
density data, drillhole grid spacing, grade continuity and confidence in the panel grade estimate. The
Mineral Resource statement, depleted to 31st December 2015, has been reported in accordance with
the guidelines of the Australasian JORC Code (JORC, 2012), which in turn complies with the
Standards on Mineral Resources and Reserves of the Canadian Institute of Mining, Metallurgy and
Petroleum (the CIM Guidelines, 2014).
Uncertainty and risk 25.1.1
In respect of the Mineral Resource estimate, and the opinion of David Gray (QP), the classifications
applied to the estimates at Guelb Moghrein accurately reflect the confidences in the geological
model and grade estimates.
Resources classed as Inferred were located along the deposit extremities where drillhole grid spacing
was more than 100 m away. However, Inferred Mineral Resources only comprise 5% of the total
available Mineral Resource, and therefore pose a low risk to the available mineralisation at Guelb
Moghrein. Of the total resource, approximately 50% has been categorised as Indicated Mineral
Resources which will benefit from improved confidence in the geology model and additional infill
drillhole data.
Compared with the previous estimate, this updated Mineral Resource estimate has increased the
tonnes and grades as guided by:
1. Additional diamond and reverse circulation drilling and sampling completed since the previous
estimate as infill and extension at Oriental and Occidental deeps
2. Further development of the Oriental deposit
3. In-pit exposures and pit geology mapping of lithology and structure
4. Use of blast hole sample data for better definition of mineralised volumes
5. Improved understanding in geological and grade continuity has resulted in additional
mineralisation domains, which in turn allow for more robust variography and robust block
grade estimates
6. Improvement of estimation methods from improved geostatistics, block dimensions, sample
selection routines

Guelb Moghrein Copper Gold Mine Technical Report March 2016
102
Mineral Reserve Estimation 25.2
The data is adequate to support the Mineral Reserve estimates using the categories of Mineral
Reserve estimates permitted under NI 43-101 within the designed final pits and based upon
Measured and Indicated Resources only.
Uncertainty and Risk 25.2.1
The Operation has been running for more than ten years and many of the operational parameters
for the open pit and process plant, including recoveries and costs, are known. In respect of the
Mineral Reserve estimate, and the opinion of Tony Cameron (QP), the classifications applied to the
estimates at Guelb Moghrein accurately reflect the confidences in the Resource model and
operational parameters and are deemed to be a low risk.
Mining 25.2.2
The mine footprint has expanded to the final pit limits and the final pushback is being developed in
order to maintain ore supply for the life of mine. Production targets are being met and MCM has
sufficient equipment on site to meet the future targets. The only issue in relation to mining, is blast
performance. This has been found to be a product related issue and MCM is working with the
supplier to resolve the issue. With respect to slope stability, the wall rock is competent and
management systems are in place. The risk in relation to the mining activities at the Guelb Moghrein
Mine is considered to be low.
Processing 25.2.3
Since commissioning, the Process plant has undergone several changes with the most significant
being the increase in throughput from 2 Mtpa to 4 Mtpa following the installation of a new Outotec
SAG Mill. Flow-sheet changes in the flotation circuit to handle the increased throughput along with
the OSA analysing additional streams has enabled the copper recoveries to be maintained with
lower feed grades and reduced residence time in the flotation circuit. In addition the introduction of
the centrifugal gravity concentrators has enabled the gold recovery to be significantly improved –
with further opportunities available as detailed in the recent gold deportment analysis.
With current management focussing on improving recoveries for both copper and gold with a strong
ethos to reduce costs. Whilst a CIL plant was commissioned in 2008 and a magnetite plant was
commissioned in 2015, both of these plants are currently idle as they are not economic to run under
current commodity prices.
Environmental Compliance 25.2.4
The most recent environmental impact study at Guelb Moghrein assessed the impact of the
magnetite circuit addition in early 2014. This EIA was approved by the Mauritanian Government in
June 2014. To date MCM has met all obligations and commitments with respect to Environmental
compliance. The environmental risk of the Guelb Moghrein Mine is considered to be low.
Social and Political Risk Management 25.2.5
The social and community risk of the Guelb Moghrein Mine is considered to be low.

Guelb Moghrein Copper Gold Mine Technical Report March 2016
103
Economic Sensitivity Analysis 25.2.6
The Guelb Moghrein mine is relatively robust and remains cashflow positive under conditions less
favourable than being currently experienced. The economic risk of the Guelb Moghrein Mine is
considered to be low.
Project Enhancement Studies 25.2.7
Mining of the Oriental deposit as a sulphide pit has been shown to be potentially economic using the
input parameters developed for and described in this report. A review of this option has
commenced.

Guelb Moghrein Copper Gold Mine Technical Report March 2016
104
ITEM 26 RECOMMENDATIONS
Geology and Mineral Resource estimation recommendations 26.1
Recommendations for continuous improvement in confidences of the Guelb Moghrein Mineral
Resource estimates include:
Continue with additional infill and extensional drilling in the near pit and deeper extension
areas in order to improve confidence of Indicated Resources estimates
Develop confidence in the Oriental Mineral Resources
Continue to improve upon quality sampling, analysis and QAQC routines for drilled samples
Develop the deposits 3D structural framework model for improved domaining and extensional
targeting.
Mineral Reserve Estimation and Mining 26.2
The following recommendations have been developed during the course of writing this report:
Continue to refine mine designs based on ongoing Geotechnical reviews.
In order to maintain and improve operational standards, quarterly reviews of the pit end of
month surveys are undertaken to monitor the accuracy of mining with respect to mine
designs. The reviews have shown a marked improvement in floor level control over the years
however, there is still room to improve further.
Continue extensional drilling studies (Oriental and Occidental deeps) to extend mine life.
Processing 26.3
With the operation currently at a mature stage the following areas for improvements are in
progress:
Alternative flotation reagent trials optimise pyrrhotite depression;
Additional Knelson by the Q3 2016;
Investigation into gravity concentrate processing options to produce bullion;
Testwork and subsequent plant trial is currently in progress to produce magnetite of high
quality that may be used for the dense media industry for cleaning of coal production – with a
significant price premium over standard magnetite pricing;
Investigation on additional column cell in the final cleaning state.
Environment 26.4
The Government of Mauritania has indemnified FQM and MCM from responsibility for any
environmental degradation or pollution caused by previous operators of the site. Nevertheless,
FQM has made a commitment to clean-up the mine site where it is practicable and viable. Some of
this work has been completed it is recommended that MCM aims to continue to meet the
commitment.

Guelb Moghrein Copper Gold Mine Technical Report March 2016
105
Project Enhancement Studies 26.5
With near-mine infill and extensional drilling commencing in 2016, MCM is actively seeking to
extend the life of the Project. The primary aims are to further evaluate the Oriental deposit as well
as identify and assess open pit and underground opportunities (both as extensions to the current pit
or as satellite projects). A tailings retreatment project is also being investigated and is primarily
focussed on tailings from the early phases of mining and processing (i.e. prior to 2012).
It is recommended that preparation for the enhancement projects is completed as soon as possible
so as to allow for expenditure on enhancement projects to be included in the 2017 annual budget
(due September 2016).

Guelb Moghrein Copper Gold Mine Technical Report March 2016
106
ITEM 27 REFERENCES
Bargmann, C. J. and Dominy, S. C., (2008), Technical Report on the Mauritania Copper Mines: Guelb
Mogherin resource estimation Project No. L00131. NI 43-101 Technical Report for Mauritania Copper
Mines by Snowden Mining Industry Consultants Limited.
CIM (2010). CIM Definition Standards on Mineral Resources and Mineral Reserves. Prepared by the
CIM Standing Committee on Reserve Definitions (adopted by CIM council 11-Dec-05).
Hitzman, M.W., Oreskes, N. and Einaudi, M.T. (1992). Geological characteristics and tectonic setting
of Proterozoic iron oxide (Cu-U-Au- REE) deposits. Precambrian Research, 58, pp 241 287.
Hitzman, M. W. (2002). Iron Oxide-Cu-Au Deposits: What, Where, When and Why. In Porter T. M.
(Ed), Hydrothermal Iron Oxide Copper- Gold & Related Deposits: A Global Perspective, Vol 1, 2nd
Edition. PGC publishing, Adelaide. p. 9-25.
Independent Metallurgical Laboratories Pty. Ltd. (2005). Project No. 2169: Metallurgical Ore
Characterisation of Guelb Moghrein Copper Ore for First Quantum Minerals Ltd., August 2005.
JORC (1996). Australian Code for Reporting of Identified Mineral Resources and Ore Reserves, July
1996.
Kirschbaum, M. (2007). Summary of 2007 Summer Field Work. Unpublished internal Powerpoint
presentation
Kolb, J., Sakellaris, G. A. and Meyer, F. M. (2006a). Controls on hydrothermal Fe oxide-Cu-Au-Co
mineralisation at the Guelb Moghrein deposit, Akjoujt area, Mauritania. Mineralium Deposita, 41,
68-81.
Kolb, J., Sakellaris, G. A. and Meyer, F. M. (2006b). Shear zone controlled IOCG mineralisation: the
Guelb Moghrein deposit, Akjoujt, Mauritania. Unpublished Powerpoint presentation.
Martyn, J. and Strickland, C. (2004). Stratigraphy, structure and mineralisation of the Akjoujt area,
Mauritania. Journal of African Earth Sciences, 38, pp 489 503.
Turner, M. (2013). Updated Guelb Moghrein Slope Design Guidelines. Report to MCM, July.
White, G. and O’Connor M., (2012). Summary Report on the Mineral Resource Estimate Update:
Guelb Moghrein Copper- Gold Deposit Mauritania for First Quantum Minerals (Unpublished Report
By CSA Global UK Ltd, 20 pp.)

Guelb Moghrein Copper Gold Mine Technical Report March 2016
107
ITEM 28 CERTIFICATES
David Gray
First Quantum Minerals Ltd 24 Outram St, West Perth, Western Australia, 6005
Tel +61 8 9346 0100; [email protected]
I, David Gray, do hereby certify that:
1. I am the Group Mine and Resource Geologist employed by First Quantum Minerals Ltd.
2. This certificate applies to the technical report entitled “Guelb Moghrein Copper Gold Mine, Inchiri, Mauritania, NI 43-101, Technical Report”, dated effective 30
th March 2016 (the “Technical Report”).
3. I am a professional geologist having graduated with a Bachelor of Science degree with Honours (1988) in Geology from Rhodes University in Grahamstown, South Africa.
4. I am a Member of the Australasian Institute of Mining and Metallurgy and a registered Professional Natural Scientist with the South African Council for Natural Scientific Professions (SACNASP).
5. I have worked as a geologist for a total of twenty six years since my graduation from university. I have over 16 years experience in production geology, over 5 years of exploration management of precious, base metal and copper deposits. During the last ten years I have consulted to and held senior technical mineral resource positions in copper mining companies operating in Central Africa and worldwide.
6. I have read the definition of “qualified person” as set out in National Instrument 43-101 – Standards of Disclosure for Mineral Projects (“NI 43-101”) and certify that, by reason of my education, affiliation with a professional association (as defined in NI 43-101) and past relevant work experience, I am a “qualified person” for the purposes of NI 43-101.
7. I most recently personally inspected the Guelb Moghrein property described in the Technical Report in November 2015.
8. I am responsible for the preparation of those portions of the Technical Report relating to geology, data collection, data analysis and verification and Mineral Resource estimation (namely Items 7 to 12 and 14).
9. I am not independent (as defined by Section 1.5 of NI 43-101) of First Quantum Minerals Ltd.
10. I have had prior involvement with the property that is the subject of the Technical Report. The nature of my prior involvement has been in the assurance of sampling QAQC, optimisation of estimation methods and the development of geology and mineralisation models.
11. I have read NI 43-101 and Form 43-101F1 and the Technical Report has been prepared in compliance with that instrument and form.
12. As of the date of this certificate, to the best of my knowledge, information and belief, the Technical Report contains all scientific and technical information that is required for it to be disclosed and to make the Technical Report not misleading.
Signed and dated this 30
th day of March, 2016 at West Perth, Western Australia, Australia.
David Gray

Guelb Moghrein Copper Gold Mine Technical Report March 2016
108
Tony Cameron Cameron Mining Consulting Ltd
20/F Central Tower, 28 Queen’s Road, Central, Hong Kong Tel +86 13521513186; [email protected]
I, Tony Cameron, do hereby certify that:
1. I am a Consultant Mining Engineer employed by Cameron Mining Consulting Ltd.
2. This certificate applies to the technical report entitled “Guelb Moghrein Copper Gold Mine Inchiri, Mauritania, NI 43-101, Technical Report”, dated effective 30
th March 2016 (the “Technical Report”).
3. I am a professional mining engineer having graduated with an undergraduate degree of Bachelor of Engineering (Mining) from the University of Queensland in 1988. In addition, I have obtained a First Class Mine Manager’s Certificate (No. 509) in Western Australia, a Graduate Dilpoma in Business from Curtin University (Western Australia) in 2000, and a Masters of Commercial Law from Melbourne University in 2004.
4. I am a Fellow of the Australasian Institute of Mining and Metallurgy.
5. I have worked as a mining engineer for a period in excess of twenty five years since my graduation from university. Over the last fifteen years I have worked as a consulting mining engineer on mine planning and evaluations for base metals operations and development projects worldwide.
6. I have read the definition of “qualified person” as set out in National Instrument 43-101 – Standards of Disclosure for Mineral Projects (“NI 43-101”) and certify that, by reason of my education, affiliation with a professional association (as defined in NI 43-101) and past relevant work experience, I am a “qualified person” for the purposes of NI 43-101.
7. I most recently personally inspected the Guelb Moghrein property described in the Technical Report in January 2015.
8. I am responsible for the preparation of those portions of the Technical Report relating to Mineral Reserve estimation and Mining, namely Items 15 and 16, respectively. I am also responsible for the preparation of those items of the Technical Report not covered specifically by the other qualified persons which are Items 1 to 6 and 18 to 28.
9. I am independent (as defined by Section 1.5 of NI 43-101) of First Quantum Minerals Ltd.
10. I have not had prior involvement with the property that is the subject of the Technical Report.
11. I have read NI 43-101 and Form 43-101F1 and the Technical Report has been prepared in compliance with that instrument and form.
12. As of the date of this certificate, to the best of my knowledge, information and belief, the Technical Report contains all scientific and technical information that is required for it to be disclosed and to make the Technical Report not misleading.
Signed and dated this 30th
day of March, 2016 at West Perth, Western Australia, Australia.
Tony Cameron

Guelb Moghrein Copper Gold Mine Technical Report March 2016
109
Andrew Briggs First Quantum Minerals Ltd
24 Outram St West Perth, Western Australia, 6005
Tel +61 8 9346 0100; [email protected]
I, Andrew Briggs, do hereby certify that:
1. I am the Group Consulting Project Metallurgist employed by First Quantum Minerals Ltd.
2. This certificate applies to the technical report entitled “Guelb Moghrein Copper Gold Mine, Inchiri, Mauritania, NI 43-101, Technical Report”, dated effective 30
th March 2016 (the “Technical Report”).
3. I am a professional metallurgist having graduated in 1974 from the Imperial College (Royal School of Mines), London, with a BSc (Eng) First Class in Metallurgy.
4. I am a Fellow of the Southern African Institute of Mining and Metallurgy, and am a Professional Engineer licenced by NAPEG (#L770) – the Association of Professional Engineers, Geologists and Geophysicists of the Northwest Territories (and Nanavut), Canada.
5. I have worked as a process engineer and metallurgist since graduation in 1974 (41 years); the first 13 years of which were in operating positions up to Metallurgical Manager in the gold mining industry. This was followed by 19 years in engineering companies in Process Design for projects worldwide, and finally 9 years with First Quantum Minerals Ltd as a Process Consultant.
6. I have read the definition of “qualified person” as set out in National Instrument 43-101 – Standards of Disclosure for Mineral Projects (“NI 43-101”) and certify that, by reason of my education, affiliation with a professional association (as defined in NI 43-101) and past relevant work experience, I am a “qualified person” for the purposes of NI 43-101.
7. I most recently personally inspected the Guelb Moghrein property described in the Technical Report in June 2014.
8. I am responsible for the preparation of those portions of the Technical Report relating to mineral processing/metallurgical testing and recovery methods, namely Items 13 and 17, respectively.
9. I am not independent (as defined by Section 1.4 of NI 43-101) of First Quantum Minerals Ltd.
10. I have been involved with the property that is the subject of the Technical Report, since inception. This work has included metallurgical testwork, process design for the plant and associated infrastructure, project planning, and engineering studies.
11. I have read NI 43-101 and Form 43-101F1 and the Technical Report has been prepared in compliance with that instrument and form.
12. As of the date of this certificate, to the best of my knowledge, information and belief, the Technical Report contains all scientific and technical information that is required for it to be disclosed and to make the Technical Report not misleading.
Signed and dated this 30th
day of March, 2016 at West Perth, Western Australia, Australia.
Andrew Briggs