guerra gikandi etal 2008 limitsandintensityofpfalciparumtransmission 7
DESCRIPTION
http://www.cddep.org/sites/default/files/guerra.gikandi.etal_.2008.limitsandintensityofpfalciparumtransmission_7.pdfTRANSCRIPT
The Limits and Intensity of Plasmodiumfalciparum Transmission: Implicationsfor Malaria Control and Elimination WorldwideCarlos A. Guerra
1,2, Priscilla W. Gikandi
1, Andrew J. Tatem
1,2, Abdisalan M. Noor
1,3, Dave L. Smith
4, Simon I. Hay
1,2*,
Robert W. Snow1,3*
1 Malaria Public Health and Epidemiology Group, Centre for Geographic Medicine, Kenyan Medical Research Institute–University of Oxford–Wellcome Trust Collaborative
Programme, Nairobi, Kenya, 2 Spatial Ecology and Epidemiology Group, Department of Zoology, University of Oxford, Oxford, United Kingdom, 3 Centre for Tropical
Medicine, John Radcliffe Hospital, University of Oxford, Oxford, United Kingdom, 4 Department of Zoology and Emerging Pathogens Institute, University of Florida,
Gainesville, Florida, United States of America
Funding: See section at end ofmanuscript.
Competing Interests: The authorshave declared that no competinginterests exist.
Academic Editor: Stephen JohnRogerson, Royal Melbourne Hospital,Australia
Citation: Guerra CA, Gikandi PW,Tatem AJ, Noor AM, Smith DL, et al.(2008) The limits and intensity ofPlasmodium falciparum transmission:Implications for malaria control andelimination worldwide. PLoS Med 5(2):e38. doi:10.1371/journal.pmed.0050038
Received: October 2, 2007Accepted: December 21, 2007Published: February 26, 2008
Copyright: � 2008 Guerra et al. This isan open-access article distributedunder the terms of the CreativeCommons Attribution License, whichpermits unrestricted use, distribution,and reproduction in any medium,provided the original author andsource are credited.
Abbreviations: AFRO, AfricanRegional Office of the WHO; AMRO,American Regional Office of the WHO;API, annual parasite incidence; EMRO,Eastern Mediterranean Regional Officeof the WHO; EURO, European RegionalOffice of the WHO; EVI, enhancedvegetation index; GIS, geographicinformation system; MAP, MalariaAtlas Project; pa, per annum; PAR,populations at risk; PfAPI, P. falciparumannual parasite incidence; Pf MEC, P.falciparum malaria endemic country;Pf PR, P. falciparum parasiteprevalence rate; Pf PR2–10, P.falciparum parasite prevalence ratecorrected to the 2–10 y age group;SEARO, Southeast Asian RegionalOffice of the WHO; WHO, World HealthOrganization; WPRO, Western PacificRegional Office of the WHO
* To whom correspondence should beaddressed. E-mail: [email protected] (SIH); [email protected] (RWS)
A B S T R A C T
Background
The efficient allocation of financial resources for malaria control using appropriatecombinations of interventions requires accurate information on the geographic distributionof malaria risk. An evidence-based description of the global range of Plasmodium falciparummalaria and its endemicity has not been assembled in almost 40 y. This paper aims to definethe global geographic distribution of P. falciparum malaria in 2007 and to provide a preliminarydescription of its transmission intensity within this range.
Methods and Findings
The global spatial distribution of P. falciparum malaria was generated using nationallyreported case-incidence data, medical intelligence, and biological rules of transmissionexclusion, using temperature and aridity limits informed by the bionomics of dominantAnopheles vector species. A total of 4,278 spatially unique cross-sectional survey estimates of P.falciparum parasite rates were assembled. Extractions from a population surface showed that2.37 billion people lived in areas at any risk of P. falciparum transmission in 2007. Globally,almost 1 billion people lived under unstable, or extremely low, malaria risk. Almost all P.falciparum parasite rates above 50% were reported in Africa in a latitude band consistent withthe distribution of Anopheles gambiae s.s. Conditions of low parasite prevalence were alsocommon in Africa, however. Outside of Africa, P. falciparum malaria prevalence is largelyhypoendemic (less than 10%), with the median below 5% in the areas surveyed.
Conclusions
This new map is a plausible representation of the current extent of P. falciparum risk and themost contemporary summary of the population at risk of P. falciparum malaria within theselimits. For 1 billion people at risk of unstable malaria transmission, elimination isepidemiologically feasible, and large areas of Africa are more amenable to control thanappreciated previously. The release of this information in the public domain will help focusfuture resources for P. falciparum malaria control and elimination.
The Editors’ Summary of this article follows the references.
PLoS Medicine | www.plosmedicine.org February 2008 | Volume 5 | Issue 2 | e380300
PLoSMEDICINE

Introduction
The magnitude of the public health burden posed bymalaria worldwide [1] and its connection to poverty [2] hasgalvanized the international donor community to put malariacontrol high on the development agenda and helped leverageunprecedented additional financing for malaria endemiccountries [3]. Progress toward agreed targets of interventioncoverage has been slow [4–6], but recent evidence indicates aprecipitous increase in access to effective drugs andprevention strategies in several countries [7–10]. In part, thisrenaissance in malaria control has served as a catalyst torevisit the possibility of malaria elimination in many regionsand countries [11–14]. A changing malaria landscape requiresan accurate spatial and dynamic description of malaria riskthat maps the spatial extent and need for control andelimination over the coming decades. Such a map isconspicuous by its absence [15].
Here, we present the first detailed description of the globaldistribution of P. falciparum risk in 40 y [16,17] by usinggeopositioned assemblies of national surveillance of malariarisk, medical intelligence, biological models of transmissionsuitability, and surveys of parasite prevalence. The paperfocuses on detailing the data sources and their adaptation forthe malaria cartography necessary to guide current diseasecontrol, with an emphasis on how we define the spatial limitsof stable and unstable P. falciparum risk worldwide.
Methods
Using Medical Intelligence to Define the Limits of P.falciparum Risk
Many countries have information assembled from medicalintelligence on the distribution of malaria risk within theirnational borders. This information is documented primarilyin reports from national health information systems thatdefine the annual numbers of confirmed parasite-specificlocal malaria infections by geographic unit, referred toclassically as the annual parasite incidence (API) [18–21].The API is generated from various combinations of active(fever surveys in communities where every person presentingwith a fever is tested for parasite infection) and passive(reports from febrile patients attending the local healthservices) case detection, and usually expresses the combinedresults as the number infected per 1,000 people per annum(pa) [18–21]. The precision of these estimates of malariaincidence are highly variable, and with the exception of somecountries where case identification is a primary control tool[22], these data cannot be used confidently to derive thepublic health burden posed by malaria [1,23–26]. They can,however, be a useful indicator of where local parasite species-specific malaria risk is likely or absent, and are particularlyplausible when triangulated with other sources of medicalintelligence, reported in international travel health guide-lines or by national malaria control programmes.
Malaria coordinating officers in the regional offices of theWorld Health Organization (WHO), responsible for thecollation of national API data from member countries werecontacted to obtain data reported nationally to the highestpossible geographic administrative unit level on populationsat risk and numbers of confirmed P. falciparum cases, for asmany years as were available between 2002 and 2006. Among
the countries in the American Regional Office, P. falciparum–specific API (PfAPI) data from national surveillance systemsin Brazil, Colombia, Peru, and Honduras were obtaineddirectly from personal communication with malaria special-ists. The reported cases of confirmed P. falciparum malaria per1,000 resident population were computed for each year byadministrative level and averaged over the number ofreporting years. Summary data were categorized as noautochthonous P. falciparum cases reported, ,0.1 autochtho-nous P. falciparum cases per 1,000 people pa, and �0.1autochthonous P. falciparum cases per 1,000 people pa. Thethreshold around 0.1 cases per thousand pa was used toprovide some indication of unstable conditions versus morestable transmission. This threshold is consistent with previoususes of PfAPI during the Global Malaria EradicationProgramme [27] and balanced against the confidence in theprecision of reported PfAPI values (Protocol S1). Each PfAPIsummary estimate was mapped by matching it to itscorresponding first-, second-, or third-level administrativeunit in a geographic information system (GIS; ArcView GIS3.2, ESRI, 1999).Mapped PfAPI data were then compared to other sources
of medical intelligence, notably national malaria controlpresentations at regional malaria meetings obtained fromregional WHO malaria coordinators and from Web sites,published sources that described national malaria epidemi-ology, and international travel and health guidelines [28,29].These combined approaches were particularly useful toidentify mapped descriptions of risk defined at higher spatialresolution than those described by the PfAPI reported acrosslarge first-level administrative units. Details of all sourcesused are provided in Protocol S1.
Defining the Biological Limits of P. falciparumTransmissionWithin the limits of risk described through PfAPI, environ-
mental conditions suitable for transmission vary enormously.These variations can be captured at much higher spatialresolution than it is possible to define by stratifying risk atadministrative unit levels. Climate-based determinants ofparasite and vector development and survival were developedthat impose biological constraints on the geographical limitsof P. falciparum transmission.First, we used a combination of the temperature-depend-
ant relationship between P. falciparum sporogony and thelongevity of the main dominant vectors to estimate theproportion of vectors surviving parasite development (Pro-tocol S2). Using mean monthly temperature records from a30-arcsec (;1 km) spatial resolution climate surface [30], theduration of P. falciparum sporogony was estimated for eachsynoptic calendar month, and those pixels where the durationof sporogony was 31 d or less were identified. The exceptionwas small areas that potentially support the longer-livedAnopheles sergentii and A. superpictus, where 62 d wereconsidered more appropriate biologically (Protocol S2). Thisresulted in 12 images with a binary outcome: P. falciparumsporogony could or could not be completed in the month.These images were then combined to identify the number ofsuitable months for P. falciparum transmission in a synopticyear. All pixels where the duration of sporogony exceeded 1mo, or 2 mo for areas within the range of A. sergentii and A.
PLoS Medicine | www.plosmedicine.org February 2008 | Volume 5 | Issue 2 | e380301
Mapping Global Malaria

superpictus, were masked since it was highly unlikely thattransmission would occur.
Second, there are areas within several malaria endemiccountries where, despite temperature being suitable forsporogony, arid conditions restrict Anopheles developmentand survival [31]. Limited surface water reduces the avail-ability of water bodies for oviposition. Moreover, low ambienthumidity in arid environments further affects egg and adultsurvival through the process of desiccation [32]. The ability ofadult vectors to survive long enough to contribute to parasitetransmission and of preadult stages to ensure minimumpopulation abundance is, therefore, dependent on the levelsof aridity and species-specific resilience to arid conditions.To capture the influence of aridity on transmission we usedthe enhanced vegetation index (EVI) derived from thebidirectional reflectance-corrected MODerate-resolutionImaging Spectroradiometer (MODIS) sensor imagery, avail-able at approximately 1-km spatial resolution [33,34] (Proto-col S2). Temporal Fourier–processed, monthly EVI imageswere used to develop 12 monthly surfaces that reclassifiedEVI � 0.1, assuming this corresponded to a good proxy forarid conditions [35,36]. Pixels were classified as suitable fortransmission if their EVI values were higher than 0.1 for atleast two consecutive months in an average year. Thisdefinition was based on the biological requirement, atoptimum temperatures, of at least 12 d to complete vectordevelopment from egg to adult [37] and on the assumptionthat a second month is required for a sufficient vectorpopulation to establish and transmit malaria [38]. Thesereclassified aridity images were then overlaid in a GIS toproduce 12 paired images. The 12 pairs were then combinedto define pixels where conditions were suitable for trans-mission. The aridity mask was treated differently from thetemperature-limiting mask to allow for the possibility, in aridenvironments, of highly over-dispersed transmission due toman-made water collection points and nomadic humanpopulations transporting vectors and parasites [39–41]. Amore conservative approach was taken, therefore, whichdown-regulated PfAPI risk by one class. In other words,extremely arid areas defined originally as at stable risk werestepped down to unstable risk and those classified initially asunstable to malaria free.
Estimating Populations at P. falciparum Transmission Riskin 2007
The Global Rural Urban Mapping Project alpha versionprovides gridded population counts and population densityestimates for the years 1990, 1995, and 2000, both adjustedand unadjusted to the United Nations’ national populationestimates [42]. We used the adjusted population counts forthe year 2000 and projected them to 2007 by applyingnational, medium variant, intercensal growth rates bycountry [43], using methods previously described [44]. Thisresulted in a contemporary population density surface ofapproximately 1-km spatial resolution, which was combinedwith the climate-adjusted PfAPI risk surface to extractpopulation at risk estimates using ArcView GIS 3.2 (ESRI,1999).
Describing Global Patterns of Parasite PrevalenceWe have described previously the rigorous process of
identifying, assembling, and geolocating community-based
survey estimates of parasite prevalence undertaken since1985 [45]. These data were used here to define the ranges of P.falciparum parasite prevalence rates (PfPR) in areas of stableand unstable malaria risk by WHO region. We acknowledgethat these geopolitical boundaries do not necessarily conformto ecological or biological spatial representations of malaria[46,47]. They do, however, represent coherent regions ofcollective planning and cooperation for malaria control. Inan attempt to minimize epidemiologically unrealistic dividesfor summary purposes, we have combined the SoutheastAsian (SEARO) and Western Pacific (WPRO), as well as theEastern Mediterranean (EMRO) and European (EURO)regions. The American WHO region (AMRO) and the AfricanWHO region (AFRO) were considered separately. PfPRestimates were reported in various age groupings. To stand-ardize to a single, representative age range of 2–10 y, weapplied an algorithm based on catalytic conversion modelsfirst adapted for malaria by Pull and Grab [48] and describedin detail elsewhere [49]. The geolocated and age-standardizedprevalence data (PfPR2�10) [45] were overlaid on the PfAPIrisk surface to extract a corresponding PfAPI value.
Results
PfAPI Data and Medical Intelligence to Define SpatialLimits of TransmissionThe PfAPI data identified 87 countries at risk of P.
falciparum transmission between 2002 and 2006, which wenow consider as P. falciparum endemic countries (PfMEC) in2007 (Protocol S1). PfAPI data were mapped to first, second,or third administrative level units across 41 PfMECs coveringa total of 8,789 unique polygons. These data incorporatecomplete years between 2002 and 2006, including summariesof three consecutive years for 16 countries, two consecutiveyears for eight countries, and the most recent complete yearfor 17 countries (Protocol S1). No information was availablefor 46 countries; mostly those in Africa. The spatialrepresentation of no risk, unstable (PfAPI , 0.1 per 1,000people pa), and stable risk (PfAPI � 0.1 per 1,000 people pa)of P. falciparum transmission globally is shown in Figure 1, toppanel.
Temperature and Aridity Masks to Constrain Limits ofTransmissionWithin the PfAPI limits of stable transmission (PfAPI � 0.1
per 1,000 pa) on the African continent, the areas with notemperature-suitable months for transmission were congru-ent with the high altitude areas in Ethiopia, Eritrea, westernKenya, eastern Tanzania, Rwanda, Burundi, eastern Demo-cratic Republic of the Congo, the Malagasy highlands, MountCameroon, and the eastern highland ranges in Zimbabwe(Figure 1, bottom panel). Outside of Africa, there was a closecorrespondence between the areas masked by the absence ofreported autochthonous cases and areas classified as unsuit-able for transmission based on low temperature in Andeanand Himalayan areas (Figure 1, bottom panel). The applica-tion of the temperature mask provided a finer spatialresolution constraint to PfAPI data, particularly for theisland of New Guinea and the highlands neighbouring the cityof Sana’a, Yemen. Important reductions in the spatial areas ofrisk were also evident in some administrative units inAfghanistan, Bhutan, China, India, and Kyrgyzstan.
PLoS Medicine | www.plosmedicine.org February 2008 | Volume 5 | Issue 2 | e380302
Mapping Global Malaria

The aridity mask constrained the mapped P. falciparumtransmission risk to small pockets in large administrativeboundaries from southern areas of Hilmand and Kandahar,in Afghanistan, the municipality of Djibouti, in Djibouti, andthe south-eastern provinces of Iran. The risk areas along theRed Sea coast of Saudi Arabia were also reduced furtherusing the aridity mask. Additional areas constrained withintheir spatial margins to no risk using the aridity maskincluded administrative units in India (n¼ 4), Pakistan (n¼ 9),Peru (n¼ 3), Kyrgyzstan (n¼ 2), Tajikistan (n¼ 1), and the lowrisk areas of Namibia bordering the Namib desert. Largeareas covered by the aridity mask were reduced from stable(PfAPI � 0.1 per 1,000 pa) to unstable risk (PfAPI , 0.1 per1,000 pa) in the Sahel. The transmission reducing effects ofaridity were also evidenced in Djibouti, Eritrea, northwestKenya, northeast Ethiopia, northern Somalia, central andcoastal areas of Yemen, and southern Pakistan. Importantly,these areas retained small pockets of higher, more-suitabletransmission conditions, corresponding to river tributaries
and irrigated land where higher transmission risk issupported [50].
Populations at RiskTable 1 provides a summary of the spatial extents and the
projected 2007 populations at risk (PAR) within areas ofassumed unstable (PfAPI , 0.1 per 1,000 pa) and stable P.falciparum transmission (PfAPI � 0.1 per 1,000 pa) globally andby WHO region. Country PAR estimations are also provided(Table S1). We estimate that there are 2.37 billion people atrisk of P. falciparum transmission worldwide, 26% located inthe AFRO region and 62% in the combined SEARO-WPROregions (Table 1). The definition of unstable risk outlinedhere is the predominant feature of exposure to transmissionin the EMRO-EURO region (Table 1). Low-risk areas in AFROwere also coincident with arid, low population density areas.Globally, 42% of the population exposed to some risk of P.falciparum was classified as inhabiting areas of unstabletransmission; the total population in these areas was 0.98billion people.
Figure 1. P. falciparum Malaria Risk Defined by Annual Parasite Incidence (top), Temperature, and Aridity (bottom)
Areas were defined as stable (dark-red areas, where PfAPI � 0.1 per thousand pa), unstable (pink areas, where PfAPI , 0.1 per thousand pa), or no risk(light grey). The few areas for which no PfAPI data could be obtained, mainly found in India, are coloured in dark grey. The borders of the 87 countriesdefined as P. falciparum endemic are shown. Highland areas where risk was excluded due to temperature appear in light grey. The aridity maskexcluded risk in a step-wise fashion, reflected mainly in the larger extents of unstable (pink) areas compared to the top panel, particularly in the Saheland southwest Asia (southern Iran and Pakistan).doi:10.1371/journal.pmed.0050038.g001
PLoS Medicine | www.plosmedicine.org February 2008 | Volume 5 | Issue 2 | e380303
Mapping Global Malaria

Global and Regional Summary of P. falciparum ParasitePrevalence
The summary data on age-corrected PfPR are presentedwithout adjustments for biological and climatic covariates,urbanization, congruence with dominant Anopheles vectorspecies, or any sampling issues inherent in an opportunisticsample of this kind. This is the subject of ongoing work. Thesummarized data, however, do provide important newinsights into the ranges of infection prevalence reportedbetween regions of the world within the P. falciparum spatiallimits of stable and unstable transmission. A total of 4,278spatially unique cross-sectional survey estimates of PfPR wereassembled as part of the activities of the Malaria Atlas Project
(MAP) by 01 September 2007. These included 186 (4.4%)surveys that were not possible to geolocate and are notconsidered further in the analysis. Of the positioned surveydata, 3,700 (90.4%) were derived from individual commun-ities (about 10 km2 or less), 131 from wide areas (more thanabout 10 km2 and about 25 km2 or less), 145 from smallpolygons (more than about 25 km2 and about 100 km2 or less),and 116 from large polygons (more than about 100 km2) [45].A total of 406 surveys were undertaken outside the definedspatial limits of P. falciparum transmission, of which 46reported presence of P. falciparum infection in the popula-tions surveyed and 360 reported zero prevalence afterallowing for a 10-km buffer around the limits. Thus, theoverall sensitivity adjusting for plausible positioning errors[51] was 98.5%. There were 611 surveys falling inside thelimits that reported zero prevalence. Even using the 10-kmbuffer the specificity of the limits was low (37.1%). Thisreflects the difficulties in estimating zero prevalence withoutlarge sample sizes [52], as well as the over-dispersed nature ofinfection risks between communities within small spatialscales [53].The global diversity of the age-corrected PfPR2–10 estimates
within the limits of transmission is shown in Figures 2–5. Atotal of 253 surveys reported zero prevalence among 2,121surveys undertaken in AFRO (Figure 2). Outside of Africa,358 surveys reported zero prevalence among 1,565 surveysundertaken within the defined limits of transmission. Over92% and 95% of surveys reporting PfPR2–10 � 50% and �75%, respectively, were located in AFRO and concentratedmostly between 158 latitude north and south, areas inhabited
Table 1. Area and Population at Risk of P. falciparum Malaria in2007
Region Area
(million km2)
PAR at PfAPI
�0.1% pa
(billion)
PAR at PfAPI
,0.1% pa
(billion)
Total
PAR
(billion)
AFRO 18.81 0.60 0.01 0.61
AMRO 8.23 0.04 0.05 0.09
EMRO-EURO 5.06 0.09 0.10 0.19
SEARO-WPRO 8.04 0.66 0.82 1.48
Globe 40.14 1.39 0.98 2.37
Detailed country estimates are presented in Table S1.%, per thousand.doi:10.1371/journal.pmed.0050038.t001
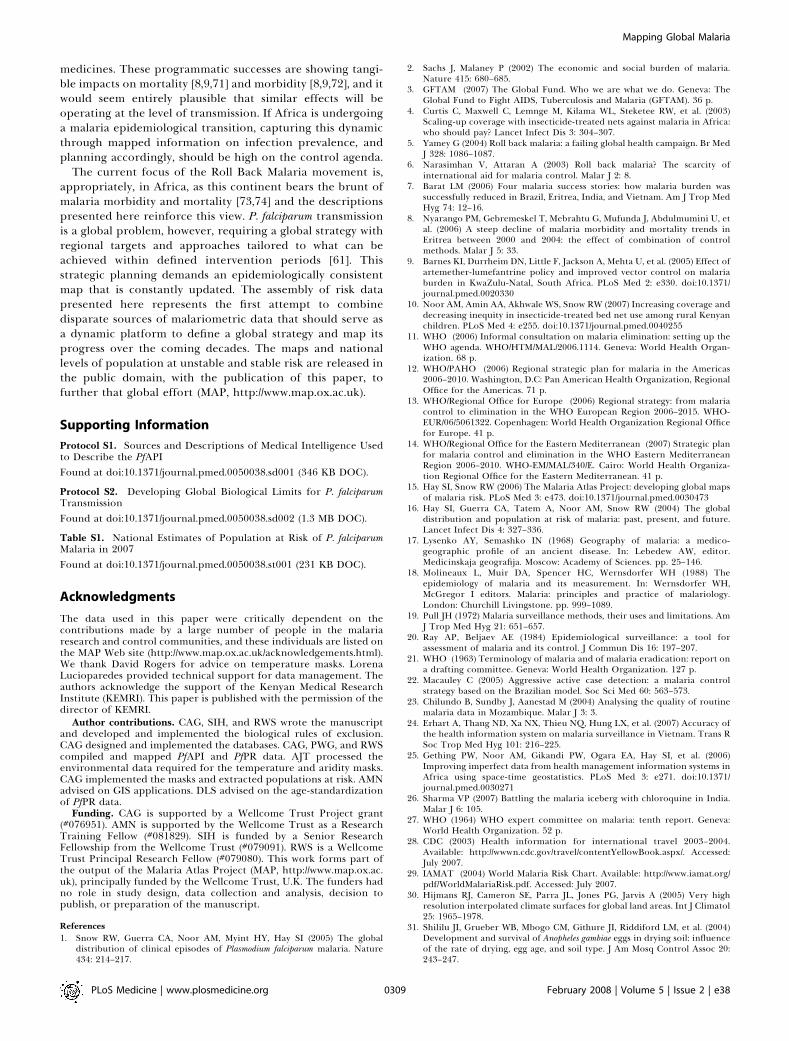
Figure 2. Community Surveys of P. falciparum Prevalence Conducted between 1985 and 2007 in AFRO
Other regions are shown in Figures 3–5. Of the 4,278 surveys reported globally, 4,092 could be geopositioned of which 3,686, shown in these figures,fell within the predicted limits of P. falciparum malaria risk. A total of 406 records, not shown in the figures, were found outside the limits, of which 46reported presence of P. falciparum. Data shown are age-standardized (PfPR2–10) and represented as a continuum from zero to 100%. Table 2 and Figure6 present detailed descriptive statistics for these data.doi:10.1371/journal.pmed.0050038.g002
PLoS Medicine | www.plosmedicine.org February 2008 | Volume 5 | Issue 2 | e380304
Mapping Global Malaria

by Anopheles gambiae s.s. [54] (Figure 2). Conversely lowerestimates of PfPR2–10 were described among those surveysconducted in areas occupying the A. arabiensis–dominantregions along the Sahel, horn, and southern areas of Africa[54] (Figure 2). In AMRO (Figure 3) and EMRO-EURO (Figure4), 87% and 65% of surveys reported PfPR2–10 below 10%,respectively, referred to classically as hypoendemic. Over65% of PfPR2–10 survey estimates in the combined SEARO-WPRO region reported infection prevalence below 10%(Figure 5), including 218 surveys reporting zero prevalence.
Despite notable gaps in the coverage of PfPR2–10 data inmany areas (Figures 2–5), a summary of the ranges ofprevalence survey estimates is provided in Table 2 and Figure6. These data are presented for the whole time period (Figure6, top panel) and stratified by time (Figure 6, middle andbottom panels). We stress that these data are not spatiallycongruent and therefore should not be viewed as represent-ing secular changes in PfPR2–10 estimates by WHO region.The data used for the bottom panel of Figure 6 arepotentially of greater value, however, when describing theendemicity characteristics of malaria within the spatial limitsshown in Figure 1, as they represent the most contemporarysummary of malaria endemicity judged by PfPR2–10.
Discussion
We have triangulated as much information as we couldassemble from exhaustive searches to provide an improvedevidence-based description of the limits of P. falciparumtransmission globally. The spatial referencing of healthstatistics, medical intelligence, and national expert opinion
represents, to our knowledge, the most complete, currentframework to understand the global distribution of P.falciparum risk in 2007. The use of plausible biologicalconstraints upon transmission, based on long-term temper-ature data and remotely sensed correlates of vegetation cover,improved the spatial precision of the limits and categories ofrisk. We estimate that there were 2.37 billion people at risk ofP. falciparum worldwide in 2007, and 40.1 million km2 of theworld might be able to support P. falciparum transmission.Assembling geographic information on disease risk is an
iterative process, building on new data and identifying gapsin our knowledge. We have presented previously thedistribution of P. falciparum using historical descriptions ofrisk [1,16] and through the reconciliation of information inmultiple travel advisories [55,56]. None have been perfectrepresentations of contemporary malaria distributionsworldwide, but such work has initiated a dialogue on theimportance of providing an evidence base to malariacartography and in the sharing of this information [15].We have not considered the spatial distribution of P. vivax
in this paper for a number of methodological reasons. First,the accuracy of health reporting systems for P. vivax clinicalcases in areas of coincidental P. falciparum risk is notoriouslypoor [57]. Second, the climatic constraints on parasite–vectorsurvival are less well defined and thus harder to predict usingstandardized regional-specific vector bionomics [58]. Third,the combined effects of a prolonged liver stage and theconsequences upon natural and drug-resistant recrudescencemake the interpretation of prevalence data considerablyharder for P. vivax compared to P. falciparum [59]. We areacutely aware that the spatial extent and disease burden of P.
Figure 3. Community Surveys of P. falciparum Prevalence Conducted between 1985 and 2007 in AMRO
doi:10.1371/journal.pmed.0050038.g003
PLoS Medicine | www.plosmedicine.org February 2008 | Volume 5 | Issue 2 | e380305
Mapping Global Malaria

vivax merits more attention than it has received, but toachieve an informed evidence-based map similar to that of P.falciparum demands a more fundamental construction of thebasic biology of transmission and clinical epidemiologybefore this can be attempted effectively.
We have been cautious in the use of the PfAPI datareported at national levels, recognizing the inadequacies andincompleteness of malaria surveillance [1,23–26]. The inten-tion has been to identify administrative reporting areas thathad not detected cases of P. falciparum malaria between 2002and 2006. It was also recognized that there existed a widerange of reported PfAPI estimates, from one case per 100,000people pa to reports of confirmed cases in almost 50% of thepopulation every year, which presents a problem for theclassification of risk. We therefore applied threshold criteriathat would distinguish areas of low clinical risk (i.e., thoseareas reporting few cases and likely to support unstabletransmission conditions) from areas with higher reportedcase incidence and probably more stable in their P. falciparumtransmission characteristics. Our use of a distinction betweenunstable and stable transmission at 0.1 per thousand pa, whileconservative is not without precedent. During the era of theGlobal Malaria Eradication Programme, epidemiologistsproposed a variety of criteria to describe malaria risk inconcert with preparatory, active, consolidation, and main-tenance phases of elimination and ultimate ‘‘eradication’’[60–63]. Parasite prevalence was the metric of choice fordefining baseline endemicity in the preparatory phase andwas useful as an indicator of control progress in the attackphase [52,64], until it became impossible to measure withcost-efficient sampling at very low levels of endemicity. Atthis juncture, it was proposed that malaria risk be measuredthrough incidence metrics such as the PfAPI [65]. Weidentified very few PfPR surveys (n ¼ 233) undertaken in
areas where reported PfAPI was below 0.1 per thousand pa, 70(30%) of which reported zero prevalence (Figures 2–5); andthe median parasite prevalence was 1.4% (Table 2). It seemsappropriate, practical, and feasible to consider multiplemetrics during the assembly of malaria risk maps, and wehave combined two common malariometric measures of risk:the PfAPI and PfPR. The mathematical relationship betweenthese measures and other traditional epidemiological meas-ures, such as the basic reproduction rate of infection and theentomological inoculation rate, is the subject of ongoingresearch [61]. Stratification of these risk areas by dominantvector species to enable a more informed assessment of theappropriate suites of intervention measures is also beingpursued actively [15].The PfPR data have been assembled from peer-reviewed
literature, unpublished ministry of health sources, postgrad-uate theses and provision of raw data from malaria scientistsin all malaria endemic regions [45]. They do not derive fromnationally representative, random-sample surveys. Theircoverage might, therefore, be subject to bias toward areasthought to be more malarious. The inclusion of 971 geo-positioned surveys reporting zero prevalence (including 523[53.8%] from Africa), however, does not support this view.Future investigation of the ecological and climatic cova-
riates of PfPR2–10 will need to move from the categoricaldescriptions of over-dispersed endemicity data presentedhere, to geostatistically robust estimates of risk that arecognisant of the many potential biases in these data acrossthe entire limits of stable transmission shown in Figure 1. Wenote, however, that as infection prevalence responds toincreased intervention coverage and access to effectivemedicines, the use of traditional biological covariates mightprove less effective in predicting the distribution of P.falciparum transmission intensity. Spatial models of PfPR
Figure 4. Community Surveys of P. falciparum Prevalence Conducted between 1985 and 2007 in EMRO-EURO
doi:10.1371/journal.pmed.0050038.g004
PLoS Medicine | www.plosmedicine.org February 2008 | Volume 5 | Issue 2 | e380306
Mapping Global Malaria

distribution are being developed and tested as part of MAP’songoing research to more accurately reflect the ranges ofmalaria transmission intensity within the margins of stableendemicity. Moreover, the PfAPI and PfPR data described inthe present paper will change with time, and future dataassemblies need to be maintained in a world with a rapidlychanging malaria epidemiology. The supporting geostatisticalmodels used to predict the spatial distribution of endemicitymust also therefore facilitate rapid updates. The annual
revision of the spatial limits of stable and unstable malaria,based upon new medical intelligence, PfAPI summaries, andthe increasingly available contemporary PfPR informationwill iteratively redefine the cartography of malaria and behosted on the MAP website (http://www.map.ox.ac.uk) as apublic domain resource [15].Assuming some degree of fidelity in the descriptions of
unstable malaria used here, we estimate that one quarter(;26%) of the malaria-endemic areas of the world are
Figure 5. Community Surveys of P. falciparum Prevalence Conducted between 1985 and 2007 in SEARO-WPRO
doi:10.1371/journal.pmed.0050038.g005
Table 2. Summaries of the P. falciparum Parasite Rate Data Reported between 1985 and 2007 and Mapped within the Spatial Limits ofP. falciparum Malaria
Region AFRO AMRO EMRO-EURO SEARO-WPRO Globe Stable Unstable
85–99 1,014 102 107 308 1,531 1,377 145
00–07 1,107 26 332 690 2,155 2,064 88
85–07 2,121 128 439 998 3,686 3,441 233
Absent 253 35 105 218 611 — —
Hypoendemic 452 76 180 434 1,142 — —
Mesoendemic 800 16 137 316 1,269 — —
Hyperendemic 400 1 11 25 437 — —
Holoendemic 216 0 6 5 227 — —
Minimum (%) 0 0 0 0 0 0 0
Q1 (%) 4.72 0 0.45 0.50 1.63 2.04 0
Median (%) 26.89 1.76 4.78 4.17 11.78 13.61 1.44
Mean (%) 32.38 4.42 11.70 11.01 23.16 24.43 5.27
Q3 (%) 54.49 4.29 15.80 16.35 39.64 41.82 5.00
Maximum (%) 99.77 50.48 99.77 93.91 99.77 99.77 63.52
The first three rows present numbers of records retrieved by time period (1985–1999 and 2000–2007) and the next five rows by endemic class [66], including absence (i.e., PfPR2–10¼ 0).The last rows (%) present descriptive statistics of the actual PfPR2–10 values, and the last two columns show these statistics by level of risk (stable: PfAPI � 0.1 per thousand pa andunstable: PfAPI , 0.1 per thousand pa). There were 12 records falling in areas where no PfAPI data could be obtained. See Figures 2–5.doi:10.1371/journal.pmed.0050038.t002
PLoS Medicine | www.plosmedicine.org February 2008 | Volume 5 | Issue 2 | e380307
Mapping Global Malaria
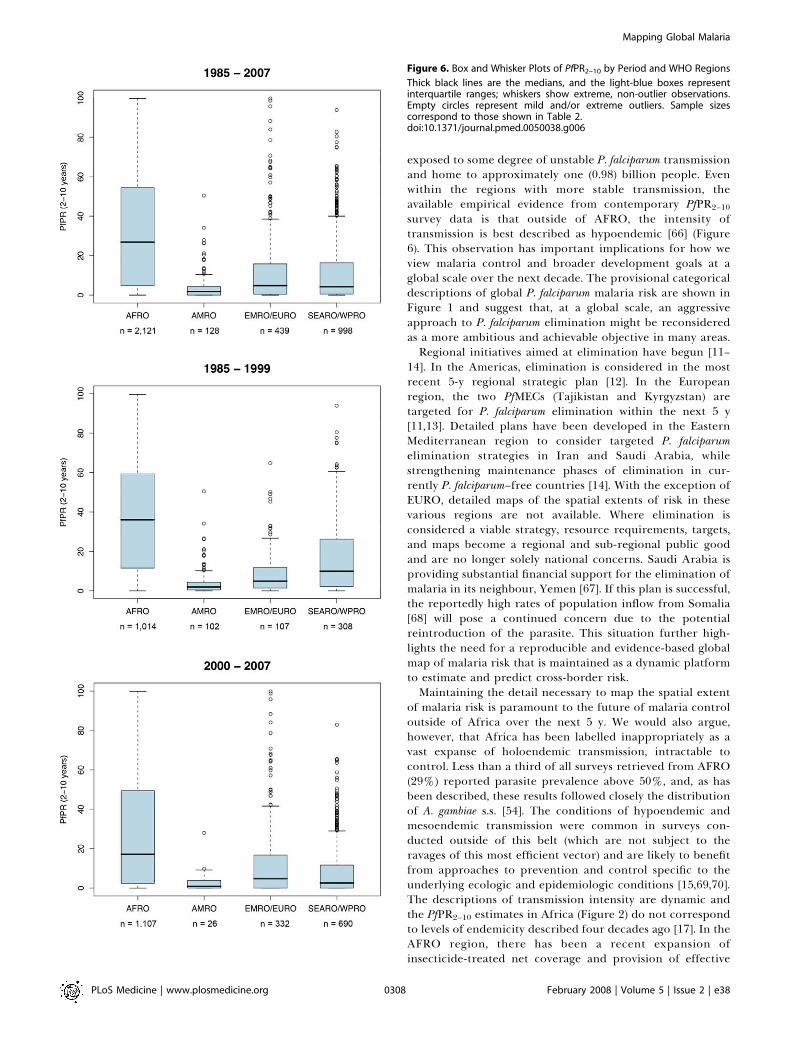
exposed to some degree of unstable P. falciparum transmissionand home to approximately one (0.98) billion people. Evenwithin the regions with more stable transmission, theavailable empirical evidence from contemporary PfPR2–10
survey data is that outside of AFRO, the intensity oftransmission is best described as hypoendemic [66] (Figure6). This observation has important implications for how weview malaria control and broader development goals at aglobal scale over the next decade. The provisional categoricaldescriptions of global P. falciparum malaria risk are shown inFigure 1 and suggest that, at a global scale, an aggressiveapproach to P. falciparum elimination might be reconsideredas a more ambitious and achievable objective in many areas.Regional initiatives aimed at elimination have begun [11–
14]. In the Americas, elimination is considered in the mostrecent 5-y regional strategic plan [12]. In the Europeanregion, the two PfMECs (Tajikistan and Kyrgyzstan) aretargeted for P. falciparum elimination within the next 5 y[11,13]. Detailed plans have been developed in the EasternMediterranean region to consider targeted P. falciparumelimination strategies in Iran and Saudi Arabia, whilestrengthening maintenance phases of elimination in cur-rently P. falciparum–free countries [14]. With the exception ofEURO, detailed maps of the spatial extents of risk in thesevarious regions are not available. Where elimination isconsidered a viable strategy, resource requirements, targets,and maps become a regional and sub-regional public goodand are no longer solely national concerns. Saudi Arabia isproviding substantial financial support for the elimination ofmalaria in its neighbour, Yemen [67]. If this plan is successful,the reportedly high rates of population inflow from Somalia[68] will pose a continued concern due to the potentialreintroduction of the parasite. This situation further high-lights the need for a reproducible and evidence-based globalmap of malaria risk that is maintained as a dynamic platformto estimate and predict cross-border risk.Maintaining the detail necessary to map the spatial extent
of malaria risk is paramount to the future of malaria controloutside of Africa over the next 5 y. We would also argue,however, that Africa has been labelled inappropriately as avast expanse of holoendemic transmission, intractable tocontrol. Less than a third of all surveys retrieved from AFRO(29%) reported parasite prevalence above 50%, and, as hasbeen described, these results followed closely the distributionof A. gambiae s.s. [54]. The conditions of hypoendemic andmesoendemic transmission were common in surveys con-ducted outside of this belt (which are not subject to theravages of this most efficient vector) and are likely to benefitfrom approaches to prevention and control specific to theunderlying ecologic and epidemiologic conditions [15,69,70].The descriptions of transmission intensity are dynamic andthe PfPR2–10 estimates in Africa (Figure 2) do not correspondto levels of endemicity described four decades ago [17]. In theAFRO region, there has been a recent expansion ofinsecticide-treated net coverage and provision of effective
Figure 6. Box and Whisker Plots of PfPR2–10 by Period and WHO Regions
Thick black lines are the medians, and the light-blue boxes representinterquartile ranges; whiskers show extreme, non-outlier observations.Empty circles represent mild and/or extreme outliers. Sample sizescorrespond to those shown in Table 2.doi:10.1371/journal.pmed.0050038.g006
PLoS Medicine | www.plosmedicine.org February 2008 | Volume 5 | Issue 2 | e380308
Mapping Global Malaria
medicines. These programmatic successes are showing tangi-ble impacts on mortality [8,9,71] and morbidity [8,9,72], and itwould seem entirely plausible that similar effects will beoperating at the level of transmission. If Africa is undergoinga malaria epidemiological transition, capturing this dynamicthrough mapped information on infection prevalence, andplanning accordingly, should be high on the control agenda.
The current focus of the Roll Back Malaria movement is,appropriately, in Africa, as this continent bears the brunt ofmalaria morbidity and mortality [73,74] and the descriptionspresented here reinforce this view. P. falciparum transmissionis a global problem, however, requiring a global strategy withregional targets and approaches tailored to what can beachieved within defined intervention periods [61]. Thisstrategic planning demands an epidemiologically consistentmap that is constantly updated. The assembly of risk datapresented here represents the first attempt to combinedisparate sources of malariometric data that should serve asa dynamic platform to define a global strategy and map itsprogress over the coming decades. The maps and nationallevels of population at unstable and stable risk are released inthe public domain, with the publication of this paper, tofurther that global effort (MAP, http://www.map.ox.ac.uk).
Supporting Information
Protocol S1. Sources and Descriptions of Medical Intelligence Usedto Describe the PfAPIFound at doi:10.1371/journal.pmed.0050038.sd001 (346 KB DOC).
Protocol S2. Developing Global Biological Limits for P. falciparumTransmission
Found at doi:10.1371/journal.pmed.0050038.sd002 (1.3 MB DOC).
Table S1. National Estimates of Population at Risk of P. falciparumMalaria in 2007
Found at doi:10.1371/journal.pmed.0050038.st001 (231 KB DOC).
Acknowledgments
The data used in this paper were critically dependent on thecontributions made by a large number of people in the malariaresearch and control communities, and these individuals are listed onthe MAP Web site (http://www.map.ox.ac.uk/acknowledgements.html).We thank David Rogers for advice on temperature masks. LorenaLucioparedes provided technical support for data management. Theauthors acknowledge the support of the Kenyan Medical ResearchInstitute (KEMRI). This paper is published with the permission of thedirector of KEMRI.
Author contributions. CAG, SIH, and RWS wrote the manuscriptand developed and implemented the biological rules of exclusion.CAG designed and implemented the databases. CAG, PWG, and RWScompiled and mapped PfAPI and PfPR data. AJT processed theenvironmental data required for the temperature and aridity masks.CAG implemented the masks and extracted populations at risk. AMNadvised on GIS applications. DLS advised on the age-standardizationof PfPR data.
Funding. CAG is supported by a Wellcome Trust Project grant(#076951). AMN is supported by the Wellcome Trust as a ResearchTraining Fellow (#081829). SIH is funded by a Senior ResearchFellowship from the Wellcome Trust (#079091). RWS is a WellcomeTrust Principal Research Fellow (#079080). This work forms part ofthe output of the Malaria Atlas Project (MAP, http://www.map.ox.ac.uk), principally funded by the Wellcome Trust, U.K. The funders hadno role in study design, data collection and analysis, decision topublish, or preparation of the manuscript.
References1. Snow RW, Guerra CA, Noor AM, Myint HY, Hay SI (2005) The global
distribution of clinical episodes of Plasmodium falciparum malaria. Nature434: 214–217.
2. Sachs J, Malaney P (2002) The economic and social burden of malaria.Nature 415: 680–685.
3. GFTAM (2007) The Global Fund. Who we are what we do. Geneva: TheGlobal Fund to Fight AIDS, Tuberculosis and Malaria (GFTAM). 36 p.
4. Curtis C, Maxwell C, Lemnge M, Kilama WL, Steketee RW, et al. (2003)Scaling-up coverage with insecticide-treated nets against malaria in Africa:who should pay? Lancet Infect Dis 3: 304–307.
5. Yamey G (2004) Roll back malaria: a failing global health campaign. Br MedJ 328: 1086–1087.
6. Narasimhan V, Attaran A (2003) Roll back malaria? The scarcity ofinternational aid for malaria control. Malar J 2: 8.
7. Barat LM (2006) Four malaria success stories: how malaria burden wassuccessfully reduced in Brazil, Eritrea, India, and Vietnam. Am J Trop MedHyg 74: 12–16.
8. Nyarango PM, Gebremeskel T, Mebrahtu G, Mufunda J, Abdulmumini U, etal. (2006) A steep decline of malaria morbidity and mortality trends inEritrea between 2000 and 2004: the effect of combination of controlmethods. Malar J 5: 33.
9. Barnes KI, Durrheim DN, Little F, Jackson A, Mehta U, et al. (2005) Effect ofartemether-lumefantrine policy and improved vector control on malariaburden in KwaZulu-Natal, South Africa. PLoS Med 2: e330. doi:10.1371/journal.pmed.0020330
10. Noor AM, Amin AA, Akhwale WS, Snow RW (2007) Increasing coverage anddecreasing inequity in insecticide-treated bed net use among rural Kenyanchildren. PLoS Med 4: e255. doi:10.1371/journal.pmed.0040255
11. WHO (2006) Informal consultation on malaria elimination: setting up theWHO agenda. WHO/HTM/MAL/2006.1114. Geneva: World Health Organ-ization. 68 p.
12. WHO/PAHO (2006) Regional strategic plan for malaria in the Americas2006–2010. Washington, D.C: Pan American Health Organization, RegionalOffice for the Americas. 71 p.
13. WHO/Regional Office for Europe (2006) Regional strategy: from malariacontrol to elimination in the WHO European Region 2006–2015. WHO-EUR/06/5061322. Copenhagen: World Health Organization Regional Officefor Europe. 41 p.
14. WHO/Regional Office for the Eastern Mediterranean (2007) Strategic planfor malaria control and elimination in the WHO Eastern MediterraneanRegion 2006–2010. WHO-EM/MAL/340/E. Cairo: World Health Organiza-tion Regional Office for the Eastern Mediterranean. 41 p.
15. Hay SI, Snow RW (2006) The Malaria Atlas Project: developing global mapsof malaria risk. PLoS Med 3: e473. doi:10.1371/journal.pmed.0030473
16. Hay SI, Guerra CA, Tatem A, Noor AM, Snow RW (2004) The globaldistribution and population at risk of malaria: past, present, and future.Lancet Infect Dis 4: 327–336.
17. Lysenko AY, Semashko IN (1968) Geography of malaria: a medico-geographic profile of an ancient disease. In: Lebedew AW, editor.Medicinskaja geografija. Moscow: Academy of Sciences. pp. 25–146.
18. Molineaux L, Muir DA, Spencer HC, Wernsdorfer WH (1988) Theepidemiology of malaria and its measurement. In: Wernsdorfer WH,McGregor I editors. Malaria: principles and practice of malariology.London: Churchill Livingstone. pp. 999–1089.
19. Pull JH (1972) Malaria surveillance methods, their uses and limitations. AmJ Trop Med Hyg 21: 651–657.
20. Ray AP, Beljaev AE (1984) Epidemiological surveillance: a tool forassessment of malaria and its control. J Commun Dis 16: 197–207.
21. WHO (1963) Terminology of malaria and of malaria eradication: report ona drafting committee. Geneva: World Health Organization. 127 p.
22. Macauley C (2005) Aggressive active case detection: a malaria controlstrategy based on the Brazilian model. Soc Sci Med 60: 563–573.
23. Chilundo B, Sundby J, Aanestad M (2004) Analysing the quality of routinemalaria data in Mozambique. Malar J 3: 3.
24. Erhart A, Thang ND, Xa NX, Thieu NQ, Hung LX, et al. (2007) Accuracy ofthe health information system on malaria surveillance in Vietnam. Trans RSoc Trop Med Hyg 101: 216–225.
25. Gething PW, Noor AM, Gikandi PW, Ogara EA, Hay SI, et al. (2006)Improving imperfect data from health management information systems inAfrica using space-time geostatistics. PLoS Med 3: e271. doi:10.1371/journal.pmed.0030271
26. Sharma VP (2007) Battling the malaria iceberg with chloroquine in India.Malar J 6: 105.
27. WHO (1964) WHO expert committee on malaria: tenth report. Geneva:World Health Organization. 52 p.
28. CDC (2003) Health information for international travel 2003–2004.Available: http://wwwn.cdc.gov/travel/contentYellowBook.aspx/. Accessed:July 2007.
29. IAMAT (2004) World Malaria Risk Chart. Available: http://www.iamat.org/pdf/WorldMalariaRisk.pdf. Accessed: July 2007.
30. Hijmans RJ, Cameron SE, Parra JL, Jones PG, Jarvis A (2005) Very highresolution interpolated climate surfaces for global land areas. Int J Climatol25: 1965–1978.
31. Shililu JI, Grueber WB, Mbogo CM, Githure JI, Riddiford LM, et al. (2004)Development and survival of Anopheles gambiae eggs in drying soil: influenceof the rate of drying, egg age, and soil type. J Am Mosq Control Assoc 20:243–247.
PLoS Medicine | www.plosmedicine.org February 2008 | Volume 5 | Issue 2 | e380309
Mapping Global Malaria

32. Gray EM, Bradley TJ (2005) Physiology of desiccation resistance in Anophelesgambiae and Anopheles arabiensis. Am J Trop Med Hyg 73: 553–559.
33. Hay SI, Tatem AJ, Graham AJ, Goetz SJ, Rogers DJ (2006) Globalenvironmental data for mapping infectious disease distribution. AdvParasitol 62: 37–77.
34. Scharleman JPW, Benz D, Hay SI, Purse BV, Tatem AJ, et al. (2008) Globaldata for ecology and epidemiology: a novel algorithm for temporal Fourierprocessing MODIS data. PLoS One 3: e1408. doi:10.1371/journal.pone.0001408
35. Suzuki R, Xu JQ, Motoya K (2006) Global analyses of satellite-derivedvegetation index related to climatological wetness and warmth. Int JClimatol 26: 425–438.
36. UNEP (2006) Global Deserts Outlook. Nairobi: Division of Early Warningand Assessment (DEWA), United Nations Environment Programme. 148 p.
37. Muir DA (1988) Anopheline mosquitos: vector reproduction, life-cycle andbiotope. In: Wernsdorfer WH, McGregor I, editors. Malaria: principles andpractice of malariology. London: Churchill Livingstone. pp. 431–451.
38. Macdonald G (1957) The epidemiology and control of malaria. London:Oxford University Press. 201 p.
39. Bouma MJ, Parvez SD, Nesbit R, Winkler AM (1996) Malaria control usingpermethrin applied to tents of nomadic Afghan refugees in northernPakistan. Bull World Health Organ 74: 413–421.
40. Omer SM, Cloudsley-Thompson JL (1970) Survival of female Anophelesgambiae Giles through a 9-month dry season in Sudan. Bull World HealthOrgan 42: 319–330.
41. Omer SM, Cloudsley-Thomson JL (1968) Dry season biology of Anophelesgambiae Giles in the Sudan. Nature 217: 879–880.
42. Balk DL, Deichmann U, Yetman G, Pozzi F, Hay SI, et al. (2006)Determining global population distribution: methods, applications anddata. Adv Parasitol 62: 119–156.
43. UNPD (2006) World Population Prospects: population database. Available:http://esa.un.org/unpp/. Accessed: August 2007.
44. Hay SI, Noor AM, Nelson A, Tatem AJ (2005) The accuracy of humanpopulation maps for public health application. Trop Med Int Health 10:1073–1086.
45. Guerra CA, Hay SI, Lucioparedes LS, Gikandi P, Tatem AJ, et al. (2007)Assembling a global database of malaria parasite prevalence for the MalariaAtlas Project. Malar J 6: 17.
46. Macdonald G (1957) Local features of malaria. In: The epidemiology andcontrol of malaria. London: Oxford University Press. pp. 63–99.
47. Mouchet J, Carnevale P, Coosemans M, Julvez J, Manguin S, et al. (2004)Biodiversite du paludisme dans le monde. Paris: John Libbey Eurotext. 428 p.
48. Pull JH, Grab B (1974) A simple epidemiological model for evaluating themalaria inoculation rate and the risk of infection in infants. Bull WorldHealth Organ 51: 507–516.
49. Smith DL, Guerra CA, Snow RW, Hay SI (2007) Standardizing estimates ofthe Plasmodium falciparum parasite rate. Malar J 6: 131.
50. Herrel N, Amerasinghe FP, Ensink J, Mukhtar M, van der Hoek W, et al.(2001) Breeding of Anopheles mosquitoes in irrigated areas of South Punjab,Pakistan. Med Vet Entomol 15: 236–248.
51. Heuvelink GBM, Burrough PA (2002) Developments in statistical ap-proaches to spatial uncertainty and its propagation. Int J Geogr Inf Sci 16:111–113.
52. Macdonald G, Goeckel GW (1964) The malaria parasite rate andinterruption of transmission. Bull World Health Organ 31: 365–377.
53. Brooker S, Leslie T, Kolaczinski K, Mohsen E, Mehboob N, et al. (2006)Spatial epidemiology of Plasmodium vivax, Afghanistan. Emerg Infect Dis 12:1600–1602.
54. Rogers DJ, Randolph SE, Snow RW, Hay SI (2002) Satellite imagery in thestudy and forecast of malaria. Nature 415: 710–715.
55. Guerra CA, Snow RW, Hay SI (2006) Defining the global spatial limits ofmalaria transmission in 2005. Adv Parasitol 62: 157–179.
56. Guerra CA, Snow RW, Hay SI (2006) Mapping the global extent of malariain 2005. Trends Parasitol 22: 353–358.
57. Mayxay M, Pukrittayakamee S, Newton PN, White NJ (2004) Mixed-speciesmalaria infections in humans. Trends Parasitol 20: 233–240.
58. Rosenberg R (2007) Plasmodium vivax in Africa: hidden in plain sight?Trends Parasitol 23: 193–196.
59. Sattabongkot J, Tsuboi T, Zollner GE, Sirichaisinthop J, Cui L (2004)Plasmodium vivax transmission: chances for control? Trends Parasitol 20:192–198.
60. Black R (1968) Manual of epidemiology and epidemiological services inmalaria programmes. Geneva: World Health Organization. 223 p.
61. Hay SI, Smith DL, Snow RW (2008) Measuring malaria endemicity fromintense to interrupted transmission. Lancet Infect Dis: In press.
62. Pampana E (1969) A textbook of malaria eradication. Second edition.London: Oxford University Press. 593 p.
63. Yekutiel P (1980) The global malaria eradication campaign In: Eradicationof infectious diseases: a critical study. Contributions to epidemiology andbiostatistics. Basel, Switzerland: Karger. pp 34–88.
64. Swaroop S, Gilroy AB, Uemura K (1966) Statistical methods in malariaeradication. Geneva: World Health Organization. 164 p.
65. Yekutiel P (1960) Problems of epidemiology in malaria eradication. BullWorld Health Organ 22: 669–683.
66. Metselaar D, van Thiel PH (1959) Classification of malaria. Trop Geogr Med11: 157–161.
67. Meleigy M (2007) Arabian Peninsula states launch plan to eradicate malaria.Br Med J 334: 117.
68. UNHCR (2006) The UN Refugee Agency (UNHCR). Available: http://www.unhcr.org/. Accessed: August 2007.
69. Najera JA, Liese BH, Hammer J (1992) Malaria. new patterns andperspectives. Washington DC: World Bank.
70. Shiff C (2002) Integrated approach to malaria control. Clin Microbiol Rev15: 278–293.
71. Fegan GW, Noor AM, Akwhale WS, Cousens S, Snow RW (2007) Effect ofexpanded insecticide-treated bed net coverage on child survival in ruralKenya: a longitudinal study. Lancet 370: 1035–1039.
72. Okiro EA, Hay SI, Gikandi PW, Sharif SK, Noor AM, et al. (2007) Thedecline in paediatric malaria admissions on the coast of Kenya:correspondence with expanded malaria prevention? Malar J 6: 151.
73. Snow RW, Craig M, Deichmann U, Marsh K (1999) Estimating mortality,morbidity and disability due to malaria among Africa’s non-pregnantpopulation. Bull World Health Organ 77: 624–640.
74. Hay SI, Guerra CA, Tatem AJ, Atkinson PM, Snow RW (2005) Urbanization,malaria transmission and disease burden in Africa. Nat Rev Microbiol 3:81–90.
PLoS Medicine | www.plosmedicine.org February 2008 | Volume 5 | Issue 2 | e380310
Mapping Global Malaria

Editors’ Summary
Background. Malaria is a parasitic disease that occurs in tropical andsubtropical regions of the world. 500 million cases of malaria occur everyyear, and one million people, mostly children living in sub-Saharan Africa,die as a result. The parasite mainly responsible for these deaths—Plasmodium falciparum—is transmitted to people through the bites ofinfected mosquitoes. These insects inject a life stage of the parasitecalled sporozoites, which invade and reproduce in human liver cells.After a few days, the liver cells release merozoites (another life stage ofthe parasite), which invade red blood cells. Here, they multiply beforebursting out and infecting more red blood cells, causing fever anddamaging vital organs. Infected red blood cells also release gametocytes,which infect mosquitoes when they take a human blood meal. In themosquito, the gametocytes multiply and develop into sporozoites, thuscompleting the parasite’s life cycle. Malaria can be treated withantimalarial drugs and can be prevented by controlling the mosquitoesthat spread the parasite (for example, by using insecticides) and byavoiding mosquito bites (for example, by sleeping under a insecticide-treated bednet).
Why Was This Study Done? Because malaria poses such a large globalpublic-health burden, many national and international agencies givecountries where malaria is endemic (always present) financial resourcesfor malaria control and, where feasible, elimination. The efficientallocation of these resources requires accurate information on thegeographical distribution of malaria risk, but it has been 40 years since amap of malaria risk was assembled. In this study, which is part of theMalaria Atlas Project, the researchers have generated a new global mapto show where the risk of P. falciparum transmission is moderate or high(stable transmission areas where malaria is endemic) and areas where therisk of transmission is low (unstable transmission areas where sporadicoutbreaks of malaria occur).
What Did the Researchers Do and Find? To construct their map of P.falciparum risk, the researchers collected nationally reported data onmalaria cases each year and on the number of people infected insampled communities. They also collected information about climaticconditions that affect the parasite’s life cycle and consequently thelikelihood of active transmission. For example, below a certain temper-ature, infected mosquitoes reach the end of their natural life span beforethe parasite has had time to turn into infectious sporozoites, whichmeans that malaria transmission does not occur. By combining these
different pieces of information with global population data, theresearchers calculated that 2.37 billion people (about 35% of the world’spopulation) live in areas where there is some risk of P. falciparumtransmission, and that about 1 billion of these people live where there isa low but still present risk of malaria transmission. Furthermore, nearly allthe regions where more than half of children carry P. falciparum parasites(a P. falciparum prevalence of more than 50%) are in Africa, althoughthere are some African regions where few people are infected with P.falciparum. Outside Africa, the P. falciparum prevalence is generallybelow 5%.
What Do These Findings Mean? The accuracy of this new map of thespatial distribution of P. falciparum malaria risk depends on theassumptions made in its assembly and the accuracy of the data fedinto it. Nevertheless, by providing a contemporary indication of globalpatterns of P. falciparum malaria risk, this new map should be a valuableresource for agencies that are trying to control and eliminate malaria. (Asimilar map for the more common but less deadly P. vivax malaria wouldalso be useful, but has not yet been constructed because lessinformation is available and its biology is more complex.) Importantly,the map provides an estimate of the number of people who are living inareas where malaria transmission is low, areas where it should, inprincple, be possible to use existing interventions to eliminate theparasite. In addition, it identifies large regions of Africa where theparasite might be more amenable to control and, ultimately, eliminationthan previously thought. Finally, with regular updates, this map willmake it possible to monitor the progress of malaria control andelimination efforts.
Additional Information. Please access these Web sites via the onlineversion of this summary at http://dx.doi.org/10.1371/journal.pmed.0050038.
� The MedlinePlus encyclopedia contains a page on malaria (in Englishand Spanish)� Information is available from the World Health Organization on malaria
(in English, Spanish, French, Russian, Arabic, and Chinese)� The US Centers for Disease Control and Prevention provide informa-
tion on malaria (in English and Spanish)� Information is available from the Roll Back Malaria Partnership on its
approach to the global control of malaria
PLoS Medicine | www.plosmedicine.org February 2008 | Volume 5 | Issue 2 | e380311
Mapping Global Malaria