guidance for ammonia
TRANSCRIPT
8/11/2019 Guidance for Ammonia
http://slidepdf.com/reader/full/guidance-for-ammonia 1/27
APPENDIX E:
Supplemental Risk Management Program Guidance for
Ammonia Refrigeration Facilities
8/11/2019 Guidance for Ammonia
http://slidepdf.com/reader/full/guidance-for-ammonia 2/27
Appendix E -2- NH3
Appendix E: Supplemental Risk Management Program Guidance for
Ammonia Refrigeration Facilities
This appendix supplements the main body of the General Guidance to provide
additional information for food processors, food distributors, and refrigerated
warehouses who use ammonia as a refrigerant, as well as any other facility that has
an ammonia refrigeration system. If you have other processes that use regulated
substances other than ammonia, refer to the main body of the General Guidance (and
any other applicable industry-specific appendix) for information on compliance with
the rule for those processes. The appendix covers Risk Management Program
elements in the same general order as those elements are addressed in the main
document. However, note that the appendix does not address some generic RMP
elements (e.g., Management System). For elements not addressed in this appendix,
simply refer to the applicable guidance in the main document.
E.1 General Applicability
EXEMPTION FOR F ARMS
The rule exempts ammonia when held by a farmer for use as an agricultural nutrient
on a farm. This exemption does not apply to agricultural suppliers, fertilizer
manufacturers, or the use of ammonia as a refrigerant. It does not apply to farm
cooperatives or to groups of farmers who buy, use, and sell ammonia.
THRESHOLD QUANTITY
The threshold quantity for anhydrous ammonia is 10,000 pounds.
CO-LOCATION OF PROCESS VESSELS
For ammonia, a release from a single vessel will not normally lead to a release from
others unless the vessel fails catastrophically and explodes, sending metal fragments
into other vessels. Co-located vessels containing ammonia, however, may well be
involved in a release caused by a fire or explosion that occurs from another source.
E.2 Applicability of Program Levels
QUICK RULES FOR DETERMINING PROGRAM 1 ELIGIBILITY
If you have a process containing more than a threshold quantity of ammonia that is
not liquefied by refrigeration alone (i.e., you hold it as a gas or liquefied under
pressure), the distance to the endpoint estimated for a worst-case release may be
several miles. As a result, the distance to endpoint is unlikely to be less than the
distance to public receptors, unless the process is very remote. In some cases,
8/11/2019 Guidance for Ammonia
http://slidepdf.com/reader/full/guidance-for-ammonia 3/27
NH3
-3- Appendix E
however, ammonia in processes contained in enclosed areas may be eligible for
Program 1.
If you have a process containing anhydrous ammonia liquefied by refrigeration alone,and your worst-case release would take place into a diked area, the chances are good
that the process may be eligible for Program 1, unless there are public receptors very
close to the process. Even if you have many times the threshold quantity of
ammonia, the process may still be eligible for Program 1.
PROGRAM 3
Most ammonia refrigeration processes that are not eligible for Program 1 will be
subject to Program 3 requirements because they are subject to the OSHA PSM
Standard.
PROGRAM 2
Ammonia refrigeration processes will usually not be eligible for this program level
because they are covered by OSHA PSM. If your ammonia process is not eligible for
Program 1, it will generally be subject to Program 3. If your ammonia refrigeration
process is subject to Program 2 requirements, this appendix does not contain
additional information on prevention program elements; consult chapter 6 in the main
document.
E.3 Offsite Consequence Analysis
This section gives simple guidance on how to perform the hazard assessment for
anhydrous ammonia in ammonia refrigeration facilities. Additional technicalinformation is provided in a separate document entitled “Technical Background
Document for Offsite Consequence Analysis for Anhydrous Ammonia, Aqueous
Ammonia, Chlorine and Sulfur Dioxide,” henceforth known as the “Technical
Background Document”. This document is available from EPA’s website at
www.epa.gov/emergencies.
E.3.1 Worst-Case Release Scenario Analysis
M ANDATORY INPUTS
The following inputs are required by the Risk Management Program rule:
Release Quantity: The worst-case release quantity (lb) shall be the greater of the
following:
For substances in a vessel, the greatest amount held in a vessel, taking into
account administrative controls that limit the maximum quantity; or
8/11/2019 Guidance for Ammonia
http://slidepdf.com/reader/full/guidance-for-ammonia 4/27
Appendix E -4-
NH3
For substances in pipes, the greatest amount in a pipe, taking into account
administrative controls that limit the maximum quantity.
Section E.3.3 shows that, for ammonia refrigeration systems, a storage vessel orreceiver is the place where the worst-case release quantity is expected to reside.
Per §68.25(c)(1), because ammonia is a vapor at ambient temperature and is handled
as a liquid under pressure in most parts of a refrigeration system, the release quantity
is assumed to be completely released from the vessel over a period of 10 minutes.
This applies whether the release takes place outside or in a building.
Wind speed/atmospheric stability class: The owner or operator shall use a wind
speed of 1.5 meters per second and F stability class. If the owner or operator can
demonstrate that local meteorological data show a higher minimum wind speed or a
less stable atmosphere at all times during the previous three years, these site-specific
conditions may be used. For simplicity’s sake, the guidance presented below isrestricted to a wind speed of 1.5 meters per second and F stability class.
Toxic Endpoint: The toxic endpoint for ammonia is 200 ppm (0.14 mg/L). This
airborne concentration has been published by the American Industrial Hygiene
Association (AIHA) and is the maximum airborne concentration below which it is
believed that nearly all individuals can be exposed for up to one hour without
experiencing or developing irreversible or other serious health effects or symptoms
which could impair an individual's ability to take protective action. The rule requires
you to assume that the toxic endpoint is constant, even though the duration of release
is only 10 minutes.
QUANTITY RELEASED AND RELEASE R ATE IN THE WORST-C ASE RELEASE SCENARIO
Quantity Released: Take the largest quantity (lb) of ammonia that is liquefied under
pressure in any vessel in the ammonia refrigeration system. For many systems, this
vessel will be the high pressure receiver with typical pressures in the range 100 to
200 psig. Other candidate vessels include: a) an outside vessel in which ammonia is
stored as a liquid at ambient temperature (some, but not all, facilities have such a
vessel); b) an intermediate receiver with typical pressures in the range 20 to 60 psig
(typical of two-stage ammonia refrigeration systems); or c) a low-pressure receiver
with pressures in the range 10-60 psig (typical of single-stage refrigeration systems).
In the case of a vessel, the quantity does not include any liquid ammonia in pipework
connected to the vessel and in any other vessel that can discharge directly into pipework connected to the vessel. In addition, the maximum amount of ammonia
that could be in the vessel at any one time, not just during normal operation, should
be considered. For example, if the vessel is used to store some or all of the ammonia
while the rest of the system is being serviced, then the quantity released should
include the additional quantity of ammonia that is in the vessel at such a time.
However, if there are administrative controls that limit the amount of ammonia that is
allowed in the vessel at any one time, this limit can also be taken into account when

8/11/2019 Guidance for Ammonia
http://slidepdf.com/reader/full/guidance-for-ammonia 5/27
NH3
-5- Appendix E
estimating the quantity released. Similarly, if the largest quantity resides in a
pipeline, you do not need to consider the quantity of ammonia in connected vessels.
Release Rate - Unmitigated Releases: For the worst-case scenario for a substancethat is a gas under ambient conditions, the largest vessel is assumed to fail in a
catastrophic manner, and the release occurs over a period of 10 minutes. The worst-
case release rate is:
QR = Q/10 (1)
where: QR = Release rate (lbs/min)
Q = Quantity released (lbs)
The rapid release of ammonia initially liquefied under pressure leads to an airborne
mixture of vapor and droplets. If the vessel is outdoors, all of the vapor and dropletsremain airborne, and the release rate (QR) is the total inventory uniformly distributed
over 10 minutes, as required by the rule.
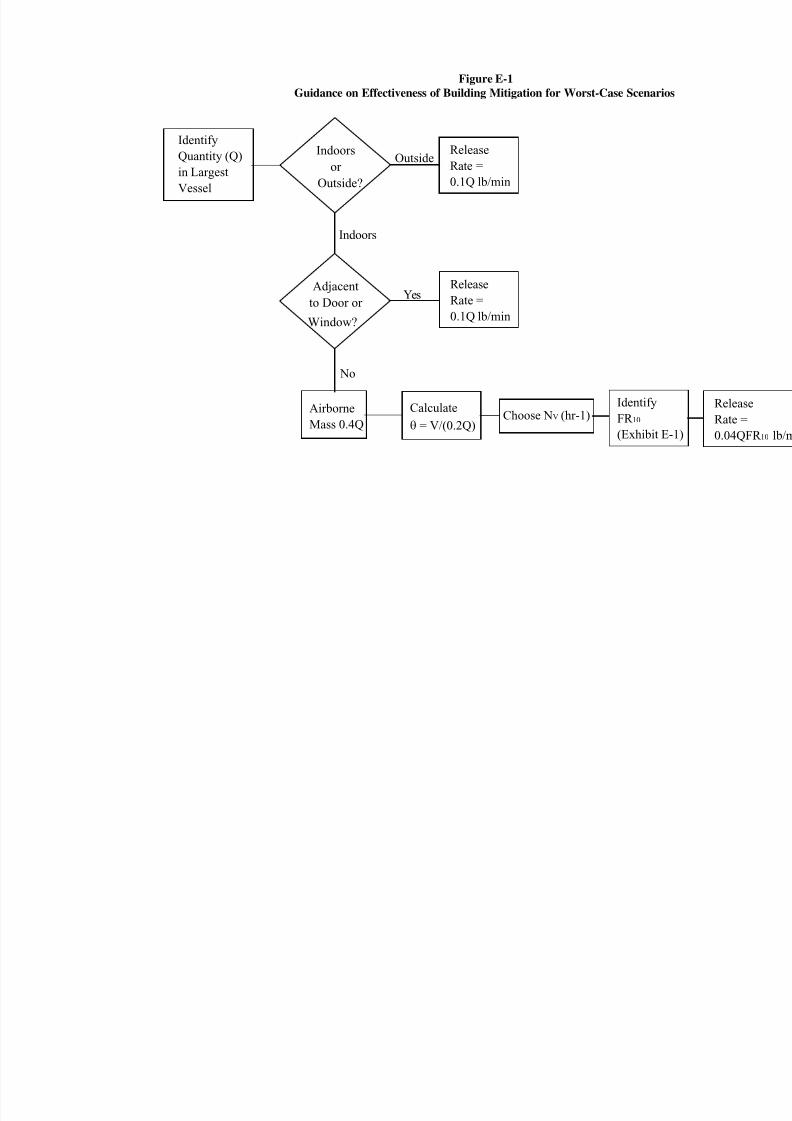
Release Rate - Mitigated Releases: The rule allows you to consider passive
mitigation in estimating the worst-case release rate. Figure E-1 displays the procedure
to be followed to determine the release rate for the worst-case scenario. If the release
takes place in a building, the building can be considered to provide passive
mitigation, unless:
The building may fail as a result of the release. This is unlikely except in the
case of a large vessel in a very small room. As a rough rule of thumb, if the
room volume (V) divided by the quantity of ammonia (Q) in the vessel is lessthan 0.1 ft3/lb, you should look at the possibility that the release of ammonia
will cause failures such as windows blowing out or doors blowing open.
The release takes place facing an opening in the building (door or window).
In this case, you should assume that the door or window will be open, and
the ammonia will be released through these openings.
If the building may fail as a result of the release, estimate the release rate as for an
unmitigated release (Equation 1, QR = Q/10 lb/min). Similarly, if the release would
take place facing doors or windows, the release rate is again the entire inventory
uniformly distributed over 10 minutes (Equation 1).
If the above conditions do not apply, you can assume that rain-out of liquid droplets
is facilitated by impingement on surfaces (in a compressor room, for example), and
only a portion of the released material will become airborne. The remainder collects
in relatively slowly evaporating pools and makes only a small contribution to the rate
of release from the building. To estimate the mitigated release rate, assume the
following:
8/11/2019 Guidance for Ammonia
http://slidepdf.com/reader/full/guidance-for-ammonia 6/27
Appendix E -6-
NH3
The amount of material airborne in the building is four-tenths of the total
inventory, or 0.4 Q.
The airborne material includes 0.2 Q vapor and 0.2 Q liquid droplets.
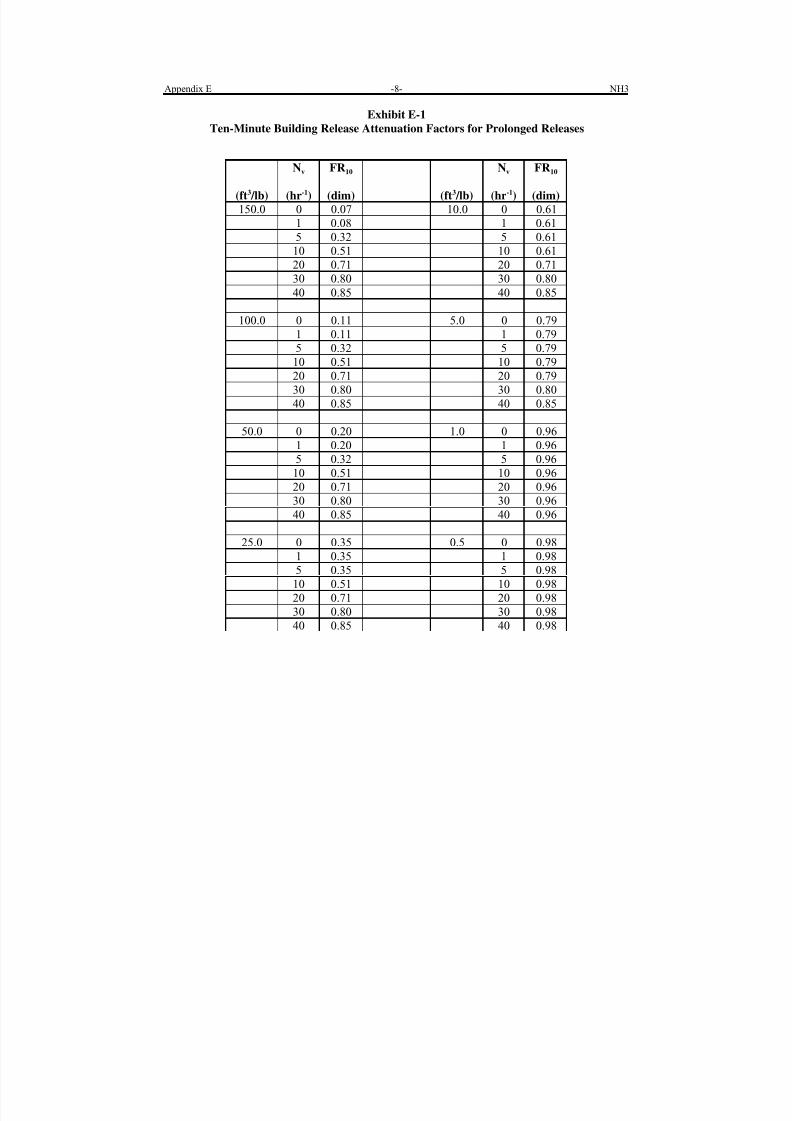
Exhibit E-1 provides factors for estimating the mitigated release rate from a
building.
To estimate the release rate using these factors, do the following:
Estimate as follows:
- Determine room volume, V, in ft3
- Calculate from room volume divided by the quantity of ammonia initially
released as vapor, or (ft3/lb) = V/(0.2 Q)
Determine the active ventilation rate, Nv, in room volumes exchanged per
hour (hr -1), for the building.
From Exhibit E-1, find the 10-minute building attenuation factor, FR 10,
corresponding to your estimated and the ventilation rate, Nv.
Estimate the release rate in lbs/min from the building attenuation factor and
the airborne quantity (0.4 Q) as follows, assuming the release takes place
over 10 minutes:
QR B = (FR10 × 0.4Q)/10 (2)
Example 1
A high-pressure receiver containing 5,000 lb of ammonia is in a room of dimensions
20 feet x 50 feet x 30 feet = 30,000 ft3. Hence, = 30,000/(5,000 x 0.2) = 30 ft3/lb.
The nearest value of on Exhibit E-1 is = 25. The ventilation rate for the building
is 5 hr -1. For = 25 and Nv = 5, FR 10 = 0.35, and the release rate to the atmosphere is
QR B = (0.35)(0.4)(5,000)/10 = 70 lb/min, using Equation 2 above.
8/11/2019 Guidance for Ammonia
http://slidepdf.com/reader/full/guidance-for-ammonia 7/27
Figure E-1
Guidance on Effectiveness of Building Mitigation for Worst-Case Scenar
Identify
Quantity (Q)
in Largest
Vessel
Indoorsor
Outside?
Indoors
Outside ReleaseRate =
0.1Q lb/min
Release
Rate =0.1Q lb/min
Adjacent
to Door or
Window?
Yes
Airborne
Mass 0.4Q
Calculate
θ = V/(0.2Q)Choose NV (hr-1)
Identify
FR 10
(Exhibit E
No
8/11/2019 Guidance for Ammonia
http://slidepdf.com/reader/full/guidance-for-ammonia 8/27
Appendix E -8- NH3
Exhibit E-1
Ten-Minute Building Release Attenuation Factors for Prolonged Releases
(ft3 /lb)
Nv
(hr-1)
FR10
(dim) (ft3 /lb)
Nv
(hr-1)
FR10
(dim)
150.0 0 0.07 10.0 0 0.61
1 0.08 1 0.61
5 0.32 5 0.61
10 0.51 10 0.61
20 0.71 20 0.71
30 0.80 30 0.80
40 0.85 40 0.85
100.0 0 0.11 5.0 0 0.79
1 0.11 1 0.79
5 0.32 5 0.79
10 0.51 10 0.79
20 0.71 20 0.79
30 0.80 30 0.80
40 0.85 40 0.85
50.0 0 0.20 1.0 0 0.96
1 0.20 1 0.96
5 0.32 5 0.96
10 0.51 10 0.96
20 0.71 20 0.96
30 0.80 30 0.96
40 0.85 40 0.96
25.0 0 0.35 0.5 0 0.98
1 0.35 1 0.98
5 0.35 5 0.98
10 0.51 10 0.98
20 0.71 20 0.98
30 0.80 30 0.98
40 0.85 40 0.98
8/11/2019 Guidance for Ammonia
http://slidepdf.com/reader/full/guidance-for-ammonia 9/27
NH3 -9- Appendix E
Example 2
The 5,000 lb vessel in Example 1 is outside. The release rate is, therefore, 5,000/10
= 500 lb/min. It can be seen that the building provides extensive attenuation.However, to take advantage of this potential attenuation, you must be certain that the
worst-case scenario cannot occur outside or adjacent to a door or window that may be
open.
OTHER POTENTIAL WORST-C ASE SCENARIOS
The rule requires that you look for other potential scenarios that could affect offsite
populations further away from the site or in different areas than does the release from
the largest vessel. Thus, even if an outside storage vessel is smaller than your high-
pressure receiver, you should consider the release of its contents over a 10-minute
period as a possible worst-case scenario. Similarly, if a pipe containing ammonia
liquefied under pressure is outside for part of its length, you should consider therelease of the contents of that pipe as a possible worst-case scenario.
DISTANCE TO THE TOXIC ENDPOINT
Take the estimated worst-case rate of release QR (unmitigated) or QR B (in a building)
and go to Exhibit E-2. Find the entry in the “Rate of Release” column that is closest
to your estimated release rate. Read off the corresponding distance from the urban or
the rural column. This is the “distance to the endpoint” that must be submitted (in
miles) in the RMP information.
To decide whether the site is rural or urban, the rule gives the following guidance in
§ 68.22(e): “Urban means that there are many obstacles in the immediate area;obstacles include buildings or trees. Rural means that there are no buildings in the
immediate area and the terrain is generally flat and unobstructed.”
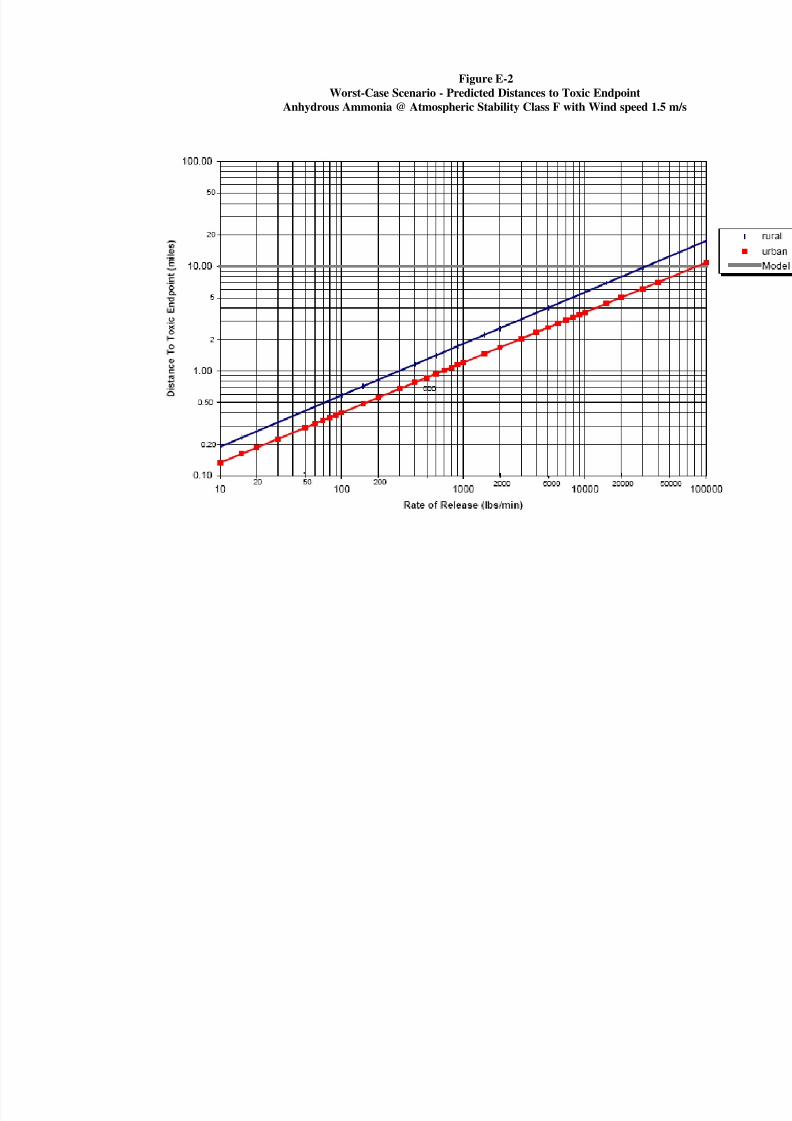
Figure E-2 represents Exhibit E-2 in graphical form. Both apply to releases of 10
minutes duration.
Example 3
Take the 500 lb/min release rate from Example 2. From Exhibit E-2, the predicted
distance to the toxic endpoint is ~ 1.3 miles at a rural site and ~ 0.9 miles at an urban
site. For the 70 lb/min release of Example 1, these distances become 0.5 miles and
0.3 miles, respectively.
8/11/2019 Guidance for Ammonia
http://slidepdf.com/reader/full/guidance-for-ammonia 10/27
Appendix E -10- NH3
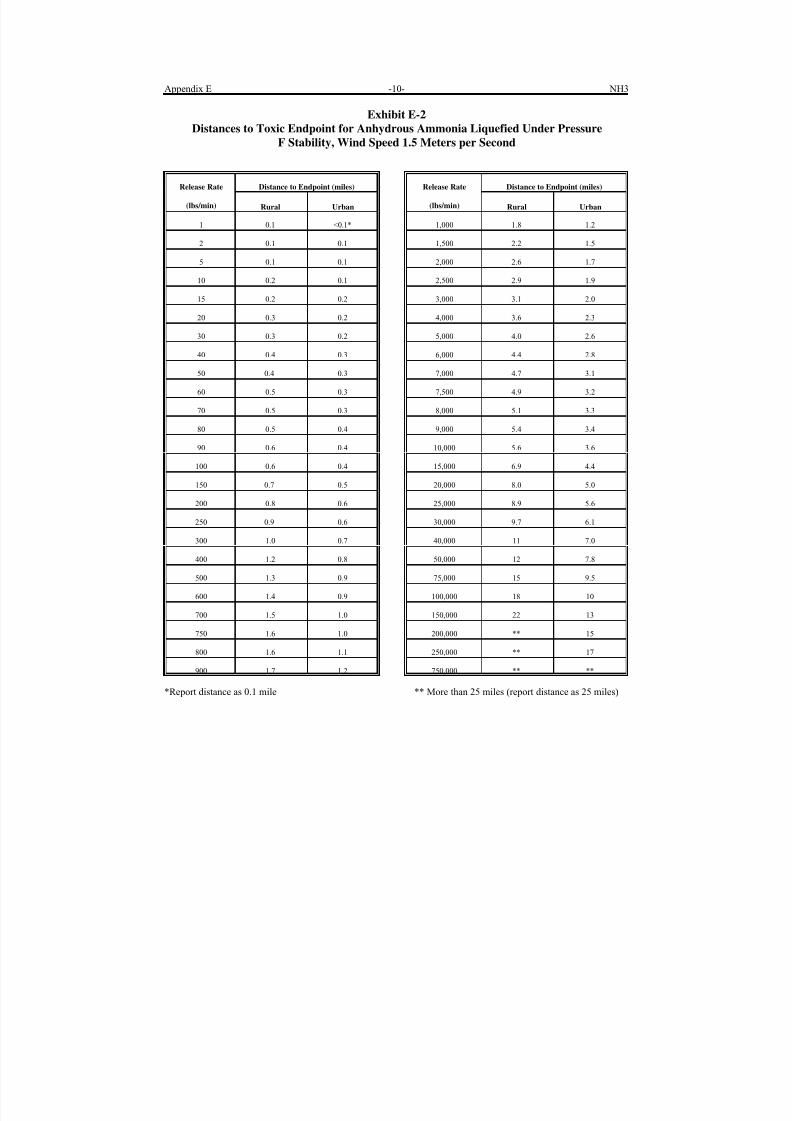
Exhibit E-2
Distances to Toxic Endpoint for Anhydrous Ammonia Liquefied Under Pressure
F Stability, Wind Speed 1.5 Meters per Second
Release Rate Distance to Endpoint (miles)
(lbs/min) Rural Urban
1 0.1 <0.1*
2 0.1 0.1
5 0.1 0.1
10 0.2 0.1
15 0.2 0.2
20 0.3 0.2
30 0.3 0.2
40 0.4 0.3
50 0.4 0.3
60 0.5 0.3
70 0.5 0.3
80 0.5 0.4
90 0.6 0.4
100 0.6 0.4
150 0.7 0.5
200 0.8 0.6
250 0.9 0.6
300 1.0 0.7
400 1.2 0.8
500 1.3 0.9
600 1.4 0.9
700 1.5 1.0
750 1.6 1.0
800 1.6 1.1
900 1.7 1.2
Release Rate Distance to Endpoint (miles)
(lbs/min) Rural Urban
1,000 1.8 1.2
1,500 2.2 1.5
2,000 2.6 1.7
2,500 2.9 1.9
3,000 3.1 2.0
4,000 3.6 2.3
5,000 4.0 2.6
6,000 4.4 2.8
7,000 4.7 3.1
7,500 4.9 3.2
8,000 5.1 3.3
9,000 5.4 3.4
10,000 5.6 3.6
15,000 6.9 4.4
20,000 8.0 5.0
25,000 8.9 5.6
30,000 9.7 6.1
40,000 11 7.0
50,000 12 7.8
75,000 15 9.5
100,000 18 10
150,000 22 13
200,000 ** 15
250,000 ** 17
750,000 ** **
*Report distance as 0.1 mile ** More than 25 miles (report distance as 25 miles)
8/11/2019 Guidance for Ammonia
http://slidepdf.com/reader/full/guidance-for-ammonia 11/27
Figure E-2
Worst-Case Scenario - Predicted Distances to Toxic Endpoint
Anhydrous Ammonia @ Atmospheric Stability Class F with Wind speed 1.
8/11/2019 Guidance for Ammonia
http://slidepdf.com/reader/full/guidance-for-ammonia 12/27
Appendix E -12- NH3
E.3.2 Alternative Release Scenario Analys is
The owner or operator must identify and analyze at least one “alternative” release
scenario.
CHOICE OF THE ALTERNATIVE SCENARIO
Your alternative scenario for a covered process must be one that is more likely to
occur than the worst-case scenario and that reaches an endpoint offsite, unless no
such scenario exists. Note that this requirement means that the release rate for the
alternative scenario for ammonia must be fairly large, or it generally will not reach
the ammonia endpoint offsite.
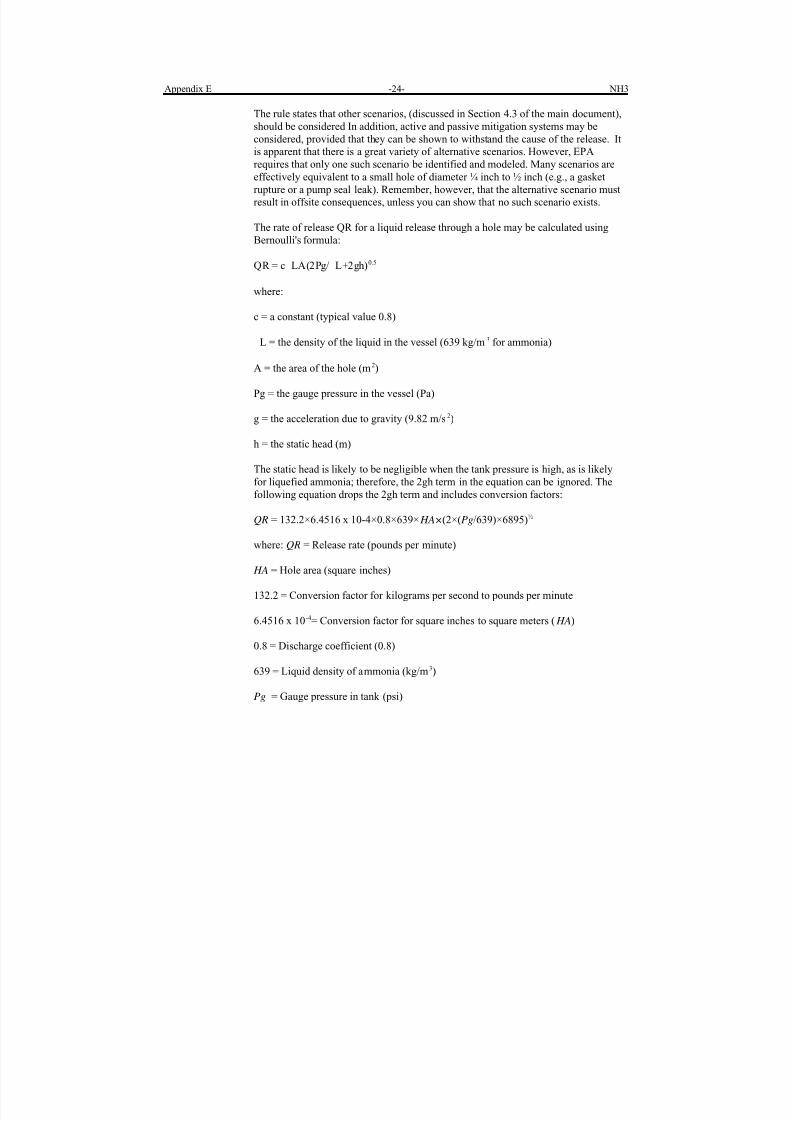
ALTERNATIVE SCENARIOS FOR AMMONIA AT REFRIGERATION F ACILITIES
For the alternative scenario analysis, you need to estimate the release rate ofammonia and the distance to the toxic endpoint. Exhibit E-3 and Figure E-3 provide
distances to the endpoint for a range of release rates under the weather conditions
discussed above. Note that Exhibit E-3 and Figure E-3 (and Equations 6 and 7 in
Section E.3.4) are intended to apply to releases of any duration.
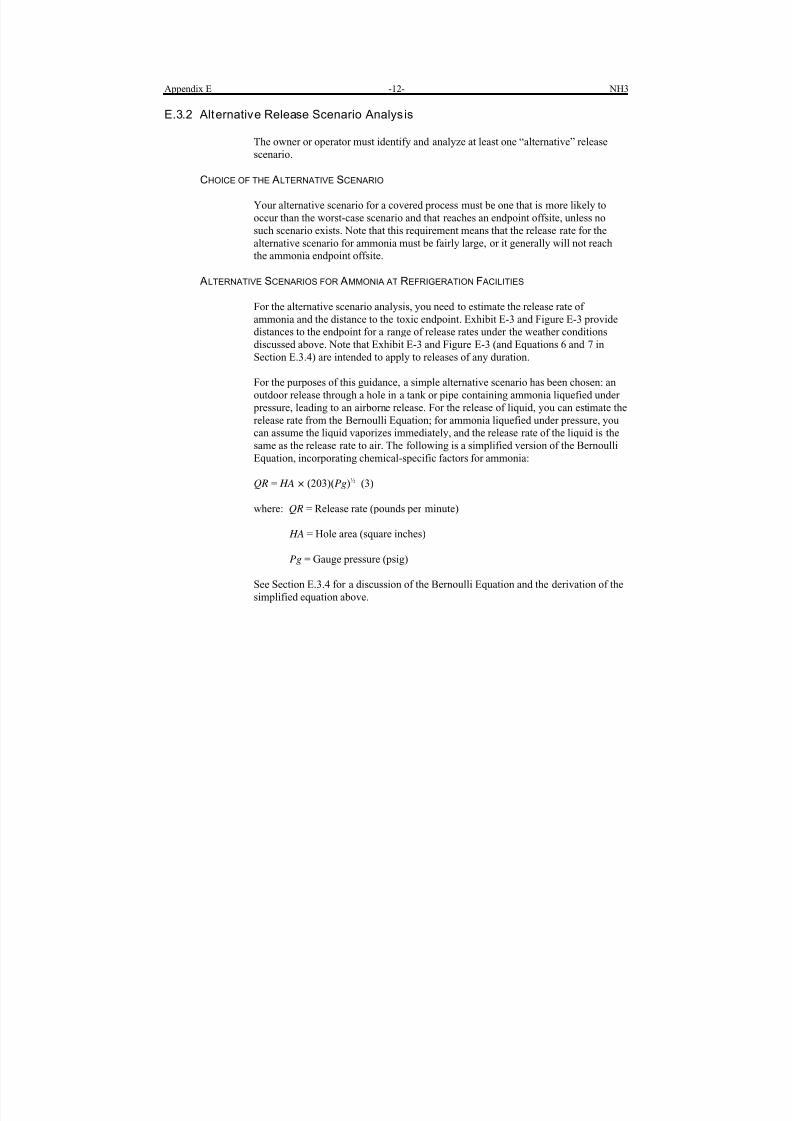
For the purposes of this guidance, a simple alternative scenario has been chosen: an
outdoor release through a hole in a tank or pipe containing ammonia liquefied under
pressure, leading to an airborne release. For the release of liquid, you can estimate the
release rate from the Bernoulli Equation; for ammonia liquefied under pressure, you
can assume the liquid vaporizes immediately, and the release rate of the liquid is the
same as the release rate to air. The following is a simplified version of the Bernoulli
Equation, incorporating chemical-specific factors for ammonia:
QR = HA × (203)(Pg)½ (3)
where: QR = Release rate (pounds per minute)
HA = Hole area (square inches)
Pg = Gauge pressure (psig)
See Section E.3.4 for a discussion of the Bernoulli Equation and the derivation of the
simplified equation above.

8/11/2019 Guidance for Ammonia
http://slidepdf.com/reader/full/guidance-for-ammonia 13/27
NH3 -13- Appendix E
Exhibit E-3
Distances to Toxic Endpoint for Anhydrous Ammonia Liquefied Under Pressure
D Stability, Wind Speed 3 Meters per Second
Release Rate Distance to Endpoint (miles)
(lbs/min) Rural Urban
<10 <0.1*
<0.1*
10 0.1
15 0.1
20 0.1
30 0.1
40 0.1
50 0.1
60 0.2 0.1
70 0.2 0.1
80 0.2 0.1
90 0.2 0.1
100 0.2 0.1
150 0.2 0.1
200 0.3 0.1
250 0.3 0.1
300 0.3 0.1
400 0.4 0.2
500 0.4 0.2
600 0.5 0.2
700 0.5 0.2
750 0.5 0.2
800 0.5 0.2
Release Rate Distance to Endpoint (miles)
(lbs/min) Rural Urban
900 0.6 0.2
1,000 0.6 0.2
1,500 0.7 0.3
2,000 0.8 0.3
2,500 0.9 0.3
3,000 1.0 0.4
4,000 1.2 0.4
5,000 1.3 0.5
7,500 1.6 0.5
10,000 1.8 0.6
15,000 2.2 0.7
20,000 2.5 0.8
25,000 2.8 0.9
30,000 3.1 1.0
40,000 3.5 1.1
50,000 3.9 1.2
75,000 4.8 1.4
100,000 5.4 1.6
150,000 6.6 1.9
200,000 7.6 2.1
250,000 8.4 2.3
300,000 9.2 2.5
* Report distance as 0.1 mile

8/11/2019 Guidance for Ammonia
http://slidepdf.com/reader/full/guidance-for-ammonia 14/27
Figure E-3
Alternative Release Scenario - Estimated Distances to Toxic Endpoint for Anhydro
Stability Class D, Wind Speed 3 Meters per Second
8/11/2019 Guidance for Ammonia
http://slidepdf.com/reader/full/guidance-for-ammonia 15/27
NH3 -15- Appendix E
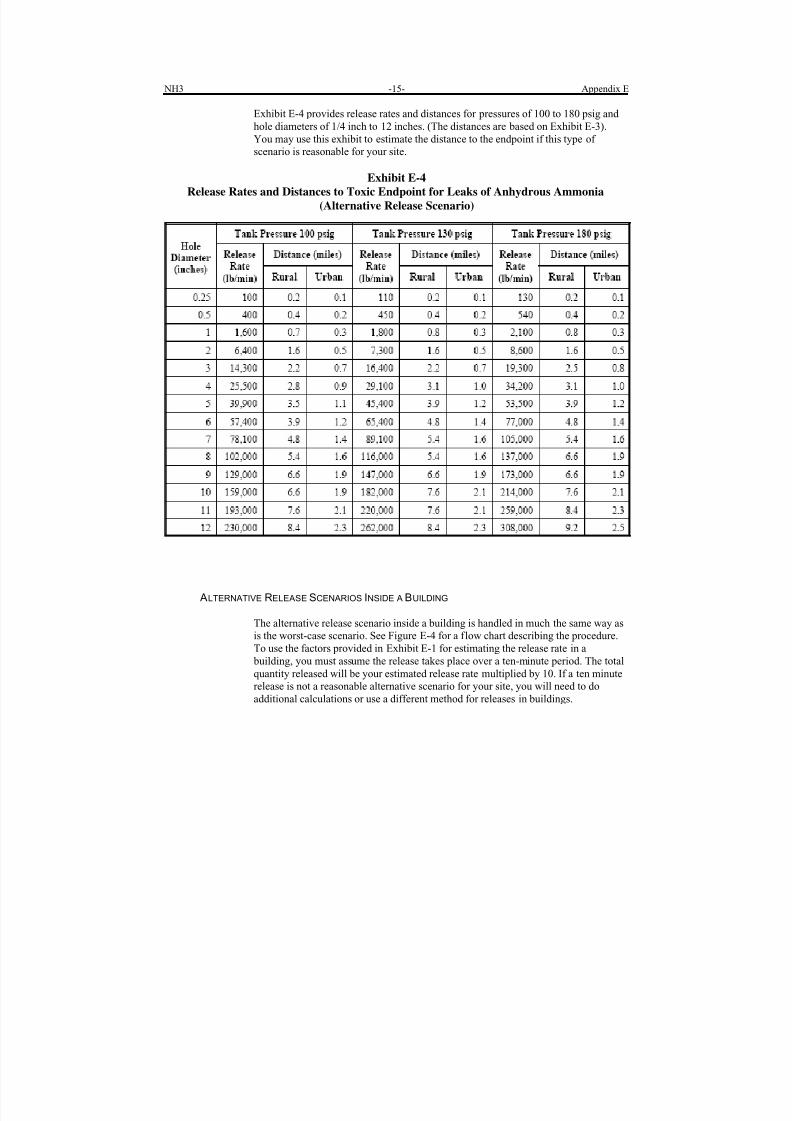
Exhibit E-4 provides release rates and distances for pressures of 100 to 180 psig and
hole diameters of 1/4 inch to 12 inches. (The distances are based on Exhibit E-3).
You may use this exhibit to estimate the distance to the endpoint if this type of
scenario is reasonable for your site.
Exhibit E-4
Release Rates and Distances to Toxic Endpoint for Leaks of Anhydrous Ammonia
(Alternative Release Scenario)
ALTERNATIVE RELEASE SCENARIOS INSIDE A BUILDING
The alternative release scenario inside a building is handled in much the same way as
is the worst-case scenario. See Figure E-4 for a flow chart describing the procedure.
To use the factors provided in Exhibit E-1 for estimating the release rate in a
building, you must assume the release takes place over a ten-minute period. The total
quantity released will be your estimated release rate multiplied by 10. If a ten minute
release is not a reasonable alternative scenario for your site, you will need to do
additional calculations or use a different method for releases in buildings.

8/11/2019 Guidance for Ammonia
http://slidepdf.com/reader/full/guidance-for-ammonia 16/27
Figure E-4
Guidance on Effectiveness of Building Mitigation for Alternative Release Sce
Calculate
Release
Rate QR
(lb/min)
Indoors
or
Outside?
Indoors
OutsideRelease
Rate =
QR lb/min
Release
Rate =
QR lb/min
Adjacent
to Door or
Window?
Yes
Airborne
Mass M = 0.4Q
Calculate
θ = V/(0.2Q)
Choose NV (hr-1)
Identify
FR 10
(Exhibit E-1)
No
Release
Entirely
Vapor?
Yes
No
Calculateθ = V/Q
AirborneMass M = Q

8/11/2019 Guidance for Ammonia
http://slidepdf.com/reader/full/guidance-for-ammonia 17/27
NH3 -17- Appendix E
Example 4
Suppose the release from a ½-inch hole in a tank with pressure 180 psig, cited in
Exhibit E-4, resulting in a release rate of 550 lb/min of flashing liquid ammonia,takes place inside a building with a ventilation rate Nv = 5 hr -1. The release is
assumed to take place over ten minutes, and the total quantity released is 550 × 10 =
5,500 lb, of which 0.4 × 5,500 = 2,200 lb becomes airborne. Of the airborne quantity,
1,100 lb is vapor and 1,100 lb is liquid that remains entrained in the vapor. The
remaining 3,300 lb of liquid forms an evaporating pool on the floor. The building
volume is 50 feet x 20 feet x 20 feet = 20,000 ft3, so that = 20,000/1,100 = 18
ft3/lb.
From Exhibit E-1, FR 10 = 0.35 for = 25 ft3/lb (the number closest to 18) and Nv =
5. Assuming a ten-minute release, the rate of release from the building is 77 lb/min
[QR B = (0.35)(0.4)(5,500)/10 from Equation 2 in section E.3.1]. Using Exhibit E-3,
the predicted distance to the toxic endpoint is 0.2 mile for a rural site and 0.1 mile foran urban site, compared to 0.4 mile (rural) and 0.2 mile (urban) for the same release
outdoors.
As noted above, the attenuation factors in Exhibit E-1 apply to ten-minute releases. If
you want to use the same method to perform a calculation for a different duration of
release in a building, consult the Technical Background Document cited at the
beginning of this appendix for additional information on how to carry out such
calculations.

8/11/2019 Guidance for Ammonia
http://slidepdf.com/reader/full/guidance-for-ammonia 18/27
Appendix E -18- NH3
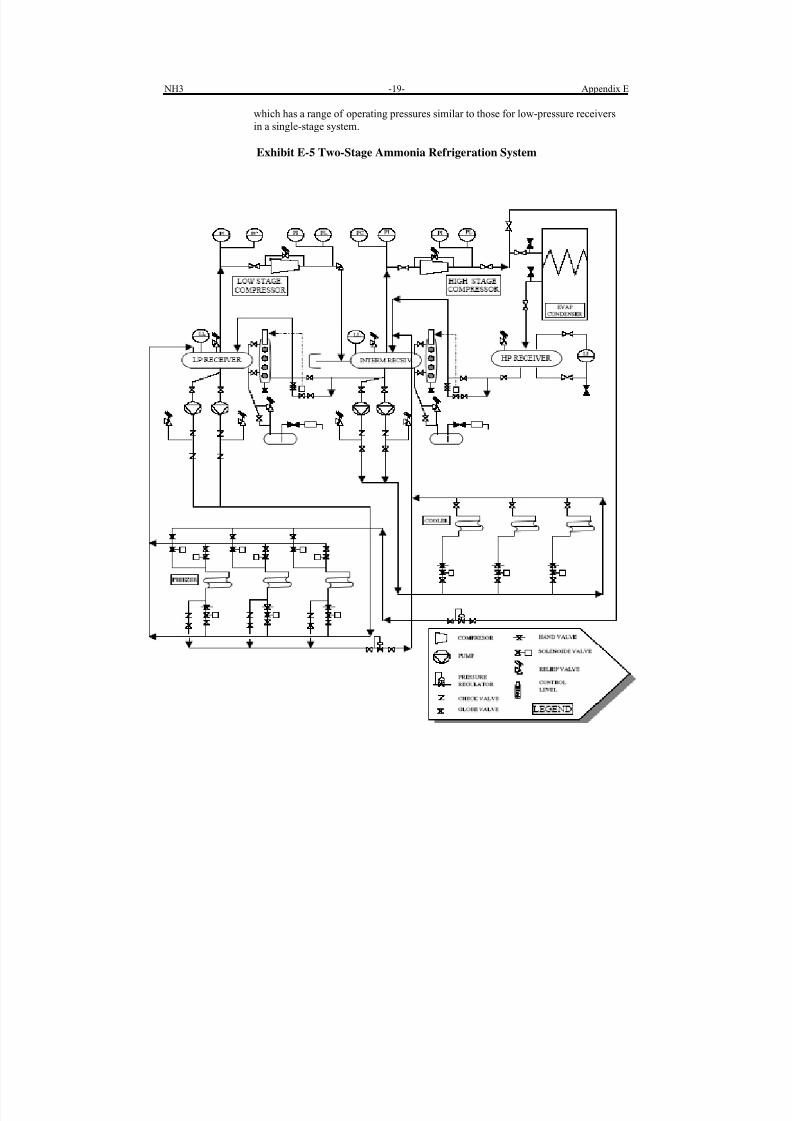
E.3.3 Brief Summary of the Various States in Which Ammonia Exists in a TypicalRefrigeration Facility
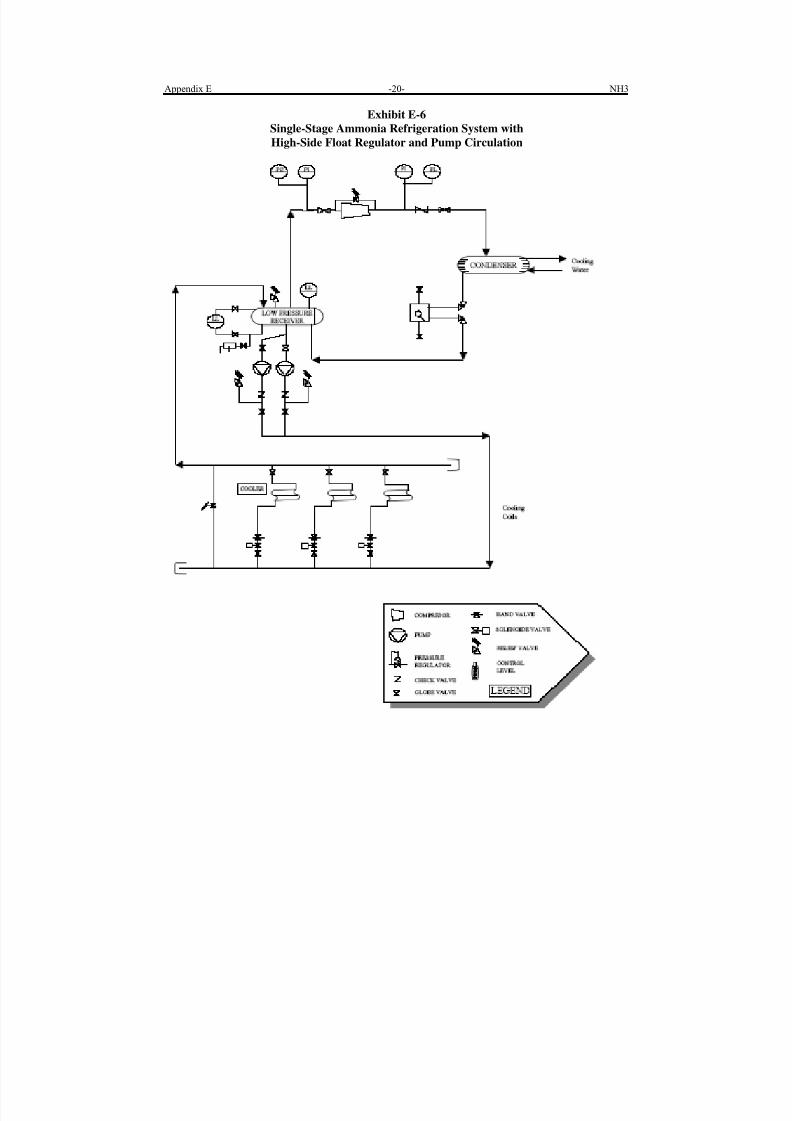
A typical block diagram of a two-stage ammonia refrigeration facility is shown on
the next page; a similar diagram of a single-stage facility is shown on the following
page.
AMMONIA LIQUEFIED UNDER PRESSURE
In many parts of a typical refrigeration system, there is ammonia liquefied under
pressure. If the pressure and temperature are sufficiently high, and if there is a sudden
release of liquid ammonia, it will all become and remain airborne as a mixture of
ammonia vapor and very fine liquid droplets that do not fall to the ground, provided
that no obstacles are encountered in the immediate vicinity of the release.
Experimental results clearly show that this is a real physical phenomenon (Goldwire
et al., 1985; Kaiser, 1989). The droplets evaporate quickly as air is entrained. The
evaporation process cools the air so that a cold mixture of air and ammonia vapor is
formed. The mixture is denser than air, and a heavy vapor dispersion model is
required to adequately predict airborne concentrations downwind of the point of
release.
In many refrigeration facilities, the ammonia travels from the discharge of the
compressors through the evaporative condensers to the high-pressure receiver. The
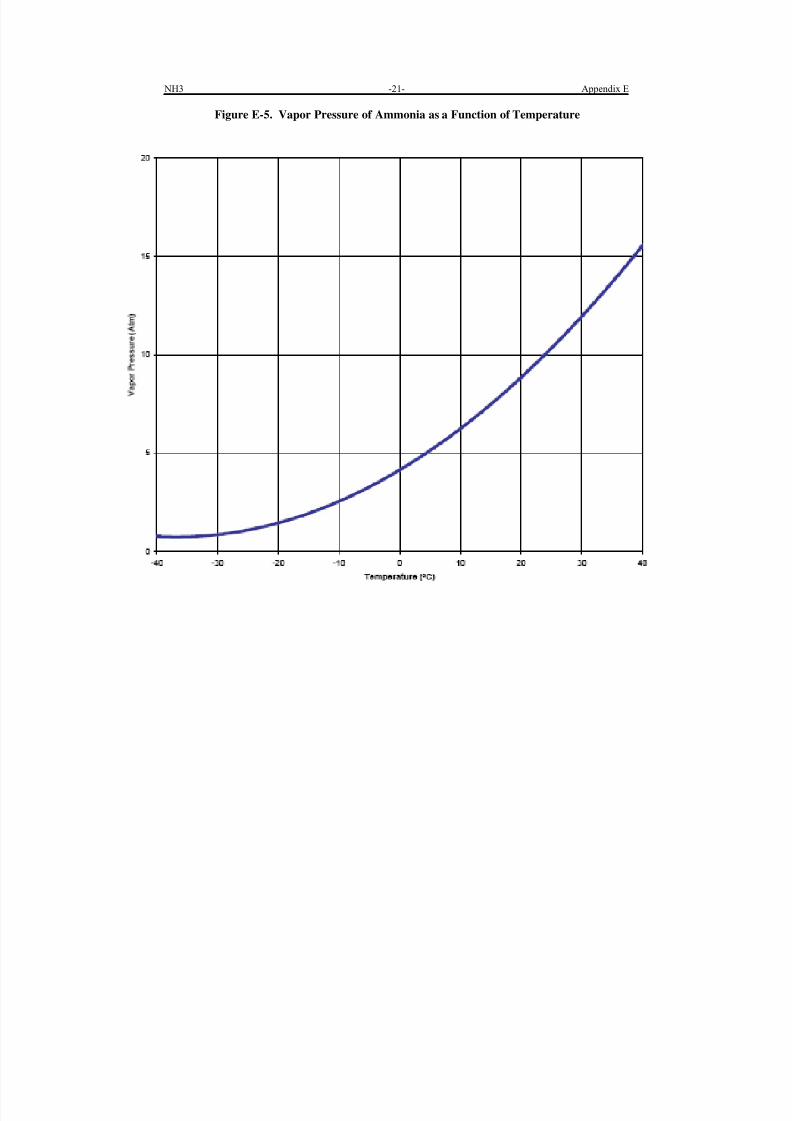
next page shows a range of typical pressures in the high-pressure receiver from 100
200 psig (approximately 8-15 atmospheres). The figure shows ammonia vapor
pressure as a function of temperature. Pressures of 8-15 atmospheres correspond to
ammonia temperatures of approximately 10-40 degrees C, or superheats (number of
degrees above the atmospheric boiling point) of about 40-70 degrees C. These
conditions are definitely such as to ensure that all of any liquid ammonia release will
become and remain airborne.
Some (but by no means all) refrigeration facilities have an ammonia storage vessel in
addition to the high-pressure receiver. This vessel will, in all likelihood, be outside,
and its pressure will fluctuate with the external temperature. However, at an ambient
temperature of 25 degrees C, the superheat would be about 60 degrees C so that the
characteristics of any release from such a vessel are expected to be similar to those of
a release from the high-pressure receiver. A release from such a vessel should be
considered as a candidate for the worst case.
Some refrigeration facilities may not have a high-pressure receiver. In such facilities,
ammonia at pressures as high as 180 psig is confined to pipework, and there may be a
low-pressure receiver with a typical pressure in the range 10-60 psig (~ 2-5
atmospheres), also containing ammonia liquefied under pressure. From Figure E-5,
the corresponding temperatures are -20-0 degrees C, or superheats of 10-30 degrees
C. It is only slightly conservative to assume that all of the ammonia released from
such a vessel becomes airborne. Two-stage systems have an intermediate receiver,
8/11/2019 Guidance for Ammonia
http://slidepdf.com/reader/full/guidance-for-ammonia 19/27
NH3 -19- Appendix E
which has a range of operating pressures similar to those for low-pressure receivers
in a single-stage system.
Exhibit E-5 Two-Stage Ammonia Refrigeration System
8/11/2019 Guidance for Ammonia
http://slidepdf.com/reader/full/guidance-for-ammonia 20/27
Appendix E -20- NH3
Exhibit E-6
Single-Stage Ammonia Refrigeration System with
High-Side Float Regulator and Pump Circulation
8/11/2019 Guidance for Ammonia
http://slidepdf.com/reader/full/guidance-for-ammonia 21/27
NH3 -21- Appendix E
Figure E-5. Vapor Pressure of Ammonia as a Function of Temperature
8/11/2019 Guidance for Ammonia
http://slidepdf.com/reader/full/guidance-for-ammonia 22/27
Appendix E -22- NH3
AMMONIA AT SUBATMOSPHERIC PRESSURES
In some facilities (e.g., food processing plants), even colder ammonia may be needed
(when, for example, very rapid freezing of food is necessary). The first figure showsa low-pressure receiver with subatmospheric pressures as low as 15 inches of water,
which corresponds to a temperature well below the atmospheric boiling point. If
released, the ammonia will spill onto the ground and, over an average period of 10
minutes or more, will evaporate at a much lower rate than a release from a worst-case
rupture in such a vessel as the high-pressure receiver. In addition, these low
temperature vessels are generally inside buildings, and it is likely that this would
further reduce the effective rate of release to the atmosphere external to the
refrigeration plant.
AMMONIA G AS
Finally, in ammonia refrigeration systems there is ammonia gas (vapor) in the systemunder a range of temperatures and pressures. If there is a rupture in the vapor space of
the high-pressure receiver, there will be a buoyant ammonia jet (i.e., the ammonia
vapor is less dense than air). However, for a given hole size and a given pressure, the
rate of release of ammonia gas is very much less than that of liquid ammonia, so that
it is unlikely that a vapor release would be the worst-case.

8/11/2019 Guidance for Ammonia
http://slidepdf.com/reader/full/guidance-for-ammonia 23/27
NH3 -23- Appendix E
E.3.4 Equations for Log-log Graphs and Calculations
LOG-LOG EQUATIONS
The guidance on Figure E-2 is essentially in the form of a straight line on a log-log
plot:
D = 0.0607(QR)0.4923 (4)
for a rural site and
D = 0.0443(QR)0.4782 (5)
for an urban site, where:
D = Distance to the endpoint (miles) and,
QR = Release rate (lb/min)
If you wish, you can use Equation 4 or 5 instead of Exhibit E-2 or Figure E-2.
The curves on Figure E-3 are approximately straight lines on a log-log plot:
D = 0.0222(QR)0.4780 (6)
at a rural site, and
D = 0.0130(QR)0.4164 (7)
at an urban site.
If you wish, you can use Equation 6 or 7 instead of Exhibit E-3 or Figure E-3.
ALTERNATIVE RELEASE SCENARIOS
There are many possible alternative scenarios. Some of those identified from a
review of past incidents in refrigeration facilities include:
Plant upsets leading to the lifting of relief valves
Pipeline failures
A blocked-in, liquid-full pipeline rupturing as it heats up
Failures during ammonia delivery, such as a hose leak
8/11/2019 Guidance for Ammonia
http://slidepdf.com/reader/full/guidance-for-ammonia 24/27

8/11/2019 Guidance for Ammonia
http://slidepdf.com/reader/full/guidance-for-ammonia 25/27
NH3
-25- Appendix E
6,895 = Conversion factor for psi to Pascals (Pg)
Combining the conversion factors and incorporating the density of ammonia, leads to
the equation presented in the text as Equation 3 for the release rate through a hole ofammonia liquefied under pressure:
QR = 203× HA×(Pg)½
Note that this is the formula for the release of a pure liquid and would apply to a
breach in the wall of a vessel or to the rupture of a very short pipe. For long pipes,
there is a pressure drop between the vessel and the hole that leads to flashing in the
pipe and a reduced rate of release.
The scenario needs to be modeled in typical weather conditions. For many sites,
Atmospheric Stability Category D with a moderate wind speed (e.g., 3 m/s) is close
to average. The distance to the toxic endpoint can then be estimated from Figure E-3or from Exhibit E-3, which is a tabulation of Figure E-3. These results could simply
be quoted in the Risk Management Plan.
You also may identify your own alternative scenario(s). Consult your trade
association (e.g., the International Institute of Ammonia Refrigeration) for guidance
on other scenarios. Your Process Hazards Analysis is another potential source of
pertinent information. However, remember that the regulation requires that releases
large enough to have the potential to exceed the toxic endpoint offsite be considered.
E.3.5 Addit ional Guidance on Modeling
If the owner or operator decides to perform his/her own modeling, there are twomajor items that are not trivial. These are:
a) Correct characterization of the source term (e.g., rate of release,
temperature, density, momentum, aerosol content, etc.)
b) Choice of a suitable dispersion model
It is not possible to cover in detail all of the issues that need to be addressed, although
there are sources of useful advice. The quadrennial conferences on vapor cloud
dispersion modeling that are organized by the Center for Chemical Process Safety
(CCPS) are a good source of information on the latest developments in source term
and dispersion modeling (CCPS, 1987, 1991, 1995). There are also CCPSGuidebooks, such as "Guidelines for Use of Vapor Cloud Dispersion Models
Second Edition".
EPA has also published additional guidance. There is one document that looks
carefully at the definition of source terms (USEPA, 1993). There is another that
describes EPA's own screening model for accidental releases of accidental chemicals
TSCREEN (USEPA, 1992). EPA has also performed an evaluation of dense gas
8/11/2019 Guidance for Ammonia
http://slidepdf.com/reader/full/guidance-for-ammonia 26/27
8/11/2019 Guidance for Ammonia
http://slidepdf.com/reader/full/guidance-for-ammonia 27/27
NH3 -27- Appendix E
International Institute of Ammonia Refrigeration (1998). Guidelines for: IIAR
Minimum Safety Criteria for a Safe Ammonia Refrigeration System, IIAR B-109.
International Institute of Ammonia Refrigeration (1993). Guidelines for Start-Up, Inspection, and Maintenance of Ammonia Refrigeration Systems, IIAR B-110.
International Institute of Ammonia Refrigeration (1991). Guidelines for Ammonia
Machinery Room Ventilation, IIAR Bulletin 111.
International Institute of Ammonia Refrigeration (1991). Guidelines for
Identification of Ammonia Refrigeration Piping and System Components, IIAR B
114.
International Institute of Ammonia Refrigeration (1992). Guidelines for Avoiding
Component Failure in Industrial Refrigeration Systems Caused by Abnormal
Pressure or Shock , IIAR B-116.
United States Environmental Protection Agency (USEPA, 1991). "Evaluation of
Dense Gas Simulation Models," EPA-450/R-89-018, Research Triangle Park, NC.
United States Environmental Protection Agency (USEPA, 1993). "Contingency
Analysis for Superfund Sites and Other Industrial Sources," EPA-454/R-93-001,
Research Triangle Park, NC.
United States Environmental Protection Agency (USEPA, 1999). “Technical
Background Document for Offsite Consequence Analysis for Anhydrous Ammonia,
Aqueous Ammonia, Chlorine, and Sulfur Dioxide,” EPA-550-B99-017, Washington,
DC.
United States Environmental Protection Agency (USEPA, 2001). Chemical Safety
Alert: “ Hazards of Ammonia Releases at Ammonia Refrigeration Facilities
(Update),” EPA 550-F-01-009. Available through EPA website at:
www.epa.gov/emergencies.