guide for monitoring employment and conducting employment
TRANSCRIPT

Guide for Monitoring Employment and Conducting Employment Impact Assessments (EmpIA) of Infrastructure InvestmentsEmployment Intensive Investment ProgrammeDevelopment and Investment BranchEmployment Policy Department

Guide for Monitoring Employment and Conducting Employment Impact Assessments (EmpIA) of Infrastructure Investments
Employment Intensive Investment ProgrammeDevelopment and Investment BranchEmployment Policy DepartmentILO, 2020
Version 1.0
This document has been produced by the International Labour Office with the financial assistance of the European Union

ii
Copyright © International Labour Organization 2020
First published 2020
Publications of the International Labour Office enjoy copyright under Protocol 2 of the Universal Copyright Convention. Nevertheless, short excerpts from them may be reproduced without authorization, on condition that the source is indicated. For rights of reproduction or translation, application should be made to ILO Publications (Rights and Permissions), International Labour Office, CH-1211 Geneva 22, Switzerland, or by email: [email protected]. The International Labour Office welcomes such applications.
Libraries, institutions and other users registered with reproduction rights organizations may make copies in accordance with the licences issued to them for this purpose. Visit www.ifrro.org to find the reproduction rights organization in your country.
Guide for Monitoring Employment and Conducting Employment Impact Assessments (EmpIA) of Infrastructure Investments
ISBN: 978-92-2-032084-6 (print)
ISBN: 978-92-2-032083-9 (web pdf)
The designations employed in ILO publications, which are in conformity with United Nations prac-tice, and the presentation of material therein do not imply the expression of any opinion whatso-ever on the part of the International Labour Office concerning the legal status of any country, area or territory or of its authorities, or concerning the delimitation of its frontiers.
The responsibility for opinions expressed in signed articles, studies and other contributions rests solely with their authors, and publication does not constitute an endorsement by the International Labour Office of the opinions expressed in them.
Reference to names of firms and commercial products and processes does not imply their endorsement by the International Labour Office, and any failure to mention a particular firm, commercial product or process is not a sign of disapproval.
ILO publications and electronic products can be obtained through major booksellers or ILO local offices in many countries, or direct from ILO Publications, International Labour Office, CH-1211 Geneva 22, Switzerland. Catalogues or lists of new publications are available free of charge from the above address, or by email: [email protected]
Visit our web site: www.ilo.org/publns
Printed in Switzerland ILO
Design in Switzerland CPG
Cover page photo: ILO’s Moztrabalha Project 2019, Mozambique

PrefaceEmployment is a key driver for development as it constitutes a bridge between economic growth and poverty reduction. People and households get out of poverty most often by moving into more productive and decent jobs or improving existing jobs. Placing the aim of achieving full and productive employment at the heart of development policy is therefore critical for reducing and eventually eliminating poverty, reducing inequality and addressing informality. This is also globally recognized with the adoption of Sustainable Development Goal (SDG) 8: “Promote sustained, inclusive and sustainable economic growth, full and productive employment and decent work for all.”
The European Commission (EC) and the International Labour Organization (ILO) both recognize that, in order to achieve SDG 8, it is critical that full and productive employment be at the heart of development policy. In the “New European Consensus on Development”, the EC emphasizes the importance of targeted policies in developing countries to promote the engagement of citizens - especially the youth, women and potential migrants – in social, civic and economic life and to ensure their full contribution to inclusive growth and sustainable development.
In this regard, the EC and ILO have jointly initiated a project entitled “Strengthening the Impact on Employment of Sectoral and Trade Policies”. This innovative project includes developing methods and capacities to determine the effects of infrastructure investments on employment. This project, being implemented in nine partner countries and working with national governments and social partners, aims to strengthen the capabilities of country partners to analyse, design and implement sectoral and trade policies and programmes for more and better jobs.
This Guide is one in a series of project publications that aim to capture the tools and methods developed and used under this project, as well as the main lessons from implementing these in the partner countries. By doing so, the experience and learning of the project can be disseminated to other countries and partners for their benefit, thus encouraging the integration of global and national employment objectives into sectoral and trade policies and consequently supporting the global employment agenda and the achievement of SDG 8.
This is Version 1.0 of this Guide, and as with all guides, it will require revisions from time to time, based on lessons learned from when it is used. It is the intention to revise this Guide based on the experiences and feedback of those who have used it on their projects.
1

AcknowledgementsThis production of this Guide was supported by the project called “Strengthening the Impact on Employment of Sectoral and Trade Policies” (STRENGTHEN), which is implemented by the International Labour Office with financial support from the European Union.
This Guide builds on the collective work and experience with Monitoring of Employment and conducting Employment Impact Assessments of the Employment Intensive Investment Programme of the ILO. It also incorporates the experience and lessons learned from conducting Employment Impact Assessment of Infrastructure investments as part of the STRENGTHEN project. The inputs and comments provided by stakeholders, consultants and experts in the partner countries when conducting and validating these assessment were also incorporated.
This Guide was prepared by Maikel Lieuw-Kie-Song (Infrastructure Specialist ILO). Others who contributed to parts of the guide are Haile Abebe (ILO), Shereen Abbady (Independent Consultant, Jordan), Kirit Vaidya, and David Morris (Aston Business School, UK). Chris Donnges and Terje Tessem provided valuable comments and suggestions on the Guide. In addition valuable comments and inputs on relevant EmpIA studies were provided by David Cheong, Matthieu Charpe, Marek Harsdorff and David Kucera (ILO).
DisclaimerAll views, findings and results expressed in this guide are of the authors alone and should not be attributed to the EU, ILO or to any other organization with which the authors are affiliated.
Guide for Monitoring Employment and Conducting Employment Impact Assessments (EmpIA) of Infrastructure Investments2

Table of ContentsPreface . . . . . . . . . . . . . . . . . . . . . . . . . . . . . . . . . . . . . . . . . . . . . . . . . . . . . . . . . . . . . . . . . . 1Acknowledgements . . . . . . . . . . . . . . . . . . . . . . . . . . . . . . . . . . . . . . . . . . . . . . . . . . . . . . . . 2Disclaimer . . . . . . . . . . . . . . . . . . . . . . . . . . . . . . . . . . . . . . . . . . . . . . . . . . . . . . . . . . . . . . . . 2Abbreviations and acronyms . . . . . . . . . . . . . . . . . . . . . . . . . . . . . . . . . . . . . . . . . . . . . . . . . 4Introduction . . . . . . . . . . . . . . . . . . . . . . . . . . . . . . . . . . . . . . . . . . . . . . . . . . . . . . . . . . . . . . 5UNIT 1A Framework for assessing employment effects of infrastructure investments . . . . . . . . . 9
1.1 Measuring and Monitoring Employment effects . . . . . . . . . . . . . . . . . . . . . . . . . . . . 101.2 Mechanisms for how Infrastructure Investment impact on Employment: A Theory of Change . . . . . . . . . . . . . . . . . . . . . . . . . . . . . . . . . . . . . . . . . . . . . . . . . . . . . 11
UNIT 2 Monitoring and reporting of the direct employment effects of infrastructure investments . . . . . . . . . . . . . . . . . . . . . . . . . . . . . . . . . . . . . . . . . . . . . . . . . . . . . . . . . . . . . . 15
2.1 Core data . . . . . . . . . . . . . . . . . . . . . . . . . . . . . . . . . . . . . . . . . . . . . . . . . . . . . . . . . . 162.2 Using the core data to calculate secondary indicators . . . . . . . . . . . . . . . . . . . . . . . 212.3 Regular progress reporting . . . . . . . . . . . . . . . . . . . . . . . . . . . . . . . . . . . . . . . . . . . 222.4 Capturing Direct Employment impacts in Project Completion Reports . . . . . . . . . . 252.5 Ex-ante estimations and employment targets . . . . . . . . . . . . . . . . . . . . . . . . . . . . . 27
UNIT 3 In depth EmpIA studies on direct employment effects . . . . . . . . . . . . . . . . . . . . . . . . . . . . 29
3.1 Defining the scope . . . . . . . . . . . . . . . . . . . . . . . . . . . . . . . . . . . . . . . . . . . . . . . . . . . 303.2 Data and Indicators for more in depth assessments . . . . . . . . . . . . . . . . . . . . . . . . 313.3 Methodology: Interviews, site visits, document reviews and surveys . . . . . . . . . . . 363.4 Data collection . . . . . . . . . . . . . . . . . . . . . . . . . . . . . . . . . . . . . . . . . . . . . . . . . . . . . . 373.5 Data analysis and expert assessments . . . . . . . . . . . . . . . . . . . . . . . . . . . . . . . . . . . 393.6 Reporting of results . . . . . . . . . . . . . . . . . . . . . . . . . . . . . . . . . . . . . . . . . . . . . . . . . . 403.7 Project level data and information useful for macro estimations . . . . . . . . . . . . . . . 40
UNIT 4 Assessing indirect and induced employment effects of infrastructure investments using SAM Multiplier Analysis . . . . . . . . . . . . . . . . . . . . . . . . . . . . . . . . . . . . . 43
4.1 Introduction . . . . . . . . . . . . . . . . . . . . . . . . . . . . . . . . . . . . . . . . . . . . . . . . . . . . . . . . 444.2 Links between the micro and macro effects and indicators . . . . . . . . . . . . . . . . . . . 444.3 Indirect and induced effects using multiplier analysis . . . . . . . . . . . . . . . . . . . . . . . 464.4 Refining estimates by creating a construction sector sub account . . . . . . . . . . . . . . 484.5 Analysis of results and reporting on the indirect and induced employment effects 50
Bibliography . . . . . . . . . . . . . . . . . . . . . . . . . . . . . . . . . . . . . . . . . . . . . . . . . . . . . . . . . . . . . 53Annexes . . . . . . . . . . . . . . . . . . . . . . . . . . . . . . . . . . . . . . . . . . . . . . . . . . . . . . . . . . . . . . . . . 57
Annex 1. Template for Regular Progress Reporting . . . . . . . . . . . . . . . . . . . . . . . . . . . . 58Annex 2. Template for Project Completion Report . . . . . . . . . . . . . . . . . . . . . . . . . . . . . 59Annex 3. Methodology for disaggregating the construction sector account . . . . . . . . . 60Annex 4. Values of key indicators from different regions and for different investments 76
3

Abbreviations and acronymsBOO Build, Operate and OwnCGE Computable General EquilibriumDySAM Dynamic Social Accounting MatrixCI Capital IntensiveEEAA Egyptian Environmental Affairs AgencyEIIP Employment-Intensive Investment Programme (ILO)EmpIA Employment Impact AssessmentEPWP Expanded Public Works Programme (South Africa)EO Employment to Output (ratio)EU European UnionEUR EuroFTE Full Time EquivalentLGBT Lesbian, Gay, Bisexual and TransgenderedGNI Gross National IncomeIFC International Finance CorporationILO International Labour OrganisationIOT Input-Output TableISCED International Standard Classification of EducationISIC International Standard Industrial ClassificationKII Key Informant InterviewsLI Labour-intensiveLIC Low Income CountriesLMIC Low Middle Income CountriesMAD (DH) Moroccan DirhamMENA Middle East and North Africa MIS Management Information SystemM&E Monitoring and EvaluationOECD Organisation for Economic Co-operation and DevelopmentO&M Operation and Maintenance PM Project ManagementPMU Project Management UnitRMF Results Measurement FrameworkSAM Social Accounting MatrixSDGs Sustainable Development GoalsSIC Standard Industrial ClassificationTOC Theory of ChangeTOR Terms of ReferenceT I Type 1 MultiplierT II Type 2 MultiplierUSD United States Dollar
Guide for Monitoring Employment and Conducting Employment Impact Assessments (EmpIA) of Infrastructure Investments4

IntroductionInfrastructure investments are critical for achieving the Sustainable Development Goal (SDG) and it is estimated that the achievement of 92% these goals is influenced by the availability or improvement of related infrastructure. It is also important to note that these infrastructure investments are required across the globe. In least developed countries the infrastructure that ensures access to basic services such as safe drinking water, electricity and all weather access to markets and schools is still inadequate. ‘Today the infrastructure gap is huge: 940 million people live without electricity, 663 million lack improved sources of drinking water, 2.4 billion lack improved sanitation facilities, one billion live more than two kilometers from an all-season road, and four billion people lack internet access1. On the other side, many developed countries also require massive investments to improve their existing infrastructure, much of which is approaching the end of its economic lifespans. For example recent estimates have placed the infrastructure investment required to support the achievement of the SDSs at US$6.3 trillion per year until 20302.
These massive investments will have important impacts on employment and the labour market. While short-term job creation is seldom the primary objective of an infrastructure investment, enhancing qualitative and quantitative employment outcomes is increasingly seen as one of the developmental impacts of infrastructure investments that need to be optimized. For this reason, there is an increasing interest in assessing and capturing these effects3. For the International Labour Organization (ILO), working to increase and enhance the employment outcomes of such investments is core to its mandate.
During their construction, infrastructure investments generate significant employment in the construction as well as related sectors that provide its inputs. At the same time, they can also be used strategically to improve the quality of employment in these sectors. Globally, there is an increased interest in monitoring these employment impacts so that these can be better understood and factored into National Development Plans and National Employment Policies. At the same time such knowledge can help to strengthen the use of infrastructure investment as a policy response to the negative employment effects of economic downturns and other types of crises. The type of knowledge and data collected through applying this guide will enhance this understanding and contribute to enhancing the employment outcomes of infrastructure investments.
This guide supports the monitoring and assessment of the short-term employment impacts of infrastructure investments, i.e. the effects during the construction process. Its target audience is people involved in the planning, design, execution and operation of infrastructure investments. These, many of whom are not economists are often still required to account and report on the employment outcomes of these investments. The purpose of this guide is to provide practical methods and approaches which can be used by project managers and monitoring staff without a background in labour or macroeconomics. Only for the methodology proposed in Unit 4 a macroeconomist or labour specialist is required. In this sense Unit 4 is intended to empower staff responsible for infrastructure planning and implementation to commission a study using the proposed methodology.
While it is known that in the long-term infrastructure investments also have impacts on lowering production costs, increasing labour productivity and creating new business opportunities which in turn have profound impacts on employment, these effects are not within the scope of this guide, as they require fundamentally different approaches and methodologies to assess. The task of assessing these also generally falls to a different audience.
1 World Bank Report (2019) Beyond the Gap – How Countries Can Afford the Infrastructure They Need while Protecting the Planet2 https://www.oecd.org/env/cc/g20-climate/Technical-note-estimates-of-infrastructure-investment-needs.pdf3 For example the EU’s External Investment Plan has Job Creation as one of its objectives (link) and the IFC has included employment one its core operational objectives.
5

This Guide is primarily based on the experience of the ILO in this area of work. It reflects practices and learning from ILO technical cooperation, projects and studies in amongst others Jordan, Lebanon, Morocco, Tunisia, Egypt, South Africa and Indonesia. It also includes the learning and experience from the Strengthen project in Rwanda and Ghana, and so aims to fill gaps that have been identified in the process. A number of other guides and publications by other agencies were also reviewed in the process. What is proposed is thus also an improvement on the current practices within the ILO. But it is written as a guide that can be used by any organization interested in the employment impacts of its infrastructure investments. The Guide also aims to introduce more rigour, consistency and coherence so that results and data obtained can be compared, aggregated and analyzed.
The guide also recognizes that it is possible, and in some cases desirable, to conduct even more in-depth and rigorous impact evaluations, using more sophisticated methodologies such experiments or quasi experiments, as well as economic models such as Computable General Equilibrium models (CGEs). But these methods require substantial involvement of specialists, as well as additional data collection and are outside the scope of this Guide4.
This guide consists of four Units. Units 1 and 2 provide practical guidance to project managers and staff responsible for Monitoring and Evaluation on reporting the direct employment outcomes of their projects. Unit 1 provides background to employment and infrastructure investments and presents the analytical framework of how infrastructure investments impact on employment during the construction process. This framework provides the basis for how the indicators and methods presented were selected. Unit 2 elaborates on the different indicators that can be used to monitor and measure employment effects. It distinguishes between indicators which can be measured from standard project information and thus be used in the regular progress reporting, and those that can be included when more in-depth studies are conducted. It also presents how the relevant employment indicators and results can be integrated into regular monitoring and reporting, during planning, implementation and upon completion.
Units 3 and 4 provide guidance on how more in-depth Employment Impact Assessments can be done, with Unit 3 addressing the direct effects and Unit 4 the indirect and induced effects. As these in-depth assessments would usually be done by a consultant these units are intended to assist project manager with developing a Terms of Reference and interpret the results from these assessments. Unit 3 provides guidance on conducting more-in depth studies of the direct employment effects, in particular on how to commission such a study. The guide concludes with Unit 4 which describes the links between the direct and indirect effects. It also explains how multiplier analysis using an Input-Output Table (IOT) or Social Accounting Matrix (SAM) can be adapted for assessing the employment effects of infrastructure investments. This Unit is accompanied by a detailed methodological Annex.
4 For these methods reference can be made to a number of other Strengthen Publications in the bibliography.
Guide for Monitoring Employment and Conducting Employment Impact Assessments (EmpIA) of Infrastructure Investments6

7
Employment impact assessments
Public and private sector development
Public employment programmes
Green works
Local resource-based approaches and community infrastructure
Emergency employment
The ILO’s Employment Intensive Investment Programme (EIIP) is implemented through global, regional, national and local programmes, funded by governments and development partners, and include sectoral, national or local infrastructure programmes, public work programmes and public employment programmes. Over the years, EIIP has developed a comprehensive package of product lines, covering
the following six thematic areas:
More information on these can be found in the EIIP Programme document on the EIIP website: www.ilo.org/eiip

China. 2007. Crozet M. © ILO

UNIT 1
A Framework for assessing employment effects of infrastructure investments
9

1.1 Measuring and Monitoring Employment effects
Measuring and monitoring employment effects of any intervention is generally challenging, because employment has a multi-dimensional nature as well as various qualitative and quantitative features. Furthermore different groups in society such as youth or women may be affected differently by such an intervention, and so there is often an interest to have data broken down by characteristics of workers, such as gender, age, educational achievement or qualification. Monitoring and measuring all these dimensions requires a large number of indicators. For most infrastructure projects it would be too costly and time consuming to include so many indicators in their Results Measurement Framework (RMF).
While there are practices on what employment related indicators to use when designing the results measurement for infrastructure investments5, this guide aims to introduce some standardization in this. The ILO, which through its Employment Intensive Investment Programme (EIIP) has extensive experience with implementing and supporting labour-intensive (LI) infrastructure investments, also does not currently have a fully standardized framework that is used systematically on all its projects. This guide proposes such a standard framework to be used by the ILO, but which governments and other development partners can also adopt.
This guide recommends an approach for the monitoring of all infrastructure investments where the employment effects are of interest. It recommends the use of five core indicators for monitoring and assessment of the employment effects. These indicators presented in Unit 2 are designed in such a way that they can be used to monitor the direct employment effect generated, while at the same time being consistent with results obtained from estimating the indirect and induced effects, which are derived using different methodologies. They can also be used in all the assessment phases (ex-ante, implementation and ex-post).
Before continuing, it is important to provide a note on terminology used in this Guide. It uses the term infrastructure investments, to refer to projects, a portfolio of projects or programmes (consisting of multiple similar projects). The guide can be used in all of these cases, but some judgement is required on under what circumstances to conduct a detailed assessment as discussed in Units 3 and 4. These are only really sensible and appropriate for relatively large investments.
Before presenting in more detail how employment effects can be measured and monitored, it is important to first outline through what mechanisms infrastructure investments impact on employment. This is presented in the next section through an analytical framework / Theory of Change (TOC). This TOC forms the basis for incorporating employment into a RMF.
5 From a recent review undertaken by the ILO of eight leading International Financial Institutions, it was clear that employment effects were only monitored to a limited extent and not in a consistent manner (ILO 2019b).
Guide for Monitoring Employment and Conducting Employment Impact Assessments (EmpIA) of Infrastructure Investments10

1.2 Mechanisms for how Infrastructure Investment impact on Employment: A Theory of Change
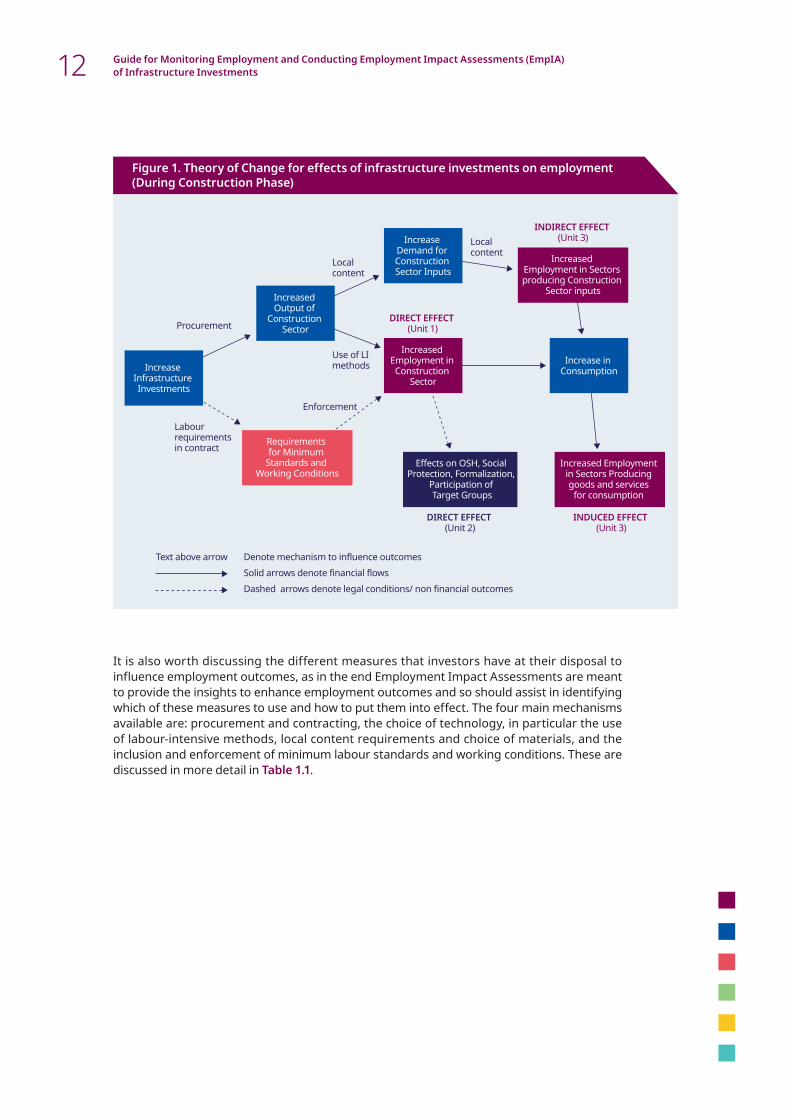
The monitoring and assessment of infrastructure investment is generally done in accordance with a results measurement framework6. Such a framework generally provides an overview of the anticipated outputs, outcomes and impacts, as well as indicators on how to measure these. Once it has been decided to include employment into the results measurement framework, the processes and mechanisms of how the investment impacts on employment needs to be articulated. This is typically done through a Theory of Change (TOC). For infrastructure investments the mechanisms through which these investments impact on employment in the short-term are generally well understood and presented in figure 1.
The blue boxes in figure 1 represent economic effects, measured in monetary terms. The purple boxes represent effects on the quantity of employment, and the dark blue boxes effects on the quality of employment. This guide focuses on the measuring and monitoring of the effects represented by purple and dark blue boxes. Similarly the solid arrows represent financial flows, and the dashed arrows non-financial measure or outcomes. The text above some of the arrows denote the different measures available to the organization making the investment to influence the employment outcomes.
In summary, the TOC is that through increased infrastructure investments the output of the construction sector is increased. This in turn increases employment in the construction sector as additional labour is required to produce the additional output. This is the direct effect. At the same time, increasing the output of the construction sector also requires increasing the non-labour inputs such as construction materials to the sector. This in turn increases the outputs of sectors that produce these inputs, in turn triggering demand for labour in these sectors. It should be noted that as these sectors in turn require inputs, this effect occurs over multiple cycles, which is called the multiplier effect. Increased employment triggered by the increased demand for construction sector inputs is called the indirect effect. Finally, if employment in the economy increases, this triggers increased consumption by those who are now employed or whose income has increased. This again triggers employment in the sectors that produce consumer goods and services. This is the induced effect.
In addition to these effects on the quantum of employment, the infrastructure investments can also have effects on the quality of employment, in particular in the construction sector. If the client includes conditions for labour standards, working conditions and employment equity, and ensures that these are enforced, the investment can also have an impact on Occupational Safety and Health (OSH), Social Protection, formalization and the participation of target groups who have more difficulties finding employment.
While there may be specific variations in different contexts, this TOC can be applied to most infrastructure investments and forms the underlying logic for this guide.
6 Result measurement frameworks are also referred to Monitoring and Evaluation Frameworks, and come in many shapes and sizes. The Logical Framework (Logframe) has been the most widely used in development projects, but increasingly other approaches are also used.
UNIT 1.A Framework for assessing employment effects of infrastructure investments 11
It is also worth discussing the different measures that investors have at their disposal to influence employment outcomes, as in the end Employment Impact Assessments are meant to provide the insights to enhance employment outcomes and so should assist in identifying which of these measures to use and how to put them into effect. The four main mechanisms available are: procurement and contracting, the choice of technology, in particular the use of labour-intensive methods, local content requirements and choice of materials, and the inclusion and enforcement of minimum labour standards and working conditions. These are discussed in more detail in Table 1.1.
Figure 1. Theory of Change for effects of infrastructure investments on employment (During Construction Phase)
Procurement
Enforcement
Labour requirements in contract
INDIRECT EFFECT (Unit 3)
DIRECT EFFECT (Unit 1)
DIRECT EFFECT (Unit 2)
INDUCED EFFECT (Unit 3)
Local content
Local content
Use of LI methods
Text above arrow Denote mechanism to influence outcomesSolid arrows denote financial flowsDashed arrows denote legal conditions/ non financial outcomes
Increase Infrastructure Investments
Increased Output of
Construction Sector
Increase Demand for Construction Sector Inputs
Increase in Consumption
Increased Employment in Sectors producing Construction
Sector inputs
Increased Employment in Sectors Producing goods and services
for consumption
Requirements for Minimum
Standards and Working Conditions
Effects on OSH, Social Protection, Formalization,
Participation of Target Groups
Increased Employment in Construction
Sector
Guide for Monitoring Employment and Conducting Employment Impact Assessments (EmpIA) of Infrastructure Investments12
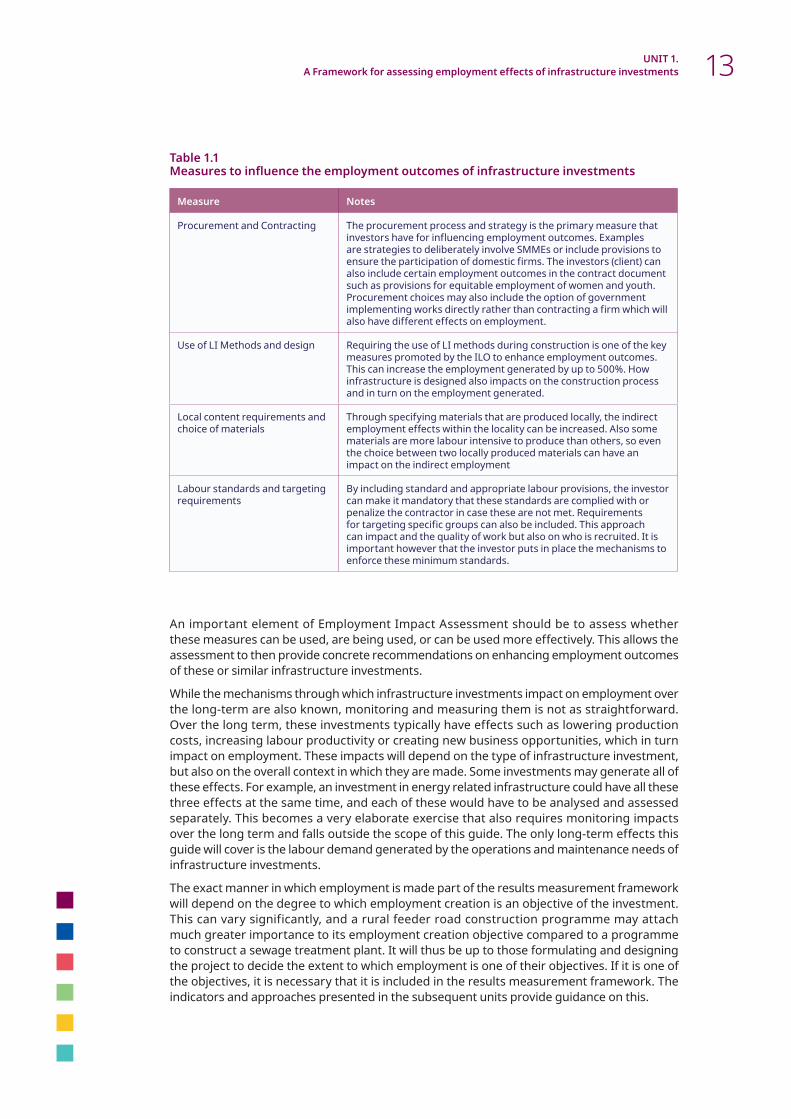
Table 1.1 Measures to influence the employment outcomes of infrastructure investments
Measure Notes
Procurement and Contracting The procurement process and strategy is the primary measure that investors have for influencing employment outcomes. Examples are strategies to deliberately involve SMMEs or include provisions to ensure the participation of domestic firms. The investors (client) can also include certain employment outcomes in the contract document such as provisions for equitable employment of women and youth. Procurement choices may also include the option of government implementing works directly rather than contracting a firm which will also have different effects on employment.
Use of LI Methods and design Requiring the use of LI methods during construction is one of the key measures promoted by the ILO to enhance employment outcomes. This can increase the employment generated by up to 500%. How infrastructure is designed also impacts on the construction process and in turn on the employment generated.
Local content requirements and choice of materials
Through specifying materials that are produced locally, the indirect employment effects within the locality can be increased. Also some materials are more labour intensive to produce than others, so even the choice between two locally produced materials can have an impact on the indirect employment
Labour standards and targeting requirements
By including standard and appropriate labour provisions, the investor can make it mandatory that these standards are complied with or penalize the contractor in case these are not met. Requirements for targeting specific groups can also be included. This approach can impact and the quality of work but also on who is recruited. It is important however that the investor puts in place the mechanisms to enforce these minimum standards.
An important element of Employment Impact Assessment should be to assess whether these measures can be used, are being used, or can be used more effectively. This allows the assessment to then provide concrete recommendations on enhancing employment outcomes of these or similar infrastructure investments.
While the mechanisms through which infrastructure investments impact on employment over the long-term are also known, monitoring and measuring them is not as straightforward. Over the long term, these investments typically have effects such as lowering production costs, increasing labour productivity or creating new business opportunities, which in turn impact on employment. These impacts will depend on the type of infrastructure investment, but also on the overall context in which they are made. Some investments may generate all of these effects. For example, an investment in energy related infrastructure could have all these three effects at the same time, and each of these would have to be analysed and assessed separately. This becomes a very elaborate exercise that also requires monitoring impacts over the long term and falls outside the scope of this guide. The only long-term effects this guide will cover is the labour demand generated by the operations and maintenance needs of infrastructure investments.
The exact manner in which employment is made part of the results measurement framework will depend on the degree to which employment creation is an objective of the investment. This can vary significantly, and a rural feeder road construction programme may attach much greater importance to its employment creation objective compared to a programme to construct a sewage treatment plant. It will thus be up to those formulating and designing the project to decide the extent to which employment is one of their objectives. If it is one of the objectives, it is necessary that it is included in the results measurement framework. The indicators and approaches presented in the subsequent units provide guidance on this.
UNIT 1.A Framework for assessing employment effects of infrastructure investments 13

Tunisia. 2016. Crozet M. © ILO

UNIT 2
Monitoring and reporting of the direct employment effects of infrastructure investments
15
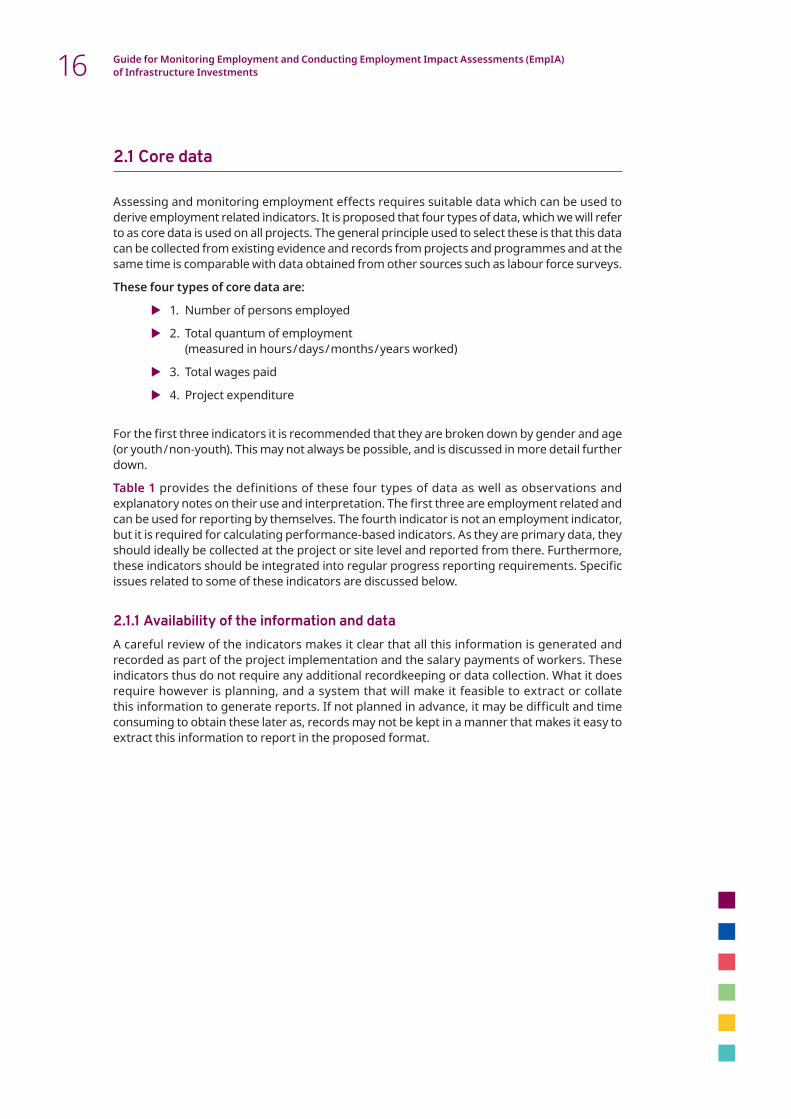
2.1 Core data
Assessing and monitoring employment effects requires suitable data which can be used to derive employment related indicators. It is proposed that four types of data, which we will refer to as core data is used on all projects. The general principle used to select these is that this data can be collected from existing evidence and records from projects and programmes and at the same time is comparable with data obtained from other sources such as labour force surveys.
These four types of core data are:
X 1. Number of persons employed
X 2. Total quantum of employment (measured in hours / days / months / years worked)
X 3. Total wages paid
X 4. Project expenditure
For the first three indicators it is recommended that they are broken down by gender and age (or youth / non-youth). This may not always be possible, and is discussed in more detail further down.
Table 1 provides the definitions of these four types of data as well as observations and explanatory notes on their use and interpretation. The first three are employment related and can be used for reporting by themselves. The fourth indicator is not an employment indicator, but it is required for calculating performance-based indicators. As they are primary data, they should ideally be collected at the project or site level and reported from there. Furthermore, these indicators should be integrated into regular progress reporting requirements. Specific issues related to some of these indicators are discussed below.
2.1.1 Availability of the information and dataA careful review of the indicators makes it clear that all this information is generated and recorded as part of the project implementation and the salary payments of workers. These indicators thus do not require any additional recordkeeping or data collection. What it does require however is planning, and a system that will make it feasible to extract or collate this information to generate reports. If not planned in advance, it may be difficult and time consuming to obtain these later as, records may not be kept in a manner that makes it easy to extract this information to report in the proposed format.
16 Guide for Monitoring Employment and Conducting Employment Impact Assessments (EmpIA) of Infrastructure Investments

Table 2.1 Core data to be collected for all investments
Information / Indicator Definition Observations and explanatory notes
1.Number of persons employed, with gender and date of birth. (END OF PROJECT)
Total number of distinct person employed on the project or programme over the reporting period, with records on their gender and date of birth.
This indicator demonstrates how many persons have benefitted from working on the project. It should be seen as a headcount, or if ID numbers are used for registering workers, the number of distinct ID numbers should be used. Gender and date of birth should be recorded so that it can be broken down by gender and age.Care needs to be taken when aggregating, as the same people could be working on a project over multiple reporting periods and as such these results cannot simply be added up over each reporting period. For this reason it may be most practical to only report on this indicator at the end of a project.
2.Number of days or months worked broken down by gender, youth*
Total number of days or months worked by all workers on the project over the reporting period.
This indicator measures the total amount of labour input provided on the project. Whether to use total days or months will depend on the project. Whatever unit is used, care should be taken to also record the usual number of hours worked per day and days per month. As these may vary from country to country this is important to enable the correct conversion of units. It should be broken down by gender and whether the persons are youth in order to distinguish between the labour inputs provided by these groups. This indicator is easily aggregated over reporting periods by simply adding up all the hours or days worked in each reporting period. This indicator forms the basis for calculating Full Time Equivalents (FTEs) which is discussed in more detail below. This indicator should be used for regular progress reporting.
3.Wages paid (broken down by gender, youth)*
Total amount of wages paid in local currency for all labour input provided over the reporting period.
The total wages paid should correspond to labour inputs reported in indicator 2 above. Wages should be based on gross salaries, and social security and insurance contributions should also be included. Salary information is often more difficult to obtain because of privacy concerns. However efforts should be made to also break down the salaries by gender and youth. This indicator is easily aggregated over reporting periods by simply adding up all the salaries in each reporting period. This indicator should be used for regular progress reporting.
4.Project expenditure*
Total expenditure on the project in local currency over the reporting period.
This should be the total cost of the capital investments, including salaries on the project over the reporting period in local currency. Non site related overheads such as HQ staff should not be included. This indicator is easily aggregated over reporting periods by simply adding up all expenditure in each reporting period.
UNIT 2. Monitoring and reporting of the direct employment effects of infrastructure investments 17
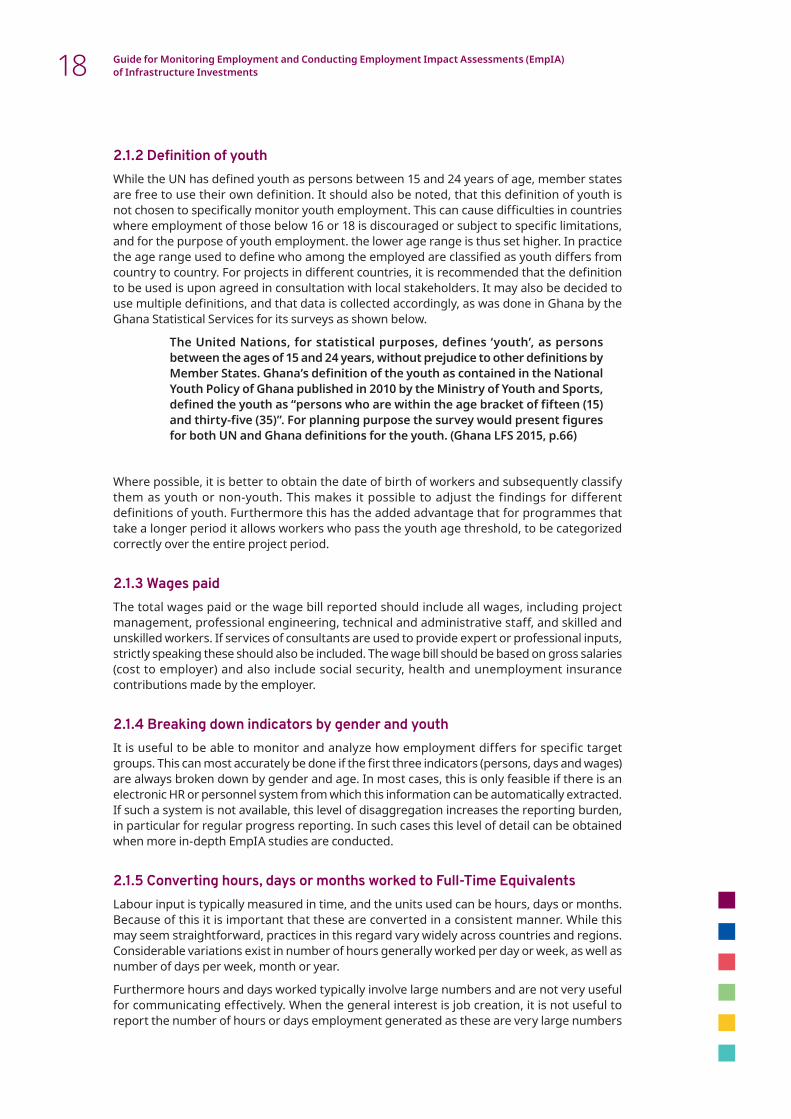
2.1.2 Definition of youthWhile the UN has defined youth as persons between 15 and 24 years of age, member states are free to use their own definition. It should also be noted, that this definition of youth is not chosen to specifically monitor youth employment. This can cause difficulties in countries where employment of those below 16 or 18 is discouraged or subject to specific limitations, and for the purpose of youth employment. the lower age range is thus set higher. In practice the age range used to define who among the employed are classified as youth differs from country to country. For projects in different countries, it is recommended that the definition to be used is upon agreed in consultation with local stakeholders. It may also be decided to use multiple definitions, and that data is collected accordingly, as was done in Ghana by the Ghana Statistical Services for its surveys as shown below.
The United Nations, for statistical purposes, defines ‘youth’, as persons between the ages of 15 and 24 years, without prejudice to other definitions by Member States. Ghana’s definition of the youth as contained in the National Youth Policy of Ghana published in 2010 by the Ministry of Youth and Sports, defined the youth as “persons who are within the age bracket of fifteen (15) and thirty-five (35)”. For planning purpose the survey would present figures for both UN and Ghana definitions for the youth. (Ghana LFS 2015, p.66)
Where possible, it is better to obtain the date of birth of workers and subsequently classify them as youth or non-youth. This makes it possible to adjust the findings for different definitions of youth. Furthermore this has the added advantage that for programmes that take a longer period it allows workers who pass the youth age threshold, to be categorized correctly over the entire project period.
2.1.3 Wages paidThe total wages paid or the wage bill reported should include all wages, including project management, professional engineering, technical and administrative staff, and skilled and unskilled workers. If services of consultants are used to provide expert or professional inputs, strictly speaking these should also be included. The wage bill should be based on gross salaries (cost to employer) and also include social security, health and unemployment insurance contributions made by the employer.
2.1.4 Breaking down indicators by gender and youthIt is useful to be able to monitor and analyze how employment differs for specific target groups. This can most accurately be done if the first three indicators (persons, days and wages) are always broken down by gender and age. In most cases, this is only feasible if there is an electronic HR or personnel system from which this information can be automatically extracted. If such a system is not available, this level of disaggregation increases the reporting burden, in particular for regular progress reporting. In such cases this level of detail can be obtained when more in-depth EmpIA studies are conducted.
2.1.5 Converting hours, days or months worked to Full-Time EquivalentsLabour input is typically measured in time, and the units used can be hours, days or months. Because of this it is important that these are converted in a consistent manner. While this may seem straightforward, practices in this regard vary widely across countries and regions. Considerable variations exist in number of hours generally worked per day or week, as well as number of days per week, month or year.
Furthermore hours and days worked typically involve large numbers and are not very useful for communicating effectively. When the general interest is job creation, it is not useful to report the number of hours or days employment generated as these are very large numbers
18 Guide for Monitoring Employment and Conducting Employment Impact Assessments (EmpIA) of Infrastructure Investments

and people find this hard to relate to job creation. For this reason hours or days worked are usually converted to Full-Time Equivalents (FTEs). A FTE is the number of hours or days worked in a year on what is considered a full time job. It is a useful measure as it is the time based unit closest to a “job”. Over the period of a year it is the equivalent amount of time worked as a person in a full time job. However, because it is sometimes equated to a job, there is scope for confusion, and the term is sometimes interpreted or used inconsistently. The definition adopted by the UN is:
Full-time equivalent employment7: Full-time equivalent employment is the number of full-time equivalent jobs, defined as total hours actually worked by all employed persons divided by the average number of hours actually worked in full-time jobs.
The essential feature of calculating the FTEs is that is based on the total hours (or days) worked. The number of persons (or posts, positions or work opportunities) does not feature in the calculation. The other part of the calculation is the average number of hours (or days) worked in full-time jobs.
However, the typical or average number of hours or days worked in a year by those in full-time employment varies from country to country. (And even within counties is may vary from sector to sector). To convert this to FTEs requires knowledge of the total number of hours worked in a full-time job per year in the country or region under consideration. It is important therefore that the most appropriate figure or definition is determined in consultation with local stakeholders.
From ILO experience it was found that figures range between 7 and 8 hours of work per day and 220 to 300 working days per year8. Table 2.2 provides an overview of the range of how many hours or days worked could be considered the equivalent of one FTE. As shown, the absence of a universal definition or convention can lead to very large differences in the total number of FTEs calculated. It is therefore critical that the definition of a FTE used, as well as any assumptions are made explicit so that proper adjustments and conversions can be done when comparisons are made.
Table 2.2 Converting hours and days worked to FTEs
Hours per day Working days per year Hours per year (FTE)
Upper bound 8 300 2400
7 300 2100
Middle range 8 250 2000
8 225 1800
Lower bound 7 250 1750
7 220 1540
Once the definition of a FTE is agreed upon, it can be used to convert the hours or days worked into FTEs and used for reporting purposes. So for example if it is decided that FTE is equivalent to 220 days worked per year, a project that created 220,000 days of work would
7 System of National Accounts 2008, paragraph 19.43, EC, UN, IMF, WB and OECD 8 For example, in some studies it is assumed that there are 25 working days in a month, and based on this, a full time equivalent for 12 months would yield 300 working days per year. In many countries an average of 25 days worked per month is quite high however as there are usually months where the number of days worked is lower. Other has used much lower estimates like 2000 hours per year or 225 days at 8 hours= 1800 hours
UNIT 2. Monitoring and reporting of the direct employment effects of infrastructure investments 19

create 220,000 / 220 = 1,000 FTEs of employment or 1,000 “FTE Jobs”. However if 300 was decided upon, this same project would report to have created 220,000 / 300 = 733 FTEs. Once this conversion is agreed upon, everywhere where hours or days worked are used above, FTEs can be used instead.
For monitoring employment on infrastructure projects in developing countries, it is not recommended that hours worked are used as this is cumbersome to track in practice. Rather it is proposed that the time unit that is the basis for wage payments is used which is typically either days, weeks or months as this makes tracking time worked and wages paid consistent and easily convertible.
2.1.6 Currency used for reportingTypically projects costs and wages are paid in local currency and so reporting can easily be done using these. However, for international comparisons, it is common to convert the local currency to United States Dollars (USD). As the USD is also the main currency used by the ILO, most of the data here is presented in USD. For final reports, it is recommended that figures are converted and reported in USD and that the exchange rate used is clearly indicated.
20 Guide for Monitoring Employment and Conducting Employment Impact Assessments (EmpIA) of Infrastructure Investments
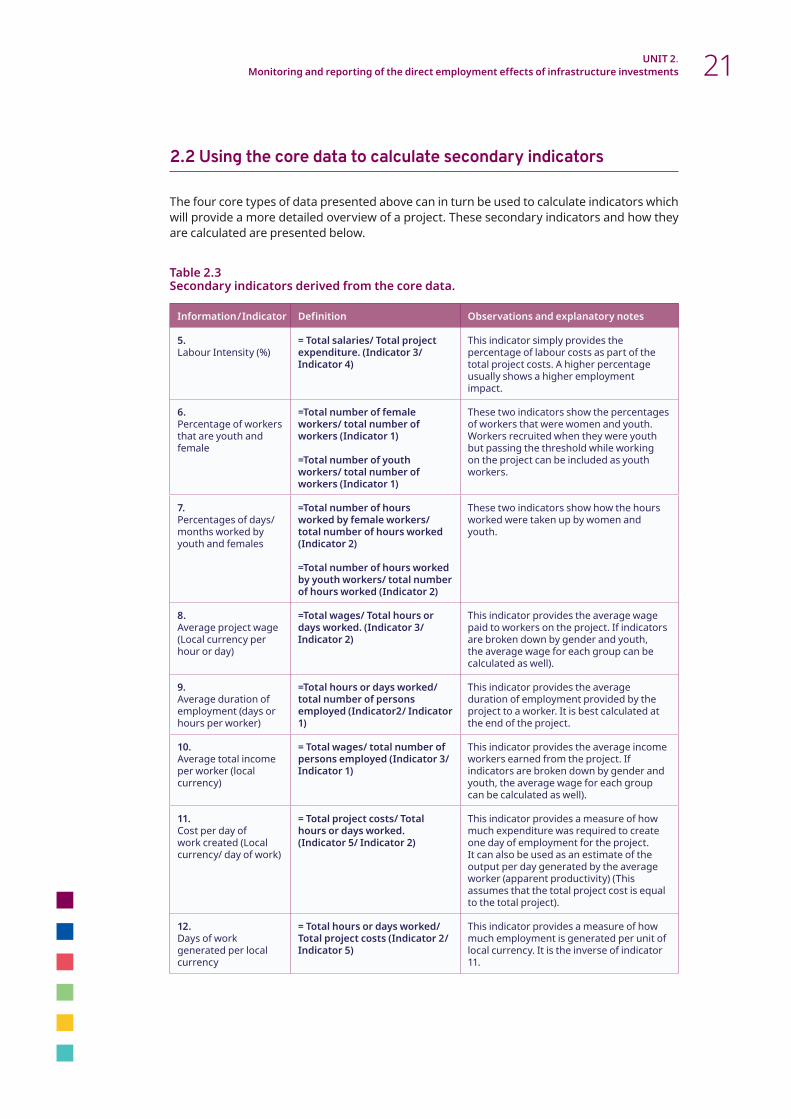
2.2 Using the core data to calculate secondary indicators
The four core types of data presented above can in turn be used to calculate indicators which will provide a more detailed overview of a project. These secondary indicators and how they are calculated are presented below.
Table 2.3 Secondary indicators derived from the core data.
Information / Indicator Definition Observations and explanatory notes
5.Labour Intensity (%)
= Total salaries/ Total project expenditure. (Indicator 3/Indicator 4)
This indicator simply provides the percentage of labour costs as part of the total project costs. A higher percentage usually shows a higher employment impact.
6.Percentage of workers that are youth and female
=Total number of female workers/ total number of workers (Indicator 1)
=Total number of youth workers/ total number of workers (Indicator 1)
These two indicators show the percentages of workers that were women and youth. Workers recruited when they were youth but passing the threshold while working on the project can be included as youth workers.
7.Percentages of days/months worked by youth and females
=Total number of hours worked by female workers/ total number of hours worked (Indicator 2)
=Total number of hours worked by youth workers/ total number of hours worked (Indicator 2)
These two indicators show how the hours worked were taken up by women and youth.
8.Average project wage (Local currency per hour or day)
=Total wages/ Total hours or days worked. (Indicator 3/ Indicator 2)
This indicator provides the average wage paid to workers on the project. If indicators are broken down by gender and youth, the average wage for each group can be calculated as well).
9.Average duration of employment (days or hours per worker)
=Total hours or days worked/ total number of persons employed (Indicator2/ Indicator 1)
This indicator provides the average duration of employment provided by the project to a worker. It is best calculated at the end of the project.
10.Average total income per worker (local currency)
= Total wages/ total number of persons employed (Indicator 3/ Indicator 1)
This indicator provides the average income workers earned from the project. If indicators are broken down by gender and youth, the average wage for each group can be calculated as well).
11.Cost per day of work created (Local currency/ day of work)
= Total project costs/ Total hours or days worked. (Indicator 5/ Indicator 2)
This indicator provides a measure of how much expenditure was required to create one day of employment for the project. It can also be used as an estimate of the output per day generated by the average worker (apparent productivity) (This assumes that the total project cost is equal to the total project).
12.Days of work generated per local currency
= Total hours or days worked/ Total project costs (Indicator 2/ Indicator 5)
This indicator provides a measure of how much employment is generated per unit of local currency. It is the inverse of indicator 11.
UNIT 2. Monitoring and reporting of the direct employment effects of infrastructure investments 21
2.3 Regular progress reporting
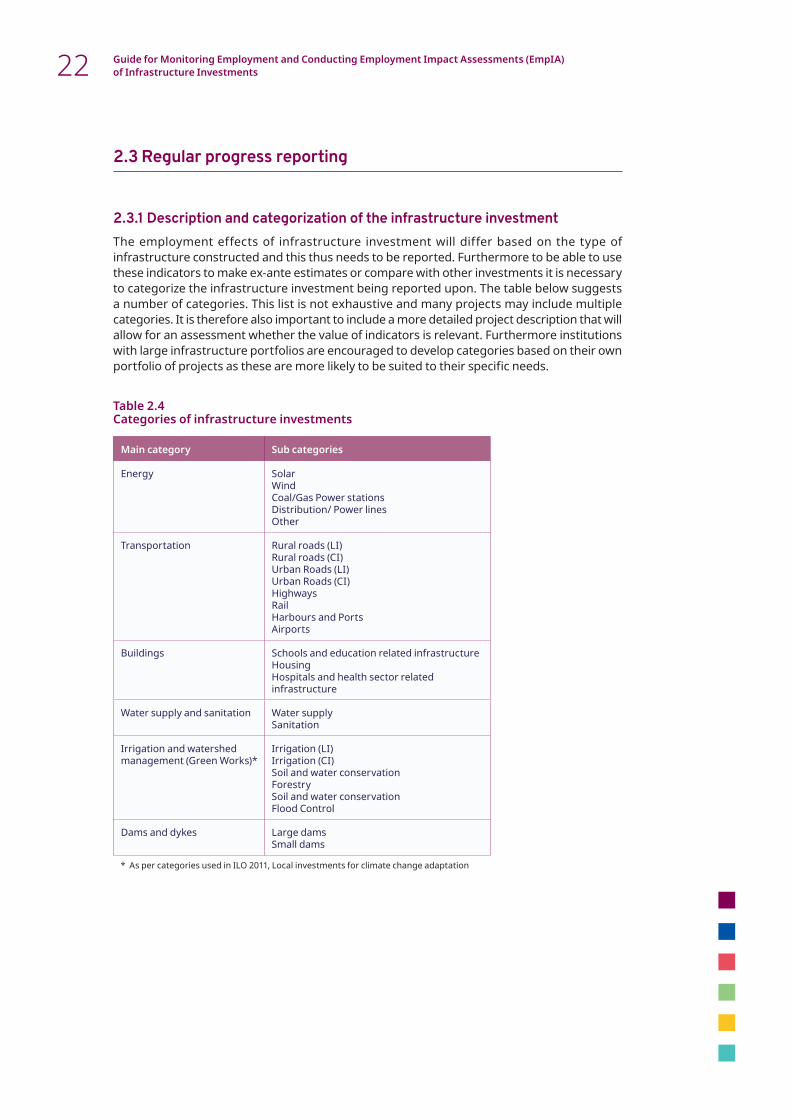
2.3.1 Description and categorization of the infrastructure investmentThe employment effects of infrastructure investment will differ based on the type of infrastructure constructed and this thus needs to be reported. Furthermore to be able to use these indicators to make ex-ante estimates or compare with other investments it is necessary to categorize the infrastructure investment being reported upon. The table below suggests a number of categories. This list is not exhaustive and many projects may include multiple categories. It is therefore also important to include a more detailed project description that will allow for an assessment whether the value of indicators is relevant. Furthermore institutions with large infrastructure portfolios are encouraged to develop categories based on their own portfolio of projects as these are more likely to be suited to their specific needs.
Table 2.4 Categories of infrastructure investments
Main category Sub categories
Energy SolarWindCoal/Gas Power stationsDistribution/ Power linesOther
Transportation Rural roads (LI)Rural roads (CI)Urban Roads (LI)Urban Roads (CI)HighwaysRailHarbours and PortsAirports
Buildings Schools and education related infrastructureHousingHospitals and health sector related infrastructure
Water supply and sanitation Water supplySanitation
Irrigation and watershed management (Green Works)*
Irrigation (LI)Irrigation (CI)Soil and water conservationForestrySoil and water conservationFlood Control
Dams and dykes Large damsSmall dams
* As per categories used in ILO 2011, Local investments for climate change adaptation
22 Guide for Monitoring Employment and Conducting Employment Impact Assessments (EmpIA) of Infrastructure Investments
2.3.2 Regular progress reporting during implementationOnce the implementation of a programme or project starts, it is recommended that regular progress reports include figures on employment created to date. For programmes, the regular progress reports would be compiled by aggregating progress from the individual projects in the programme. The Expanded Public Works Programme (EPWP) in South Africa provides an example of such progress reporting, where the national programme reports quarterly on employment created on thousands of individual projects9.
Project finance, administration and HR staff usually keep records of all this data as they need it to make the correct wage payments to workers and the most effective approach for employment reporting is to work closely with this staff to obtain these figures as required.
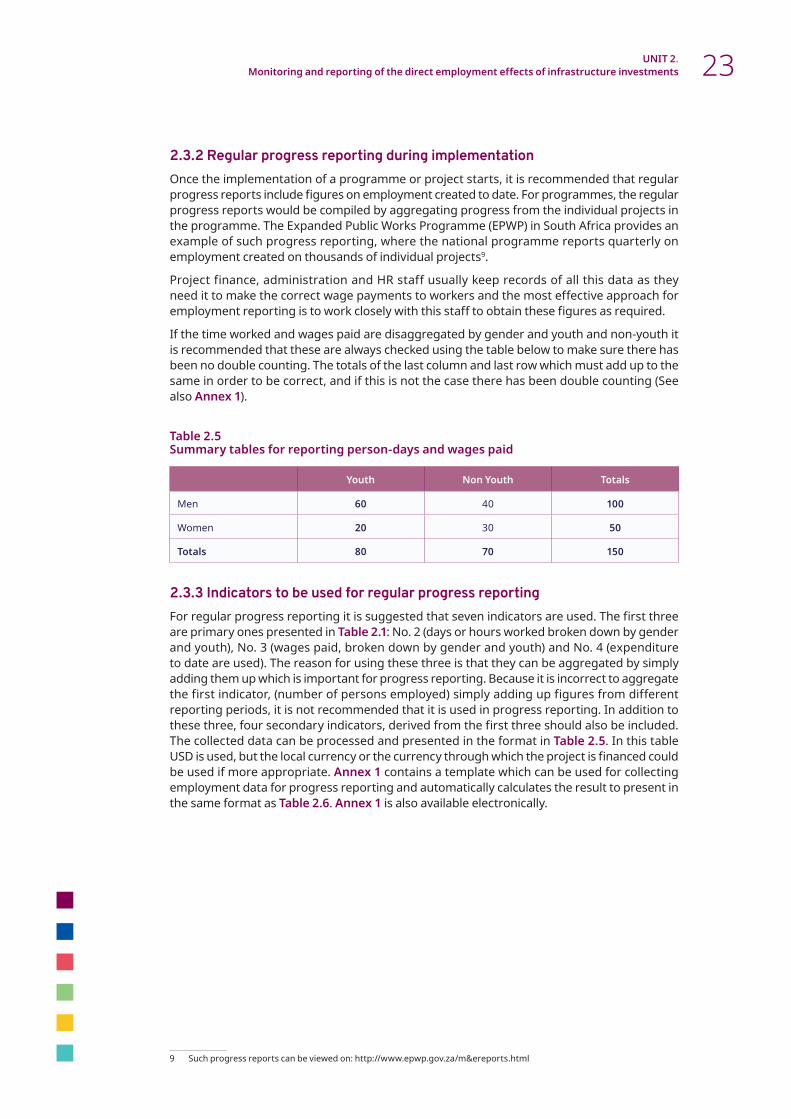
If the time worked and wages paid are disaggregated by gender and youth and non-youth it is recommended that these are always checked using the table below to make sure there has been no double counting. The totals of the last column and last row which must add up to the same in order to be correct, and if this is not the case there has been double counting (See also Annex 1).
Table 2.5 Summary tables for reporting person-days and wages paid
Youth Non Youth Totals
Men 60 40 100
Women 20 30 50
Totals 80 70 150
2.3.3 Indicators to be used for regular progress reportingFor regular progress reporting it is suggested that seven indicators are used. The first three are primary ones presented in Table 2.1: No. 2 (days or hours worked broken down by gender and youth), No. 3 (wages paid, broken down by gender and youth) and No. 4 (expenditure to date are used). The reason for using these three is that they can be aggregated by simply adding them up which is important for progress reporting. Because it is incorrect to aggregate the first indicator, (number of persons employed) simply adding up figures from different reporting periods, it is not recommended that it is used in progress reporting. In addition to these three, four secondary indicators, derived from the first three should also be included. The collected data can be processed and presented in the format in Table 2.5. In this table USD is used, but the local currency or the currency through which the project is financed could be used if more appropriate. Annex 1 contains a template which can be used for collecting employment data for progress reporting and automatically calculates the result to present in the same format as Table 2.6. Annex 1 is also available electronically.
9 Such progress reports can be viewed on: http://www.epwp.gov.za/m&ereports.html
UNIT 2. Monitoring and reporting of the direct employment effects of infrastructure investments 23

Table 2.6 Sample of employment results for a regular Progress report
Reporting Period: 1 Oct 2019 to 31 Dec 2019Note: Report is cumulative reflecting figures from start of the project on 1 June 2018.
Indicator Value
1.Employment generated (days)
Total% to female
% to youth
45001200 / 4500 = 27%2500 / 4500 = 56%
2.Wages paid (USD)
Total% to female
% to youth
90,00020,000 / 90,000 = 22%35,000 / 90,000 = 39%
3.Project expenditure (USD)
290,000
4.Labour intensity (To date), %
90,000 / 290,000= 31%
5.Average project wage (To date)
GlobalAverage for women
Average for menAverage for youth
Average for non-youth
90,000 / 4500 = 20.00 / day20,000 / 1200 = 16.67 / day70,000 / 3300 = 21.21 / day35,000 / 2500 = 14.00 / day 55,000 / 2000 = 27.50 / day
6.Cost per day of work created (USD / day)
290,000 / 4500 = USD 64 / day
7.Days of work generated per million (Days / USD million)
= 4500 / 0.290 = 15,517 days / USD million
One issue is to be decided upon is whether the reporting should be cumulative or just cover for the reporting period. Given that the figures for reporting periods can simply be added up to produce cumulative reports, either option can be chosen. For management and accountability purposes, cumulative reports, reflecting progress from the start of the project are usually more useful and these are recommended.
2.3.4 Extracting progress reports from electronic HR systems or Management Information Systems
With the increased use of electronic HR management and payment systems, as well as of mobile based attendance systems and muster roles, the ability to report accurately on employment is potentially much better. These electronic systems make it is possible to report on days worked and wages paid per individual worker. Furthermore it is also possible to report on the characteristics of each worker such as gender and age. Such individual reports can easily be aggregated into a summary report on employment.
This will require however that the relevant project HR is set up to generate these reports. Where this is applicable, it is recommended that at the beginning of the project, the staff responsible for reporting works with HR so that the system is set up to generate these more detailed reports. To avoid privacy concerns, it is recommended that the data is made anonymous (i.e that names are omitted or stripped from the data set).
If such systems are in place, it becomes possible to also include the first primary indicator, number of persons employed. A critical requirement here however is that each employee is allocated a unique employee number or code, as this will allow monthly reports to be correctly aggregated and numbers or increased or reduced numbers of persons employed to be traced. Without such a code it will not be possible to report on the number of persons as only the days worked can be aggregated.
24 Guide for Monitoring Employment and Conducting Employment Impact Assessments (EmpIA) of Infrastructure Investments

2.4 Capturing Direct Employment impacts in Project Completion Reports
2.4.1 Reporting on final employment resultsAt the end of each project, a Project Completion Report should be compiled by the project manager. The project completion report should contain a section on the employment outcomes with results using the indicators presented in Tables 2.1 and 2.3. An example of such an employment section of the project completion report is presented below. These should be based on the final expenditure and employment figures and should also include the total number of person who have worked on the project. It is also recommended that for the final report the days worked are converted into FTEs and local currencies in to USD. However the definition of FTE and the exchange rate used should be clearly indicated. If employment targets were set at the beginning of the project these should also be included in the report. A suggested format for the employment part of such a report is presented in Table 2.7. A template for collecting and presenting this data is presented in Annex 2 and also available electronically.
Table 2.7 Sample of employment related results for a completion report
Indicator Value
1.Employment generated (FTE)
Total% to male
% to female% to youth
% to non-youth(1FTE= 230 days)
50,000 days = 217 FTE35,000 days = 152 FTE: 70%15,000 days = 65 FTE: 30%25,000 days = 109 FTE: 50%25,000 days = 109 FTE: 50%
2.Number of persons employed
Total% to male
% to female% to youth
% to non-youth
420280/420 = 67%140/420 = 33%250/420 = 60%170/420 = 40%
3.Wages paid (USD)
Total% to male
% to female% to youth
% to non-youth
1,243,000887,000/1,243,000 = 71%356,000/1,243,000 = 29%510,000/1,243,000 = 41%733,000/1,243,000 = 59%
4.Project expenditure (FINAL) (USD)
3,650,000
5.Labour intensity (FINAL), %
1,243,000/3,650,000 = 34%
6.Average project wage (FINAL)
GlobalAverage for men
Average for womenAverage for youth
Average for non-youth
1,243,000/50,000 = 24.86/ day887,000/35,000 = 25.34/ day356,000/15,000 = 23.73/ day510,000/25,000 = 20.40/day733,000/25,000 = 29.32/day
7.Average duration of employment
GlobalAverage for men
Average for womenAverage for youth
Average for non-youth
50,000/420 = 11935,000/280 = 12515,000/140 = 10725,000/250 = 10025,000/170 = 147
UNIT 2. Monitoring and reporting of the direct employment effects of infrastructure investments 25

Indicator Value
8.Average income per worker
GlobalAverage for men
Average for womenAverage for youth
Average for non-youth
1,243,000/420 = 2,959887,000/280 = 3,168356,000/140 = 2,542510,000/250 = 2,040733,000/25,000 = 4,312
9.Cost per FTE created (USD / FTE)
Cost per FTE created (USD/ FTE) 3,650,000/217 = USD 16,820
10.FTEs generated per million (FTE / USD million)
= 217/ 3.65= 59.5 FTE/ USD million
The four core indicators and additional seven derived indicators already provide a good insight into the employment generated from an investment. If this is done for all projects, this can also be aggregated, typically into a MIS, to provide data for a programme (for example a social housing programme consisting of many projects). Over time, institutions can build up a database of these indicators, and these can be used for doing better ex-ante estimations. Annex 4 contains a list of values for some of these indicators for projects in different parts of the world.
2.4.2 Reflections on the employment outcomesIn the completion report the project manager may also reflect on the employment outcomes of the project. If the project had employment targets, the first part of the reflection should compare these targets to the actual outcomes and if there are large discrepancies, these should be explained.
The second part of the reflection should address whether the four mechanisms identified in the TOC in Unit 1 were used effectively in the project. Four questions to guide this reflection are suggested:
X 1. Could procurement have been used more effectively?
X 2. Could LI methods have been used more widely?
X 3. Could local content requirements have been used or enforced more strictly?
X 4. Could requirements on labour standards have been included or enforced more strictly?
26 Guide for Monitoring Employment and Conducting Employment Impact Assessments (EmpIA) of Infrastructure Investments

2.5 Ex-ante estimations and employment targets
Ex-ante estimations are not strictly part of the general monitoring, as they are done before the project starts. However ex-ante estimates of the direct employment effects usually form the basis for any agreed upon targets for direct employment creation. Where such a target is set, it may be required that as part of the monitoring, the intervention reports on progress against these targets. It is therefore important to understand how ex-ante estimates are done and targets are set, so that reporting against the targets can be done in a consistent manner.
Estimates of the direct employment impact of infrastructure investments are generally done based on past experience with similar projects or activities. The main difference is the level of detail of the assessment.
The most detailed estimates can be done during the design and contract preparation phase of a project, as part of the preparation of the Bill of Quantities (BOQ). In order to prepare the BOQ the various types of labour inputs for all the various activities of the project are typically quantified to arrive at the scope of work and cost estimate. The anticipated employment effect can be quite accurately estimated as part of this process. For example, if one part of the BOQ is the excavation of 9,000 m3 of soil for trenches, and it is known that under conditions similar to the project a worker is capable of excavating 1.5 m3, then it can be estimated that (9000 m3) / (1.5 m3 / day) = 6,000 days of work will be created through this activity. Such employment estimations are not always done however as it may not be included as part of the responsibility of those preparing the BOQ. Where feasible it is recommended that such an estimate is included in their contract or Terms of Reference (TOR). A similar method can be also be used at a less detailed level. For example, if from past experience it is known that approximately 50 FTE of employment are generated through the construction of 1 km of rural road. Then for a programme of constructing 90 km of rural road the anticipated employment effect would be 50 FTE / km x 90 km = 4500 FTEs of employment.
Another way to estimate the direct employment is to use the budget estimate of the project and the most relevant figure of FTEs per million USD (or local currency) available. The project budget is then simply multiplied by this figure to arrive at an estimate of FTEs that will be created by the intervention. If the project from which this figure is derived is similar to the intervention to be undertaken, the estimate is likely to be reasonably accurate. (For example if both are for irrigation related activities in the same country). Annex 4a provides some figures from past projects that can be used for such assessments. It is advocated however that institutions establish a practice of collecting their own project employment data so as to make more accurate ex-ante estimations. In most circumstances and ex-ante estimation of Indicator 2: total workdays (or FTEs) estimated is sufficient. If data on the other indicators such as past youth participation are available, these can also be used to set targets, in particular if it is an objective to improve on the rate of participation of youth.
A third approach, which is used when there is no project or programme level data available is to use national level data, in this case the national construction sector employment-output ratio. This approach uses the same data to what is used in Input-Output based estimates (See Unit 4). It essentially entails taking dividing the total employment in the construction sector for a given year (in FTEs converted from hours worked) and dividing it by total output of the sector in the same year (in USD millions) to arrive at a figure of FTEs/ million for the sector as a whole. This figure can then be used together with the project budget to make a rough estimate of the direct employment effects. However as this will be based on the national average for the construction sector as a whole, it may be substantially different from a figure that is based on a specific set of activities such as construction of social housing or rehabilitation of rural roads.
Regardless of how the ex-ante estimates that inform employment targets are done, the method and figures used should be clearly explained so that it clear where these targets come from and any discrepancies for actual employment generated at the end of the project can be understood and explained.
UNIT 2. Monitoring and reporting of the direct employment effects of infrastructure investments 27

Construction workers having work meeting

UNIT 3
In depth EmpIA studies on direct employment effects
29

3.1 Defining the scope
Policymakers, investors, donors and other stakeholders may be interested in a more in-depth understanding of the direct employment effects of a project and whether these could have been improved. The progress or completion reports in Unit 2 may not be sufficient for providing such insights. They may be interested in more detail on for example wage levels, as well as qualitative dimensions of employment such as the types of skills used on the project, the safety of workers and their involvement in accidents, levels of informality or whether project staff had access to social security. A particular interest may be how the quality of employment generated through the investment compares with that in the construction sector or the rest of the economy. These questions can be assessed through a more in-depth assessment or what we refer to as an Employment Impact Assessment (EmpIA). Such an in-depth assessment of the direct effects can also be combined with assessing the indirect and induced effects. It can be done while the project is active, or at the end of the project. This Unit provides guidance conducting such an EmpIA of the direct employment. The main aims are to ensure that such an assessment provides reliable results, but is also cost effective and delivers results which are consistent and comparable with assessments of other projects.
The scope of an EmpIA will vary, depending on interest and available budgets. It may be the case that there has not been any regular employment reporting so far, or that it was done using only very few indicators. This section will present the approach and methods, which are useful for developing a Terms of Reference for such an EmpIA. The idea is to assist project stakeholders to identify what types of questions and topics can be covered in such a study. Such studies could be done in house by relevant M&E staff but would most likely be done externally through a consultant.
Typical questions that an EmpIA of direct effects would be expected to answer are:
X How many jobs have been created? This question captures the quantitative dimension of employment and should analyze the number of people employed, person-days or FTEs of employment created and the duration of the jobs. If regular progress reporting is in place, these figures can generally be obtained from these reports.
X What kinds of jobs have been created? This question captures the qualitative dimensions of employment and should consider indicators such as contract type, skill levels, occupation types, wage levels, formality, occupational health and safety, access to social security and whether jobs were full-time or part-time.
X Who was able to take up these jobs? This question captures the accessibility and inclusivity dimensions of employment and looks at whether youth, women and people with disability, former unemployed, immigrants, indigenous groups or any other specific groups were able to access the jobs created.
X Have measures been taken to improve the employment outcomes? This question captures whether specific interventions or requirements where put in place to enhance the employment outcomes and would consider the procurement strategy, technology choice,/ use of labour intensive methods, local content requirements and requirements for minimum labour standards and working conditions.
Guide for Monitoring Employment and Conducting Employment Impact Assessments (EmpIA) of Infrastructure Investments30

Not all these questions may be of interest in every study, and the first task is to decide on the scope. This can be done by using questions such as:
X What are the employment dimensions or issues we are concerned about?
X What were the expectations with regards to employment creation and do we need to assess whether these are being met?
X Based on this, (if not yet decided) what is a suitable project or selection of projects to assess? Ideally they are representative of the investment in question. If not feasible to select a statistically representative sample, efforts need to be made to ensure that they are typical.
The question of how to select the project to be reviewed in-depth may require consideration in the preparation of the TOR. This may be obvious when there is only a single project of interest. However if a larger programme, or activity is under review, selecting the project can be more difficult. Ideally, if a large number of projects are involved (for example multiple smaller roads projects which are all part of a rural roads programme), a statistically representative sample could be considered. But this may be costly and so will depend on the available resources. In general the following should be considered when selecting project(s):
X Is the project typical of other projects in the programme- considerations here would be size, implementation approach, nature of the activity, physical conditions where project was implemented. In such a case the findings could be considered to also be relevant more widely, even if they cannot be considered to be statistically representative.
X Is the project still active, or has it been completed, and if so how long ago?
X Are the stakeholders (in particular contractors) open to collaborating on the study, in particular with regards to making project data and information available?
Finally, a project could also be considered, precisely because it is not typical but was particularly innovative, or had specific problems which if better understood could provide valuable learning for how to improve in future.
At this stage it is also important to decide if there will also be a macroeconomic analysis as part of the EmpIA to assess the indirect and induced effects. If this is the case, the type of data to be collected as part of the project/ programme level studies should also include data on the non-labour inputs which are required for the project. The type of data and information to be collected it this case is discussed in Unit 4. The collection of this data can easily be combined with the collection of the detailed employment data and it is thus cost-effective to combine these.
3.2 Data and Indicators for more in depth assessments
3.2.1 WagesOne interest for investors may be to understand how wages on employment generated through the project compare with wages in the rest of the economy or the construction sector. In this case it is necessary to obtain and review national wage benchmarks and related data and compare wages on the project with these.
Unit 3. In depth EmpIA studies on direct employment effects 31
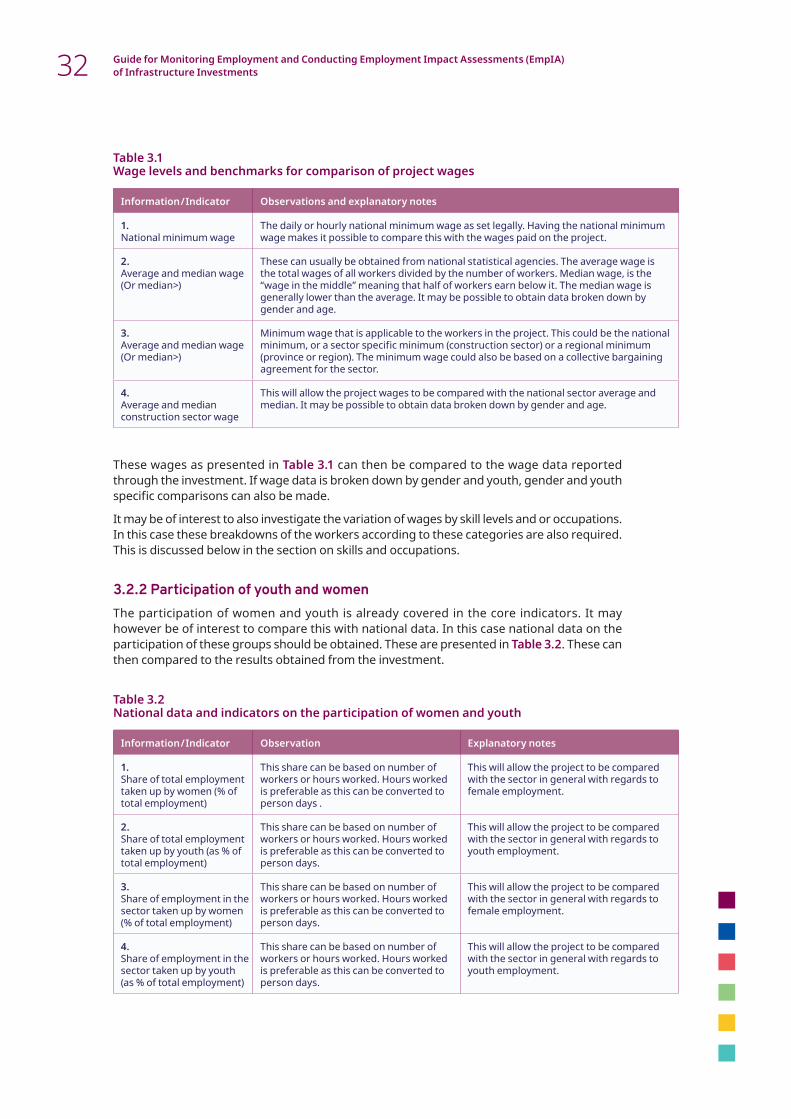
Table 3.1 Wage levels and benchmarks for comparison of project wages
Information / Indicator Observations and explanatory notes
1.National minimum wage
The daily or hourly national minimum wage as set legally. Having the national minimum wage makes it possible to compare this with the wages paid on the project.
2.Average and median wage (Or median>)
These can usually be obtained from national statistical agencies. The average wage is the total wages of all workers divided by the number of workers. Median wage, is the “wage in the middle” meaning that half of workers earn below it. The median wage is generally lower than the average. It may be possible to obtain data broken down by gender and age.
3.Average and median wage (Or median>)
Minimum wage that is applicable to the workers in the project. This could be the national minimum, or a sector specific minimum (construction sector) or a regional minimum (province or region). The minimum wage could also be based on a collective bargaining agreement for the sector.
4.Average and median construction sector wage
This will allow the project wages to be compared with the national sector average and median. It may be possible to obtain data broken down by gender and age.
These wages as presented in Table 3.1 can then be compared to the wage data reported through the investment. If wage data is broken down by gender and youth, gender and youth specific comparisons can also be made.
It may be of interest to also investigate the variation of wages by skill levels and or occupations. In this case these breakdowns of the workers according to these categories are also required. This is discussed below in the section on skills and occupations.
3.2.2 Participation of youth and women The participation of women and youth is already covered in the core indicators. It may however be of interest to compare this with national data. In this case national data on the participation of these groups should be obtained. These are presented in Table 3.2. These can then compared to the results obtained from the investment.
Table 3.2 National data and indicators on the participation of women and youth
Information / Indicator Observation Explanatory notes
1.Share of total employment taken up by women (% of total employment)
This share can be based on number of workers or hours worked. Hours worked is preferable as this can be converted to person days .
This will allow the project to be compared with the sector in general with regards to female employment.
2.Share of total employment taken up by youth (as % of total employment)
This share can be based on number of workers or hours worked. Hours worked is preferable as this can be converted to person days.
This will allow the project to be compared with the sector in general with regards to youth employment.
3.Share of employment in the sector taken up by women (% of total employment)
This share can be based on number of workers or hours worked. Hours worked is preferable as this can be converted to person days.
This will allow the project to be compared with the sector in general with regards to female employment.
4.Share of employment in the sector taken up by youth (as % of total employment)
This share can be based on number of workers or hours worked. Hours worked is preferable as this can be converted to person days.
This will allow the project to be compared with the sector in general with regards to youth employment.
Guide for Monitoring Employment and Conducting Employment Impact Assessments (EmpIA) of Infrastructure Investments32

3.2.3 Participation of persons with disabilities and other groupsAnother area of interest may be to assess whether the employment generated by the investment is taken up by target groups, other than youth and women. One example of this is persons with disabilities, but in some countries it can also include others such as ethnic groups, immigrants or refugees. The assessment can investigate this, but of paramount importance is that the groups are clearly defined before any data collection or survey takes place.
For example in the case of persons with a disability, it is important to note that the definition of what constitutes a disability may not be uniform. For consistency it is recommended that the definition used by the local Ministry of Labour or Employment is used. This is important as definitions used by Ministries of Health or Social Welfare may differ substantially from this. Similar issues may also arise with other groups of interest.
3.2.4 Occupational Safety and HealthThe performance of the infrastructure investment in terms of ensuring the occupational safety and health of workers can also be a topic of interest. This can be done through obtaining data on the number of injuries and number of fatalities suffered. Together with the core data the incidence and frequency rates can be calculated. These indicators which can be used for reporting are defined as follows:
X Incidence rate = Number of injuries (or fatalities) / number of workers
X Frequency rate = Number of injuries (or fatalities) / number of days worked
These can again be compared with national figures as these same indicators are usually also used at the national level. Again care should be taken to ensure that the definition of injury used in national data collection is the same as used on the projects.
3.2.5 Type of contractThe type of employment contract is also an indicator of the quality of employment. The exact nature of the contract used varies considerably from country to county and so it is hard to provide definite categories. However for consistency, and taking into account the characteristics of the construction sector, it is suggested that the main contract types along which workers should be categorized are:
X 1. Permanent contracts
X 2. Temporary contracts
X 3. Casual workers (Very short term) (With contract)
X 4. Casual workers (Very short term) (Without contract)
More detailed descriptions of these contracts are presented in Table 3.3 and the data to be collected is the type of contract each of the workers on the project is or was employed under.
Table 3.3 Contract types
Contract type indicator Observations and explanatory notes
Permanent contracts These are permanent or long-term contracts that extend beyond the project in question.
Temporary of fixed-term contracts
These are temporary contracts typically linked to the project in questions. They have an end date and are usually shorter or for the same duration as the project.
Casual workers (Very short term) (With written contract)
These are very short-term (daily or weekly) contracts. They can be renewed multiple times, but are usually linked to specific tasks or activities within the project.
Casual workers (Very short term) (Without written contract)
These workers do not have a written contract and are usually employed on a daily or weekly basis or specific small tasks.
Unit 3. In depth EmpIA studies on direct employment effects 33
3.2.6 Skills levels, educational attainment and occupationsThe skills levels of workers can also be obtained through records from the personnel or Human Resources departments, on site interviews and possibly a survey. Education levels are often used to categorize workers according to their skill levels, as this is usually the easiest to ascertain. The drawback of this is that in particular in the construction sector, workers may have gained skills from their work experience, but without having obtained formal qualifications. Four indicators can be used to categorize workers by skill and occupation. These are:
X Skill levels: as used on the project by the contractors, a typical hierarchy is: low-skilled (unskilled) workers (manual labour), semi-skilled workers, skilled labour (artisans), administrative staff (book keepers, clerks, secretaries) technical staff (technicians, junior engineers, accountants, surveyors), and professional staff (engineers, managers, quantity surveyors)
X Educational attainment for example by ISCED levels: (1) ISCED levels 0-2: less than primary, primary and lower secondary; (2) ISCED levels 3-4: upper secondary and post-secondary non-tertiary education, and (3) ISCED 5-8: tertiary education;
X Job categories (project management and engineering, technicians, artisans, manual labour workers, other workers, administrative);
X Wages paid for different categories of workers, for example workers could be categorized in terms of different salary ranges. One approach to determining the ranges is to set them based on the minimum wage or lowest wage paid on the project.
In order to make these categories comparable with national statistics, it is recommended that as much as possible categories used by national statistical agencies to conduct labour force, establishment and household surveys are used.
3.2.7 Access to Social Security and Social ProtectionThe extent to which workers have access to social security is an important indicator of the quality of employment. Through the personnel or HR Department, it is relatively easy to assess what share of workers have entitlements to social security and other benefits. Typically an EmpIA will assess what number or share of workers have:
X Entitlements to paid leave (Holidays, Sickness, Maternity)
X Access to Health Insurance (partially of fully paid for by the employer)
X Access to Social Security (Employer pension contributions and participation in Unemployment Insurance)
X Accident insurance coverage
The percentages of the persons employed who have access to these benefits should be reported.
3.2.8 Compliance with the four ILO fundamental principlesThe ILO has adopted four fundamental principles and rights in four categories:
X Freedom of association and the effective recognition of the right to collective bargaining;
X Elimination of forced or compulsory labour;
X Abolition of child labour and
X Elimination of discrimination in respect of employment and occupation.
Guide for Monitoring Employment and Conducting Employment Impact Assessments (EmpIA) of Infrastructure Investments34
An EmpIA should also aim to assess whether these are being adhered to. The right to freedom of association can be assessed by whether workers are members of unions and are free to organize if they so wish. This question can be included in surveys or interviews of workers. With regards to collective bargaining, in the wage section it was already recommended that it is assessed whether there are wages determined through collective bargaining in the sector and if these apply to the investment. The wages paid in the project can also be compared with the collective bargaining wages.
Assessing that there is no compulsory, forced or child labour can usually be done through site visits and interviews with stakeholders and workers.
The elimination of discrimination is often harder to assess. A general concern in the sector is the discrimination against women, but depending on the local context, concerns about discrimination may also involve minorities, racial groups, indigenous persons, immigrants, and LGBT persons. Assessing this requires knowledge of the local context as well as its sensitivities. The main approach to assessing this is to review whether specific workplace policies to address discrimination are in place, the extent to which there are being enforced and the extent to which these specific groups have actually obtained employment on the project on the same terms as other groups. In the EmpIA report a qualitative assessment of the extent to which these fundamental principles are adhered to should be included.
3.2.9 Informal employmentInformal work is highly prevalent in the construction sector, especially in developing countries. As reducing informality is a common policy goal, insights on the extent to which a project is generating formal or informal employment and is supporting a transition to formality would be of interest. Measuring informal employment is complex and closely linked to the quality of employment. The indicators related to the quality of employment presented are also all indicators of whether employment can be considered informal10. It should therefore be assessed within this broader context and recognizing that the quality of employment may vary considerably, even if both are considered informal.
The exact definition of an informal worker varies widely however and it is thus important the national definition is found. Usually, this definition is based on whether workers are entitled or have access to some of the rights and benefits above. Based on the local definition, the type of data collected for the study could be adapted so that employment on the projects can be categorized as formal or informal employment and these percentages can be reported. This can also be compared with national data on the share of employment that is informal. An example is provided below.
Example: Definition of an informal worker in Ghana11
Informal employment is defined as employment in an establishment where workers are not entitled to paid holidays or leave, sick or maternity leave and where there is no verbal or written contract at the time a person started to work. Any one the three conditions has to be fulfilled in order for a person to be classified as working in informal employment.
Based on this definition, all those entitled to sick leave, holiday leave and maternity leave AND were provided with a contract would be classified as formal workers. The rest would be classified as informal workers. In the case of the Social Housing project in Ghana12, none of the casual workers had leave entitlement and were thus all considered informal workers. However all permanent workers met these requirements and could be considered formal.
The assessment should provide an estimate of the share of persons employed who could be considered informal workers. In addition, it should also provide an assessment of any
10 See ILO 2013, Section 2: Measurement of the Informal Economy11 GSS 201612 Abbadi et. Al. 2019
Unit 3. In depth EmpIA studies on direct employment effects 35

X Box 1: Suggested topics and interview questions
measures that support a transition to formality and this analysis should incorporate the findings on all the qualitative indicators above.
3.3 Methodology: Interviews, site visits, document reviews and surveys
Information and data for an EmpIA can be collected through a combination of interviews, document reviews and surveys. Key Informant Interviews (KII) are usually conducted with various parties involved in the project. These include clients such as ministries and funding agencies, resident engineers or client representatives who oversee the project implementation, and contractors and the staff responsible for executing the works. These interviews are useful for getting an overall understanding of the project and gaining insights into the local context. The interviews should include open questions that aim to build a better understanding of a broader set of sector and employment related issues. These questions are also useful for assessing to what extent the different mechanisms for enhancing employment outcomes were used effectively. Samples of questions are provided in Box 1.
Procurement strategy: Is the procurement strategy allowing for or encouraging the use of local firms? Or small or medium enterprises? Does it include provisions for recruiting local labour?
Choice of technology: Does the project require the use of labour intensive methods? Were some materials or construction technologies specifically chosen to maximize or optimize the labour content?Local content: Were any requirements for the purchasing local (community or national) in place. Where options existing, were locally produced materials chose over those imported) or to be transported from far?Skills: Is it easy or difficult to find workers with the right skills and levels of experience? Did the contractor have to put in place specific measures to address this– on the job training, assigning more experienced workers to assist less experienced ones, additional supervision?Quality and productivity: related to the question of skills, did managers have problems meeting quality requirements? Or productivity norms? Was this due to skills, or other issues? What constraints other than skills are there to improving quality and productivity?Recruitment: What kind of recruitment processes were used? Where they effective? Did they use Ministries of Labour or Public Employment Services? Were there any efforts made to ensure levels of inclusivity in terms of youth, gender, or other groups?Payment procedures and mechanisms: What was the basis for setting wages? Are workers paid based on time or tasks? How is the task system managed? Can workers earn more by doing more tasks? Are there any bonuses or extras? How often are workers paid? How- cash, bank transfers, others? Any specific challenges encountered in this regard?Occupational Safety and Health: What measures are required in the contract? Are these in place? Are there clear procedures in place in case of an accident? What is nearest first aid post or hospital? Are there first aid supplies present on-site? Are records kept on the numbers and types of accidents? Are there sanitary facilities? Are there arrangements for child-care and breastfeeding?Social security: What workers qualify / contribute to what types of social security measures (leave, health care, unemployment insurance, accident insurance, pension contributions). How is it determined who qualifies for what? Are there specific non-financial obstacles (bureaucratic, legal) that limit the extent to which social security benefits are provided?
Once the focus and types of questions have been determined, a semi-structured interview guide should be developed to be used during the meetings with the project stakeholders: contractor, sub-contractor(s), construction supervisor and project manager and clients.
Guide for Monitoring Employment and Conducting Employment Impact Assessments (EmpIA) of Infrastructure Investments36

Interviews should be recorded and transcribed, but to do this permission should be obtained beforehand13.
The interviews should also be used to explain the data collection tools, the type of data as well as definitions used. They are also helpful to discuss local definitions which may be most appropriate such as for example how to categorize skills, what are conventions in terms of hours worked per day and days per week or month, and practices with regards to contract types, social security and the use of sub-contractors. The interview should also be used to identify persons who can assist with completing the data collection tools, if the interviewee is not able to do so.
One document of particular interest is the Bill of Quantities (BOQ) and this should be obtained. Ideally it should be the BOQ which was completed by the Contractor as part of his bid and is now part of the contract. The BOQ will assist in estimating the various inputs, including labour, required for completion of the project.
3.4 Data collection
Once the indicators are decided upon, the type of data to be collected to be able to calculate the indicators need to be determined. These should then be used to develop an appropriate data collection tool, typically a spreadsheet. The spreadsheet will contain space for all the data to be collected, and will also ideally automatically calculate the values of the various indicators. A sample of such a tool is provided in Table 3.4, and is also available electronically.
13 Transcription apps for mobile phones, such as Otter automatically transcribe (English) recordings which will make the interviewing recording and transcription process a lot easier and faster.
Unit 3. In depth EmpIA studies on direct employment effects 37

Table 3.4 Sample of a typical data collection tool (available electronically)
Job category Job titleNumber of non-youth
workers
Number of youth workers
(18-35)
Total person/month
Employment type
Average Salary Benefits Min. Educational
Level Required
01: Project managers02:Engineers03: Technicians04: Skilled Labour05: Unskilled Labour06: Adminis-trative staff 07: Security guards08: Cleaners09: Other (specify the job title)
(worked until completion of construction for all workers in this job)
P: PermanentT: TemporaryC: Casual / daily
GHS/Month
SS: Social SecurityPA: Paid Annual leavePS: Paid sick leaveHI: Health insuranceTA: Transportation provided or transportation allowance ML: Maternity LeaveDC: Day care servicesCA: Child care allowanceOther: specify
01: University (Bachelor’s or above)02:HND/Diploma/post-secondary (qualifications midway between secondary and bachelor’s, such as agriculture colleges or technical (construction) certificates from poly-technics, etc)03: Secondary/Technical/ Vocational /Commercial (includes SHS, GCE O&A Level, Technical schools, etc.)04: BECE/MSLC05: No education06: Other specify
Male Female Male Female
01 Project manager 1 0 35 20 P 1,200 SS, HI, TA 05
02 Quantity surveyor
1 0 35 20 P 1,200 SS, HI, TA 05
03 Site foreman 1 0 35 20 P 800 SS, HI, TA 06
04 Carpenters, masons, electrician, painters, plumber, steel binder, wilder, tiler
34 3 30 217 T 1,750 Covered by site all risk insurance
06
04 Machine operator
3 0 25 6 T 700 Site all risk insurance
08
05 Unskilled workers
55 10 23 351 C 1,250 Site all risk insurance
05
06 Store keeper 1 0 30 20 P 600 Site all risk insurance
06
06 Driver 1 0 30 20 P 600 Site all risk insurance
06
07 Security guard 1 2 30 20 P 300 Site all risk insurance
08
Totals 98 15
Guide for Monitoring Employment and Conducting Employment Impact Assessments (EmpIA) of Infrastructure Investments38

3.5 Data analysis and expert assessments
Before completing the data analysis it is important to assess the quality of the data obtained, in particular that it is accurate, consistent and complete. It is also important to understand the granularity of the data obtained (See Box 2 on data quality for more details on the various dimensions of data quality). It is possible that employment data and information collected from different sources such as muster rolls or attendance registers, personnel and wage payment records or progress reports. In this case and it is important to check for consistency and potential double counting when combining data from these sources. Box 2 provides some guidance on assessing the quality of data obtained.
The data and findings should ideally be reviewed by someone familiar with the local construction sector to ensure that they are reasonable and credible. If there are concerns or doubts, these should be investigated further.
There are several approaches and methods to ensure and check the quality of data, and depending on the type of data different dimensions of data quality are important. For the studies related to this guide the following are deemed particularly relevant 14: Accuracy and Precision This characteristic refers to the exactness of the data. It cannot have any erroneous elements and must convey the correct message without being misleading. This accuracy and precision have a component that relates to its intended use. Without understanding how the data will be consumed, ensuring accuracy and precision could be off-target or more costly than necessary. For example, data on the dates of birth of all employees may not be available, and so it cannot be determined how many were youth. Estimations could be made, for example by surveying the current set of employees but this will not be as accurate and may not be acceptable if the main concern is youth unemployment. Reliability and Consistency: Regardless of what source collected the data or where it resides, it cannot contradict a value residing in a different source or collected by a different system. There must be checks to ensure that the data is without contradiction or unwarranted variance. For example, a common problem with employment reporting is double counting. For example an employee who switches contract may be counted twice, or a young woman may be I such a manner that she is reported as two jobs, once as a female employee and then again as a youth employee.Completeness and Comprehensiveness: Incomplete data leads to a partial view of the overall picture to be displayed. It is important to understand the complete set of requirements that constitute a comprehensive set of data to determine whether or not the requirements are being fulfilled. For example: the implications for not obtaining some data, like number of distinct employees should be understood, as it may compromise the study. This may need to be weighed against the (additional) costs of trying to obtain this information by going back to some data sources.Granularity and Uniqueness: The level of detail at which data is collected is important, because confusion and inaccurate decisions can otherwise occur. Aggregated, summarized and manipulated collections of data could offer a different meaning than the data implied at a lower level. An appropriate level of granularity must be defined to provide sufficient uniqueness and distinctive properties to become visible. For example: how detailed are wage payments, is the data obtained for each individual employee, or is what has been obtained aggregated? If it has been aggregated, is it possible to go back and verify it?
14 These dimensions and descriptions were found to be particularly useful and were adapted from https://www.blazent.com/seven-characteristics-define-quality-data/
X Box 2: Key aspects of data quality
Unit 3. In depth EmpIA studies on direct employment effects 39

3.6 Reporting of results
While there is no standard format for reporting results from a more detailed EmpIA, for consistency it is recommended that the report includes a summary of the key indicators presented in this guide. This would typically include all the indicators in Table 2.7, as well as those indicators in section 3.2 that were selected. Where data was not available, it is also recommended to indicate this clearly as this then makes it easier for the reader to avoid wasting time studying the report looking for such data.
In addition the findings from the interviews will also provide insights which will either help contextualize the findings from the data, or help explain some of the anomalies. It is therefore recommended that the findings of the interviews are synthesized, and where relevant quotes are included.
3.7 Project level data and information useful for macro estimations (indirect and induced effects)
Project level data on the various project inputs can be used to improve on estimations of the macro (indirect) employment impacts. It is efficient to collect this data as part of the same process of collecting the project or programme level employment data. This data pertains to the inputs (other than labour which is already captured) that are required, typically material inputs produced by other sectors of the economy, services provided by other sectors as well as factor capital inputs (profits). This can typically be obtained from financial records and project documentation, in particular the Bill of Quantities. The details on the type of information to collect and how to categorize it is explained in Unit 4.
Guide for Monitoring Employment and Conducting Employment Impact Assessments (EmpIA) of Infrastructure Investments40

Unit 3. In depth EmpIA studies on direct employment effects 41

Factory workers push a cart with bricks in kiln
UNIT 4
Assessing indirect and induced employment effects of infrastructure investments using SAM Multiplier Analysis
43

4.1 Introduction
This unit shifts the focus from direct employment to the indirect and induced effects. As these effects occur mostly in other sectors of the economy and are more difficult to observe, estimating their magnitude requires a shift from a project or programme level focus, to a national or macroeconomic perspective. However there are important links between the project/ direct effects, and the macro/ indirect effects, and these will discussed briefly before presenting the methodology for assessing macro effects.
The methodology presented in this unit for assessing the indirect and induced effects is essentially a multiplier analysis using Leontief multipliers derived from an Input-Output Table (IOT) or Social Accounting Matrix. (SAM). This method also provides an estimate of the direct employment effects, not just of the indirect and induced. This direct effect will be based on national averages of the construction sector. Thus if the investment under consideration is very different from the national average, the direct effects from the multiplier analysis may differ greatly from those based on the project level data. The methodology presented aims to address this by using project level data in the macro analysis, to obtain more accurate and consistent estimates. They become more accurate by shifting from using construction sector averages to parameters that are more specific to the infrastructure investment in question. In order to do this, it is important to explain the similarities between the project level indicators and relevant macroeconomic indicators and this is done in the next section.
Before proceeding on this a few points are worth noting. Leontief multiplier based analysis is by no means the only method for assessing indirect and induced effects, and other methods exist or are being developed. The methodology presented in this unit and the accompanying annexes and references are not meant to be used by a project manager or staff involved in the project. It will typically require the involvement of a macroeconomist familiar with multiplier analysis. It is assumed that if a project want to do an assessment of its indirect and induced impact, a consultant with experience in using these methods will be contracted. This unit is meant to assist the project staff to develop a TOR for hiring such a consultant as well as interpret the results which will emerge from such a study. At the same it is also meant to provide guidance to the consultant, in particular if she or he has not done any assessments of infrastructure investments.
4.2 Links between the micro and macro effects and indicators
The specific and derived indicators presented in the previous Units were partially chosen because they are macro level equivalents. This allows the project level employment indicators to be compared with national figures. The core indicators and their macro/ national level equivalents are presented and discussed in Table 4.1.
Guide for Monitoring Employment and Conducting Employment Impact Assessments (EmpIA) of Infrastructure Investments44
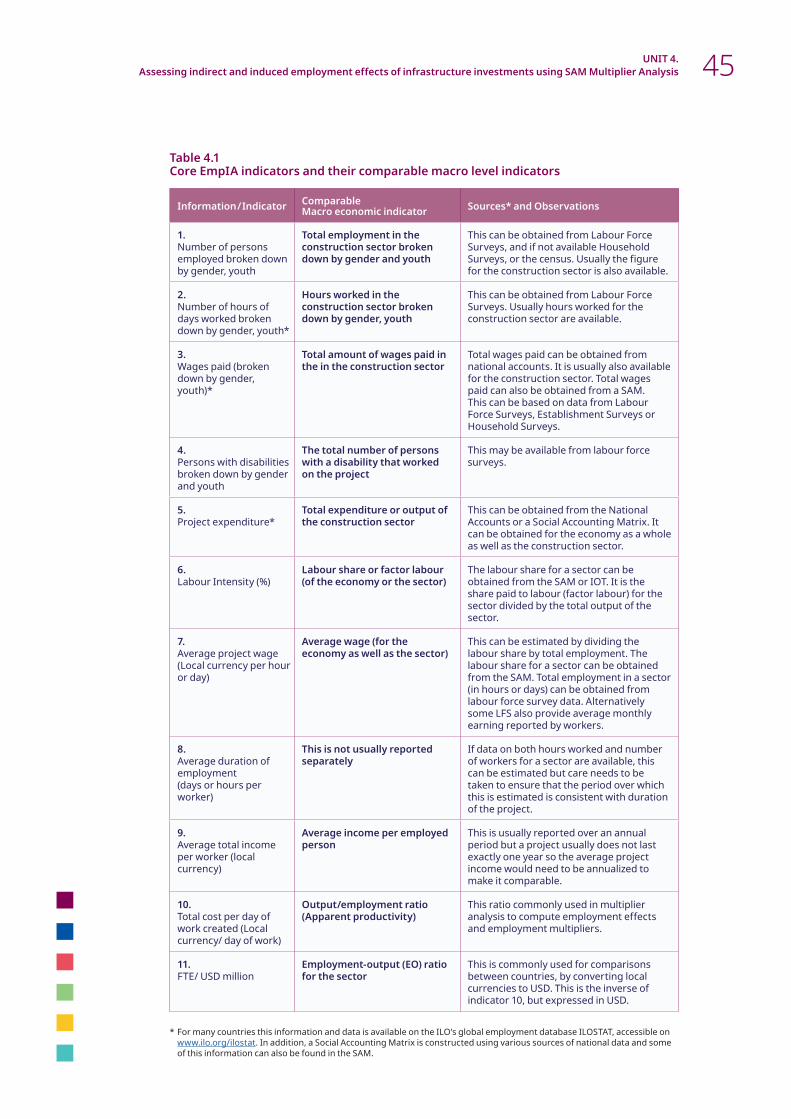
Table 4.1 Core EmpIA indicators and their comparable macro level indicators
Information / Indicator Comparable Macro economic indicator Sources* and Observations
1.Number of persons employed broken down by gender, youth
Total employment in the construction sector broken down by gender and youth
This can be obtained from Labour Force Surveys, and if not available Household Surveys, or the census. Usually the figure for the construction sector is also available.
2.Number of hours of days worked broken down by gender, youth*
Hours worked in the construction sector broken down by gender, youth
This can be obtained from Labour Force Surveys. Usually hours worked for the construction sector are available.
3.Wages paid (broken down by gender, youth)*
Total amount of wages paid in the in the construction sector
Total wages paid can be obtained from national accounts. It is usually also available for the construction sector. Total wages paid can also be obtained from a SAM. This can be based on data from Labour Force Surveys, Establishment Surveys or Household Surveys.
4.Persons with disabilities broken down by gender and youth
The total number of persons with a disability that worked on the project
This may be available from labour force surveys.
5.Project expenditure*
Total expenditure or output of the construction sector
This can be obtained from the National Accounts or a Social Accounting Matrix. It can be obtained for the economy as a whole as well as the construction sector.
6.Labour Intensity (%)
Labour share or factor labour (of the economy or the sector)
The labour share for a sector can be obtained from the SAM or IOT. It is the share paid to labour (factor labour) for the sector divided by the total output of the sector.
7.Average project wage (Local currency per hour or day)
Average wage (for the economy as well as the sector)
This can be estimated by dividing the labour share by total employment. The labour share for a sector can be obtained from the SAM. Total employment in a sector (in hours or days) can be obtained from labour force survey data. Alternatively some LFS also provide average monthly earning reported by workers.
8.Average duration of employment (days or hours per worker)
This is not usually reported separately
If data on both hours worked and number of workers for a sector are available, this can be estimated but care needs to be taken to ensure that the period over which this is estimated is consistent with duration of the project.
9.Average total income per worker (local currency)
Average income per employed person
This is usually reported over an annual period but a project usually does not last exactly one year so the average project income would need to be annualized to make it comparable.
10.Total cost per day of work created (Local currency/ day of work)
Output/employment ratio (Apparent productivity)
This ratio commonly used in multiplier analysis to compute employment effects and employment multipliers.
11.FTE/ USD million
Employment-output (EO) ratio for the sector
This is commonly used for comparisons between countries, by converting local currencies to USD. This is the inverse of indicator 10, but expressed in USD.
* For many countries this information and data is available on the ILO’s global employment database ILOSTAT, accessible on www.ilo.org/ilostat. In addition, a Social Accounting Matrix is constructed using various sources of national data and some of this information can also be found in the SAM.
UNIT 4. Assessing indirect and induced employment effects of infrastructure investments using SAM Multiplier Analysis 45

The employment/output (EO) ratio (indicator 11), is an important indicator used in multiplier analysis to convert changes in output into changes in employment. Without this ratio, the multiplier analysis only provides estimates of how increased investment in infrastructure impacts overall output of the economy.
One specific advantage of having an EO ratio related to the construction of the specific type of infrastructure investment is that this can be used in the macro analysis presented in this unit. As the macro analysis also provides an estimate of direct employment, using this, instead of the average for the construction sector will provide more accurate estimates. This is one important way in which project of programme level data can be used to enhance the macro analysis.
4.3 Indirect and induced effects using multiplier analysis
The indirect and induced effects of an infrastructure investments can be estimated using Social Accounting Matrix (SAM) multiplier analysis. The infrastructure investment is treated as an exogenous shock to the economy, and the effects of the shock on the output of the economy is calculated using output multipliers. Output multipliers are expressed as numbers without units. For example the value of an output multiplier for the construction sector could 1.8, indicating that an increase in output of 1unit in the construction sector will lead to an increase of 1.8 units of the overall economy. Usually two types of multipliers are calculated, the Type I multipliers which capture the direct and indirect effects, and the Type II multipliers which capture direct, indirect and induced effects. This allows for assessing the indirect and induced effects separately which is important.
Once the change in output is estimated this and the EO ratios are then used to estimate the employment effect. The output multipliers and EO ratios can also be used to calculate employment multipliers. These are expressed as the number of jobs created for every additional amount of output (usually expressed in USD million).So if the employment multiplier for the construction sector is 31, it means that for every additional USD million of construction sector output 31 jobs are created in the entire economy. Again Type I and Type II employment multipliers can be calculated, depending on which output multiplier is used to calculate them. Annex 4b provides some values of these multipliers for different countries.
This methodology well established and documented in economic literature and described in detail in the ETE Toolkit. It will not be repeated in this guide and it is recommended that in the TOR for such work explicit reference is made to this Guide and the Toolkit. Unit 1 of the toolkit provides an overview of a Social Accounting Matrix which is useful for readers who may not be familiar with a SAM. Units 2 and 3 provide detailed steps of how to proceed and estimate the employment effects of such a shock.
The main points to take note of is that in the case of infrastructure investment,
X The value of exogenous shock would be based on the value of the infrastructure investment, but it needs to be “annualized” in that the amount of the investment that would be spend in a year needs to be estimated and this will be the value of the exogenous shock.
X The shock is then applied to the construction sector account of the SAM, or if the construction account is disaggregated to the most appropriate subsector. For example if the investment is in road infrastructure and the construction sector account is split into civil construction and building construction, the shock is best applied to the civil construction account.
X It should be noted that the results obtained will include the direct effects (jobs created directly by the project in the construction sector) as well as indirect and induced effects and will be the effect for one year.
Guide for Monitoring Employment and Conducting Employment Impact Assessments (EmpIA) of Infrastructure Investments46
If the SAM only contains an aggregated construction sector account, there may be good reasons to split the construction sector account to obtain a more accurate estimate. This is discussed in more detail in the next section.
It is also important to be aware of some of the well-known assumptions and limitations behind using IOT or SAM analysis to estimate the employment effects. Understanding these will assist in the interpretation and presentation of the results. The main assumptions and limitations to be aware of are:
X The completeness and accuracy of the underlying data used to compile the IOT or SAM. IOTs and SAMs are compiling from different data sets, and sometimes some can be out of date or certain assumptions are made during the compilation to address data gaps. So while they are meant to be objective representations of the economy this is not always the case.
X It is assumed there are no supply constraints and therefore increased demand leads to increased supply and not to higher prices.
X There are no increased economies of scale and production technology does not change, therefore one need 3 units of X to produce 1 unit of Y, it follows that we need 9 units of X to produce 3 units of Y.
X The sectors in the SAM represent a diverse set of activities that are aggregated, for example the construction sector includes both the construction of low-cost private housing as well as the construction major highways. Such aggregation can distort results.
X For estimating the induced effect, it is assumed that the consumption and savings patterns of households do not change if their income increases. However in general such patterns do change as household income increases. For very large investments this should ideally be taken into account15.
Collectively, all these assumptions tend to lead to an overestimation of the employment effects. Despite these assumptions and limitations, multiplier analysis is widely used because of its simplicity and limited data requirements. As such it remains the most feasible approach to estimate indirect and induced effects. It should also be noted that other methodologies can be considered. These can either built on IOT and SAM based approaches, or be based on entirely different data sets16.
15 This can be done by introducing a consumption function into the estimations. However this can increase the scope and costs of the assignment significantly.16 See for example the Strengthen publications on different methodologies by Gibson and Flaherty (2017), Charpe (2019) and Shaffer (2019).
UNIT 4. Assessing indirect and induced employment effects of infrastructure investments using SAM Multiplier Analysis 47

4.4 Refining estimates by creating a construction sector sub account
If it is thought that the inputs required and the labour content of the investment are deemed to be significantly different from the construction sector averages contained in the SAM construction sector account, it may be desirable to split the construction sector account and create a sub account based on the inputs and labour content of the infrastructure investment in question. To do this an initial comparison can be made. This can be done using estimates of the input and labour contents of the planned investment and comparing this with the technology coefficients in the construction sector of the SAM with those for the investment. This comparison can be done ex-ante with estimates of the inputs obtained from the project plan or detailed design (Bill of Quantities of the project), or using actual information if available from actual expenditure (See Annex 4 for more details).
The comparison can be done by obtaining the technical coefficients for the construction sector account from the SAM (See Box 4), and comparing these to the inputs required for the infrastructure investment. Of particular relevance (and generally quite easy) is to compare the estimated labour intensity with the labour inputs in the SAM.
The other comparison is the estimated EO ratio of the project (expressed in FTE/ USD million), with the EO ratio of the construction sector which can be estimated from the construction sector account of the SAM and construction sector employment data (See Box 5).
If the differences are found to be substantial it is likely that the estimations will vary significantly as well. In this case a choice may be made to do a more accurate assessment. This would involve using the coefficients and EO ratios that more accurately reflect the investment in question.
The suggested approach for doing this is to split the construction sector account in the SAM into an account more reflective of the investment, and a “rest of construction” account. The account representing the investment would use the inputs, coefficients and EO ratios based on the data from the investment. The rest of construction account would be the residual. The rationale here is that the investment in question, for example construction of highways, is already included in the construction sector account, as this account reflects all construction sector activity in the economy. What is proposed is to disaggregate the account again and take the construction of highways back out of the construction sector account.
Guide for Monitoring Employment and Conducting Employment Impact Assessments (EmpIA) of Infrastructure Investments48

The construction sector inputs for an economy can be from the Construction sector account (Column) of the SAM. This account quantifies what inputs the sector purchases from other sector as well as from the factor accounts (labour and capital). This is illustrated in the table below. The first column contains all the sectors and factors the in SAM. The second column contains the spending by the construction sector on inputs from each of sectors and factors. These two columns can be obtained directly from the SAM. The third column presents the share of these inputs expressed in percentages and is calculated by dividing the inputs from each sector and factor by the total inputs purchased from the sector. These percentages are sometimes also referred to as the technical coefficients, as they are a reflection of the production technology used in the sector.
Table 4.2 Technical coefficients for the Construction Sector from a SAM for Rwanda Construction spending Percentage (RWF millions)
Agriculture 0 0.00Forestry 2,071 0.31Textile and clothing 39 0.01Wood, paper and printing 367,91 5.51Chemicals 16,352 2.45Non-metallic minerals 28,691 4.29Furniture and other manu. 132 0.02 Electricity, gas and water 248 0.04Construction 54,393 8.14Wholesale and retail trade 9,294 1.39Transports 77,061 11.54Communication 12,002 1.80Finance and insurance 64,357 9.63Real estate 277 0.04Business services 23,387 3.50Repair 2291 0.34Labour – unskilled 141,584 21.19Labour - Low Skill 42,827 6.41Labour - High Skill 7,652 1.15Capital - Non-Agriculture 134,664 20.16Capital - Sector Specific 13,913 2.08Total 668,027 100
Source: (Lieuw-Kie-Song et. al. 2019)
So for example, according to this SAM the Construction sector spends 11.54 per cent of its expenditure of RWF 668,027 million on inputs from the transport sector. And the total labour intensity of the sector can be obtained from summing up the percentages of the three labour accounts. So total labour intensity is 21.19 + 6.41 + 1.15 = 28.75 per cent. These values can be compared with those estimated for the infrastructure investment under question to get a sense of how similar or different it is for the construction sector average. If these are quite similar, the multipliers for the construction sector can be used for employment estimations. However if they are very different, a separate account can be created to estimate the multiplier for the specific investment.
X Box 4: Determining the sector and labour inputs into the construction sector from a IOT or SAM
UNIT 4. Assessing indirect and induced employment effects of infrastructure investments using SAM Multiplier Analysis 49
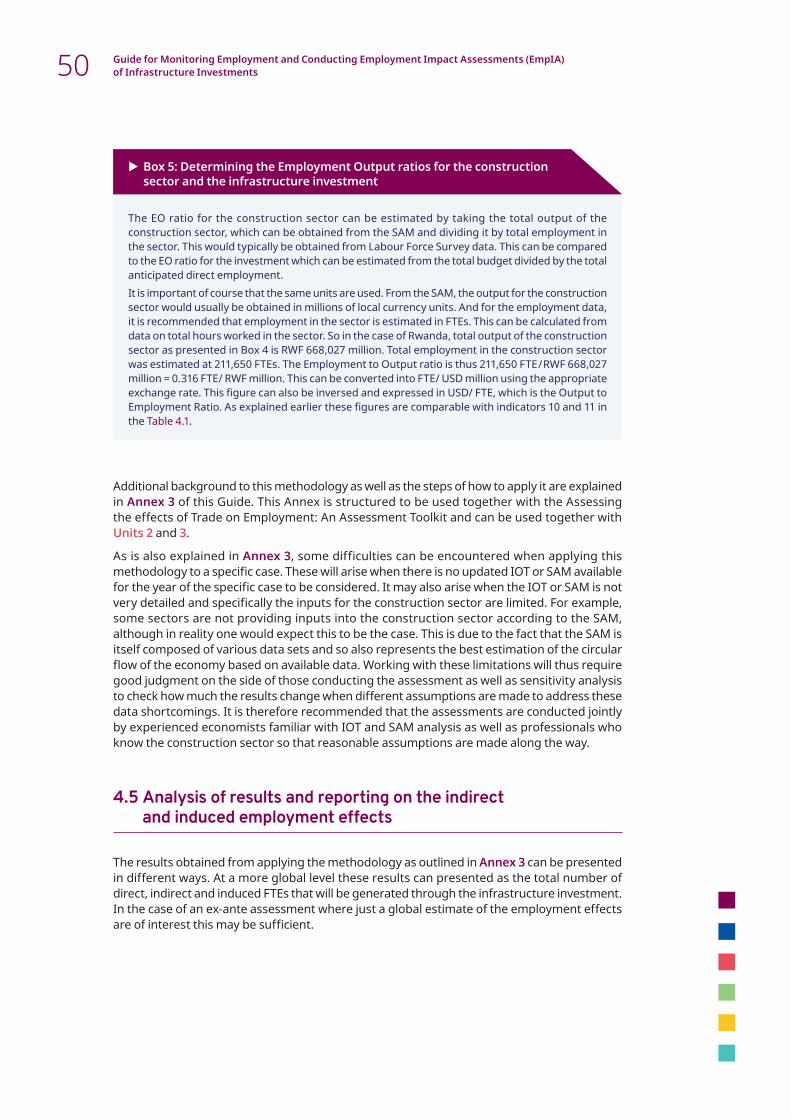
The EO ratio for the construction sector can be estimated by taking the total output of the construction sector, which can be obtained from the SAM and dividing it by total employment in the sector. This would typically be obtained from Labour Force Survey data. This can be compared to the EO ratio for the investment which can be estimated from the total budget divided by the total anticipated direct employment. It is important of course that the same units are used. From the SAM, the output for the construction sector would usually be obtained in millions of local currency units. And for the employment data, it is recommended that employment in the sector is estimated in FTEs. This can be calculated from data on total hours worked in the sector. So in the case of Rwanda, total output of the construction sector as presented in Box 4 is RWF 668,027 million. Total employment in the construction sector was estimated at 211,650 FTEs. The Employment to Output ratio is thus 211,650 FTE / RWF 668,027 million = 0.316 FTE/ RWF million. This can be converted into FTE/ USD million using the appropriate exchange rate. This figure can also be inversed and expressed in USD/ FTE, which is the Output to Employment Ratio. As explained earlier these figures are comparable with indicators 10 and 11 in the Table 4.1.
Additional background to this methodology as well as the steps of how to apply it are explained in Annex 3 of this Guide. This Annex is structured to be used together with the Assessing the effects of Trade on Employment: An Assessment Toolkit and can be used together with Units 2 and 3.
As is also explained in Annex 3, some difficulties can be encountered when applying this methodology to a specific case. These will arise when there is no updated IOT or SAM available for the year of the specific case to be considered. It may also arise when the IOT or SAM is not very detailed and specifically the inputs for the construction sector are limited. For example, some sectors are not providing inputs into the construction sector according to the SAM, although in reality one would expect this to be the case. This is due to the fact that the SAM is itself composed of various data sets and so also represents the best estimation of the circular flow of the economy based on available data. Working with these limitations will thus require good judgment on the side of those conducting the assessment as well as sensitivity analysis to check how much the results change when different assumptions are made to address these data shortcomings. It is therefore recommended that the assessments are conducted jointly by experienced economists familiar with IOT and SAM analysis as well as professionals who know the construction sector so that reasonable assumptions are made along the way.
4.5 Analysis of results and reporting on the indirect and induced employment effects
The results obtained from applying the methodology as outlined in Annex 3 can be presented in different ways. At a more global level these results can presented as the total number of direct, indirect and induced FTEs that will be generated through the infrastructure investment. In the case of an ex-ante assessment where just a global estimate of the employment effects are of interest this may be sufficient.
X Box 5: Determining the Employment Output ratios for the construction sector and the infrastructure investment
Guide for Monitoring Employment and Conducting Employment Impact Assessments (EmpIA) of Infrastructure Investments50

Table 4.3 Estimated employment effects from Feeder Road investments in Rwanda
Sectors Increase in total Increase in total hours worked hours worked Feeder Roads Feeder Roads LB
Forestry 462,952 507,754Fishing & Hunting 273,789 301,168Textile Manufacture 962,172 1,009,108Wood and Paper Products Manu. 1,577,024 1,823,434Chemical Industries 807,386 886,027Non-metallic Products. 366,573 185,568Furniture and other Manu. – –Gas, Water & Electricity 400,416 369,615Construction 6,083,589 33,912,176Wholesale and Retail Trade 4,200,704 3,543,610Hotel & restaurants 518,758 492,820Transport 3,558,160 4,474,806Communications 146,382 131,744Financial services 667,547 712,349Real Estate 22,125 18,871Business Services and repair 445,267 354,485Total non-construction 14,409,256 14,811,358Total 20,492,844 48,723,535
Source: (Lieuw-Kie-Song et. al. 2019)
However, it is also possible to present disaggregated effects, showing in which of the sectors the indirect and induced employment effects will be generated as shown in Table 4.3. This show the results for two options, the construction of feeder roads using more capital intensive of more LI methods. It shows the effects broken down per sector, as well as the totals. This may be important as there may be a particular interest in showing how the construction sector is linked to other sectors, and thus how increasing output in this sector, impacts on other sectors in the economy. This will require that the multipliers are disaggregated for each sector, and that the EO ratio for each of the sector is estimated. This can also be done if one wants to be more conservative when presenting the results and take into account some of the limitations of the methodology which can lead to overestimations. For this reason the effects on employment in agriculture were not included17. Annex 3 also contains another example of reporting results.
In particular in developing countries, with a high shares of agricultural and informal employment, care should be taken in this regard. Because these have such low productivity (and high employment-output ratios), the analysis tends to overestimate employment effects for these sectors. Consideration can therefore be given to not including effects in the agriculture and sectors with very high level of informality and employment output ratios in the results.
17 This was also done as the Rwandan government was explicitly interested on effects on non-agricultural employment.
UNIT 4. Assessing indirect and induced employment effects of infrastructure investments using SAM Multiplier Analysis 51

Finally, it is important that any discussions on the results are had taking into account the assumptions and limitations of using SAM multiplier analysis and which were presented in Section 4.3. It should be noted that some of these assumptions and limitations can also be used to raise important policy questions and inform policy and social dialogue. Some suggestions of how these be turned into policy questions are presented in Table 4.4.
Table 4.4 Assumption in Multiplier Analysis and related policy questions
Assumption/ Limitation Related policy questions
1. No supply constraints and fixed prices
Is this a reasonable assumption? Are stakeholders aware of sectors that are already facing supply constraints? Would these constraints more likely result in higher prices? Should measures be considered to address these constraints? Example: If local cement production is already operating and full capacity, increased construction demand is not likely to results increased output and employment in this sector. Rather it may lead to either increased prices or increased imports and lower employment effects.
2. No economies of scale and constant production technology
Is it correct that the production technologies of the relevant sectors will remain the same? Or would increased demand result in investments that would change the production technology? Is this process already underway in the sector?Example: In an economy where brick manufacturing is done through both small-scale large-scale mechanized producers, there may exist large economies of scale it may be possible to increase output without hiring additional workers in the same proportion and this would results in lower employment effects.
3. Aggregation and nature of the sector
As with the construction sector, other sectors of a SAM also contain a very wide range of activities with very different production technologies and input structures. This will require careful interpretation of the result for these sectors and a discussion on which types of firms in these sectors would be likely to increase their output. Example wholesale and retail may contain wholesalers with sophisticated warehousing and distributions centers, as well as informal street vendors, but a large construction project is more likely to buy its inputs from a large wholesaler. This would this result in increased formal employment with wholesalers, but little increase in informal employment in this sector.
Guide for Monitoring Employment and Conducting Employment Impact Assessments (EmpIA) of Infrastructure Investments52

BibliographyAbbadi S., Arthur F., Abebe H. and Lieuw-Kie-Song M. 2019. “Assessing the Employment Effects of Investment in Housing in Ghana”, Strengthen Project Publication, ILO Geneva, Available on: https://www.ilo.org/africa/countries-covered/ghana/strengthen/WCMS_723281/lang--en/index.htm
Charpe M. 2019. “Local Multipliers in a selection of Sub-Saharan countries”, Strengthen Publication Series Working Paper No. 12, ILO Geneva, Available on: https://www.ilo.org/employment/Whatwedo/Projects/sector-trade-policies/WCMS_723226/lang--en/index.htm
EC, UN, IMF, WB and OECD 2009. “System of National Accounts” 2008, paragraph 19.43,UN, New York, Available on: https://unstats.un.org/unsd/nationalaccount/docs/SNA2008.pdf
Gibson B. and Flaherty D. 2017. “Employment impact assessments: A review of methodologies”, Working Paper No. 3. Strengthen Project Publication, ILO Geneva, Available on: https://www.ilo.org/employment/Whatwedo/Projects/sector-trade-policies/WCMS_608077/lang--en/index.htm
GSS 2016. 2015. Labour Force Report, Ghana Statistical Services, Accra.
IFPRI 2009. “Social accounting matrices and multiplier analysis: An introduction with exercises”, Food Security in Practice Technical Guide Series, International Food Policy Research Institute (IFPRI), Washington D.C. Available on: https://www.ifpri.org/publication/social-accounting-matrices-and-multiplier-analysis
ILO 2013. “The informal economy and decent work: a policy resource guide supporting transitions to formality”, ILO, Employment Policy Department, Geneva 2013
ILO 2017. “Employment impact of infrastructure investments in Jordan”, Employment Research Brief, ILO Geneva, Available on https://www.ilo.org/employment/Whatwedo/Publications/research-briefs/WCMS_575884/lang--en/index.htm
ILO 2017. “Employment impact of infrastructure investments in Tunisia”, Employment Research Brief, ILO Geneva, Available on: https://www.ilo.org/employment/Whatwedo/Publications/research-briefs/WCMS_575893/lang--en/index.htm
ILO 2017. “Employment impact of infrastructure investments in Morocco”, Employment Research Brief, ILO Geneva, Available on: https://www.ilo.org/employment/Whatwedo/Publications/research-briefs/WCMS_575889/lang--en/index.htm
ILO 2018. “Investment in infrastructure - Assessment of employment outcomes using macro-level analysis: Approach and indicators”, Policy Brief, ILO Geneva, Available on: https://www.ilo.org/employment/Whatwedo/Publications/policy-briefs/WCMS_575722/lang--en/index.htm
ILO 2018. ” Investment in infrastructure - Assessment of employment outcomes using project-level analysis: Approach and indicators, Policy Brief, ILO Geneva Available on: https://www.ilo.org/employment/Whatwedo/Publications/policy-briefs/WCMS_575720/lang--en/index.htm
ILO and World Bank 2018. “Assessment of Infrastructure Investments in Transport and Job Creation : Examples from Road Sector Investments in Lebanon and Jordan”. Available on: https://www.ilo.org/global/topics/employment-intensive-investment/publications/WCMS_662370/lang--en/index.htm
ILO 2019a. “Assessing the Effects of Trade on Employment: an Assessment Toolkit”, Strengthen Project Publication, ILO, Geneva. Available on: https://www.ilo.org/employment/Whatwedo/Projects/sector-trade-policies/trade/WCMS_671539/lang--en/index.htm
ILO 2019b. “Review of Practices and Methods for Monitoring and Assessing the Employment Impacts of International Financial Institutions (IFIs)”, Strengthen Project, Development and Investment Branch, mimeo.
Lieuw-Kie-Song M. Abebe H. Sempundu T. and Bynens E. 2019. “Employment Impact Assessments: Analysis of the employment effects of infrastructure investment in Rwanda using multiplier analysis of construction subsectors”, Strengthen Publications Series Working Paper No. 14, ILO Geneva, Available on: https://www.ilo.org/africa/countries-covered/rwanda/strengthen/WCMS_723285/lang--en/index.htm
53
Shaffer P. 2017, “Improving Impact Assessment of the Effects of Trade on Employment: Study on Qualitative and Mixed Method Approaches”, Strengthen Publication Series Working Paper No. 4, ILO Geneva. Available on: https://www.ilo.org/employment/Whatwedo/Projects/sector-trade-policies/WCMS_652225/lang--en/index.htm
Vadiya, K. 2017. “Review of impacts on roads sector investments on employment”, STRENGTHEN Series Publication Number 2, Geneva, ILO Available on: https://www.ilo.org/employment/Whatwedo/Projects/sector-trade-policies/WCMS_608076/lang--en/index.htm
List of employment impact assessment studies grouped by region (including those not cited in this Guide)
Africa
Alarcón, J.; Ernst, C.; Joaquim, Z.; Madime, E.; Stella, D. 2014. “Assessing employment opportunities of the Mozambican economy: a DySAM analysis”, ILO Geneva
Charpe M.; Abebe H.;, Kouakou C. 2019, “Multiplicateurs d’emploi sectoriel en Côte d’Ivoire”, Strengthen Publication Series Working Paper No. 7, ILO Geneva,
El Ghrib, A. 2014. “Evaluation des impacts des projets financés par la Banque Européenne d’Investissement au Maroc sur les emplois indirects et induits: Energie solaire – Transport – Assainissement - Environnement” (Luxembourg and Geneva, European Investment Bank and ILO).
El Kadhi, Z. 2014. “Impact macro-économique sur l’emploi des investissements en infrastructure en Tunisie. Impact d’un réseau routier urbain prioritaire (Voiries Prioritaires) et de la centrale électrique de Sousse”, final report , ILO, Geneva
El-Megharbel, N.; Raouf, M.; Ahmed, S. 2015, Employment impact of EIB infrastructure investments in the Mediterranean Partner Countries Egypt study, (Cairo, European Investment Bank and ILO).
Ernst, C. and Iturriza, A. 2011. Tackling deforestation in Mozambique: Reconciling the social, economic and environmental agenda, paper presented at the 14th ILO Regional Seminar for Labour Based Practitioners, Accra, 5-9 September.
Ernst, C. and Sarabia, M. 2015. Urgent plan to activate the Egyptian economy: an employment impact assessment, Employment Working Papers no. 176, ILO, Geneva.
Philip, K. 2013. The Community Work Programme: Building a Society that Works, Employment, Working Paper No.149 (Geneva, ILO).
Gamoo, L. and Johannessen, B. 2011, Study on enhancing the labour intensity in the Expanded Public Works Programme road infrastructure projects, South Africa: Final Report, (Pretoria, Department of Public Works).
McCord, A.; and Van Seventer, D. 2004, The economy-wide impacts of the labour intensification of infrastructure expenditure in South Africa, Centre for Social Science Research Working Paper No. 93, University of Cape Town, Cape Town.
Maniscalo, D.; Yemene, S.; Taylor, G. 2011, Employment ompact assessment of infrastructure investments in Liberia, (IT Transport Ltd., Ardington, United Kingdom)
The United Republic of Tanzania Ministry of Works, 2004, Comparative Study on labour based and equipment based methods in road works in Tanzania, (In association with K & Associates Professional Services & Daima Associates Limited, Tanzania).
Abbadi,S., Senadza, B., Lieuw-Kie-Song, M. and Abebe H. 2019, “Assessing the Employment Effects of Processing Cocoa in Ghana” Strengthen Project Publication, ILO Geneva. Available on: https://www.ilo.org/africa/countries-covered/ghana/strengthen/WCMS_673136/lang--en/index.htm
Guide for Monitoring Employment and Conducting Employment Impact Assessments (EmpIA) of Infrastructure Investments54

High Income Countries
Bivens, J. 2014. “The short- and long-term impact of infrastructure investments on employment and economic activity in the U.S. economy”, EPI Briefing Paper #374 (Washington, D.C., Economic Policy Institute).
James Heintz J.; Pollin R.; Garrett-Peltier H. 2009; How Infrastructure Investments Support the U.S. Economy: Employment, Productivity and Growth, Political Economy Research Institute (PERI), University of Massachusetts-Amherst, Amherst, MA.
National Roads Authority, 2013, The Employment Benefits of Investment Projects, Transport Research and Information Note, (Dublin, National Roads Authority).
Nana, G. 2003, Assessment of the economic impact of efficiency improvements in building and construction, BERL Ref: 4219a.
Zacharias, A.; Masterson, T.; Kim, K. 2009. Labor Market Outcomes of Infrastructure Expenditures under the American Recovery and Reinvestment Act (Annandale-on-Hudson: Levy Economics Institute of Bard College).
South America
Coremberg, A. 2010. Simulador de impacto de la construcción en la economía argentina. - 1a ed. - Buenos Aires : FODECO.
Ernst, C. and Sánchez-Aconchea, D. 2008. “Offshoring and employment in the developing world: The case of Costa Rica”, Employment Working Paper, No. 4 (Geneva, ILO).
Ernst, C. and López Avilés, E. 2011. “Offshoring en México: Trampa o potencial oportunidad para crear más y mejores empleos?” in Revista Trabajo, México D.F.
Ferreira Filho, J.B.S. and da Cunha Filho J.H. “Uma matriz de contabilidade social para o setor sucroalcooleiro do Brasil” (Brasília, ILO).
Ferreira Filho, J.B.S. and Fachinello A.L. 2015.“Employment and income generation in the Brazilian Amazon forest: A SAM based multiplier approach” International Forestry Review Vol. 17 (S1).
Asia
Alarcon, J. and Ernst, C. 2015. Regional development, infrastructure and decent work: An IRSAM analysis, a paper presented at the 23rd Input-Output Association Conference, Mexico City, 22-26 June.
Alarcon, J. and Sharma, P.D. 2015. Application of a Green-Jobs SAM with Employment and CO2 Satellites for Informed Green Policy Support: The case of Indonesia, a paper presented at the 23rd Input-Output Association Conference, Mexico City, 22-26 June.
Chen-Chen Y. 2015. Organic Agricultural Exports and Job Opportunities: A Case of Malaysia (Kuala Lumpur, Malaysia).
Ernst, C. and Bird, M. 2009. Offshoring and employment in the developing world: The case of Business Process Outsourcing in the Philippines, Employment Working Paper (Geneva, ILO).
Ernest, C. and Peters, R. 2012. Employment Dimension of Trade Liberalization with China: Analysis of the case of Indonesia with Dynamic Social Accounting Matrix, ILO Working Paper no. 112 and UNCTAD Series on Assuring Development Gains from the International Trading System and Trade Negotiations, Working Paper 4/2011 (Geneva, ILO and UNCTAD).
Green Jobs Malaysia Project; ILO Green Jobs Programme for Asia and the Pacific. 2015. Green DySAM-based modelling and policy support simulations: green township scenario simulation and application in organic agriculture exports, Policy brief (Jakarta, Ministry of Energy, Green Technology and Water Malaysia (KeTTHA), Ministry of Human Resources and ILO).
Hartono, D. 2010. “A research study to assess the effectiveness of policies designed to mitigate the impact of the global financial crisis in Indonesia”, Discussion Paper Series No. 208 (Geneva, International Institute of Labour Studies).
55Bibliography

Sinha, A.; Prabhakar, A.; Jaiswal, R. 2015. Employment Dimension of Infrastructure Investment: State Level Input-Output Analysis. Employment Working Paper No 168 (Geneva, ILO).
Omari, M.; Soufan, Z.; Al-Sabbagh, O. 2014. Macro-economic employment impact of infrastructure investments in Jordan (Amman, Ministry of Planning and International Cooperation of Jordan).
Multi-country studies
Alarcon, J.; Ernst, C.; Khondker, B; Sharma, J.D. 2011. Dynamic Social Accounting Matrix (DySam): Concept, Methodology and Simulation Outcomes. The case of Indonesia and Mozambique, Employment Working Paper no. 88 (Geneva, ILO).
Van Imschoot, M. and Brudefors, U. 2015, Employment impact infrastructure investments in the Mediterranean Partner Countries: Study Summary Report, ILO EMP/INVEST.
General and global studies
Ernst, C. and Nübler, I. 2013. “Creating Productive Capacities, Employment and Capabilities for Development: The Case of Infrastructure Investment” in I. Islam and D. Kucera (eds.): Beyond Macroeconomic Stability Structural Transformation and Inclusive Development (Geneva, ILO).
Ernst, C. and Sarabia, M. 2014. The role of construction as an employment provider: a world-wide input-output analysis, Employment Working Paper (Geneva, ILO).
Vaidya, K. 2013. Towards acceptable wages for public employment programmes: A guide for conducting studies for wage setting and estimating labour supply response, Employment Working Paper no. 150 (Geneva, ILO).
Methodologies
Charpe M. 2019. Local Multipliers in a selection of Sub-Saharan countries, Strengthen Publication Series Working Paper No. 12, ILO Geneva. Available on: https://www.ilo.org/employment/Whatwedo/Projects/sector-trade-policies/WCMS_723226/lang--en/index.htm
GAIN 2017. GAIN Training Guidebook How to measure and model social and employment outcomes of climate and sustainable development policies Green Jobs Assessment Institutions Network. Available on: https://www.ilo.org/global/topics/green-jobs/publications/WCMS_613934/lang--en/index.htm
Gibson B. and Flaherty D. 2017. Employment impact assessments: A review of methodologies, Working Paper No. 3. Strengthen Project Publication, ILO Geneva, Available on: https://www.ilo.org/employment/Whatwedo/Projects/sector-trade-policies/WCMS_608077/lang--en/index.htm
Gibson B. and Flaherty D. 2017. Employment Impact Assessments: Integrating the informal sector into social accounting matrices and computable general equilibrium models, Working Paper No. 6. Strengthen Project Publication, ILO Geneva, Available on: https://www.ilo.org/wcmsp5/groups/public/---ed_emp/documents/publication/wcms_735672.pdf
Ernst, C.; Miller, S.; Van Imschoot, M., 2015, The employment dimension of infrastructure investments: A guide for employment impact assessment, ILO Employment Sector, Employment Working Paper No. 178.
Estache, A. and Gregoire, G. 2012, The scope for an impact of infrastructure investments on jobs in developing countries, IFC Economic Notes, Note 4. Unpublished.
Shaffer P. 2017, Improving Impact Assessment of the Effects of Trade on Employment: Study on Qualitative and Mixed Method Approaches, Strengthen Publication Series Working Paper No. 4, ILO Geneva. Available on: https://www.ilo.org/employment/Whatwedo/Projects/sector-trade-policies/WCMS_652225/lang--en/index.htm
Guide for Monitoring Employment and Conducting Employment Impact Assessments (EmpIA) of Infrastructure Investments56

Annexes
57
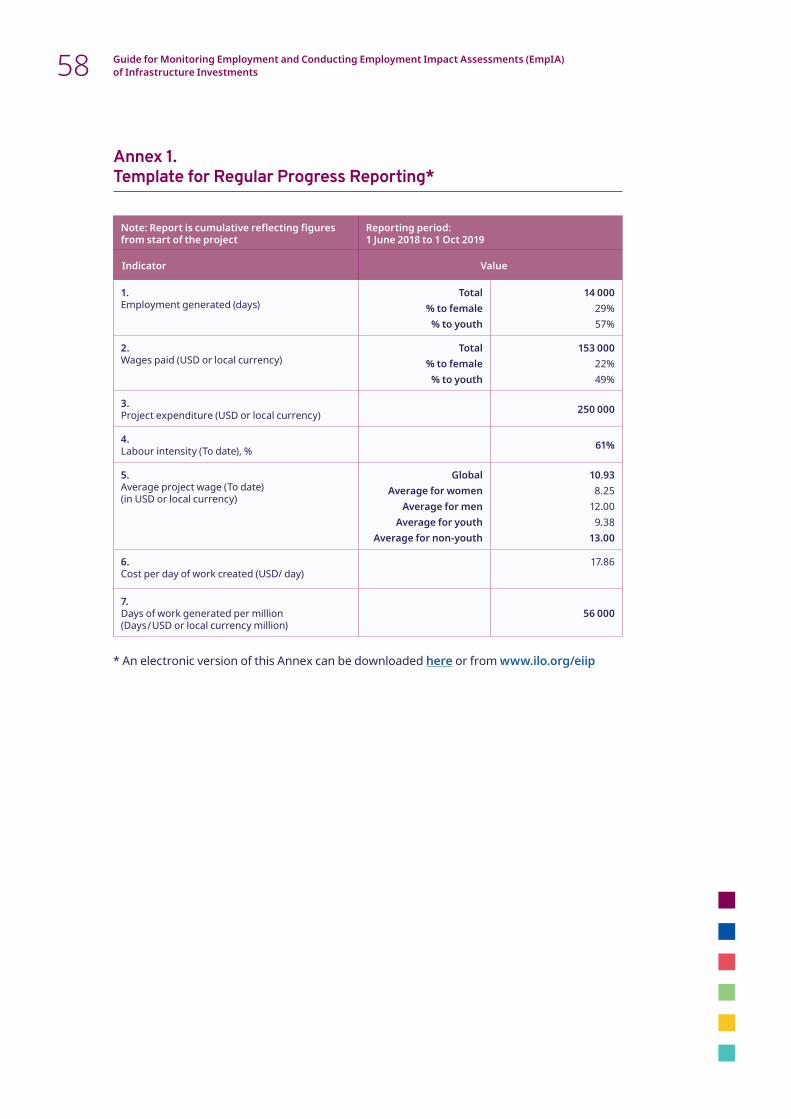
Annex 1. Template for Regular Progress Reporting*
Note: Report is cumulative reflecting figures from start of the project
Reporting period: 1 June 2018 to 1 Oct 2019
Indicator Value
1. Employment generated (days)
Total% to female
% to youth
14 00029%57%
2. Wages paid (USD or local currency)
Total% to female
% to youth
153 00022%49%
3. Project expenditure (USD or local currency) 250 000
4. Labour intensity (To date), % 61%
5. Average project wage (To date) (in USD or local currency)
GlobalAverage for women
Average for menAverage for youth
Average for non-youth
10.938.25
12.009.38
13.00
6. Cost per day of work created (USD/ day)
17.86
7. Days of work generated per million (Days / USD or local currency million)
56 000
* An electronic version of this Annex can be downloaded here or from www.ilo.org/eiip
Guide for Monitoring Employment and Conducting Employment Impact Assessments (EmpIA) of Infrastructure Investments58

Annex 2. Template for Project Completion Report*
Note: Report is cumulative reflecting figures from start of the project
Reporting period: 1 June 2018 to 31 Dec 2019
Indicator Value
1. Employment generated (FTE)
Total% to male
% to female% to youth
% to non-youth(1FTE= 230 days)
16368%32%48%52%
2. Number of persons employed
Total% to male
% to female% to youth
% to non-youth
390 72%28%54%46%
3. Wages paid (USD)
Total% to male
% to female% to youth
% to non-youth
365 00070%30%45%55%
4. Project expenditure (FINAL) (USD) 900 000
5. Labour intensity (FINAL), % 41%
6. Average project wage (USD/day)
GlobalAverage for women
Average for menAverage for youth
Average for non-youth
9.7310.00
9.179.17
10.26
7. Average duration of employment (days)
GlobalAverage for women
Average for menAverage for youth
Average for non-youth
9691
10986
108
8. Average income per worker (USD/worker)
GlobalAverage for women
Average for menAverage for youth
Average for non-youth
936911
1 000786
1 111
9. Cost per FTE created (USD/ FTE) 5 520
10. FTEs generated per million (FTE/ USD million 181
* An electronic version of this Annex can be downloaded here or from www.ilo.org/eiip
59Annexes

Annex 3. Methodology for disaggregating the construction sector account
This Annex is complementary to Unit 4 of this Guide. It also refers to Units 2 and 3 of the Assessing the effects of Trade on Employment: An Assessment Toolkit, which is another Strengthen Project publication and can be accessed here.
A3.1 An overview of the approachMuch of the existing social accounting matrix (SAM) based guidance on measuring employment effects are not specific to a particular type of infrastructure investment. In this context, the employment effects of infrastructure investments are assessed using employment multipliers which are computed using the construction account of the SAM and the Employment Output ratios for the economy. While there are already well documented limitations in using this approach estimate employment effects, in the case of specific infrastructure investments, this approach has further limitations. These limitations are mainly associated with the fact that the key parameters that influence the employment estimates of such specific investments, namely the value and composition of the multiplier and the employment-output ratio, may differ significantly from the values obtained when using construction sector averages. The proposed approach is an adjustment to the existing SAM based methodology and allows for deriving multipliers and employment output ratios that reflect the particular characteristics of the infrastructure investment in question.
In a nutshell, the approach involves creating a sub account for the infrastructure investment under study as a subaccount of the construction sector of the SAM. The construction account of the SAM is split into two accounts: a sub account reflecting the characteristics of the investment in questions and rest of construction sector which contains the remaining activities of the sector. Once the sub account is created in the SAM, the multipliers of the sub account can be computed using the conventional SAM multiplier analysis. It is a relatively simple method meant to improve estimates when using a SAM. It is used because of its relative simplicity and can be done when a recent SAM and employment data is available. It remains an estimation- and the results should be interpreted as such. All the assumptions and limitations of doing such a multiplier analysis as presented in Unit 4 still apply.
Tables A3.1 (a & b) presents an overview of the disaggregated SAM which we will use to analyze the employment effects of infrastructure investment. Table A3.1 (a) presents how the inputs of the infrastructure project are inserted into the SAM. This is done be adding a column as highlighted in grey. Table A3.1(b) shows how the outputs of the project are integrated be adding a row.
Guide for Monitoring Employment and Conducting Employment Impact Assessments (EmpIA) of Infrastructure Investments60
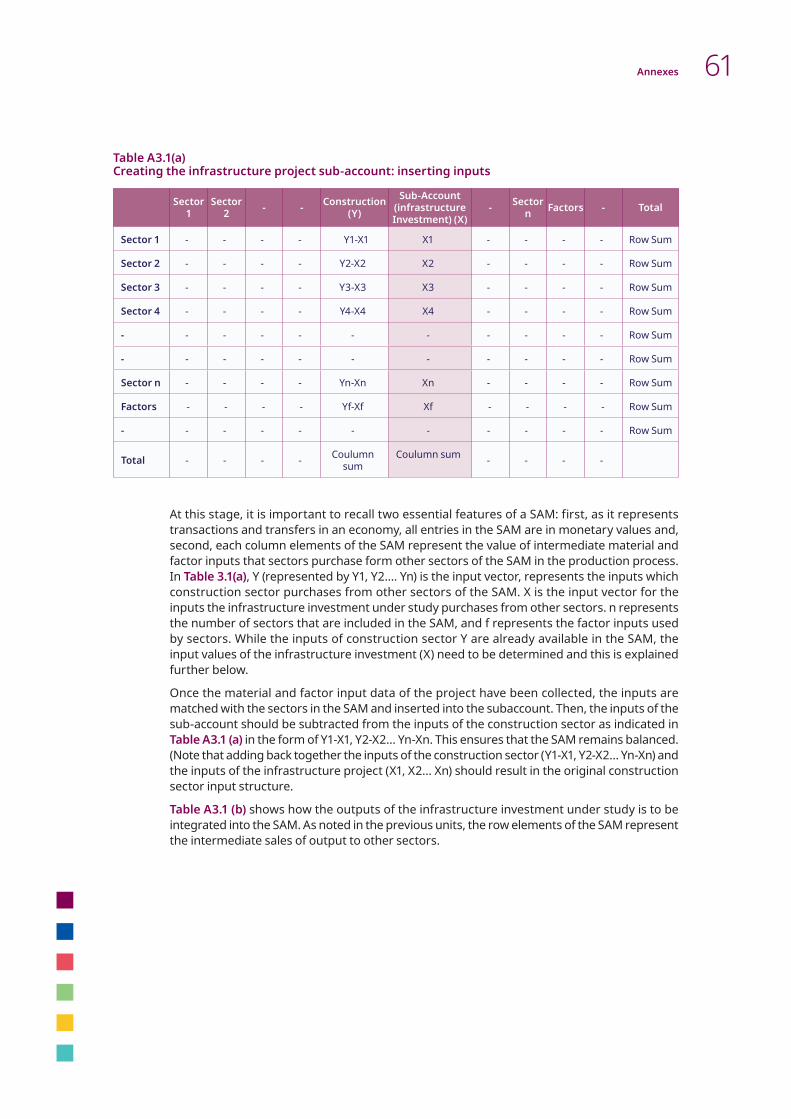
Table A3.1(a) Creating the infrastructure project sub-account: inserting inputs
Sector 1
Sector 2 - - Construction
(Y)
Sub-Account (infrastructure Investment) (X)
- Sector n Factors - Total
Sector 1 - - - - Y1-X1 X1 - - - - Row Sum
Sector 2 - - - - Y2-X2 X2 - - - - Row Sum
Sector 3 - - - - Y3-X3 X3 - - - - Row Sum
Sector 4 - - - - Y4-X4 X4 - - - - Row Sum
- - - - - - - - - - - Row Sum
- - - - - - - - - - - Row Sum
Sector n - - - - Yn-Xn Xn - - - - Row Sum
Factors - - - - Yf-Xf Xf - - - - Row Sum
- - - - - - - - - - - Row Sum
Total - - - - Coulumn sum
Coulumn sum - - - -
At this stage, it is important to recall two essential features of a SAM: first, as it represents transactions and transfers in an economy, all entries in the SAM are in monetary values and, second, each column elements of the SAM represent the value of intermediate material and factor inputs that sectors purchase form other sectors of the SAM in the production process. In Table 3.1(a), Y (represented by Y1, Y2…. Yn) is the input vector, represents the inputs which construction sector purchases from other sectors of the SAM. X is the input vector for the inputs the infrastructure investment under study purchases from other sectors. n represents the number of sectors that are included in the SAM, and f represents the factor inputs used by sectors. While the inputs of construction sector Y are already available in the SAM, the input values of the infrastructure investment (X) need to be determined and this is explained further below.
Once the material and factor input data of the project have been collected, the inputs are matched with the sectors in the SAM and inserted into the subaccount. Then, the inputs of the sub-account should be subtracted from the inputs of the construction sector as indicated in Table A3.1 (a) in the form of Y1-X1, Y2-X2… Yn-Xn. This ensures that the SAM remains balanced. (Note that adding back together the inputs of the construction sector (Y1-X1, Y2-X2… Yn-Xn) and the inputs of the infrastructure project (X1, X2… Xn) should result in the original construction sector input structure.
Table A3.1 (b) shows how the outputs of the infrastructure investment under study is to be integrated into the SAM. As noted in the previous units, the row elements of the SAM represent the intermediate sales of output to other sectors.
61Annexes
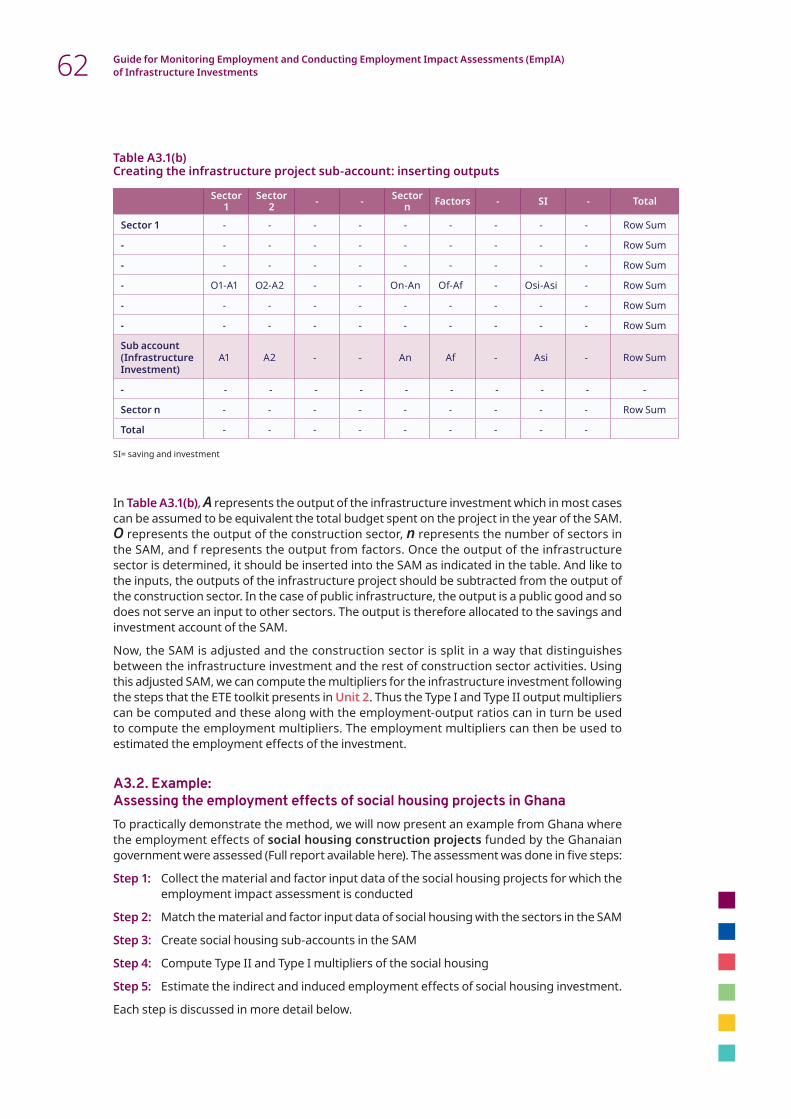
Table A3.1(b) Creating the infrastructure project sub-account: inserting outputs
Sector 1
Sector 2 - - Sector
n Factors - SI - Total
Sector 1 - - - - - - - - - Row Sum
- - - - - - - - - - Row Sum
- - - - - - - - - - Row Sum
- O1-A1 O2-A2 - - On-An Of-Af - Osi-Asi - Row Sum
- - - - - - - - - - Row Sum
- - - - - - - - - - Row Sum
Sub account (Infrastructure Investment)
A1 A2 - - An Af - Asi - Row Sum
- - - - - - - - - - -
Sector n - - - - - - - - - Row Sum
Total - - - - - - - - -
SI= saving and investment
In Table A3.1(b), A represents the output of the infrastructure investment which in most cases can be assumed to be equivalent the total budget spent on the project in the year of the SAM. O represents the output of the construction sector, n represents the number of sectors in the SAM, and f represents the output from factors. Once the output of the infrastructure sector is determined, it should be inserted into the SAM as indicated in the table. And like to the inputs, the outputs of the infrastructure project should be subtracted from the output of the construction sector. In the case of public infrastructure, the output is a public good and so does not serve an input to other sectors. The output is therefore allocated to the savings and investment account of the SAM.
Now, the SAM is adjusted and the construction sector is split in a way that distinguishes between the infrastructure investment and the rest of construction sector activities. Using this adjusted SAM, we can compute the multipliers for the infrastructure investment following the steps that the ETE toolkit presents in Unit 2. Thus the Type I and Type II output multipliers can be computed and these along with the employment-output ratios can in turn be used to compute the employment multipliers. The employment multipliers can then be used to estimated the employment effects of the investment.
A3.2. Example: Assessing the employment effects of social housing projects in GhanaTo practically demonstrate the method, we will now present an example from Ghana where the employment effects of social housing construction projects funded by the Ghanaian government were assessed (Full report available here). The assessment was done in five steps:
Step 1: Collect the material and factor input data of the social housing projects for which the employment impact assessment is conducted
Step 2: Match the material and factor input data of social housing with the sectors in the SAM
Step 3: Create social housing sub-accounts in the SAM
Step 4: Compute Type II and Type I multipliers of the social housing
Step 5: Estimate the indirect and induced employment effects of social housing investment.
Each step is discussed in more detail below.
Guide for Monitoring Employment and Conducting Employment Impact Assessments (EmpIA) of Infrastructure Investments62
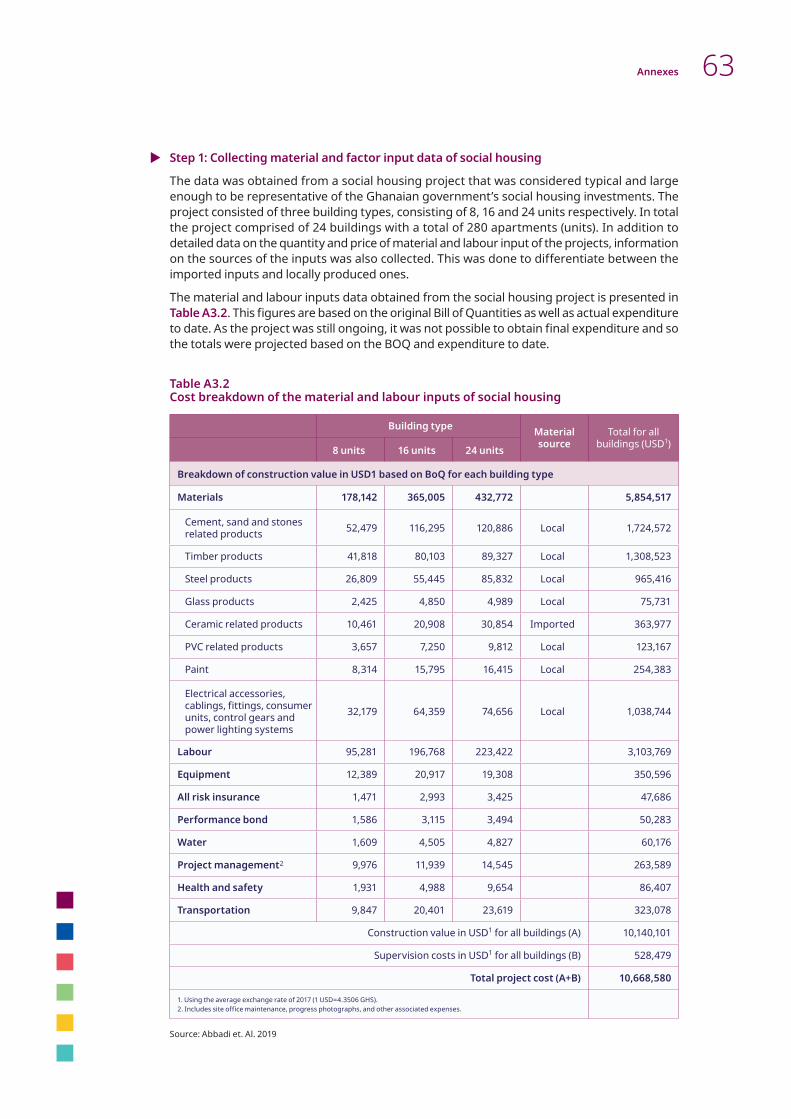
Step 1: Collecting material and factor input data of social housing
The data was obtained from a social housing project that was considered typical and large enough to be representative of the Ghanaian government’s social housing investments. The project consisted of three building types, consisting of 8, 16 and 24 units respectively. In total the project comprised of 24 buildings with a total of 280 apartments (units). In addition to detailed data on the quantity and price of material and labour input of the projects, information on the sources of the inputs was also collected. This was done to differentiate between the imported inputs and locally produced ones.
The material and labour inputs data obtained from the social housing project is presented in Table A3.2. This figures are based on the original Bill of Quantities as well as actual expenditure to date. As the project was still ongoing, it was not possible to obtain final expenditure and so the totals were projected based on the BOQ and expenditure to date.
Table A3.2 Cost breakdown of the material and labour inputs of social housing
Building type Material source
Total for all buildings (USD1)8 units 16 units 24 units
Breakdown of construction value in USD1 based on BoQ for each building type
Materials 178,142 365,005 432,772 5,854,517
Cement, sand and stones related products 52,479 116,295 120,886 Local 1,724,572
Timber products 41,818 80,103 89,327 Local 1,308,523
Steel products 26,809 55,445 85,832 Local 965,416
Glass products 2,425 4,850 4,989 Local 75,731
Ceramic related products 10,461 20,908 30,854 Imported 363,977
PVC related products 3,657 7,250 9,812 Local 123,167
Paint 8,314 15,795 16,415 Local 254,383
Electrical accessories, cablings, fittings, consumer units, control gears and power lighting systems
32,179 64,359 74,656 Local 1,038,744
Labour 95,281 196,768 223,422 3,103,769
Equipment 12,389 20,917 19,308 350,596
All risk insurance 1,471 2,993 3,425 47,686
Performance bond 1,586 3,115 3,494 50,283
Water 1,609 4,505 4,827 60,176
Project management2 9,976 11,939 14,545 263,589
Health and safety 1,931 4,988 9,654 86,407
Transportation 9,847 20,401 23,619 323,078
Construction value in USD1 for all buildings (A) 10,140,101
Supervision costs in USD1 for all buildings (B) 528,479
Total project cost (A+B) 10,668,580
1. Using the average exchange rate of 2017 (1 USD=4.3506 GHS).2. Includes site office maintenance, progress photographs, and other associated expenses.
Source: Abbadi et. Al. 2019
63Annexes

Step 2: Matching data to sector and factor accounts of the SAM
The material and labour inputs data of the projects as collected by the survey should then be matched to the SAM sectors in order to be able to insert the inputs into the SAM. This has to be done using the International Standard Industrial Classification (ISIC) guidance and in consultation with local experts. In principle, the inputs which social housing buys should be matched with and subtracted from the inputs that the construction sector buys in the SAM. This is with the assumption that social housing investments are already included in the construction sector of the SAM. Table A3.3 presents the SAM sectors which provide inputs to the construction sector. The total input spending of the construction sector is 28.3 billion GHS which is distributed among nine sectors that provide material inputs to the construction sector and the two factor accounts: labour and capital.
Table A3.3 Sectors and factors providing inputs to the construction sector in the SAM
Description Codes in the SAM Construction
Mining comin - - 332 -
Wood and paper cwood - - 1529 -
Petroleum cpetr - - 158 -
Chemicals cchem - - 307 -
Non-metal minerals cnmet - - 1,849 -
Metals and metal products cmetl - - 3,292 -
Machinery and equipment cmach - - 173 -
Construction ccons - - 25 -
Transportation and storage ctran - - 23 -
Labour flab - - 2,584 -
Capital fcap-n - - 18,097
Total 28,369.55
Source: 2015 Ghana SAM
The inputs of social housing were then matched with the sectors which provide inputs to the construction sector. This is presented in Table A3.4 below. The last column of the table shows how the inputs of social housing were matched with the sectors in the 2015 SAM of Ghana. As indicated, material inputs such as cement, sand, stone and related products were allocated into non-metal minerals account of the SAM. Steel products and electronic accessories allocated in metal and metal related products account, timber products were also allocated into wood and paper products account of the SAM. Paints were also allocated to the chemicals sector.
It should be noted that allocating the inputs of the infrastructure investment into the sectors in the SAM is not always straightforward. One difficulty is that it may be found that infrastructure investment buys inputs a sectors that the construction sector in the SAM does not. For instance, in this example, it was found that social housing buys inputs that should be allocated to sectors such as financial services and water supply and sewage. However, the construction account is the SAM does not buy inputs from these sectors, so allocating the inputs to those sectors would unbalance the SAM.
There are several options to address this and this will require some judgment on the side of those conducing the assessment. One is to consult with the institution which constructed the SAM on how the inputs should best be matched. If the input spending of the infrastructure investment on those sectors is not very large and will not to distort the result the analysis, it
Guide for Monitoring Employment and Conducting Employment Impact Assessments (EmpIA) of Infrastructure Investments64

may also be decided not to include them. Another option is to allocate them to another sector that is closely related18.
Looking at the factor inputs, the labour cost of the project was allocated into the labour account of the SAM. It is important to mention that in many SAMs the labour account is disaggregated by locality and skills level of workers. Thus, when the input data is collected for the infrastructure projects, the survey tools should be structured in such a way which allows the labour inputs to be allocated to the labour categories of the SAM. However, if such a breakdown of labour data is unavailable from projects, the labour categories in the SAM can be aggregated into a single labour account. Any profits should be allocated to the factor capital account of the SAM.
A final note is to made with regards to the exchange rates and dates for the SAM. While the project was implemented over 2017, the SAM is for 2015 and no SAM was available for 2017. As the structure of the economy, and in particular the proportion of the various inputs, would not have changed much over this period, we expect the multipliers not to have changed much either. However the exchange rate in 2015 was 3.75, significantly lower than the rate of 4.36 of 2017. As no SAM is available for 2017, it was decided to use the 2015 exchange rate to simulate the investment and so the investment of USD 10,668 was converted into GHS at this rate.
Table A3.4 Matching the social housing input with the sectors in the SAM
Material and Labour inputs
Input cost for all buildings
(USD)
Input cost for all buildings
(GHS)
Input cost for all buildings (in
millions of GHS)*Best fitting sector
in the SAM
Cement, sand and stones related products 1,724,572 6,467,145 6.47 Non-metal minerals
Timber products 1,308,523 4,906,961 4.91 Wood and paper
Steel products 965,416 3,620,310 3.62 Metals and metal products
Glass products 75,731 283,991 0.28 Non-metal minerals
Ceramic related products 363,977 1,364,914 1.36 Non-metal minerals
PVC related products (Imported) 123,167 461,876 0.46 Non-metal minerals
Paint 254,383 953,936 0.95 Chemicals and petroleum
Electrical accessories, 1,038,744 3,895,290 3.90 Metals and metal products
Labour 3,103,769 11,639,134 11.64 Labour account
Equipment 350,596 1,314,735 1.31 Machinery and equipment
All risk insurance 47,686 178,823 0.18 Finance and insurance
Performance bond 50,283 188,561 0.19 Finance and insurance
Water 60,176 225,660 0.23 Water supply and sewage
Project management 263,589 988,459 0.99 Construction
Health and safety equipment 86,407 324,026 0.32 Machinery and equipment
Transportation 323,078 1,211,543 1.21 Transportation and storage
Project management (Supervision) costs in USD for all buildings (B)
528,479 1,981,796 1.98 Construction
Total 10,668,576 40,007,160 40.01
* The 2015 Ghana SAM is in millions of GHS and the inputs costs of social housing were also converted accordingly at the 2015 exchange rate of GHS 3.75 per USD.
Source: Abbadi et. al. 2019
18 Another option would be to include all the sectors and update and rebalance the SAM. This can be quite an elaborate exercise however and may significantly increase the scope and expertise required to conduct the assignment.
65Annexes

Step 3: Inserting the allocated inputs and output data of social housing into the SAM
Once the social housing inputs are collected and matched with the sectors in the SAM, the next step is inserting the input costs into the SAM. To do so, first, the input costs collected from the projects should be converted to the currency and unit used in the SAM. Transactions in the 2015 Ghana SAM are presented in millions of GHS, so the inputs of social housing should be converted accordingly.
Social housing sub-account was subsequently created in the SAM as indicated in Table 3.5. The material and labour inputs of social housing were inserted according to the sectors they were allocated to, and the inputs were subtracted from the input costs of the construction sector. For example, the construction sector purchases GHS 1,529 million worth of inputs from wood and paper and the amount that social housing projects buy from the same sector is estimated to be GHS 4.9 million GHS, so this 4.9 million was subtracted from what construction sector spends on this sector. The same was done for all sectors from which the construction sector and social housing purchase their inputs including labour inputs.
Table A3.5 Creating the new social housing subaccount and inserting the inputs costs
Description Codes in the SAM Electricity Water
supply Construction Social housing
Wholesale trade
Mining comin - - 331.60 - -
Wood and paper cwood - - 1,524.30 4.91 -
Petroleum cpetr - - 157.90 - -
Chemicals cchem - - 306.00 0.95 -
Non-metal minerals cnmet - - 1,840.50 9.03 -
Metals and metal products cmetl - - 3,284.90 7.50 -
Machinery and equipment cmach - - 171.80 1.63 -
Construction ccons - - 22.10 2.99 -
Transportation and storage ctran - - 21.49 1.21 -
Labour flab - - 2,572.50 11.64 -
Capital fcap-n - - 18,097.20 - -
Total - - 28,330.19 39.51 -
Inserting the outputs of social housing into the SAM
The outputs of the social housing were allocated to the saving and investment (S-I) account of the SAM. Table A3.6 (a) presents the output of construction which is allocated into the Savings and Investment (S-I) account of the current SAM. GHS 26.3 billion or 93 percent of the output of construction is allocated into the S-I account of the SAM. Table A4.6 (b), shows how the output of social housing was included into the SAM. All the output of social housing was allocated into the S-I account and the same amount was subtracted from the construction output allocated to the same account.
Guide for Monitoring Employment and Conducting Employment Impact Assessments (EmpIA) of Infrastructure Investments66

Table A3.6 (a) The output of the construction sector allocated to saving and investment
Description mtax stax s-i dstk row total
Water supply - - - - - -
Construction - - 26,394 - - 28,370
Wholesale trade - - - - - -
Source: The 2015 Ghana SAM
Table A3.6 (b) Creating the new social housing subaccount and inserting outputs
Description mtax stax s-i dstk row total
Water supply - - - - - -
Construction - - 26,356 - - 28,330
Social housing - - 39.51 - - 39.51
Wholesale trade - - - - - -
Step 4: Computing Type I and Type II multipliers of the social housing
Once the inputs and outputs are integrated into the SAM, the next step is computing the Type I and Type II output multipliers of social housing using this amended SAM. Type I multipliers only capture the direct and indirect effects and the Type II output multipliers capture the direct, indirect and induced effects. From this it also follows that the difference between the two multipliers captures the induced effect. The method to derive these multipliers is well established and can be summarised as follows:
X 1. Compute the technical coefficient (A matrix) of the SAM. To derive the A matrix, the values of each sector of the SAM should be divided by the total sum of that column.
X 2. Create an identity matrix (the I matrix). The identity matrix of the SAM has ones on its main diagonal elements and zeros elsewhere.
X 3. Subtract the A matrix from the identity matrix (I – A).
X 4. Derive matrix of multipliers. The SAM multiplier matrix is the inverse of the (I – A) matrix. Which is represented by (I – A) –1
A detailed explanation of all the steps for deriving these multipliers presented in Unit 2 of the ETE toolkit but is also widely available in literature of IOT and SAM19.
19 The method for calculating these multipliers, was developed by W. Leontief for which he won the Nobel Prize in 1973 and remains widely used. Other references explaining the method are XXXX (Text book) which also explains the theory behind the method and Social accounting matrices and multiplier analysis (IFPRI 2009) which provides more practical guidance much like the ETE Toolkit.
67Annexes

The multiplier refers to an economic concept that shows how much or by how many times the final output of a given sector would increase if some extra investment/spending is done in other sectors. It also provides an indication of how an increase in one area, leads to increases in other areas.Input-output (Type I) multipliers are computed from the intermediated demand table of the SAM and capture the direct and indirect production effects only. They estimate the impact on the supply chain resulting from a producer of a certain product increasing their output to meet additional demand. However, Type I multipliers underestimate the effect on the economy as they do not estimate the induced effects.SAM multipliers (Type II) are calculated using the entire SAM and in addition to the direct and indirect effects, they include the induced effects based on how households spend the income they earn from the direct and indirect effects. Multipliers computed using the SAM are, therefore, tend to be larger than multipliers computed using the input-output table.
The first step to compute multipliers is deriving the technical coefficients (matrix A) of the sectors in the SAM including the newly integrated social housing subsector. Technical coefficients (Matrix A) show the proportional value of inputs purchased by a given sector to produce one unit of output in that sector. And each entry in the matrix A is calculated by dividing the corresponding cell of the SAM by its column total.
Note that when deriving the technical coefficient (matrix A), it is important to identify the endogenous accounts and exogenous accounts of the SAM. In most SAM framework, it has been customary to regard transactions in the government account, tax, the saving and investment account, and the rest of the world as exogenous accounts. Thus, all values in these accounts of the Ghana SAM were made exogenous. In excel, we can make account exogenous by simply inserting zero in all cells of the matrix A of these accounts as indicated in Table A3.7. Table A3.7 presents the technical coefficients (matrix A) of social housing and for comparison, the matrix A of the construction sector is also presented.
Table A3.7 The technical coefficient of social housing and construction sector
Description Endogenous accounts Exogenous accounts
- Constru- ction
Social housing - gov mtax stax s-i dstk row
Mining - 0.012 0 - 0 0 0 0 0 0
Wood and paper - 0.054 0.128 - 0 0 0 0 0 0
Petroleum - 0.006 0 - 0 0 0 0 0 0
Chemicals - 0.011 0.025 - 0 0 0 0 0 0
Non-metal minerals - 0.065 0.224 - 0 0 0 0 0 0
Metals and metal products - 0.116 0.197 - 0 0 0 0 0 0
Machinery and equipment - 0.006 0.043 - 0 0 0 0 0 0
Construction 0.001 0.078 - 0 0 0 0 0 0
Transportation and storage - 0.001 0 - 0 0 0 0 0 0
Labour - 0.091 0.305 - 0 0 0 0 0 0
Capital - 0.639 0 - 0 0 0 0 0 0
Total 1 1 1 1 0 0 0 0 0 0
Source: computed by authors
X Box A1: Description of multipliers
Guide for Monitoring Employment and Conducting Employment Impact Assessments (EmpIA) of Infrastructure Investments68

The technical coefficients of social housing presented can be interpreted as follows: out of every 1 GHS spent by social housing sector on the inputs, 12 percent of the inputs spending will be on wood and paper products; 22 percent will be spent on non-metal minerals; 19 percent on the metals and metal products. Social housing spends a significant amount its of inputs cost on labour which is around 30 percent of its total input spending.
There is a significant difference in the input spending pattern of the construction sector as a whole compared to what was found for social housing alone. For instance, while the construction sector spends only 7 and 5 percent of its input expenditure on non-metal minerals and wood products respectively, whereas social housing spends 22 and 12 percent of its input spending on non-metal minerals and wood products respectively. Looking at the factor inputs, while the construction sector spends 9 percent of its input spending on labour inputs, social housing spends 30 percent of its input spending on labour.
The biggest difference is that the SAM also shows 63 percent of construction spending is allocated to the factor capital inputs. This seems very high, and probably reflects a common practice in the construction of SAMs of allocating the residual output of the sector to the capital account20. These factor payments theoretically represent profit share, purchases of land by the construction sector, as well as the cost of capital associated with the high-interest rates in Ghana. For the social housing, the building was done on government land which was thus free to government. from the data collected for the project, the profit margins appeared very low and were assumed to be zero21.
The resulting Type I and Type II multipliers for social housing and the construction sector are presented in Table A3.8.
20 It also demonstrates one limitation of using the SAM in contexts where these are constructed on the basis of limited data sets.21 As the project was still ongoing and the data provided by the contractor on this was limited the profit margin could not be deducted. Because of some delays encountered and what to the assessment team seemed to have been an underestimation of the labour costs, there were strong indications that the contract would be making a loss on the project. For these reasons the profit margin was taken to be zero.
69Annexes

Table A3.8 Type I and Type II multipliers of social housing and the construction sector
Social Housing Construction
Sectors Type II Multipliers
Type I Multipliers
Type II Multipliers
Type I Multipliers
Agriculture, forestry and fishing 0.23 0.12 0.23 0.05
Mining and quarrying 0.05 0.09 0.06 0.05
Agro-processing 0.14 0.01 0.17 0.00
Textile and clothing 0.04 0.00 0.05 0.00
Wood and paper 0.15 0.17 0.07 0.07
Petroleum and Chemicals 0.16 0.18 0.16 0.09
Non-metal minerals 0.27 0.39 0.08 0.11
Metals and metal products 0.23 0.33 0.14 0.18
Machinery and equipment 0.10 0.10 0.08 0.03
Other manufacturing 0.01 0.01 0.02 0.01
Electricity, gas and steam 0.05 0.05 0.06 0.02
Water supply and sewage 0.03 0.00 0.04 0.00
Social housing 1.00 1.00 - -
Construction 0.08 0.08 1.00 1.00
Wholesale and retail trade 0.13 0.01 0.12 0.01
Transportation and storage 0.15 0.02 0.15 0.01
Accommodation and food services 0.07 0.00 0.09 0.00
Information and communication 0.04 0.01 0.05 0.00
Finance and insurance 0.04 0.02 0.04 0.01
Real estate activities 0.03 0.01 0.03 0.00
Business services 0.03 0.03 0.04 0.02
Public administration 0.01 0.00 0.01 0.00
Education 0.03 0.00 0.04 0.00
Health and social work 0.01 0.00 0.01 0.00
Other services 0.05 0.00 0.06 0.00
Total 3.13 2.63 2.78 1.66
Source: Abbadi et. al. 2019
The table shows that the Type I and Type II multipliers for social housing were found to be 2.63 and 3.13 respectively. And the difference between the two captures the induced effect which is 0.5. In comparison, the Type I and Type II multipliers for the construction sector as a whole were found to be 1.66 and 2.78 respectively. The multipliers are composed of contributions from the different sectors and the sectoral breakdown of the multipliers is also shown.
Guide for Monitoring Employment and Conducting Employment Impact Assessments (EmpIA) of Infrastructure Investments70

Step 5: Estimating the employment effects of social housing investment
To estimate the employment effects of the social housing project first, we need to calculate the employment multipliers of social housing. This step is again already captured in detail in Unit 3 of the ETE Toolkit it is thus just summarized here.
X The employment multiplier refers to the number of jobs created as a result of one million GHS investment made in social housing. They can be computed by multiplying the output multipliers already derived by the employment to outputs ratio (EO ratios):
Employment Multiplier = Output Multiplier * EO ratios (1)
X Employment-output ratio (EO ratios) measure the number of workers needed to produce one unit worth of sectoral output for a specified year – hence, how much labour is used per unit of output. Thus, the ratio is computed by dividing the total employment in a given sector by the total output of the same sector.
EO ratio =
(Total employment) (Total output) (2)
Employment-output ratios for Ghana
The sectoral employment data as presented in full-time equivalents (FTEs) used in this analysis are based on the Labour Force Survey 201522. The sectoral output, was obtained from the Ghana 2015 SAM. Using equation (2), the employment-output ratio for Ghana were calculated and presented in Table A4.10.
22 As presented in the 2015 Labour Force Report (GSS 2016) data which is available from the Ghana Statistical Services (GSS).
71Annexes

Table A3.9 Employment-output ratios for Ghana in each sector
Sectors Sectoral
employment in FTEs (LFS 2015)
Sectoral output in million GHS (2015)
Employment-Output ratios (FTEs per
million GHS)
Agriculture, forestry and fishing 3 213 166 29 956 107
Mining and quarrying 56 727 30 803 2
Agro-processing 601 828 9 598 63
Other food processing 1 128 892 1
Textile and clothing 54 791 1 155 47
Wood and paper 76 352 3 516 22
Petroleum and Chemicals 15 996 10 351 2
Non-metal minerals 28 731 1 205 24
Metals and metal products 21 130 1 265 17
Other manufacturing 9 473 355 27
Electricity, gas and steam 11 998 8 526 1
Water supply and sewage 28 846 4 531 6
Construction 281 497 28 370 10
Social housing 1 197 40 30
Wholesale and retail trade 2 181 023 20 067 109
Transportation and storage 330 794 22 119 15
Accommodation and food services 460 557 11 215 41
Information and communication 49 491 8 179 6
Finance and insurance 87 071 7 890 11
Real estate activities 6 753 6 068 1
Business services 154 853 10 745 14
Public administration 240 864 14 831 16
Education 450 778 9 039 50
Health and social work 282 248 3 576 79
Other services 372 031 5 932 63 *Total FTEs and output data for social housing are computed from project data
Source: Labour Force Survey (2015) and Social Accounting Matrix (2015)
It is important to note the large differences in employment output ratios between sectors in Ghana, and in particular to note the low apparent productivity of the agriculture sector (107 FTEs per 1 million GH₵ output) and wholesale and retail (109 FTEs per 1 million GH₵ output) compared to other sectors. This low productivity in agriculture and wholesale and retail, is associated with the high levels of informality of these sectors and this will have important implications for estimating employment effects because any increase in the output of these sectors will result in a large increase in the estimated number of additional labour required.
Based on the findings form the project, the employment to output ratio for social housing differed from that of the construction sector as a whole. For the project, it was found that the total labour input was 1197 FTEs and the value of the total output was USD 10.67 million. This implies an employment output ratio of 112 FTEs/ USD million, which is equivalent to approximately 29 FTE / GHS million. This is substantially higher than the 10 FTE/ GHS million for the construction sector as a whole as obtained from the national LFS data.
Guide for Monitoring Employment and Conducting Employment Impact Assessments (EmpIA) of Infrastructure Investments72

Estimating employment multipliers and employment effects
Once the output multipliers and EO ratios are available the employment multipliers can be calculated using equation (1). These results are presented in Table A3.10. The Type II and Type I multipliers of social housing are presented in column (2) and column (3) respectively and the EO ratios are presented in column (4) of the table. The total employment multipliers are computed by multiplying each multiplier in column (2) by their respective EO ratios in column (4). The indirect effects are also computed by multiplying each element in column (4) of the table by the EO ratios. The total employment multipliers of social housing are presented in column (5) and estimated to be 106 FTEs and the indirect and induced components of these multipliers in columns (6) and (7). This implies that every 1 million investment made in social housing, 106 FTEs jobs would be created in the Ghanaian economy. Of which 36 FTEs would be indirect effects, 41 FTEs would be induced effects and the remaining 29 FTEs would be direct effects in social housing itself.
Table A3.10 Employment multipliers of social housing
2 3 4 5 6 7Social Housing
Multipliers Employment multipliers
Sectors Type II Multipliers
Type I Multipliers EO ratios Total Indirect Induced
Agriculture, forestry and fishing 0.23 0.12 107 24.6 12.8 11.77
Mining and quarrying 0.05 0.09 2 0.1 0.2 0.00
Agro-processing 0.14 0.01 63 8.8 0.6 8.19
Textile and clothing 0.04 0.00 47 1.9 0.0 1.88
Wood and paper 0.15 0.17 22 3.3 3.7 0.00
Petroleum and Chemicals 0.16 0.18 2 0.3 0.4 0.00
Non-metal minerals 0.27 0.39 24 6.5 9.4 0.00
Metals and metal products 0.23 0.33 17 3.9 5.6 0.00
Machinery and equipment 0.10 0.10 - - - -
Other manufacturing 0.01 0.01 27 0.3 0.3 0.00
Electricity, gas and steam 0.05 0.05 1 0.1 0.1 0.00
Water supply and sewage 0.03 0.00 6 0.2 0.0 0.18
Social housing 1.00 1.00 29 29.0 0.0 0.00
Construction 0.08 0.08 10 0.8 0.8 0.00
Wholesale and retail trade 0.13 0.01 109 14.2 1.1 13.08
Transportation and storage 0.15 0.02 15 2.3 0.3 1.95
Accommodation and food services 0.07 0.00 41 2.9 0.0 2.87
Information and communication 0.04 0.01 6 0.2 0.1 0.18
Finance and insurance 0.04 0.02 11 0.4 0.2 0.22
Real estate activities 0.03 0.01 1 0.0 0.0 0.02
Business services 0.03 0.03 14 0.4 0.4 0.00
Public administration 0.01 0.00 16 0.2 0.0 0.16
Education 0.03 0.00 50 1.5 0.0 1.50
Health and social work 0.01 0.00 79 0.8 0.0 0.79
Other services 0.05 0.00 63 3.2 0.0 3.15
Total 3.13 2.63 - 106 36 46
73Annexes
From employment multipliers to employment effects
X Using the employment multipliers and the spending on the project (x), the indirect and induced employment effects can be estimated using the equation:
Employment effects= Employment Multipliers* x
X For the project which had a value of GHS 40 million, the total employment effect was thus 106 * 40 = 4,240 FTEs. Of this the indirect effect is 36 * 40 = 1,440 FTEs and the induced effect is 46 * 40= 1,840 FTEs.
It is assumed that the project reviewed was typical of the government’s social housing portfolio, the same approach can be used to estimate the employment effect of the entire portfolio. According to the Ministry of Works and Housing, between 2018 and 2020 the government plans to invest an average of GHS 1,570 million in social housing construction per year. If we treat this as an exogenous shock(x) estimates of the employment effects then can be computed using the following equation:
Based on this the total employment effects of the social housing investment by the Ghanaian government is estimated at 174,000 FTEs. Of these, around 45,500 FTEs would be direct jobs created in social housing, around 56,500 FTEs would be indirect jobs created in the sectors which supply inputs to social housing, and 72,000 FTEs induced jobs. These results and the breakdown by sector are presented in Table A3.11.
It should be noted however that a large share (35%) of the total estimated FTEs are created in two sectors, namely agriculture and wholesale and retail trade. As was mentioned earlier the employment output ratio of these two sectors is very low. This is due to the low productivity and these two sectors. It is therefore also clear whether these two sectors would respond to increased demand by increasing employment, or by also increasing productivity. For these reasons, the employment estimates from these two sectors were not included in the overall estimates in the final report as there was a high risk these were inflating the estimate and creating an impression that the employment effects would be much greater than are probable.
Guide for Monitoring Employment and Conducting Employment Impact Assessments (EmpIA) of Infrastructure Investments74

Table A3.11 Estimated employment effects of social housing by sector and effect
Employment Multipliers Employment effects
Sectors Direct Indirect Induced Exogenous Shock Direct Indirect Induced Total
Agriculture, forestry and fishing 0 12.8 11.77 1570 0 20096 18479 38575
Mining and quarrying 0 0.2 0 0 0 314 0 314
Agro-processing 0 0.6 8.19 0 0 942 12858 13800
Textile and clothing 0 0 1.88 0 0 0 2952 2952
Wood and paper 0 3.7 0 0 0 5809 0 5809
Petroleum and Chemicals 0 0.4 0 0 0 628 0 628
Non-metal minerals 0 9.4 0 0 0 14758 0 14758
Metals and metal products 0 5.6 0 0 0 8792 0 8792
Machinery and equipment 0 0.3 0 0 0 471 0 471
Other manufacturing 0 0.1 0 0 0 157 0 157
Electricity, gas and steam 0 0 0.18 0 0 0 283 283
Water supply and sewage 0 0.8 0 0 0 1256 0 1256
Social housing 29 0 0 0 45530 0 0 45530
Construction 0 1.1 13.08 0 0 1727 20536 22263
Wholesale and retail trade 0 0.3 1.95 0 0 471 3062 3533
Transportation and storage 0 0 2.78 0 0 0 4506 4506Accommodation and food services 0 0.1 0.18 0 0 157 283 440
Information and communication 0 0.2 0.22 0 0 314 345 659
Finance and insurance 0 0 0.02 0 0 0 31 31
Real estate activities 0 0.4 0 0 0 628 0 628
Business services 0 0 0.16 0 0 0 251 251
Public administration 0 0 1.5 0 0 0 2355 2355
Education 0 0 0.79 0 0 0 1240 1240
Health and social work 0 0 3.15 0 0 0 4946 4946
Other services 29 36 45.85 1570 45530 56520 72127 174177
Total 3.13 2.63 - 106 36 46 46 46
Source: Abbadi et. al. 2019
75Annexes

Annex 4. Values of key indicators from different regions and for different investmentsAnnex 4a: Micro (Project) level indicators of selected projects*
* An electronic version of this Annex can be downloaded here or from www.ilo.org/eiip
Global region Country Project/Programme Infrastructure Type: Main Category
Sub category Project Details Technology Year of
studyCost (original
currency (millions) Currency Labour cost (original currency) Currency Cost (USD
millions)Labour cost
(USD millions)
MENA Morocco PNRR2 Transportation National Programme of Rural Roads, large scale project with many sub-projects (information for 71.13 km of roads included in the study) Equipment based 2015 88 MAD 10.4 MAD 9.0 1.1
MENA Morocco Solar Project (Ouarzazate) Energy Solar Energy plant in Ouarzazate, 500MW Plant Equipment based 2015 1000 USD 106 MAD 102.0 10.8
MENA Morocco Sanitation Oujda Sanitation Sanitation in Oujda, Sewage network, treatment plant and storm water drainage Equipment based 2015 437 MAD 49 MAD 44.6 5.0
MENA Morocco Sanitation Sebou Sanitation Sanitation in Sebou Basin, Infrastructure for collection and treatment in 17 urban centers Equipment based 2015 237 MAD 13 MAD 24.2 1.3
MENA Tunisia Priority Roads Transportation Urban Priority Roads, 12 sub-projects to reduce traffic congestion Equipment based 2015 41.9 Euro 5.96 Euro 45.7 6.5
MENA Tunisia Sousse Power Station Energy
Power station in Sousse, Construction and operation of dual-fuel power plant (This O&M figure is based on 150 full time staff for 25 years, plus 1.4 maintence staff per year for 25 years and the 63 staff on maintence contracts for 25 years).
Equipment based 2015 300 Euro 28.2 Euro 327.0 30.7
MENA Jordan Amman Ring Road Transportation Ring road in Amman, 41m four-lane highway Equipment based 2015 160 JOD 41 JOD 223.6 57.3
MENA Jordan Tafila Wind Farm Energy Windfarm in Tafilah, 117MW wind farm with 38 turbines Equipment based 2015 230 Euro N/A 250.7 N/A
MENA Egypt Giza Power Station Energy Power plant in Giza, 2,250MW power plant Equipment based 2015 651 USD 65 USD 651.0 65.0
MENA Egypt Power Transmission Energy Egypt Power Transmission, 10 transmission lines, 1 underground cable, 10 substations
and 22 transformers Equipment based 2015 49 USD 5.5 USD 49.0 5.5
MENA Egypt EPAP II Environment EPAPII, Pollution abatement in various industries in Alexandria and Greater Cairo governorates Equipment based 2015 86.5 USD 3.2 USD 86.5 3.2
Sub-Saharan Africa South Africa EPWP 1 BuildingsExpanded Public Works Program (EPWP) (1) - Programme intended to generate employment through labour-intensive methods but potential not fully exploited as indicated by labour intensity.
Equipment based 2011 13815 ZAR 359 ZAR 1945.8 50.6
Sub-Saharan Africa South Africa EPWP 1 Energy - Electricity Expanded Public Works Program (EPWP) (1) 2011 223 ZAR 51 ZAR 31.4 7.2
Sub-Saharan Africa South Africa EPWP 1Transportation - Roads (construction and maintenance)
Expanded Public Works Program (EPWP) (1) 2011 6 430 ZAR 714 ZAR 905.6 100.6
Sub-Saharan Africa South Africa EPWP 1 Sanitation Expanded Public Works Program (EPWP) (1) 2011 816 ZAR 65 ZAR 114.9 9.2
Sub-Saharan Africa South Africa EPWP 1 Stormwater Expanded Public Works Program (EPWP) (1) 2011 344 ZAR 13 ZAR 48.5 1.8
Sub-Saharan Africa South Africa EPWP 1 Waste management Expanded Public Works Program (EPWP) (1) 2011 51 ZAR 20 ZAR 7.2 2.8
Sub-Saharan Africa South Africa EPWP 1 Water supply Expanded Public Works Program (EPWP) (1) 2011 1 175 ZAR 136 ZAR 165.5 19.2
Sub-Saharan Africa South Africa EPWP 1 Total Expanded Public Works Program (EPWP) (1) 2011 22 854 ZAR 1 358 ZAR 3218.9 191.3
Sub-Saharan Africa Madagascar Multiple projects Transportation - Roads maintenance
Four road maintenance projects including rehabilitation and periodic maintenance in different terrains of about 25km of road Labour-intensive approach 2007 0.18 USD 0.05 USD 0.2 0.05
Sub-Saharan Africa Madagascar Multiple projects Transportation - Roads maintenance
Four road maintenance projects including rehabilitation, periodic maintenance and treatment of critical areas in different terrains of about 129km of road Semi-mechanized 2007 1.9 USD 0.47 USD 1.9 0.47
Sub-Saharan Africa Madagascar Multiple projects Transportation - Roads maintenance
Three road maintenance projects including rehabilitation and periodic maintenance in different terrains of about 180km of road Equipment based 2007 9.9 USD 0.79 USD 9.9 0.79
Sub-Saharan Africa Madagascar Multiple projects Buildings - Schools Three schools including a total of 8 classrooms, 18 latrines, 2 tanks and one water point Local resource-based approach 2007 0.05 USD 0.006 USD 0.05 0.006
Sub-Saharan Africa Madagascar Multiple projects Buildings - Schools Three schools including a total of 14 classrooms, 3 latrines and 1 tank using mixed approach (Concrete roof frames and metal work for windows and doors) Mixed approach 2007 0.12 USD 0.017 USD 0.120 0.017
Sub-Saharan Africa Madagascar Multiple projects Buildings - Schools Two schools including rehabilitation and building of classrooms, offices and facilities using mixed approach (Metal roof frames and metal work for windows and doors) Mixed approach 2007 0.10 USD 0.012 USD 0.1 0.012
Sub-Saharan Africa Madagascar Multiple projects Buildings - Schools Three schools including 78 classrooms using prefabricated components Pre-fabricated 2007 0.80 USD 0.060 USD 0.8 0.060
Sub-Saharan Africa Madagascar Multiple projects Irrigation Rehabilitation of irrigation network serving a total area of 610 hectares of land Labour-intensive approach 2007 0.22 USD 0.040 USD 0.22 0.040
Sub-Saharan Africa Madagascar Multiple projects Irrigation Rehabilitation of irrigation network serving a total area of 760 hectares of land Equipment-based 2007 0.35 USD 0.030 USD 0.35 0.030
Sub-Saharan Africa Madagascar Multiple projects Transportation-roads Pavement of two roads using cobalt stone (total surface of 2,386 square meters) Local resource-based approach 2007 5.810 USD 1.930 USD 5.81 1.930
Sub-Saharan Africa Ghana One project Social Housing Construction of 280 Housing Units (Apartments) in 18 buildings, suburban Accra Mixed approach as per local concventions 2018 10.668 USD 4.694 USD 10.67 4.694
MENA Jordan Programme Irrigation and watershed management (Green Works)
Employment through labor Intensive Infrastructure Program in Jordan (Phase I - Work under agriculture sector-Farm improvement, Forestry and Irrigation) ILO project Labour-intensive approach 2018 0.581 USD 0.331 USD 0.58 0.331
MENA Jordan Programme Irrigation and watershed management (Green Works)
Water Cisterns, ILO project, Job Creation for Syrian Refugees and Jordanian host communities through Green Works in Agriculture and Forestry Labour-intensive approach 2018 0.254 USD 0.079 USD 0.25 0.079
MENA Jordan Programme Irrigation and watershed management (Green Works)
Reforestation activities, ILO project, Job Creation for Syrian Refugees and Jordanian host communities through Green Works in Agriculture and Forestry Labour-intensive approach 2018 0.657 USD 0.510 USD 0.66 0.510
MENA Jordan Project Rural Roads Routine road maintenance, Balama, Mafraq, EIIP, ILO project Labour-intensive approach 2018 0.345 USD 0.173 USD 0.35 0.173
MENA Jordan Project Rural Roads Routine road maintenance, Manshyeh, Mafraq, EIIP, ILO project Labour-intensive approach 2018 0.272 USD 0.139 USD 0.27 0.139
MENA Jordan Project Highway 22 km of ring road for Al Salt, Jordan Equipment based 2018 50.783 USD 10.055 USD 50.78 10.055
MENA Jordan Project Highway Upgrading of 110 km of major highway, Azraq (Highway 30) Equipment based 2018 148.785 USD 32.584 USD 148.79 32.584
MENA Lebanon Project Rural Roads Rehabilitation of 4.3 km of rural road, Ba'albak, direct implementation Labour-intensive approach 0.370 USD 0.272 USD 0.37 0.272
MENA Lebanon Project Rural Roads Rehabilitation of 7.28km, Jbeil District, Mt Lebanon 2018 7.300 2.400 USD 7.30 2.400
MENA Lebanon Project Highway Rehabilitation of 12 km of road, Nabatieh Equipment based 2018 7.540 USD 1.600 USD 7.54 1.600
MENA Lebanon Project Highway Rehabilitation and widening of 14.7 km of road, Chouf District Equipment based 2018 14.826 USD 2.520 USD 14.83 2.520
MENA Lebanon Project Urban Road Construction Rehabilitation of 1.7 km of road, Hazmieh Region Equipment based 2018 3.079 USD 0.579 USD 3.08 0.579
Minimum 7.2 1.1
Maximum 1945.8 100.6
77Guide for Monitoring Employment and Conducting Employment Impact Assessments (EmpIA) of Infrastructure Investments76 Annexes
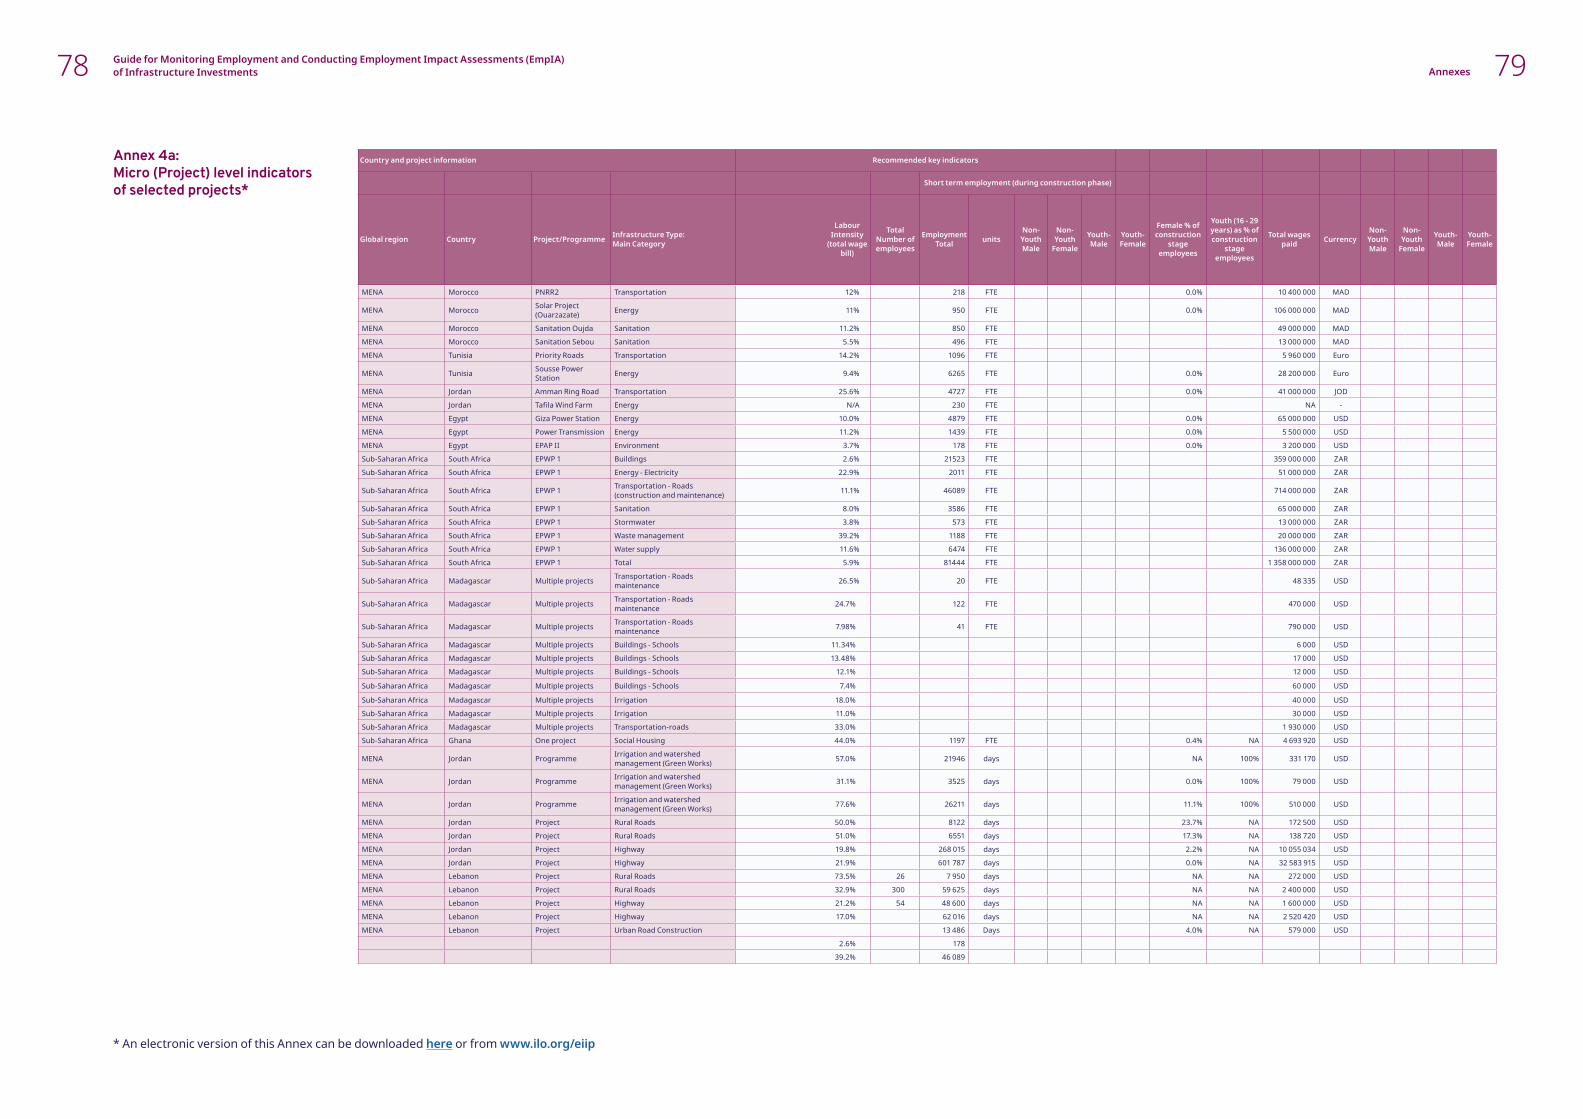
Annex 4a:Micro (Project) level indicators of selected projects*
Country and project information Recommended key indicators
Short term employment (during construction phase)
Global region Country Project/Programme Infrastructure Type: Main Category
Labour Intensity
(total wage bill)
Total Number of employees
Employment Total units
Non-Youth Male
Non-Youth
Female
Youth-Male
Youth-Female
Female % of construction
stage employees
Youth (16 - 29 years) as % of construction
stage employees
Total wages paid Currency
Non-Youth Male
Non-Youth
Female
Youth-Male
Youth-Female
MENA Morocco PNRR2 Transportation 12% 218 FTE 0.0% 10 400 000 MAD
MENA Morocco Solar Project (Ouarzazate) Energy 11% 950 FTE 0.0% 106 000 000 MAD
MENA Morocco Sanitation Oujda Sanitation 11.2% 850 FTE 49 000 000 MAD
MENA Morocco Sanitation Sebou Sanitation 5.5% 496 FTE 13 000 000 MAD
MENA Tunisia Priority Roads Transportation 14.2% 1096 FTE 5 960 000 Euro
MENA Tunisia Sousse Power Station Energy 9.4% 6265 FTE 0.0% 28 200 000 Euro
MENA Jordan Amman Ring Road Transportation 25.6% 4727 FTE 0.0% 41 000 000 JOD
MENA Jordan Tafila Wind Farm Energy N/A 230 FTE NA -
MENA Egypt Giza Power Station Energy 10.0% 4879 FTE 0.0% 65 000 000 USD
MENA Egypt Power Transmission Energy 11.2% 1439 FTE 0.0% 5 500 000 USD
MENA Egypt EPAP II Environment 3.7% 178 FTE 0.0% 3 200 000 USD
Sub-Saharan Africa South Africa EPWP 1 Buildings 2.6% 21523 FTE 359 000 000 ZAR
Sub-Saharan Africa South Africa EPWP 1 Energy - Electricity 22.9% 2011 FTE 51 000 000 ZAR
Sub-Saharan Africa South Africa EPWP 1 Transportation - Roads (construction and maintenance) 11.1% 46089 FTE 714 000 000 ZAR
Sub-Saharan Africa South Africa EPWP 1 Sanitation 8.0% 3586 FTE 65 000 000 ZAR
Sub-Saharan Africa South Africa EPWP 1 Stormwater 3.8% 573 FTE 13 000 000 ZAR
Sub-Saharan Africa South Africa EPWP 1 Waste management 39.2% 1188 FTE 20 000 000 ZAR
Sub-Saharan Africa South Africa EPWP 1 Water supply 11.6% 6474 FTE 136 000 000 ZAR
Sub-Saharan Africa South Africa EPWP 1 Total 5.9% 81444 FTE 1 358 000 000 ZAR
Sub-Saharan Africa Madagascar Multiple projects Transportation - Roads maintenance 26.5% 20 FTE 48 335 USD
Sub-Saharan Africa Madagascar Multiple projects Transportation - Roads maintenance 24.7% 122 FTE 470 000 USD
Sub-Saharan Africa Madagascar Multiple projects Transportation - Roads maintenance 7.98% 41 FTE 790 000 USD
Sub-Saharan Africa Madagascar Multiple projects Buildings - Schools 11.34% 6 000 USD
Sub-Saharan Africa Madagascar Multiple projects Buildings - Schools 13.48% 17 000 USD
Sub-Saharan Africa Madagascar Multiple projects Buildings - Schools 12.1% 12 000 USD
Sub-Saharan Africa Madagascar Multiple projects Buildings - Schools 7.4% 60 000 USD
Sub-Saharan Africa Madagascar Multiple projects Irrigation 18.0% 40 000 USD
Sub-Saharan Africa Madagascar Multiple projects Irrigation 11.0% 30 000 USD
Sub-Saharan Africa Madagascar Multiple projects Transportation-roads 33.0% 1 930 000 USD
Sub-Saharan Africa Ghana One project Social Housing 44.0% 1197 FTE 0.4% NA 4 693 920 USD
MENA Jordan Programme Irrigation and watershed management (Green Works) 57.0% 21946 days NA 100% 331 170 USD
MENA Jordan Programme Irrigation and watershed management (Green Works) 31.1% 3525 days 0.0% 100% 79 000 USD
MENA Jordan Programme Irrigation and watershed management (Green Works) 77.6% 26211 days 11.1% 100% 510 000 USD
MENA Jordan Project Rural Roads 50.0% 8122 days 23.7% NA 172 500 USD
MENA Jordan Project Rural Roads 51.0% 6551 days 17.3% NA 138 720 USD
MENA Jordan Project Highway 19.8% 268 015 days 2.2% NA 10 055 034 USD
MENA Jordan Project Highway 21.9% 601 787 days 0.0% NA 32 583 915 USD
MENA Lebanon Project Rural Roads 73.5% 26 7 950 days NA NA 272 000 USD
MENA Lebanon Project Rural Roads 32.9% 300 59 625 days NA NA 2 400 000 USD
MENA Lebanon Project Highway 21.2% 54 48 600 days NA NA 1 600 000 USD
MENA Lebanon Project Highway 17.0% 62 016 days NA NA 2 520 420 USD
MENA Lebanon Project Urban Road Construction 13 486 Days 4.0% NA 579 000 USD
2.6% 178
39.2% 46 089
* An electronic version of this Annex can be downloaded here or from www.ilo.org/eiip
79Guide for Monitoring Employment and Conducting Employment Impact Assessments (EmpIA) of Infrastructure Investments78 Annexes

Annex 4a:Micro (Project) level indicators of selected projects*
Country and project information
Derived Indicators
Global region Country Project/Programme Infrastructure Type: Main Category
Labour intensity Average wage Unit
Average duration of
employment (days)
Average income
per workers
Cost per FTE (or per day) (local currency)
FTE/million USD
MENA Morocco PNRR2 Transportation 11.8% 3 976 Local/month 403 670 205
MENA Morocco Solar Project (Ouarzazate) Energy 10.6% 9 298 Local/month 1 052 632 88
MENA Morocco Sanitation Oujda Sanitation 11.2% 4 804 Local/month 514 118 170
MENA Morocco Sanitation Sebou Sanitation 5.5% 2 184 Local/month 477 823 374
MENA Tunisia Priority Roads Transportation 14.2% 453 Local/month 38 230 169
MENA Tunisia Sousse Power Station Energy 9.4% 375 Local/month 47 885 204
MENA Jordan Amman Ring Road Transportation 25.6% 723 Local/month 33 848 83
MENA Jordan Tafila Wind Farm Energy NA NA Local/month 1 000 000 NA
MENA Egypt Giza Power Station Energy 10.0% 1 110 Local/month 133 429 75
MENA Egypt Power Transmission Energy 11.2% 319 Local/month 34 051 262
MENA Egypt EPAP II Environment 3.7% 1 498 Local/month 485 955 56
Sub-Saharan Africa South Africa EPWP 1 Buildings 2.6% 1 390 Local/month 641 871 426
Sub-Saharan Africa South Africa EPWP 1 Energy - Electricity 22.9% 2 113 Local/month 110 890 280
Sub-Saharan Africa South Africa EPWP 1 Transportation - Roads (construction and maintenance) 11.1% 1 291 Local/month 139 513 458
Sub-Saharan Africa South Africa EPWP 1 Sanitation 8.0% 1 511 Local/month 227 552 392
Sub-Saharan Africa South Africa EPWP 1 Stormwater 3.8% 1 891 Local/month 600 349 313
Sub-Saharan Africa South Africa EPWP 1 Waste management 39.2% 1 403 Local/month 42 929 422
Sub-Saharan Africa South Africa EPWP 1 Water supply 11.6% 1 751 Local/month 181 495 338
Sub-Saharan Africa South Africa EPWP 1 Total 5.9% 1 390 Local/month 280 610 426
Sub-Saharan Africa Madagascar Multiple projects Transportation - Roads maintenance 26.5% 199 Local/month 9 043 418
Sub-Saharan Africa Madagascar Multiple projects Transportation - Roads maintenance 24.7% 321 Local/month 15 574 260
Sub-Saharan Africa Madagascar Multiple projects Transportation - Roads maintenance 8.0% 1 598 Local/month 240 291 52
Sub-Saharan Africa Madagascar Multiple projects Buildings - Schools 12.0% #DIV/0! Local/month #DIV/0! 0
Sub-Saharan Africa Madagascar Multiple projects Buildings - Schools 14.2% #DIV/0! Local/month #DIV/0! 0
Sub-Saharan Africa Madagascar Multiple projects Buildings - Schools 12.0% #DIV/0! Local/month #DIV/0! 0
Sub-Saharan Africa Madagascar Multiple projects Buildings - Schools 7.5% #DIV/0! Local/month #DIV/0! 0
Sub-Saharan Africa Madagascar Multiple projects Irrigation 18.2% #DIV/0! Local/month #DIV/0! 0
Sub-Saharan Africa Madagascar Multiple projects Irrigation 8.6% #DIV/0! Local/month #DIV/0! 0
Sub-Saharan Africa Madagascar Multiple projects Transportation-roads 33.2% #DIV/0! Local/month #DIV/0! 0
Sub-Saharan Africa Ghana One project Social Housing 44.0% 326.78 USD/Month 8 912 112
MENA Jordan Programme Irrigation and watershed management (Green Works) 57.0% 15.09 USD/day 26 164
MENA Jordan Programme Irrigation and watershed management (Green Works) 31.1% 22.41 USD/day 72 60
MENA Jordan Programme Irrigation and watershed management (Green Works) 77.6% 19.46 USD/day 25 173
MENA Jordan Project Rural Roads 50.0% 21.24 USD/day 42 78
MENA Jordan Project Rural Roads 51.0% 21.18 USD/day 42 80
MENA Jordan Project Highway 19.8% 37.52 USD/day 189 18
MENA Jordan Project Highway 21.9% 54.15 USD/day 247 13
MENA Lebanon Project Rural Roads 73.5% 34.21 USD/day 306 10 462 47 72
MENA Lebanon Project Rural Roads 32.9% 40.25 USD/day 199 8 000 122 27
MENA Lebanon Project Highway 21.2% 32.92 USD/day 900 29 630 155 21
MENA Lebanon Project Highway 17.0% 40.64 USD/day 239 14
MENA Lebanon Project Urban Road Construction 18.8% 42.93 USD/day 228 15
#VALEUR! #VALEUR! - 168
#VALEUR! #VALEUR! - 458
* An electronic version of this Annex can be downloaded here or from www.ilo.org/eiip
81Guide for Monitoring Employment and Conducting Employment Impact Assessments (EmpIA) of Infrastructure Investments80 Annexes

Country and programme or project information
Region number Global region Country Project / Programme
Sector /Infrastructure
typeTechnology Year of Study (Year
of data inputs)
Cost / Investment
(original currency, millions)
Original Currency
Cost / Investment
(USD, millions)
1 MENA (LMIC) Egypt Giza Power Station Energy High Technology 2015 (2011) 2200.0 USD 2200.0
1 MENA (LMIC) Egypt Power Transmission Project Energy High Technology 2015 (2011) 700.0 USD 700.0
1 MENA (LMIC) Egypt EPAP 2 Environment High Technology 2015 (2011) 150.0 USD 150.0
1 MENA (HMIC) Jordan Amman Ring Road Transportation High Technology 2014 (2010) 160.0 JOD 223.6
1 MENA (HMIC) Jordan Tafila Wind Park Energy High Technology 2014 (2010) 230.0 Euro 250.7
1 MENA (LMIC) Morocco PNRR 2 Transportation Lower Technology 2014 (2003-2012) 650.0 USD 650.0
1 MENA (LMIC) Morocco Solar Project Energy High Technology 2014 (2003-2012) 1000.0 USD 1000.0
1 MENA (LMIC) Morocco Sanitation Oujda Sanitation High Technology 2014 (2003-2012) 65.0 Euro 70.9
1 MENA (LMIC) Morocco Sanitation Sebou Sanitation High Technology 2014 (2003-2012) 87.0 Euro 94.8
1 MENA (HMIC) Tunisia Priority Roads Transportation Lower Technology 2014 (2011) 143.7 Euro 156.6
1 MENA (HMIC) Tunisia Sousee Power station Energy High Technology 2014 (2011) 388.0 Euro 422.9
2 South Asia (LMIC) India (Gujarat) Simulation - Irrigation Canal Irrigation No information 2015 (2009-2010) 0.1 RP 0.0015
2 South Asia (LMIC) India (Gujarat) Simulation - Highways/Urban Roads Transportation No information 2015 (2009-2010) 0.1 RP 0.0015
2 South Asia (LMIC) India (Gujarat) Simulation - Rural Roads Transportation No information 2015 (2009-2010) 0.1 RP 0.0015
2 South Asia (LMIC) India (Gujarat) Simulation - Other Average No information 2015 (2009-2010) 0.1 RP 0.0015
2 South Asia (LMIC) India (West Bengal) Simulation - Irrigation Canal Irrigation No information 2015 (2009-2010) 0.1 RP 0.0015
2 South Asia (LMIC) India (West Bengal) Simulation - Highways/Urban Roads Transportation No information 2015 (2009-2010) 0.1 RP 0.0015
2 South Asia (LMIC) India (West Bengal) Simulation - Rural Roads Transportation No information 2015 (2009-2010) 0.1 RP 0.0015
2 South Asia (LMIC) India (West Bengal) Simulation - Other Average No information 2015 (2009-2010) 0.1 RP 0.0015
3 South East Asia (LMIC) Indonesia Fiscal Stimulus Package
(Varied Projects) Infrastructure No information 2011 (2000-2008) 10800000.0 RP 14644.8
3 South East Asia (LMIC) Indonesia Simulation - Construction:
Roads Transportation Labour Intensive 2011 (2000-2008) 1000.0 RP 1.4
3 South East Asia (LMIC) Indonesia Simulation - Construction:
Roads Transportation Capital Intensive 2011 (2000-2008) 1000.0 RP 1.4
3 South East Asia (LMIC) Indonesia Simulation - Construction:
Irrigation Sanitation No information 2011 (2000-2008) 1000.0 RP 1.4
3 South East Asia (LMIC) Indonesia Simulation - Construction:
Other Infrastructure No information 2011 (2000-2008) 1000.0 RP 1.4
4 Sub Saharan Africa (LIC) Liberia
Simulation - Employment Intensive Approach to Infrastructure
Transportation Employmemnt Intensive 2011 (2008) 48.0 USD 48.0
4 Sub Saharan Africa (LIC) Liberia Simulation - Conventional
Approach to Infrastructure Transportation Conventional Approach 2011 (2008) 48.0 USD 48.0
4 Sub Saharan Africa (LIC) Liberia
Simulation - Employment Intensive Approach to Infrastructure
Other Employmemnt Intensive 2011 (2008) 45.3 USD 45.3
4 Sub Saharan Africa (LIC) Liberia Simulation - Conventional
Approach to Infrastructure Other Conventional Approach 2011 (2008) 45.3 USD 45.3
4 Sub Saharan Africa (LIC) Ghana Social Housing Assessment Housing Concentional 2017 (2019) 47.4 GHC 10.6
4 Sub Saharan Africa (LIC) Rwanda Simulation Feeder Roads Labour Intensive 2015 (2019) 41.0 USD
4 Sub Saharan Africa (LIC) Rwanda Simulation Feeder Roads Capital Intensive 2015 (2019) 41.0 USD
* An electronic version of this Annex can be downloaded here or from www.ilo.org/eiip
Annex 4b: Macro (Country) level indicators from selected assessments*
Guide for Monitoring Employment and Conducting Employment Impact Assessments (EmpIA) of Infrastructure Investments82
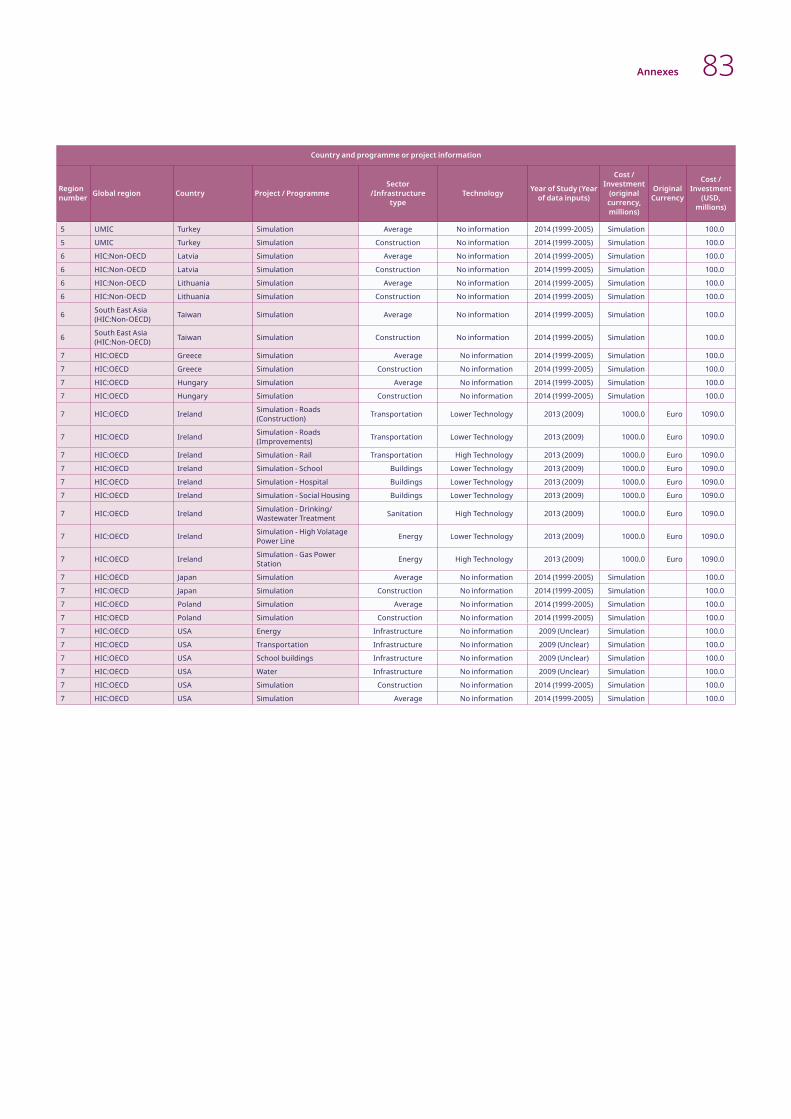
Annex 4b: Macro (Country) level indicators from selected assessmentsCountry and programme or project information
Region number Global region Country Project / Programme
Sector /Infrastructure
typeTechnology Year of Study (Year
of data inputs)
Cost / Investment
(original currency, millions)
Original Currency
Cost / Investment
(USD, millions)
5 UMIC Turkey Simulation Average No information 2014 (1999-2005) Simulation 100.0
5 UMIC Turkey Simulation Construction No information 2014 (1999-2005) Simulation 100.0
6 HIC:Non-OECD Latvia Simulation Average No information 2014 (1999-2005) Simulation 100.0
6 HIC:Non-OECD Latvia Simulation Construction No information 2014 (1999-2005) Simulation 100.0
6 HIC:Non-OECD Lithuania Simulation Average No information 2014 (1999-2005) Simulation 100.0
6 HIC:Non-OECD Lithuania Simulation Construction No information 2014 (1999-2005) Simulation 100.0
6 South East Asia (HIC:Non-OECD) Taiwan Simulation Average No information 2014 (1999-2005) Simulation 100.0
6 South East Asia (HIC:Non-OECD) Taiwan Simulation Construction No information 2014 (1999-2005) Simulation 100.0
7 HIC:OECD Greece Simulation Average No information 2014 (1999-2005) Simulation 100.0
7 HIC:OECD Greece Simulation Construction No information 2014 (1999-2005) Simulation 100.0
7 HIC:OECD Hungary Simulation Average No information 2014 (1999-2005) Simulation 100.0
7 HIC:OECD Hungary Simulation Construction No information 2014 (1999-2005) Simulation 100.0
7 HIC:OECD Ireland Simulation - Roads (Construction) Transportation Lower Technology 2013 (2009) 1000.0 Euro 1090.0
7 HIC:OECD Ireland Simulation - Roads (Improvements) Transportation Lower Technology 2013 (2009) 1000.0 Euro 1090.0
7 HIC:OECD Ireland Simulation - Rail Transportation High Technology 2013 (2009) 1000.0 Euro 1090.0
7 HIC:OECD Ireland Simulation - School Buildings Lower Technology 2013 (2009) 1000.0 Euro 1090.0
7 HIC:OECD Ireland Simulation - Hospital Buildings Lower Technology 2013 (2009) 1000.0 Euro 1090.0
7 HIC:OECD Ireland Simulation - Social Housing Buildings Lower Technology 2013 (2009) 1000.0 Euro 1090.0
7 HIC:OECD Ireland Simulation - Drinking/Wastewater Treatment Sanitation High Technology 2013 (2009) 1000.0 Euro 1090.0
7 HIC:OECD Ireland Simulation - High Volatage Power Line Energy Lower Technology 2013 (2009) 1000.0 Euro 1090.0
7 HIC:OECD Ireland Simulation - Gas Power Station Energy High Technology 2013 (2009) 1000.0 Euro 1090.0
7 HIC:OECD Japan Simulation Average No information 2014 (1999-2005) Simulation 100.0
7 HIC:OECD Japan Simulation Construction No information 2014 (1999-2005) Simulation 100.0
7 HIC:OECD Poland Simulation Average No information 2014 (1999-2005) Simulation 100.0
7 HIC:OECD Poland Simulation Construction No information 2014 (1999-2005) Simulation 100.0
7 HIC:OECD USA Energy Infrastructure No information 2009 (Unclear) Simulation 100.0
7 HIC:OECD USA Transportation Infrastructure No information 2009 (Unclear) Simulation 100.0
7 HIC:OECD USA School buildings Infrastructure No information 2009 (Unclear) Simulation 100.0
7 HIC:OECD USA Water Infrastructure No information 2009 (Unclear) Simulation 100.0
7 HIC:OECD USA Simulation Construction No information 2014 (1999-2005) Simulation 100.0
7 HIC:OECD USA Simulation Average No information 2014 (1999-2005) Simulation 100.0
83Annexes

Annex 4b: Macro (Country) level indicators from selected assessments*
Country and programme or project information Recommended key indicators
Region number Global region Country Project / Programme
Total FTE per million USD of
investment (Total
Jobs / Cost of investment
(m USD)
Direct FTE per million USD
of investment (Direct Jobs/
Cost of investment (m
USD)
Indirect FTE per million
USD of investment
(Indirect Jobs/ Cost of
investment (m USD)
Induced FTE per million
USD of investment
(Induced Jobs/ Cost of
investment (m USD)
T1 Multiplier (Direct Jobs +
Indirect Jobs]/ Direct Jobs)
T2 Multiplier (Direct Jobs +
Indirect Jobs + Induced Jobs]/
Direct Jobs)
Investment cost per
FTE year of employment
created (USD) - Direct, indirect and
induced
Investment cost per
FTE year of employment
created (USD) - Direct only
1 MENA (LMIC) Egypt Giza Power Station 30.5 5.1 20.3 5 4.97 5.97 32 783 195 782
1 MENA (LMIC) Egypt Power Transmission Project 5.0 0.9 3.0 1 4.19 5.32 201 555 1 073 620
1 MENA (LMIC) Egypt EPAP 2 40.9 7.7 24.5 9 4.18 5.32 24 462 130 208
1 MENA (HMIC) Jordan Amman Ring Road 46.2 17.1 15.2 14 1.87 2.67 21 651 58 516
1 MENA (HMIC) Jordan Tafila Wind Park 52.4 21.5 18.9 12 1.87 2.42 19 092 46 566
1 MENA (LMIC) Morocco PNRR 2 76.2 19.9 31.3 25 2.58 3.83 13 124 50 282
1 MENA (LMIC) Morocco Solar Project 39.9 8.2 28.0 4 4.41 4.86 25 092 121 804
1 MENA (LMIC) Morocco Sanitation Oujda 82.6 28.7 42.6 11 2.48 2.88 12 103 34 878
1 MENA (LMIC) Morocco Sanitation Sebou 79.3 29.6 38.2 12 2.29 2.68 12 605 33 794
1 MENA (HMIC) Tunisia Priority Roads 54.0 34.3 11.6 8 1.34 1.57 18 506 29 136
1 MENA (HMIC) Tunisia Sousee Power station 10.9 6.8 2.4 2 1.35 1.61 91 502 146 949
2 South Asia (LMIC) India (Gujarat) Simulation - Irrigation
Canal 2147.5 375.1 222.7 1550 1.59 5.72 466 2 666
2 South Asia (LMIC) India (Gujarat) Simulation - Highways/
Urban Roads 2035.5 269.1 215.4 1551 1.80 7.56 491 3 716
2 South Asia (LMIC) India (Gujarat) Simulation - Rural
Roads 3335.2 1507.9 266.4 1561 1.18 2.21 300 663
2 South Asia (LMIC) India (Gujarat) Simulation - Other 2151.4 222.7 351.3 1577 2.58 9.66 465 4 490
2 South Asia (LMIC)
India (West Bengal)
Simulation - Irrigation Canal 5676.2 2073.2 393.0 3210 1.19 2.74 176 482
2 South Asia (LMIC)
India (West Bengal)
Simulation - Highways/Urban Roads 4181.6 464.0 456.7 3261 1.98 9.01 239 2 155
2 South Asia (LMIC)
India (West Bengal)
Simulation - Rural Roads 5089.0 1450.2 454.7 3184 1.31 3.51 197 690
2 South Asia (LMIC)
India (West Bengal) Simulation - Other 4369.2 575.3 497.1 3297 1.86 7.59 229 1 738
3 South East Asia (LMIC) Indonesia Fiscal Stimulus Package
(Varied Projects) 20.0 49 982
3 South East Asia (LMIC) Indonesia Simulation -
Construction: Roads 36.4 27 505
3 South East Asia (LMIC) Indonesia Simulation -
Construction: Roads 17.3 57 702
3 South East Asia (LMIC) Indonesia Simulation -
Construction: Irrigation 17.6 56 736
3 South East Asia (LMIC) Indonesia Simulation -
Construction: Other 22.4 44 605
4 Sub Saharan Africa (LIC) Liberia
Simulation - Employment Intensive Approach to Infrastructure
1408.4 1061.4 1061.4 710 942
4 Sub Saharan Africa (LIC) Liberia
Simulation - Conventional Approach to Infrastructure
893.3 814.1 814.1 1 119 1 228
4 Sub Saharan Africa (LIC) Liberia
Simulation - Employment Intensive Approach to Infrastructure
924.3 240.2 684.1 1 082 4 163
4 Sub Saharan Africa (LIC) Liberia
Simulation - Conventional Approach to Infrastructure
299.8 55.4 244.4 3 336 18 049
4 Sub Saharan Africa (LIC) Ghana Social Housing
Assessment 272.0 112.0 81.0 79 2.60 3.10 3 676 8 929
4 Sub Saharan Africa (LIC) Rwanda Simulation 600.0 413.0 1.80 2.80 1 667 2 418
4 Sub Saharan Africa (LIC) Rwanda Simulation 250.0 74.0 1.90 2.90 4 000 13 513
* An electronic version of this Annex can be downloaded here or from www.ilo.org/eiip
Guide for Monitoring Employment and Conducting Employment Impact Assessments (EmpIA) of Infrastructure Investments84

Country and programme or project information Recommended key indicators
Region number Global region Country Project / Programme
Total FTE per million USD of
investment (Total
Jobs / Cost of investment
(m USD)
Direct FTE per million USD
of investment (Direct Jobs/
Cost of investment (m
USD)
Indirect FTE per million
USD of investment
(Indirect Jobs/ Cost of
investment (m USD)
Induced FTE per million
USD of investment
(Induced Jobs/ Cost of
investment (m USD)
T1 Multiplier (Direct Jobs +
Indirect Jobs]/ Direct Jobs)
T2 Multiplier (Direct Jobs +
Indirect Jobs + Induced Jobs]/
Direct Jobs)
Investment cost per
FTE year of employment
created (USD) - Direct, indirect and
induced
Investment cost per
FTE year of employment
created (USD) - Direct only
5 UMIC Turkey Simulation 39.8 6.1 22.5 11.2 4.69 6.52 25 126 163 934
5 UMIC Turkey Simulation 41.8 6.4 27.0 8.4 5.22 6.53 23 923 156 250
6 HIC:Non-OECD Latvia Simulation 37.5 5.2 19.7 12.6 4.79 7.21 26 667 192 308
6 HIC:Non-OECD Latvia Simulation 30.9 6.1 13.3 12 3.18 5.07 32 362 163 934
6 HIC:Non-OECD Lithuania Simulation 43.3 5.5 25.3 12.5 5.60 7.87 23 095 181 818
6 HIC:Non-OECD Lithuania Simulation 53.6 8.3 31.8 13.5 4.83 6.46 18 657 120 482
6
South East Asia (HIC:Non-OECD)
Taiwan Simulation 42.4 4.9 21.5 16.0 5.39 8.65 23 585 204 082
6
South East Asia (HIC:Non-OECD)
Taiwan Simulation 51.3 7.3 28.4 15.6 4.89 7.03 19 493 136 986
7 HIC:OECD Greece Simulation 26.5 2.9 12.2 11.4 5.21 9.14 37 736 344 828
7 HIC:OECD Greece Simulation 28.5 4.5 13.8 10.2 4.07 6.33 35 088 222 222
7 HIC:OECD Hungary Simulation 36.5 5.3 20.9 10.3 4.94 6.89 27 397 188 679
7 HIC:OECD Hungary Simulation 42.9 5.8 27.1 10.0 5.67 7.40 23 310 172 414
7 HIC:OECD Ireland Simulation - Roads (Construction) 12.8 8.0 3.1 1.7 1.38 1.59 77 952 124 245
7 HIC:OECD Ireland Simulation - Roads (Improvements) 13.9 9.4 2.6 1.8 1.28 1.48 71 971 106 165
7 HIC:OECD Ireland Simulation - Rail 11.8 7.5 2.8 1.6 1.37 1.58 84 772 133 808
7 HIC:OECD Ireland Simulation - School 13.7 7.2 4.7 1.8 1.66 1.92 72 978 139 779
7 HIC:OECD Ireland Simulation - Hospital 13.3 6.7 4.9 1.8 1.73 1.99 75 059 149 602
7 HIC:OECD Ireland Simulation - Social Housing 14.5 8.2 4.4 1.9 1.54 1.78 68 831 122 307
7 HIC:OECD Ireland Simulation - Drinking/Wastewater Treatment 11.8 5.7 4.4 1.6 1.77 2.05 85 004 173 955
7 HIC:OECD Ireland Simulation - High Volatage Power Line 16.0 8.7 5.1 2.1 1.58 1.83 62 604 114 436
7 HIC:OECD Ireland Simulation - Gas Power Station 9.3 2.5 5.6 1.2 3.20 3.69 107 146 395 357
7 HIC:OECD Japan Simulation 19.2 2.5 8.2 8.5 4.28 7.68 52 083 400 000
7 HIC:OECD Japan Simulation 23.3 2.5 10.5 10.3 5.20 9.32 42 918 400 000
7 HIC:OECD Poland Simulation 43.7 6.0 21.0 16.7 4.50 7.28 22 883 166 667
7 HIC:OECD Poland Simulation 40.2 6.9 19.7 13.6 3.86 5.83 24 876 144 928
7 HIC:OECD USA Energy 17.0 58 824
7 HIC:OECD USA Transportation 19.0 52 632
7 HIC:OECD USA School buildings 19.0 52 632
7 HIC:OECD USA Water 20.0 50 000
7 HIC:OECD USA Simulation 21.0 2.3 8.2 10.5 4.57 9.13 47 619 434 783
7 HIC:OECD USA Simulation 17.7 1.9 7.4 8.4 4.89 9.32 56 497 526 316
Max 5 676.2 2 073.2 1 061.4 3 296.8 5.7 9.7 201 555 1 073 620
Min 5.0 0.9 2.4 1.1 1.2 1.5 176 482
Average 566.1 189.5 124.6 417.0 3.1 5.1 35 659 146 560
85Annexes

Annex 4b: Macro (Country) level indicators from selected assessments*
* An electronic version of this Annex can be downloaded here or from www.ilo.org/eiip
Guide for Monitoring Employment and Conducting Employment Impact Assessments (EmpIA) of Infrastructure Investments86
Country and programme or project information Programme or project level employment information
Region number Global region Country Project / Programme
Total FTE year jobs -
(Direct Jobs + Indirect Jobs + Induced Jobs)
Total Number of Direct Jobs
Direct % - (Direct Jobs/ Total JobsJ)
Total Number of Indirect
Jobs
Indirect % - (Indirect Jobs/
Total Jobs}
Total Number of Induced
Jobs
Induced % - (Induced Jobs/
Total Jobs}Type
1 MENA (LMIC) Egypt Giza Power Station 67107 11237 17.0 44601 66.0 11269 17.0 I-O
1 MENA (LMIC) Egypt Power Transmission Project 3473 652 19.0 2080 60.0 741 21.0 I-O
1 MENA (LMIC) Egypt EPAP 2 6132 1152 19.0 3672 60.0 1308 21.0 I-O
1 MENA (HMIC) Jordan Amman Ring Road 10327 3821 37.0 3408 33.0 3098 30.0 I-O
1 MENA (HMIC) Jordan Tafila Wind Park 13131 5384 41.0 4727 36.0 3020 23.0 I-O
1 MENA (LMIC) Morocco PNRR 2 49529 12927 26.1 20356 41.1 16246 32.8 I-O
1 MENA (LMIC) Morocco Solar Project 39854 8210 20.6 27978 70.2 3667 9.2 I-O
1 MENA (LMIC) Morocco Sanitation Oujda 5854 2031 34.7 3015 51.5 808 13.8 I-O
1 MENA (LMIC) Morocco Sanitation Sebou 7523 2806 37.3 3619 48.1 1098 14.6 I-O
1 MENA (HMIC) Tunisia Priority Roads 8464 5376 63.0 1821 21.0 1267 15.0 I-O
1 MENA (HMIC) Tunisia Sousee Power station 4622 2878 62.0 1009 22.0 735 16.0 I-O
2 South Asia (LMIC) India (Gujarat) Simulation - Irrigation
Canal 0.566 17.5 0.336 10.4 2.338 72.2 I-O
2 South Asia (LMIC) India (Gujarat) Simulation - Highways/
Urban Roads 0.406 13.2 0.325 10.6 2.340 76.2 I-O
2 South Asia (LMIC) India (Gujarat) Simulation - Rural
Roads 2.275 45.2 0.402 8.0 2.355 46.8 I-O
2 South Asia (LMIC) India (Gujarat) Simulation - Other 0.336 10.4 0.530 16.3 2.380 73.3 I-O
2 South Asia (LMIC)
India (West Bengal)
Simulation - Irrigation Canal 3.128 36.5 0.593 6.9 4.843 56.6 I-O
2 South Asia (LMIC)
India (West Bengal)
Simulation - Highways/Urban Roads 0.700 11.1 0.689 10.9 4.920 78.0 I-O
2 South Asia (LMIC)
India (West Bengal)
Simulation - Rural Roads 2.188 28.5 0.686 8.9 4.804 62.6 I-O
2 South Asia (LMIC)
India (West Bengal) Simulation - Other 0.868 13.2 0.750 11.4 4.974 75.5 I-O
3 South East Asia (LMIC) Indonesia Fiscal Stimulus Package
(Varied Projects) 293 000 DySAM
3 South East Asia (LMIC) Indonesia Simulation -
Construction: Roads 49 DySAM
3 South East Asia (LMIC) Indonesia Simulation -
Construction: Roads 24 DySAM
3 South East Asia (LMIC) Indonesia Simulation -
Construction: Irrigation 24 DySAM
3 South East Asia (LMIC) Indonesia Simulation -
Construction: Other 30 DySAM
4 Sub Saharan Africa (LIC) Liberia
Simulation - Employment Intensive Approach to Infrastructure
67 601 16654 50947 I-O
4 Sub Saharan Africa (LIC) Liberia
Simulation - Conventional Approach to Infrastructure
42 878 3798 39079 I-O
4 Sub Saharan Africa (LIC) Liberia
Simulation - Employment Intensive Approach to Infrastructure
41 826 10870 30957 I-O
4 Sub Saharan Africa (LIC) Liberia
Simulation - Conventional Approach to Infrastructure
13566 2507 18.5 11060 I-O
4 Sub Saharan Africa (LIC) Ghana Social Housing
Assessment 2883 1197 41.5 858 29.8 837 29.03 SAM
4 Sub Saharan Africa (LIC) Rwanda Simulation 24600 16933 68.8 SAM
4 Sub Saharan Africa (LIC) Rwanda Simulation 10250 3034 29.6 SAM

87Annexes
Country and programme or project information Programme or project level employment information
Region number Global region Country Project / Programme
Total FTE year jobs - (Direct
Jobs + Indirect Jobs + Induced
Jobs)
Total Number of Direct Jobs
Direct % - (Direct Jobs/ Total JobsJ)
Total Number of Indirect
Jobs
Indirect % - (Indirect Jobs/
Total Jobs}
Total Number of Induced
Jobs
Induced % - (Induced Jobs/
Total Jobs}Type
5 UMIC Turkey Simulation 1800.95 610 15.3 2250 56.5 1120 28.1 I-O
5 UMIC Turkey Simulation 4180 640 15.3 2700 64.6 840 20.1 I-O
6 HIC:Non-OECD Latvia Simulation 3 750 520 13.9 1970 52.5 1260 33.6 I-O
6 HIC:Non-OECD Latvia Simulation 3 090 610 19.7 1330 43.0 1150 37.2 I-O
6 HIC:Non-OECD Lithuania Simulation 4 330 550 12.7 2530 58.4 1250 28.9 I-O
6 HIC:Non-OECD Lithuania Simulation 5 360 830 15.5 3180 59.3 1350 25.2 I-O
6
South East Asia (HIC:Non-OECD)
Taiwan Simulation 4 240 490 11.6 2150 50.7 1600 37.7 I-O
6
South East Asia (HIC:Non-OECD)
Taiwan Simulation 5 130 730 14.2 2840 55.4 1560 30.4 I-O
7 HIC:OECD Greece Simulation 2 650 290 10.9 1220 46.0 1140 43.0 I-O
7 HIC:OECD Greece Simulation 2 850 450 15.8 1380 48.4 1020 35.8 I-O
7 HIC:OECD Hungary Simulation 3 650 530 14.5 2090 57.3 1030 28.2 I-O
7 HIC:OECD Hungary Simulation 4 290 580 13.5 2710 63.2 1000 23.3 I-O
7 HIC:OECD Ireland Simulation - Roads (Construction) 13 983 8 773 62.7 3349 24.0 1861 13.3 I-O
7 HIC:OECD Ireland Simulation - Roads (Improvements) 15 145 10 267 67.8 2 862 18.9 2 016 13.3 I-O
7 HIC:OECD Ireland Simulation - Rail 12 858 8146 63.4 3001 23.3 1711 13.3 I-O
7 HIC:OECD Ireland Simulation - School 14 936 7 798 52.2 5 150 34.5 1 988 13.3 I-O
7 HIC:OECD Ireland Simulation - Hospital 14 522 7286 50.2 5303 36.5 1933 13.3 I-O
7 HIC:OECD Ireland Simulation - Social Housing 15 836 8912 56.3 4 816 30.4 2 108 13.3 I-O
7 HIC:OECD Ireland Simulation - Drinking/Wastewater Treatment 12 823 6266 48.9 4 850 37.8 1 707 13.3 I-O
7 HIC:OECD Ireland Simulation - High Volatage Power Line 17 411 9525 54.7 5569 32.0 2 317 13.3 I-O
7 HIC:OECD Ireland Simulation - Gas Power Station 10 173 2757 27.1 6 062 59.6 1 354 13.3 I-O
7 HIC:OECD Japan Simulation 1 920 250 13.0 820 42.7 850 44.3 I-O
7 HIC:OECD Japan Simulation 2 330 250 10.7 1050 45.1 1030 44.2 I-O
7 HIC:OECD Poland Simulation 4 370 600 13.7 2100 48.1 1670 38.2 I-O
7 HIC:OECD Poland Simulation 4 020 690 17.2 1970 49.0 1360 33.8 I-O
7 HIC:OECD USA Energy 1 667 I-O
7 HIC:OECD USA Transportation 1 887 I-O
7 HIC:OECD USA School buildings 1 923 I-O
7 HIC:OECD USA Water 1 961 I-O
7 HIC:OECD USA Simulation 2 100 230 11.0 820 39.0 1050 50.0 I-O
7 HIC:OECD USA Simulation 1 770 190 10.7 740 41.8 840 47.5 I-O
Max 68.8 70.2 78.0
Min 10.4 6.9 9.2
Average 28.9 39.2 32.6

Guide for Monitoring Employment and Conducting Employment Impact Assessments (EmpIA) of Infrastructure InvestmentsEmployment Intensive Investment ProgrammeDevelopment and Investment BranchEmployment Policy Department
ILO
G
uide
for M
onito
ring
Em
ploy
men
t and
Con
duct
ing
Empl
oym
ent I
mpa
ct A
sses
smen
ts (E
mpI
A) o
f Inf
rast
ruct
ure
Inve
stm
ents
Empl
oym
ent i
mpa
ct
asse
ssm
ents
Publ
ic a
nd p
rivat
e se
ctor
dev
elop
men
tPu
blic
em
ploy
men
t pr
ogra
mm
esGr
een
w
orks
Loca
l res
ourc
e-ba
sed
appr
oach
es
and
com
mun
ity
infr
astr
uctu
reEm
erge
ncy
empl
oym
ent
Address: 4 route des Morillons, CH-1211 Geneva 22, Switzerland
E-mail: [email protected]
Tel: +41 (0) 22 799 6111
EIIP Website: www.ilo.org/eiip
Strengthen Project Website: www.ilo.org/strengthen
Employment Intensive Investment Programme
EIIP
This document has been produced by the International Labour Office with the financial assistance of the European Union