guide on measuring migration policy impacts in · pdf filethe reproduction rights organization...
TRANSCRIPT

Guide on measuring migration policy impacts in ASEAN
International Labour Organization


Guide on measuring migration policy impacts in ASEAN
International Labour Organization

Copyright © International Labour Organization 2016 First published 2016
Publications of the International Labour Office enjoy copyright under Protocol 2 of the Universal Copyright Convention. Nevertheless, short excerpts from them may be reproduced without authorization, on condition that the source is indicated. For rights of reproduction or translation, application should be made to ILO Publications (Rights and Permissions), International Labour Office, CH-1211 Geneva 22, Switzerland, or by email: [email protected]. The International Labour Office welcomes such applications.
Libraries, institutions and other users registered with reproduction rights organizations may make copies in accordance with the licences issued to them for this purpose. Visit www.ifrro.org to find the reproduction rights organization in your country.
Abella, Manolo ; Martin, Philip
Guide on measuring migration policy impacts in ASEAN / Manolo Abella and Philip Martin ; ILO Regional Office for Asia and the Pacific ; Tripartite Action for Protection and Promotion of the Rights of Migrant Workers in the ASEAN Region (ASEAN TRIANGLE project). – Bangkok : ILO, 2015
ISBN: 9789221294511 ; 9789221294528 (web pdf)
ILO Regional Office for Asia and the Pacific, Tripartite Action for Protection and Promotion of the Rights of Migrant Workers in the ASEAN Region (ASEAN TRIANGLE project)
migration policy / labour migration / international migration / migrant worker / recruitment / guide / ASEAN countries
14.09.1ILO Cataloguing in Publication Data
The designations employed in ILO publications, which are in conformity with United Nations practice, and the presentation of material therein do not imply the expression of any opinion whatsoever on the part of the International Labour Office concerning the legal status of any country, area or territory or of its authorities, or concerning the delimitation of its frontiers.
The responsibility for opinions expressed in signed articles, studies and other contributions rests solely with their authors, and publication does not constitute an endorsement by the International Labour Office of the opinions expressed in them.
Reference to names of firms and commercial products and processes does not imply their endorsement by the International Labour Office, and any failure to mention a particular firm, commercial product or process is not a sign of disapproval.
ILO publications and electronic products can be obtained through major booksellers or ILO local offices in many countries, or direct from ILO Publications, International Labour Office, CH-1211 Geneva 22, Switzerland, or ILO Regional Office for Asia and the Pacific, 11th Floor, United Nations Building, Rajdamnern Nok Avenue, Bangkok 10200, Thailand, or by email: [email protected]. Catalogues or lists of new publications are available free of charge from the above address, or by email: [email protected]
Visit our website: www.ilo.org/publns or www.ilo.org/asia
Printed in Thailand
Guide on measuring migration policy impacts in ASEAN
Cha
pte
r 3
i
Preface
This guide offers policy-makers and administrators a guide to evaluate labour migration
policies work in practice, based on documented experiences in ASEAN and other
parts of the world. It starts with the labour market tests used to determine whether
the migrant workers requested by employers are really needed. The second section
discusses the recruitment process, and the effectiveness of policies to match workers
with jobs and minimize the cost of recruitment. The third section focuses on protection
and outlines methods to assess policies that set the wages and working conditions of
migrant workers and deal with complaints filed by workers with government agencies.
The fourth section reviews evidence on the impacts of migration on destination and
origin countries, including on incomes, productivity, and non-economic factors such
as crime and congestion. The fifth section highlights the conceptual and practical
difficulties involved in evaluating the effects of labour migration and lays out practical
steps that national authorities can take to improve labour market testing, recruitment,
labour market monitoring, and assessment of the overall impact. A final section reviews
the experience of Malaysia in managing the admission and employment of foreign
workers, and summarizes the research on migration’s impacts on the Malaysian labour
market and economy.
This publication was authored by Manolo Abella and Philip Martin.
Manolo Abella is the former Director of ILO’s International Migration Programme. He
has spent many years in Asia working with governments and their tripartite partners
in developing sound policies and programmes on labour migration. He is currently a
Senior Research Associate at the Centre for Migration Policy and Society, University of
Oxford and continuous to do advisory work on behalf of the ILO, the World Bank, and
other international organizations.
Philip Martin is Professor of Agricultural and Resource Economics at the University of
California-Davis. He edits Rural Migration News (http://migration.ucdavis.edu), has
served on several federal commissions, and testifies frequently before Congress. He is
an award-winning author who works for United Nations agencies around the world on
labour and migration issues.


Table of contents
Preface i
Acknowledgements viii
Executive summary ix
Abbreviations and acronyms xi
Chapter 1. Trends in international labour migration 1
1.1 Global trends 1
1.2 Migration in Asia 3
1.3 Migration in ASEAN 5
Chapter 2. Admitting foreign workers 9
2.1 Goals in admission of foreign workers 11
2.2 Process indicators to monitor programme delivery 14
2.3 Programmes and regulations to achieve policy objectives 19
2.4 Monitoring the outcomes of foreign worker programmes 24
2.5 Macroeconomic impact of immigration 25
2.6 Impact of immigration on productivity and innovation 28
2.7 Problems and issues in identifying and measuring the impact of migration 29
Chapter 3. Recruitment: Finding migrant workers 35
3.1 Intermediaries recruit migrant workers 36
3.2 Other recruitment mechanisms 37
3.3 Objectives behind State policies on recruitment 38
3.4 Monitoring success and failure in regulating recruitment 40
3.5 Models of regulation 46
3.6 Indicators to assess recruitment outcomes 56

Chapter 4. Regulating migrant employment 61
4.1 Labour market regulation 61
4.2 Markets versus regulations 63
4.3 Effectiveness and impact of labour market regulation 67
4.4 Interpreting indicators 74
Chapter 5. Recommendations and next steps 77
5.1 Economics needs tests 78
5.2 Regulating recruitment 79
5.3 Monitoring migrant wages and impacts 80
5.4 Next steps 81
Chapter 6. Measuring migration policy impact in Malaysia 83
6.1 Foreign worker dependency in Malaysia 83
6.2 Foreign worker policy in Malaysia 92
6.3 Policy instruments to manage foreign workers 93
6.4 Managing demand for foreign workers 98
6.5 Conclusion 124
References 127
Appendix I Best-practice recommendations: Managing labour migration 133
Appendix II Economics of recruitment 143
Appendix III - Measuring recruitment or migration costs: 146 Migrant survey questionnaire
Annex IV: Summary of discussion, Regional Meeting to 163 Validate the Guide on Measuring Migration Policy Impacts in ASEAN Member States

List of tables
Chapter 1. Trends in international labour migration 1
Table 1.1 International migrants in 2010 (in millions and per cent) 2
Table 1.2 ASEAN migration stocks, 2010 6
Chapter 2. Admitting foreign workers 9
Table 2.1 Foreign workers – Goals and strategies of receiving countries 13
Table 2.2 Indicators of the impact of foreign worker programmes 15
Table 2.3 Logical framework analysis to evaluate foreign worker admissions 18
Table 2.4 Example of UK Migration Advisory Committee labour market indicators 21
Table 2.5 Impact of improved economic migration screening (1999+) on employment outcomes at six months for select General Skilled Migration birthplace groups, Australia (1993–95 and 1999–2000) (per cent) 33
Chapter 3. Recruitment: Finding migrant workers 35
Table 3.1 Measures to regulate recruitment 40
Table 3.2 Worker-paid migration costs (in US$) – Bangladeshi workers in Kuwait, 2014 44
Table 3.3 Example of United States H-2A certification process 53
Table 3.4 Process and impact indicators related to regulating recruitment 57
Chapter 4. Regulating migrant employment 61
Table 4.1 Working conditions: Objectives and measures 64
Table 4.2 Process and impact indicators of working condition regulations 68
Table 4.3 Monthly wages of Thai workers, registered migrant workers, and unregistered migrant workers in Thailand 70
Table 4.4 Action on labour and welfare complaints received by Philippines Consulate in Dubai, first three quarters 2008–09 72

Table 4.5 Process indicator: Status of cases filed in 2008 at POEA as of 15 Oct. 2009 72
Chapter 6. Measuring migration policy impact in Malaysia 83
Table 6.1 Malaysia’s population and labour force by nationality, 1995-2013, various sources 84
Table 6.2 Number of documented foreign workers in Malaysia by nationality and sector, 1990-2013 90
Table 6.3 Number of expatriates in Malaysia, 2010 & 2014 91
Table 6.4 High-skilled foreign workers by sector, 2004-2014 (per cent) 91
Table 6.5 Members of the Cabinet Committee on Foreign Workers (CCFWII) 97
Table 6.6 Policy instruments and measures to manage foreign workers 97
Table 6.7 Activities in agriculture permitted to hire foreign workers and regulations guiding the number of workers that can be hired 99
Table 6.8 Approved sectors for employment of foreign nationals 102
Table 6.9 List of documents required for new applications for foreign workers 103
Table 6.10 Schedule of statutory payments 104
Table 6.11 Structure of foreign worker levy 106
Table 6.12 Advantages of the OS system over the current recruitment system 109
Table 6.13 Remittances by foreign labour, 2000 & 2013 (Ringgit, million) 114
Table 6.14 Monthly minimum wage of foreign workers before and after minimum wage implementation in Peninsular Malaysia 122
Table 6.15 The macroeconomic impact of the minimum wage policy 123

List of figures
Chapter 2. Admitting foreign workers 9
Figure 2.1 Admission of foreign workers admission: Goals and process indicators 14
Figure 2.2 Macroeconomic impacts of migrants: United States, 1996 27
Chapter 3. Recruitment: Finding migrant workers 35
Figure 3.1 Flowchart of the Korean EPS 52
Chapter 6. Measuring migration policy impact in Malaysia 83
Figure 6.1 Number of documented migrant workers 88
Figure 6.2 Share of foreign workers in marjor economic sectors, 2000-2013 89
Figure 6.3 Institutional framework for the management and protection of migrant workers 95
List of boxes
Chapter 2. Admitting foreign workers 9
Box 2.1 The difficult “counter-factual” 12
Box 2.2 The three “Rs” of labour markets 34
Chapter 3. Recruitment: Finding migrant workers 35
Box 3.1 Licensing criteria for Singaporean recruiters 47
Box 3.2 Work BC (Canada) Temporary Foreign Workers Programme 48

Guide on measuring migration policy impacts in ASEAN
Cha
pte
r 3
Acknowledgements
This report was made possible through the ASEAN TRIANGLE Project, generously funded by
the Department of Foreign Affairs, Trade and Development of the Government of Canada.
The authors have greatly benefited from discussions with many people who generously shared
their time and insights.
In Malaysia, the authors would like to thank the late Ms Irene Fernandez, a human rights
champion, Mr Rahim bin Abdul Razak (Economic Planning Unit), Mr Sahar bin Darusman, Ms
Zulikfli wan Setapa, and Mr Amir (Ministry of Human Resources), Mr Shamsuddin Bardan and
Mohd Zalin Baharudin (Malaysian Employers Federation), Mr Gopal Krishnan (Malaysian Trade
Union Council), and Mr Anson Alexander (Schneider Electric). Dr Vijayakumari Kanapathy
assisted the authors in their field visits in Malaysia.
In Singapore the authors learned a great deal from their colleagues at the National University
of Singapore: Dr Mui Teng Yap, Prof. Hui Weng Tat, and Prof. Phua Kai Hong from the Lee
Kuan Yew School of Public Policy and Prof. Brenda Yeoh and Prof. Shadre Thangavelu from
the Faculty of Arts and Social Sciences. The authors also extend their gratitude to Mr Lam
Kong Hong and Mr Zhuo Yaohong from the Singapore Business Federation; Ms Florence Tee
Li Fong from the Migrant Workers’ Centre; and Ms Joann Tan from the Singapore Ministry of
Manpower who patiently answered the authors’ questions.
In Thailand Prof. Supang Chantavanich and Dr Ratchada Jayagupta (Chulalongkorn University)
organized a useful seminar. And in the Philippines Ms Rosalinda Dimapilis-Baldoz, Secretary of
Labour, and Mr Hans Cacdac, Administrator of POEA generously provided insights.
The authors would also like to thank the participants of the Regional Meeting to Validate the
Guide on Measuring Migration Policy Impacts in ASEAN Member States, held on the 10-11th
November 2015. Their inputs and insights proved valuable in finalization of this manual.
A number of ILO staff provided technical comments on the report, including Nilim Baruah,
Senior Regional Migration Specialist, Manuel Imson, Senior Project Coordinator, and Heike
Lautenschlager, Technical Officer.
This report was edited by John Maloy and graphic design and layout were done by Opus
Cambodia and Mona Wang. From the ILO, Chanitda Wiwatchanon assisted with the publication
process. Nachagahn Sathiensotorn and Chadapa Krailassuwan provided administrative
support throughout the production of the report.
viii

Guide on measuring migration policy impacts in ASEAN
Cha
pte
r 3
Executive summary
This Guide, supported by the International Labour Organization’s ASEAN Triangle Project
to improve migration governance, outlines indicators to assess the effectiveness of labour
migration policies in four areas:
1. Responding to employer requests to hire foreign workers.
2. Regulating the recruitment of foreign workers.
3. Monitoring the wages and working conditions of foreign workers to
ensure their protection.
4. Evaluating the effects of foreign workers on broader economic and
noneconomic factors, from productivity to congestion in migrant
receiving countries and on poverty reduction and development in
sending countries.
The methodology included three major elements. First was a review of the
policies available to manage these four key policy functions, viz.:
• conducting labour market or economic needs testing to determine whether the migrant workers requested by employers are “needed”;
• licensing and regulating recruiters;
• monitoring the wages and working conditions of migrant workers; and
• assessing the overall impacts of migration.
The second step involved interviewing government officials, employers and recruiters,
and other key informants in Malaysia, Singapore, and Thailand as receiving countries,
and the Philippines and Viet Nam as sending countries, to learn about the indicators
they rely on to administer labour migration policies in these four areas.
The third step was to lay out suggestions for changes in and additions to the indicators
currently used to manage labour migration based on comparative experience, surveys of
employers, and the results of the interviews.
ix

Guide on measuring migration policy impacts in ASEAN
Cha
pte
r 2
The Guide has five chapters. Chapter 1 summarizes major migration stocks and flows in Asia
and in Association of Southeast Asian Nations (ASEAN) countries. Chapter 2 discusses the
instruments and indicators available to determine whether foreign workers are needed to fill
vacant jobs and the impacts of migrants on migrant receiving countries. Chapter 3 reviews
the recruitment process used to match employers with workers, and focuses special attention
on for-profit recruiters, including efforts to regulate their activities, and government-to-
government recruitment systems. Chapter 4 deals with policies to protect migrant workers
while they are employed abroad, including ensuring that they receive the wages and benefits
to which they are entitled and that they are protected while employed abroad. Chapter 5
provides conclusions and recommendations. In Chapter 6, Dr. Vijay Kanapathy describes
the experience of an important country of destination, Malaysia, to manage the admission,
employment, regularization and protection of foreign workers; and analyses the impact of
migration on Malaysia’s economy, on wages and productivity, competitiveness, and social
conditions.
x

Guide on measuring migration policy impacts in ASEAN
Cha
pte
r 2
Abbreviations and acronyms
AEC ASEAN Economic Community
ASEAN Association of Southeast Asian Nations
COD country of destination
COO country of origin
ENT economic needs test
EPS Employment Permit System [Republic of Korea]
FDI foreign direct investment
FLC farm labour contractor
GDP gross domestic product
GNP gross national product
HIV human immunodeficiency virus
ILO International Labour Organization
IT information technology
MAC Migration Advisory Committee [United Kingdom]
MYR Malaysian ringgit
NGO non government organization
NPC National Processing Centre [United States]
OECD Organization for Economic Cooperation and Development
OSC outsourcing companies
PEO professional employers’ organization
PES public employment services
SWA State Workforce Agency [United States]
UN United Nations
xi

Guide on measuring migration policy impacts in ASEAN
Cha
pte
r 1
Cha
pte
r 1
Chapter 1. Trends in international labour migration
1.1 Global trends
The number of international migrants, defined as persons residing outside their country of
birth for at least a year, more than doubled between 1980 and 2010, from 103 million to
214 million (United Nations Population Division, 2009). The stock of international migrants
increased faster than the global population, which rose 57 per cent from 4.4 billion to 6.9
billion over these three decades. The United Nations (UN) reported that the number of
international migrants was 232 million in 2013; projections suggest that the stock of migrants
could almost double to over 400 million by 2050.
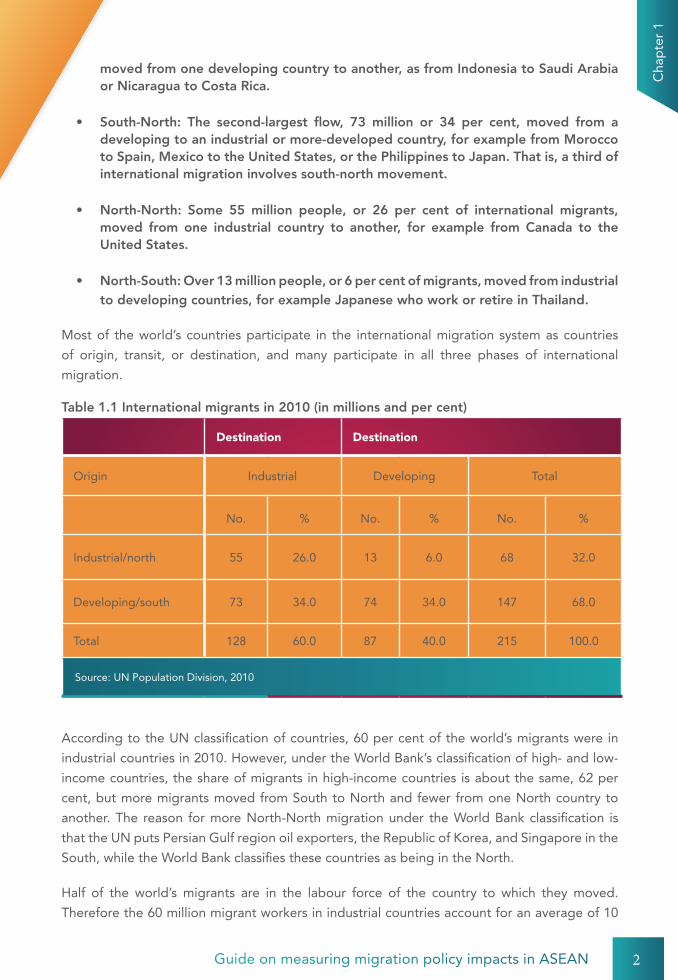
Each international migrant is unique, and every migration corridor has unique features, but
the four major migration flows are often summarized as South-South, South-North, North-
North, and North-South (Table 1.1):
• South-South: The largest flow of migrants, 74 million or 34 per cent in 2010,
(2) A shipyard worker, Batam, Indonesia.© ILO/A. Mirz 2007
1
Guide on measuring migration policy impacts in ASEAN
Cha
pte
r 1
moved from one developing country to another, as from Indonesia to Saudi Arabia or Nicaragua to Costa Rica.
• South-North: The second-largest flow, 73 million or 34 per cent, moved from a developing to an industrial or more-developed country, for example from Morocco to Spain, Mexico to the United States, or the Philippines to Japan. That is, a third of international migration involves south-north movement.
• North-North: Some 55 million people, or 26 per cent of international migrants, moved from one industrial country to another, for example from Canada to the United States.
• North-South: Over 13 million people, or 6 per cent of migrants, moved from industrial to developing countries, for example Japanese who work or retire in Thailand.
Most of the world’s countries participate in the international migration system as countries
of origin, transit, or destination, and many participate in all three phases of international
migration.
Table 1.1 International migrants in 2010 (in millions and per cent)
Destination Destination
Origin Industrial Developing Total
No. % No. % No. %
Industrial/north 55 26.0 13 6.0 68 32.0
Developing/south 73 34.0 74 34.0 147 68.0
Total 128 60.0 87 40.0 215 100.0
Source: UN Population Division, 2010
According to the UN classification of countries, 60 per cent of the world’s migrants were in
industrial countries in 2010. However, under the World Bank’s classification of high- and low-
income countries, the share of migrants in high-income countries is about the same, 62 per
cent, but more migrants moved from South to North and fewer from one North country to
another. The reason for more North-North migration under the World Bank classification is
that the UN puts Persian Gulf region oil exporters, the Republic of Korea, and Singapore in the
South, while the World Bank classifies these countries as being in the North.
Half of the world’s migrants are in the labour force of the country to which they moved.
Therefore the 60 million migrant workers in industrial countries account for an average of 10
2

Guide on measuring migration policy impacts in ASEAN
Cha
pte
r 1
per cent of the 600 million workers in those countries, according to the UN classification. The
migrant share of industrial country workforce varies widely, from less than 2 per cent in Japan
to over 25 per cent in Switzerland. There were 87 million migrants in developing countries in
2010, but they comprised less than 1.5 per cent of developing country residents and workers.
The share of workers who are migrants in developing countries spans a very wide range, from
less than 1 per cent in China, Nigeria, and Peru to over 80 per cent in many Gulf oil exporters.
The UN revised its estimate of the stock of international migrants in 2010 from 213 million
to 220 million, and estimated there were 232 million international migrants in October 2013,
while the World Bank estimated almost 250 million international migrants in 2013. The
distribution of migrants did not change, that is, over 60 per cent of migrants in 2013 were in
“developed regions,” the 30+ countries with 136 million migrants, making migrants 11 per
cent of the 1.2 billion residents of richer countries. The 96 million migrants in the 170 poorer
developing countries account for 1.6 per cent of their 6 billion residents.
Between 1990 and 2000, the global stock of migrants rose from 154 million to 175 million, up
by 2.1 million a year. Between 2000 and 2010, the global migrant stock rose by an average
4.5 million a year. And between 2010 and 2013, when the stock rose from 220 million to 232
million, the increase averaged 4 million a year.
About 48 per cent of the world’s migrants in 2013 were women (52 per cent of migrants in
the North were women), and 35 million or 15 per cent of all migrants were under the age of
20. The migrant stock included 16 million refugees, making refugees less than 7 per cent of
international migrants. The UN estimated 20 million irregular migrants, including 11 million
in the United States (US) and over 500,000 each in Italy, Malaysia, Thailand, and the United
Kingdom. International migrants are more likely to be of working age than other residents in
the countries where they live. Almost three-fourths of migrants were between the ages of 20
to 64 in 2013, compared to 60 per cent of all residents.
Europe had 72 million migrants in 2013, followed by 71 million in Asia. Half of international
migrants live in ten countries, including a quarter in the United States. The United States had
46 million migrants in 2013, followed by Russia with 11 million; Germany, 10 million; Saudi
Arabia, 9.1 million; the United Arab Emirates, 7.8 million; United Kingdom, 7.8 million; and
France, Canada, Australia, and Spain, about 7 million each.
1.2 Migration in Asia
Asia is home to 60 per cent of the world’s people and 30 per cent of the world’s international
migrants, a migrant-to-population share ratio of 0.5. Europe, by contrast, has 10 per cent of
the world’s people and 30 per cent of the world’s migrants for a migrant-to-population share
ratio of 3.0; while North America has 5 per cent of the world’s people and 25 per cent of
the world’s migrants, making its migrant-to-population share ratio 5.0. Migrant-to-population
share ratios are highest in Oceania and the Gulf oil exporters.
3

Guide on measuring migration policy impacts in ASEAN
Cha
pte
r 1
There are several reasons for the relatively low migrant-to-population share ratio in Asia. Asia
has several very large countries experiencing large-scale internal migration that might have
been international migration on other continents with more countries and national borders to
cross. Asia and Europe each have about a quarter of the world’s 200 countries, but Asia has
six times more people than Europe, so Chinese and Indians can move within their respective
countries and not be international migrants. Most Europeans, by contrast, live in the 28 member
European Union, which promotes freedom of movement between member countries.
There are several other Asia-Europe differences. It is sometimes said that Europe makes it hard
for low-skilled migrants to enter, but once inside a European country, it is hard for European
governments to persuade low-skilled migrants to leave. Many Asian countries that attract low-
skilled workers, by contrast, make it relatively easy for low-skilled migrants to enter but harder
for them to stay.
Migration patterns in Asia highlight migration extremes. China, Indonesia, and Japan have very
few migrant workers, while Gulf oil-exporting countries such as Qatar rely on migrants to fill
almost all private sector jobs. The rural-urban migration within Asian population giants China
and India can be akin to international migration because of government regulations on access
to public benefits. For example, almost 20 per cent of the 1.4 billion Chinese live away from
the place in which they are registered, which limits their access to government services where
they live and work.
Asian nations that attract migrant workers often perceive themselves to be different in managing
migration from American and European nations. Unlike nations of immigrants such as Canada
and the United States or reluctant countries of immigration in Europe, few Asian nations
consider themselves destinations for settler immigrants (and their families) who will eventually
become fellow citizens. Instead, most Asian nations with migrant workers expect them to stay
for two or three years before returning to their country of origin. Generally, only higher income
professionals are allowed to bring their families with them into the Asian countries that admit
migrant workers.
Two other factors distinguish international labour migration in Asia. First, there is more diversity
in labour migration policies in migrant receiving countries than in their economic policies,
which generally stress high local savings and foreign investment to create jobs in factories that
employ local and migrant workers to produce goods that are exported. Migration policies
form a rough triangle, marked at one corner by Singapore’s welcoming skilled workers while
rotating low-skilled workers in and out of the country; Japan’s welcoming skilled foreigners
(and attracting few) but resisting calls to open their doors to low-skilled guest workers; and the
Gulf Cooperation Council countries’ dependence on migrants to fill private-sector jobs at all
rungs of the job ladder.
Second, in contrast to the differences in migration policy among Asian countries that receive
migrants, there is more policy convergence among labour-sending countries. From Bangladesh
to Viet Nam, the goal is generally to send more skilled workers abroad and to diversify the
4

Guide on measuring migration policy impacts in ASEAN
Cha
pte
r 1
destinations of migrant workers. In practice, this means that most migrant sending countries in
Asia want to send fewer workers to Gulf oil exporters and more workers to European and North
American countries, and to send more engineers and nurses and fewer domestic workers and
labourers abroad.
1.3 Migration in ASEAN
The ten Member States of ASEAN have 600 million residents and 280 million workers. The
ASEAN Economic Community (AEC) is a blueprint to further reduce barriers to trade and
investment in 2015, including fostering freedom of movement between ASEAN countries
for professionals and highly skilled workers and easing the cross-border movement of self-
employed entrepreneurs.
The original ASEAN Vision 2020, endorsed by heads of government in 1997, did not mention
migration, although it emphasized a “free flow of goods, services, investment and capital.” The
Hanoi Plan of Action in 1998 revised Vision 2020 and called for a “freer flow of skilled labour
and professionals in the region,” including the creation of “ASEAN Lanes” at ports of entry
to facilitate intra-ASEAN travel by citizens of Member States. Focal points were designated in
each ASEAN Member State to facilitate cooperation to combat illegal migration and trafficking
in persons, since reducing illegal migration was considered essential to facilitate legal migration
within ASEAN. In 2006, ASEAN leaders agreed to allow nationals of ASEAN member nations to
enter other ASEAN States to visit without visas for up to 14 days.
ASEAN labour ministers have been meeting since 1975, and the Senior Labour Officials are
charged with implementing the 2007 ASEAN Declaration on the Protection and Promotion
of the Rights of Migrant Workers. The Senior Labour Officials also deal with safety and health
(including HIV) in the workplace, but many of the issues that affect labour mobility, such as
preventing trafficking and unsafe migration, are primarily the responsibility of other ministries,
such as home affairs or interior. The work plan of the ASEAN Senior Labour Officials between
2010 and 2015 includes promoting best practices to protect migrant rights.
The AEC plans to implement freer labour mobility in a top–down fashion, beginning with skilled
workers. Top–down labour mobility is a sharp contrast to existing realities, since most intra-
ASEAN labour migrants are low-skilled workers. The top–down focus likely reflects concerns
of richer ASEAN countries, such as Malaysia, Singapore, and Thailand, that they could receive
“too many” low-skilled migrants if there were immediate freedom of movement for all types
of workers.
There is significant intra-ASEAN labour migration, including from Cambodia, the Lao People’s
Democratic Republic, and Myanmar into Thailand; from Indonesia and Viet Nam into Malaysia;
and from Malaysia, the Philippines, and other ASEAN nations into Singapore and Brunei
Cha
pte
r 1
5

Guide on measuring migration policy impacts in ASEAN
Cha
pte
r 1
Darussalam. However, the World Bank’s migration database suggests that there were two
migrants who left the region for every ASEAN national who moved within the ASEAN region
in 2010. That is, almost 13 million ASEAN nationals left the region in 2010, but only 4.1 million
moved to another ASEAN Member State for a year or more (see Table 1.2).1
Migration in ASEAN is concentrated, with a few of the ten Member States most affected.
Three ASEAN Member States – Indonesia, the Philippines, and Viet Nam – were the source
countries for 9 million migrants, or almost 70 per cent of the total emigrant stock from ASEAN;
while three others – Malaysia, Singapore, and Thailand – accounted for 80 per cent of the
immigrant stock in ASEAN. Similarly, two countries, Indonesia and Malaysia, accounted for
two-thirds of intra-ASEAN emigration. And two countries, Malaysia and Singapore, accounted
for 80 per cent of intra-ASEAN immigration. It should be emphasized that the World Bank
migration database likely underestimates some flows, as from Myanmar to Thailand.
Table 1.2 ASEAN migration stocks, 2010
Intra-ASEAN migration Total migration
Emigration Immigration Emigration Immigration
Brunei
Darussalam9 313 120 578 24 343 148 123
Cambodia 53 722 320 573 350 485 335 829
Indonesia 1 518 687 158 485 2 504 297 397 124
Lao PDR 82 788 10 134 366 663 18 916
Malaysia 1 195 566 1 882 987 1 481 202 2 357 603
Myanmar 321 100 814 514 667 98 008
Philippines 335 407 9 096 4 275 612 435 423
Singapore 122 254 1 162 960 297 234 1 966 865
Thailand 262 721 448 218 811 123 1 157 263
Viet Nam 221 956 21 511 2 226 401 69 307
Total 4 123 514 4 135 356 12 852 027 6 984 461
Source: World Bank, 2013
6
1 Hall (2012) uses these UN data to assert that, since 60 per cent of workers in ASEAN are not employed in formal jobs, many intra-ASEAN migrant workers lack the protections laid out in ILO and UN conventions.

Guide on measuring migration policy impacts in ASEAN
Cha
pte
r 1
7Homeworkers and their families in Indonesia © ILO/F. Latief 2012

Guide on measuring migration policy impacts in ASEAN
Cha
pte
r 1

Guide on measuring migration policy impacts in ASEAN
Cha
pte
r 2
Cha
pte
r 2
Cha
pte
r 2
Chapter 2. Admitting foreign workers
This chapter discusses the goals of policies and programmes that admit foreign workers,
implementation measures adopted by governments, and methods to assess the impacts of
labour migration programmes. As countries reach higher levels of economic development,
the admission of foreign workers rises on the agenda of national policy-makers. Faced
with tightening labour markets at home, business enterprises begin to look for external
sources of labour and pressure their governments to admit foreign workers. Governments,
concerned with both the economic the social consequences of foreign workers, respond with
programmes that allow the entry of foreign workers to fill vacant jobs while ensuring that
local workers are not displaced. Governments are concerned about more than vacant jobs,
including protecting low-wage domestic workers and encouraging productivity growth.
In a free market, price adjustments bring supply and demand into balance, as when a storm
that reduces the availability of apples increases their price and encourages some consumers
to buy oranges rather than apples, bringing the supply of and demand for apples into balance
at a higher price. The same adjustment process occurs in the labour market. If employers seek
more workers than are available locally, wages should rise, encouraging some employers to
substitute capital for labour and take other steps to reduce the employment of more costly
labour. Meanwhile, higher wages should encourage more people to join the labour force
and seek jobs, and those already employed to work longer hours. Governments that admit
©ILO
9

Guide on measuring migration policy impacts in ASEAN
Cha
pte
r 2
foreign workers do not allow these labour market adjustments to occur for a number of
reasons, including fears that an excess demand for labour could lead to higher wages, a loss
of export markets, and inflationary pressures. Admitting migrant workers thus reduces the
wage adjustments that in a free market should reduce the demand for labour and increase
the supply of labour.
Economies and labour markets are ever changing, creating and destroying jobs. The more
dynamic the economy, the faster the expansion of jobs and incomes, but also the more
likely for labour shortages to appear if demand for particular skills increases faster than
supply, as has occurred in many dynamic Asian economies (Abella, 2013). Many of the skills
desired by employers take time and resources for individuals to develop, so there can be a
lag between the creation of new jobs and an expansion of the supply in IT, health care, and
similar sectors.
There may also be geographic shifts in the location of jobs, as when the number of farm
jobs shrinks while factory, construction, and service employment expands. Some local
workers may be reluctant to move from where jobs are disappearing to where they are
being created because they own their home or farm and do not want to move away from
family and friends. For example, in many Organization for Economic Cooperation and
Development (OECD) countries where factories and mines close, unemployment rates stay
high as local workers avoid relocating to where jobs are being created.
There are many ways to resolve the inherent conflicts of interest in deciding whether
to admit migrant workers. Labour migration is usually employer-led in the sense that
employers begin the process by asking for permission to hire migrants, and governments
develop policies that balance the interests of employers in hiring the workers they prefer
with those of local workers seeking jobs, encouraging productivity growth, and promoting
social cohesion. Researchers shape this balancing by evaluating the labour market and
other socio-economic impacts of labour migration.
This chapter outlines the main features of the policies and strategies that balance employer
and other interests. It lays out the goals of foreign worker admissions policies and the
means of assessing the effectiveness of the instruments used to implement admissions
policies. For example, almost all governments want full employment, and they also want
productivity and wages to increase over time. Admitting the proper number and type of
migrant workers can help to achieve employment, productivity, and wage goals, especially
if the migrants complement local workers. However, if the migrants are substitutes
for local workers, unemployment may rise and productivity growth may slow with easy
access to migrants. Table 2.1 summarizes the various policy goals and instruments used by
governments to achieve those goals.
10

Guide on measuring migration policy impacts in ASEAN
Cha
pte
r 2
2.1 Goals in admission of foreign workers
There are at least four important reasons why governments may decide to admit the migrant
workers requested by employers rather than allowing an excess demand for labour to lead to
wage increases:
1. Where they complement each other, the presence of migrants preserves or creates jobs and raises wages for some local workers.
2. The employment of migrants holds down the cost of non-tradable goods and services as in construction and health care.
3. Migrants can fill 3-D jobs that local workers shun.
4. It may take time to train local workers to fill jobs in fast-growing occupations such as IT, while migrants with needed skills are available immediately.
Migrants needed as complement to local workers Governments may want to admit migrant workers rather than allow wage adjustments to bring
labour demand and supply into balance because migrants complement local workers. Workers
are complements with one another if the presence of one worker creates or preserves a job for
another, such as when migrant farm workers create or preserve jobs for local farm managers.
Without migrant workers, there may be fewer jobs for local plantation managers, truckers, and
others whose jobs depend on plantation commodities.
Another example of complementarity involves domestic workers. If governments make it easy
for households to employ foreign domestic workers to care for children and the elderly, local
women who might otherwise perform these tasks are free to work for wages. Admitting foreign
domestic workers, in this case, raises the labour force participation rate of local women. In
health care, the availability of nurses and other health care workers willing to work in remote
areas or at unsocial hours can keep hospitals and other health care providers open when
they otherwise may have to close, so that migrants are the “preserving ingredient” for what
many consider essential services. Some IT firms believe that diverse work teams are more
innovative, so they add migrants to teams in order to ensure there are multiple perspectives
on understanding and resolving problems and developing new products and services.
Migrants reduce the cost of non-tradable goods Trade can be a substitute for migration, as when governments elect to allow the import of
garments from lower wage countries rather than bring in migrant sewers to make garments.
However, some goods are not easily tradable, and governments may import migrant workers in
order to reduce their cost. Reducing costs may be especially important if the good is produced
Cha
pte
r 2
11

Guide on measuring migration policy impacts in ASEAN
Cha
pte
r 2
with the help of tax monies.
Construction of buildings, bridges, and other infrastructure provide examples of “non-tradable
goods.” If contractors request migrant workers, constructions costs may be lower because wage
costs are lower. Admitting migrant workers can also speed up the completion of projects that
improve the infrastructure and improve productivity, as with bridges and other infrastructure
projects. Many construction projects involve a general contractor with overall responsibility
for the project and a number of specialized subcontractors who complete various portions of
the project. If these subcontractors hire migrants, they can leave the country after the project
is completed, putting less pressure on the subcontractor to find additional projects in order
to keep workers employed. In manufacturing, the availability of migrant workers could hold
down labour costs, improving export competitiveness, but also raise productivity, especially if
local workers shun unsocial hours of work and the availabilty of migrants justifies investments
in machines that make all workers, local and migrant, more productive. By admitting migrants,
employers may have an incentive to invest more in machinery because they can spread the
costs over more production.
Many services are hard to trade, including personal services in private homes and low-skill
services in restaurants, hotels, and hospitals. If local workers shun such service jobs, and it is
hard to raise wages because the cost of providing the service is 80 per cent or more labour
costs, governments may admit migrants to hold down wages and labour costs of “essential
services.” There can also be a public finance aspect to migrants and some services. Many
personal and health services are funded in part through taxes. Admitting migrant workers to
hold down wages reduces the need to raise taxes to provide these tax-supported services.
See Box 2.1.
Migrants do 3-D jobs There are so-called 3-D (or dirty, dangerous,
and difficult) jobs at the bottom of the labour
market that governments believe should
be filled even if local workers shun them.
Admitting foreign workers to fill such jobs
may be more acceptable than letting wages
rise. For example, for food security and
related reasons, governments may want to
support the continued production at home
of some or most of the food consumed by
citizens. If local workers shun farming jobs,
governments may decide to admit foreign
farm workers. Similarly, governments may
elect to admit domestic workers to fill
jobs in private households if these jobs are
being rejected by local workers. Domestic
12
Box 2.1 The difficult “counter-factual”While it is easy to monitor the admission of migrants, it is much harder to assess how policy goals are being achieved. Such assessments require looking at the “counter-factual” of what would have been the cost of “essential services” if foreign workers had not been available. On this basis one could estimate the savings in public resources that would have been necessary to provide the same services. Estimating how the admission of foreigners in personal services and tourism would affect wages and employment depends on the demand for such services, in particular how much substitution for local workers is likely to take place. The impact is likely to show up in reduced wages and employment of low-skill foreign workers, as has been observed in Singapore.

Guide on measuring migration policy impacts in ASEAN
Cha
pte
r 2
workers may encourage educated women to have children or enable women to work outside
the home. As countries get richer and levels of education rise, the pool of local workers
available to fill 3-D jobs tends to decline. This is rarely stated as a rationale for government
decisions to admit migrant workers, but it is often emphasized by employers who find it hard
to recruit local workers.
Migrants to fill temporary gaps The excess demand for particular types of labour can reflect fast changing economic conditions,
as in information technology (IT). If there are suddenly more IT jobs available, the local supply
of IT workers may not respond quickly because of the time needed to learn the required skills.
Employers may say that there is a demand for their IT and other services, but not enough local
workers have the required skills to do the work, so government may allow employers to recruit
migrant workers. In order to reduce the need for foreign IT workers in the future, governments
and employers may offer subsidies and encouragement to local students to obtain IT degrees
so that over time the gap between demand and supply can be narrowed.
Table 2.1 Foreign workers – Goals and strategies of receiving countries
Policy goal Issues Strategies & instruments
Full employment
of national
workers
Do foreign workers displace local
workers? Or do they complement
them?
Are foreign workers needed for
industries to be competitive?
Has the admission of foreign
labour contributed to faster
economic growth and expanded
overall employment?
Govt controls admission through
quantitative quotas and levies
Govt pre-identifies/prioritizes
skills in short supply
Govt tests for labour market
shortage before granting
employers’ request
Govt requires employers to
attest to prioritizing local
workers
Increased
productivity and
higher wages
Do industries get the qualified
workers they need?
Do industries invest in upgrading
technologies to save on labour?
Does immigration lead to
depressed wages?
Liberal policy for admission of
talents/highly skilled
Liberal quotas for strategic
sectors
Foreign worker levy differentials
by occupation
The issues raised for evaluating the impact of typical admission policies adopted by receiving
countries are summarized in Table 2.1. Pursuing one of these objectives often requires policy
instruments or programmes (third column). A proper evaluation of their impact, in turn, requires
addressing distinct but related issues, such as whether the admission of migrants displaces
13

Guide on measuring migration policy impacts in ASEAN
Cha
pte
r 2
local workers or increases total employment. The bigger question is whether the policy will aid
or hinder the achievement of the major objective of most economic policies, that is, to raise
productivity and spur faster economic growth.
2.2 Process indicators to monitor programme delivery
While policies need to be evaluated in terms of whether they achieve desired outcomes,
the link between existing conditions and governments goals is often tenuous. Most policy
administrators focus on whether they have delivered programmes (“inputs”) rather than
measuring changes due to these programmes (the “outputs”).
In order to monitor the delivery of programmes administrators rely on “process indicators”.
Figure 2.1 illustrates how administrative decisions on the issuance of work visas are consistent
with the pursuit of certain goals such as preserving local jobs where these depend on the
availability of foreign workers. The data on visas issued and employment growth at the industry
level can help to determine if migrants complement local workers. Similarly, the data on work
visas issued to low-skill migrants can help to determine if migration is filling vacancies in 3-D jobs.
Figure 2.1 Admission of foreign workers admission: Goals and process indicators
Policy goals Process indicators
In order to assess whether policy goals are being achieved one has to look beyond “process
indicators” to how conditions may have been changed by migration by monitoring “impact
indicators”. If foreign workers are being admitted with a view to preserving jobs (such as where
complementarity exists), it is important to measure growth in both output and employment
of local workers in industries with migrant workers. One should expect an increase in labour
14
Number of work visas applied
for and issued and employment
in selected industries where
complementarities exist
Number of work visas applied
for and issued for low-skill
workers
Number of work visas applied
for and issued for jobs in
construction and in state-
funded services like health
Admit foreign workers
To create or preserve jobs
of local workers
To fill 3-D jobs rejected by
local workers
To hold down cost of
critical services and non-
tradables

Guide on measuring migration policy impacts in ASEAN
Cha
pte
r 2
15
productivity where foreign workers really complement local workers. Table 2.2 identifies
possible indicators of the impact of foreign worker programmes.
Table 2.2 Indicators of the impact of foreign worker programmes
Indicator Data Key questions to consider
Labour shortage
by industry,
occupation, locality
Number of workers requested by employers vs number of
local worker applicants, by
- industry
- occupation
- locality/region
Unfilled job vacancies reported by employers
Surveys of employers
Shortages identified by
independent commissions
How many foreign workers
are requested by industries?
What % of requests are
approved?
What % of openings are
taken up by local workers?
Are shortages due to low
wages or to other factors
like gestation period for
developing skills or changes
in technology?
Share of foreign
workers in
employment
No. of foreign workers
employed (change over time)
Firm level
Industry level
Do trends in employment
of foreign workers
indicate growing “path
dependence”?
Does their share of
employment change with
economic cycles?
Trends in foreign
worker admissions
by type of control
No. of foreign workers
admitted in different
programme categories
How quickly (at firm or
industry level) are quotas
filled in each category?
Impact of labour
admissions
on industry
productivity
Growth of production in
industries employing foreign
workers
Growth of employment of
local and foreign workers
Is there much evidence of
complementarity between
local and foreign workers?
Have there been lay-offs of
locals?
Various statistical sources provide information on how foreign worker programmes affect
the labour market. Table 2.2 highlights the types of data available to provide information on
impacts, including data that are reported regularly by public employment offices, by offices
that issue work permits, and by statistical agencies that survey enterprises. As indicated in the
last column, government agencies can obtain data on:
Cha
pte
r 2

Guide on measuring migration policy impacts in ASEAN
Cha
pte
r 2
16
1. Government responsiveness to industry demand: How many migrant workers are requested by employers, by industry or sector, occupation, and geographic location, and how many are approved? Most governments have data on employer requests, but many do not publish them. Since employers are aware of government policies and priorities, they tend not to apply for permission to employ foreign workers unless they are confident their requests will be approved. It is thus not surprising that administrative records show relatively few rejections of employer requests. However, if administrative data are used as indicators of policy responsiveness, one could be misled into concluding that programme objectives have been met.
2. Domestic labour supply response: How many local workers applied for jobs that employers requested permission to fill with migrants? How are the numbers affected by the wage being offered? Data on the number of local workers who responded and were hired, and on local workers who complained that they applied for the jobs but were not hired, may be readily available but are rarely reported. Note that the absence of complaints does not necessarily mean that the testing system leads to an “optimal” number of migrant workers being admitted. Employers advertise for local workers because this is a requirement of the government before they are allowed to recruit migrants.
3. Are some industries becoming dependent on foreign workers? What happens to migrant employment by industry or sector, occupation, and area (geography) over time? Migrant worker numbers and shares by industry can generally be constructed from published data. Governments can track the share of migrants in the workforce of an employer and monitor how it rises over time except where migrant worker shares are constrained by quota or other regulations. Once migrant networks begin to take over the recruitment and training of new hires, employers can become ever more dependent on migrant workers (“path dependence”). The share of migrant workers should be of interest to governments, especially in strategic sectors such as IT where governments may allow industries to employ migrants at the same time that they encourage local workers to get trained for those jobs.
4. What happens to migrant employment during cyclical downturns? Do local workers who used to be employed in agriculture, construction, fisheries, and services return to those so-called “migrant jobs” or remain unemployed or enter retraining rather than fill 3-D jobs? It should be possible to answer these questions from data on the migrant share of the workforce and unemployment rates over time, by industry and occupation. Quotas on migrant workers are usually reduced when the unemployment rate rises, as happened in Thailand in 1997–982 and Malaysia in 2008–09; but case studies of adjustments in key industries suggest that it is very difficult to substitute local for migrant workers.

Guide on measuring migration policy impacts in ASEAN
Cha
pte
r 2
5. How do different forms of control such as quotas and foreign worker levies affect employment of and reliance on foreign labour? Is the demand sensitive to the size of the levy? How do employer-reported shortages compare with those estimated by agencies or by independent commissions for each sector? For the entire economy?
A possible logical framework for analyzing a country’s labour admission programme is
illustrated in Table 2.3. The overall objective of accelerating economic growth by removing the
labour constraint is translated into specific objectives and expected results, with appropriate
indicators and the usual sources of data. For example, ministries of labour need data from
their employment exchanges or from regular surveys of establishments to gauge the extent
to which claimed labour shortages in an industry are being met through the foreign worker
admission programme. Whether or not the programme is working to meet the specific skill
shortages of industry can be assessed using a mix of information sources. The certification that
some governments issue upon approval of an employer request for authorization to engage a
foreign worker is supposed to indicate that a specific shortage exists, but it may be desirable
to cross-check it with findings from other information sources, such as establishment surveys
and employment exchange registries.
2 Thailand planned to expel 10,000 legal foreign workers employed in rice mills by 10 July 1998. Mill operators predicted that rice
output would fall sharply despite Government assurances that replacement Thai workers would be found. Mills noted that ads for 20,000 temporary mill workers drew only 17 applicants (Migration News, 1998), prompting the Government on 15 July 1998 to reverse its decision and allow 38,000 foreign workers on rubber plantations, 23,000 on cane plantations, 3,000 on pig farms, 11,000 in rice mills, and 20,000 in fishing boats to remain until July 1999.
On 5 July 1998, an estimated 600 of 1,000 Thai rice mills closed because, the owners claimed, the Government would not permit them to employ foreign workers, and Thai workers refused to replace foreigners who have been forced to return to Myanmar. At the time, the minimum wage was US$4 a day, or $122 a month, to carry bags of rice that weigh up to 100 kilograms. A Myanmar worker reported that he had to carry 200 sacks a day, each weighing 80 kilograms, with a bonus of $0.025 a bag above the 200-sack quota (http://migration.ucdavis.edu/mn/more.php?id=1607_0_3_0).
17

Guide on measuring migration policy impacts in ASEAN
Cha
pte
r 2
Table 2.3 Logical framework analysis to evaluate foreign worker admissions
Overall objective Indicators
Information Sources
and means of
verification
Assumptions
Accelerate growth and development by easing constraints to labour supply
Increased
overall
productivity of
the economy
National household
and enterprise
surveys on
employment and
productivity
Specific Objectives
Meet specific skill shortages
Preserve jobs by complementing local skills
Reduce cost of providing vital services
Rate vacancies
are filled
Employment by
industry
Wage trends in
specific sectors
As reported to labour
ministries, which
operate employment
service offices and
also undertake
regular enterprise
surveys
Ministries of labour
undertake surveys
of establishments
and have
dedicated units
for reporting and
analyzing survey
results
Expected results
Admissions closely attuned to industry needs
Admissions
limited to
identified
shortages
No qualified
local workers
have applied for
the jobs
Admissions
do not exceed
quotas set
Data on work permits
issued
Immigration data
Certification by
Department of
Labour
Employer attestation
Overall trends in
unemployment
Employers found
no qualified
applicants for job
vacancies
Job-seekers have
access to vacancy
information
Employers actually
pay migrants
prevailing wages in
market for the skill
Admissions do not lead to displacing local workers
Unemployment
rate
Wage rates
Employers
absorb added
labour cost
Records of public
employment service
Trade unions
Complementarity
exists between
skills of local and
migrant workers
18

Guide on measuring migration policy impacts in ASEAN
Cha
pte
r 2
Overall objective Indicators
Information Sources
and means of
verification
Assumptions
Represented by
foreign worker
levy
Enterprise surveys Local workers with
same skills not
displaced
Jobs of local workers preserved with admission of complementary foreign workers
Unemployment
rate
Productivity of
enterprises
Enterprise surveys Enterprise viability
depends on
availability of
more workers,
not technology
upgrading.
2.3 Programmes and regulations to achieve policy objectives
The broad policy objectives governing the admission of foreign workers are implemented
with a variety of instruments and programmes and government agencies. These programmes
are usually activated when employers request for authorization (usually in the form of a work
permit) to engage a foreign worker. Government agencies must balance at least two goals:
1. To allow employers to hire the workers they want.
2. To protect local workers from “unfair competition.”
Giving employers easy access to migrant workers should sustain or increase economic growth,
but could lead to the displacement of local workers by migrant workers, depress wages, and
slow productivity growth. Unless government agencies are guided by quotas or lists of labour-
short occupations, employers are very likely to succeed in convincing these agencies that the
admission and employment of migrant workers will not adversely affect local workers and
the economy simply because there are rarely any data that convincingly show that migrants
adversely affect local workers. While most countries have adopted restrictions such as quotas or
outright prohibitions on the admission of different types or categories of foreign labour, others
have what has been characterized as “employer-driven” labour immigration systems where the
admissions process begins with employers requesting permission from a government agency,
such as the Ministry of Labour, to hire foreign workers to fill particular jobs. In considering such
requests, the Ministry of Labour usually invokes variety of procedural safeguards and measures
19

Guide on measuring migration policy impacts in ASEAN
Cha
pte
r 2
20
aimed at giving local workers priority or the “first call” on jobs that become available.
In the United States, this government monitoring of efforts to recruit local workers results in a
“certification” that allows the employer to hire migrants. In Asia the procedures for granting
employer requests are usually less formal and may be granted if the employer is in a sector
where government has already determined that a shortage exists and where the employer
is ready to pay a levy for each migrant worker employed, as in Singapore and Malaysia. A
variant of the “trust-the-employer” approach is what in the United States is referred to as
“attestation”, where work permits are granted after employers assert that they had tried but
failed to find local workers while offering prevailing wages and working conditions.
It is commonly assumed that employers prefer migrants to local workers because the former
will work “hard and scared”. This is the reason why trade unions often monitor government
labour market tests. The unions argue that most jobs can be filled by local workers if employers
would only raise wages and improve benefits and working conditions sufficiently to attract
local workers. In other words, there is really no shortage of local workers, only a “shortage”
of wages to attract them to fill vacant jobs. Employers, on the other hand, argue that if they
were to raise wages to the levels needed to attract local workers, the demand for their goods
and services would fall, perhaps forcing them to lay off local workers or putting them out of
business.
Nevertheless the pursuit of simple policy goals like full employment can raise a variety of issues
when temporary foreign worker policy is a means of adjusting to labour market imbalances.
It is very hard to obtain accurate snapshots of a labour market in motion. Most governments
lack detailed and timely labour market information to determine exactly where and by how
much the demand for labour exceeds supply. Some rely on employer requests for foreign
workers to determine whether there is a labour shortage and its severity.
Hire local workers first With the exception of Gulf oil exporting countries, where over 80 per cent of private-sector
workers may be foreign temporary workers, most workers in most jobs in most countries
are local citizens. Almost all governments have hire-local-workers-first policies, meaning that
foreign workers are a “last resort” for employers who cannot find qualified local workers.
However it is often hard to determine if a local worker whom the employer rejects is “qualified”
to fill the vacant job. Many local workers shun so-called 3-D jobs, and employers say that local
workers who apply for such jobs will not work hard or stick with the job. Some employers
say that so-called “soft skills”, such as a willingness to show up for work every day and to
provide service with a smile, are more important to them than hard skills such as diplomas and
knowledge of the local language, especially if the migrants are earning what for them are high
wages while local workers accept the job only until they can find a better job. Government
agencies are rarely in a position to second-guess employers about which individual is most
qualified to fill a particular job.

Guide on measuring migration policy impacts in ASEAN
Cha
pte
r 2
Table 2.4 Example of UK Migration Advisory Committee labour market indicators
Top-down data 2213 Pharmacists/pharmacologists
Skilled Skilled in top-down analysis (as calculated for our September 2008 report)
SOC skill level classification 4.0
Median hourly pay for all employees
£18.01
Percentage of employees with NVQ3+
92.6
Shortage Excluding NESS, occupation passes 4 out of 12 valid indicators
Indicators Apr 09 Sept 09
Spring 10
Indicators (continued)
Apr 09 Sept 09
Spring 10
P1 Annual percentage change of median hourly pay for all employees
2.30 2.30 11.10
V2 Annual percentage change in employment estimates
-10.40 -12.00 -8.60
P2 Annual percentage change of mean hourly pay for all employees
3.60 3.60 14.80
V3 Annual Percentage change of median total paid hours
0.0 0.00 0.00
P3 Return to occupation given NQF3, with age and region controls 0.41 0.76 14.80
V4 Absolute change in proportion working in employer under 1 year
-0.02 -0.05 -0.03
I1 Absolute change in median vacancy duration
2.20 -29.30 -8.30
E1 SSVs as a percentage of all vacancies
18.00 X 10.70
I2 Live unfilled vacancies/unemployment by sough occupation
0.36 0.35 1.07
E2 SSVs as a percentage of hard-to-fill vacancies
100.00 X 55.50
V1 Annual percentage change in unemployment by sough occupation
17.90 86.80 48.50
E3 SSVs as a percentage of total employment
0.09 X 0.10
Sensible indicators Apr 09 Sept 09
Spring 10
Apr 09 Sept 09
Spring 10
Percentage of workforce born non-EEA 12 13 20
Percentage of workforce trained in the past 13 weeks
50 54 62
Cha
pte
r 2
21

Guide on measuring migration policy impacts in ASEAN
Cha
pte
r 2
22
Determine need for migrants Without good labour market information, governments cannot formulate explicit strategies
that link migration admission decisions to expanding the employment of local workers where
“complementarities” exist, or to increasing the production of “non-tradables” that have
significant consequences for the rest of the economy. Similarly, information about processes of
skills acquisition and the time it takes to train workers to standards needed by industry rarely
features in government decisions about how many migrant workers should be admitted, over
what periods of time, and in what occupations. The same may be said of the so-called 3-D
jobs in particular industries and occupations. Often handicapped by such lack of information,
governments are seldom able to formulate explicit strategies for responding to employers’
requests for migrant workers. The usual response of most governments is to require evidence
that the employer has made efforts to find local workers but without success. This procedure is
termed a labour market or economic needs test (ENT).
In the United Kingdom the Government established a Migration Advisory Committee (MAC),
an independent body that studies labour market information to determine if there are indeed
labour shortages in occupations for which employers request migrant workers. The MAC has
developed 12 top–down labour market indicators for occupations in which employers request
permission to hire migrants: (MAC, 2008; MAC, 2010a, p. 44):
• three “price-based” indicators, such as the growth of wages in an occupation;
• four “volume-based” indicators, such as the growth of employment or the unemployment rate in an occupation;
• three “employer-based” indicators, such as employer reports of labour shortages; and
• two other indicators, including job vacancy data (Table 2.4).
The MAC considers an occupation to have a labour shortage if it passes a “median plus 50 per
cent of the median” test. For example, if the median wage increase in all occupations is 2 per
cent, the median wage increase in a shortage occupation must be at least 3 per cent to suggest
a shortage. If at least half of the 12 top–down indicators satisfy this 50+50 test, the MAC can
conclude that there is a “potential labour shortage” in the occupation and places the occupation
on the labour-short occupation list. An occupation being placed on the list eliminates the need
for employers to search for local workers before receiving permission to hire non-European
Union migrant workers. For example, the MAC concluded that there was no shortage of
pharmacists in the United Kingdom in 2009–10 because only four top–down indicators in spring
2010 suggested a shortage, among which three were “wage-based” indicators. However, most
of the employment and other indicators did not suggest labour shortages, so pharmacists were
not put on labour shortage lists despite employer requests.
Top–down analysis of labour market indicators rarely finds labour shortages. For example, Veneri
(1999) defined a labour-short occupation as one in which:

Guide on measuring migration policy impacts in ASEAN
Cha
pte
r 2
• employmentincreasedatleast50percentfasterthantheaverageforalloccupations;
• wagesroseatleast30percentfasterthantheaverageforalloccupations;and
• theoccupation inquestionhadanunemployment rate at least 30per centbelowaverage for all occupations.
Veneri (1999) found few labour shortages during the 1990s United States economic boom
using this 50+30+30 test. The top–down test suggested potential labour shortages in seven
of 62 occupations between 1992 and 1997, but only one, special education teachers, had
both top–down and bottom–up evidence of labour shortages (the bottom–up evidence was
letters from school districts saying they had trouble filling special education teaching jobs
after laws and court decisions mandated a quick expansion of services for children needing
these services). Notably, Veneri found that computer-related occupations did not satisfy the
50+30+30 top–down test of a labour shortage. Computer-related occupations had rapid
employment growth and low unemployment rates, but earnings in computer occupations did
not rise more than 30 per cent faster than earnings in all occupations.
MAC analysis of top–down indicators has also found few labour-short occupations. The MAC
can also consider bottom–up evidence from employers, unions, and others to decide whether
there is a labour shortage, and this bottom–up evidence has been decisive in most occupations
where the MAC has determined that there are labour shortages. In some cases, the MAC
decides that only some of the job titles within a broader occupation have labour shortages,
such as for primary school math teachers rather than for all math teachers. Note that the MAC
makes national rather than regional labour-shortage determinations.
Rotate the low-skilled and keep the skilled Most countries make it easier to admit highly skilled and professional workers than low-skilled
workers. Japan, for instance, imposes no limits on the admission of professional and technical
workers in 14 occupational categories but does not approve the admission of others, especially
those with low-skill.3 The Republic of Korea allows the entry of low-skilled contract workers
but imposes an annual quota on their number.
Establish quotas on employment of foreign labour Instead of labour-market tests, some countries regulate the employment of foreign workers,
especially the low-skilled, through quotas at sector and firm levels. The quota at the firm level
may be expressed as a ratio of migrant workers employed to local workers employed, and
the ratio varies by sector. In Singapore employers are allowed to hire any number of foreign
workers provided they do not exceed the firm’s quota, even without a test of the labour market
to determine whether local workers are available. Governments often specify the countries
from which employers can recruit workers, and some charge employers a monthly or annual
levy or tax for each migrant worker they employ to avoid overreliance on migrant workers.
23
3Japan did make an exception for foreign nationals of Japanese ancestry or the so-called “nikkeijins”.

Guide on measuring migration policy impacts in ASEAN
Cha
pte
r 2
Avoid “path dependence” on migrants Once employers find a reliable source of migrant workers they are freed from the usual
worries about hiring and training workers, even in occupations that have very high turnover,
like agriculture or construction. Network recruiting and training can turn what is often a daily
challenge for employers who rely on local workers into something that is handled without
their deep involvement. Experiences in many countries indicate that employers would typically
have already identified the foreign workers they want to hire before they even begin to search
for local workers. It is hardly surprising therefore that few claim they can find local workers
when required by the authorities to go through the labour market test.
Once employers have identified a source of good workers abroad, they often rely on recruiters
or networks of current workers to refer friends and relatives who would be good workers to
fill job vacancies, and these friends and relatives often train and orient the new hires. These
arrangements can be so efficient that employers become more dependent on migrant workers
over time. This behavior is symptomatic of “path dependence” on migrants that proponents of
stricter migration controls often warn policy-makers about. They advocate requiring employers
to go through more hurdles before allowing them to hire migrant workers. Employers who hire
mostly migrants may lose touch with local labour market developments, so the labour costs
and training standards of migrant-dependent employers may diverge from “normal” labour
market developments over time. For example, employers who hire mostly local workers may
offer more part-time jobs or develop ways to organize work that makes their jobs easier and
more attractive to older workers, while employers who hire mostly migrant workers do not
make such changes.
The presence of migrants can depress wages or keep wages from rising as fast as they would
if employers were restricted to local workers. With migrants keeping wages lower than they
otherwise would be, employers may not invest in machinery or other capital that raises
productivity over time, putting some on a treadmill of dependence on migrants to remain
competitive. If some local workers are employed alongside migrants, inequality can increase
if wages and benefits in migrant-dominated sectors lag behind those in other sectors of the
economy.
2.4 Monitoring the outcomes of foreign worker programmes
What are the outcomes of migrant worker programmes, and how do these outcomes
correspond to programme objectives? Most governments have information on the progress
made to implement programmes, but few actually measure whether these programmes
achieve policy objectives. Government agencies have data on employer requests for migrant
workers and the share approved and rejected, but not on displacement, complementarity, and
24
3Japan did make an exception for foreign nationals of Japanese ancestry or the so-called “nikkeijins”.

Guide on measuring migration policy impacts in ASEAN
Cha
pte
r 2
other impacts. As with efforts to reduce crime or unemployment, gaps between policy goals
and outcomes are common in public policy. However, the size of the gap between the policy
goal and outcome varies by area and issue. For example, governments can be effective with
policies that aim to ensure that children attend primary school, but less effective in ensuring
that the children learn. Similarly, governments can be more effective in requiring employers
to follow certain procedures to hire foreign workers than in ensuring that local workers have
priority to fill jobs and avoiding path dependence.
Migration goal-outcome gaps can be measured in several ways. One obvious measure is the
number of unauthorized migrants, since there being more unauthorized migrants suggests
that many employers and migrants operate outside the guest worker system. Distortion and
dependence in particular industries can be harder to measure, but one indicator is whether
employers in some sectors become ever more dependent on migrant workers over time.
One of the difficulties in policy evaluation is due to the fact that administrators often have
to make “trade-offs” between competing goals. Governments want to admit “needed”
foreign workers to fill jobs that would otherwise be vacant but “should” be filled. However,
governments also want to avoid an “overdependence” on migrant workers that can reduce
productivity growth, raise housing costs, create congestion, and impose other costs on
local residents. Governments also want to minimize unauthorized migration, which can rise
alongside legal labour migration.
Governments of origin countries want their citizens to have opportunities to work abroad at
higher wages, but also want to ensure that their citizens are fully informed when they make
decisions to go abroad to work. Migrant sending governments want to maximize remittances
and ensure that remittances contribute to development, but avoid having remittances lead
to an over-valued exchange rate and out-migration change incentives in ways that distort the
economy, as when youth drop out of secondary school in the expectation of working abroad.
These more complex effects of migrant workers often involve trade-offs between competing
goods, but governments lack the data and are thus reluctant to make explicit choices between
them. For example, what is the benchmark for productivity growth that enables governments
to determine whether “too many” migrant workers have slowed productivity growth? How
can the effects of migrants on housing costs and congestion be measured, and when does a
measurable migrant impact trigger government action?
2.5 Macroeconomic impact of immigration
Governments can estimate the macroeconomic effects of migrant workers using standard
comparative static analysis, which assumes that adding migrants to the labour force shifts
25
Cha
pte
r 2
Guide on measuring migration policy impacts in ASEAN
Cha
pte
r 2
the aggregate labour supply curve to the right along a fixed labour demand curve, increasing
employment and lowering wages in a now-larger economy. The three major economic
beneficiaries of migration in this standard economic analysis are migrants who earn higher
wages, employers who pay lower wages than they would if there were no labour migration, and
consumers who pay lower prices due to lower wages. The major losers are workers employed
before the arrival of migrants, and who now compete with these migrants.
In the United States, which has 20 per cent of the world’s international migrants, a
comprehensive 1996 analysis of migrant macroeconomic effects suggested that migrants
increased employment, depressed wages, and expanded the economy, but both the wage
depression and economic expansion effects were modest. Figure 2.2 summarizes the study,
which assumed that without immigrants, 125 million US workers would have earned an average
$13 an hour at the point labeled “E” (Smith and Edmonston, 1997). The United States had 15
million foreign-born workers in 1996, and the study estimated that their presence reduced the
average hourly earnings of all US workers, US-born and migrants, by 3 per cent (or $0.39) to
$12.60.
Adding migrant workers shifts the labour supply to the right, for a new equilibrium at point “F”
in Figure 2.2 (fewer US workers are employed at the lower wage, as some withdraw from the
labour force). Migration creates two rectangles and a triangle in Figure 2.2: (1) rectangle “C”
is a transfer between natives, from US workers whose wages are reduced to higher profits for
owners of capital; and (2) the economy expands by rectangle “D” and triangle “B”. Immigrants
get most of the benefits of this economic expansion as wages in “D”, but owners of capital
gain triangle “B” as well. Thus, labour migration benefits (1) immigrants and (2) owners of
capital at the expense of (3) native workers, whose wages are reduced.
The size of triangle “B”, the net increase in national income (in per cent) due to immigration,
was estimated as follows: 1/2 (3 per cent decrease in US wages x 11 per cent immigrant share
of US labour force x 70 per cent share of labour in US national income), or 1/2 x 0.002 = 0.001,
that is, US national income increased by 1/10 of 1 per cent due to immigration. US GDP was
$8 trillion in 1996, making the net immigration benefit “B” equal to $8 billion. Each 1 per cent
increase in GDP is $80 billion, so an $8 trillion economy growing 3 per cent a year expands by
$240 billion a year or $1 billion per working day, making “B” equivalent to about eight days
of US economic growth at mid-1990s rates.4 This small overall net increase in the US economy
prompted Borjas (1995, p. 9) to assert: “If the social welfare function depends on both
efficiency gains and the distributional impact of immigration, the slight benefits arising from
the immigration surplus [“B”] may well be outweighed by the substantial wealth redistribution
that takes place, particularly since the redistribution goes from workers to owners of capital
(or other users of immigrant services).”
26
4 In the long run, if the aggregate production function has constant returns to scale, higher profits should lead to higher investment and an outward shift in demand and an eventual return to the original wage. This means that the wage depression would persist for about a decade after a one-time infusion of migrants.

Guide on measuring migration policy impacts in ASEAN
Cha
pte
r 2
This US analysis, and similar analyses in other countries, suggest that the macroeconomic
effects of immigration are mostly distributional, although they may be more significant for
particular migrant-dependent areas and sectors. For example, if wage depression due to
migrants doubled to 6 per cent and the immigrant share of workers doubled to 22 per cent (as
in California in 1996), the size of “B” is 0.5 x 0.06 x 0.22 x 0.7 = 0.005, or 5/10 of 1 per cent. In
particular sectors, “B” can be even larger. In US fruit and vegetable agriculture, where wages
may be 50 per cent lower because of migrants, 75 per cent of farm workers are immigrants,
and labour’s share of farm revenue is about 30 per cent, “B” is 6 per cent of revenues (0.5 x
0.5 x 0.75 x 0.3 = 0.06) or $3 billion based on $50 billion in sales of fruits and vegetables. Note
that these benefits of migration, especially in the case of fruit and vegetable agriculture, are
heavily concentrated. In most commodities, the largest ten producers typically account for
over half of total sales.
E
FB
D
A$
0
Employ
C
S w/o immL
S immL
D econL
L140125
$12.60 W
1
1
$13 W0
L 0
Figure 2.2 Macroeconomic impacts of migrants: United States, 1996
27

Guide on measuring migration policy impacts in ASEAN
Cha
pte
r 2
2.6 Impact of immigration on productivity and innovation
Migrants affect more than wages and employment. Productivity growth, stimulated by
entrepreneurship and innovation, is the key driver of increasing GDP per capita. Migration
can raise productivity growth if migrants have high rates of entrepreneurship and innovation,
meaning that migration can put the economy on a higher growth path that benefits both
migrants and natives. There are many historical examples of migrants spurring innovation and
productivity growth, including the expulsion of the Huguenots from France in the sixteenth
and seventeenth centuries and their contribution to the industrial revolution in Britain in the
eighteenth century.
The second potential dynamic economic effect of migrants is on innovation, as externalities
from innovation generate endogenous growth (Romer, 1994). Migrants are widely seen as
innovators. A large share of Nobel Prizes are awarded to migrants, raising the question
of whether countries can increase the rate of innovation and raise productivity growth by
welcoming migrants. Migrants receive patents at higher rates than natives in many countries,
and one study concluded that increasing the share of college-educated migrants in a US state
was associated with up to 10 per cent more patents per capita in that state.
Migrants are sometimes associated with “strategic skills” in particular industries, such as Indians
and Chinese in the IT industry. One study (Wadhwa, et al., 2009) reported that migrants were
founders or co-founders of a quarter of the 28,000 IT start ups launched in the US between
1995 and 2008. It urged the United States to welcome migrants seeking degrees in science
and engineering and migrants with science and engineering degrees earned abroad in order
to increase the rate of innovation and IT entrepreneurship.5 George, et al. (2012) concluded
that non-European Economic Area migrants in the United Kingdom have “strategic skills”
that complement rather than substitute for the skills of resident workers, including language
and cultural skills that can facilitate trade and investment with their countries of origin.
In many countries, migrants are more likely than natives to begin new businesses. Migrant
entrepreneurship may arise from newcomers being quicker to spot opportunities and open
businesses to serve unmet needs or because lack of language and skills pushes them into
self-employment, which is often higher for migrants than the native born. Self-employment
rates vary by migrant country of origin, level of education, and other individual characteristics,
28
5 It is important to examine migrant impacts on new business formation carefully, since some of the research on migrant effects leaves the impression that, without the migrant entrepreneur, there would have been no business and no jobs for native workers. This is clearly too simplistic, since there would have been a computer chip industry even without the immigrant co-founder of Intel. Developing a more sophisticated understanding of migrant–entrepreneurship–innovation links would fill an important research gap and lay out clearer guidelines for policy on skilled migrants.
Cha
pte
r 2

Guide on measuring migration policy impacts in ASEAN
Cha
pte
r 2
29
and are especially high, for example, for Asian migrants in industrial countries. Governments
may want to investigate why some migrants are more likely to be self-employed than natives,
and the effects of high self-employment rates on business formation and job creation in the
broader economy.
2.7 Problems and issues in identifying and measuring the impact of migration
The same high-skilled migrants who can boost entrepreneurship and innovation and raise
productivity growth can also increase competition for desirable items wanted by local
residents, such as scarce housing and slots in universities, fueling local resentment of migrants.
Low-skilled migrants can also have negative consequences, as when the easy availability of
migrants discourages employers from making productivity-boosting investments in capital
that raise productivity over time. Productivity growth is the ultimate source of income growth,
and “too many migrants” can slow productivity growth, as with agriculture in many high-
income countries. Low-skilled migrants can complement local workers, but if they eventually
become settled residents, the result can be more poor people and children in poor families
who have trouble climbing the economic ladder.
Assessing the benefits and costs of migration, and measuring them precisely, is difficult.6 In
the United Kingdom the Government’s migration advisory committee, (MAC) (2012, p. 9),
suggested that the most appropriate dependent variable to assess migration policy changes
was their effect on GDP per capita of native or pre-migration residents. At the same time MAC
(2010) recognized that there are also public service and social impacts of migration which are
harder to measure. MAC separated services where the additional cost to the Government
from the arrival of migrants can be measured, such as education, health care, and similar
government-provided services, from migrant impacts on housing, crime, cohesion and similar
factors, where migrant costs are much harder to measure.
The nature of migration’s benefits and costs often makes identifying, measuring, and
evaluating them in a consistent quantitative framework very difficult. For example, migration
usually yields benefits that are immediate, as migrants arrive and go to work; measurable in
additional economic output; and concentrated in the hands of migrants, their employers,
and complementary workers. However, many of migration’s costs are deferred, often arising
Cha
pte
r 2
6 Migration policy normally answers questions such as how many, from where, and in what status newcomers arrive, while benefit–cost analysis aims to quantify benefits and costs and compare them at a common point in time.

Guide on measuring migration policy impacts in ASEAN
Cha
pte
r 2
30
with family formation or unification; are not easily measured, as with fear of crime; and are
more widely diffused, affecting those not directly involved in migration via housing prices,
congestion, and other factors.
The transition from short-run economic analysis of migrant workers to longer-run socio-
economic impacts is fraught with difficulty. Some generalizations appear appropriate. Migrants
are often different from the resident population, since they are more likely to be young and in
their working and earning years rather than in the youth and elderly age groups most likely to
benefit from government education and pension and healthcare programmes.
The question of whether migrant workers pay their way, or contribute more in taxes than
they use in tax-supported services, usually involves settled migrants with families; although
questions have been raised about migrants benefitting from subsidized utilities, transport,
and other public services. It is very difficult to isolate the taxes paid by migrants to cover the
cost of the public services they use, including schools, welfare benefits, and health care, either
at a point in time (static studies) or over time (dynamic studies). Most analysts believe that the
age structure of migrants (most are young and working age) and the fact that they are abroad
to work ensures that they pay more in taxes than they consume in tax-supported benefits.
Migrants must pay most taxes, including sales taxes on the goods they buy and property taxes
incorporated into their rents, but they are not eligible for some tax-supported services, which
should further increase their positive fiscal effects.
Many factors shape the impact of migrants on public finance The public finance benefits and costs of migrants vary with migrant characteristics as well
as the host country’s tax and spending system. The same comprehensive study of migrant
impacts in the United States economy in 1996 that estimated wage and employment
effects also developed a “dynamic fiscal effects of migrants” model that reached two major
conclusions about migrants, taxes, and tax-supported benefits in the United States (Smith
and Edmonston, 1997). First, the United States Federal Government benefits from all types
of migrants because the major taxes they pay are federal income and social security taxes
that support programmes, like defense, whose costs do not increase with more residents or
programmes that serve largely native groups, such as the elderly. Second, a migrant’s fiscal
balance, the differences between taxes they pay for and the cost of tax-supported services
they utilize, depends primarily on where the migrant lives. Low-earning migrants residing in
United States that offer a wide array of tax-supported services to low-income residents, such
as California and New York, generate a deficit that is covered by higher taxes paid by United
States-born residents in these states. States that offer fewer services to low-income residents,
including Texas, have smaller state deficits due to migrants.
Cha
pte
r 2

Guide on measuring migration policy impacts in ASEAN
Cha
pte
r 2
Need to take into account the impact of migration over time Fiscal-balance studies of taxes paid and benefits received are snapshots at a point in time.
The earnings of settled migrants tend to rise over time, and so do the taxes they pay under
progressive tax systems. The 1996 study constructed a long-run picture of migrants that
estimated their future earnings, tax payments, and the value of the government services they,
their children, and their grandchildren are likely to consume. The result was an estimate of the
present value of a migrant to the United States fiscal system of $80,000 in 1996, reflecting
a negative $3,000 for the migrant but a positive $83,000 for the migrant’s children and
grandchildren, who were assumed to have the same earnings, taxes paid, and tax-supported
benefits as native-born children.
The public finance impacts of migrants have a clear implication for immigration policy, that
is, in order to maximize the fiscal surplus from immigration, one should select young and
well-educated migrants who are most likely to find jobs and earn higher than average wages
(Hanson, 2006). Such migrants are less likely to consume tax-supported public services.
Difficult to measure impact of migration on social cohesion The British Migration Advisory Committee MAC (2012, p. 91) tried to measure the effects
of migrants on difficult factors such as how individuals and groups interact and get along
in communities. The MAC reached two major findings about migration and social cohesion
in the United Kingdom. First, it identified differences between migrant groups, which were
defined by country of origin, level of education and other factors. In the various measures of
social cohesion, the MAC found that some migrants expressed more trust in British institutions
and more feelings of belonging to Britain than some natives (the same trait in the United
States is often expressed as migrants “renewing” American ideals). Second, the degree of
social cohesion may change over time, with some migrants becoming more skeptical of British
institutions as they integrate. The MAC found that economic deprivation rather than the
volume of new migrants was most responsible for the negative indicators of social cohesion;
that is, adding more migrants in a poor area may make both natives and migrants more
distrustful of each other.
Impact of migration may change overtime History suggests that it is difficult to project how social cohesion will change over time. United
States predictions of which migrant groups would integrate most easily, and how social
cohesion would be affected by the arrival of more migrants from particular areas and with
particular religious affiliations, proved to be largely false. Continued monitoring of indicators of
integration and social cohesion may give early warnings of problems amenable to intervention
but it is very hard to predict. This was illustrated by the riots in Los Angeles in 1992 when an
incident between Korean shop owners and black customers spilled into violence.
31
Cha
pte
r 2

Guide on measuring migration policy impacts in ASEAN
Cha
pte
r 2
Impact of migration on crime The relationship between crime and migration is a long-studied topic but research has not
reached definitive conclusions. Migrants may commit crimes and may also be victims, and
there is believed to be widespread under-reporting by migrant victims of crime. Studies
suggest that young men – native and migrant – are most likely to commit crimes; although
young migrant men may be less likely to commit crimes than young native men.
Impact of migration on congestion This is also a much discussed topic associated with migrants that is difficult to assess. Migrants
seek jobs that offer higher wages, so they tend to move to economically booming areas that
also attract internal migrants. These internal movements of people tend to increase congestion
and raise the cost of housing and other services that respond slowly to increased demand; but
it is extremely difficult to calculate the marginal contribution of migrants to these increases.
In some countries, notably Australia and Canada, the immigration authorities deal with the
issue by simply adding points for aspiring immigrants who agree to settle in particular places,
often rural areas with abundant housing and little congestion, or tie temporary workers to
employers in such places.
Migration outcomes can always be improved if immigrants admitted into the country can be
more carefully selected. Do they possess the skills in short supply? Do they have the language
skills and the ability to navigate their way in the labour market? Table 2.5 shows the effect of
adopting better screening of economic migrants into Australia by comparing what per cent of
those who arrived in 1993-95 and those who arrived in 1999-2000 found employment within
six months of their arrival.
Labour markets bring workers seeking jobs together with employers seeking workers. In all
labour markets, employers utilize three R-processes to employ workers (Box 2.2).
32

Guide on measuring migration policy impacts in ASEAN
Cha
pte
r 2
Table 2.5 Impact of improved economic migration screening (1999+) on employment outcomes at six months for select General Skilled Migration birthplace groups, Australia (1993–95 and 1999–2000) (per cent)
Birthplace of select economic
principal applicants
Employment within
6 months (1993–95
arrivals)
Employment within 6
months (1999–2000
arrivals)
UK/Ireland 85 86
South Africa 76 89
North West Europe 73 83
Eastern Europe 31 79
Philippines 57 76
India 56 73
Hong Kong (China)/Malaysia/
Singapore53 68
China 45 61
Middle East/ North Africa 42 72
North, South-East, & Central Asia 40 77
33

Guide on measuring migration policy impacts in ASEAN
Cha
pte
r 2
34
Box 2.2 The three “Rs” of labour markets
Labour markets match workers with jobs, serving as a marketplace for employers seeking workers and workers seeking jobs. The three major functions of labour markets – recruitment, remuneration, and retention – are complicated by national borders.
Recruitment: Finding the best workers Employers interested in hiring foreign workers often rely on intermediary recruiters. Finding the right workers from another country is inherently more difficult than doing so locally due to differences in language, unfamiliarity with other countries’ training standards, differences in occupational classification and definitions of skills make, and more generally, about how people work. To cut costs employers, unless they are recruiting highly specialized professionals, would normally turn to professional recruiters who may have partners in source countries. The latter, in turn, may have agents in far-flung regions, hence there can be several layers between the employers who are looking for workers and the workers who have the skills they want. These layers of intermediation increase the chances for miscommunication and misinformation, which lead to poor matching of workers to jobs.
Remuneration: exchanging work for wages Work is the exchange of effort for reward, as workers give employers control of some of their time in exchange for a package of wages and benefits. Determining appropriate remuneration or wages to reflect the exchange of effort for reward may be more difficult when employers do not share the language and culture of their employees. The result may be misunderstanding of exact responsibilities and expected performance. Expectations of employers and employees are more likely to vary if the migrant sending and the migrant receiving country follow different systems or standards for defining the same occupations. Similarly, disputes are likely to arise if migrant workers sign contracts that they do not fully understand.
The results of employer–worker misunderstandings can have serious consequences for both employers and workers. An employer who has invested in recruiting a worker but later determines that the latter cannot perform is faced with the choice of either firing or downgrading the worker’s category, and thus reducing his or her salary. Workers, in turn, may feel that they are performing the job satisfactorily, at least as it was explained to them. For many migrant workers losing a job is catastrophic, especially if they have incurred debts to go abroad. Many would, in such instances, opt to stay abroad, even in an irregular status, rather than return with no way to repay debts they have incurred when they emigrated.
Retention: keeping the best workers The key to higher wages for workers and profits for firms is productivity, making more goods or providing more services with fewer hours of work. Experienced workers are generally more productive than less-experienced workers, giving employers an incentive to retain their best workers and workers an incentive to stay with firms that value their experience.
The expiration of work visas that require migrant workers to return to their countries of origin at the end of their contracts can limit the productivity growth that normally comes with having workers gain experience on the job. Employers may seek to renew or extend visas for their best workers, or encourage them to return after the minimum period abroad. Meanwhile, workers who have grown accustomed to higher wages abroad may want to stay abroad rather than return to their countries of origin.

Guide on measuring migration policy impacts in ASEAN
Cha
pte
r 3
35
Cha
pte
r 3
Cha
pte
r 3
©ILO M.Crozet 2013
Chapter 3. Recruitment: Finding migrant workers
Employers seek the most efficient way of finding workers to fill jobs. To find local workers they
can place ads in newspapers and post vacancies on employment exchanges, but the more
common practice is to ask current employees to recommend or refer friends and relatives to
fill job vacancies, a process often called network recruiting because the employer relies on
the personal networks of current workers to find additional workers. Since current workers are
likely to know both the requirements of the job and the abilities of their friends and relatives,
network recruiting is often the most efficient way of filling vacant jobs.
Where networks do not prove sufficient to meet their requirements, employers then may
turn to public employment exchanges or to commercial or ”for-profit” recruitment agents
or intermediaries. Today, most countries have publicly-funded employment exchanges (often
7 Most countries have public employment exchanges. For example, the Wagner-Peyser Act of 1933 established what are now called State Workforce Agencies. There are now over 3,400 such SWAs, and they have two major functions, labour brokering or matching workers and jobs and administering unemployment insurance programmes (Eberts and Holzer, 2004). The US Current Population Survey asks the unemployed how they looked for jobs, and in 2001 two-thirds reported contacting employers directly, half reported sending out resumes, and less than a fifth reported using public employment exchanges (jobseekers could use more than one method). Jobless workers most likely to use public employment exchanges had little education and were minorities. In the United States, private employment agencies generated more new hires, about 6 per cent, than public employment exchanges, less than 3 per cent, and both were far less than network recruiting, which generated 40 per cent of new hires, and ads, 30 per cent (Eberts and Holzer, 2004, p. 26). However, many public employment exchanges also distribute unemployment insurance benefits to jobless workers, giving some employers the perception that workers referred by public employment exchanges would really prefer to receive jobless benefits.

Guide on measuring migration policy impacts in ASEAN
Cha
pte
r 3
36
referred to as public employment services or PES) that provide free services to employers
and workers.7 Where these employment exchanges have the staff qualified to understand the
skills needed by industry and are able to test the skills of workers, employers will find it cost-
effective to recruit through them. Unfortunately only a few countries have public employment
exchanges with such capabilities, so PES typically account for less than five percent of worker-
job matches in most countries.
3.1 Intermediaries recruit migrant workers
To find workers in another country, employers generally turn to private recruiters with networks
abroad that can locate workers with the required skills and qualifications, and are familiar with
all the immigration laws, requirements, and procedures that need to be satisfied. Employers in
one country would generally not be very familiar with the qualifications of workers in another,
will not know where to find them, and will need to invest significant amounts of time and
money to navigate the legal procedures required to move workers from one country to work
in another. For these reasons, employers make use of private recruiters. Scale is also a factor.
Those seeking to employ only a single worker, such as a foreign domestic helper, will almost
always find it advantageous to recruit through a private job agent. On the other hand, a
construction company needing a few hundred workers with a variety of skills may find it more
cost-effective to recruit directly, or to get all the workers through a foreign sub-contractor.
Some private recruiters may offer services that employers find essential to obtain from outside
the firm. An example would be the recruiters’ specialized know-how in testing the suitability
of foreign applicants – especially for highly paid jobs – from a country or cultural environment
that employers may not be familiar with.
In Europe, public employment services have helped to move migrant workers over national
borders, especially under the auspices of bilateral labour agreements. For example, when
it needed foreign workers Germany negotiated agreements with source countries like
Italy, Spain, Turkey, and the former Yugoslavia. The German PES opened branches in their
counterpart offices’ source countries during the 1960s to recruit and screen guest workers.
France had similar arrangements with Italy, Portugal, and Spain. However, the role of public
employment services has declined in the past half century, and today PES generally play a
small role in matching workers and jobs locally and over borders.
Commercial or for-profit recruiters dominate job matching in the international labour market.
Employers generally pay some or all the costs when recruiting highly skilled workers such
as managers, healthcare professionals, and engineers because there are relatively few such
workers and the consequences of a poor match can be costly. On the other hand, because

Guide on measuring migration policy impacts in ASEAN
Cha
pte
r 3
there are usually many more low-skilled workers than available jobs in occupations such as
domestic service and construction labour, low-skilled workers tend to be willing to absorb the
recruitment costs and to pay recruiters to put them at the front of the queue.
The recruitment process is often a layered process with three distinct elements. First is the
employer who engages the services of a recruiter in the destination country. Then the latter
usually turns to a recruiter in the source country to find workers. Since recruiters in migrant
sending countries are often located in capital cities where the government agencies that
approve exits are found, a third layer is involved where the recruiters rely on agents and
subagents to find workers in rural areas. Workers usually make their first contact with subagents
who are paid for each worker that they bring to a recruiter’s office.
This layered process arrangement can open the door to miscommunication and excessive
worker-paid recruitment fees. For example, the destination-country recruiter may exaggerate
the wages and benefits of the job and fail to emphasize the work required, and this can be
further exaggerated in communication between the recruiter and subagents in the sending
country. As a result, there can be a significant gap between employer and worker expectations,
leading to disappointments and conflicts.
3.2 Other recruitment mechanisms
Under some countries’ labour laws, an employment or staffing agency can be both the recruiter
of workers and their sole employer at the workplace. Alternatively, the staffing agency can be
a joint employer alongside the firm that benefits from the workers’ work. Adecco, Manpower,
and Kelly Services are examples of employment, temp, or staffing agencies that usually are the
employers of the workers they recruit and place in one workplace after another.8
There are also employer organizations that recruit workers and act as the co-employer of the
workers they recruit in the workplace. Organizations such as farmer cooperatives in the United
States and Canada recruit workers in Mexico and other countries and provide payroll services,
such as administering health and work-related benefits, but they leave it to the employers to
supervise their employees in the workplace.9
In the event of unpaid wages, these employer organizations are usually found jointly liable
with the employer who owes wages to workers, so that all employers may contribute via the
cooperative to cover the unpaid wages of one member.
37
8 The American Staffing Association reported that its member firms placed an average 3 million workers a day in US workplaces in 2013, but that a total of 11 million individuals were employed by temp agencies sometime in 2013. US staffing firm revenue was almost $110 billion or about $36,700 per full-year job (www.americanstaffing.net)
9 Employer organizations can sometimes obtain work-related benefits cheaper than small employers, especially health and workers compensation insurance. In the United States, where there are 2–3 million workers under Professional Employers Organizations (PEOs), employers pay fees of 3–15 per cent of gross payroll to PEOs for their services (www.napeo.org).

Guide on measuring migration policy impacts in ASEAN
Cha
pte
r 3
3.3 Objectives behind State policies on recruitment
Government regulation of recruitment in countries of origin and countries of employment is
motivated by similar concerns and objectives. In countries of employment, governments want:
1. To enhance the efficiency of the labour market in matching workers to jobs.
2. To prevent fraud, misinformation, and various practices related to people smuggling and trafficking.
3. To protect workers and encourage agencies to follow good practices.
In countries of origin, governments seek:
1. To protect jobseekers against fraudulent job offers, misinformation, and becoming victims of trafficking
2. To regulate fees that recruiters charge workers for their services.
3. To expand job-markets abroad for national workers.
4. To shield local agencies against unfair competition from abroad.
Avoiding “worker-job” mismatch Governments in countries of origin and employment are both interested in promoting
efficiency in recruitment because inefficiencies lead to very adverse consequences. On the one
hand, inefficiencies that lead to “mismatches” of workers and jobs may cause unsatisfactory
workmanship, wasted materials, and delays in project execution that all amount to increased
costs to the employer. On the other, mismatches can cause considerable losses to workers
who may have invested substantial amounts to get to the country of employment, paying for
airfare, fees to recruiters, fees for securing clearances and travel documents, and foregoing
earnings at home. Many workers incur heavy debts to get their jobs abroad. A worker without
the skills required by the employer can end up without a job in a foreign country, or more
likely, accept a lower-paying job. Some who decide to look for other employers risk becoming
“irregular” when they over-stay their work visas in the hope of recouping their investments.
Matching workers with jobs is a complex undertaking that requires knowledge of various
occupational requirements, trade testing standards, and work place conditions. Countries of
origin and employment may not have similar or compatible systems for classifying and grading
skills, and many jobs offered are for occupations for which no common standards exist for
skills testing and certification. Many required skills and worker abilities are hard to measure
and communicate. For example, domestic workers may have the requisite skills but not the
personal traits important to maintain the employment relationship. This is the reason why
38

Guide on measuring migration policy impacts in ASEAN
Cha
pte
r 3
the Singapore Government requires applicants for a recruitment license to undergo training
and pass a test. The Philippine Overseas Employment Administration encourages agencies
to specialize in certain occupations in order to develop a deeper understanding of employer
needs and to create their own databases on workers with suitable experience and qualifications.
Professionalism in the recruitment industry is important but often sadly lacking because of the
ease of entering the business, which requires only a small capital investment. There may also
be little motivation for recruiters to bother with careful selection of workers when they feel no
obligation to the employers. This is typically the case where visa trading is rampant, a situation
where recruiters “purchase” work permits from foreign employers and derive their profit by
selling the permits to anyone willing to pay.
Campaigning against trafficking in persons Protection against abuses in recruitment poses the biggest challenge to most governments,
especially to ensure that workers do not fall victim to trafficking, false information about jobs
and outright fraud, and from having to pay excessively high fees to recruiters. In some countries,
human trafficking continues to be a huge problem, justifying coordination among agencies
using a wide variety of programmes and measures. The usual response of governments to
cases of trafficking is education, including alerting potential migrant workers about fraud in
recruitment and the forms it can take, including persons offering non-existent jobs abroad,
advertising more jobs than actually exist, and misinforming applicants about the work and
wages abroad. In most cases, public resources are spent to rescue victims of trafficking, and
fraud in recruitment is increasingly treated as a criminal offense.
Expanding markets Many migrant sending governments want recruiters to expand markets for their citizens
abroad. Some governments make it easy to obtain a recruiter license in the expectation that
more recruiters mean more opportunities for citizens to work in other countries. Expanding the
number of recruiters has led to the rapid growth of out-migration from some countries, but has
equally led to many problems with worker protection.
Instead of the quantity of foreign job placements, some countries emphasize the quality of
recruiters. The Philippines and other migrant sending governments give awards to the best
recruitment companies and the best foreign employers. These awards often provide benefits for
recruiters, including an exemption from the usual requirement to submit foreign job contracts
to the Government for approval in the Philippines, saving them considerable costs in time and
money. Good recruiters may be promoted by the Government to foreign employers and be
selected for inclusion in labour supply agreements with foreign governments.
Cha
pte
r 3
39
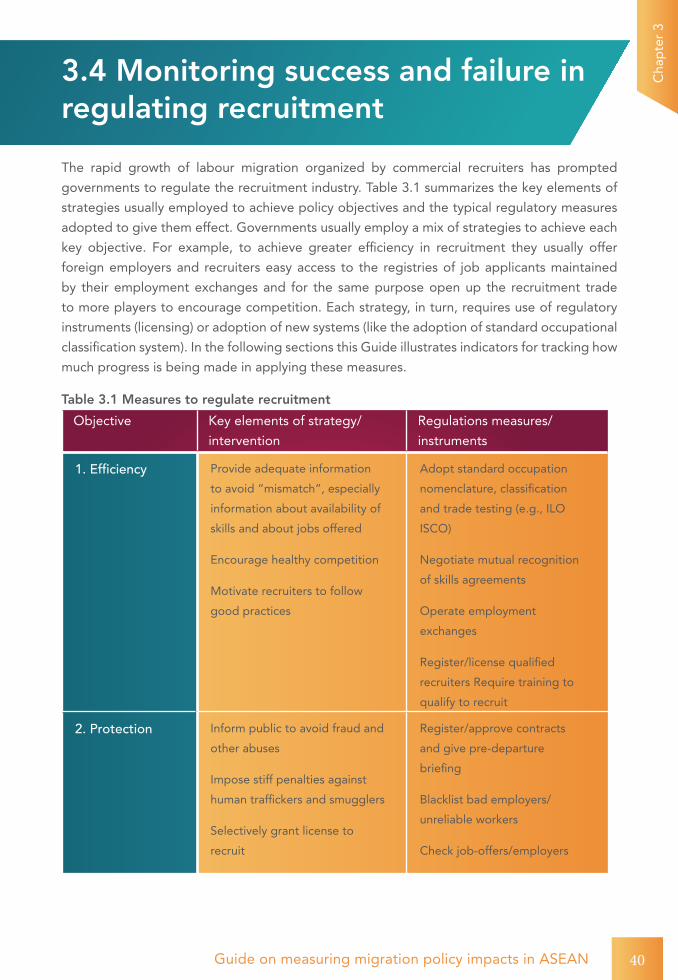
Guide on measuring migration policy impacts in ASEAN
Cha
pte
r 3
3.4 Monitoring success and failure in regulating recruitment
The rapid growth of labour migration organized by commercial recruiters has prompted
governments to regulate the recruitment industry. Table 3.1 summarizes the key elements of
strategies usually employed to achieve policy objectives and the typical regulatory measures
adopted to give them effect. Governments usually employ a mix of strategies to achieve each
key objective. For example, to achieve greater efficiency in recruitment they usually offer
foreign employers and recruiters easy access to the registries of job applicants maintained
by their employment exchanges and for the same purpose open up the recruitment trade
to more players to encourage competition. Each strategy, in turn, requires use of regulatory
instruments (licensing) or adoption of new systems (like the adoption of standard occupational
classification system). In the following sections this Guide illustrates indicators for tracking how
much progress is being made in applying these measures.
Table 3.1 Measures to regulate recruitment
Objective Key elements of strategy/
intervention
Regulations measures/
instruments
1. Efficiency Provide adequate information
to avoid “mismatch”, especially
information about availability of
skills and about jobs offered
Encourage healthy competition
Motivate recruiters to follow
good practices
Adopt standard occupation
nomenclature, classification
and trade testing (e.g., ILO
ISCO)
Negotiate mutual recognition
of skills agreements
Operate employment
exchanges
Register/license qualified
recruiters Require training to
qualify to recruit
2. Protection Inform public to avoid fraud and
other abuses
Impose stiff penalties against
human traffickers and smugglers
Selectively grant license to
recruit
Register/approve contracts
and give pre-departure
briefing
Blacklist bad employers/
unreliable workers
Check job-offers/employers
40

Guide on measuring migration policy impacts in ASEAN
Cha
pte
r 3
Objective Key elements of strategy/
intervention
Regulations measures/
instruments
Apply labour standards to
migrants
Regulate fees/ban charges to
workers
Require prior approval of job
ads
Disallow or limit worker-paid
recruitment fees
Require licensed agencies to
put up performance bonds or
guarantees
Conduct inspections
Cancel or suspend licenses and
impose stiff penalties against
trafficking and violation of
regulations
3. Employment Open recruitment business
to more companies, including
foreign-owned ones
Allow direct recruitment by
foreign employers
Use incentives to promote best
practice and development of
specialized market niches
Clear entry criteria,
transparent, efficient
procedures for licensing
One-stop service centres for
approval of contracts
Special facilities for recruiters
in good standing
Allocate quotas under labour
supply agreements
4. Competition Market reserved for local
recruiters
Promote specialization
Hold recruiters jointly liable with
foreign employers
Limit ownership and
management of recruitment
agency to citizens
Organize licensed recruiters
into associations and adopt
code of ethics
The rapid growth of labour migration from Asia to destinations within the region and to other
regions suggests that recruitment has by and large been efficient in the sense that workers
found jobs abroad, and many have returned on renewed contracts. Has state intervention
made any difference to migration outcomes? Would the growth of migration have been the
41

Guide on measuring migration policy impacts in ASEAN
Cha
pte
r 3
same even if the states adopted totally laissez-faire attitude? The Asian experience shows that
states of origin have decided that it is in the best interest of their citizenry for the government
to intervene and insure that their workers are protected against fraud and abuses, such as the
practice of “selling” work visas; advertising more job positions than what are actually on offer;
substituting contracts registered with authorities with inferior ones; deceiving jobseekers with
false information about jobs, wages, and benefits abroad; sending workers abroad with fake
visas or with no guarantee of jobs abroad; and trafficking in persons.
The prevalence of these problems is well known to administrators, but there are surprisingly
few examples of efforts to systematically monitor their incidence and the difference that
policies and regulatory interventions make to remedy them. This gap may be due to the fact
that identifying what acts are abusive or fraudulent is not easy, and administrators are more
concerned with monitoring what happens to the big cases that hit the headlines, than with
keeping tabs on the usual cases. However, without establishing programmes for continuous
monitoring of their incidence, it is hardly possible to conclude that the policies taken have
produced the desired results.
A system for monitoring successes and failures in recruitment would need to include, as a
minimum:
• Number of workers placed in jobs abroad over time, by destination country, by sex and age, by education and occupation, salary level or range, and according to how they were recruited.
• Number of workers denied entry to foreign ports and forced to return because of fake documents, by year and country of destination, by occupation, with and without registered job contracts, and profile of recruiter that sent them.
• Number of workers filing complaints with labour attaché offices abroad and police authorities at home about recruitment fraud or abuse, by type of abuse, country of intended employment, and profile of recruiter.
• Cost of recruitment as reflected in complaints filed with labour ministry against recruiters, or as determined through surveys of workers, distributed by occupation or skill, by country of destination, and by size of annual deployment by the recruiter.
• Number of workers reported by various sources (especially authorities in countries of destination) to have been trafficked, distributed by origin province or district, by age, sex and education, and trafficking routes.
Human trafficking continues to be a major problem due to many factors. Indicators of policy
effectiveness must be designed to provide answers to questions such as: Does the incidence
of trafficking decline with more investment in public information? With increased training of
border police officers and more support to local community organizations? With increased
42

Guide on measuring migration policy impacts in ASEAN
Cha
pte
r 3
investment in education, skills training, and job creation in poor regions? Or simply with stricter
enforcement of border controls?
The hardest element of the recruitment system to regulate are agents or subagents, most of
whom operate informally. Agents and subagents perform a useful function, however, because
they know recruiters who are seeking workers and workers who are seeking jobs. The problem
arises when they make oral promises to workers about the foreign jobs that may be false or
misleading. Prosecution of agent is difficult because they do not issue receipts or provide
documentation of the services they provide and the fees they collect (Rahman, 2012). Since
authorities have very few means to monitor informal activities, assessment of policy impact or
effectiveness will require less orthodox means of collecting information, such as using a panel
of key informants from local areas.
Monitoring recruitment fees and cost of migration Many Asian governments have established maximum fees that can be charged from workers
for recruitment services, but none of these governments have found a way of checking if
the regulation is observed. It is nonetheless known that unrealistic ceilings on fees are only
observed in exceptional cases, such as those made by recruiters specializing in the recruitment
of scarce skills and talents. Worker-paid migration costs can be up to a third of what low-skilled
workers can expect to earn in two or three years abroad.
Experience shows that market forces result in worker-paid fees varying inversely with the skill
of the workers. Low-skilled workers pay a higher share of their foreign earnings in recruitment
fees than high-skilled workers. This reflects the reality that there are usually excess supplies of
low-skilled workers and excess demand for the highly skilled.
Monitoring non-compliance with fee regulations is made more difficult by the fact that workers
are not motivated to report them. In order to enhance their chances of getting a job, low-
skilled workers may pay a fee equivalent to a larger percentage of what they expect to earn
abroad than those with more skills and experience. Some would not report the amounts they
actually paid to recruiters for fear of being taken off the list of selected workers. The Philippine
Overseas Employment Administration has from time to time undertaken surveys of departing
migrant workers at the airport when workers are already cleared to leave and just about ready
to board their planes. The information that can be collected in such circumstances is, however,
very limited, especially given the likely state of mind of the interviewees at the moment of their
departure.
43
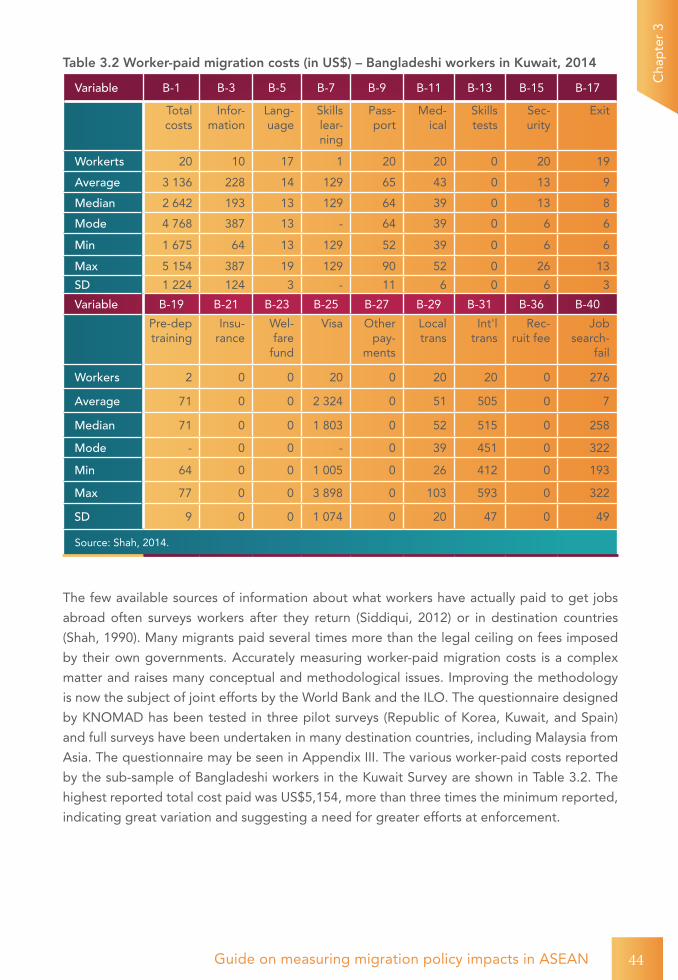
Guide on measuring migration policy impacts in ASEAN
Cha
pte
r 3
Table 3.2 Worker-paid migration costs (in US$) – Bangladeshi workers in Kuwait, 2014
Variable B-1 B-3 B-5 B-7 B-9 B-11 B-13 B-15 B-17
Total costs
Infor-mation
Lang- uage
Skills lear- ning
Pass- port
Med- ical
Skills tests
Sec- urity
Exit
Workerts 20 10 17 1 20 20 0 20 19
Average 3 136 228 14 129 65 43 0 13 9
Median 2 642 193 13 129 64 39 0 13 8
Mode 4 768 387 13 - 64 39 0 6 6
Min 1 675 64 13 129 52 39 0 6 6
Max 5 154 387 19 129 90 52 0 26 13
SD 1 224 124 3 - 11 6 0 6 3
Variable B-19 B-21 B-23 B-25 B-27 B-29 B-31 B-36 B-40
Pre-dep training
Insu- rance
Wel- fare
fund
Visa Other pay-
ments
Local trans
Int'l trans
Rec- ruit fee
Job search-
fail
Workers 2 0 0 20 0 20 20 0 276
Average 71 0 0 2 324 0 51 505 0 7
Median 71 0 0 1 803 0 52 515 0 258
Mode - 0 0 - 0 39 451 0 322
Min 64 0 0 1 005 0 26 412 0 193
Max 77 0 0 3 898 0 103 593 0 322
SD 9 0 0 1 074 0 20 47 0 49
Source: Shah, 2014.
The few available sources of information about what workers have actually paid to get jobs
abroad often surveys workers after they return (Siddiqui, 2012) or in destination countries
(Shah, 1990). Many migrants paid several times more than the legal ceiling on fees imposed
by their own governments. Accurately measuring worker-paid migration costs is a complex
matter and raises many conceptual and methodological issues. Improving the methodology
is now the subject of joint efforts by the World Bank and the ILO. The questionnaire designed
by KNOMAD has been tested in three pilot surveys (Republic of Korea, Kuwait, and Spain)
and full surveys have been undertaken in many destination countries, including Malaysia from
Asia. The questionnaire may be seen in Appendix III. The various worker-paid costs reported
by the sub-sample of Bangladeshi workers in the Kuwait Survey are shown in Table 3.2. The
highest reported total cost paid was US$5,154, more than three times the minimum reported,
indicating great variation and suggesting a need for greater efforts at enforcement.
44

Guide on measuring migration policy impacts in ASEAN
Cha
pte
r 3
Does it matter who recruits? Many countries restrict recruitment licenses to citizens of the country or to firms that are
majority owned and managed by citizens. The government’s basic justification for citizen-only
recruitment is to ensure that an entity based and operating in the country from which migrants
are recruited can be held accountable for any violation of employment contracts, such as the
failure of the employer to pay a migrant worker their earned wages. Some countries bar
foreign employers from recruiting workers directly inside their borders, requiring them instead
to go through licensed local recruiters, and many countries prohibit foreign recruiters from
soliciting business with local employers. Whether such policies lead to the desired outcomes
– better matching of skills to jobs and lower recruitment costs for migrant workers – is not
known, but information to enable an evaluation is also hardly ever collected.
Requiring migrants to register job contracts In South Asia since the colonial period migrants have been required to register their contracts
as they leave, a step prompted by abuses in recruiting and transporting workers for British
plantations. The Emigration Ordinance created a Protector of Emigrants office, a regulatory
mechanism that still exists in countries of the Indian sub-continent. Before a low-skilled migrant
worker can leave India, for example, their contract must be approved by the Protector of
Emigrants, who must also be assured that the worker has read and understands the contract.
Most Asian migrant sending countries require contracts to be registered with the concerned
authority (usually ministries of labour) before workers can leave legally. The registration
requirement is meant to check if the prospective migrant understands the contents of the
employment contract that they are entering into. However, a recent survey of Indian workers in
the United Arab Emirates found that 40 per cent of contract workers in production, transport,
and related jobs believed the job they were doing was different from that called for in their
contracts (Zachariah, et al, 2002). The survey also indicated that despite having contracts,
many migrant workers did not fully understand what they were expected to do abroad.
Providing services on-site through labour attachés Many governments in migrant sending countries post representatives in countries with large
numbers of their citizens to respond to their needs and to check on the job offers being
made by employers. Actual verification of jobs offered is necessary because language can
be deceptive. For example, a job that includes “free board and lodging” can easily mean
inadequate food and workers lodged in cramped bunkhouses with few toilet facilities. Also,
unless employers’ financial capabilities are checked, workers may end up accepting jobs in
companies that are likely to delay or miss payment of wages.
Cooperation between authorities in origin and destination countries at the recruitment stage
is clearly desirable but seldom attained. Singapore offers an example of good practice, as
exemplified by the steps its Ministry of Manpower takes to check prospective employers of
domestic workers and to give these employers instructions on how to treat their workers.
45

Guide on measuring migration policy impacts in ASEAN
Cha
pte
r 3
3.5 Models of regulation
Controlling entry into recruitment business through licensingMost governments require recruiters to identify themselves and secure a license. The grant
of a license is usually based on meeting certain conditions or criteria, which in most countries
include minimum paid-up capital, citizenship of the controlling incorporators, and absence of
any previous conviction for illegal activities or fraud. Each application would usually involve
a background check, references, and passing a test of relevant laws. Generally, only citizens
of the country with clean criminal and labour law records are allowed to become licensed
recruiters. In some countries recruitment licenses are reserved for state corporations. An
example of the requirements recruiters have to satisfy is shown in Box 3.1 for Singapore.
Many countries impose additional requirements on recruiters. Most common is the requirement
that recruiters post bonds to cover unpaid wages owed to workers. These bonds are usually
guaranteed by banks, with the recruiter paying the bank 5 or 10 per cent of the value of the
bond. Since the banks assume the risk of having to pay the entire bond if the recruiter fails to
do so, they have an incentive to check the credit worthiness of the recruiters before agreeing
to issue the bond (see more below).
Regulating recruitment feesIn order to shield workers from high migration costs, many governments ban or put a ceiling
on recruitment fees. For example, in Canada most provinces prohibit recruiters from charging
any fees to migrant workers (Box 3.1). However many governments allow fees but regulate the
amount. Enforcement can be difficult, since there is no easy way to police private transactions
between employers and recruiters or workers. Canada requires employers to certify that they
did not receive payment for job offers, an offense subject to stiff financial penalties as well as
disqualification from future access to foreign contract workers.
Legal ceilings on recruitment fees and penalties for charging more than the ceiling are almost
never enough to ensure compliance. Enforcing recruitment fee ceilings requires that:
• allowable fees are well publicized and are simple to understand;
• there is credible enforcement of the regulation such as financial penalties and criminal penalties for violators;
• receiving country governments cooperate by not allowing salary deductions for recruitment fees; and
46

Guide on measuring migration policy impacts in ASEAN
Cha
pte
r 3
• migrants fully understand the provisions of their employment contracts, so they are aware of any unlawful deductions from their wages/salaries.
47
Box 3.1 Licensing criteria for Singaporean recruiters
You must meet the following criteria before you may apply for an employment agency licence:
• You must be a Singapore citizen or permanent resident at the point of application. If you are a foreigner applying for an employment agency licence for a business/company/limited liability partnership (LLP)/Limited Partnership (LP), you are required to obtain an Employment Pass which will allow you to work in that particular business/company/LLP/LP.
• You must hold the following positions in your organizations, as registered with Accounting and Corporate Regulatory Authority (ACRA).
○ Owner (for sole-proprietorship and partnership) ○ Managing director, director or agent (for company) ○ Partner (for limited liability partnership) ○ General partner (for limited partnership)
• You must have one of the following principal activities, as registered with ACRA:
○ Maid agencies (SSIC 78103) ○ Employment agencies (excluding maid agencies) (SSIC 78104) ○ Executive search agencies (SSIC 78105)
• You cannot be an undischarged bankrupt
• You cannot have any previous court convictions records (particularly under the Women’s Charter, Children and Young Persons Act, Penal Code, Immigration Act, Employment Agencies Act and Employment of Foreign Manpower Act) in Singapore or elsewhere, of an offence involving dishonesty or human trafficking.
• You are not a director of or involved in the management of an employment agency whose licence had been revoked.

Guide on measuring migration policy impacts in ASEAN
Cha
pte
r 3
48
Requiring guarantees It is common practice in Asian countries to require recruiters to post a guarantee or security
deposit in a government-designated bank before they can receive a license. The bond is
usually issued by a financial institution on behalf of the applicant recruiter and the financial
institution has the legal obligation to make good, up to the full amount of the bond, for
any payments that the recruiter may be required to make to the government for violating
recruitment rules and regulations or to the workers whose claims for non-payment of wages
by foreign employers are judged to be valid. For issuing the bond, the financial institution
normally requires the recruiter to maintain a minimum deposit, and to pay interest on the full
amount of the bond. Since the financial institution risks having to pay more than the deposit, it
has an incentive to check on the reliability of the recruiter. In countries of employment, similar
requirements may exist whereby employers and local recruiters of foreign workers must post
bonds that can be tapped to cover unpaid wages or to cover the cost of repatriating workers
who are deported.
Box 3.2 Work BC (Canada) Temporary Foreign Workers
Programme
No one can charge a fee to a person for:
• Helping that person find a job.
• Providing information about prospective jobs.
• A foreign worker cannot be required to pay for immigration assistance as a condition of being placed in a job.
• A foreign worker cannot be required to post a bond or pay a deposit to ensure they will finish a work term or employment contract, or to pay a penalty if they do not.
• A foreign worker cannot be required to pay back any costs the employer paid to an employment agency or anyone else to recruit the worker.
See more at: http://www.workbc.ca/Employers/Find-the-right-talents/Recruitment-and-Retention/Temporary-Foreign-Worker-ProgramProgramme.aspx#sthash.dwVAu3cf.dpuf

Guide on measuring migration policy impacts in ASEAN
Cha
pte
r 3
Holding recruiters equally liable as employers There are several other ways that government agencies can enforce promises made to
workers. In some countries, notably the Philippines, local recruiters are jointly liable with
foreign employers to fulfill the terms of contracts signed by the foreign employer (or their
local agent/recruiter) and the worker. If the foreign employer refuses to abide by the contract,
the migrant can sue the Filipino recruiter upon her return and recover lost wages and benefits
from the recruiter’s bond. The intent of joint employer-recruiter liability is to insure that
someone is liable in Philippine courts for the failure of foreign employers to abide by their
obligations, and at the same time pressure recruiters to be more careful in choosing foreign
employers to whom they send workers.
Organizing labour migration through “outsourcing companies” In 2006 the Malaysian Government required employers who needed fewer than 50 migrant
workers to use designated outsourcing companies to supply and manage these foreign
workers. Those needing more could use other outsourcing companies or recruit and manage
migrants on their own. The number of outsources quickly increased from fewer than 60 in
2006 to 250 in 2012, but the policy subsequently gave rise to other problems.
In theory, the use of outsourcing companies should be a win-win proposition. Migrant worker
regulations are complex, and the employer of a few migrants may not understand them.
Outsourcers can be expected to learn the regulations and spread the cost of recruiting and
managing migrant workers over a larger labour force, increasing efficiency. The system offers
flexibility. Employers pay the outsourcer a fee that covers the cost of migrant worker wages
and benefits as well as government levies, but assume no long term obligations towards the
workers. Employers can lay off migrant workers when they are no longer needed. But because
workers managed by an outsourcer can be shifted from one enterprise to another, the workers
have a better chance at continuing employment even during a period of economic instability
when some employers slow down production or are driven out of business.
In practice, outsourcers have been associated with high worker-paid fees, runaway workers,
and widespread dissatisfaction. Since migrant workers are willing to pay for jobs in Malaysia,
many arrived in debt. Some outsourcers requested more migrant workers than they could
place, leaving migrants with contracts but no jobs (jobless migrants are supposed to be
paid 400 Malaysian ringgit a month until the outsourcer can place them in a job). Instead of
making it easier to enforce recruitment regulations, outsourcers proved difficult to regulate,
especially because of their complex links with recruiters in sending countries and with small
Malaysian employers, and in December 2013 the Government announced that outsourcers
would be phased out.10
49

Guide on measuring migration policy impacts in ASEAN
Cha
pte
r 3
Promoting consolidation in the recruitment industry The Saudi Government is encouraging its 600 recruiting agencies to form 18 mega associations
to obtain visas for the foreign workers requested by Saudi employers. Under the new structure,
the mega association rather than the employer is responsible for the welfare of the migrant
worker. Mega associations are expected to hire staff who speak the languages of migrant
workers and deal with their concerns and complaints. Some hope that mega associations will
reduce cases of sponsor–employers holding worker documents and not allowing workers to
leave the country.
Direct recruitment by foreign employers Most governments remain reluctant to allow foreign employers to recruit their citizens
directly, reasoning that the potential benefit of more foreign jobs is less than the current
costs incurred to recover unpaid wages owed to migrants. The argument that a local agent
must be available to pay unpaid wages is tempered by experience that shows, even with
local agents, it can be hard to get unpaid wages delivered to migrants. Some countries
accommodate direct recruitment on a case-by-case basis, especially where the employers
are reputable companies or are foreign government agencies, such as ministries of health.
Allowing reputable multinational recruitment companies to operate and recruit in an origin
country could help elevate recruitment practices.
Providing labour market information to facilitate recruitment Timely labour market information in both countries of origin and employment promotes
efficiency in recruitment. For example, in the European Union employers can post job offers
in the EURES system that can be easily accessed by interested workers. Some governments
make information on foreign job offers available on the websites of government agencies so
that local workers can contact foreign employers or their agents directly, potentially reducing
recruitment costs. However, such direct worker-employer contact systems function best if
there are common occupational definitions and standards. An employer’s job offer for a
carpenter or mason may attract applicants who are considered carpenters or masons in the
origin country but do not have the skills expected in the country of employment. Testing
workers for their skills can reduce the problem of mismatch but it is costly and sometimes
50
10 Phasing out outsourcers was reportedly a response to US President Barack Obama’s 25 September 2012 executive order Strengthening Protections against Trafficking in Persons in Federal Contracts, which prohibited firms with US Government contracts from buying goods produced from firms that use outsourcing firms that charge workers recruitment fees. Section 2A of the Executive Order prohibits federal contractors and subcontractors from: (i) using misleading or fraudulent recruitment practices during the recruitment of employees; (ii) charging employees recruitment fees; (iii) destroying, concealing, confiscating, or otherwise denying access by an employee to the employee’s identity documents, such as passports or drivers’ licenses; and (iv) failing to pay return transportation costs upon the end of employment, for an employee who is not a national of the country in which the work is taking place and who was brought into that country for the purpose of working on a US Government contract or subcontract. See www.whitehouse.gov/the-press-office/2012/09/25/executive-order-strengthening-protections-against-trafficking-persons-fe.

Guide on measuring migration policy impacts in ASEAN
Cha
pte
r 3
requires expensive specialized equipment (e.g., cranes and other heavy machinery used in
construction). In the case of professionals, agreement among the countries of origin and
employment to recognize skill qualifications earned in each other’s territory is also necessary.
Bilateral cooperation to minimize recruitment failuresThe Korean Employment Permit System (EPS) is an example of a bilateral government-to-
government agreement that specifies in some detail how workers are to be recruited in the
source country to fill jobs in the Republic of Korea. It was designed to eliminate intermediaries
other than public employment offices in order to minimize the costs usually borne by the
workers.
The Government of the Republic of Korea entered into bilateral agreements with 15 Asian
countries willing to supply workers and provide the free services of their publicly operated
employment offices. Applicants for jobs (www.eps.go.kr/ph/index.html) must first pass a test
of Korean language proficiency before they are placed on a list maintained by a sending
country government agency, and from such lists Korean employers select the workers they
need. Under the EPS, maximum worker-paid migration costs in the country of origin are
specified in the agreements covered by memorandums of understanding, but the cost
to workers of learning the Korean language in order to be placed on selection lists is not
specified. Figure 3.1 gives a breakdown of the EPS process.
51

Guide on measuring migration policy impacts in ASEAN
Cha
pte
r 3
52
Deciding the number of foreign workers to receiveand sending countries
Signing the MOU
Preparing and sendinga list of candidate workers
Chairman: the Minister of the Office of Government
Policy Coordination
FWPCFWPC
Committee on Employment fo Foreign
Workers
MOELMOEL
The Central Employmentinformation Centerwill be in change of
ESC of the MOELESC of the MOEL
EmployerEmployer
Foreign job seekersForeign job seekers
1
2
3
Registering to offer a job and making effortsto hire domesticworkers
4
Applying for the employment permit
6
Entry and Registration13
10 Issuing the CCVIvisa issuance
Issuing the confirmation on workforce shortages
5
Applying for theapproval of thevisa issuance
9
Recommendingworkers to bereceived out of eps pool(Employment permit)
7
Signing thelabor contract
8
Issuing the visa12
Applying for visa issuance
11
MOJMOJ
Korean mission tosending countriesKorean mission tosending countries
HRD KoreaHRD Korea
Governments of Sending CountriesGovernments of
Sending Countries
(Public authorities)
Notifying theresults of the applications for the approvalof the visaissuance
Being able to conduct worksof 8-13 when entrusted
Registering to seek jobs
Figure 3.1 Flowchart of the Korean EPS

Guide on measuring migration policy impacts in ASEAN
Cha
pte
r 3
H-2A and H-2B visas in the United States At the other end of the spectrum, governments can simply expect their employers to abide
by sending country recruitment regulations when they recruit migrant workers. This is the case
in the United States for employers given permission to recruit foreign H-2A and H-2B workers
to fill seasonal jobs (www.uscis.gov/working-united-states/temporary-workers/temporary-
nonimmigrant-workers). United States employers granted such permissions can go to any one
of 60+ countries and recruit workers who use their United States employer job offers to obtain
work visas at US consulates in their country of origin.
The US Government specifies the migration costs that employers should pay, such as
transportation costs from the place of recruitment abroad to the United States workplace.
Over time, there have been many exceptions, leading to complexity, as with employers who
reimburse worker-paid costs only after the worker has completed at least half of the contract
period.
The United States H-2A and H-2B programmes are considered to be unilateral in the sense that,
once the government certifies that the employer has a legitimate need for foreign workers,
United States employers determine exactly where and how to recruit migrant workers. The
certification process, summarized in Table 3.3, requires government agencies to quickly
determine whether employers have complied with wage, housing, and other regulations, and
tried to recruit United States workers.
Table 3.3 Example of United States H-2A certification process
Recruitment
procedure
Calendar Application procedure
Enter date of
need23-Sep-07 Days
Local recruitment begins
9-Aug-07 45 Timely filing: Two original,
signed applications must
be filed at the National
Processing Centre (NPC) at
least 45 days before Date of
Need – 655.101(c)
1 10-Aug-07 44 Copy of application sent
to State Workforce Agency
(SWA); local recruitment
begins – 655.101(c)(2)
2 11-Aug-07 43 NPC has seven days to review
application - determine cert/
deny
3 12-Aug-07 42 NPC verifies with state when
local recruitment began
53

Guide on measuring migration policy impacts in ASEAN
Cha
pte
r 3
Recruitment
procedure
Calendar Application procedure
Enter date of
need23-Sep-07 Days
4 13-Aug-07 41
5 14-Aug-07 40
6 15-Aug-07 39 NPC completes review to see
if 655.101–655.103 criteria are
met
Unacceptable application –
NPC sends rejection letter –
655.104(c). Day 7
Once “Acceptance Letter” is received – Intra/Interstate recruitment begins – Local recruitment continues
7 16-Aug-07 38 Acceptable application – NPC
sends acceptance letter –
655.105(a). Also clearance
letter to SWA to begin intra/
interstate clearance. Day 7
8 17-Aug-07 37 Intra/interstate recruitment
should begin – 653.501 and
655.105 when NPC accepts
application/job order
9 18-Aug-07 36 Employer has five days to
submit modifications to
rejection letter.
10 19-Aug-07 35 In orders for 50 or more
workers, employer must
submit results of positive
recruitment every Friday after
recruitment starts until cert
day, Day 30
11 20-Aug-07 34
12 21-Aug-07 33 Employer corrections due
if original application is
unacceptable (655.104(e) – 5
calendar days
13 22-Aug-07 32 Employer advertises for
workers – 655.105(b)
54

Guide on measuring migration policy impacts in ASEAN
Cha
pte
r 3
Recruitment
procedure
Calendar Application procedure
Enter date of
need23-Sep-07 Days
14 23-Aug-07 31 Employer must follow positive
recruitment plan submitted
(see ETA 790 attachment)
Employer's housing meets standards
15 24-Aug-07 30 State reports housing
results or status of housing
inspections. If housing
does not meet standards-
conditional entry 654.403(e),
NPC denies application
and SWA cancels orders in
clearance.
Ask for all reports (workers
comp, final recruitment report,
housing, any other unfinished
business). Two recruitment
reports – employer’s positive
recruitment and State’s
referral results. Prepare for
certification.
Employer must submit results
of positive recruitment
(planned recruitment)
and results of recruitment
instructed by NPC
SWA sends results of referrals
/ housing inspection /
modifications
Certification granted (in whole
or part) or denied (in whole or
part) – Last day for housing,
MUST meet standards –
conditional entry 654.403(c)
If Housing doesn’t meet
standards, NPC
55

Guide on measuring migration policy impacts in ASEAN
Cha
pte
r 3
Recruitment
procedure
Calendar Application procedure
Enter date of
need23-Sep-07 Days
denies application 654.403(e)
and SWA cancels orders in
clearance 654.403
SWA calculates 50% of the
work contract for referral
purposes.
25-Aug-07 29
19-Sep-07 4
H-2A workers
depart for the US
20-Sep-07 3 State ceases active
recruitment but leaves Job
Order and clearance job
orders open until 50% of
contract period is completed,
all other efforts are suspended
on date of certification.
21-Sep-07 2
22-Sep-07 1
23-Sep-07 0
3.6 Indicators to assess recruitment outcomes
What information do governments collect to assess their recruitment policies? Most
government migration data are “process indicators”, such as the number of recruiters licensed,
the number of inspections conducted, the number of workers given pre-departure briefing,
or the number of contracts approved (see Table 3.5). Bilateral agreements are also a “process
indicator” because an agreement by itself does not represent a desired outcome (e.g., more
and better jobs) although it is possible that some may wish to treat it as a desirable outcome.
56

Guide on measuring migration policy impacts in ASEAN
Cha
pte
r 3
Cha
pte
r 3
Government licensing indicators include the number of those taking the test required to be
licensed, the number who become or are licensed recruiters, their years in business under a
particular name, and the number of job matches made by a licensed recruiter during a time
period such as a year. Some governments have data on the structure of a recruiter’s business,
including the number of branch offices.11
Few governments collect data on ties between particular recruiters and employers,
although long-term employer–recruiter relationships suggest that the recruiter is satisfying
the employer. Since employers often turn to recruiters in their own countries, who in turn
deal with recruiters in worker countries of origin, another indicator would be the length of
relationships between particular recruiters.
Some sending country governments require recruiters to achieve a certain volume of
placements in order to renew their licenses, such as the Philippines’ requirement that
recruiters send at least 100 workers a year abroad. This makes it important to monitor how
many recruiters fail to live up to this qualification criterion and lose their license to operate.
Some sending country governments require recruiters to achieve a certain volume of
placements in order to renew their licenses, such as the Philippines’ requirement that
recruiters send at least 100 workers a year abroad. It will thus be important to monitor how
many recruiters fail to live up to this qualification criterion and lose their license to operate.
Table 3.4 Process and impact indicators related to regulating recruitment
Objective Process indicators Impact indicators
1. Efficiency Number of registered or
licensed recruiters
Number of contracts processed
Bilateral labour agreements
Job placements by public
employment exchanges and by
private recruitment agencies, by skill
Strength of employer–recruiter
partnerships
Trends in average wages
Number of workers prematurely
terminated
Cost of recruitment to workers and
employers
2. Protection Number of job offers/
employers checked
Workers reported to be trafficked
Trends in reported fraud
57
11 Some countries prohibit recruiters from opening branch offices, which can prompt recruiters to use subagents to recruit workers.

Guide on measuring migration policy impacts in ASEAN
Cha
pte
r 3
Objective Process indicators Impact indicators
Number of job advertisements
approved or disallowed
Number of contracts registered
/approved
Number of workers who went
through pre-departure briefing
Number of inspections
conducted
Number of licenses cancelled or
suspended
Trends in reported contract
violations, complaints received
Trends in worker-paid recruitment
fees
3. Employment Foreign employers authorized
to recruit
Bilateral agreements
Number of new employers served/
trends in direct hiring
Recruitment for old and new
destinations
4. Competition New licenses issued by
nationality of ownership,
size of recruitment, assets or
capitalization
Job placements by size and
nationality of agencies
Job placements in new destination
countries/new occupations
Some sending country governments require recruiters to achieve a certain volume
of placements in order to renew their licenses, such as the Philippines’ requirement that
recruiters send at least 100 workers a year abroad. This makes it important to monitor how
many recruiters fail to live up to this qualification criterion and lose their license to operate.
Complaint data are the top-line indicator of protection issues during recruitment available
to governments. Complaints can be filed by workers in sending or receiving countries. In
sending countries, worker complaint data can indicate particularly bad recruiters, especially if
governments maintain data on both complaints received and the resolution of such complaints.
For example, if workers who paid recruiters for foreign jobs are dissatisfied and file complaints,
but the recruiter sends the worker to the promised foreign job in exchange for withdrawing
the complaint, complaint data may not necessarily reflect the fact that the recruiter violated
recruitment regulations.
Complaints about excessive fees are another indicator. In some countries, recruiters collect
more than is allowed under regulations that establish maximum worker-paid fees, typically
one month’s foreign earnings on a two-year contract or 4.2 per cent of expected foreign
earnings. If workers file complaints, governments can record complaints, investigate them,
and order recruiters to stop overcharging workers and to refund overpayments. Once again, if
58

Guide on measuring migration policy impacts in ASEAN
Cha
pte
r 3
recruiters satisfy the worker who filed the complaint, the complaint may be withdrawn even if
the recruiter violated regulations.
Many recruitment violations are less transparent. For example, if there is contract substitution
abroad (the migrant has different wages and working conditions abroad than promised),
migrants may be unable to complain effectively, since the promise was made in the country
of origin and violated abroad. Some countries, including the Philippines, make the sending
country recruiter jointly liable with the foreign employer to fulfill the terms of the contract
approved by the migrant sending government before the migrant departed, which allows the
migrant to file a complaint after their return and get compensation from the recruiter who sent
them abroad. However, the passage of time and the frequent lack of documentation of the gap
between promises in the sending country and realities abroad can make effective enforcement
of such joint-liability regulations difficult.
Major recruitment indicators include:
• Numbers: The number of licensed recruiters, their specialization by industry or sector, area, and country or countries in which they recruit or send workers. What is the size structure of recruiters, that is, how many send more than 100, 500, or 1,000 workers a year abroad, or bring more than 100, 500, or 1,000 workers a year into a country?
• Recruitment failures: Complaint and enforcement data, including worker-filed complaints, those resolved in favor of workers and against recruiters, recruiters who lose licenses each year, and the share of recruiters who are in business more than five, ten, and 20 years. Most recruiters operate only in one country, so that data on licensed recruiters must normally be collected in both origin and destination countries in order to see recruiter relationships.
• Strength of employer–recruiter partnerships: Data on employer–recruiter and recruiter–recruiter partnerships. Market transactions can involve agents who bring workers and employers together but do not expect to conduct business with them in the future. By contrast, partners who expect a continuing relationship may develop a deep understanding of the employer’s business. Given the expectation of future business, long-term partner recruiters should be careful about the workers sent to the employer, expecting to spread recruiting costs over many placements. Theory would predict that recruiter–employer partnerships are more common at higher skill levels, where the consequences of poor worker–job matches are greater. Are there data on long-term employer–recruiter and recruiter–recruiter partnerships?
• Cost of recruitment: Worker-paid recruitment fees. Are they higher than the employer-pays-all-recruitment costs provisions of ILO Conventions or the maximum one month’s foreign salary specified in some countries’ laws? What are worker-paid migration costs, and how do they vary by migration corridor between particular countries and at different skill levels? Are there provisions for routine collection of recruitment cost data, as from workers as they leave one country, arrive in another, or
59

Guide on measuring migration policy impacts in ASEAN
Cha
pte
r 3
return to their country of origin?
• Other services provided by recruiters: What functions do recruiters serve in the workplace? What share of recruiters find and screen workers for employers versus recruiters who also supervise migrant workers at work? What share of recruiters provide housing for workers and pay them? In these cases, are recruiters joint employers with the firms where the migrants work, or are they the migrants’ sole employer?
Other indicators can suggest the efficiency of government agencies in serving migrants. These
agencies can report their revenues and costs, including balances in insurance and other funds
that are financed by migrant-paid fees to provide emergency and other services. Comparative
data on average and marginal costs to serve migrant workers could help to identify particular
aspects of the recruitment process that are handled more efficiently in one country than another.
60
Improved working conditions at PT Tesena Inovindo. ©ILO.Asrian Mirza

Guide on measuring migration policy impacts in ASEAN
Cha
pte
r 4
61
Ms Dang Thu Hoan, a young worker at the Viet Thinh Garment Factory in Ho Chi Minh City, Viet Nam. ©ILO. A. Dow 2011
Chapter 4. Regulating migrant employment
This chapter examines typical policies that regulate foreign workers while they are employed
abroad, and outlines the information available to indicate the effectiveness and impacts of
such policies.
4.1 Labour market regulation
All countries regulate their labour markets, seeking to ensure that workers receive at least
a minimum package of wages and benefits while employed in workplaces that are safe and
respectful of workers. However, the treatment of migrant workers, citizens of one country
employed in another, remains a major concern amid regular reports of abuse.
Those subject to the worst forms of abuse include victims of trafficking, who almost always
end up performing forced labour. However, even regular migrant workers face many risks, in

Guide on measuring migration policy impacts in ASEAN
Cha
pte
r 4
62
part because most are “tethered” to their employer. Many do not speak the local language or
understand their rights, and many countries with migrant workers do not extend full workplace
rights to them.
Some of the most common problems of migrant workers involve:
• Compensation: discriminatory treatment in wages, payment delays and non-payment for overtime work, deductions for recruitment fees and taxes.
• Hours of work: excessive demands for overtime work/deprivation of weekly rest days.
• Health and safety: exposure to dangerous chemicals (especially in agriculture) and safety issues (especially in construction).
• Physical maltreatment: including sexual harassment, especially of female workers.
• Housing: overcrowded/sub-standard accommodation.
• Mobility: constraints on movement, especially due to confiscation of passports by employers.
ILO Conventions and RecommendationsThe ILO has since 1919 aimed to protect “those working in countries other than their own”.
The ILO has long recognized that migrant workers are more vulnerable to exploitation and
abuse than national workers.
Under the ILO’s fundamental Conventions,12 migrant workers are entitled to the same rights
as national workers, and are covered by most other Conventions unless specifically excluded.
The ILO’s Migration for Employment Convention (No. 97), first adopted in 1926 and revised
after the Second World War in 1949, is based on equal treatment, viz. migrant workers are
entitled to “treatment no less favourable than that which they (States) apply to their own
nationals” in respect of remuneration, hours of work, holidays, apprenticeship and training,
membership in trade unions, accommodation, most branches of social security, employment
taxes, and in legal proceedings.
The ILO adopted the Migrant Workers (Supplementary Provisions) Convention (No. 143) in
1975. Convention No. 143 had two purposes. First, it requires Member States to suppress
clandestine movements and illegal employment of migrant workers. On the other hand, it also
12 The fundamental conventions are Freedom of Association and Protection of the Right to Organize Convention, 1948 (No.87); Right to Organize and Collective Bargaining Convention, 1949 (No. 98); Forced Labour Convention, 1930 (No. 29); Abolition of Forced Labour Convention, 1957 (No. 105); Equal Remuneration Convention, 1951 (No. 100); Discrimination (Employment and Occupation) Convention, 1958 (No. 111); Minimum Age Convention, 1973(no.138); Worst Forms of Child Labour Convention 1999, (No. 182)

Guide on measuring migration policy impacts in ASEAN
Cha
pte
r 4
63
requires member States to guarantee equal treatment, including free choice of employment
(subject to the condition of having worked lawfully for a fixed period) and to facilitate the
unification of families of settled migrant workers.
A number of other ILO Conventions protect the rights of migrant workers, especially the
Plantations Convention, 1958 (No.110); Safety and Health in Construction Convention,
1988 (No.167); Safety and Health in Mines Convention, 1995 (No. 176); Safety and Health in
Agriculture Convention, 2001 (No. 184); and the Domestic Workers Convention, 2011 (No.
189).
In 1990 the UN adopted the Convention on the Rights of Migrant Workers and Members of
their Families, which called for respecting the basic human rights of migrants, regardless of
their legal status, in addition to their labour rights. The issue of equal rights for migrants in an
irregular situation became a stumbling block to ratification of the 1990 UN Convention, which
came into force in 2004 after ratification by mainly countries of origin.
4.2 Markets versus regulations
Most governments prefer market-determined wages, but most also establish minimum wages
and working conditions to protect low-skilled and vulnerable workers. How these are applied
in practice, especially with respect to migrant workers, often depends on interpretations by
inspectors. There are competing goals in the admission of migrant workers, including reducing
the cost of “non-tradable” goods and services (i.e., infrastructure) while avoiding becoming
too dependent on cheap foreign labour.
Employers want greater flexibility in the labour market, being able to access workers when
and where they are needed at reasonable cost. Workers want higher wages, priority in hiring
for local jobs, and greater job security. Where the priority lies is almost never very clear, so
administrators of policy often end up making the decisions on the trade-offs between goals.
Policy objectives and implementationTable 4.1 identifies the key policy objectives that governments pursue in regulating working
conditions and the specific measures they use to achieve them. Most governments would
like wages to reflect labour productivity, since setting wages too high by regulation can push
employers to use more capital-intensive techniques and can lead to unemployment, while
setting wages too low can lead to labour-intensive production methods.
Other labour standards, such as standards on health and safety, are widely considered as
non-negotiable in modern societies, even if there have been sad industrial incidents that
show considerable lapses in enforcement. Note that safety regulations benefit migrant and
local workers (i.e., regulations on safety in construction or in plantations). During periods of
economic downturn, temporary migrant workers are usually the first ones to be laid off, and in

Guide on measuring migration policy impacts in ASEAN
Cha
pte
r 4
64
this sense are denied any security of employment. However, some governments allow migrant
workers prematurely laid off for reasons not of their own making to stay until the end of their
visa and look for another job.
Table 4.1 Working conditions: Policy objectives and regulatory measures
Working conditions Policy objective Regulatory measures
Compensation Country of employment
– pay according to
productivity
Country of origin – obtain
highest wage possible
Grant of work permit conditional on
paying equal wage
Check provisions/register contract
Labour inspection to check/curb
violations
Provide complaints mechanism/access
to labour court
Allow membership in trade unions
Hours of work Protect health of workers
Enhance productivity
Labour inspection to check/curb
violations
Prohibit making worker serve more
than one employer
Health & safety Prevent industrial accidents
that cause injuries (or even
death) and production
losses.
Site inspections to check on
conditions/safety programmes and
measures taken by enterprises
Training programmes for safety
officers
Require medical and hospitalization
insurance
Cover migrant workers with workmen
compensation
Other working conditions
Prevent all forms of
physical and sexual
harassment
Establish SOS centres and hotlines
Provide labour attaché services
Impose stiff penalties against
employers found guilty.
Job security Security but only for
duration of contract
Authorize migrants laid off due to
employer bankruptcy to find another
job.

Guide on measuring migration policy impacts in ASEAN
Cha
pte
r 4
65
Working conditions Policy objective Regulatory measures
Housing Provide decent housing Check on housing facilities prior to
approving job offers or applications
for work permits
Periodically inspect housing
Mobility in labour market
Discourage job-hopping Require worker to obtain prior
approval if changing employers
Dispute resolution Promote industrial peace Provide services of conciliators and
arbitrators
Enable migrants to join trade
unions and be covered by collective
agreements
Countries of origin and employment share concerns about the working conditions of migrant
workers. Both want workers gainfully employed in safe working environments, and they both
want all employers to obey standards on working hours, rest periods, overtime pay, and
others. Sending- and receiving-governments may differ on policies that regulate the mobility
of migrants in the labour market and regulate migrant job security, but most of their labour
market policy aims are similar. However, governments in countries of employment have more
ability to influence migrant working conditions, so much of the following discussion deals with
their activities.
Table 4.1 includes examples of the measures taken by governments to pursue their objectives.
The registration of employment contracts is the first line of defense against potential
problems. At this stage, governments of both countries of origin and employment can check
whether the workers and employers have agreed on terms of employment consistent with
labour standards.
Employers applying for work permits usually have to convince the authorities that they are
offering terms no less favorable than those offered to local workers. Labour inspections are
the next important means for effective enforcement of many policies, including payment of
proper wages and hours of work. However, labour inspections are not particularly helpful in
the case of foreign domestic workers, nor in the case of migrant workers who work offshore
in fishing for months at a time. Inspections are particularly important in hazardous industries
where many migrant workers tend to be employed, such as in construction, plantation
agriculture, or in some areas of manufacturing (e.g., textile dyeing firms).
Both countries of origin and of employment often have programmes to prepare migrant
workers for foreign employment that culminate in a general briefing or pre-departure seminar

Guide on measuring migration policy impacts in ASEAN
Cha
pte
r 4
66
before a worker gets final clearance to leave for employment abroad. Some governments
educate foreign workers bound for factories about unfamiliar hazards to health and safety.
The Republic of Korea, for example, requires newly arrived migrant workers to complete
a two-day training programme, upon arrival, while Singapore requires first time employers
of domestic workers and those who apply repeatedly within a year for work permits within
a 12-month period to undergo training on how to deal properly with domestic workers.
The Department of Labour of Hong Kong (China) has staff dedicated to resolving disputes
between employers and foreign workers and operates “hotlines” to receive complaints.
The provision of adequate housing is an important part of most contracts. Many governments
do not approve employer work permit applications unless the employer can provide
adequate housing. Housing is often poor, as documented for many construction workers
in the Gulf States of the Middle East. Poor accommodation is an equally big problem for
domestic helpers in Hong Kong (China) and factory workers in Malaysia.
The Philippine Overseas Employment Administration usually requires foreign employers to
satisfy the Philippine labour attaché of the adequacy of housing to be provided to Filipino
migrants. In countries of employment, national authorities may also inspect housing facilities.
Employers may face challenges instructing and supervising workers who have a different
language, culture, and traditions, and workers may face adjustment and adaptation
problems abroad. The likelihood of misunderstanding can rise as skill levels fall, especially if
employers hire dozens or hundreds of low-skilled workers that they see as interchangeable.
Low-skilled workers who were promised good jobs and high wages may have few
opportunities to learn about their rights under local laws or to learn the customs and practices
they are expected to observe before or after arrival, and they may see the realities of the
workplace as representing broken promises. If migrants live in dorms near their workplace
with other migrants, they often become dependent on fellow workers for information on
their rights and obligations.
Most employers rely on supervisors from the workers’ country of origin to instruct and
supervise the rest of the migrant workforce. This can ease communication but hide corruption
if the supervisors are collecting fees or showing favoritism. When workplace problems arise,
the first point of contact is normally the worker’s immediate supervisor. Some employers
have staff in personnel or human resource departments that speak the worker’s language
and to whom workers with grievances can turn to in person or anonymously. Some migrant
workers have union representatives to whom they can turn. If efforts to resolve workplace
issues with the employer fail, the worker can turn to government agencies or NGOs for
assistance. As with employer human resource departments, some government agencies
and NGOs have staff that speak the languages of migrant workers and are specialized in
migrant worker issues. One issue for many migrants is that government agencies often
operate only during work hours, which can make it hard for workers to file complaints orally

Guide on measuring migration policy impacts in ASEAN
Cha
pte
r 4
and in person, which low-skilled workers are most likely to do.
Migrant workers are normally abroad for two or three years. As their contracts near expiration,
migrants may be entitled to end-of-service payments, social security refunds, and other
payments and benefits associated with completing a contract successfully. Most migrants
know that it will be hard for them to collect such payments after they leave, lending urgency
to their efforts to collect payments and resolve any disputes that arise before they lose the
legal right to be in the county.
There can be long battles to recover monies due to migrants. Between 1942 and 1949,
about 10 per cent of the wages earned by Mexican braceros (manual labourer) in the United
States were withheld by their employers, deposited in United States banks and transferred to
Mexican banks for collection by braceros in Mexico. Most of these forced savings disappeared,
prompting the Mexican Government to create a compensation fund in 2005, six decades later,
to repay these worker earnings.13 The Mexican Government in July 2012 reported that 166,840
former braceros each received payments of US$2,771 between 2005 and 2011, for a total
$462 million. Payments are still being made, and the government estimates that eventually
194,000 ex-braceros will receive a total $510 million in long-deferred payments.
4.3 Effectiveness and impact of labour market regulation
How do governments assess the effectiveness and impacts of labour market regulations
aimed at protecting migrant workers? The information collected by governments can serve as
feedback and point to the need for policy changes by providing answers to basic questions
such as:
1. Are migrant workers receiving the minimum wage or the same wage as local workers, and do they receive these wages at all? How do migrant earnings compare to the earnings of local workers in similar jobs, and are any patterns of difference lawful?
2. What are typical migrant complaints, e.g., what share of complaints involve unpaid wages, delayed wages, and unexplained deductions? What is the average time required to investigate and resolve complaints, and how many complaints are withdrawn during the investigation process? How many complaints do labour attachés from countries of origin forward to labour inspectors, and what is the disposition of these inspectors?
3. What do unannounced inspections of migrant workplaces discover? Are there patterns of violation by industry and occupation? If yes, do governments respond with stepped up enforcement, employer education, and other steps?
67
13 Details on bracero forced savings are at: http://migration.ucdavis.edu/rmn/more.php?id=508_0_4_0

Guide on measuring migration policy impacts in ASEAN
Cha
pte
r 4
4. Do migrants receive work-related benefits that they are entitled to, including health insurance, paid holidays and vacations, pension benefits, and bonuses? How much do these benefits cost, who contributes to their cost, and how many migrant and local workers benefit from them?
The indicators developed to answer most of these questions are usually “process indicators”.
Governments collect and report data on the applications received from employers to admit
foreign workers, the number of work permits issued, the number of inspections conducted
and violations identified, the number of complaints received, and similar other information
generated in the process of enforcing measures or implementing programmes. Data reflecting
actual impact of their regulations on the wages or the health and safety of the workers are
much less available even if they are essential to assessing what difference policies make. Table
4.2 shows the types of “process indicators” and “impact indicators” that would be important
to develop to have a better idea of how government programmes work.
Table 4.2 Process and impact indicators of working condition regulations
Policy objective Process indicators Impact indicators
Country of employment – pay worker according to productivity.
Country of origin – obtain highest possible wage
Average wage by
occupation based on
contracts
Labour inspection reports
Complaints received by
labour attaché, or by labour
department
Surveys of establishment –
average wages in different
industries (* but data usually
for all workers; can only
distinguish migrant-dominated
industries from others)
Independent surveys of
migrants.
Protect health of workers
Enhance productivity
Number of labour
inspections conducted,
violations identified
regarding working hours
and overtime pay
Surveys of establishment –
hours of work in different
industries (* but data usually
for all workers; can only
distinguish migrant-dominated
industries from others)
Prevent industrial accidents that cause injuries (or even death) and production losses.
Number of factory and
plantation inspections
carried out
Accidents reported and
consequences
Employment compensation
claims
Number of workers trained
on accident prevention
Same as process indicators
68

Guide on measuring migration policy impacts in ASEAN
Cha
pte
r 4
Policy objective Process indicators Impact indicators
Prevent all forms of physical and sexual harassment
Complaints received
Cases resolved
Same as process indicators
Increase job security Termination of employment
reported by employers
Number of laid-off workers
who applied to change
employers
Employment trends based on
labour force surveys
Provide decent housing
Inspection reports No secondary source available
Discourage job-hopping
Lay-offs reported by
employers and permission
granted to applicants for
new employment
No secondary source available
Promote industrial peace
Reports of conciliators and
arbitrators
Collective agreements
registered
Migrant membership in trade
unions
Do migrant workers receive equal treatment?Most ministries of labour do not authorize labour inspectors to enquire into the country of
origin of workers, so it is often hard to compare their treatment to that of native workers.
Instead comparisons are made between conditions of work in migrant-dominated versus
non-migrant industries. Some governments have specialized labour inspection units to deal
with industries and occupations with large numbers or shares of migrant workers, including
agriculture, construction, and some manufacturing and services that include inspectors who
speak the workers’ languages and who may be familiar with common violations.
In some cases, the inspectors make unannounced visits to check on migrant work places, and
some governments offer migrant workers who have been the victims of serious violations
of labour laws a temporary legal status that allows the migrant to remain in the country
and work in order to testify against the employer. Indicators that arise from unannounced
inspections of migrant workplaces may provide more reliable indicators of compliance than
complaints. Data from random inspections can provide a basis for special employer education
programmes, as in fishing or other industries where violations of migrant worker rights are
believed to be widespread. If the employers most likely to violate labour laws also tend to hire
irregular workers, inspectors who check on wage and other labour law compliance may not
be welcomed by irregular workers who, if detected, face removal from the country. In some
69

Guide on measuring migration policy impacts in ASEAN
Cha
pte
r 4
countries, labour law and immigration law enforcement is combined, while in others separate
agencies enforce the two types of laws.
Where labour inspections cannot serve as sources of information on working conditions, it may
be necessary to survey migrant workers. Table 4.3 from a 2007 report by Chantavanich, et al.
for Thailand compares monthly wages earned by Thai workers, registered migrant workers,
and unregistered migrant workers in migrant-dominated industries. As may be expected, Thai
workers had higher wages than migrants, even compared to registered migrants. The only
exception is in construction, where migrants were receiving about the same wages as locals.
The unregistered migrants were clearly receiving much lower wages, often less than half of
their Thai counterparts.
Table 4.3 Monthly wages of Thai workers, registered migrant workers, and unregistered migrant workers in Thailand
Sector Monthly wage (in thousand Thai baht)
Thais Registered migrants
Unregistered migrants
Agriculture 3.0 – 4.5 3.0 – 4.0 1.0 – 1.5
Construction 3.0 – 6.0 4.5 – 6.0 3.3
Domestic work 5.9 – 7.0 1.0 – 4.0 0.7 – 1.0
Entertainment 5.0 – 10.0
Factory 5.5 3.0 – higher 1.0 – 3.0
Fishery 10.0 3.0 – 4.5 2.8 – 3.9
Fishery-related work 5.0 – 6.0 3.0 – 4.5 2.8 – 3.9
General labour 4.3 – 5.0 1.0 – 5.0 0.6 – 3.0
Source: Table 3.1, Chantavanich, et al., 2007.
Most process and impact indicators used to assess working condition regulations can only
infer their effectiveness in protecting migrants. There are some possibilities for separating
information on migrant workers, such as complaints received and reported by units of
ministries of labour that are assigned to attend to migrant worker issues.
Complaints as indicatorsMost government agencies record the number and nature of complaints and how they were
resolved. Complaints filed by employers and workers and their resolution can be used to
detect patterns of compliance and violations by industry, occupation, and area. However, the
reliability of cases filed and their disposition may provide only a partial picture of compliance
if complaint data are incomplete. Indicators of employer compliance and migrant satisfaction
include:
70

Guide on measuring migration policy impacts in ASEAN
Cha
pte
r 4
• number of complaints filed against employers and the number of migrants terminated before the end of their contracts as a share of the number admitted and employed;
• nature of complaints made by employers and migrant workers about violations of contracts;
• when in the expected period of employment these complaints occurred; and
• reasons for employer terminations of migrants and migrant quits, and when in the contract terminations and quits occurred.
The most common complaints made by migrant workers against their employers involve
wages, including delayed or unpaid wages and unexplained deductions from wages. It is
important to take into account how such disputes are resolved. Disputes involving one or
a few workers are usually resolved informally, and may only reflect a misunderstanding.
However, the way disputes involving more workers are resolved may be more complicated
and difficult to monitor since they may involve lengthy court proceedings.
Labour attachés from migrant sending countries often check on the wages and working
conditions of migrants. In some cases, labour attachés greet arriving migrant workers and
have routine access to them in workplaces and hostels, as with Mexican SAWP workers in
Canada. In other cases, labour attachés have limited contacts with migrant workers unless
the worker approaches the embassy or consulate seeking help. The number and capacities
of labour attachés to help migrant workers varies widely depending on the origin and the
destination countries.
Typical use of the “process indicators” that many governments have developed is shown in
Table 4.4, data on complaints received by the Philippine Consulate in Dubai during the first
three quarters of 2008 and 2009. The data show an improvement in the resolution of cases
(mostly through conciliation) even though there was no increase in assigned personnel. The
report deals with administrative processes, and does not say whether workers were better
protected because of the services provided.
Origin country involvement extends to protection issues arising outside the workplace. Some
migrants run afoul of the laws of the host country and end up in jail. Consular officials may be
notified each time one of their nationals is arrested for violating local laws, or only when an
arrested migrant faces serious charges. In some cases, there are protocols in place to involve
consular officials when group activities may violate local laws, including labour disputes such
as strikes or demonstrations and protests.
71

Guide on measuring migration policy impacts in ASEAN
Cha
pte
r 4
Table 4.4 Action on labour and welfare complaints received by Philippines Consulate in Dubai, first three quarters 2008–09
2008 2009Change
(%)
# % # %
Cases received 3 562 100 4 280 100 +20.1
Cases resolved 3 121 88 4 029 94 +29.0
Cases pending 441 12 251 06 -43.0
Source: Philippine Consulate Dubai as cited in Agunias, 2010.
The number of complaints filed by migrant workers may not reflect employer adherence to
wage and working conditions laws. Relatively few migrant workers file labour law violation
complaints, a fact that prompts two reactions. Some employers say that the lack of migrant
worker complaints reflects widespread adherence to labour laws among employers. These
employers often claim that migrants are highly valued “partners in production”, asserting
that the employer would go out of business without migrants. Some NGOs and unions, on
the other hand, counter that employer violations of labour laws are widespread, but that
migrant workers do not complain because: (1) they may not know their rights and recognize
violations of labour laws; and/or (2) migrants may be afraid to complain for fear of losing their
jobs and the right to be in the country.
Table 4.5 Process indicator: Status of cases filed in 2008 at POEA as of 15 Oct. 2009
%
1 month or less 2
More than 1 month to 3 months 14
More than 3 months to 6 months 21
More than 6 months to 9 months 13
More than 9 months to 12 months 5
More than 12 months to 18 months 3
Still pending 42
100
Source: Philippines Overseas Employment Administration (2009)
72

Guide on measuring migration policy impacts in ASEAN
Cha
pte
r 4
The number of terminations and complaints, as well as their resolutions, have to be interpreted
with care. First, employers may terminate workers who refuse to agree to wages and working
conditions that differ from those promised before departure, or workers may refuse to perform
the jobs to which they are assigned because their assignments differ from what they agreed
to before departure. Second, recruiters who collect fees from migrants may have incentives
to recruit “too many” workers, so that some terminations may reflect recruiter incentives to
“over-recruit” rather than unsatisfactory workers.
In some countries, employers who are found to violate labour laws frequently, or who are
especially egregious violators of labour laws, can be labeled by government agencies and
barred from recruiting additional migrant workers or they are made to pay higher fees. In
the United States, employers who repeatedly violate regulations under the H-1B high-skilled
migrant worker programme are labeled as “willful violators” and barred from obtaining more
H-1B workers.
Trade unions and NGOs can also file complaints, but they are often “ad hoc”. Instead, periodic
reports from surveys of establishments undertaken by governmental bureaus of statistics
that cover all workers can be analysed. Where certain industries are dominated by migrant
workers, such as construction in Singapore, the furniture industry in Malaysia, or fisheries in
Thailand, establishment surveys can indicate trends in wages and conditions of employment
of migrant workers. There may also be independent surveys of migrant workers conducted
by researchers that shed light on wages and cost of recruitment. Hui (2013) used government
data on trends in productivity and real wages to examine productivity.
Unions including the National Trade Unions Congress of Singapore or the Malaysian Trades
Union Congress have programmes dedicated to migrant workers. They can provide data on
the number of migrants that have joined as members, the number covered under collective
agreements, and cases of rights violations that they helped migrants resolve through the
courts. Many countries allow migrant workers, and sometimes irregular migrant workers, to
join unions in order to bargain for higher wages and improved benefits.
A particularly delicate issue is whether immigration authorities should conduct checks during
union-organizing drives, which could chill worker enthusiasm for union representation.
In countries where labour and immigration law are enforced by separate agencies, labour
agencies can notify immigration enforcement agencies when union drives are underway so
that immigration enforcement agencies refrain from enforcement activities until the union
election is completed.
73

Guide on measuring migration policy impacts in ASEAN
Cha
pte
r 4
4.4 Interpreting indicators
Employers want productive migrant workers to maximize production and profits, workers
want to maximize earnings and savings, and governments want satisfied employers and
workers in workplaces that adhere to labour laws. Government goals related to migrant
workers mostly centre on ensuring that employers and migrant workers abide by applicable
laws in and outside the workplace.
Governments have an interest in assuring that employers pay and migrant workers receive
the wages and work-related benefits due them, since failure to enforce wage and working
condition laws could: (1) benefit offending employers at the expense of law-abiding
employers; and (2) encourage some employers to prefer to hire migrants in order to lower
labour costs, which could disadvantage local workers.
The big question is understanding how the various goals in migration policy interact, such
as the goals of (1) filling low-skilled jobs in ways that (2) protect low-skilled resident workers
from adverse effects while (3) not slowing productivity growth. The first two goals can work
against each other, and the analytic question is how to design guest worker programmes that
best achieve the triangle of goals. The same triangle of migration goals appears in policies
that aim to (1) attract the “best and brightest” foreigners and (2) induce residents to earn
degrees in science and engineering while (3) promoting innovation in strategic industries.
In both cases, it is very hard to develop an analytic framework to measure progress toward
achieving migration goals and trade-offs between them.
Trade-offs and shared interestsThere is no easy way to determine which of the sometimes competing goals in migration
policies deserves the highest priority. Admitting migrant workers should boost output and
employment, but may hold down the wages of some local workers and overall wage and
productivity growth. Migrant workers and their families can push up the costs of housing and
other items consumed by both migrants and local residents, just as the presence of migrants
can increase competition for goods and services in fixed or limited supply, from mass transit
to parks and, for settled migrants with children, to university slots and hospital beds.
Most newly arrived workers are on probation as employers evaluate their abilities to perform
the job satisfactorily before they become “regular” employees after 60 or 90 days have
elapsed under two- or three-year contracts. There may be pressure on both employers and
migrant workers to make the employment relationship “work” during this probationary
period even if the employer or worker has doubts. For example, the employer may have
paid a levy or fee to the government for the right to hire migrant workers that may not be
refundable, making the employer reluctant to terminate the worker, while migrant workers
74

Guide on measuring migration policy impacts in ASEAN
Cha
pte
r 4
may have incurred pre-migration recruitment costs that they want to repay from higher wages
abroad, making them reluctant to quit and return home.
Interagency coordinationThere is wide variance in the formality used by government agencies to resolve disputes
involving migrant workers. Some government agencies prefer informal and administrative
redress mechanisms so that disputes involving migrants can be resolved quickly, since migrants
may lose their right to be in the country legally if the dispute involves a termination. In other
cases, government agencies may initiate legal procedures to show employers that they are
serious about compliance with labour laws, even if the result is a lengthy judicial process.
Some countries allow aggrieved migrant workers to stay even if they were fired or beyond the
normal end of their work contracts in order to testify in judicial proceedings against serious
violators of labour and immigration laws.
Government agencies other than labour ministries or departments are also involved with
migrant issues such as those responsible for inspecting the housing provided to migrant
workers and the means by which they are transported to and from work; the police who
monitor compliance with traffic and other safety laws; health and social welfare agencies; and
institutions that deal with education of migrant children.
75

Guide on measuring migration policy impacts in ASEAN
Cha
pte
r 4
76Garment Factory in the Philippines ©ILO. A. Dow 2011

Guide on measuring migration policy impacts in ASEAN
Cha
pte
r 5
Portrait of a woman with her cheeks decorated with yellow “thanaka” paste. City of Yangon (Rangoon). ©ILO/M. Crozet
77
Chapter 5. Recommendations and next steps
This Guide helps policy-makers to respond to employers who request permission to hire
foreign workers. It provides background analysis of the labour market testing performed by
government agencies that respond to employers seeking permission to hire temporary foreign
workers; outlines the issues involved in regulating the recruitment of foreign workers; assesses
the opportunities and challenges of monitoring the employment and earnings of foreign
workers; and lays out the framework to assess the broader economic and non-economic
impacts of migrant workers.
The AEC 2015 promises more labour mobility among the ten ASEAN Member States. This
Free Trade Agreement aims to liberalize labour migration in top–down fashion by allowing
selected professionals, such as accountants and nurses, to move within ASEAN and have
their credentials recognized in the ASEAN country to which they move, as when Cambodian
nurses move to Singapore and are recognized there as nurses. However, the mechanics of free
migration for selected professionals are not yet in place, leaving questions such as: Where
migrant nurse present their credentials to have them recognized? What timelines govern the

Guide on measuring migration policy impacts in ASEAN
Cha
pte
r 5
78
issuance of work and residence permits after a migrant arrives and finds a job? And what are
the appeals procedures for migrant accountants or nurses who believe they were wrongly
denied any required licenses and permits?
Most labour migration in ASEAN involves low-skilled workers moving from poorer to richer
ASEAN Member States, as from Indonesia to Malaysia or from Myanmar to Thailand. ASEAN
Member States have programmes to admit and protect low-skilled migrant workers, but many
migrant workers are outside these programmes, giving governments less control over labour
migration and leaving migrant workers with fewer protections. The goal of this Guide is to
provide practical advice to policy-makers and administrators to help them to deal with the
four fundamental aspects of labour migration, viz. determining whether migrant workers are
needed, regulating recruitment, monitoring wages and working conditions of migrants, and
assessing the overall impacts of labour migration.
5.1 Economics needs tests
Most international labour migration is employer-driven in the sense that employers request
permission from government agencies to hire temporary foreign workers. Governments often
face a trade-off between competing goods when deciding how to respond to employers.
On the one hand, they want employers to fill vacant jobs and thus contribute to economic
growth, but on the other hand they want to protect local workers from “unfair” competition
and encourage employers to make investments that raise productivity.
Few governments have articulated reasons to admit migrant workers. Instead, they reject the
alternative of allowing labour markets to make the “natural” adjustments that would flow from
rising wages in labour-short sectors, viz. a reduced demand for labour and increased supply
and allow employers to recruit and employ migrants. Governments have economic reasons
to allow employers to hire migrant workers, from complementarity, as when the presence
of migrant plantation workers creates jobs for local managers and processing workers, to
reducing the costs of non-tradables, such as construction infrastructure and child and elderly
care. If migrants can hold down wages and labour costs in sectors that are supported in part
by taxes, there is less need to raise taxes.
After making the decision to allow employers to hire migrants, governments must decide
exactly how migrants will be admitted. Should employers rely on recruiters at home and
abroad to find workers, or should migrants be admitted by creating arrangements between
government agencies? Private recruiters may be more efficient at finding workers, but recruiter
activities often raise concerns about migrant worker fees and protections.
The major challenge for government agencies is a lack of useful information and analyses of
available data. Governments often have administrative data on how many employers applied

Guide on measuring migration policy impacts in ASEAN
Cha
pte
r 5
79
for migrant workers and the disposition of employer requests, but they frequently lack data
on whether local workers are available to fill vacant jobs; whether employers honestly tried to
find local workers; and whether the presence of migrants is complementing local workers and
raising productivity or displacing local workers and slowing productivity growth.
Furthermore, many government agencies lack the staff and expertise to interpret available data.
Since decisions about whether and how many migrant workers to admit can be controversial,
some governments establish quota and levy systems that spell out when and how many
migrant workers can be admitted. However, even if the admissions system is spelled out in
law or regulation, government agencies need data to assess the labour market and broader
effects of migrant workers. Some governments rely on independent commissions to analyse
labour market data, and the limited experience with such commissions suggests that they can
improve the quality of the debate over the need for and effects of migrant workers.
Governments with migrant workers need mechanisms to collect and analyse labour market
and other data so that they can determine whether particular sectors of their economies
are developing path dependencies on migrants that are acceptable or should be slowed.
In many countries, dependence on migrant workers rises over time, as when almost all of
the workers employed in fisheries or as labourers on plantations or at construction sites are
migrants. Governments need mechanisms to collect and analyse data on the effects of such
concentrations of migrant employment on an ongoing basis.
5.2 Regulating recruitment
Most employers find migrant workers with the help of private recruiters. The major motivation
to work abroad is the wage wedge, the fact that wages abroad are five or ten times higher
than at home. Private recruiters take some of this wage wedge for the services they provide,
viz. matching jobs in one country with workers in another.
The policy question is how much of this wage wedge should be absorbed by recruiters and
how government agencies can ensure that recruiters do not take advantage of migrants
(employers are less likely to be “cheated” by recruiters because of competition between
recruiters to provide workers). Most governments require recruiters to identify themselves by
obtaining licenses, and many make obtaining and renewing recruitment licenses contingent
on recruiters posting bonds and taking other steps to ensure that there will be funds to pay
any aggrieved workers.
Regulating recruiters is an ongoing process important to migrants, employers, and
governments. Good worker–job matches at “reasonable” costs to migrants lead to a more
satisfied labour force and less need for governments to deal with terminated workers,
runaways, and other special cases.

Guide on measuring migration policy impacts in ASEAN
Cha
pte
r 5
80
The major mechanism for encouraging “good” worker–job matches is a contract between the
employer and migrant worker that lays out wages, benefits, and responsibilities. Employers
usually submit these contracts to government agencies for approval before sending them to
recruiters, and sending country governments often check the contracts of departing migrants.
As a result, all parties should know their rights and responsibilities.
In practice, the contract may provide only a partial picture of actual wages and work. Migrants
may pay more fees than are specified in the contract, or be assigned to a job different from
that described in the contract or with a different rate of pay and with different deductions.
Dealing with such “recruitment failures” can absorb a great deal of the time of employers,
migrants, governments, and NGOs and unions.
Best practices to manage recruitment include standard contracts for various types of workers
to make it easier to educate both employers and workers about contract provisions. Best
practices also include clear regulations that specify who pays what expenses and specify
maximum worker-paid fees. Maintaining a database of approved contracts in government
agencies in both sending and receiving countries can expedite the resolution of disputes.
In some cases, government-to-government agreements that rely on public agencies may
be both efficient and protective of workers, while in others employer cooperatives that deal
with government agencies may prove superior to the private recruiters who now move most
migrant workers over borders.
Recruitment procedures and regulations vary, reflecting the particular circumstances of each
migration corridor. Regardless of how recruitment occurs, clear and transparent regulations
and procedures that are enforced uniformly and effectively are optimal.
5.3 Monitoring migrant wages and impacts
International labour migration is a journey of hope and fear: hope for higher wages and more
opportunities abroad, and fear of the unknown and exploitation. ILO Conventions and national
laws emphasize equal treatment: migrant workers should receive the same wages and benefits
as local workers. There are many reasons for stressing the importance of equal treatment,
including the fact that treating migrant workers equally is the best way to protect local workers
from “unfair migrant competition”.
Ensuring equal treatment is easiest if migrant workers are legal, have contracts, and are aware
of their rights and responsibilities while employed abroad. Employers are usually more aware
of local labour laws than migrants, and they are the key actors in either ensuring that migrant
rights are protected in the workplace or taking advantage of their migrant employees by
violating labour laws. Migrants who are aware of their rights can keep employers honest, and
migrants are more likely to do so if they are supported by governments, unions, and NGOs

Guide on measuring migration policy impacts in ASEAN
Cha
pte
r 5
that make migrants aware of their rights and help to rectify violations.
Most employers want to fill jobs and get work done, so they announce policies that aim
for compliance with contracts and labour laws. However, employer policies may not be
implemented fully and effectively, especially if employers rely on outsourcers or other entities
to manage and house migrant workers. Employers have a responsibility to ensure that their
policies promising equal treatment and protection are fulfilled by all entities in the migrant
worker chain.
Some employers hire migrants to gain a competitive edge via lower labour costs. If worker
exploitation spreads as a business model, ever more employers may hire migrants to reduce
labour costs and stay competitive, setting in motion a “race to the bottom” that culminates
in unsafe workplaces and perhaps a ban on goods produced by exploited migrant workers.
Most government agencies know about migrant worker “problem spots”, but they often
lack the resources and political will to tackle persistent reports of labour law violations.
Furthermore, enforcing labour laws may disadvantage migrants, such as when migrants who
are not being paid full wages are deported if the offending employer dismisses them. The
usual best practice is to bring employers into compliance through education, fines, and other
inducements that ensure continued employment for migrants and, in extreme cases, by
giving migrants the right to change to other employers.
Migrants affect labour markets, industries, and the broader society. Governments that open
doors to migrant workers should explain clearly to their citizens why migrants are needed and
why labour migration is beneficial to employers, migrants, and society at large. Governments
need to take the lead in heading off xenophobia, which can arise when large numbers of
migrants congregate in particular places. Migration is an ongoing process to manage, not
a problem to solve, and requires government agencies that actively monitor and act on
migration issues.
5.4 Next steps
This Guide lays out the challenges and opportunities facing governments in countries where
employers request permission to recruit migrant workers. The Guide spells out the major
tasks of government administrators and reviews the options available to them to manage
labour migration.
Some of the challenges are universal, such as devising mechanisms to ensure that local
workers are given the first opportunity to fill vacant jobs. Others have no easy answer, such
as how to balance employer requests for migrant workers at today’s wages versus allowing
wages to rise in order to encourage employers to make productivity-increasing investments.
Some challenges require innovative thinking, such as acknowledging that there are rarely
81

Guide on measuring migration policy impacts in ASEAN
Cha
pte
r 5
enough resources to effectively police all recruiters. The most efficient way to protect migrant
workers may be to separate recruiters into groups based on their record of adhering to
regulations and allowing the best recruiters to police themselves.
Migration means change – change for migrants who move and for the countries they leave
behind; change for employers and workers in destination countries; change for the destination
countries themselves; and change for the entire region. Migration policies developed for
one country or region may not be appropriate in another, or may have to be modified to be
useful. We hope that this Guide can be discussed in seminars and used to develop migration
policies that better achieve the migration goals of governments.
82
A shipyard worker, Batam, Indonesia. © ILO. Asrian Mirza

Guide on measuring migration policy impacts in ASEAN
Cha
pte
r 6
83
©ILO/M.Crozet 2013
Chapter 6. Measuring migration policy impact in Malaysia
6.1 Foreign worker dependency in Malaysia
Malaysia is one of the largest destination countries in Asia for the recruitment and employment
of low-skilled foreign workers. It is also a significant sending nation for high-skilled labour.
Despite considerable cross-border labour mobility, estimating the stock and flows of in-
migrants is difficult due to fluidity in cross-border labour movements and the relatively large
presence of undocumented foreign workers. There are also no official records on Malaysians
working abroad. Data on foreign workers from the different official sources vary considerably
(See Table 6.1). The Department of Immigration keeps records of all migrants with valid work
permits. These are stock figures and present the most reliable estimates of documented
foreign workers in the country, especially since the mid- 1990s.14
This chapter was written by V. Kanapathy
14 A more systematic documentation of foreign workers in the country only began in 1992 with a program to register all foreign workers in the country.

Guide on measuring migration policy impacts in ASEAN
Cha
pte
r 6
84
Based on work permits issued, the number of foreign workers in the country has increased
more than three-fold from around 0.7 million in 1995 to 2.3 million in 2013, plus an unknown
number of unauthorized foreigners. The Ministry of Human Resources estimated 6.7 million
foreigners in the country in November 2014 (Bernama News Agency, 2014) suggesting 4.4
million unauthorized foreigners. This is despite the most recent legalization and amnesty
programme for undocumented foreigners code-named “6P” that was launched on August
2011 by the Ministry of Homes Affairs to address the problem of undocumented workers.
During the 6P legalisation programme, 2,088,358 foreign workers were registered, of whom
1,135,499 did not hold valid documents. Clearly the 6P Amnesty Programme to address
the problem of undocumented workers has failed to reduce the number of undocumented
workers. In 2014, foreign workers account for about 48 per cent of the labour force or about
22 per cent of the total population. In terms of the number employed, foreigners outnumber
locals at about 52 per cent. More importantly, between 2005 and 2013 documented foreigner
workers alone accounted for more than a third of the increase in the labour force.
Table 6.1 Malaysia’s population and labour force by nationality, 1995-2013, various sources
1995 2000 2005 2010 2013 Growth rate (%)
1995-2000 2000-2013
Total population
(mil)
20.68 23.49 26.75 28.96 29.81 2.60 1.80
Malaysian
citizens
19.68 22.08 24.36 26.79 27.43 2.30 1.70
Non-Malaysians* 1.00 1.41 2.39 2.17 2.38 7.10 4.10
Malaysia five-year development plans
1995 2000 2005 2010 2013 Growth rate (%)
1995-2000 2000-2013
Labour Force
(‘000)
8 254.00 9 571.60 11 290.50 12 406.80 14 084.60 3.00 3.00
Local 7 401.30 8 820.60 9 512.90 10 864.30 11 752.30 3.60 2.20
Foreign 852.70 751.00 1 777.60 1 542.50 2 332.30 -2.50 9.10
Low-skill workers n.a. 732.60 1 742.10 1 500.00 2 250.30 - 9.00
Expatriates n.a 18.40 35.50 42.50 82.00 - 12.20
Ratio of skilled
foreign workers
(%)
- 2.5 2.0 2.8 3.5 - -
This chapter was written by V. Kanapathy

Guide on measuring migration policy impacts in ASEAN
Cha
pte
r 6
85
Foreign labour
as a % of labour
force
10.30 7.80 15.70 12.40 16.60 - -
Department of Immigration
1995 2000 2005 2010 2013 Growth rate (%)
1995-2000 2000-2013
Number of work
permits issued
(‘000)
726.70 799.70 1,9450 1,817.90 2,250.30 1.0 8.3
Foreign labour
as a % of labour
force
8.80 8.40 17.20 14.70 16.00 - -
Annual labour force survey
1995 2000 2005 2010 2013
Foreign labour
as a % of labour
force
6.30 12.60 9.80 n.a. n.a. - -
Note: Includes permanent residents, foreign workers with work permits, expatriates and foreign students.Source: Malaysia (2006), Ninth Malaysia Plan, 2006-2010, Malaysian National Printers Berhad, Kuala Lumpur. Malaysia (2001), Eighth Malaysia Plan, 2001-2005, Malaysian National Printers Berhad, Kuala Lumpur. Malaysia (1996), Seventh Malaysia Plan, 1996-2000, Malaysian National Printers Berhad, Kuala Lumpur. Unpublished figures from Department of Statistics, Malaysia. Unpublished figures from Department of Immigration, Malaysia
The number of non-citizens in 2000 was 6.0 per cent of the total population compared to 4.3
per cent in 1991 (Department of Statistics, Population Census, 1991 and 2000).15 By 2010, it
had risen to 7.5 per cent (Table 6.1). This is particularly evident in the state of Sabah where
there has been a five-fold increase in the total population from 0.6 million in 1970 to 3.5 million
by 2013. Cross-border labour mobility in Sabah differs from that in the Peninsula. Migrants in
Sabah include political refugees from the Philippines who migrated in the 1970s and economic
migrants in later years. Unlike the Peninsula, migration in Sabah involves full family formation.
Sabah also relies heavily on foreign workers, where documented foreign workers account for
about half of the workforce.
Trends in foreign workers are closely tied to the economic cycle. Foreign workers have
augmented local labour and relieved wage inflationary pressures during an economic
upswing, but have been downsized when the economy slows down (see figure 6.1). The
15 Note that Malaysia does not have an official policy to grant permanent resident status to foreign workers but about half of the non-Malaysian citizens are reported to be permanent residents.

Guide on measuring migration policy impacts in ASEAN
Cha
pte
r 6
86
profile of low-skilled foreign workers is largely influenced by policy measures designed to
restrict and regulate their inflow as well as policies of the sending countries. The nationality
of foreign workers has changed drastically, especially since the turn of the century. In 2000,
about 75.0 percent of the documented low-skilled foreign workers were from Indonesia, but
in 2013 their share fell sharply to less than half (45.4 per cent). Malaysia has been a preferred
destination for Indonesians due to similar language and culture, geographical proximity as
well as the extensive Indonesian migrant and social network developed in Malaysia over the
years. However, Indonesia’s self-imposed restrictions on sending workers to Malaysia over
the treatment of its migrant workers, and more significantly the improved performance of the
Indonesian economy in recent years have reduced their presence in Malaysia. More foreign
workers are now recruited from South Asian countries. Nepal is now the second biggest source
of foreign workers (about 17.0 per cent), followed closely by Bangladesh (14.3 per cent).
About a third of low-skilled foreign workers are employed in manufacturing, while agriculture
absorbs about a quarter. The construction sector, which employed about a tenth of migrant
workers since 2000, has increased its share to about a fifth in 2013, following a period of
growth in the construction industry. There was a sharp fall in the number of domestic workers,
both in terms of numbers and as a percentage in recent years. Following the ban on domestic
workers from Indonesia, the number of domestic workers fell by about 30 per cent from around
247,000 in 2000 to 170, 000 in 2013.16
Foreign labour dependency has been rising steadily for all sectors, reaching a peak in 2008.
Figure 6.2 charts the proportion of low-skill foreign workers within each sector based on the
work permits issued. From 2008 to 2011, the proportion of foreign workers fell marginally
before rising again. This trend is most likely due to the higher incidence of undocumented
workers prior to the 2011 amnesty, legalization and crackdown on undocumented foreign
workers. The agriculture and construction sectors have the largest share of foreign workers
at about 37 and 35 per cent respectively. These ratios are underestimates as the incidence
of undocumented workers in these two sectors is relatively high. Interestingly, a third of the
workforce in manufacturing also consists of low-skilled foreign workers. Overall, only 4 per
cent of the workforce in the entire services sector is low-skill foreign labour, though foreign
labour dependency in the wholesale, retail, hotel and restaurant services is expected to be
high as the majority of the foreign workers in the services sectors are employed here. In
addition, the domestic worker sector is almost entirely filled by foreign nationals.
The skills structure of foreign workers in the country may not support the goal of Malaysia
becoming a developed nation with a per capita income of US$15,000 by 2020. Skilled foreign
workers, commonly referred to as expatriates, represent 2 to 3.5 per cent of foreign workers in
the country. The employment of high-skilled labour has traditionally been tied to foreign direct
16 The decline was due to the self-imposed moratorium by Indonesia, the details of which are explained later in the report.

Guide on measuring migration policy impacts in ASEAN
Cha
pte
r 6
investment (FDI), particularly in manufacturing. With the decline in FDI, the number of skilled
foreign workers has likewise fallen from a peak of about 60,000 in the 1980s to around 18,000
in 2000. However, following the policy reforms to facilitate the intake of high-skilled workers,
their presence has now risen almost five-fold.17 They are now largely employed in the services
sectors (42 per cent) and in the information technology sector (18.0 per cent). On the other
hand, the employment of foreign skilled labour in manufacturing has fallen by almost half from
17,490 in 2004 to 9,610 in 2014.
In 2014, the majority of high-skilled migrants were from India (20.1 per cent) followed by China
(12.5 per cent). This is understandable as both these countries have a surplus of both high and
low-skilled workers. Interestingly, Indonesia which has traditionally been an important source
country for low-skilled labour, has in recent years become the third largest origin country for
high-skilled labour. Within South Asia, apart from India, both Bangladesh (5.3 per cent) and
Pakistan (3.6 per cent) are important origin countries for high-skilled labour.
87
17 The former Employment Pass Division within the Immigration Department was transformed into a one-stop centre known as the Expatriate Services Division in December 2012 to provide improved integrated services to expatriates and their dependents. Further, a Residence Pass-Talent was introduced in April 2011 and it is offered to highly-.skilled expatriates who seek to live and work in Malaysia on a long-term basis, i.e. up to 10 years. The Pass allows its holders to change employers without having to renew the pass, bring in their spouse and dependents below 18 years and also allows the spouse to seek employment without having to apply for the Employment Pass.

Guide on measuring migration policy impacts in ASEAN
Cha
pte
r 6
88
1998
1997
500 0
1 00
0
1 50
0
2 00
0
2 50
0
-2 5
00
-2 0
00
-1 5
00
-1 0
00
-500
2 046810 -10
-8-6-4-2
Num
ber
of
mig
rant
sG
row
th r
ate
1995
1 47
1.60
Num
ber
%
7 25
.70
745.
20
1 12
7.60
697.
2080
7.1084
9.80
1 06
7.50
1 33
7.001 47
0.10
1 81
5.20
1 86
9.20
2 04
4.80 1 06
2.60
1 91
8.10
1 81
7.90
1 57
3.10
1 57
1.60
2 25
0.30
1996
1999
2000
2001
2002
2003
2004
2005
2006
2007
2008
2009
2010
2011
2012
2013
Fig
ure
6.1
Num
ber
of
do
cum
ente
d m
igra
nt w
ork
ers
Sour
ce: D
epar
tmen
t o
f Im
mig
rati
on
(unp
ublis
hed
dat
a), M
inis
try
of
Fina
nce,
Eco
nom
ic R
epo
rt, v
ario
us is
sues

Guide on measuring migration policy impacts in ASEAN
Cha
pte
r 6
89
5.00
-
10.0
0
15.0
0
% 2
0.00
25.0
0
30.0
0
35.0
0
40.0
0
Serv
ices
Year
Man
ufac
turi
ng
Co
nstr
ucti
on
Ag
ricu
ltur
e
2000
2001
2002
2003
2004
2005
2006
2007
2008
2009
2010
2011
2012
2013
Fig
ure
6.2
Shar
e o
f fo
reig
n w
ork
ers
in m
ajo
r ec
ono
mic
sec
tors
, 200
0-20
13

Guide on measuring migration policy impacts in ASEAN
Cha
pte
r 6
Table 6.2 Number of documented foreign workers in Malaysia by nationality and sector, 1990-2013
1990 2000 2010 2013
#
(‘000)
% #
(‘000)
% #
(‘000)
% #
(‘000)
%
Foreign workers * 242.0 100.0 807.1 100.0 1 817.9 100.0 2 250.3 29.81
By Sector
Domestic workers - - 177.5 22.0 247.1 13.6 169.9 7.6
Manufacturing 25.1 10.4* 307.2 38.1 672.8 37.0 751.8 33.4
Construction 25.1 10.4 68.2 8.5 235.0 12.9 434.2 19.3
Services 76.0 31.3** 53.7 6.7 165.3 9.1 269.3 12.0
Agriculture 115.8 47.9 200.5 24.8 497.7 27.4 625.1 27.8
By nationality
Bangladesh 59.5 24.6 158.1 19.6 319.5 17.6 322.8 14.3
Pakistan 1.2 0.5 3.1 0.4 28.9 1.6 50.7 2.3
Nepal 0.2 0.1 0.7 0.1 251.4 13.8 385.5 17.1
India 7.3 3.0 18.9 2.3 95.1 5.2 124.0 5.5
Indonesia 168.0 69.4 603.5 74.8 792.8 43.6 1 021.7 45.4
Others 5.8 2.4 22.8 2.8 330.1 18.2 345.8 15.4
Notes: * Includes mining
** Includes domestic helpers
Source: Department of Immigration as cited in Ministry of Finance, Economic Report, 2004/2005, Kuala Lumpur (for 1990); Department of Immigration (unpublished data)
90

Guide on measuring migration policy impacts in ASEAN
Cha
pte
r 6
Table 6.3 Number of expatriates in Malaysia, 2010 & 2014
Country 2010 2014
# % # %
Bangladesh 1 878 5.8 4 443 5.3
India 5 888 18.1 16 977 20.1
Nepal 173 0.5 338 0.4
Pakistan 1 406 4.3 3 074 3.6
Indonesia 1 735 5.3 6 516 7.7
Singapore 1 249 3.8 2 457 2.9
Thailand 573 1.8 1 762 2.1
Myanmar 521 1.6 978 1.2
China 3 206 9.8 10 525 12.5
Japan 2 248 6.9 5 029 6.0
Korea, Rep. of 1 399 4.3 2 511 3.0
Taiwan (China) 589 1.8 1 181 1.4
Iran 706 2.2 1 933 2.3
Australia 1 023 3.1 1 637 1.9
Others 9 989 30.7 24 938 29.6
Source: Department of Immigration (unpublished data)
Table 6.4 High-skilled foreign workers by sector, 2004-2014 (per cent)
Sector 2004 2010 2014*
Services 44.6 63.1 42.0
Manufacturing 40.3 22.5 11.4
Education 3.7 6.1 7.7
Petroleum 3.4 0.1 7.9
Construction 3.2 6.8 7.6
Trade 2.8 1.2 1.3
Transport 0.9 0.1 1.3
Information technology 0.0 0.0 18.8
Others 1.1 0.2 3.9
Total
(number)
100.0
(43 406)
100.0
(32 583)
100.0
(84 299)
Note: * As of January 2014Source: Department of Immigration (unpublished data)
91
Guide on measuring migration policy impacts in ASEAN
Cha
pte
r 6
6.2 Foreign worker policy in Malaysia
The Malaysian economy has been dependent on low-skilled foreign labour since the late-
1970s, but an explicit policy on foreign labour was only announced in 1995 when it became
apparent that foreign worker dependency had speedily extended beyond agriculture and
construction to the manufacturing and services sectors. In the 1995/96 annual budget, the
government announced “the import of foreign labour as an interim solution to meet excess
demand for low-skilled labour, while it pursued a longer-term strategy to increase productivity
and expand the supply of skilled labour” (Ministry of Finance, 1996, p.39). This implies that the
reliance on foreign workers is a temporary phenomenon. However, more than three decades
of empirical evidence has shown that agriculture, manufacturing, construction and selected
services sectors continue to rely on foreign labour to remain competitive, and increasingly so.
There has been no change in the national policy on foreign labour, though from time to time, it
has set targets to reduce foreign worker dependency. A target was set to cap the total number
of workers at 1.5 million by 2010 (MOHR website, 14 May 2006). This deadline to reduce the
number of foreign workers to 1.5 million has now been extended to 2015, but based on the
latest trends in foreign worker dependency the target may be unattainable once again. As
noted earlier the total number of foreign workers in the country is estimated at 6.7 million,
with about two-thirds undocumented.
There is mounting empirical evidence on the important contribution of foreign labour to output,
employment and export expansion, more so than ever during times of difficult growth. Key
sources of growth, such as palm oil, construction and labour-intensive manufacturing industries
such as the electrical and electronics, wood and textile-based industries are heavily reliant
on foreign labour to remain profitable and competitive. The long-term excessive reliance on
foreign labour has had significant social, economic and political ramifications on the entire
economy. Despite the far-reaching consequences for the economy, foreign labour policy in
Malaysia has been narrowly conceived. It has been viewed as a temporary phenomenon with
the policy focus on the supply-side management of foreign labour through an expansionary
immigration policy. This has been executed through the transfer of the management of foreign
labour from the Ministry of Human Resources (MOHR) to the Ministry of Home Affairs (MOHA).
The national policy on low-skill foreign labour has to be reviewed with a view to realigning
and integrating it with the national development goals and strategies and to identify clear and
consistent pathways to attain these objectives.
The institutional infrastructure to manage foreign workers was further revamped and expanded
in 2005 to address weaknesses in foreign worker management (see figure 3). The remit of the
Cabinet Committee on Foreign Workers (CCFW) was expanded to include the management
of illegal immigrants, and is now termed Cabinet Committee on Foreign Workers and Illegal
Immigrants (CCFWII). It is the highest decision-making body with respect to the management
of foreign workers in the country. The MOHA is the secretariat to the CCFWII. The Cabinet
Committee is chaired by the Deputy Prime Minister and it meets twice a year (see table 5 for
92

Guide on measuring migration policy impacts in ASEAN
Cha
pte
r 6
93
the expanded list of members of the CCFWII). However, major decisions of this Committee
are still heavily skewed towards regulating and managing the supply of foreign labour and
addressing the problem of irregular migrants.
The implementation of the national policy on foreign labour is governed by two key
pieces of legislation and a variety of policy instruments or measures. The entry, residence
and employment of foreign labour are governed by the Employment Act 1955 and the
Immigration Act 1959/63. The overarching legislation have been amended to include other
policy instruments to control the inflow of low-skilled labour and encourage high-skill labour.
Unlike high-skilled labour, managing the intake of low-skilled workers has remained much
more complex and challenging, given the speed and scale of their cross-border movements
and the relatively high incidence of undocumented entry and employment. Thus the major
component of the policy responses deals with the complexities in low-skill foreign labour
management.
6.3 Policy instruments to manage foreign workers
The key policy instruments to regulate, manage and protect migrant workers are summarized
in table 6.6. These policy instruments have evolved over the years, yielding both positive and
negative consequences on the entire spectrum of the migration process, from the migrant
worker to the recruitment agency and the employer, as well as on the entire economy.
Overall, foreign workers are better served and protected than previously, but gaps in policy
actions and implementation still persist, compounded by weak governance. There have been
frequent changes in policy instruments, without due process, to address immediate economic
and political expediencies. Some of the ill-conceived policy responses further confound the
inherent difficulties in managing foreign labour, producing poor outcomes.
International cross-border labour movement, especially of low-skill nature, is without doubt
a complex and dynamic process that poses tremendous challenges in its management. Thus
changes in policy responses are essential and necessary, but the manner in which these
changes have been introduced need reexamining. Often, changes are ad hoc and reactive,
with inadequate consultation with interested parties. These revisions further add to the layers
of administrative procedures and guidelines, producing an inconsistent and opaque system in
the recruitment and employment of foreign workers, and more importantly in the enforcement
of these policy measures by a multitude of agencies. It also raises the monetary costs of
migration, encouraging migrants to bypass the formal system and become undocumented
workers, and falling out of the formal system that was originally designed to grant protection
from abuse and exploitation from recruiting agents and employers. Attempts by some of the
implementing agencies to detail the process and procedures of recruitment and employment
through their websites and publications and distribution of handbooks have proven somewhat

Guide on measuring migration policy impacts in ASEAN
Cha
pte
r 6
94
useful, but often have been unable to keep abreast of the frequent changes.
The following section, 6.4, reviews the various policy instruments to manage four key policy
functions, viz, managing demand for foreign labour, recruitment, wages and working conditions,
and the overall impacts of migration.
Stevedores transferring tuna at Malaysian port.©ILO

Guide on measuring migration policy impacts in ASEAN
Cha
pte
r 6
Figure 6.3 Institutional framework for the management and protection of migrant workers
95
CCFWIIRepresentatives from
13 ministries/agenciesMakes policy decisions
Ministry of HealthImplements health
related issues
FOMEMAHandles medical examination of foreign workers
Ministry of Home Affairs (OSC)
Implements intake of foreign workers
Immigration Department
Manages entry and exit of foreign
workers
RELA (Paramilitary Civil Volunteer Corp)
Apprehends undocumented foreign workers
Ministry of Internal Security
Implements security-related issues
Royal Malaysia Police
Handles border patrol and criminal cases related
to foreign workers
Ministry of Human Resources
Implements employment and
labour issues
Labour Department
Enforces labour and labour-related laws
Trade UnionsHandle
employment-related issues of foreign
workers
Employer Organizations
Represents employer concerns on foreign
workers
EmbassiesResponsible
for the welfare of their nationals
Civil Society Organization
Provide overall assistance to migrants

Guide on measuring migration policy impacts in ASEAN
Cha
pte
r 6
96
CCFWIIRepresentatives from
13 ministries/agenciesMakes policy decisions
Ministry of HealthImplements health
related issues
FOMEMAHandles medical examination of foreign workers
Ministry of Home Affairs (OSC)
Implements intake of foreign workers
Immigration Department
Manages entry and exit of foreign
workers
RELA (Paramilitary Civil Volunteer Corp)
Apprehends undocumented foreign workers
Ministry of Internal Security
Implements security-related issues
Royal Malaysia Police
Handles border patrol and criminal cases related
to foreign workers
Ministry of Human Resources
Implements employment and
labour issues
Labour Department
Enforces labour and labour-related laws
Trade UnionsHandle
employment-related issues of foreign
workers
Employer Organizations
Represents employer concerns on foreign
workers
EmbassiesResponsible
for the welfare of their nationals
Civil Society Organization
Provide overall assistance to migrants

Guide on measuring migration policy impacts in ASEAN
Cha
pte
r 6
Table 6.5 Members of the Cabinet Committee on Foreign Workers (CCFWII)
Chairman: Deputy Prime Minister
Members Government Agencies
Ministry of Home Affairs
Ministry of Human Resources
Ministry of Internal Affairs
Ministry of International Trade and Industry
Ministry of Foreign Affairs
Ministry of Agriculture and Agro-Based Industry
Ministry of Finance
Ministry of Plantation Industries and Commodities
Ministry of Rural and Regional Development
Ministry of Health
Ministry of Tourism
Public Works Department
Department of Immigration
Source: Ministry of Home Affairs
Table 6.6 Policy instruments and measures to manage foreign workers
Objective Policy instrument/measure
Determine demand for
migrant workers
- Labour market test
Manage entry and
employment
- Visa (VPTE/PKLS or employment pass)
- Work permit – (tied to restrictions on age, nationality,
sector of employment, marital status, family reunion,
etc.)
- Levy (varies according to sectors and skills)
- Temporary ban (by sector, occupation/nationality
Regulate recruitment process - Regulation of recruitment agencies
- Bilateral or G to G agreements
Protection of migrant workers - Foreign Worker Recruitment Policy
* Requirement for contract of employment,
97

Guide on measuring migration policy impacts in ASEAN
Cha
pte
r 6
98
Objective Policy instrument/measure
* Provision of similar wages and benefits as local
workers as provided for in the Employment Act
1955 (except for domestic workers)
- Compulsory induction course on local labour laws,
language and customs
Address irregular migration - Registration and regularization programs for
- irregular migrants
- Amnesty
- Security operations to arrest, detain and deport
undocumented migrants
- Enhanced legal penalties for irregular migrants and
those hiring or harbouring irregular migrants
6.4 Managing demand for foreign workers
6.4.1 Labour market testForeign worker demands in Malaysia are not based on any detailed manpower requirements
projections, but screened via a simple “labour market test”. At present there is a huge
information gap on the labour market structure, its prospects and potential. To address these
concerns, several measures were proposed in the New Economic Model (2010-2020) to
address the information deficit in the labour market now in various stages of implementation.
One main outcome was the establishment of the Institute of Labour Market Information and
Analysis (ILMIA) in 2012 as a division of the Ministry of Human Resources (MOHR) to carry out
labour market studies as well as manpower requirements projections. It currently provides
analysis of labour market trends and emerging human capital issues for enabling human
capital planning and labour policy formulation. It is in the process of producing data on the
demand and supply of labour by occupation and by sector from 2015 to 2030. At present, it
releases short-term information on the skills deficit by National Key Result Areas (NKEAs) and
by occupation based on job offers by companies in the NKEAs, but how this feeds into the
process of determining demand for low-skill foreign workers remains unclear.

Guide on measuring migration policy impacts in ASEAN
Cha
pte
r 6
Various ministries or agencies covering different sectors are represented in the one-stop
Labour Approval Centre (OSC)18 within the MOHA and each is responsible for determining
the number of foreign workers required for their respective sectors. There are no clear or
firm guidelines on how the quota for their respective sectors is determined. Discussions with
officials and industry organizations suggest that the industry quota is a “guesstimate” after
taking into account the views of the main stakeholders within the industry. In the case of the
plantation sector, where foreign labour accounts for over 70 per cent of the workforce, the
Ministry of Plantation Industries and Commodities has some guidelines on the employment
of foreign labour (see table 6.7) linking the number to the hectares cultivated. There were
some indications from officials that for the manufacturing sector, a ratio of foreign to local
workers was used as a guideline. For the export-oriented industries, it is one local worker to
three foreigners, while for non-export firms it was restricted to only one foreign worker. For
the electronics firms it was set at one local worker to two foreign workers. For the services
sectors, there are no clear-cut guidelines on the number of foreign workers that can be
hired, but discussions with companies suggest it depends on the size of their operations.
Only the construction sector had some clear guidelines. Only employers registered with the
Construction Industry Development Board (CIDB) and who have a valid license from CIDB
can apply for foreign workers. The ratio of local to foreign workers is set at 1:3, and the total
number of workers is based on the type of project, such as housing, infrastructure, transmission
lines and so on.
Table 6.7 Activities in agriculture permitted to hire foreign workers and regulations guiding the number of workers that can be hired
Crop For every
hectare
No. of foreign
workers
Minimum
hectares
Oil palm 8.0 1 5
Rubber 4.0 1 3
Cocoa 3.6 1 3
Jungle plot 2.5 1 2
Teak/Sentang plots 15.0 1 9
Jungle nursery 20.0 1 -
Oil palm nursery 2.0 1 -
Other types of nursery 1.0 1 -
Source: Ministry of Plantation and Commodities, June 2006 (as cited in Narayanan & Lai, Y. W (2007)
Generally higher quotas are set for sectors that face difficulties in recruiting local workers.
Pressure from the various Industry Associations does have an impact on the final decision
with respect to the industry quota. Industry associations press for additional foreign labour
99
18 The OSC was set up in 2005, formalizing a previous set-up performing similar tasks. Its members now include representatives from MOHA, Department of Labour, MITI, Ministry of Plantation Industries and Commodities, Ministry of Agriculture and Agro-Based Industries and CIDB.

Guide on measuring migration policy impacts in ASEAN
Cha
pte
r 6
100
via memoranda to the Minister-in-charge of their portfolio or through the many public-private
sector dialogue sessions.
Individual employer requests are screened via a simple “labour market test” to verify or
authenticate the demand for foreign workers. As noted earlier, the national policy on the
intake of migrant workers is one that is based on “hiring of Malaysians first”. A Job Clearing
System (JCS) was set up in 2006 and has since been used to verify that jobs were offered to
Malaysians first.19 Employers wanting to hire foreign workers must get certified clearance from
the JCS that local workers are not available for the advertised position. Firms in the plantation
sector must advertise their vacancies in the JCS for at least one week, the service sector for
two weeks, and the manufacturing sector for a month before the JCS clearance is granted.
Following the implementation of the minimum wage policy employers are also screened to
ensure they are willing to pay the stipulated minimum wage before approval is granted. The
“labour market test” is performed by the Division for the Management of Foreign Workers
under the Department of Labour before it is forwarded to the OSC for processing. The OSC
then interviews the employers, thus serving as an additional checking mechanism to ensure
employers do not apply for more workers than necessary and to control the overall number of
applications. The employer must pay the levy within 48 hours, following which a conditional
approval letter is issued to proceed with the recruitment of the foreign worker.
Immigration is under the jurisdiction of the state in Sabah and Sarawak. Hence in Sabah,
employers must obtain a license from the Sabah Labour Department and a quota from the
Committee for Foreign Workers in Sabah and Labuan before submitting their application to
the State Immigration Department. Likewise in Sarawak, employers must obtain a license and
quota from the Sarawak Labour Department before applying for the VPTE/PKLS. The quota
is usually based on estimated number of workers per hectare as in the case of the Peninsula.
6.4.2 Managing entry and employment of foreign labourForeign labour in Malaysia is distinguished into two categories: “expatriates” and “foreign
workers”, using a monthly salary cut-off level set by the authorities. The latter, also termed
“migrant workers”, are the lower-skilled workers, while the expatriates are the high-skilled
workers in managerial, professional or technical positions. These two categories of foreign
workers are governed by a different set of rules and privileges vis-a-vis their entry, employment
and residency, recruitment procedures and costs, and employment benefits and protection.
These rules and privileges are primarily administered via the visa, employment permit and the
foreign worker’s levy.
The Employment PermitThe employment permit is the principal policy instrument for managing the entry, employment
and residency of foreign workers in the country. There are basically two types of employment
19 Prior to the setting up of the JCS, employers had to merely advertise in the local newspapers.
Guide on measuring migration policy impacts in ASEAN
Cha
pte
r 6
101
permits. Low-skilled foreigners are issued with visit passes for temporary employment (VPTE
or PKLS by its Malay acronym) while the high-skilled foreigners are granted the employment
pass (EP). The VPTE/PKLS is commonly termed the work permit and the latter the employment
pass.
(i) Visit Pass for Temporary Employment (VPTE/PKLS) for Low-skill Labour
The VPTE/PKLS is governed by strict criteria to restrict and regulate the entry, employment
and residency of low-skilled migrants. This is to ensure that Malaysians are not replaced by
cheaper foreign labour, and to encourage employers to adopt labour-saving production
techniques or shift to skill and knowledge-intensive industries to reduce long-term reliance
on foreign labour (Kanapathy, 2006). The VPTE/PKLS is issued for a restricted duration to
discourage permanent settlement. It is initially issued for a year and can be renewed annually
for a total period of three years.20 In the case of workers with specific skills, their length of stay
may be extended for another two years.21 The decision to extend the stay has been varied
from time to time. The 3+1+1–year ruling however does not apply to domestic workers. They
can be employed for as long as their services are required or up to the maximum age of
45. The work permit does not allow foreign workers to bring along their dependents,22 they
must be within 18 and 45 years of age and not permitted to marry or get pregnant while in
employment. A violation of any of these terms and conditions invites immediate deportation.
The nature of employment is determined through restrictions imposed on the occupation,
sector or industry.
Table 6.8 details the different nationals and the sector/occupation they are allowed to work
in. The list has been varied from time to time, largely based on non-economic reasons. In the
case of Sabah, its foreign workers are from neighbouring Indonesia and the Philippines, while
in Sarawak, they are from Kalimantan in Indonesia. Recently, workers from Bangladesh were
also allowed to work in Sabah.
20 Once their services are terminated, a grace period of three months is given to allow them to leave the country.
21 Following requests from employers, the government had agreed to extend the duration of work permits in selected industries. Employers can now extend their foreign workers’ services beyond the five-year period, provided they could furnish information within six months that their workers are skilled. During the six-month period, the employer is encouraged to send his workers for further training to improve their skills. Relevant organizations such as the Department of Skills Development (for manufacturing), the CIDB (for construction), the Ministry of Plantation Industries and Commodities (for plantations), and the Ministry of Agriculture and Commodities (for agriculture) are entrusted with the task of verifying the skills of the migrant workers. If the workers were certified as skilled, the Ministry of Home Affairs would extend their stay. Foreign workers in construction can stay as long as ten years.
22 There is however documentary evidence of foreign workers with dependents, particularly in Sabah, where entire families migrate. It is reported that about a quarter of the estimated 300,000 Indonesian migrant workers in Sabah have 2 to 3 children per family (The Star, September 29, 2004).

Guide on measuring migration policy impacts in ASEAN
Cha
pte
r 6
Table 6.8 Approved sectors for employment of foreign nationals
Approved Sectors Nationals of:
Manufacturing
Plantation
Agriculture
Construction
Services sector
Indonesia (females only)
Cambodia
Nepal
Myanmar
Laos
Vietnam
Philippines (male only)
Pakistan
Sri Lanka
Thailand
Turkmenistan
Uzbekistan
Kazakhstan
Services (cooks, wholesale/retail, barber, metal/
scraps/ recycle, textile)
Construction (fixing of high voltage cable only)
Agriculture & plantation
India
Source: Immigration Department, 2014
Several changes were recently introduced to improve the management of foreign workers.
Previously foreign workers could enter the country under a social visit pass and apply for the
work permit while in Malaysia. This had led to an influx of foreigners, many of whom failed
to secure full-time jobs or even chose to remain undocumented, working freelance. Usually,
the foreigners were brought in by recruiting agents (RAs) who charged excessive fees and
falsely promised jobs, wages and benefits. Some foreigners were even left “abandoned” at
the Malaysian airport when “prospective employers” failed to receive them. Not all recruiters
are registered which makes it difficult to regulate them. Under the revised ruling, foreign
employees will only be allowed to enter Malaysia after the application for visa (Visa with
Reference-VDR) and work permit (VTPE/PLKS) have been approved.
As noted earlier, once the employer is given the green light to recruit foreign labour, the
employer has to pay the levy and apply for the visa and the VPTE/PLKS. A complete list of
documents must be submitted to the Immigration Department before it can be processed
(table 6.9). Original documents must also be produced for certification. The foreign worker
must obtain the calling visa from the Malaysian Representative offices overseas, usually the
Malaysia embassy. Once the foreign worker enters Malaysia, he/she must undergo another
medical test at any Foreign Workers Medical Examination Monitoring Agency FOMEMA
registered clinic or health centre within one month of entry into Malaysia. All those who fail
the test are repatriated. They must then obtain the visitor’s pass sticker at the Immigration
102

Guide on measuring migration policy impacts in ASEAN
Cha
pte
r 6
Department with the original approval letter from the Local Centre of Approval, original
receipts of payments made, and the worker’s passport.
The entire process may take about three to eight months, or even a year and costs the
employer between 3,000 to 5,000 Malaysian Ringgit (MYR) for each foreign worker (table
6.10). However, the upfront fee paid by the foreign workers to the local agents in their
respective countries is usually much higher and varies from as low as MYR3,000 to as high as
MYR10,000. Even when there are guidelines on the costs of recruitment as specified in the
MoUs (Memorandum of Understanding), rarely do the actual costs follow the guidelines. It is
determined by market forces and is usually much higher.
Except in the case of domestic workers there are no clear guidelines on who bears the costs
of recruitment. In most instances, the cost of recruitment is split between the employer and
the migrant worker, whereby the amount spent in Malaysia is usually borne by the employer,
while the rest is paid by the worker. Migrants usually raise the initial amount required either
through borrowings or by disposing of or mortgaging their assets. However, in the case of
most small and medium scale industries, the total transaction costs are largely borne by the
migrant workers. The employer may fund the initial recruitment costs, but deduct them later
from the migrant’s monthly wages. There are instances, especially in the case of very large
multinational corporations, where the employer bears the entire cost of recruitment.
Table 6.9 List of documents required for new applications for foreign workers
1
2
3
4
5
6
7
8
9
10
11
12
13
An application letter from employer
Visa applications by reference form
Letter of approval from the Ministry of Home Affairs
Original receipts of levy paid
Form IMM.12
Payment form
VDR Application form for new foreign workers
Bank draft (payment PLKS, PROCESS AND VISA)
Deposit/Insurance guarantee/Bank guarantee (valid for at least 18 months)
Copy of worker’s passport
Worker’s photograph (1 piece)
Stamped personal bond
Medical report from the country of origin approved by the Ministry of Health Malaysia
Additional documents:
Copies of the registration form (Form 49 / Form B & D) Representative Company
Card (Yellow Card) for Foreign Workers Application VDR (Employer / Company
Representative)
The original approval letter outsourcing foreign workers, and certified copies of VDR
application for outsourcing foreign workers (outsourcing company)
Source: Department of Immigration, 2014
103

Guide on measuring migration policy impacts in ASEAN
Cha
pte
r 6
Once the contract is completed, the foreign worker is repatriated either by the employer or
the RA. The employer must apply for a checkout memo from the Immigration Department to
record the repatriation. Should the employer fail to obtain the checkout memo, he/she will be
blacklisted. However, if the foreign worker absconds any time prior to the completion of the
contract, the employer must report the matter to the Immigration Department and has to pay
MYR250. In practice, many employers report either to their agent or the police.
Table 6.10 Schedule of statutory payments
Type of payments Amount (MYR)
Levy MYR410 to MYR1,850
Visit Pass (Temporary Employment) or PLKS MYR60 per year
Visa MYR15 to MYR100 per year (depending on
nationality)
Processing Fee MYR125
Security Bond Deposit Between MYR250 to MYR1,500 per worker
Foreign Worker Compensation Scheme
under the Workmen’s Compensation Act,
1952 (Amendment 1996)
MYR86 per worker per year + 5% service
charge
Health insurance (since June 2011) MYR120 per year
Medical Examination by FOMEMA MYR180 per year for male
MYR190 per year for female
Cost of selection/interviews/transportation
to bring-in workers/documentation
Employers spend between MYR3,000 to
MYR5,000 per worker for every recruitment
(depending on source country)
Source: Immigration Department Malaysia, 2014
(ii) Employment Pass (EP) for High-skill Labour
High-skilled foreign labour is officially classified as managerial, professional and technical
workers earning an arbitrary cut-off salary of MYR5,000 23 and above per month. These
expatriates are issued with employment passes if their employment contracts are at least for
two years, while those on short-term contracts of less than a year are issued with a visit passes
for professional employment.
The issuance of work passes for expatriates has been relatively liberal but their numbers
remain small, in contrast to the large volume of low-skilled foreign labour. The incidence of
irregular migration among the high-skilled foreigners is negligible, and their recruitment is
104
23 The salary cut-off has been raised several times, starting from as low as MYR1,500.

Guide on measuring migration policy impacts in ASEAN
Cha
pte
r 6
generally better managed, though there have been isolated cases of fraud. There has been
less policy attention with respect to restricting their entry and employment. On the contrary,
there are policies to encourage and facilitate their entry and employment.
A set of reform measures was introduced beginning 2011 to address the skills gap and to
make Malaysia more investment friendly, especially in skill and knowledge-intensive industries.
Broadly, the governance structure for the entry, employment and residency of high-skill labour
was refined further to make it more competitive to tap into the global pool of talents. The rules
were further relaxed and made more transparent and simple, and the application process was
speeded up. For instance, the job categories and their respective functions are now clearly
specified so that individuals or firms hiring foreigners are aware of the type of jobs eligible for
expatriate approval. The jobs that are restricted to locals are also listed out in great detail. In
addition expatriates earning MYR8, 000 or more are eligible for automatic approval, subject
to application to the Department of Immigration with the necessary documents.
The changes initially introduced in 1997 to ensure faster and more efficient processing of
applications for expatriate positions by decentralizing decision-making to each relevant
Ministry/Agency were further improved. At present, there are five agencies in charge of
approving expatriate positions for industries under their portfolio and each uses a different
set of criteria.24 In addition, an Expatriate Committee (EC) was set up to approve positions
outside the purview of the five Ministries/Agencies. The EC consists of representatives from
the Ministry of Home Affairs (MOHA), Ministry of International Trade and Industry (MITI),
Ministry of Domestic Trade and Consumer Affairs, Ministry of Education (MOE), Ministry of
Human Resources (MOHR), Construction Industry Development Board (CIDB) and the Council
of People or MARA (Majlis Amanah Rakyat). The Immigration Department (DOI) which serves
as the Secretariat merely endorsed and processed the applications to hasten the process.
In general, expatriates are allowed to work in almost all sectors, except those that impinge on
national security. There are some restrictions on the number of expatriates allowed to work
in the finance and banking, and manufacturing sectors, but firms located in special economic
zones, such as the Multimedia Super Corridor, can employ as many expatriates as required.
Unlike the less-skilled migrant workers, expatriates are allowed to bring in their dependents.
They also pay lower mandatory fees. They do not pay a levy and their employment pass
costs between MYR200 (for term post) and MYR300 (for key post), while the visit pass for
professional employment cost only MYR90. A Residence Pass-Talent was introduced in April
2011 which allows expatriates to be employed on a long-term basis (ten years) and their
spouses to seek employment without having to obtain the employment pass. Expatriates
who wish to retire in Malaysia upon expiry of their employment pass may also participate in
the Malaysia My Second Home Scheme (MM2H) provided they meet the obligatory financial
105
24 These include the Malaysian Industrial Development Authority (MIDA) for manufacturing, hotel & tourism and the research and development sector, the Multimedia Development Corporation (MDC) for companies with MSC (Multimedia Super Corridor Status) status, the Public Services Department (PSD) for the medical, teaching and other positions offered by the Public Service Commission (PSC), Bank Negara Malaysia (BNM) for the banking, finance and insurance industries, the Securities Commission (SC) for securities industry and the share market, and the Expatriate Committee (EC) for all other expatriate positions.
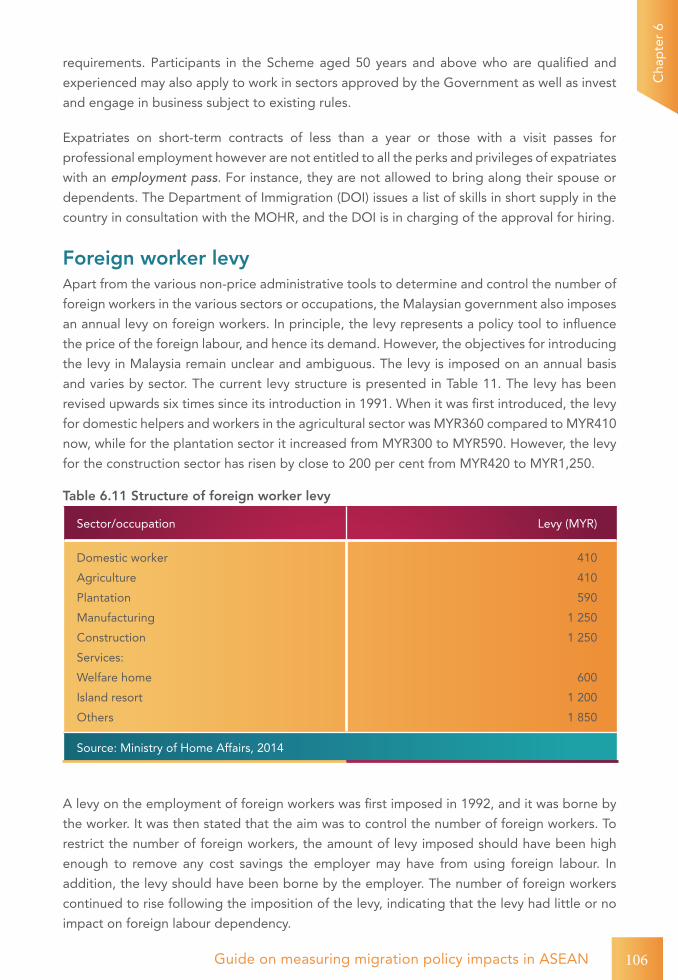
Guide on measuring migration policy impacts in ASEAN
Cha
pte
r 6
requirements. Participants in the Scheme aged 50 years and above who are qualified and
experienced may also apply to work in sectors approved by the Government as well as invest
and engage in business subject to existing rules.
Expatriates on short-term contracts of less than a year or those with a visit passes for
professional employment however are not entitled to all the perks and privileges of expatriates
with an employment pass. For instance, they are not allowed to bring along their spouse or
dependents. The Department of Immigration (DOI) issues a list of skills in short supply in the
country in consultation with the MOHR, and the DOI is in charging of the approval for hiring.
Foreign worker levyApart from the various non-price administrative tools to determine and control the number of
foreign workers in the various sectors or occupations, the Malaysian government also imposes
an annual levy on foreign workers. In principle, the levy represents a policy tool to influence
the price of the foreign labour, and hence its demand. However, the objectives for introducing
the levy in Malaysia remain unclear and ambiguous. The levy is imposed on an annual basis
and varies by sector. The current levy structure is presented in Table 11. The levy has been
revised upwards six times since its introduction in 1991. When it was first introduced, the levy
for domestic helpers and workers in the agricultural sector was MYR360 compared to MYR410
now, while for the plantation sector it increased from MYR300 to MYR590. However, the levy
for the construction sector has risen by close to 200 per cent from MYR420 to MYR1,250.
Table 6.11 Structure of foreign worker levy
Sector/occupation Levy (MYR)
Domestic worker
Agriculture
Plantation
Manufacturing
Construction
Services:
Welfare home
Island resort
Others
410
410
590
1 250
1 250
600
1 200
1 850
Source: Ministry of Home Affairs, 2014
A levy on the employment of foreign workers was first imposed in 1992, and it was borne by
the worker. It was then stated that the aim was to control the number of foreign workers. To
restrict the number of foreign workers, the amount of levy imposed should have been high
enough to remove any cost savings the employer may have from using foreign labour. In
addition, the levy should have been borne by the employer. The number of foreign workers
continued to rise following the imposition of the levy, indicating that the levy had little or no
impact on foreign labour dependency.
106

Guide on measuring migration policy impacts in ASEAN
Cha
pte
r 6
The levy varied across sectors, but the rationale for the differential rates has not been clearly
specified. Sectors that heavily rely on low-skill foreign labour such as palm oil and rubber
are important contributors to growth and export earnings, and hence the mostly likely
rationale for a lower levy was to ensure that the growth momentum of these activities was
not jeopardized by labour shortages. Workers in the agriculture and plantation sectors pay as
low as a quarter of the highest levy imposed for the selected services sectors. These sectors
face great difficulties in attracting local labour and more than 70 per cent of their workers are
foreigners. The possibility of foreign labour substitution in these sectors through improved
working conditions and work processes or through automation and moving up the value
chain is relatively low. A higher levy has been imposed on sectors where labour shortage has
been perceived to be less serious, and where the possibility of foreign labour substitution is
relatively much higher such as in the manufacturing, construction and services sectors.
The levy has been revised upwards several times since 1992, and in 2009, a decision was
made to transfer the levy to the employer, to re-emphasize the need to reduce foreign labour
dependency. However, with the implementation of the national minimum wage, the levy has
once again been passed on to the migrant worker, following requests from employers. It is
clear that the levy system has not been tied to any specific set of objectives. It has not been
designed as a policy tool to influence the price of labour. Nevertheless it has served as a cost
recovery tool to cover the huge costs incurred in managing migrant workers and for their use
of public amenities as recently acknowledged.
6.4.3 Regulate the recruitment processRecruitment of foreign workers is either done directly by employers (or individuals in the case
of domestic helpers) or indirectly through a recruitment agency or through an outsourcing
company (OSC). Even in the case of “direct” recruitment, Malaysian companies often rely on
services of agents who became employer “representatives” to source workers from overseas
and to help process their applications. The recruitment process is legislated by the Private
Employment Agency Act, 1981 that governs the operations of the recruiting agents (RAs),
while the Government to Government recruitment is governed by the terms and conditions
reached upon by the relevant signing counterparts.
Recruitment Agency Legislation: All RAs must have a license from the MOHR and
they must register with the Immigration Department. They are governed by the Private
Employment Agency Act, 1981, but the Act is currently being reviewed for replacement by
the Private Employment Agencies Bill, 2014, the details of which have yet to be announced.
The recruiting companies were originally formed to send Malaysian workers abroad, mainly
to the Middle East in the 1970s, but when Malaysia began recruiting foreign workers from
abroad, these agencies assumed the role of RAs for bringing in workers. As such, the Act has
been proven to be inadequate, in terms of its scope and coverage, to monitor and regulate
the activities of the RAs.
According to MOHR the new Bill aims to improve and modernize the legislation and strengthen
107

Guide on measuring migration policy impacts in ASEAN
Cha
pte
r 6
its enforcement. The coverage of the new legislation will extend to the recruitment of foreign
workers especially foreign domestic workers to provide better protection from abuse and
exploitation by RAs.
The role of outsourcing companies (OSC): Since August 2006,25 large numbers of foreign
workers have been recruited through OSC. All companies that hired less than 50 foreign
workers were required to use the services of an OSC, while those employing more than 50
workers had the option of using OSCs or to recruit directly. The new recruitment directive
affected the small and medium-sized enterprises (SMEs). In addition, firms using the OSCs
would have to recruit at least 50 per cent of their foreign workers from Bangladesh. Malaysia
had resumed recruiting workers from Bangladesh following a Government to Government
labour agreement with Bangladesh in 2006. Malaysia had imposed a ban on the recruitment of
workers from Bangladesh in 1996. From January 2010 onwards, the OSCs were only allowed
to supply and manage workers for the manufacturing, plantation and agriculture sectors.
An OSC is permitted to bring in foreign workers and supply and manage the workers for the
principal company. The Cabinet Committee on Foreign Workers (now known as CCFWII) had
set several conditions for a recruitment agency to be licensed as an OSC. It must be locally-
owned and have a minimum paid-up capital of MYR100,000 and approved by the Cabinet
Committee on Foreign Workers.
According to the MOHA, the rationale for introducing the OS system was to overcome the
recurrent problems in the ongoing system of recruitment and employment of foreign workers.
Table 6.12 summarizes the state rationale for the use of the OSC and its potential advantages
over the prevailing system.
The OS system had spawned a whole new “labour outsourcing industry”. From only 58 in
2006 it rapidly grew to over 400 over the years. Currently, there are around 240 companies
registered with the MOHA. In practice, the system was ill-conceived, with lack of clarity with
respect to the accountability and responsibility of the employers to their workers. Due to
poor monitoring and weak governance, it not only failed to address the perennial problems of
abuse and exploitation by RAs, but it had raised a whole new set of issues.
Unlike the system of outsourcing of “services”, where the OSC manages the “work”
outsourced, the outsourcing of “workers” represents a labour contract system whereby the
OSC manages the workers. Under this system, the OSC provides the “principal” company
with workers to perform a “job” or “specific tasks”. The OSC enters into an agreement with
the principal company to supply the required number of workers for a specified period in
return for a payment for the recruitment and management of the workers. The OS system
as practised in Malaysia not only increased the cost of recruitment, but led to abuse and
exploitation of workers by transferring the management and accountability of foreign workers
from the employer to the OSC.
108
25 The government approved the outsourcing system during the Foreign Workers’ Cabinet Committee meeting on 5 July 2005.

Guide on measuring migration policy impacts in ASEAN
Cha
pte
r 6
Table 6.12 Advantages of the OS system over the current recruitment system
Current recruitment system Outsourcing system
1 Employer has to find and manage
workers, provide accommodation,
transportation, etc. and look after their
welfare
Supply & management of workers done
by professional OSC. Employer relieved
of handling worker problems, and can
fully concentrate on core business
operations
2 Employer bears part of the cost of
recruitment.
OSC to pay the levy, cost incurred
for medical check-up, Workers
Compensation fee and salary at the
end of the month. Costs incurred are
deductible from salary.
3 Worker’s permit tied to one firm
and cannot be transferred to other
companies in the event of business
closure
OSC is obligated to find alternate
suitable job.
4 Workers not paid when not in
employment
OSC pays an allowance of MYR400 per
month if worker is without a job
5 Principal company not required to pay a
security bond
OSC is charged a security bond of
MYR500 per worker as a guarantee to
abide by OS regulations
6 Recruitment time is longer. Recruitment is faster as induction is
done in origin country
7 Employers have to hire foreign workers
for a period of at least one year.
Employers can hire workers on a
short-term basis, to meet seasonal/job-
specific demand
The OSC in Malaysia signs an agreement with a “principal” company to provide labour in return
for a fee. Hence, all responsibility for labour recruitment and management is transferred from
the employer to the OSC. In the contract the principal company identifies the job functions or
the process and procedures that they want performed and the terms of payments, the number
of workers and the period of employment. The OSC in turn signs an employment contract
with the worker specifying the wages and other terms and conditions of employment, such
as overtime, bonus, etc. The OSC is obligated to provide accommodation, including utilities,
transportation, medical benefits and be responsible for the overall welfare of the worker. The
OSC must pay the worker a minimum salary of MYR400 per month, even if the worker is not
employed. Should the worker remain unemployed for a continuous period of four months,
109

Guide on measuring migration policy impacts in ASEAN
Cha
pte
r 6
the worker must be repatriated and be paid the basic salary (MYR400) for the balance of the
contracted period.
Apart from these obligations, there were no clear standards stipulated in the provision of the
other terms and conditions listed in the Contract of Employment (COE). The High Commissions
or Embassies were responsible for attesting that the working and living conditions were up
to standard. In practice, they were not adequately staffed to monitor these agreements.
Not all workers were provided with the minimum housing facilities. Many workers brought
in under the OS system did not have secure employment, were not paid the minimum wage
of MYR400 per month and their movements restricted. In practice, contract substitution was
common and when workers protested they were transferred to other jobs and places. As the
contract of employment is not with the employer but with the OSC, the employer is absolved
of all responsibility for human resource issues. Effective monitoring of the work places by the
Department of Labour to ensure that the welfare and well-being of workers are safeguarded
was far from adequate, further worsening the situation.
The labour OS system led to a significant rise in the costs of recruitment by adding new
layers of intermediaries. The first batch of workers brought in under the OS system was from
Bangladesh, following its Government to Government agreement with Malaysia. Under the
bilateral agreement, the cost of recruitment borne by the worker was set at MYR4,350. As
the supply of labour in Bangladesh far exceeded the demand for labour in Malaysia, the RAs
in Bangladesh were able to charge the workers as high as MYR7,500 to RM11,000 claiming
that they had to pay “lobbying fees” for the “job offer”. Likewise the recruiting fee incurred
in Malaysia rose by between MYR2,500 to MYR3,200 per worker. Each OSC was given a
quota by the MOHA to bring in foreign labour. The OSC had to look for “job orders” from
companies before it is allowed to bring in workers. The OSCs used “marketing agents” who
went around looking for employers needing workers. They charged anything from MYR200 to
MYR500 per “job demand”. The OSCs also used these “agents” to take care of the necessary
administrative approvals. Additional “lobbying” fees of between MYR2,000 to MYR3,000
were charged for job approvals and for processing of applications.
The labour OS system had led to greater casualization and deregulation of the labour market,
undermining the workers’ fundamental labour rights. When the OS system was introduced,
it was not made clear how the new recruitment system would affect foreign workers vis-a-vis
the various legislation that covered workers’ rights such as the Employment Act, Occupational
Safety and Health Act, Workmen Compensation Act and The Industrial Relations Act. The
OS firm is defined as the “employer” in the employment contract between the OSC and the
worker. In the event of abuses at the work place, the question as to who bears the responsibility
remained unclear.
Work permits issued by the Immigration Department are tied to the job sector and employer.
However, under the OS system, the OSC has the right to transfer the worker to a different job
or employer or location. Thus a worker recruited under the OSC system may be employed in
110
Guide on measuring migration policy impacts in ASEAN
Cha
pte
r 6
job or sector that is different from that stated in his work permit, and may encounter problems
when approached by enforcement agencies. The apparent contradictions between the OS
system and the issuance of the work permit place the foreign worker at risk of arrest and
detention by enforcement authorities.
In December 2013, a parliamentary decision was announced to discontinue the services of
OSCs. All future recruitments were to be carried out directly by employers. However, OSCs
that still have quotas issued by the MOHA to bring in workers were allowed to function. This
abrupt parliamentary decision was essentially a response to the Executive Order signed by
the United States President in 2013 entitled “Strengthening Protections against Trafficking in
Persons in Federal Contracts”. The executive order forbids recruitment fees and the use of
OSCs.
Several large electrical and electronic multinational corporations in Malaysia rely heavily on
low-skill foreign workers supplied through OSCs, and these multinational companies export
their products back to the United States. Once the executive order comes into force, these
multinational corporations will no longer be allowed to export to the United States if they
continue to use the services of OSCs. Following these developments, many of the larger
companies in Malaysia are now absorbing the total costs of recruitment of foreign workers.
6.4.4 Government to Government agreementsLabour agreements formalize the sending and receiving nation’s commitment to ensure that
migration takes place in accordance with agreed principles and procedures. The earliest
Government to Government agreement was the Medan Agreement signed with Indonesia
in 1984. Similar MoUs were later signed with other countries such as Sri Lanka (August 2003),
Republic of China (September 2003), Thailand (October 2003), Bangladesh (October 2003),
Pakistan (October 2003), Vietnam (December 2003) and Indonesia (May 2004). The MoUs
identify the skills required and the sectors in which the migrants were to be deployed. By
selecting countries with which it signed bilateral agreements, it also determined the nationality
of the migrant workers. On socio-political grounds, Malaysia has only allowed the recruitment
of foreign workers from a few selected countries, and it has also varied the selection of countries
from time to time.
The initial MOUs were unsuccessful as the recruitment process was too slow and failed to
meet rising market demands and stem the inflow of undocumented workers. The bilateral
agreements were revived to stem abuse and exploitation by RAs, many of whom were illegal.
The bilateral agreements reintroduced in February 2002 aimed to ensure that the process of
recruitment was more systematic and transparent, and beneficial to all parties. The services of
some of the private employment agencies continued to be used for recruitment, depending
on the MOU signed with the labour exporting country.
The framework of agreement signed between Malaysia and the labour exporting countries
included several clauses covering the responsibilities of both signing parties. Of significance
111

Guide on measuring migration policy impacts in ASEAN
Cha
pte
r 6
are the following clauses:
a. ensure the home country is responsible for repatriating the migrant workers upon expiry of their work permits;
b. the migrant worker does not have a criminal record;
c. he or she is a genuine jobseeker;
d. the migrant worker should be proficient in Bahasa Malaysia or English; and
e. the exporting country must also conduct pre-departure orientation programmes to provide foreign workers with basic knowledge of the Malaysian way of life and cultural sensitivities, and of their contractual rights.
6.4.5 Overall economic impact of migrant workers on the economyAs noted earlier, the total number of foreign workers in the country is currently estimated
at 6.7 million, accounting for about 48 per cent of the labour force or about 52 per cent of
the total employed. In other words, the Malaysian economy employs slightly more foreigners
than Malaysians. Such an employment scenario has undoubtedly raised popular concerns and
serious policy debates in the nation. As in other major labour destination countries, the key
policy concerns in Malaysia focus on labour market outcomes, in particular on wages and
employment, the current account of the balance of payments, public expenditure as well as on
the macroeconomy, in particular on growth and income distribution, and productivity.
There is increasing empirical analysis on the economic impact of foreign workers in the country,
but the corresponding social and political consequences have been less studied. This in large
measure is due to the lack of reliable empirical data and methodological difficulties in isolating
the vast array of variables that account for the social and political outcomes in the country. The
following surveys the available empirical studies on the economic impact of foreign workers on
the Malaysian economy and highlights the key findings.
Macroeconomic outcomesThere are no clear theoretical arguments on the economic impact of migrant workers on the
economy, and this has spawned a vast and growing empirical search for answers, initially in
the developed economies and more recently in the East Asian economies that rely on low-skill
migrants hired on a short-term rotation basis. This is also true of Malaysia where more than
three decades of foreign worker dependency has generated sufficiently long time-series data
to carry out some rigorous analysis on the effects of foreign workers on the labour market,
the overall macroeconomy as well as on firms. In addition, enhanced accessibility to general
equilibrium modeling techniques has enabled simulation-based analysis of the impact of
migrant workers on the economy. The results from several studies using both techniques are
examined.
112

Guide on measuring migration policy impacts in ASEAN
Cha
pte
r 6
The Malaysian studies show that foreign workers make important contributions to the economy,
in terms of output, employment and export earnings. The findings from a government-
sponsored study (MSN, 2004) to assess the relationship between key economic variables and
foreign labour showed that for every 1 per cent increase in foreign worker employment, the
real GDP increased by 0.19 per cent, while for every 1 per cent increase in domestic workers,
GDP increased by 0.65 per cent, suggesting higher output elasticity of more skilled domestic
workers. These findings were corroborated by a simulation using a computable general
equilibrium model which found a 10 per cent net increase in low-skill foreign workers increased
the real GDP by between 1.16 to 1.18 per cent, depending on whether their contribution is
measured at market price or at factor cost (Kanapathy, 2010). From the demand side the
increase in GDP at market prices was attributed to strong export expansion (1.66 per cent) and
to relatively strong growth in aggregate investment (1.15 per cent) as well as the increases in
household consumption (0.42 per cent) and government expenditure (0.42 per cent).
The MSN (2004) study also used a growth accounting approach to estimate the total contribution
of foreign workers to GDP. Between 1997 and 2002, foreign workers’ contribution to real GDP
ranged from 3.6 per cent to 4.6 per cent and to between 4.8 per cent and 10.0 per cent when
considering their relative share in total factor productivity (TFP). Given the engagement of
foreign workers in mainly low-skill jobs, the inclusion of foreign workers’ share in TFP may not
be entirely justifiable. It is none the less indicative of the upper boundary of the estimate of
foreign workers’ contribution to GDP.
Migrants send remittances to their home countries, an outflow of foreign exchange that affects
the balance of payments. Table 13 provides an estimate of remittances by foreign labour,
both high-skill and low-skill. The total estimated remittances almost tripled from MYR12.5
billion in 2000 to MYR33.3 billion in 2013. However as a percentage of GDP remittances have
remained steady at between 3 to 4 per cent. The official data on remittances are most likely
underestimates as they do not cover monies sent through informal networks such as through
unlicensed money changers, smuggling or cash taken out directly.
As noted above, foreign workers contribute to increase in export earnings which represent
an inflow of foreign exchange. The net effect on the balance of payments will also depend
on the extent to which the repatriated income is spent on Malaysian made products either
directly or indirectly. To assess both the primary and secondary effects of immigrants on the
balance of payments, the statistical relationship between the balance of payments and current
account, and remittances of low-skill foreign workers was assessed. The results show that
remittances of foreign workers is weakly correlated to the overall balance of payments and
moderately correlated with the current account balance. The computable general equilibrium
simulation which takes into account all income transfers in the economy however showed
that net transfers to the rest of the world increased by about 2.0 per cent due to the increase
in remittances following a 10 per cent increase in migrant workers (Kanapathy, 2010). Thus,
while real GDP increased by 1.2 per cent following the intake of low-skill migrant workers,
remittances also expanded resulting in negative net factor payments of 0.1 per cent. Hence
real GNP from the income side registered an increase of only 0.81 per cent.
113

Guide on measuring migration policy impacts in ASEAN
Cha
pte
r 6
Table 6.13 Remittances by foreign labour, 2000 & 2013 (Ringgit, million)
Year Expatriates Low-skill foreign workers
Total As a % of GDP at purchasers’ value
2000
2001
2002
2003
2004
2005
2006
2007
2008
2009
2010
2011
2012
2012
2 276
2 409
2 832
3 161
3 760
4 848
5 314
5 973
5 157
5 449
5 632
6 038
7 076
8 231
10 185
10 218
13 079
11 229
16 333
18 107
17 889
17 383
18 904
23 326
23 711
25 744
25 130
25 087
12 461
12 627
15 911
14 390
20 094
22 955
23 203
23 356
24 061
28 775
29 343
31 782
32 206
33 318
3.5
3.6
4.2
3.4
4.2
4.2
3.9
3.5
3.1
4.0
3.7
3.6
3.4
3.4
Source: Computed from Bank Negara Malaysia, Monthly Statistical Bulletin, various issues.
Labour market outcomesOne popular perception of labour market outcomes when there are migrants is that foreigners
take jobs away from locals and depress their wages. A review of several empirical studies
produced mixed outcomes, especially with respect to the wage effects.
Using a simultaneous equations model and testing for Granger causality, the MSN study (2004)
showed no strong evidence that foreign workers “cause” real salary and wage movements.
Rather the study showed that growth in real salaries and wages led to higher recruitment of
foreign workers. The findings are consistent with the expectation that industries may resort to
hiring foreigners to constrain cost hikes. The same study examined the extent to which foreign
workers influence wages using a labour market equation system and showed that on average,
the real salaries and wages per employee declined by 0.12 per cent following a 1.0 per cent
increase in foreign workers.
The CGE study (Kanapathy, 2010) which includes estimates of undocumented workers showed
that there was a decline in the average real wage by 0.68 per cent following a 10 per cent net
114

Guide on measuring migration policy impacts in ASEAN
Cha
pte
r 6
increase in low-skill workers. Wages of low-skill natives who compete directly with low-skill
foreigners fell by about 13.7 per cent, while the wages of high-skill labour, both local and
foreign, increased by 2 per cent. There is also a higher decline in the wages of the low-skill
migrant workers at 16.1 per cent due to the increase in their numbers.
To shed further light on the job displacement issue posed by foreign workers, the MSN
(2004) Study used the Hicksian factor elasticity approach to determine substitutability
or complementarity between foreign and local workers. The findings showed that at the
national level, foreign workers complement local workers, but were found to be substitutes
within the manufacturing sector such as in electrical and electronics industries as well as in
the construction industry. These findings are corroborated by a study on the elasticity of
substitution between foreign and local workers in the manufacturing sector using the firm-
level surveys. Idris Jajri & Rahmah Ismail (2006) show that foreign and local workers are more
substitutes than complements. Of the 15 elasticity of substitution estimates that were found
to be significant, 11 were substitutes and four complements.
A more recent study by the World Bank in collaboration with ILMIA (World Bank and ILMIA,
2013) involved a detailed analysis of the effects of immigration on the labour market outcomes
in Malaysia using data from the Annual Labour Force Survey. Its findings differ from all other
studies, finding that immigration increases demand for Malaysian workers but does not changes
relative wages across industries or locations. Instead, immigration increased the overall wage
level in Malaysia because enough Malaysian workers moved across industries (and possibly so
regions) to allow wages to rapidly equalize. An additional 10 per cent of foreign worker intake
in a given sector and region increased average wages of Malaysians by 0.15 per cent, with
differences by industry, gender, age and education. The positive wage effects for Malaysians
are higher in agriculture and low-skilled services. Male wages rose by 0.3 per cent whereas
women’s wages were barely affected. The young (15 to 19 years) experienced lower wage
increases than the older age-groups, and those between 30 to 44 years benefitted most (0.5
per cent). Finally, those with at least primary education experienced falling wages, while those
with secondary education had a 0.6 per cent wage rise.
Studies by Athukorala and Devadason (2012) and Narayanan and Lai (2014) however supported
the earlier evidence (by MSN 2004 and Kanapathy, 2009) of the negative impact of foreign
workers on wages. Athukorala and Devadason (2012) found that real wages in an industry
declined by 0.67 per cent when the share of immigrants in the total employment increased
by 10 per cent. On the other hand, a 10 per cent increase in the share of immigrant unskilled
workers in the unskilled workforce of an industry decreased real wages of unskilled workers by
1.3 per cent. Narayanan and Lai (2014) found similar results. A 10 per cent increase in the share
of immigrant workers in total employment resulted in a 0.6 per cent decline in wages, while
a 10 per cent increase in the share of immigrant unskilled workers in total unskilled workers
resulted in a decline of 1.23 per cent in the wages of unskilled workers.
The World Bank and ILMIA (2013) Study also examined the employment effects of immigration
115

Guide on measuring migration policy impacts in ASEAN
Cha
pte
r 6
and concluded that foreigners create employment for Malaysians. They contend that hiring
foreign labour reduces the costs of production, making Malaysian firms cheaper and more
competitive in the global market and subsequently increasing their demand for Malaysian
workers. For every 1,000 new foreigners that enter a given sector in a given state, 836 new
full-time and 169 part-time jobs are created for Malaysians. However, the employment effects
vary by sector, gender, age and education. More jobs were created in services (742 jobs) and in
agriculture and mining (671 jobs) than in manufacturing (193 jobs) following an additional intake
of 1,000 foreign workers in each of these sectors.26
With respect to gender, one main concern is that hiring foreign workers discourages women
from entering the labour force. The findings showed that an additional 1,000 migrants in a given
sector increases overall male employment by 604 workers, but the overall effect on women
although positive is only 205 additional jobs. The impact on women’s work also varies by broad
economic sectors. While it is positive and significant for women working in the services sector, it
is negative for women employed in manufacturing. Further different age-groups were affected
differently following an additional intake of 1,000 foreigners. Foreign workers created more jobs
for older Malaysians. There was no employment effect on the 5 to 19 year-olds, while 207 new
jobs were created for those between 20 to 29 years, 303 jobs for 30 to 44 year olds, and 340
new jobs for those over 45 years. Finally, analysis on the effects of migrants by education level
showed positive outcomes for those with middle and high levels of education, but impacted
negatively on the lowest educated. For every 100 new foreign workers there was a job loss of
114 for workers with no formal or primary education. In other words, Malaysians with low levels
of education compete directly with foreigners who are also low-skilled.
In general, the analysis of the labour market outcomes of immigration using the Annual Labour
Force data is highly questionable. The more disaggregated the analysis, such as in the World
Bank and ILMIA (2013) Study, the more unreliable the results. The labour force survey severely
underestimates the total number of migrant workers in the country as it only includes all
workers in single dwellings. Migrants, especially the undocumented workers who largely remain
clandestine, especially from state officials, are rarely captured by the LFS. Currently there are an
estimated two undocumented migrants for every documented migrant. By isolating about two-
thirds of the migrant population in their analysis the studies severely underestimate the effects
of migrants on the labour market or even produce erroneous results. Despite the limitations of
the various studies, they do however clearly show that foreign workers complement skilled local
workers but compete with low-skill workers and negatively impact their wages.
Firm-level outcomesOne of the major economic challenges confronting the Malaysian economy is sluggish productivity
growth. Malaysia’s total factor productivity (TFP) has been relatively low and declining. Official
116
26 The effect in manufacturing is not statistically significant, while it is so in the other sectors.

Guide on measuring migration policy impacts in ASEAN
Cha
pte
r 6
estimates of TFP growth find a decline from 2.5 per cent during the Sixth Malaysian Plan
Period (1991-1995) to 1.6 per cent from 1998 to 2007 (Government of Malaysia, Sixth (1991-
1995) and Tenth Malaysian 2011-2015) Plans). Though a high-value added growth strategy
has been the policy stance since the Seventh Malaysia Plan (1996-2000), in practice, growth
has been largely driven by the more labour-intensive industries. It has been argued that the
import of large-scale low-skill foreign workers has been used to sustain the profitability and
competitiveness of key growth industries. The easy availability of low-skill foreign workers
is said to deter firms from scaling up the value chain through greater investment in capital,
technology and workers. Empirical analysis of the effects of foreign labour on productivity has
also produced mixed results.
Findings from the MSN (2014) study revealed that foreign workers had a negative impact
on real labour productivity. On average a 1 per cent increase in foreign workers lowered the
level of productivity by 0.03 per cent. Further, the productivity of foreign workers is much
less than that of local workers and the gap has been widening. The econometric analysis
showed that foreign worker productivity dropped by 4.5 per cent annually during the 1990s,
while local workers’ productivity increased by 3.3 per cent annually over the same period. By
contrast, Zaleha, et al 2011 found that foreign labour has significant and positive impact on
labour productivity in manufacturing. A 1 per cent increase in foreign labour increased labour
productivity by 0.172 per cent, while a similar increase in domestic labour increased labour
productivity by 1.93 per cent.
Further the CGE impact analysis at the detailed industry level analysis also showed that the
policy of addressing labour shortages through the large-scale intake of low-skilled labour had
not only made labour-intensive industries more profitable than otherwise, but it has led to
the expansion of labour-intensive activities (Kanapathy, 2010). Industries that relied heavily
on low-skill foreign labour such as the primary commodity export sectors (rubber, oil palm,
and forestry) have registered the largest increase in employment, ranging from 2.4 to 5.0
percentage points. The import-competing manufacturing industries which also rely heavily
on low-skill foreign labour (such as the wood and rubber-based industries) registered an
employment expansion of between 2.2 to 3.6 percentage points. The rise in capital supply
lags behind the increase in labour in the short run, leading to a fall in the capital-labour ratio.
This can be attributed to an expansion of industries that use intensively low-skilled labour or
substitution on the part of industries towards low-skilled labour following a decline in relative
real wages of low-skilled labour. The change in relative prices thus have significant impact on
the industrial structure of the economy and may explain why Malaysia, despite the tight labour
market, has been slow in moving up the value chain through more capital- and skill-intensive
production processes.
On the other hand, the World Bank & ILMIA Study (2013) showed a positive relationship
between foreign worker utilization and productivity for larger firms and a negative relationship
for smaller firms. A 10 per cent increase in the level of foreign workers at a representative firm
increased TFP in the manufacturing sector by 6.2 percent and in construction by 1.8 per cent
117

Guide on measuring migration policy impacts in ASEAN
Cha
pte
r 6
in the case of the medium and large firms (50+ workers). For plantations, it noted that the
results are not conclusive due to the lack of statistical significance. In the case of smaller firms
(20 to 50 workers), the effect is negative but not significant in the case of the manufacturing
sector, but negative for the plantation and construction sectors. A 10 per cent increase in the
employment of foreign workers reduces TFP by 18.3 per cent in the plantations sector and by
5.8 percent in the construction sector.
Narayanan and Lew (2014) studied the impact of foreign workers in manufacturing and lent
further support to the contention that foreign workers in manufacturing did negatively impact
upon productivity growth. They explain that productivity in manufacturing has been declining
since 2000 and this is consistent with the rising share of low-skilled and unskilled immigrant
workers during this period. Even though the capital-labour ratio has been on the rise since
2005, this they suspect is due to the easy availability of labour that encouraged employers
to sustain output increases through the use of more capital equipment that needed labour
(labour–using technologies) rather than opting for technologies that substituted labour
(capital using technologies).
6.4.6 Socio-political outcomesAside from the economic impact, high foreign worker dependency has also raised the social
and political anxiety in the country, particularly with respect to the rising incidence of crime,
congestion in the use of public amenities, enhanced competition in the market and workplace,
health risks as well as the fraudulent use of foreigners as voters in general elections. As noted
earlier, there is little empirical analysis on the socio-political outcomes of foreign workers in
the country due to the lack of empirical data and the methodological difficulties inherent in
undertaking such an exercise. Though many of the popular concerns may be mere perceptions
or exaggerated claims, they have important ramifications for the economy and society. It is
important to understand why such perceptions prevail in society and address the sources of
competition and conflict in a timely manner.
The following surveys some of the main popular concerns and the anecdotal evidence and
empirical research available on the social impact of foreign workers. The impact of migrants
on the political outcomes in the country, though important, especially in Sabah, is too complex
and controversial to be dealt with here. With the rapid expansion of foreign workers in the
country, especially in the urban areas, sources of competition stemming from foreign workers
have been highlighted in the local media or at public forum. These assertions are largely
anecdotal but they do pose challenges to policy-makers.
One of the main sources of tension with foreign workers raised during interviews with local
employees is competition at the workplace, even when local workers are paid more than
foreigners. Interviews with employers suggest that foreigners are more willing to do overtime
and rarely take leave in contrast to local workers. This is understandable since unlike foreign
workers, local employees have family obligations and hence more inclined to take leave.
Hence local workers complain that employers prefer hiring foreigners. Further, in the unionized
118

Guide on measuring migration policy impacts in ASEAN
Cha
pte
r 6
occupations or industries, the employment of huge numbers of foreign workers is seen as an
impediment to union efforts at bargaining for better terms and conditions of employment for
local workers. The wages and benefits of foreign workers are often not directly dependent
on union negotiations but on the contract of employment between the foreign worker and
the employer.
Competition in the informal trade and services sector is another area of concern following
the rise in the number of foreigners engaged in petty trading. Foreign workers who engage
in petty trading or providing services that require little overhead costs, such as grass cutting,
car-washing, repair and minor renovations, are seen to pose a threat to the livelihood of the
locals. There is ample anecdotal evidence of foreigners, especially those who have been
in the country long enough to familiarize themselves with the local conditions, engaging
in petty trading in the urban areas, especially at night markets throughout Greater Kuala
Lumpur, and in areas where there are large concentrations of foreigners. Interviews with local
councils show that foreigners either operate without licenses or use licenses issued to locals
who rent it out to them. They compete by underpricing as their overheads are generally low
compared to the legitimate local traders. They usually do not comply with regulations and
operate in makeshift tents.
There are large numbers of foreigners in the urban areas and they are perceived to compete
with the local population for housing, amenities and other public services such as public
transport. Lack of affordable housing is a major policy issue in urban areas. The majority
of foreigners live in low-cost houses and thus they are seen to compete with the locals
for cheaper accommodation. Moreover, foreigners usually prefer living within their own
community and have converted certain locations within the city into “foreign settlements”,
compelling the locals to move out of these areas or depressing the rental and property prices
of these areas. There is currently no reliable data on such “foreign squatters or settlements”,
though complaints from locals are highlighted in the social and print media. These crowded
settlements are seen to burden the provision of the limited basic amenities. Apart from
competition for housing, foreigners are also seen to compete with the local population for
public transport and public health services. Though all documented foreign workers must
have medical insurance, many foreigners, especially those without work permits impose a
heavy toll on public medical services.
Foreign workers are also associated with greater exposure to health risks and inflict a financial
burden on the healthcare system in the country. There has been a re-emergence of many of
the highly contagious diseases that had once been wiped out following the inflow of foreign
workers, especially the undocumented who bypass compulsory health screening. All foreign
workers must produce certificates of fitness from recognized clinics in their home countries
before work permits are issued to them. They would undergo re-examination by FOMEMA
within a month of arrival. FOMEMA also carries out random checks on 10.0 per cent of the
new foreign workers that enter the country each year to ascertain whether they suffer from
infectious diseases.
119

Guide on measuring migration policy impacts in ASEAN
Cha
pte
r 6
Statistics released by the Health Minister revealed that about 3 to 7 per cent of the 1.3 million
foreign workers who did not undergo the two health screenings were found to be suffering
from tuberculosis, hepatitis B, syphilis, HIV and leprosy. Statistics released by FOMEMA
revealed that out of the 1.27 million foreign workers screened, 3 to 3.5 per cent had failed the
second screening test for TB and other diseases. There has been a steady rise in the incidence
of tuberculosis in the country and it is the highest cause of death among all infectious diseases,
even surpassing the death rate due to dengue. There were 58 cases per 100,000 in 1995 and
it rose to 63 cases per 100,000 in 2008 or about 16,000 cases in 2008. This figure has risen to
18,000 cases in 2010, posing a challenge to the health services in the country. Foreign workers
often live in overcrowded conditions, and about 85 per cent of the incidence of tuberculosis
was from among foreign workers (Bernama News Agency, Dec 29, 2013). The majority of the
foreign workers does not have adequate health insurance and thus burden the public health
system with rising unpaid medical bills. Mandatory health insurance coverage was introduced
in January 2011 to address the problem as well as to improve the healthcare benefits of
foreign workers.
The influx of foreign workers is also perceived to impinge upon public safety and security.
Cross-border terrorism activities in the region have raised concerns about employing large
numbers of migrants from countries associated with terrorist activities. However, the incidence
of crimes committed by foreigners has been low on a per capita basis. Between 1992 and
2002, the proportion of crimes committed by foreigners merely hovered around 2.0 per cent
of the total crimes in Malaysia, but the ratio has been on the rise (Kanapathy, 2006). In a recent
interview with an Al Jazeera correspondent, the Deputy Minister of Home Affairs said that
the percentage of crimes committed by foreigners now stands at about 15 per cent (www.
aljazeera.com/programmes/101east, Nov. 23, 2014). However, a recent study that analysed
the relationship between immigration and crime in Malaysia using data on crimes by state for
the years 2003 to 2010 found no correlation between immigration and crime in Malaysia (World
Bank & ILMIA, 2013). The study further found that immigration reduces both the crime rate
and the absolute number of crimes committed. An additional 100,000 immigrants in a state of
Malaysia reduces the absolute number of crimes committed in Malaysia by between 1.4 and
4.6 per cent, depending on the crime, while having no effect on the number of murders. They
argue that the main reason immigration reduces crime in Malaysia is because it encourages
economic activity.
6.4.7 The impact of minimum wages Statutory minimum wages in Malaysia came into effect from 1 January, 2013 in accordance
with the Minimum Wages Order 2012. The national minimum wage for Peninsular Malaysia was
set at MYR900 per month, while for Sabah and Sarawak it was slightly lower at MYR800 per
month. Employers with six or more employees have to pay minimum wages with effect from
1 January, 2013, and those with five or fewer employees had to implement it by 1 July, 2013.
The policy for foreign employees in the small and medium-sized enterprises was however
deferred until 31 December, 2013 following employer demands. Malaysia has a policy of equal
120

Guide on measuring migration policy impacts in ASEAN
Cha
pte
r 6
pay for equal work, irrespective of nationality hence, minimum wages also apply to foreign
workers. The minimum wage was defined to include all basic allowances and all other fixed
cash payments to the workers.
Following protests from employers, the government allowed companies to deduct the levy
from the monthly salary of workers. In addition employers are allowed to deduct an amount
not exceeding MYR50 per month per migrant worker for accommodation. Applications for
accommodation costs exceeding MYR50 a month for each foreign worker may be considered
by the Labour Department in special circumstances. The deduction is allowed without any
applications but the employer has to notify the nearest Labour Office via email or letter.
According to employers, the average basic wages of foreign workers is between MYR450 to
MYR600 per month, excluding housing, amenities and transportation costs. The basic wage
does not include overtime and bonus payments. The implementation of minimum wages is
thus expected to increase wages of foreign workers by about 16 to 78 per cent (see table
6.14). Foreign workers in the plantation sector are likely to benefit the most as their monthly
wages would rise by between 34 to 78 per cent. Those in the services sectors gain the least,
i.e., between 16 to 55 per cent as they pay higher levy, as high as MYR1,850 annually.
On the other hand, the vast majority of local workers remain unaffected by the implementation
of minimum wages as their wages were most likely above the minimum wage due to their
tenure of employment. Unlike local workers, foreigners are hired on an annual contract basis
and as such their wages are fixed irrespective of the number of years in service. According to
industry sources, many foreigners also earned above the minimum wage, if other payments
such as over-time and bonus payments were included.27 Following the imposition of the
minimum wage, the over-time pay will increase as well since it is set at 1.5 times the basic
hourly wage. Thus the total wage bill for foreign workers will increase with the same number
of hours worked.
Firms that produce for the international market are not in a position to pass on their labour
cost hikes to the consumers, and thus must compensate by increasing their productivity.
Based on industry sources, the average productivity increase per year is about 2 to 3 per cent,
whereas the anticipated wage hikes for foreign workers are between 16 to 78 per cent. Thus in
the short run the imposition of minimum wages is anticipated to have significant implications
for the economy. The following uses a computable general equilibrium model to analyse the
economy-wide impact of the wage rise for foreigners, following the implementation of the
minimum wage. The details of the computable general equilibrium model (MyGEM) are fully
documented in Kanapathy (2010).
121
27 Overtime pay should evidently not be included in reckoning if workers receive the minimum wage.

Guide on measuring migration policy impacts in ASEAN
Cha
pte
r 6
Tab
le 6
.14
Mo
nthl
y m
inim
um w
age
of
fore
ign
wo
rker
s b
efo
re a
nd a
fter
min
imum
wag
e im
ple
men
tati
on
in P
enin
sula
r M
alay
sia
Low
wag
e
(RM
)
Hig
h w
age
(RM
)
Plan
tati
onC
ons
truc
tio
nM
anuf
actu
ring
Serv
ices
Pla
ntat
ion
Co
nstr
ucti
on
Man
ufac
turi
ngSe
rvic
es
Bas
ic S
alar
y b
efo
re
min
imum
wag
e45
045
045
045
060
060
060
060
0
Bas
ic s
alar
y af
ter
min
imum
wag
e90
090
090
090
090
090
090
090
0
Ded
ucti
ons
per
mit
ted
Levy
*49
104
104
154
4910
410
415
4
Acc
om
mo
dat
ion
5050
5050
5050
5050
Min
imum
tak
e ho
me
wag
e80
174
674
669
680
175
675
669
6
Incr
ease
in w
ages
(%)
78.0
65.8
65.8
54.7
33.5
26.0
26.0
16.0
No
te: *
The
hig
hest
levy
fo
r th
e se
rvic
es s
ecto
r is
ap
plie
d
122

Guide on measuring migration policy impacts in ASEAN
Cha
pte
r 6
Impact of minimum wages on the economy The extent of wage increases varies between sectors, depending on the salary structure and
the levy imposed (See Table 14). Thus the economy-wide impact analysis is carried out using
three different wage increase scenarios, i.e. 35, 45 and 55 per cent. The percentage increase
is computed using the average of the high and low wage rises for three different sectors to
analyse the impact of the minimum wage on the economy. It is assumed that local workers
will not be affected by the implementation of the minimum wage policy as their wages were
already above the minimum level. Only the wages of foreign workers are increased by 35, 45
and 55 per cent. The impact on key macroeconomic variables following the rise in the wages
of low-skill foreign labour is presented in Table 6.15 below.
Table 6.15 The macroeconomic impact of the minimum wage policy
Variables Description 35% increase
in foreign worker wages
45% increase
in foreign worker wages
55% increase
in foreign worker wages
delB (Balance of trade)/GDP -0.003 -0.005 -0.006
x0gdpexp Real GDP from
expenditure side
-0.550 -0.710 -0.860
p3tot Consumer price index 0.210 0.270 0.340
p4tot Export price index, local
currency
0.070 0.090 0.110
x3tot Real household
consumption
-0.110 -0.140 -0.170
x4tot Export volume index -0.670 -0.870 -1.060
x5tot Aggregate real
government demands
-0.110 -0.140 -0.170
x0imp_c Import volume index,
duty-paid weights
-0.320 -0.410 -0.500
employ_ios Aggregate employment
(persons weights)
-1.850 -2.380 -2.910
realwage Average real wage 3.510 4.510 5.520
x1prim_i Aggregate output (value
added weights)
-0.570 -0.720 -0.900
p0realdev Real devaluation -0.540 -0.700 -0.860
Aggregate investment
price index
1.430 1.840 2.250
In the short run, the increase in wages of the low-skill foreign labour is expected to decrease
national output and increase the average real wage. As expected, real GDP falls between
0.57 to 0.55 percentage points, depending on whether GDP is measured at market price or
at factor cost, while the average real wage rises by 3.51 per cent. The difference between the
123

Guide on measuring migration policy impacts in ASEAN
Cha
pte
r 6
124
GDP at factor cost and market price is due to the indirect taxes. The decreased output can be
explained from both the supply and demand sides. From the supply side, these adjustments
can be explained by the fall in employment. The number of people employed falls by 1.9 per
cent. From the demand side, the fall in GDP at market prices can be attributed to the decline
in exports (-0.67 per cent), household consumption (-0.11) and in government expenditure
(-0.11 per cent).
Imports have also fallen by 0.32 per cent. The lower imports can be attributed to the relatively
high import intensity of Malaysian exports. The export decline has exceeded the decrease
in imports, giving rise to a negative trade balance. The trade balance (delB) has declined
marginally by 0.004 per cent.
The rise in wages has increased the domestic prices/costs relative to foreign prices/costs,
making Malaysian exports less competitive. The increase in domestic prices is reflected by
the increase in investment (1.43 per cent), consumer (0.21 per cent) and exports prices (0.07)
indices. These relative price adjustments explain the fall in exports and are reflected by the
real devaluation of the Malaysian Ringgit by 0.54 per cent.
The higher wage increases of the low-skill foreign workers of 45 per cent and 55 per cent
bring about similar changes in the macroeconomy, but the impact of higher wage rises is more
significant with respect to the average real wage, exports and the level of employment.
6.5 Conclusion
The empirical analysis on the economic impact of foreign workers on the Malaysian economy
clearly show that foreign workers do contribute to economic growth. The increase in GDP is
driven by the increase in exports, consumption and investment following the intake of foreign
workers. Growth however is less driven by productivity. The large-scale intake of low-skill
foreign workers has had a negative impact on productivity growth.
The debate favouring a positive relationship between immigration and productivity stems from
the notion that firm level efficiency increases with a more global and culturally plural workforce
that can enhance knowledge and foster creativity and innovation. In the case of Malaysia,
where an overwhelming 98 per cent of the foreign workers are low-skilled the likelihood of a
positive relationship between foreign workers and productivity is highly unlikely.
The large-scale availability of low-skill foreign workers has acted as a disincentive to use
capital-using technologies. Even though there was an increase in capital investment, the
investment has been in industries that use labour-using technologies rather than in industries
that substituted labour for capital (i.e. capital-using technologies).
Malaysia’s leading export sectors are largely driven by labour-intensive industries. The
easy availability of low-skill foreign labour has encouraged investment in labour-intensive

Guide on measuring migration policy impacts in ASEAN
Cha
pte
r 6
manufacturing industries, including the domestic-oriented labour-intensive industries. Even in
the plantation sector heavy foreign worker reliance has curtailed productivity enhancements.
According to the Malaysian Palm Oil Board (MPOB), firms have shown little commitment to
adopting new technologies even if there are more than 30 types of farm machinery that have
been shown to increase worker productivity and reduce reliance of labour in plantations.
While the impact of immigration on overall wages remains unclear, there is strong empirical
evidence that the employment of low-skill foreign workers has a negative impact on the
wages of low-skilled local workers. The hiring of migrant labour has undermined wage growth
in the country, and the hardest hit are the low-skill Malaysians who experience a decline in
their wages. While migrant workers complement high-skill local workers, they tend to displace
local low-skill workers as employers try to reduce their non-wage costs.
High foreign worker dependency also has important ramifications for the economy and society.
However, there is little empirical analysis on the socio-political outcomes of foreign workers
in the country. More empirical research is needed to understand why negative perceptions
of foreign workers prevail in society and to address the sources of competition and conflict
in a timely manner.
125
Cambodian fishing community, Rayong province, Thailand©ILO/E. Maillard 2012

Guide on measuring migration policy impacts in ASEAN
Cha
pte
r 6
126114 128PT Panasonic Indonesia.©ILO.Asrian Mirz

Guide on measuring migration policy impacts in ASEAN
Ref
eren
ces
References
Abella, M. 2013. Use of foreign labour to meet labour shortages in dynamic East- and South-East Asian economies (Bangkok, ILO). Available at: http://www.ilo.org/wcmsp5/groups/
public/---asia/---ro-bangkok/documents/publication/wcms_219023.pdf. [8 Jan. 2015].
Agunias, D. 2010. Migration’s middlemen: Regulating recruitment agencies in the Philippines-United Arab Emirates Corridor (Washington, Migration Policy Institute).
Athukorala, P. and E. S. Devadason. 2012. “The impact of foreign labour on host country
wages: The experience of a southern host, Malaysia”, in World Development, Vol. 40 No.8,
pp. 1497-1510.
Borjas, G. 1995. “The economic benefits of immigration”, in Journal of Economic Perspectives, Vol. 9, No. 2, pp. 3–22. Available at: www.aeaweb.org/articles.php?doi=10.1257/jep.9.2.3.
[8 Jan. 2015].
Chantavanich, S.; Vungsiriphisal, P.; Laodumrongchai, S. 2007. Thailand policies towards migrant workers from Myanmar (Bangkok, Asian Research Centre for Migration).
Eberts, R.; Holzer, H. 2004. “Overview of labour exchange policies and services”, in D.
Balducchi, R. Eberts, and H. Holzer (eds.) Labour exchange policy in the United States (Kalamazoo, Upjohn Institute), pp. 1–31.
George, A.; Lalani, M.; Mason, G.; Rolfe, H.; Bondibene, C. 2012. “Skilled immigration and
strategically important skills in the UK economy”, report prepared for Migration Advisory
Committee, United Kingdom, 7 Feb. Available at: www.niesr.ac.uk/pubs/searchdetail.
php?PublicationID=3221 [8 Jan. 2015].
Hanson, Gordon. 2006. Illegal migration from Mexico to the United States. NBER Working
Paper No. 12141. Available at http://www.nber.org/papers/w12141 [8 Jan. 2015].
Hui, W.T. 2013. “Economic growth and inequality in Singapore: The case for a minimum
wage”, in International Labour Review, No. 152, pp. 107–123. Available at: http://
onlinelibrary.wiley.com/doi/10.1111/j.1564-913X.2013.00171.x/abstract [8 Jan. 2015].
Jajri, I & Ismail, R. 2006. “Elasticity of substitution between foreign and local workers in the
Malaysian manufacturing sector”, in Journal of Social Science & Humanities, Vol. 14, No. 1,
pp. 63-76.
International Labour Organization (ILO). 2006. Multilateral Framework on Labour Migration: Non-binding principles and guidelines for a rights-based approach to labour migration
115127

Guide on measuring migration policy impacts in ASEAN
Ref
eren
ces
128
(Geneva, ILO). Available online at www.ilo.org/public/english/protection/migrant/areas/
multilateral.htm [8 Jan. 2015]
International Migration Organization. 2013. World Migration Report 2013. Migrant Well-being and Development. Available at: http://publications.iom.int/bookstore/free/
WMR2013_EN.pdf [8 Jan. 2015]
Kanapathy, V. 2010. Impact of migrant labour in Malaysia: A general equilibrium analysis, paper presented at the World Bank/Institute of Policy Studies Workshop on Cross Border
Mobility in the Asia-Pacific Region, Singapore, 28 – 29 May.
Kanapathy, V. 2006. Migrant workers in Malaysia: An overview, country paper prepared for
the Workshop on an East Asian Cooperation Framework for Migrant Labour, Kuala Lumpur,
6-7 Dec.
Khurana, R. 2002. “Market triads: A theoretical and empirical analysis of market
intermediation”, in Journal for the Theory of Social Behaviour, Vol. 32. No. 2, pp. 239–262.
Available at: www.hbs.edu/faculty/Pages/item.aspx?num=12051. [8 Jan. 2015].
Migration Advisory Committee (MAC). 2010. Skilled, shortage, sensible: Review of methodology (London, MAC). Available at: https://www.gov.uk/government/uploads/
system/uploads/attachment_data/file/343446/MAC_Methodology_report.pdf. [8 Jan.
2015].
—. 2012. Analysis of the impacts of migration (London, MAC). Available at: https://www.
gov.uk/government/uploads/system/uploads/attachment_data/file/257235/analysis-of-the-
impacts.pdf. [8 Jan. 2015].
Migration News. 1998. “Thailand: Repatriation and shortage”, Vol. 5, No. 7. Available at
http://migration.ucdavis.edu/mn/more.php?id=1582_0_3_0. [8 Jan. 2015].
Narayanan, S., Lai Yew Wah. 2014. Migration and development in Malaysia: The impact of immigrant labour on the manufacturing sector, 1986-2010, paper presented at the
National Population Conference on the Inter-Relationship between Population Dynamics
and Development, University of Malaya, 6 June.
National Economic Advisory Council. 2010a. “New economic model for Malaysia part 1”.
(Putrajaya, Malaysia).
National Economic Advisory Council. 2010b. “New economic model for Malaysia concluding part 2”. (Putrajaya, Malaysia).
Ref
eren
ces

Guide on measuring migration policy impacts in ASEAN
Ref
eren
ces
National Economic Action Council. 2004. “Impact of migrant workers on the Malaysian economy: Final Report, Vol. II.” (Putrajaya, Malaysia).
Oyer, P.; Schaefer, S. 2010. “Personnel economics: Hiring and incentives”, in The Handbook of Labour Economics, Vol. 4. Available at: www.sciencedirect.com/science/article/pii/
S016972181102418X. [8 Jan. 2015].
Rahman, M. 2012. Bangladeshi labour migration to the Gulf States: patterns of recruitment
and processes, in Canadian Journal of Development Studies, Vol. 33, Issue 2. Available at:
www.tandfonline.com/doi/abs/10.1080/02255189.2012.689612 [8 Jan. 2015].
Romer, P. 1994. “The origins of endogenous growth”, in Journal of Economic Perspectives, Vol. 8,
No. 1, pp. 3–22. Available at: http://links.jstor.org/sici?sici=0895-3309%28199424%298%3A1
%3C3%3ATOOEG%3E2.0.CO%3B2-H. [8 Jan. 2015].
Ruhs, M.; Martin, P. 2014. “Independent labour commissions and labour migration: The British
MAC”, in Migration Letters, Vol. 11, No. 1, pp. 23-32.
Shah, N. 2014. Preliminary findings from pilot survey of worker-paid migration costs in Kuwait, (World Bank, KNOMAD).
Siddiqui, T. 2012. Bangladesh: Challenges of governing migration in countries of origin
(RMMRU University of Dhaka, Bangladesh), unpublished paper, Available at: www.rmmru.org
[8 Jan. 2015].
Smith, J.; Edmonston, B. (eds). 1997. The new Americans: Economic, demographic, and fiscal effects of immigration (Washington, DC, National Research Council).
Stigler, G. 1962. “Information in the labour market”, in The Journal of Political Economy, Vol.
70, No. 5, pp. 94–105. Available at: http://www.jstor.org/stable/1829106 [8 Jan. 2015].
Tenaganita. Undated. “A fact finding report: Outsourcing in labour or trafficking in migrant
labour?”
United Nations Population Division. 2009. International migrant stock: The 2008 revision, available at”: http://esa.un.org/migration/ [8 Jan. 2015].
Veneri, Carolyn M. 1999. “Can Occupational Labour Shortages Be Identified Using Available
Data?” in Monthly Labour Review, Vol., 122 No., 3 pp.15-21. Available at: http://eric.
ed.gov/?id=EJ585104 [8 Jan. 2015].
Wadhwa, V.; Saxenian, A.; Freeman, R.; Gereffi, G.; Salkever, A. 2009. America’s loss is the world’s gain: America’s new immigrant entrepreneurs, Part IV. Available at: http://papers.ssrn.
com/sol3/papers.cfm?abstract_id=1348616 [8 Jan. 2015].
129

Guide on measuring migration policy impacts in ASEAN
Ref
eren
ces
World Bank. 2013. “Bilateral migration and remittances”. Available at: http://go.worldbank.
org/JITC7NYTT0 [8 Jan 2015].
World Bank & Institute of Labour Market Information and Analysis. 2013. Immigration in Malaysia: Assessment of its economic benefits, and a review of the policy and system. (Washington, DC.).
Zachariah, K.C; Kannan, K.P. and Rajan, S. I. 2002. Kerala’s Gulf connection- CDS studies on international labour migration from Kerala State in India (Thiruvananthapuham, Centre for
Development Studies).
Zaleha, et al. 2011. “The Impact of Foreign Workers on Labour Productivity in Malaysian
Manufacturing Sector”, in International Journal of Economics and Management, Vol. 5, No. 1,
pp. 169 – 178.
130

Guide on measuring migration policy impacts in ASEAN
Ref
eren
ces
Shan construction workers in Northern Thailand.©ILO.John Hulme

Guide on measuring migration policy impacts in ASEAN
Ref
eren
ces

Guide on measuring migration policy impacts in ASEAN
Item Problem/issue Action Note
Pre-employment abroad and pre-departure: Acquiring skills, making informed decisions to work abroad, enhancing information and transparency, harmonizing standards, and regulating recruitment.
Skills training and certification The lack of a system to train and test standardized
skills can lead to costly mismatches abroad
Countries of origin (COOs) assess efficiency
of public & private training institutions to
strengthen testing & certification system and
standardize skills
Some training institutions are associated
with inadequate training and mismatches;
need for regulation
Country of destination (COD) employer
access to information on workers and
training in COOs
Reduce information asymmetry between employer
expectations and contract worker abilities
Foreign employers or COD authorities
visit COO training facilities, review training
and certification, and interview workers to
improve job–worker matching and increase
employer–worker satisfaction
Could begin visits with COO training
institutions to encourage higher standards.
Institutions could maintain data on the
share of graduates offered jobs by foreign
employers.
Facilitating job matching Minimize job and worker mismatches by:
• improving labour supply and demand data;
• harmonizing occupational classification
systems using the International Standard
Classification of Occupations (ISCO);
• facilitating recognition of standards and
certificates
COOs and CODs cooperate to develop
common definition of occupations, and
COOs promote use of COD job titles in
training institutions and encourage training
to meet skill requirements of CODs
CODs and COOs cooperate to develop
data on supply and demand for workers
with various skills to develop job–worker
exchange systems
CODs and COOs cooperate to align skill
certification and testing systems in line with
international standards
One starting point is ILO use of employer
definitions to modify ISCO-88 occupations
COD or third party to evaluate COO skills
training and testing standards
Improved labour market data can be useful
in labour market planning in both COD and
COO
Ensuring better balance between labour
supply and demand
Admitting contract workers largely on the basis of
employer requests can result in too many workers,
reducing productivity and perhaps encouraging
irregularity
Developing labour market indicators to
determine the optimal number and skill mix
of contract workers by assessing past or
similar projects elsewhere.
Develop preferences, quotas and/or levy
systems to improve the management of
employer requests for contract workers
Goal of contract worker policy should be to
increase productivity and enhance national
competitiveness.
Better labour market information can help
to increase the employment of local workers
and ensure that contract worker policy
supports economic policy
133
Cha
pte
r 6
Appendix I Best-practice recommendations: Managing labour migration

Guide on measuring migration policy impacts in ASEAN
Item Problem/issue Action Note
Pre-employment abroad and pre-departure: Acquiring skills, making informed decisions to work abroad, enhancing information and transparency, harmonizing standards, and regulating recruitment.
Skills training and certification The lack of a system to train and test standardized
skills can lead to costly mismatches abroad
Countries of origin (COOs) assess efficiency
of public & private training institutions to
strengthen testing & certification system and
standardize skills
Some training institutions are associated
with inadequate training and mismatches;
need for regulation
Country of destination (COD) employer
access to information on workers and
training in COOs
Reduce information asymmetry between employer
expectations and contract worker abilities
Foreign employers or COD authorities
visit COO training facilities, review training
and certification, and interview workers to
improve job–worker matching and increase
employer–worker satisfaction
Could begin visits with COO training
institutions to encourage higher standards.
Institutions could maintain data on the
share of graduates offered jobs by foreign
employers.
Facilitating job matching Minimize job and worker mismatches by:
• improving labour supply and demand data;
• harmonizing occupational classification
systems using the International Standard
Classification of Occupations (ISCO);
• facilitating recognition of standards and
certificates
COOs and CODs cooperate to develop
common definition of occupations, and
COOs promote use of COD job titles in
training institutions and encourage training
to meet skill requirements of CODs
CODs and COOs cooperate to develop
data on supply and demand for workers
with various skills to develop job–worker
exchange systems
CODs and COOs cooperate to align skill
certification and testing systems in line with
international standards
One starting point is ILO use of employer
definitions to modify ISCO-88 occupations
COD or third party to evaluate COO skills
training and testing standards
Improved labour market data can be useful
in labour market planning in both COD and
COO
Ensuring better balance between labour
supply and demand
Admitting contract workers largely on the basis of
employer requests can result in too many workers,
reducing productivity and perhaps encouraging
irregularity
Developing labour market indicators to
determine the optimal number and skill mix
of contract workers by assessing past or
similar projects elsewhere.
Develop preferences, quotas and/or levy
systems to improve the management of
employer requests for contract workers
Goal of contract worker policy should be to
increase productivity and enhance national
competitiveness.
Better labour market information can help
to increase the employment of local workers
and ensure that contract worker policy
supports economic policy
134

Guide on measuring migration policy impacts in ASEAN
Item Problem/issue Action Note
Improve systems to allow employers to hire
contract workers already in the COD instead
of admitting new contract workers from
abroad
CODs and COOs cooperate to suppress
trading in work permits
Explore management systems so that
employers do not have incentives to request
“too many” contract workers
Standard or model contracts Disputes over terms and requirements of the job
once the contract worker has arrived in the COD
Develop and mandate the use of standard
or model contracts that contain all key
employment terms and conditions. Transfer
approved contracts electronically from
COD to COO, and ensure that workers
understand their rights and obligations
by having COO government agencies
attest that departing workers receive and
understand their contracts
Contract workers can more easily make
informed decisions if they are educated
about their rights and responsibilities under
standard contracts, and COO agencies
explain contract terms
Pre-departure and post-arrival education
and information
Potential workers need to be better informed
of what to expect in COD before departure,
including the job, local laws, and information on
health and social services
CODs and COOs can cooperate to produce
brochures and multimedia tools that explain
to contract workers their jobs and lives
abroad in a language they understand
Families should be able to learn about and
plan for contingencies that arise when a
family member is employed abroad
Videos can be screened on COO television
as well as at pre-departure orientation to
show typical workplaces, accommodations,
lifestyles, etc.
Regulating recruitment Unlicensed recruiters take advantage of low-
skilled workers
Maximum fees set by COOs are violated routinely;
many fees are paid by workers to subagents and
other intermediaries
Recruiters engage in visa trading
Improve pre-departure health screening to avoid
sending workers abroad who are found to be
medically unfit
COOs should adopt realistic and easy to
understand maximum recruitment fees that
departing workers’ pay, such as one month’s
foreign wages.
COOs educate workers about maximum
fees and strengthen enforcement to reduce
over charges. Encourage licensed agencies
to open branches in labour-source areas.
CODs and COOs cooperate to combat trade
in employment permits, with enforcement
aimed at full disclosure of all fees paid, their
purpose, and their recipients.
Linking recruitment fees to foreign wages
is easy for workers to understand, but may
cause complications if CODs require COD
employers to pay all recruitment fees or
inequities between workers with different
foreign wages.
COD mandates that COD employers and
agents collected no fees from contract
workers
135

Guide on measuring migration policy impacts in ASEAN
Item Problem/issue Action Note
Improve systems to allow employers to hire
contract workers already in the COD instead
of admitting new contract workers from
abroad
CODs and COOs cooperate to suppress
trading in work permits
Explore management systems so that
employers do not have incentives to request
“too many” contract workers
Standard or model contracts Disputes over terms and requirements of the job
once the contract worker has arrived in the COD
Develop and mandate the use of standard
or model contracts that contain all key
employment terms and conditions. Transfer
approved contracts electronically from
COD to COO, and ensure that workers
understand their rights and obligations
by having COO government agencies
attest that departing workers receive and
understand their contracts
Contract workers can more easily make
informed decisions if they are educated
about their rights and responsibilities under
standard contracts, and COO agencies
explain contract terms
Pre-departure and post-arrival education
and information
Potential workers need to be better informed
of what to expect in COD before departure,
including the job, local laws, and information on
health and social services
CODs and COOs can cooperate to produce
brochures and multimedia tools that explain
to contract workers their jobs and lives
abroad in a language they understand
Families should be able to learn about and
plan for contingencies that arise when a
family member is employed abroad
Videos can be screened on COO television
as well as at pre-departure orientation to
show typical workplaces, accommodations,
lifestyles, etc.
Regulating recruitment Unlicensed recruiters take advantage of low-
skilled workers
Maximum fees set by COOs are violated routinely;
many fees are paid by workers to subagents and
other intermediaries
Recruiters engage in visa trading
Improve pre-departure health screening to avoid
sending workers abroad who are found to be
medically unfit
COOs should adopt realistic and easy to
understand maximum recruitment fees that
departing workers’ pay, such as one month’s
foreign wages.
COOs educate workers about maximum
fees and strengthen enforcement to reduce
over charges. Encourage licensed agencies
to open branches in labour-source areas.
CODs and COOs cooperate to combat trade
in employment permits, with enforcement
aimed at full disclosure of all fees paid, their
purpose, and their recipients.
Linking recruitment fees to foreign wages
is easy for workers to understand, but may
cause complications if CODs require COD
employers to pay all recruitment fees or
inequities between workers with different
foreign wages.
COD mandates that COD employers and
agents collected no fees from contract
workers
136

Guide on measuring migration policy impacts in ASEAN
Item Problem/issue Action Note
Incentives for recruiter self-regulation Recruitment agencies and subagents are difficult
to regulate effectively
Provide incentives based on the
performance of agencies in placing workers
in foreign jobs without complaints (e.g., ABC
rating system)
A-rated recruiters can receive expedited or
special services and gain market share over
time
Reward A-recruiters with (1) self-certification
of standard contracts after a period of
inspection that finds no problems; (2)
opportunity to accompany minister abroad
Can favour employer–recruiter pairs that
establish long-term relationships
Reduce worker debt Many workers obtain loans from moneylenders at
high cost to pay deployment costs
COOs develop programmes to protect
departing workers from excessive pre-
departure debt
Reducing airfare cost Some policies of COD and COO may raise travel
costs for the workers
Encourage airlines to offer low one-way fares
and encourage discount airlines to serve
major contract employment corridors
CODs reconsider requirement that workers
have return tickets
Cooperate to develop low-cost round-trip
tickets
Re-evaluate requirements that employers
pay airfare if this raises costs to workers
Employment abroad: Preparing workers for a new work environment, protecting worker rights, enhancing communication and access to information
Briefing newly arrived workers Avoid problems by familiarizing workers with
local labour and immigration laws. Explain how to
access health and other services in the COD, as
well as the services provided by COOs in the COD
(e.g., labour attachés)
COD and COO cooperate to develop
content of orientation programme for
departing and newly arrived workers
that explains the workers’ rights and
responsibilities and how to deal with
common issues
CODs to develop and disseminate Standard
Operating Procedures to handle arrivals as
well as problems, from runaway workers to
arrests
Enhancing communications Lack of common language can cause employer–
employee misunderstanding.
Foreign workers may not be able to access
information, advice, and particular forms of
assistance.
Make workers aware of the services
provided by COO labour attachés. Establish
information services for foreign workers in
major cities, and create helplines/hotlines to
answer worker questions.
Republic of Korea and Canadian worker
centres may be a model to provide multi-
language centres and helplines or hotlines
Republic of Korea requires workers to learn
some Korean before they can be selected
by employers to work in the Republic of
Korea
137

Guide on measuring migration policy impacts in ASEAN
Item Problem/issue Action Note
Incentives for recruiter self-regulation Recruitment agencies and subagents are difficult
to regulate effectively
Provide incentives based on the
performance of agencies in placing workers
in foreign jobs without complaints (e.g., ABC
rating system)
A-rated recruiters can receive expedited or
special services and gain market share over
time
Reward A-recruiters with (1) self-certification
of standard contracts after a period of
inspection that finds no problems; (2)
opportunity to accompany minister abroad
Can favour employer–recruiter pairs that
establish long-term relationships
Reduce worker debt Many workers obtain loans from moneylenders at
high cost to pay deployment costs
COOs develop programmes to protect
departing workers from excessive pre-
departure debt
Reducing airfare cost Some policies of COD and COO may raise travel
costs for the workers
Encourage airlines to offer low one-way fares
and encourage discount airlines to serve
major contract employment corridors
CODs reconsider requirement that workers
have return tickets
Cooperate to develop low-cost round-trip
tickets
Re-evaluate requirements that employers
pay airfare if this raises costs to workers
Employment abroad: Preparing workers for a new work environment, protecting worker rights, enhancing communication and access to information
Briefing newly arrived workers Avoid problems by familiarizing workers with
local labour and immigration laws. Explain how to
access health and other services in the COD, as
well as the services provided by COOs in the COD
(e.g., labour attachés)
COD and COO cooperate to develop
content of orientation programme for
departing and newly arrived workers
that explains the workers’ rights and
responsibilities and how to deal with
common issues
CODs to develop and disseminate Standard
Operating Procedures to handle arrivals as
well as problems, from runaway workers to
arrests
Enhancing communications Lack of common language can cause employer–
employee misunderstanding.
Foreign workers may not be able to access
information, advice, and particular forms of
assistance.
Make workers aware of the services
provided by COO labour attachés. Establish
information services for foreign workers in
major cities, and create helplines/hotlines to
answer worker questions.
Republic of Korea and Canadian worker
centres may be a model to provide multi-
language centres and helplines or hotlines
Republic of Korea requires workers to learn
some Korean before they can be selected
by employers to work in the Republic of
Korea
138

Guide on measuring migration policy impacts in ASEAN
Item Problem/issue Action Note
Strengthen enforcement of labour and
other laws
COD may find it hard to detect violations of
wage and other labour laws that protect contract
workers if they rely on worker complaints
CODs can ensure that contract workers
receive the wages due them with wage
protection systems and mandatory insurance
schemes, and monitor these schemes to
ensure compliance
Many workers are employed in dangerous
occupations, including construction,
highlighting the need for education to
minimize occupational risks, effective
treatment for injuries, and follow-up care in
the COO
Preparing for return: Designing realistic programmes, informing workers about earned end-of-contract benefits and savings and investment opportunities at home, and orderly return of irregular workers
Design realistic return programmes Avoiding returns considered unsuccessful
Worker needs vary. Most workers want to return,
but some may not be ready to return if they failed
to achieve goals abroad
Identify and validate necessary elements
of return preparation programmes by
developing appropriate information on
worker needs
Baseline data should help identify distinct
groups, including savings, goals after return,
and needs. This information can improve
pre-return and re-integration programmes
Financial literacy Help contract workers abroad to better
understand the options for investing their savings
in COOs
Many CODs require employers to pay end-of-
service bonuses and allow withdrawal of social
security contributions; some workers do not
receive bonuses or contributions
CODs and COOs can develop financial
guides in conjunction with financial
institutions, NGOs, and other organizations
Educate workers about bonuses and
contribution refunds in the standard contract
and in preparation for return
Not all contract workers have saved enough
to justify extensive financial counselling;
include options for workers at home with
low levels of savings
COO rules on imports Many contract workers are unaware of COO
customs rules and duties, as well as privileges/
exemptions
COOs produce and distribute guides to
customs rules for returning workers
COOs offer incentives for productive use
of savings; more transparent customs rules
reduce corruption
Irregular workers Irregular workers may not be able to leave for
COOs without paying fines
COD and COO cooperate to ensure
orderly repatriation of irregular workers in
conformance with national legislation
COOs and CODs could agree on protocols
to return irregular workers
Facilitating re-integration: Finding employment, using skills acquired abroad, helping with housing, and promoting linkages.
139

Guide on measuring migration policy impacts in ASEAN
Item Problem/issue Action Note
Strengthen enforcement of labour and
other laws
COD may find it hard to detect violations of
wage and other labour laws that protect contract
workers if they rely on worker complaints
CODs can ensure that contract workers
receive the wages due them with wage
protection systems and mandatory insurance
schemes, and monitor these schemes to
ensure compliance
Many workers are employed in dangerous
occupations, including construction,
highlighting the need for education to
minimize occupational risks, effective
treatment for injuries, and follow-up care in
the COO
Preparing for return: Designing realistic programmes, informing workers about earned end-of-contract benefits and savings and investment opportunities at home, and orderly return of irregular workers
Design realistic return programmes Avoiding returns considered unsuccessful
Worker needs vary. Most workers want to return,
but some may not be ready to return if they failed
to achieve goals abroad
Identify and validate necessary elements
of return preparation programmes by
developing appropriate information on
worker needs
Baseline data should help identify distinct
groups, including savings, goals after return,
and needs. This information can improve
pre-return and re-integration programmes
Financial literacy Help contract workers abroad to better
understand the options for investing their savings
in COOs
Many CODs require employers to pay end-of-
service bonuses and allow withdrawal of social
security contributions; some workers do not
receive bonuses or contributions
CODs and COOs can develop financial
guides in conjunction with financial
institutions, NGOs, and other organizations
Educate workers about bonuses and
contribution refunds in the standard contract
and in preparation for return
Not all contract workers have saved enough
to justify extensive financial counselling;
include options for workers at home with
low levels of savings
COO rules on imports Many contract workers are unaware of COO
customs rules and duties, as well as privileges/
exemptions
COOs produce and distribute guides to
customs rules for returning workers
COOs offer incentives for productive use
of savings; more transparent customs rules
reduce corruption
Irregular workers Irregular workers may not be able to leave for
COOs without paying fines
COD and COO cooperate to ensure
orderly repatriation of irregular workers in
conformance with national legislation
COOs and CODs could agree on protocols
to return irregular workers
Facilitating re-integration: Finding employment, using skills acquired abroad, helping with housing, and promoting linkages.
140

Guide on measuring migration policy impacts in ASEAN
Item Problem/issue Action Note
COO programmes for reintegration of
returning workers
Workers may return with savings, but see them
disappear quickly if they cannot find gainful
employment
COOs could develop special programmes
to help returnees find jobs, including
self-employment that takes advantage
of subsidized lending programmes and
technical assistance
Government and private banks could offer
safe vehicles to invest foreign-earned
savings that protect savers from inflation and
exchange rate risks
Many returned workers invest their savings
in over-crowded business ventures (e.g.,
small stores) and end up losing their hard-
earned capital.
Returned workers should be encouraged to
seek assistance to identify viable projects,
perhaps by having access to businesses
being sold by retirees or workers going
abroad.
Productive use of skills acquired abroad Develop credentials recognition systems so that
local industries know about the skills acquired by
workers who have been abroad.
Perhaps begin with letters from foreign employer
attesting to worker skills and experience.
COOs may need to develop systems for
recognizing and certifying the skills of
returning workers
COO training centres and industry
associations should be invited to help
develop skills-recognition programme. Use
some returned workers in centres that train
workers to go abroad
Capital for new or improved housing New or improved housing is often the top priority
of returned contract workers
Most COOs have Welfare Funds to which
departing workers contribute. Explore
making loans from these Funds to help
returned workers build new or improve
housing or generate income in the COO
Singapore’s Provident Fund helps workers
with relatively few savings to obtain low-cost
housing.
Special arrival facilities Returning workers, especially women, often need
assistance and protection
COOs to provide a variety of services to
arriving workers including information,
telephone services, safe lodging, safe local
transport, etc.
On return, workers often encounter
problems with hustlers and overcharged for
transport
Promote re-integration of workers with
their families and in communities
Returning workers may have trouble re-adapting
to their families and communities
Provide services to help workers re-integrate
with their families and in their communities
by recognizing common problems and
strategies to cope with them
Some workers and their families may need
access to counselling and other mental-
health related services
Consider re-deployment abroad Many returned workers seek to go abroad again
as contract workers
COOs could motivate returnees to register
with public employment offices and make
referrals to local employers.
Withdrawal of skilled workers from the
labour force while seeking new jobs abroad
wastes resources
141

Guide on measuring migration policy impacts in ASEAN
Item Problem/issue Action Note
COO programmes for reintegration of
returning workers
Workers may return with savings, but see them
disappear quickly if they cannot find gainful
employment
COOs could develop special programmes
to help returnees find jobs, including
self-employment that takes advantage
of subsidized lending programmes and
technical assistance
Government and private banks could offer
safe vehicles to invest foreign-earned
savings that protect savers from inflation and
exchange rate risks
Many returned workers invest their savings
in over-crowded business ventures (e.g.,
small stores) and end up losing their hard-
earned capital.
Returned workers should be encouraged to
seek assistance to identify viable projects,
perhaps by having access to businesses
being sold by retirees or workers going
abroad.
Productive use of skills acquired abroad Develop credentials recognition systems so that
local industries know about the skills acquired by
workers who have been abroad.
Perhaps begin with letters from foreign employer
attesting to worker skills and experience.
COOs may need to develop systems for
recognizing and certifying the skills of
returning workers
COO training centres and industry
associations should be invited to help
develop skills-recognition programme. Use
some returned workers in centres that train
workers to go abroad
Capital for new or improved housing New or improved housing is often the top priority
of returned contract workers
Most COOs have Welfare Funds to which
departing workers contribute. Explore
making loans from these Funds to help
returned workers build new or improve
housing or generate income in the COO
Singapore’s Provident Fund helps workers
with relatively few savings to obtain low-cost
housing.
Special arrival facilities Returning workers, especially women, often need
assistance and protection
COOs to provide a variety of services to
arriving workers including information,
telephone services, safe lodging, safe local
transport, etc.
On return, workers often encounter
problems with hustlers and overcharged for
transport
Promote re-integration of workers with
their families and in communities
Returning workers may have trouble re-adapting
to their families and communities
Provide services to help workers re-integrate
with their families and in their communities
by recognizing common problems and
strategies to cope with them
Some workers and their families may need
access to counselling and other mental-
health related services
Consider re-deployment abroad Many returned workers seek to go abroad again
as contract workers
COOs could motivate returnees to register
with public employment offices and make
referrals to local employers.
Withdrawal of skilled workers from the
labour force while seeking new jobs abroad
wastes resources
142

Guide on measuring migration policy impacts in ASEAN
Appendix II Economics of recruitment
The economics of recruitment covers the incentives and behavior of employers and workers
and the business of job matching. There is an extensive economics literature on how employers
find the best workers to fill vacant jobs and how workers find the best jobs given their abilities
and preferences, but there are few studies of exactly how recruitment businesses are organized
and operated and their profitability.
Job-search literature is rife with theories of employer screening mechanisms to attract and sort
through applicants and worker-signaling mechanisms to let employers know of their abilities.
For example, some employers hire only graduates of certain universities, relying on the school
to screen potential employees and hiring only graduates of certain programmes from that
school. Similarly, there is a literature that concludes that, even when a graduate did not learn
anything relevant to the job in university, the fact that the graduate completed a course of
study signal’s the graduate’s abilities to complete the tasks desired by the employer.
By contrast, there are few studies of recruitment businesses. There are profiles of labour market
intermediaries such as “headhunter” firms that recruit the CEOs of private and nonprofit firms.
One argument is that people involved in hiring and seeking CEO jobs often know who is
available and which high-level jobs are vacant or soon will be, but for many reasons they prefer
to interact via executive search firms rather than approach each other directly. Headhunter
firms can interview both parties and get information from each that the parties may have
difficulty conveying directly to one another. If the search firm is interviewing a large number of
candidates for many firms, it can achieve economies of scale and spread the cost of learning
about jobs and candidates over more job matches (Khurana, 2002).
There is literature on how employers recruit low-skilled workers, but little involving recruiting
firms. For example, one prominent finding of US hiring literature is that low-skilled workers
rarely reject job offers; over 90 per cent of employer job offers made by US firms in one
sample were accepted (Oyer and Schaefer, 2010, p. 42). On the other hand, some employers
reject all of the candidates for a job and leave the job vacant (Oyer and Schaefer, 2010, p. 47).
Job-matching is a people-to-people business, and recruiters are businesses that seek to
maximize profits by providing the service of matching workers with jobs. Most recruiting
companies are small and private, so there is little publicly available data on their revenues,
costs, and profits. There are few barriers to entry, although some governments require new
entrants seeking a recruiting license to develop a “new foreign market” by soliciting employer
job orders.
Once licensed, the main asset of recruiters is their ability to secure employer job vacancies and
143

Guide on measuring migration policy impacts in ASEAN 144
find workers available to fill them. Recruiters usually have to travel abroad to meet with foreign
employers and receive job orders. In the Gulf States the practice of “buying” job offers from
employers or “sponsors” seems widespread. Recruiters generally seek to have as many job
applicants as possible, including using subagents to find workers in far-flung areas, and most
would maintain lists of workers who have been screened and are ready to depart. It requires
little capital to engage in the business of recruitment, hence most recruiters are relatively small.
Personal contacts are important assets in the business, not only with employers abroad but
also with government officials who can facilitate the processing and approval of job contracts.
Multinational employment agencies such as Adecco and Manpower do not move low-skilled
migrants over borders except in free-movement areas, and there are no franchises of recruiters
to suggest standardized models of how the recruiting business operates.
Government agencies deal with recruiters (1) when they obtain or renew their licenses; (2)
when recruiters seek approval of contracts for workers they are sending abroad; and (3) when
they deal with charges that recruitment regulations were violated. Government agencies use
these data primarily to identify the size structure of recruiters and perhaps provide awards to
particular recruiters who send workers abroad without complaints.
The challenge of understanding the economics of recruiters is similar to that of understanding
the economics of farmers. In both cases, most are small and privately held concerns. However,
in the case of farmers, universities and others operate model farms and publish average
revenues and costs of producing particular crops that serve as guides for farmers, bankers,
and others, all of whom know that yields and prices can vary. Farmers may vary in the efficiency
with which they combine inputs to produce farm outputs, and their costs may vary depending
on the extent of land debts or rents.
Governments may want take a similar approach to improving their understanding of the
several thousand recruiters who send low-skilled workers abroad. Focus groups and surveys of
recruiters can generate data on typical start-up and operating costs that can generate estimates
of average and marginal placement costs. As with agriculture, the goal is to understand the
economics of diverse businesses that face common external and internal market prices to
better understand how these market conditions affect recruiter compliance with labour laws.
An example may be illustrative. Farm labour contracting involves supplying crews of workers
to farmers to perform specific tasks, such as hoeing the weeds in a field. In most cases, workers
are paid the minimum wage, and the farm labour contractor (FLC) receives an overhead to
cover the cost of recruiting and hiring workers, payroll taxes on wages, providing toilets and
shade facilities, and profits. Payroll taxes alone add 25 per cent to worker wages, so laws say
that the farm employer is jointly liable for wage and other labour law violations unless the FLCs
and farmer have a written contract that includes an overhead sufficient to cover “normal” FLC

Guide on measuring migration policy impacts in ASEAN
costs. The analogy to international labour recruiting would be to require written contracts
between employers and local recruiters in migrant receiving countries, recruiters in migrant
sending countries, or between recruiters, and to make both parties liable in the event of
violations. The Philippines uses this joint liability model between Filipino recruiters and foreign
employers.
145
Ando International garment factory (Better Work Vietnam). © ILO/A. Santos

Guide on measuring migration policy impacts in ASEAN 146
Appendix III - Measuring recruitment or migration costs: Migrant survey questionnaire
This questionnaire was drafted for the Thematic Working Group on Low-Skilled Labour
Migration, The Global Knowledge Partnership on Migration and Development (KNOMAD).
This questionnaire is a Document of the World Bank.
Introduction
The KNOMAD’s Migration Cost Survey measures the financial costs incurred by low-skilled
migrants, collecting data from migrant workers who are legally employed in destination
countries with standardized survey instruments and a uniform sampling methodology. The
goal is to compare worker-paid costs across migration corridors.
The project has two goals: First, develop a bilateral migration cost matrix that includes
baseline cost data and allows identification of a global target for worker-paid costs, such as
one-month’s wages abroad. Second, explore the feasibility of policies to reduce worker-paid
migration costs.
The Global Knowledge Partnership on Migration and Development (KNOMAD) is envisaged to be a global hub of knowledge and policy expertise on migration and development issues. It draws on experts from all parts of the world to synthesize existing knowledge and generate new knowledge for use by policy makers in sending and receiving countries. It works in close coordination with the Global Forum on Migration and Development (GFMD) and the Global Migration Group (GMG). The Swiss Agency for Development and Cooperation (SDC) and the Federal Ministry of Economic Cooperation and Development (BMZ) are the largest contributors to the trust fund established by the WB to implement KNOMAD which is located in the Development Prospects Group of the Development Economics Vice-Presidency (DEC). KNOMAD is led by Dilip Ratha.
KNOMAD’s core objectives are:
1. generating and synthesizing knowledge on migration issues for countries;
2. generating a menu of policy choices based on multidisciplinary knowledge and evidence; and
3. providing technical assistance and capacity building to sending and receiving countries for the implementation of pilot projects, evaluation of migration policies, and data collection.
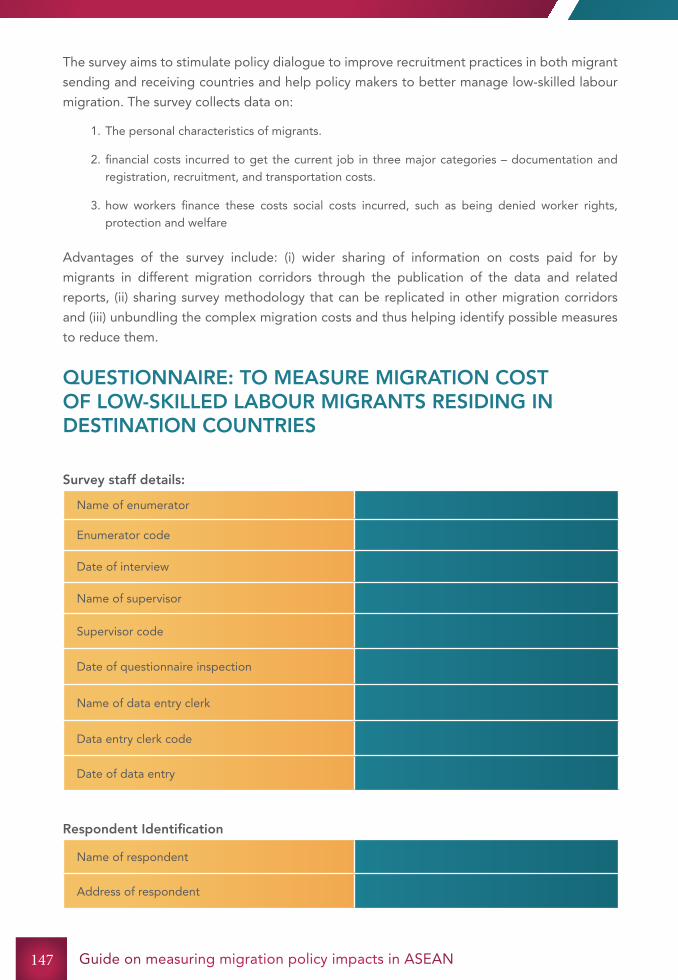
Guide on measuring migration policy impacts in ASEAN
The survey aims to stimulate policy dialogue to improve recruitment practices in both migrant
sending and receiving countries and help policy makers to better manage low-skilled labour
migration. The survey collects data on:
1. The personal characteristics of migrants.
2. financial costs incurred to get the current job in three major categories – documentation and registration, recruitment, and transportation costs.
3. how workers finance these costs social costs incurred, such as being denied worker rights, protection and welfare
Advantages of the survey include: (i) wider sharing of information on costs paid for by
migrants in different migration corridors through the publication of the data and related
reports, (ii) sharing survey methodology that can be replicated in other migration corridors
and (iii) unbundling the complex migration costs and thus helping identify possible measures
to reduce them.
QUESTIONNAIRE: TO MEASURE MIGRATION COST OF LOW-SKILLED LABOUR MIGRANTS RESIDING IN DESTINATION COUNTRIES
Survey staff details:
Name of enumerator
Enumerator code
Date of interview
Name of supervisor
Supervisor code
Date of questionnaire inspection
Name of data entry clerk
Data entry clerk code
Date of data entry
Respondent Identification
Name of respondent
Address of respondent
147

Guide on measuring migration policy impacts in ASEAN 148
Part A. Respondent information
Respondent information
1 Where were you born? Name of country to be coded later
2 Are you a citizen of [COUNTRY NAME
FROM QUESTION 1]?
1 = Yes >> Q4
2 = No
3 What country are you a citizen of? Write name of country, to be coded
later
4 Sex 1 = Male
2 = Female
5 How old are you? Age in years
6 What is your marital status? 1 = Never married
2 = Married monogamous
3 = Married polygamous
4 = Common law, union coutumiere, union libre, living together
5 = Divorced/Separated
6 = Widowed
7 What is the highest level of education
you have completed?
1 = None
2 = Primary incomplete
3 = Primary complete
4 = Secondary incomplete
5 = Secondary complete
6 = Post-secondary technical complete
7 = University and higher
8 = Adult education or literacy program
9 = Not stated
99 = Other
8 How many people do you support
financially here in [CURRENT COUNTRY]
and back in your home country with
remittances?

Guide on measuring migration policy impacts in ASEAN
Respondent information
9 Is this the first time you have worked
outside of your country?
1 = Yes >> Q12
2 = No
10 How many times have you worked in a
country other than your home country?
1___number of times, or
2___number of years
11 When did you first work outside of your
country, even if it was not here?
Year
12 Where did you live right before coming
here?
Name of country to be coded later
13 Did you have a job in [COUNTRY IN
PREVIOUS QUESTION]?
1 = Yes
2 = No >> Q15
14 What was your main job when you were
living in [NAME OF COUNTRY FROM
QUESTION 12] before you came here?
1 = Managers
2 = Professionals
3 = Technicians & Associate Professionals
4 = Clerical support workers
5 = Service & Sales workers
6 = Skilled agricultural, forestry & forestry workers
7 = Craft and related trade workers
8 = Plant & machinery operators & assemblers
9 = Elementary occupations (please specify_____________________
10 = Armed forces occupations
99 = Other/unspecified/missing
15 How did you find out about getting a
job here?
1 = Relative/friend
2 = Newspaper advertisement
3 = Recruiter
4 = Other
16 Is this the first time you have come to
[COUNTRY] to work?
1 = Yes
2 = No
17 When did you arrive here for your most
recent work experience? If migrant has
already returned home, when did you go
to work in [COUNTRY]?
Month and year
149

Guide on measuring migration policy impacts in ASEAN 150
Respondent information
18 How long do you expect to remain in
[COUNTRY]?
If migrant has already returned home,
how long did you expect to stay in
[COUNTRY]?
Months
Part B. Information on costs for current job
Information on costs for current job
1 Did you obtain information about the job or
apply for it with a local agent?
1 = Yes
2 = No >> Q3
2 How much did it cost you to obtain information
about the job or apply for it with a local agent?
Amount Currency
3 Did you learn [COUNTRY’S] language before
coming?
1 = Yes
2 = No >> Q5
4 How much did it cost you to learn [COUNTRY’S]
language?
Amount Currency
5 Did you undergo training to qualify for the job
you are doing in [COUNTRY]?
1 = Yes
2 = No >> Q7
6 How much did it cost you to undergo training to
learn those skills?
Amount Currency
7 Did you obtain a passport in order to come to
[COUNRTY] for this job?
1 = Yes
2 = No >> Q9
8 How much did it cost you to obtain passport? Amount Currency
9 Did you take any medical exams in order to
come to [COUNTRY] for this job?
1 = Yes
2 = No >> Q12
10 How much did it cost you to take the medical
exams?
Amount Currency
11 Did you take any skills tests in order to come to
[COUNTRY] for this job?
1 = Yes
2 = No >> Q13

Guide on measuring migration policy impacts in ASEAN
Information on costs for current job
12 How much did it cost you to take these skills
tests?
Amount Currency
13 Did you obtain a police/security clearance in
order to come to [COUNTRY] for this job?
1 = Yes
2 = No >> Q15
14 How much did it cost you to obtain this police/
security clearance?
Amount Currency
15 Was your contract approved by a national
authority before you left your country?
1 = Yes
2 = No >> Q17
16 How much did it cost to obtain this contract /
exit approval?
Amount Currency
17 Did you have to undergo a required pre-
departure briefing in order to come to
[COUNTRY] for this job?
1 = Yes
2 = No >> Q19
18 How much did it cost for this pre-departure
briefing?
Amount Currency
19 Did you obtain any health/life insurance in order
to come to [COUNTRY] for this job?
1 = Yes
2 = No >> Q21
20 How much did this health/life insurance cost? Amount Currency
21 Did your Government require you to be a
member of a state-run Welfare Fund in order to
come to [COUNTRY] for this job?
1 = Yes
2 = No >> Q23
22 How much did it cost to obtain this welfare fund
membership?
Amount Currency
23 Did you obtain a visa in order to come to
[COUNTRY] for this job?
1 = Yes
2 = No >> Q26
24 How much did it cost to obtain the visa to work
in [COUNTRY]?
Amount Currency
25 Did you make any other payments, formal and
informal, for this job?
1 = Yes
2 = No >> Q27
151

Guide on measuring migration policy impacts in ASEAN
Information on costs for current job
26 How much were these other payments? Amount Currency
27 Before departure, did you incur expenses for
inland transportation and accommodation in
country where you were living?
1 = Yes
2 = No >> Q30
28 How much did you pay for inland transportation
and accommodation?
Amount Currency
29 Did you pay for international transportation to
come to this country for this job?
1 = Yes
2 = No. if no, who paid? >>
Q32
30 How much did you, including all taxes (e.g.
departure tax)?
Amount Currency
31 Were you told that the employer would
reimburse your expenses?
1 = Yes
2 = No >> Q34
32 Who told you about such reimbursement? 1 = Agent
2 = Employer
3 = Others
33 Which payments were you told would be
reimbursed?
Circle the payments (previous
questions)
34 Have you been reimbursed for any of these
payments?
1 = Yes
2 = No
35 Did you make any other payments for this job? 1 = Yes
2 = No >> Q37
36 How much were these other payments? Amount Currency
37 Did you obtain this job through relatives or
friends?
1 = Yes
2 = No >>39
38 How much did you pay your relative or friend for
helping you get this job?
Amount Currency
39 Did you make other payments, formal or
informal, that I have not covered in my earlier
questions?
1 = Yes
2 = No >> Q40
152

Guide on measuring migration policy impacts in ASEAN
Information on costs for current job
40 What were these other payments for? 1 = Taxes/levies in origin country
2 = Taxes/levies in host country
3 = Informal fees (.i.e. bribes)
4 = Don’t know
41 In total, how much have you and your family
spent for your present job?
Amount Currency
42 Were you successful in finding jobs abroad in the
past?
1 = Yes
2 = No >>43
43 How much in total did you spend in your earlier
efforts to work abroad?
Amount Currency
44 How much in total did you spend even when you
did not get a foreign job?
Amount Currency
Part C. Borrowing money for the foreign job
Interviewer – check Part B to see if any money was spent on the job search. If money was spent, ask Part C. If not go to Part D.
Borrowing money for the foreign job
1 Did you or someone from your family
borrow any of the money that you spent in
order to get this job?
1 = Yes
2 = No >> Next section
2 How much? Amount Currency
3 Who was the money borrowed from? 1 = Member of household
2 = Other Relative/friend
3 = Money lender
4 = Bank
5 = Community group
6 = Government agency
7 = Credit union
153

Guide on measuring migration policy impacts in ASEAN
Borrowing money for the foreign job
3 8 = Cooperative
9 = Pawnshop
10 = Landlord
11 = Other (specify)
4 Was any asset put up as collateral in order
to get the loan?
1 = Yes
2 = No >> Q6
5 What collateral was given? 1 = Real estate
2 = Farm
3 = Equipment
4 = Car or vehicle
5 = Co-signer
6 = Other (specify)
6 What interest rate is being paid? Rate Unit
1 = Day
2 = Week
3 = Month
4 = Year
7 How is the loan being repaid? 1 = From money you send to your family
2 = From deductions from your salary
3 = From other sources of income (specify)
8 How much has been paid to the person/
institution that loaned the money?
Amount Currency
9 How much is left to be paid to the person/
institution that loaned the money?
Amount Currency
10 Did you lose any or all of the collateral due
to failure to repay the loan?
1 = Yes
2 = No
154

Guide on measuring migration policy impacts in ASEAN
Part D. Work in foreign country
Work in foreign country
1 Did your current employer
arrange for your work visa?
1 = Yes
2 = No
2 Did you get a contract before
departing for this job?
1 = Yes
2 = No
3 Are you working under the
same contract you received
before departure?
1 = Yes
2 = No
4 What kind of work do you do
here? If migrant has returned
home, what kind of work did
you do in [COUNTRY]?
Write down a description of the work. Include
sufficient detail to be able to code it using the
occupation code ISCO 08. Write down the code
after the interview is completed.
5 What products are made or
what services are provided by
your employer?
Write down a description of the work. Include
sufficient detail to be able to code it using the
industry ISIC codes. Write down the code after
the interview is completed.
6 Were you working, even
if you received no pay,
prior to coming to work in
[COUNTRY]?
1 = Yes
2 = No >>10
7 At that time did you work for
yourself or for an employer,
even if not paid?
1 = Worked for an employer
2 = Was self-employed
8 What products were made or
what services were provided
by your employer in your
country of origin?
Write down a description of the work. Include
sufficient detail to be able to code it using
the ISIC codes. Write down the code after the
interview is completed.
9 How much did you earn as
a [OCCUPATION FROM Q
A.14] in the country where
you lived prior to working in
[COUNTRY]?
Amount Currency Unit
1 = Day
2 = Week
3 = Month
4 = Year
155

Guide on measuring migration policy impacts in ASEAN
Work in foreign country
10 How much is the wage that
you agreed on for your job in
[COUNTRY]?
Amount Currency Unit
1 = Day
2 = Week
3= Month
4 = Year
11 What wage were you promised
before departure?
Amount Currency Unit
1 = Day
2 = Week
3= Month
4 = Year
12 How much do you actually
earn on average?
Amount Currency Unit
1 = Day
2 = Week
3= Month
4 = Year
13 Are you paid regularly? 1 = Yes
2 = No
14 How much is deducted from
your wages?
Amount Currency Unit
1 = Day
2 = Week
3= Month
4 = Year
15 Do you know what these
deductions are for?
1 = Yes
2 = No
16 In the year you have worked in
[COUNTRY] how much money,
on average, were you able to
send home to your family?
Amount Currency Unit
1 = month
2 = year
3 = _____
(please
specify)
17 Have you changed employers
since you arrived in
[COUNTRY]?
1 = Yes
2 = No
18 Does your employer supply
migrant workers to other
employers?
1 = Yes
2 = No
156

Guide on measuring migration policy impacts in ASEAN
Part E. Job environment
Job environment
1 Did your employer pay any of the
costs that you had to pay in order
to go to [COUNTRY]?
1 = Yes
2 = No >> Q5
2 Do you have to pay back these
costs through deductions from
your earnings?
1 = Yes
2 = No >> Q5
3 How much is (or was) deducted
from your earnings each month?
Amount Currency
4 For how many months do you have
to make these payments?
Months ( in total )
5 Does your employer provide you
with housing?
1 = Yes
2 = No >>7
6 Is the cost of housing deducted
from your wages?
1 = Yes
2 = No
7 How long did it take you to find
this job in your home country?
months
8 Did your search for this job affect
your ability to work your previous
job in your country?
1 = Yes
2 = No
3 = Did not have work prior to this job
9 Do you hold a skill certificate
issued by vocational testing
center?
1 = Yes
2 = No >> Q11
10 What skill certificate do you have?
11 Do you make use of your skill in
your current job?
1 = Yes
2 = No
12 Do you believe you could have
found a job here which would use
your skill?
1 = Yes
2 = No
13 If you had a job here that used
your skills, how much more do
you think you can earn? (Specify
whether per week or per month)?
Amount Currency Unit
1 = Day
2 = Week
3= Month
4 = Year
14 Is there a union in your workplace? 1 = Yes
2 = No
157

Guide on measuring migration policy impacts in ASEAN
Job environment
15 If yes, are you allowed to join the
union?
1 = Yes
2 = No
16 Have you joined the union? 1 = Yes
2 = No
17 Have you been deprived of any
rights?
1 = Yes
2 = No >>19
18 Which rights? 1 = Unable to express views freely
2 = Unable to join or organize a trade union
3 = Unable to engage in industrial action such as going on strike
4 = Unable to change employers
5 = Not entitled to the same wages as native workers
6 = Restricted from transferring repatriating earnings
7 = No job security
8 = Excluded from social security
9 = Cannot practice own religion
19 How many hours a week do you
usually work?
Hours per week
20 Do you receive at least one rest
day a week?
1 = Yes
2 = No
21 Have you been injured while at
work or fallen sick at your current
job?
1 = Yes
2 = No >> Q24
22 What was the cause of injury or
illness?
Please specify
23 Were you paid for the days when
you were not able to work because
of injury or illness?
1 = Yes
2 = No
24 Did you enter the country with
work visa?
1 = Yes >> Finish interview
2 = No
25 What is your current status? 1 = On short term work visa
2 = On tourist visa
3 = Other (specify)
158

Guide on measuring migration policy impacts in ASEAN
ISIC Rev. 3.1. Code
Sampling sectors to be included in the survey are Agriculture, Construction, and Activities of private
households.
A - Agriculture, hunting and forestry
01 - Agriculture, hunting and related service activities
02 - Forestry, logging and related service activities
B - Fishing
05 - Fishing, aquaculture and service activities incidental to fishing
C - Mining and quarrying
10 - Mining of coal and lignite; extraction of peat
11 - Extraction of crude petroleum and natural gas; service activities incidental to oil and gas extraction, excluding surveying
12 - Mining of uranium and thorium ores
13 - Mining of metal ores
14 - Other mining and quarrying
D - Manufacturing
15 - Manufacture of food products and beverages
16 - Manufacture of tobacco products
17 - Manufacture of textiles
18 - Manufacture of wearing apparel; dressing and dyeing of fur
19 - Tanning and dressing of leather; manufacture of luggage, handbags, saddlery, harness and footwear
20 - Manufacture of wood and of products of wood and cork, except furniture; manufacture of articles of straw and plaiting materials
21 - Manufacture of paper and paper products
22 - Publishing, printing and reproduction of recorded media
23 - Manufacture of coke, refined petroleum products and nuclear fuel
24 - Manufacture of chemicals and chemical products
159

Guide on measuring migration policy impacts in ASEAN
25 - Manufacture of rubber and plastics products
26 - Manufacture of other non-metallic mineral products
27 - Manufacture of basic metals
28 - Manufacture of fabricated metal products, except machinery and equipment
29 - Manufacture of machinery and equipment n.e.c.
30 - Manufacture of office, accounting and computing machinery
31 - Manufacture of electrical machinery and apparatus n.e.c.
32 - Manufacture of radio, television and communication equipment and apparatus
33 - Manufacture of medical, precision and optical instruments, watches and clocks
34 - Manufacture of motor vehicles, trailers and semi-trailers
35 - Manufacture of other transport equipment
36 - Manufacture of furniture; manufacturing n.e.c.
37 - Recycling
E - Electricity, gas and water supply
40 - Electricity, gas, steam and hot water supply
41 - Collection, purification and distribution of water
F - Construction
45 - Construction
G - Wholesale and retail trade; repair of motor vehicles, motorcycles and personal and household goods
50 - Sale, maintenance and repair of motor vehicles and motorcycles; retail sale of automotive fuel
51 - Wholesale trade and commission trade, except of motor vehicles and motorcycles
52 - Retail trade, except of motor vehicles and motorcycles; repair of personal and household goods
H - Hotels and restaurants
55 - Hotels and restaurants
I - Transport, storage and communications
60 - Land transport; transport via pipelines
160

Guide on measuring migration policy impacts in ASEAN
61 - Water transport
62 - Air transport
63 - Supporting and auxiliary transport activities; activities of travel agencies
64 - Post and telecommunications
J - Financial intermediation
65 - Financial intermediation, except insurance and pension funding
66 - Insurance and pension funding, except compulsory social security
67 - Activities auxiliary to financial intermediation
K - Real estate, renting and business activities
70 - Real estate activities
71 - Renting of machinery and equipment without operator and of personal and household goods
72 - Computer and related activities
73 - Research and development
74 - Other business activities
L - Public administration and defence; compulsory social security
75 - Public administration and defence; compulsory social security
M - Education
80 - Education
N - Health and social work
85 - Health and social work
O - Other community, social and personal service activities
90 - Sewage and refuse disposal, sanitation and similar activities
91 - Activities of membership organizations n.e.c.
92 - Recreational, cultural and sporting activities
93 - Other service activities
P - Activities of private households as employers and undifferentiated production activities of private households
95 - Activities of private households as employers of domestic staff
161

Guide on measuring migration policy impacts in ASEAN
96 - Undifferentiated goods-producing activities of private households for own use
97 - Undifferentiated service-producing activities of private households for own use
Q - Extraterritorial organizations and bodies
99 - Extraterritorial organizations and bodies
For further details, please see, http://unstats.un.org/unsd/cr/registry/regcst.asp?Cl=17
162

Guide on measuring migration policy impacts in ASEAN 162
Annex IV: Summary of discussion, Regional Meeting to Validate the Guide on Measuring Migration Policy Impacts in ASEAN Member States
The ILO ASEAN TRIANGLE Project organized the Regional Meeting to Validate the Guide on
Measuring Migration Policy Impacts in ASEAN Member States, in Bangkok, Thailand on 10-11
November 2015. The meeting brought together representatives from the ASEAN Member
States, Employers’ Organization, Workers’ Organization, resource persons from Singapore,
Malaysia, Korea and an observer from the ASEAN Secretariat. Technical sessions and
discussions during the meeting focused on indicators of labour market “shortages; indicators
used in ASEAN countries for determining admissions of foreign worker; monitoring wages
and working conditions; indicators of recruitment conditions, measures to reduce migration
costs and indicators of overall socio-economic impact (See Annex I and II for the agenda and
participant list)
In 2014, the ILO ASEAN TRIANGLE Project (ATP) developed a Guide to Measure Labour
Migration Policy Impacts in ASEAN Member States. The purpose of the Guide is to assist
national authorities in ASEAN countries responsible for managing labour migration to develop
evidence-based indicators of the impacts of their policies and programmes. The regional
meeting was convened to discuss and validate the proposed Guide and to solicit stakeholder
inputs to implement the Guide. The team expected to receive suggestions from the tripartite
participants to improve the Guide and to enhance staff capacity at national levels for collecting
and analysing impact indicators through training, sharing of information, and research.
Opening Remarks:In his Opening Remarks H.E. Philip Calvert, Canadian Ambassador to Thailand noted the
work of the ILO ATP to support emerging interests of ASEAN Member States, particularly in
cross-cutting issues related to labour migration. The ambassador maintained that governance
in labour migration, development of tools that aim to deliver equitable labour migration
practices is crucial and the Government of Canada supports these initiatives. The ambassador
acknowledged the extensive process that was carried out to develop the guide on measuring
migration policy impact in ASEAN and hoped that the guide would assist governments,
employers’ and workers’ organizations in ASEAN to better govern labour migration. Mr Nilim
Baruah, ILO Senior Labour Migration Specialist, thanked the Canadian Government for its
support to the ASEAN project The protection of migrant workers is imbedded in the ILO’s
Constitution and he cited how ,this is currently expressed in the ILO Multilateral Framework
2005 (which adopted a rights based approach) and in the ILO DG report in 2014 on constructing
a fair migration agenda. He highlighted the work and achievements of ATP in improving labour
163

Guide on measuring migration policy impacts in ASEAN
migration policy for the protection of migrants, particularly the ILMS database, scoping study
on mutual recognition of skills, technical and financial support for research and development
work and ATP’s support for the AFML. Mr Baruah stressed that the guide to assess the impact
of migration policy is the first systematic initiative to develop indicators and measures to
assess the impact of migration policy in ASEAN. After the opening remarks from the Canadian
ambassador and ILO’s senior migration specialist, the meeting proceeded with an overall
introduction to the guide by Mr Manolo Abella, co-author of the Guide with Prof. P. Martin.
He explained why it is so important to assess if policies make any difference to outcomes,
why evidence is important in deciding if one instrument works more efficiently than another
to achieve the same goals, and to know how much of one goal may have to be given up if
one pursues another since there are always “trade-offs” between desirable outcomes. Policy
choices also need to take into account the “unintended consequences” such as when the
admission of foreign workers cause real wages of workers, particularly of the low-skill, to
decline or when it leads to path dependence when enterprises are not pressured to upgrade
their production technologies because they feel they can always get cheap labour. He gave
examples drawn from the Guide of typical labour migration policies for destination and origin
countries, their possible outcomes, and how the effects and consequences may be measured.
Session 1: Indicators of labour Market ShortagesThe first session of the validation meeting focused on indicators of labour market shortages.
Dr Philip Martin explained the usual “attestation” and “certification” procedures followed by
governments when employers request authorization to hire migrant workers. He highlighted
the policy goals and policy instruments adopted by governments to test local labor markets, the
reasons for labour shortages (when market adjustments through wage increases are avoided).
He referred to the issues raised by hiring migrant workers, such as protecting the interest of
local workers and promoting productivity growth and competitiveness. In efforts to respond
to requests of employers for foreign workers while protecting local workers, governments
often end up using process indicators rather than outcome indictors. Dr. Martin also explained
the Logical framework analysis to evaluate foreign worker admissions (Table 2.3) and the tools
that governments use to manage migration, such as quotas and levies. He cited as an example
UK’s Migration Advisory Committee (MAC), which relies on an independent commission to
assess the validity of labour shortage claims by occupation. Labour shortages are usually
eliminated in market economies when prices and wages adjust to bring supply and demand
into balance. Governments generally do not have detailed labour data to respond to employer
requests for hiring migrant workers. Even when they do, lack of communication between
agencies with labour market data and agencies that decide whether to admit migrant workers
make decision-making very difficult. For this reason, tripartite commissions can help to clarify
overall economic and labour goals and the role of migrants to achieve them.
164

Guide on measuring migration policy impacts in ASEAN
Session 2: General discussion of indicators used in ASEAN countries for determining admission of foreign workersIn the second session, Mr Manuel Imson, Senior Programme Officer of the ILO ASEAN
TRIANGLE Project spoke on the situation of labour migration data collection and sharing in
ASEAN, citing various recommendations for the development of an ASEAN labour migration
database. Starting with a mapping of existing data sources, the ILO developed the International
Labour Migration Statistics (ILMS) database to bring together official government data on
labour migration in ASEAN. The ILMS is the first ASEAN migrant database that is available to
the public for free, and has been recognized as a “good practice” by the Global Migration
Group (GMG). He explained the rigorous processes (meetings, discussions, and surveys)
undertaken to develop the database as well as the access to the database (ILOSTAT, AP-
Migration, and ASEAN Statistics), its achievements and milestones. He ended by noting the
recommendations and way forward for both receiving and sending countries with regards to
improving labour migration data collection and for building common practices and institutions.
The second presentation was by Dr. Yap Mui Teng, Principal Research Fellow at the Lee
Kuan Yew School of Public Policy of the National University of Singapore. She spoke on
Indicators used in Singapore to guide admissions of foreign workers. In Singapore, there are
several tripartite committees actively involved with admissions decisions and recruitment
costs. Dr. Teng noted that the existing policies in Singapore are strongly influenced by the
recommendations of the Economic Strategy Committee (ESC), which has recognized that the
limited size of work force is a major constraint to economic growth of Singapore. However,
the ESC believes that dependence on foreign workers is already too high (one third of the
total labour force), and recommended that the government rely on price mechanisms such
as increasing the foreign worker levy to raise the quality of the foreign workforce. Dr. Teng
maintained that this approach allowed competitive and dynamic business to grow, provided
flexibility to hire workers and contributed to the slowdown in the rate of growth of foreign
workers. However, she also noted that with the increase in infrastructure projects, admissions
of foreign workers in Singapore will likely remain high.
The third presentation was by Professor Dong-Hoon Seol, from the Department of Sociology
of Chonbuk National University, Korea. Professor Seol introduced the Employment Permit
System (EPS) of Korea, which was implemented to protect employment opportunities for
Korean citizens, to fill labour shortage in medium enterprise as well as to prevent infringement
of rights of workers. He talked about the 5 basic principles of the EPS, and provided details on
the number of migrants working and living in Korea in 2014. He also explained the procedures
on Recruitment of the General EPS Foreign Workers, as well as criteria and indicators used
to admit foreign workers (such as quota by country, quota of new entrants and reentrants,
dependency ratio ceiling, eligibility of sending countries, age, health and character of workers,
no violation record under Korea’s Immigration Control Act, registration with the government
of sending countries, EPS-TOPIK Scores, skills test score, labour market tests, and employer’s
preferences ). The Foreign Workforce Policy Committee’s announcement in December 2014
165

Guide on measuring migration policy impacts in ASEAN
focused on four EPS Improvement Measures, including selection, recruitment and allocation
of foreign workers, and sojourn management
Session 3: Monitoring wages and working conditionsIn the first presentation for session 3 Mr Manolo Abella spoke on how monitoring the conditions
of migrant workers pose unique problems and challenges, as many foreign workers are non-
nationals and are subject to different treatment in legislation. Following the Cebu Declaration
the ASEAN member states have committed to protect the rights of migrant workers and their
families using various policy instruments and measures. In countries of origin these include:
bilateral agreements, regulation of recruitment (licensing, bonds, penalties, etc.), setting
minimum standards for job contracts, prohibiting nationals to work in countries where rights
are not protected, banning young women from going abroad for employment, prohibiting
recruitment for certain occupations, pre-departure training, and posting labour attaches to
attend to migrant needs/problems in host countries. In countries of destination they include:
screening employers, regulating recruitment agencies, registration of contracts, effective
inspection system, establishment of migrant support centres and the activities of trade union
in monitoring the conditions of work of migrant worker. Mr Abella drew a distinction between
“process” and “output” or outcome indicators, noting that administrators often only make
use of the former since they are derived from administrative records like complaints received
and resolved. To obtain a more complete picture of how effectively policies are working to
protect migrant workers he advised also measuring outcomes such as how much wages and
benefits they actually earned.
Mr Max Tunon, Coordinator of the ILO GMS TRIANGLE Project, provided an overview of the
project, specifically how it contributes to monitoring and evaluation (M&E) of policies. He
highlighted the importance of a data-driven approach to M&E, especially within the GMS
region, and explained the three different tools that are used in monitoring and evaluation.
The first tool was the qualitative analysis of contribution to policy and legislative change, the
second was the use of Migration Resource Centres to generate data and the third tool was
primary research (baseline and end line surveys). Qualitative analysis of contribution to policy
and legislative change typically involves interviews with constituents and key stakeholders.
The second tool - Migrant worker Resource Centers (MRCs) – has been supported by the GMS
TRIANGLE project in 26 sites across 6 countries. Data collected from project beneficiaries
are useful in measuring and determining the impact of labour laws especially in the case of
irregular migration, and also in quantifying the outcomes of complaint cases registered by
migrant workers. Examples were given of countries in ASEAN where MRCs were used in
monitoring the progress on gender equality through collection, reporting of disaggregated
data on beneficiaries and participants for capacity building workshops, as well as the MRC’s
contribution in encouraging migration through legal channels. The third tool used by the
project was base and end line surveys. Mr Tunon explained how the surveys contributed to
generating data and enhancing capacity of authorities and local leaders to provide practical
support to potential migrants and to strengthen linkages between the actors involved. A
166

Guide on measuring migration policy impacts in ASEAN
survey of migrants from Myanmar showed that improved language skills contributed to better
relations between migrants and employers, and in improving wages and working conditions.
The third speaker, Mr Muktar Panakor from the Department of labour Protection and Welfare,
Thailand described the policies and measures that Thailand uses to provide equal treatment
and protection to all workers, including migrant workers. He talked about the policies of
the Ministry of Labour, particularly with regards to child labour in the fishing industry, and
highlighted the labour inspection done in the fishing industry. He cited examples of rescuing
Thai fishers from Ambon Island in Indonesia and the efforts of the Thai government to prevent
abuses and exploitation through the labour Inspection of ocean-going fishing Vessels. He
also mentioned the partnership with the International Labour Organization to address the
issues surrounding forced labour on fishing boats, as well as with governments and NGOs to
protect both Thai and migrant workers.
Day 2, Nov 11, 2015
Presentation of Group work:All the three groups presented their input on the table of indicators: on admission of foreign
workers and on effectiveness and impact of working condition regulations. Please refer to the
charts that follow this report for the detailed information and recommendation on the table
of indicators (Table 2.3: Logical framework analysis to evaluate foreign worker admissions and
Table 4.2: Indicators of effectiveness and impact of working condition regulations)
Session 4: Indicator of recruitment conditionsIn session 4, Dr Martin and Mr Abella presented the indicators used to assess systems to
recruit migrant workers. Matching workers with jobs is difficult, in part because of asymmetric
information, since employers know more about the job they are offering and workers know
more about their ability to perform the job. Because of these asymmetries screening and
signalling are fundamental behaviour of employers and workers When employers recruit
workers in other countries, they generally pay recruitment costs for high shilled workers
because there are relatively few such workers and the costs of mistakes are high for the
employer. However, when employers recruit low-skilled workers, there are often more workers
than jobs, and workers are willing to pay in order to get to the front of the selection queue.
For example, low-skilled Bangladeshi migrants earning $200 a month or $7,200 over three
years are reported to pay as much as a year’s earnings to get a job in the Gulf. Governments
try to balance various objectives and goals - to maintain efficiency by matching the right
worker to the right job; protect the workers during recruitment & deployment and while
abroad, and at the same time maintain their current markets and open new markets for their
workers. Dr. Martin then explained Table: 3.1 Measures to regulate recruitment and Table
3.6 Process and Impact indicators regulating recruitment. Mr Abella joined the session and
reflected on the available tools and processes available to monitor recruitment and measure
the effect of policies on recruitment. Most monitoring systems include data on licenses issued,
167

Guide on measuring migration policy impacts in ASEAN
cancelled, suspended, and complaints received, but these indicators may not measure the
impact of recruitment policies on what it costs workers to get their jobs. Even countries
of origin that make systematic use of such “process indicators” do not monitor migration
costs. He cited the surveys of migration cost being undertaken by the World Bank and the
ILO. Most origin governments, according to Mr Abella, make it easy for private business
to engage in recruitment and hope that increased competition will reduce the worker-
paid costs. He noted, however, that contrary to the intention of the policy the competition
between recruitment agencies does not benefit the worker, but instead reduces the cost of
recruitment services to the employer. He suggested that mismatches of workers and jobs
should be monitored to help to assess the effectiveness of the policies. Prohibiting outright
any recruitment fees from being charged to workers might be the best policy, since it will be
simpler to enforce compared to current policies which often confuse workers about what fees
are allowable under the law. Similarly, periodic checking of wages in both country of origin
as well as country of destination can help in assessing the effectiveness of wage standards.
Finally, public employment services should be strengthened to provide a real alternative to
private agencies and serve as a means to pressure them to reduce fees.
Session 5: Measures to reduce migration costsThe first presentation by Ms AiLee Lim, consultant at PE Research in Malaysia, was on the
findings of an ILO-commissioned survey on “migrations costs for Vietnamese workers in
Malaysia”. Vietnamese migrants in Malaysia who were working in the manufacturing and
construction sectors and possessed a legal work permit were interviewed for the study.
There are about 2.2 million foreign workers in Malaysia, including 56 thousand Vietnamese.
Recruitment is mostly undertaken by licensed agencies in Vietnam who usually charge
workers a lump sum for organizing the latter’s deployment to Malaysia. The survey showed
that on average a Vietnamese migrant worker spent USD 1,374 to land a job in Malaysia. The
majority of migrant workers underwent medical tests, obtained visa & passport, paid for local
transportation (which is commonly not included in the brokerage fees), borrowed money,
got the contract approval by national authority, obtained exit approvals and police security
clearance. Most workers surveyed did not undergo skill assessment nor pre-departure training
in language or about the host country. The majority of workers borrowed money from Banks
or family members to finance their migration. Most workers did not possess skills relevant to
their jobs but nevertheless received higher wages in Malaysia than what they were promised
The second speaker for the session, Ms Thi Kim Han Le from Vietnam’s Ministry of Labour
Invalids and Social Affairs, spoke on the masures taken by her Government to protect
Vietnamese migrant workers. Around 500,000 migrant workers are currently working outside
Vietnam, most of them deployed by licensed recruitment agencies. In recent years there has
been a gradual increase in the number of outbound migrant workers usually from rural areas,
both male and female, semi/low skilled workers to countries like Japan, Korea, Malaysia, Taiwan
and the Gulf countries, in sectors such as agriculture, construction, fisheries, manufacturing.
Ms Le explained the components of cost of migration for workers, including service charge
168

Guide on measuring migration policy impacts in ASEAN
and commission fees, fees for orientation training course, foreign language training course,
skills training course, airfare, legal fee, visa, passport, medical check-up and contribution to
the Fund for overseas employment support. The two major reasons for high cost of migration
incurred by Vietnamese workers is due to malpractices of licensed recruitment agencies that
rely on sub-agents who do not strictly follow the law and because of lack of information and
awareness of workers. The government has adopted several measures to reduce migration
cost including: strict monitoring of activities of licensed enterprises, application of sanctions
for enterprises charging high fees from migrant workers, signing of non-profit cooperation
agreements with receiving countries, informing outbound migrants on migration cost and
educating them on ways to protect themselves in host country (i.e channels for lodging
complaints, or keeping evidence of salary payment). Ms Le cited a ministerial decree (Decision
71/2009/QD-TTg of 2009 ) which provides support for accommodation and for low interest
loans for the benefit of outbound migrant workers from 62 poor districts.
Speaking at the final session, Ms Evelia Durato, head of the Regional Center for Visayas of
the Philippine Overseas Employment Administration (POEA), first identified the factors that
lead to high migration costs and then described the various measures taken by POEA to
reduce them. On the measures she described the “Continuing Education Programme” for
licensed agencies intended to encourage ethical recruitment and the protection of migrant
workers. Prospective recruitment agencies have to undergo pre-licensing as well as continuing
agency education seminars on the ways of handling worker problems in host countries. The
POEA also conducts pre-employment seminars in colleges, universities, and churches, as
well as during job fairs for prospective migrant workers. Ms Durato also explained how the
POEA monitors and evaluates the credibility of recruitment agencies. To foster fair migration
POEA has various approaches: minimum standards, welfare assistance, conciliation services,
a “reward and incentive” system, a Continuing Agency Education Program, promotion of
quality management and voluntary code of ethical practice; pre-employment, pre-departure,
post arrival orientation programmes, bilateral labour agreements, ratification of international
labour conventions on migration and advocacy of migrants’ rights in regional and multilateral
processes. POEA has embarked on digitalization of some of the processes, such as the Balik
– Manggagawa for issuance of Overseas Employment Certificate (OEC), Mandatory Online
Application System for Special Recruitment Authority and or Letter of Agreement (e –
SUBMISSION / e – PAYMENT) for all licensed land based agencies that are currently enrolled
in the electronic contract submission system (e – Sub). Digitalization has clearly helped the
government better maintain detailed records of recruitment agency performance.
Session 6: Indicators of socio-economic impactsThe two presenters for this session were the Consultants Prof. Philip Martin and Mr Manolo
Abella. Prof. Martin started with a question on the overall impacts of labour migration in
receiving countries. Migrants tend to move to the more prosperous parts of a country, and
benefits are maximized when they are allowed to move freely in the labour market. Migration
can have significant effects on GDP growth by enlarging the labour force and production.
169

Guide on measuring migration policy impacts in ASEAN
Migrants can enter another country- through front door migration (legal immigration), side
door migration (migrants residing temporarily), and back door migration (irregular migration).
He provided examples of countries like Australia and New Zealand to explain front door
system migration; guest workers to explain side door migration on a rotation mode (2-3 years),
and examples form Malaysia and Thailand on backdoor migration where irregular migration is
through entering without a valid visa or overstaying. Citing an example from the US economy,
Dr Martin stated that in 1996, migration was estimated to have added a net contribution of
$ 8 billion to the US economy which was equivalent to 2 weeks of US economic growth at
the time. To understand the socio economic impact of migration, one needs to look at the
share of migrants and locals in a given sector such as agriculture. The economic benefits from
migrants are greater if the migrants enter flexible economies that can adjust to their presence.
Migrants can displace but they can also complement native workers. The fiscal impact of
migrants is more complex, involving a comparison of sales and income taxes paid versus the
costs of services provided to migrants for services such as for health and education.
Mr Abella highlighted the effects of migration on the larger society. He cited as an example
the ILO study on how the migration of workers from Pakistan to the Middle East countries led
to the breakdown of traditional systems of apprenticeship in Pakistan. Migration to the Gulf
States “creamed off” Pakistan’s most skilled electricians, carpenters and masons, robbing the
country of its usual trainers, making it hard to replace those skills. Another example of severe
negative externalities in origin countries is the impact of the exodus of nurses and doctors,
which has led to a worsening of health services, particularly in the remote regions. Destination
countries, on the other hand, benefited. A larger impact of migration is on competitiveness
in trade. The employment of cheap foreign workers may boost one country’s exports at the
expense of another exporter. In a destination country, the skill of the workers it chooses
to admit may have important “distributional effects,” as when bringing in foreign domestic
helpers effectively subsidizes the consumption of the wealthier sections of the host society.
There is a need for more studies on the wider impact of migration on societies of origin.
Mr. Abella cited the case of the Philippines where, contrary to popular assumption, there
is evidence to indicate that children of migrants reached higher levels of education and
generally performed better in school.
Session 7: Group Discussions to formulate recommendations on recruitment conditions, recruitment costs and socio-economic impactsThe participants were divided into three groups and allocated 90 minutes to discuss the
table of indicators (Table 3.4 Process and impact indicators related to regulating recruitment
and Table 3.1 Measures to regulate recruitment). The result of the group work was a set of
recommendations and suggestions from each group, which is provided below.
170

Guide on measuring migration policy impacts in ASEAN
Session 8: Presentation of Group ReportsEach group presented their set of recommendations in the meeting, presented below.
GROUP WORK RECOMMENDATIONS, DAY 1 AND DAY 2
Overall objective IndicatorsInformation Sources and means of
verificationAssumptions Recommendations/Suggestions
Accelerate growth and development by easing constraints to labour supply
Increased overall
productivity of the
economy
National household and enterprise
surveys on employment and
productivity
Group 1:
- The employment of migrant workers may not only accelerate
growth but also lead nationals to lower participation in the
labour force. This is one reason why Hong Kong requires that
employers applying to hire domestic worker must themselves
be employed. Malaysia requires the household to have a
certain income level before being approved for hiring;
- Surveys must be sector based.
Group 2:
- Overall increases in per capita income should be the indicator
of productivity improvements. They indicate how long it will
take countries to move up when they employ foreign workers.
Specific Objectives
Meet specific skill shortages
Preserve jobs by complementing local skills
Reduce cost of providing vital services
Rate vacancies are
filled
Employment by
industry
Wage trends in
specific sectors
As reported to labour ministries,
which operate employment service
offices and also undertake regular
enterprise surveys
Ministries of labour
undertake surveys of
establishments and
have dedicated units for
reporting and analysing
survey results
Group 1:
- Recognize that some migrant workers do not fill skill gaps but
rather undertake 3D work not wanted by nationals
Group 2:
- With regards to meeting skills, most appropriate criteria
should be time taken from application to the date foreign
worker starts work;
- To insure that migrants complement rather than displace local
workers, the criteria for admission should include certified
skills of FWs. AQRF can be a good measurement system;
- To reduce the cost of providing vital services, it is important
that the admission of foreign workers should be aimed at
meeting labour shortages, not to reduce cost.
171

Guide on measuring migration policy impacts in ASEAN
Session 8: Presentation of Group ReportsEach group presented their set of recommendations in the meeting, presented below.
GROUP WORK RECOMMENDATIONS, DAY 1 AND DAY 2
Overall objective IndicatorsInformation Sources and means of
verificationAssumptions Recommendations/Suggestions
Accelerate growth and development by easing constraints to labour supply
Increased overall
productivity of the
economy
National household and enterprise
surveys on employment and
productivity
Group 1:
- The employment of migrant workers may not only accelerate
growth but also lead nationals to lower participation in the
labour force. This is one reason why Hong Kong requires that
employers applying to hire domestic worker must themselves
be employed. Malaysia requires the household to have a
certain income level before being approved for hiring;
- Surveys must be sector based.
Group 2:
- Overall increases in per capita income should be the indicator
of productivity improvements. They indicate how long it will
take countries to move up when they employ foreign workers.
Specific Objectives
Meet specific skill shortages
Preserve jobs by complementing local skills
Reduce cost of providing vital services
Rate vacancies are
filled
Employment by
industry
Wage trends in
specific sectors
As reported to labour ministries,
which operate employment service
offices and also undertake regular
enterprise surveys
Ministries of labour
undertake surveys of
establishments and
have dedicated units for
reporting and analysing
survey results
Group 1:
- Recognize that some migrant workers do not fill skill gaps but
rather undertake 3D work not wanted by nationals
Group 2:
- With regards to meeting skills, most appropriate criteria
should be time taken from application to the date foreign
worker starts work;
- To insure that migrants complement rather than displace local
workers, the criteria for admission should include certified
skills of FWs. AQRF can be a good measurement system;
- To reduce the cost of providing vital services, it is important
that the admission of foreign workers should be aimed at
meeting labour shortages, not to reduce cost.
172

Guide on measuring migration policy impacts in ASEAN
Group 3:
- The objective should specify that workers meet the skills
requirements of employers.
- Change to indicator 1: Rate vacancies are filled by
competent/qualified workers. This change is made to ensure
that the vacancies are being filled by suitably qualified skilled
workers;
- Change to indicator 2: Employment by industry and by
nationality. This change is made to determine employment of
local and foreign workers;
- Additional indicator: Decreasing time taken to select & recruit
migrant workers. This change is made to ensure that migrant
workers are admitted in a timely manner;
- The information source for data should include ministries/
departments beyond the labour ministries. Change to “as
reported by labour ministries, and other relevant parties”.
Expected results
Admissions closely attuned to industry needs
Admissions limited to
identified shortages
No qualified local
workers have applied
for the jobs
Admissions do not
exceed quotas set
Data on work permits issued
Immigration data
Certification by Department of
Labour
Employer attestation
Overall trends in unemployment
Employers found no
qualified applicants for
job vacancies
Job-seekers have access
to vacancy information
Employers actually pay
migrants prevailing
wages in market for the
skill
Group 1:
- Assess number of applications rejected by Ministries and
reasons.
Group 2:
- The system for establishing quotas for admission of foreign
workers should be made transparent such as in Korea.
Jobs of local workers preserved with admission of complementary foreign workers
Unemployment rate
Productivity of
enterprises
Enterprise surveys Enterprise viability
depends on availability
of more workers, not
technology upgrading.
Group 3:
Change indicator 2: Increased productivity of enterprises and
Add source: Labour Force Surveys.
173

Guide on measuring migration policy impacts in ASEAN
Group 3:
- The objective should specify that workers meet the skills
requirements of employers.
- Change to indicator 1: Rate vacancies are filled by
competent/qualified workers. This change is made to ensure
that the vacancies are being filled by suitably qualified skilled
workers;
- Change to indicator 2: Employment by industry and by
nationality. This change is made to determine employment of
local and foreign workers;
- Additional indicator: Decreasing time taken to select & recruit
migrant workers. This change is made to ensure that migrant
workers are admitted in a timely manner;
- The information source for data should include ministries/
departments beyond the labour ministries. Change to “as
reported by labour ministries, and other relevant parties”.
Expected results
Admissions closely attuned to industry needs
Admissions limited to
identified shortages
No qualified local
workers have applied
for the jobs
Admissions do not
exceed quotas set
Data on work permits issued
Immigration data
Certification by Department of
Labour
Employer attestation
Overall trends in unemployment
Employers found no
qualified applicants for
job vacancies
Job-seekers have access
to vacancy information
Employers actually pay
migrants prevailing
wages in market for the
skill
Group 1:
- Assess number of applications rejected by Ministries and
reasons.
Group 2:
- The system for establishing quotas for admission of foreign
workers should be made transparent such as in Korea.
Jobs of local workers preserved with admission of complementary foreign workers
Unemployment rate
Productivity of
enterprises
Enterprise surveys Enterprise viability
depends on availability
of more workers, not
technology upgrading.
Group 3:
Change indicator 2: Increased productivity of enterprises and
Add source: Labour Force Surveys.
174

Guide on measuring migration policy impacts in ASEAN
Table 4.2 Indicators of effectiveness and impact of working condition regulations
Policy objective Process indicators Impact indicators Recommendations/Suggestions
Country of employment – pay worker according to productivity.
Country of origin – obtain highest possible wage
Average wage by occupation based on
contracts
Labour inspection reports
Complaints received by labour attaché, or by
labour department
Surveys of establishment –
average wages in different
industries (* but data usually for
all workers; can only distinguish
migrant-dominated industries
from others)
Independent surveys of
migrants.
Group 1:
- Use (or require) RA reporting in order to assess range of
MW placement issues;
- Look at complaints to unions and NGOs (as few MWs
complain to government authorities).
Group 2:
- Payment of wages of foreign workers based on
productivity may not reflect the actual situation.it is
suggested that foreign workers be paid based on market
rate or on minimum wages laws;
- Wages are determined by host country and not sending
country.
Group 3:
- Remuneration/wage should be indicated in the contract.
Though the group noted that there are many workers
without contract. Change to indicator: ‘average wage by
occupation based on contracts or the prevailing industrial
wage rate’;
- Change to indicator 2: Number of cases of non-
compliance identified through labour inspection reports
and number of enterprises inspected;
- Add an indicator: number of companies undertaking
voluntary compliance measures (drawing on the example
of the Philippines where companies with less than 100
employees can undertake joint assessments with trade
unions and employers);
- Change indicator 3: Nature and number of Complaints
received by labour attachés, labour department, social
partners and other relevant entities.
175

Guide on measuring migration policy impacts in ASEAN
Table 4.2 Indicators of effectiveness and impact of working condition regulations
Policy objective Process indicators Impact indicators Recommendations/Suggestions
Country of employment – pay worker according to productivity.
Country of origin – obtain highest possible wage
Average wage by occupation based on
contracts
Labour inspection reports
Complaints received by labour attaché, or by
labour department
Surveys of establishment –
average wages in different
industries (* but data usually for
all workers; can only distinguish
migrant-dominated industries
from others)
Independent surveys of
migrants.
Group 1:
- Use (or require) RA reporting in order to assess range of
MW placement issues;
- Look at complaints to unions and NGOs (as few MWs
complain to government authorities).
Group 2:
- Payment of wages of foreign workers based on
productivity may not reflect the actual situation.it is
suggested that foreign workers be paid based on market
rate or on minimum wages laws;
- Wages are determined by host country and not sending
country.
Group 3:
- Remuneration/wage should be indicated in the contract.
Though the group noted that there are many workers
without contract. Change to indicator: ‘average wage by
occupation based on contracts or the prevailing industrial
wage rate’;
- Change to indicator 2: Number of cases of non-
compliance identified through labour inspection reports
and number of enterprises inspected;
- Add an indicator: number of companies undertaking
voluntary compliance measures (drawing on the example
of the Philippines where companies with less than 100
employees can undertake joint assessments with trade
unions and employers);
- Change indicator 3: Nature and number of Complaints
received by labour attachés, labour department, social
partners and other relevant entities.
176

Guide on measuring migration policy impacts in ASEAN
Policy objective Process indicators Impact indicators Recommendations/Suggestions
Protect health of workers
Enhance productivity
Number of labour inspections conducted,
violations identified regarding working hours
and overtime pay
Surveys of establishment –
hours of work in different
industries (* but data usually for
all workers; can only distinguish
migrant-dominated industries
from others)
Group 1:
- Assess number of sick days and claims on medical
benefits.
Group 3:
- Add indicators on OSH should be added to ensure the
health of workers is protected;
- The group felt that productivity was not being measured
under the given indicators. Suggested change: ‘No of
accidents and incidence of work stoppages’.
Prevent industrial accidents that cause injuries (or even death) and production losses.
Number of factory and plantation inspections
carried out
Accidents reported and consequences
Employment compensation claims
Number of workers trained on accident
prevention
Same as process indicators
Group 1:
- Look at orientation program content / how much input
from former MWs.
Group 3:
- Add to indicator 4: number of workers and employers
trained on accident prevention and OSH regulations.
Prevent all forms of physical and sexual harassment
Complaints received
Cases resolved
Same as process indicators
Increase job security Termination of employment reported by
employers
Number of laid-off workers who applied to
change employers
Employment trends based on
labour force surveys
Group 1:
- Look at number of contract renewals and average length
of employment (trends).
Group 3:
- The group clarified the indicator: Reduced number of
termination of employment reported by employers/
Ministries
177

Guide on measuring migration policy impacts in ASEAN
Policy objective Process indicators Impact indicators Recommendations/Suggestions
Protect health of workers
Enhance productivity
Number of labour inspections conducted,
violations identified regarding working hours
and overtime pay
Surveys of establishment –
hours of work in different
industries (* but data usually for
all workers; can only distinguish
migrant-dominated industries
from others)
Group 1:
- Assess number of sick days and claims on medical
benefits.
Group 3:
- Add indicators on OSH should be added to ensure the
health of workers is protected;
- The group felt that productivity was not being measured
under the given indicators. Suggested change: ‘No of
accidents and incidence of work stoppages’.
Prevent industrial accidents that cause injuries (or even death) and production losses.
Number of factory and plantation inspections
carried out
Accidents reported and consequences
Employment compensation claims
Number of workers trained on accident
prevention
Same as process indicators
Group 1:
- Look at orientation program content / how much input
from former MWs.
Group 3:
- Add to indicator 4: number of workers and employers
trained on accident prevention and OSH regulations.
Prevent all forms of physical and sexual harassment
Complaints received
Cases resolved
Same as process indicators
Increase job security Termination of employment reported by
employers
Number of laid-off workers who applied to
change employers
Employment trends based on
labour force surveys
Group 1:
- Look at number of contract renewals and average length
of employment (trends).
Group 3:
- The group clarified the indicator: Reduced number of
termination of employment reported by employers/
Ministries
178

Guide on measuring migration policy impacts in ASEAN
Policy objective Process indicators Impact indicators Recommendations/Suggestions
Provide decent housing Inspection reports No secondary source available Group 2:
- Include number of compliances/breaches of rules &
regulations on accommodation.
Group 3:
- The group noted that inspection reports may not include
inspection of housing in all countries;
- Indicator should be more specific to read: Regular
inspection reports on housing conditions of migrant
workers.
Discourage job-hopping Lay-offs reported by employers and permission
granted to applicants for new employment
No secondary source available Group 3:
- Change indicator: there should be strict monitoring of
workplace conditions;
- In the case of Malaysia/Indonesia, migrant workers are
unable to change employers. They may be considered to
be irregular when they change employer.
Promote industrial peace Reports of conciliators and arbitrators
Collective agreements registered
Migrant membership in trade
unions
Group 1:
- Look at situation of shop stewards (numbers / relationship
with management).
Group 3:
- There should be ratification of ILO Convention 87 and 98
- Add indicators: number of unions registered and the
number of collective bargaining agreements registered.
179

Guide on measuring migration policy impacts in ASEAN
Policy objective Process indicators Impact indicators Recommendations/Suggestions
Provide decent housing Inspection reports No secondary source available Group 2:
- Include number of compliances/breaches of rules &
regulations on accommodation.
Group 3:
- The group noted that inspection reports may not include
inspection of housing in all countries;
- Indicator should be more specific to read: Regular
inspection reports on housing conditions of migrant
workers.
Discourage job-hopping Lay-offs reported by employers and permission
granted to applicants for new employment
No secondary source available Group 3:
- Change indicator: there should be strict monitoring of
workplace conditions;
- In the case of Malaysia/Indonesia, migrant workers are
unable to change employers. They may be considered to
be irregular when they change employer.
Promote industrial peace Reports of conciliators and arbitrators
Collective agreements registered
Migrant membership in trade
unions
Group 1:
- Look at situation of shop stewards (numbers / relationship
with management).
Group 3:
- There should be ratification of ILO Convention 87 and 98
- Add indicators: number of unions registered and the
number of collective bargaining agreements registered.
180

Guide on measuring migration policy impacts in ASEAN
DAY 2, NOVEMBER 11, 2015, GROUP-WORK: Table 3.4 Process and impact indicators related to regulating recruitment
Objective Process indicators Impact indicators Recommendations/Suggestions
1. Efficiency Number of registered or
licensed recruiters
Number of contracts processed
Bilateral labour agreements
Job placements by public
employment exchanges and by
private recruitment agencies,
by skill
Strength of employer–recruiter
partnerships
Trends in average wages
Number of workers prematurely
terminated
Cost of recruitment to workers
and employers
Group 1:
- Assess number of placements;
- Assess time taken to complete recruitment process (i.e. typical time taken from date employer
requests migrant worker to date the MW actually starts work. How many hiring steps;
- Consider online application process (e.g., Philippines);
- Assess repeat use of the Recruitment Agencies (a good indicator of each RA’s effectiveness/
efficiency).
Group 2:
- Limit license to agencies providing quality service only (evaluate the quality control provisions
for protection of migrant workers).
Group 3:
- Add in process indicators following:
- Facilitation by recruiters and government’s labour agencies;
- Regional instrument (refer to ASEAN instrument on protection and promotion of the rights of
migrant workers).
2. Protection Number of job offers/employers
checked
Number of job advertisements
approved or disallowed
Number of contracts registered
/approved
Number of workers who went
through pre-departure briefing
Number of inspections
conducted
Workers reported to be
trafficked
Trends in reported fraud
Number of licenses cancelled or
suspended
Trends in reported contract
violations, complaints received
Trends in worker-paid
recruitment fees
Group 1:
- Consider country’s implementation of the principles of C87 within their own law and policies
(notwithstanding that they may not have ratified the convention);
- Responsibility of RA’s for the treatment of workers from departure to return;
- Assess coordination/synergy between authorities issuing work permits and those issuing visas
(to ensure the rights/requirements match);
- Look at post arrival orientation programs to see what issues are being addressed;
- Master Data base of migrant workers;
- Access to, and mobility of, social security.
181

Guide on measuring migration policy impacts in ASEAN
DAY 2, NOVEMBER 11, 2015, GROUP-WORK: Table 3.4 Process and impact indicators related to regulating recruitment
Objective Process indicators Impact indicators Recommendations/Suggestions
1. Efficiency Number of registered or
licensed recruiters
Number of contracts processed
Bilateral labour agreements
Job placements by public
employment exchanges and by
private recruitment agencies,
by skill
Strength of employer–recruiter
partnerships
Trends in average wages
Number of workers prematurely
terminated
Cost of recruitment to workers
and employers
Group 1:
- Assess number of placements;
- Assess time taken to complete recruitment process (i.e. typical time taken from date employer
requests migrant worker to date the MW actually starts work. How many hiring steps;
- Consider online application process (e.g., Philippines);
- Assess repeat use of the Recruitment Agencies (a good indicator of each RA’s effectiveness/
efficiency).
Group 2:
- Limit license to agencies providing quality service only (evaluate the quality control provisions
for protection of migrant workers).
Group 3:
- Add in process indicators following:
- Facilitation by recruiters and government’s labour agencies;
- Regional instrument (refer to ASEAN instrument on protection and promotion of the rights of
migrant workers).
2. Protection Number of job offers/employers
checked
Number of job advertisements
approved or disallowed
Number of contracts registered
/approved
Number of workers who went
through pre-departure briefing
Number of inspections
conducted
Workers reported to be
trafficked
Trends in reported fraud
Number of licenses cancelled or
suspended
Trends in reported contract
violations, complaints received
Trends in worker-paid
recruitment fees
Group 1:
- Consider country’s implementation of the principles of C87 within their own law and policies
(notwithstanding that they may not have ratified the convention);
- Responsibility of RA’s for the treatment of workers from departure to return;
- Assess coordination/synergy between authorities issuing work permits and those issuing visas
(to ensure the rights/requirements match);
- Look at post arrival orientation programs to see what issues are being addressed;
- Master Data base of migrant workers;
- Access to, and mobility of, social security.
182

Guide on measuring migration policy impacts in ASEAN
Objective Process indicators Impact indicators Recommendations/Suggestions
Group 2:
- Set time limit on the contract of a worker;
- Include prosecution and action taken by authorities in the impact indicator;
- Set up a common ASEAN framework for overseas employment (such as AQRF).
Group 3:
- Add in the process indicator:
- Number of travel insurance for migrant workers from Country of Origin to Country of
Destination.
- Add in the process indicator:
- Regional instrument on employment ;
- Cambodia, Indonesia, and Myanmar have no direct recruitment by employer.
3. Employment Foreign employers authorized
to recruit
Bilateral agreements
Number of new employers
served/trends in direct hiring
Recruitment for old and new
destinations
Group 2:
- Provide preference to workers from ASEAN countries;
- The practice of foreign employers is not common in sending countries in ASEAN;
- Encourage long term contract for the workers.
- Implement AQRF framework.
Group 3:
- Change in process indicator:
- No license issued to foreign recruiters.
4. Competition New licenses issued by
nationality of ownership,
size of recruitment, assets or
capitalization
Job placements by size and
nationality of agencies
Job placements in new
destination countries/new
occupations
Group 2: The group does not agree with the indicators.
183

Guide on measuring migration policy impacts in ASEAN
Objective Process indicators Impact indicators Recommendations/Suggestions
Group 2:
- Set time limit on the contract of a worker;
- Include prosecution and action taken by authorities in the impact indicator;
- Set up a common ASEAN framework for overseas employment (such as AQRF).
Group 3:
- Add in the process indicator:
- Number of travel insurance for migrant workers from Country of Origin to Country of
Destination.
- Add in the process indicator:
- Regional instrument on employment ;
- Cambodia, Indonesia, and Myanmar have no direct recruitment by employer.
3. Employment Foreign employers authorized
to recruit
Bilateral agreements
Number of new employers
served/trends in direct hiring
Recruitment for old and new
destinations
Group 2:
- Provide preference to workers from ASEAN countries;
- The practice of foreign employers is not common in sending countries in ASEAN;
- Encourage long term contract for the workers.
- Implement AQRF framework.
Group 3:
- Change in process indicator:
- No license issued to foreign recruiters.
4. Competition New licenses issued by
nationality of ownership,
size of recruitment, assets or
capitalization
Job placements by size and
nationality of agencies
Job placements in new
destination countries/new
occupations
Group 2: The group does not agree with the indicators.
184

Guide on measuring migration policy impacts in ASEAN
Table 3.1: Measures to regulate recruitment
ObjectiveKey elements of strategy/
interventionRegulations measures/instruments Recommendations/Suggestions
1. Efficiency Provide adequate information
to avoid “mismatch”, especially
information about availability of
skills and about jobs offered
Encourage healthy competition
Motivate recruiters to follow
good practices
Adopt standard occupation
nomenclature, classification and
trade testing (e.g., ILO ISCO)
Negotiate mutual recognition of
skills agreements
Operate employment exchanges
Register/license qualified recruiters
Require training to qualify to recruit
Group 1:
- Look at prevalence of On Line recruitment (E.g., Philippines)
- Limit number of steps on the recruitment process
Group 2:
- There is ambiguity in strategy/intervention with regards to healthy competition;
- Implement system that is similar to EURES (job portal that allows access to both employers and
workers on job postings).
2. Protection Inform public to avoid fraud and
other abuses
Impose stiff penalties against
human traffickers and smugglers
Selectively grant license to
recruit
Apply labour standards to
migrants
Regulate fees/ban charges to
workers
Register/approve contracts and
give pre-departure briefing
Blacklist bad employers/ unreliable
workers
Check job-offers/employers
Require prior approval of job ads
Disallow or limit worker-paid
recruitment fees
Require licensed agencies to put up
performance bonds or guarantees
Conduct inspections
Cancel or suspend licenses and
impose stiff penalties against
trafficking and violation of
regulations
Group 1:
- Responsibility of RAs from departure to return;
- Require contracts to be in language of worker (and prevent double contracts);
- Due diligence/scrutiny of board members/owners of the RAs.
Group 2:
- Emphasize awareness; programmes in sending countries.
- Modernize administrative process (like in Malaysia, it takes away the brokers).
Group 3:
- Key elements of strategy/ intervention 3: Selective and provisional grant license to recruit;
- Key elements of strategy/ intervention 5: delete word “ban charges”.
185

Guide on measuring migration policy impacts in ASEAN
Table 3.1: Measures to regulate recruitment
ObjectiveKey elements of strategy/
interventionRegulations measures/instruments Recommendations/Suggestions
1. Efficiency Provide adequate information
to avoid “mismatch”, especially
information about availability of
skills and about jobs offered
Encourage healthy competition
Motivate recruiters to follow
good practices
Adopt standard occupation
nomenclature, classification and
trade testing (e.g., ILO ISCO)
Negotiate mutual recognition of
skills agreements
Operate employment exchanges
Register/license qualified recruiters
Require training to qualify to recruit
Group 1:
- Look at prevalence of On Line recruitment (E.g., Philippines)
- Limit number of steps on the recruitment process
Group 2:
- There is ambiguity in strategy/intervention with regards to healthy competition;
- Implement system that is similar to EURES (job portal that allows access to both employers and
workers on job postings).
2. Protection Inform public to avoid fraud and
other abuses
Impose stiff penalties against
human traffickers and smugglers
Selectively grant license to
recruit
Apply labour standards to
migrants
Regulate fees/ban charges to
workers
Register/approve contracts and
give pre-departure briefing
Blacklist bad employers/ unreliable
workers
Check job-offers/employers
Require prior approval of job ads
Disallow or limit worker-paid
recruitment fees
Require licensed agencies to put up
performance bonds or guarantees
Conduct inspections
Cancel or suspend licenses and
impose stiff penalties against
trafficking and violation of
regulations
Group 1:
- Responsibility of RAs from departure to return;
- Require contracts to be in language of worker (and prevent double contracts);
- Due diligence/scrutiny of board members/owners of the RAs.
Group 2:
- Emphasize awareness; programmes in sending countries.
- Modernize administrative process (like in Malaysia, it takes away the brokers).
Group 3:
- Key elements of strategy/ intervention 3: Selective and provisional grant license to recruit;
- Key elements of strategy/ intervention 5: delete word “ban charges”.
186

Guide on measuring migration policy impacts in ASEAN
ObjectiveKey elements of strategy/
interventionRegulations measures/instruments Recommendations/Suggestions
3. Employment Open recruitment business
to more companies, including
foreign-owned ones
Allow direct recruitment by
foreign employers
Use incentives to promote best
practice and development of
specialized market niches
Clear entry criteria, transparent,
efficient procedures for licensing
One-stop service centres for
approval of contracts
Special facilities for recruiters in
good standing
Allocate quotas under labour
supply agreements
Group 1:
- Reject foreign ownership of RAs;
- Reject direct recruitment by employers.
Group 2:
- Sub-contracting should not be discouraged and the principal employer must be reliable.
Group 3:
- Key elements of strategy/ intervention 1: delete including foreign-owned ones;
- Key elements of strategy/ intervention 2: delete.
4. Competition Market reserved for local
recruiters
Promote specialization
Hold recruiters jointly liable with
foreign employers
Limit ownership and management
of recruitment agency to citizens
Organize licensed recruiters into
associations and adopt code of
ethics
Group 1:
- Hold RAs jointly and severally liable with employers.
Group 2:
- There is a need for sustainable paid up capital;
- Include both monetary, social cost while calculating cost.
What existing information do you collect that can be used to monitor working conditions of migrants?
Following are the information provided by the three groups for the question above:
- In the Philippines, there is the practice of a comprehensive Pre-employment & pre-
departure training as well as post-arrival orientation in the country of destination
(conducted through the embassy in the host country). This approach was followed to a
certain extent by Indonesia, Myanmar & Cambodia. In Indonesia, employment agencies
report to the government once in every three months about the situation and issues faced
by foreign workers sent through the agency.
- Additionally, in the Philippines there is the system of Joint & several liability on employment
agents with the receiving countries employers. Employment agents may also be liable for
breaches and offences committed by employers in the host countries.
- In some of the ASEAN countries information on working conditions of migrants is collected
from NGOs, Unions and Labour inspector reports.
187

Guide on measuring migration policy impacts in ASEAN
ObjectiveKey elements of strategy/
interventionRegulations measures/instruments Recommendations/Suggestions
3. Employment Open recruitment business
to more companies, including
foreign-owned ones
Allow direct recruitment by
foreign employers
Use incentives to promote best
practice and development of
specialized market niches
Clear entry criteria, transparent,
efficient procedures for licensing
One-stop service centres for
approval of contracts
Special facilities for recruiters in
good standing
Allocate quotas under labour
supply agreements
Group 1:
- Reject foreign ownership of RAs;
- Reject direct recruitment by employers.
Group 2:
- Sub-contracting should not be discouraged and the principal employer must be reliable.
Group 3:
- Key elements of strategy/ intervention 1: delete including foreign-owned ones;
- Key elements of strategy/ intervention 2: delete.
4. Competition Market reserved for local
recruiters
Promote specialization
Hold recruiters jointly liable with
foreign employers
Limit ownership and management
of recruitment agency to citizens
Organize licensed recruiters into
associations and adopt code of
ethics
Group 1:
- Hold RAs jointly and severally liable with employers.
Group 2:
- There is a need for sustainable paid up capital;
- Include both monetary, social cost while calculating cost.
What existing information do you collect that can be used to monitor working conditions of migrants?
Following are the information provided by the three groups for the question above:
- In the Philippines, there is the practice of a comprehensive Pre-employment & pre-
departure training as well as post-arrival orientation in the country of destination
(conducted through the embassy in the host country). This approach was followed to a
certain extent by Indonesia, Myanmar & Cambodia. In Indonesia, employment agencies
report to the government once in every three months about the situation and issues faced
by foreign workers sent through the agency.
- Additionally, in the Philippines there is the system of Joint & several liability on employment
agents with the receiving countries employers. Employment agents may also be liable for
breaches and offences committed by employers in the host countries.
- In some of the ASEAN countries information on working conditions of migrants is collected
from NGOs, Unions and Labour inspector reports.
How does your government assess and monitor the cost of migration? What are the initiatives/programmes to reduce the cost of migration?
Here are the responses form the groups on the question above:
- The groups encouraged use of online licensing for PEA.
- Governments are generally not monitoring cost of migration or putting in place
initiatives to reduce costs. However, Vietnam has a programme for outbound migrants
from selected groups (from certain poor areas). Members of those groups have the
cost of travel and subsidiary costs paid for by the government. Philippine worker unions
in Hong Kong do surveys of costs and other issues and submit the survey results to
the Philippine government for its use. Other governments penalize RAs if they charge
workers fees above allowable fees.
188

Guide on measuring migration policy impacts in ASEAN
- Following were the mechanisms to access and monitor cost of migration in:
1. Cambodia: has no regulated fee, except for workers employed under EPS of Korea,
but has identified the items of expenses of migrant workers
2. Myanmar: has regulated the fee
3. Malaysia: has regulated the fee
- Initiatives to reduce the cost of migration were:
- G to G system
- Migrant Resource Centres including complaint mechanism
189


Guide on measuring migration policy impacts in ASEAN
This Guide offers policy-makers and administrators a guide for evaluating how labour migration policies work in practice, based on documented experiences in ASEAN and other parts of the world. It starts with assessing the outcomes of labour market tests used to determine whether the migrant workers requested by employers are really needed. The second section discusses the recruitment process, and ways to assess the effectiveness of policies in terms of better outcomes in matching workers with jobs, as well as minimizing the cost of recruitment. The third section focuses on protection and outlines methods to assess how policies protect the wages and working conditions of migrant workers and deal complaints filed with government agencies. The fourth section reviews evidence on the impacts of migration on destination and origin countries, including on incomes, productivity, and non-economic factors such as crime and congestion. The fifth section points out the conceptual and practical difficulties in evaluating the various consequences of labour migration and lays out practical steps that national authorities can take to improve labour market testing, recruitment, labour market monitoring, and assessment of the overall impact. A final section reviews the experience of Malaysia in managing the admission and employment of foreign workers, and what light past research sheds on its impact on the Malaysian labour market and economy as a whole.
The Department of Foreign Affairs, Trade and Development of Canada supported the production and validation of this publication.
978-92-2-129451-1 (print)978-92-2-129452-8 (web pdf)
ILO Regional Office for Asia and the Pacific United Nations Building Rajadamnern Nok AvenueBangkok 10200, Thailand Tel.: +662 288 1234 Fax: +622 280 1735Email: [email protected]
www.ilo.org/asia