guide to arcview 20 - d32ogoqmya1dw8.cloudfront.net · the arcview gis software package, not as an...
TRANSCRIPT

Educator’s Guide to ArcView® GISEducator’s Guide to ArcView® GIS
Larry P. KendallLarry P. Kendall

COPYRIGHT © 2003 Brooks/Cole, a division of Thomson Learning, Inc.Thomson Learning™ is a trademark used herein under license.
Development of these materials was supported, in part, by the National Science Foundation under Grant No. DUE-9555205. Any opinions, fi ndings, and conclusions or recommendations expressed in these materials are those of the authors and do not necessarily refl ect the views of the National Science Foundation.
ESRI and ArcView are registered trademarks in the United States and are either trademarks or registered trademarks in all other countries in which they are used. The ArcView logo is a trademark of Environmental Systems Research Institute, Inc.
The SAGUARO ProjectMichelle K. Hall-Wallace, Director
Department of GeosciencesThe University of Arizona
1040 E Fourth Street • Tucson, AZ [email protected]
http://saguaro.geo.arizona.edu

Contents
Introduction Preface ............................................................................................................................. 1 The ArcView user interface ....................................................................................... 3
Basic techniques Theme basics ................................................................................................................. 4 Panning and zooming ................................................................................................ 6 Editing legends ............................................................................................................. 8 Changing scale and projection ............................................................................. 12 Measuring .................................................................................................................... 14 Working with attribute tables ............................................................................... 16 Editing data .................................................................................................................. 19 Using Boolean operations ....................................................................................... 20 Finding features with queries ............................................................................... 22 Using Select By Theme ............................................................................................... 24 Creating layouts .......................................................................................................... 26

Educator’s Guide to ArcView GIS

GIS vocabularythemes - sets of geographic features and their attributes.
features - map representations of geographic objects (points, lines, or polygons)
attributes - information describing a map feature.
extent - the geographic area represented in a map view.
Educator’s Guide to ArcView GIS
Preface 1
We live in an information age. Maps and databases are a part of our daily life. Chances are you have already used several kinds of maps today for one purpose or another. You even carry mental maps in your head, containing information that you use frequently.
What is a GIS?A Geographic Information System (GIS) combines maps and informa-tion about map features with the interactive visualization and analytical power of computers. The result is a powerful tool for working with spatial data. GIS is used by, or at least affects, people of nearly every walk of life. After all, there’s no shortage of geographic data. As GIS users are quick to point out, “Everything happens somewhere!”
Using this guideThis guide was designed as a quick reference to the basic functions of the ArcView GIS software package, not as an exhaustive manual. It was prepared as a supplement to the GIS-based science curriculum materials developed by The SAGUARO Project at the University of Arizona.
Our experience in using and testing these materials has taught us that it’s usually only necessary to give students a 5–10 minute introduction to these essential skills before they use ArcView for the fi rst time.
• navigating the ArcView user interface (Page 3) • turning themes on and off (Page 4) • activating themes (Page 4) • panning and zooming (Page 6)
Beyond these basics, students will learn nearly everything they need to know about ArcView by simply using it as a tool and following the directions provided in the materials. The other techniques in this guide may be of interest as students become more familiar with ArcView and begin to use it to explore “outside the box,” seeking answers to their own questions.
A work in progressThis document is a work in progress, and can only become more useful through user feedback. Your ideas and suggestions for improve-ment are welcomed. Please direct comments and inquiries to us at [email protected].
Preface

Educator’s Guide to ArcView GIS
2 Preface

The ArcView user interfaceArcView GIS provides tools for working with information in the form of maps (called views), tables, charts, layouts, and scripts. The collection of information you are working with at any given time in ArcView is called a project, and the computer fi le that describes how the project components are displayed is the project fi le. The name of this fi le ends with .apr, which stands for ArcView Project. Each project component has its own user interface, with an appropriate set of tools, buttons, menus, and windows. This example names and describes the parts the Views interface.
Note - this view shows the Macin-tosh user interface. The Windows interface is virtually identical except that the status bar is at the bottom of the application window.
Menu Bar
Button Bar
Tool Bar
Status Bar*
Title Bar
The Project WindowProject component icons
Views - map windows
Tables - attribute data in database fi les
Charts - graphical display of attribute data
Layouts - visual displays of project components
Scripts - instructions for automated processes and custom functions
Each component has its own user interface.
The View windowThis is where ArcView draws maps, layer by layer.
Buttons are shortcutsto menu items.
Status bar gives feed-back about tools and buttons, and the status of current operations.
Cursor coordinates (in map units)
Scale box (empty if no map units set)
Active theme(s) are highlighted. Shift-click to activate/deactivate multiple themes.
Display themecheckbox:Control-click to turn all themes on or off.
ArcView performs operations on the active theme(s), whether they are on or not!
Drag here and here to resize the table of con-tents and the View window.
Table ofContentsThe list of themes in the current view.
Tools let you interact directly with the data.
Educator’s Guide to ArcView GIS
The ArcView User Interface 3

Points, lines, and polygonsThese are the three basic types of spatial data. (For you math lovers, they have 0, 1, and 2 dimensions respectively.) Which is used to represent a feature often depends on the extent of the map. Some examples are:
• Points - cities, landmarks, survey points
• Lines - roads, pipelines, trails • Polygons - boundaries,
buildings, regions
Educator’s Guide to ArcView GIS
4 Theme basics
In a GIS, a set of geographic features that share similar characteristics is called a theme. A view is a map of one or more themes displayed on a common coordinate grid.
The table of contentsThe table of contents lists the themes that have been added to the view and displays each theme’s legend. Manipulating the table of contents changes the appearance of the view.
Adding a theme to a viewTo add a new theme to a view:
• Choose View Add Theme… or click the add theme button and select a theme to add. The theme will be added to the top of the view’s table of contents, but will not be turned on.
Turning themes on and off (Essential Skill)Whether a theme is displayed or hidden depends on whether or not that theme is turned on or off in the table of contents.
• Click an unchecked box to turn that theme on. • Click a checked box to turn that theme off.
Activating themes (Essential Skill)To work with a theme, it must be active.
• To make a theme active, click the theme’s title in the table of contents. A raised border highlights the active theme.
• To activate or deactivate multiple themes, hold down the shift key and click on additional theme titles. Each active theme will have a raised border.
Theme basics
Displaying shortcutsHold down the control key while clicking the box to turn all of the themes in a view on or off.
Timesaving tipThe more themes that are displayed, the longer it takes to redraw when you make a change to the view. To reduce the redraw time, turn off any themes you don’t need.
active themes
themes on (displayed)
themes off (hidden)
scroll to see additional themes
Drag themes up or down to change the draw order.
theme legend theme name

Educator’s Guide to ArcView GIS
Theme basics 5
Deleting themesTurning a theme off causes that theme’s features to not be displayed, but the theme’s data is still part of the project. To permanently remove a theme’s data from a project:
• Activate the theme(s) you want to delete. • Choose Edit Delete Themes.
Changing the draw order of themesA theme represents features as points, lines, or polygons (areas). If more than one theme is turned on, they are drawn on the map as layers. These layers are drawn in order, starting at the bottom of the table of contents. Polygon themes, such as states or counties, may cover point or line themes, such as cities or rivers, that are lower in the table of contents.
If you don’t see a theme drawn in the map, fi rst check to see that the theme has been turned on. Then check to see if a polygon shape is covering it. To change the drawing order of a theme, drag the theme title up or down to a new position in the table of contents. In general, move point themes to the top of the table of contents, line themes to the middle, and polygon themes to the bottom.
Changing theme namesYou may want to change the names of themes listed in the table of contents to make them easier to read or understand. For example, how many people would guess that ftn_crs.shp represents points on a fi tness course trail? To edit the name of a theme:
• Make the theme active in the table of contents. • Choose Theme Properties…. • Edit the name in the Theme Name box and click OK.
Changing the name of a theme changes the way the name is displayed in the project, but does not change the name of the original data fi le.
Editing theme legends and dataThemes can be edited in several ways. Two sections of this guide cover additional editing operations:
• Editing legends explains how to modify the colors and symbols used to display the theme in the map.
• Editing data explains how to add, delete and modify theme data.
Don’t see theTheme Name text box?If you don’t see the Theme Name box, scroll to the top of the theme properties list and select the Defi ni-tion icon.
Dragging cities.shp to the top of the table of contents causes ArcView to draw the cities on top of the counties.
Here, the counties theme covers the cities theme. You can’t see the cities, even though the cities theme is turned on.

Educator’s Guide to ArcView GIS
6 Panning and zooming
Selected featuresSelected features are highlighted in yellow in both the View window and in the theme’s attribute table. See Selecting Features on page 22 for more information.
Zoom to Full Extent
Zoom to Active Them
e(s)
Zoom to Selected Features
Zoom In
Zoom O
utZoom
to Previous Extent
Zoom buttonsThe six zoom buttons are grouped on the Views button bar:
Panning and zoomingPanning (Essential Skill)Panning moves the map within the View window without changing the scale or the extent (see sidebar). To pan, click and drag the map with the pan tool in the direction you want it to move. When you release the button, the missing parts of the view will redraw.
Zooming (Essential Skill)Zooming changes the view’s extent:
• Zooming in makes features appear larger and reduces the view’s extent.
• Zooming out makes features appear smaller and increases the view’s extent.
Using the zoom to extent buttonsThe three zoom to extent buttons allow you to quickly fi ll the view with an area of interest. The view below contains two themes: countries of the world and the United States. The States theme is active, and Montana has been selected (highlighted) with the Select Feature tool. If map units are set, the scale of the map is displayed in the scale box on the right end of the tool bar.
Are you lost in your view?If one or more themes are turned on but you don’t see any features or can’t fi gure out where you are in the view, click the Zoom to Full Extent button to regain your sense of place.
What’s an “extent”?The extent is the geographic area that’s displayed in the view window.
Zoom to Full Extent This button scales the map so that all of the features of all of the themes will fi t in the view, whether they are displayed or not.
Zoom to Active Theme(s)
Zoom to Selected
This button scales the map so that all of the features of the active theme will fi t in the view, whether they are displayed or not.
This button scales the map so that the selected (highlighted) features of the active theme will fi t in the view, whether they are displayed or not.

To zoom in on a specifi c area, click and drag out a rectangle with the Zoom In tool .
Educator’s Guide to ArcView GIS
Panning and zooming 7
Other zoom buttonsArcView gives you other ways to zoom in and out:
• To zoom in to the center of the view, click the Zoom In button . • To zoom out from the center of the view, click the Zoom Out
button .
Zooming toolsArcView has two zooming tools—the Zoom In tool and the Zoom Out tool . To use them, activate the tool and click on the view. The view will zoom in or out, centered on the location you clicked.
The Zoom In tool also lets you click and drag in the view window to defi ne the zoom extent.
Oops! How do I undo a zoom?To undo a zoom, click the Zoom to Previous Extent button. ArcView lets you “step back” through the fi ve most recent extents or zooms.
Zooming bychanging the scaleYou can also zoom by changing the scale of the view.
• Click here.
• Enter the desired scale here and click OK. Use a smaller value to zoom in and a larger value to zoom out.

The Legend Editor allows you to change the colors, patterns, lines, and symbols used to draw the features on a map.
Legend Editor basics To edit a theme’s legend: • Double-click the theme name in the table of
contents (shown at right). • Choose the legend type, classifi cation fi eld,
and type of classifi cation (if appropriate). • To change a symbol, double-click the symbol in the Legend
Editor window and use the Symbol Window to change the symbol’s appearance. (See Editing symbols below.)
• Click the button and close the Legend Editor window.
Editing symbols—the Symbol Window To edit a legend’s symbol: • Double-click the symbol in the Legend Editor window to open
the Symbol Window. • Click the appropriate palette buttons and make the desired
changes. • Close the Symbol Window.
• Click the button in the Legend Editor.
Editing legends
What if my edits don’t “stick”?After editing a legend, always click the button before closing the Legend Editor window.
The symbol window contains six palettes for setting the properties of map symbols:
Fill Palette—Choose the type of fi ll pattern for polygons.
Pen Palette—Change the thickness and style of lines used in line themes and polygon borders.
Marker Palette—Select the type of marker used for point themes.
Font Palette—Change the size, type, etc. of text in a theme.
Color Palette—Change the symbol’s color.
Palette Manager—Reset the palettes to their default settings.
Palette Buttons
The Legend Editor window
Educator’s Guide to ArcView GIS
8 Editing legends

Legend typesArcView offers several types of legends, each suited to particular kinds of data. To choose a legend type, click on the legend type pop-up menu and make an appropriate selection.
Single SymbolSingle Symbol is the default legend type. It shows all of the features of the theme using a single color and symbol.
To revert back to a single symbol legend: • Choose Single Symbol from the Legend Type popup menu. • Double-click the symbol, choose a color from the Symbol
Window, and close the Symbol Window. • Click the Apply button.
Unique ValueDisplays all features sharing the same value as a unique color.
To create a unique value legend: • Choose Unique Value from the Legend Type popup menu. • Choose a Values Field from the popup menu. • Choose a color scheme from the Color Schemes popup menu. • If necessary, edit individual legend colors.
• Click the Apply button.
Legend classifi cation
What is classifi cation?Classifi cation sorts data values into groups so that unique symbols can be assigned to each group. Graduated Color and Graduated Symbol legends divide the values of a fi eld into groups or classes, so that a color or symbol can be assigned to each value.
To set the type of classifi cation, the number of classes, and the number of decimal places for classifi cation values, click the Classify… button in the Legend Editor window.
Types of classifi cation • Equal area - the features of
each class contains about the same total area.
• Equal interval - each class has the same value range.
• Natural breaks - ArcView looks for clusters of data and breaks these clusters into separate classes.
• Quantile - each class contains about the same number of features.
• Standard Deviation - values are classifi ed according to how far they are above or below the average value.
Theme: StatesLegend Type: Unique ValueValue Field: Sub_region
Theme: StatesLegend Type: Single Symbol
Educator’s Guide to ArcView GIS
Editing legends 9

Graduated Color (points, lines, or polygons)Displays a theme in a graduated spectrum of colors based on the values in one fi eld of the theme’s attribute table.
To create a graduated color legend: • Choose Graduated Color from the Legend Type popup menu. • Choose a Classifi cation Field from the popup menu. (See
Legend classifi cation on Page 9). • Click the Classify… button. Choose the type, number of
classes, and precision of the values, then click OK. • Choose a color scheme from the Color Ramps popup menu. • Click the Apply button.
Graduated Symbol (points or lines only)Graduated symbol legends are similar to graduated color, except that each class has a unique size (or width) of marker or line. The colors of the symbols can be set manually.
To create a graduated symbol legend: • Choose Graduated Symbol from the Legend Type popup menu. • Choose a Classifi cation Field from the popup menu. (See
Legend classifi cation on Page 9). • Click the Classify… button. Choose the type, number of
classes, and precision of the values, then click OK. • Double-click the Symbol and choose the symbol type and color. • Set the Size Range for the symbols. • Click the Apply button.
Graduated colors or graduated symbols?Graduated color legends are good for displaying qualitative or relative attributes like population density, percent unemployment, and birth rate.
Graduated symbol legends are usually best for showing quantitative (how many, how big, etc.) attributes like population, magnitude, and agricultural production.
Theme: StatesLegend Type: Graduated ColorValue Field: Pop1996
Theme: CitiesLegend Type: Graduated SymbolValue Field: Population
Normalizing dataWhen using Graduated Color or Graduated Symbol legends, in addition to classifying single attributes, you can classify data based on the relationship between two attributes. Called normalizing, this is done by dividing the value of one fi eld (the classifi cation fi eld) by the value of another fi eld (the normalization fi eld).
In this example, the 1990 population of each state is normalized by that state’s area. The resulting values are the population per unit area (also called the Population Density).
Educator’s Guide to ArcView GIS
10 Editing legends

ChartChart legends display data using pie or bar graphs. These are useful when you want to compare the values of two or more different fi eld values for each feature. Here, the 1990 and 1996 state populations are displayed in a bar chart.
To create a chart legend: • Choose Chart from the Legend Type popup menu and click
the desired Chart Type. • Choose each fi eld you want added to the chart and click Add. • Double-click the symbol for each fi eld and choose an appropri-
ate color and fi ll pattern for each symbol. • Double-click the Background Symbol and choose an appro-
priate color and fi ll pattern. • Click the Apply button.
Dot (polygons only)Displays data by fi lling the polygon with a dot density profi le (the higher the value, the more dots).
To create a dot legend: • Choose Dot from the Legend Type popup menu. • Choose a Density Field from the popup menu. • Enter a Dot Legend value (1 dot = ____) or click the Calculate
button to have ArcView calculate the value for you. • Double-click the Dot Symbol and choose a symbol type and color. • Click the Apply button.
Theme: StatesLegend Type: ChartChart Fields: Pop1990 and Pop1996
Theme: StatesLegend Type: DotDensity Field: Pop1996
Educator’s Guide to ArcView GIS
Editing legends 11

Educator’s Guide to ArcView GIS
12 Changing scale and projection
Map scaleA map scale represents a comparison of the distance between two points on a map to the distance between corresponding points on the ground.
Scale in ArcView GISThe scale of a view is shown on the right end of the tool bar. The scale updates automatically as you zoom in or out.
0.4 0 0.4 0.8 Miles
How maps express scaleThree types of scales appear on maps:
• Ratio Scale - Expresses the ratio of map measurement to ground measurement. For example, a scale of 1:24,000 means that one inch on the map equals 24,000 inches on the ground. The units can be anything, as long as map and ground units are the same.
• Verbal Scale - Compares map distance to ground distance in words. The map and ground units are often different: “One inch equals one hundred miles”.
• Graphic Scale - Ground distances are given on a graphic scale bar:
ArcView contains tools for automatically creating graphic scales on map layouts. See Layouts on page 26 for information on adding scale bars to your maps.
Changing scale and projection
What if the scale is blank?For ArcView to calculate a view’s scale, the map and distance units of the view must be set. Instructions for setting map and distance units are given in the section on Measuring on page 14.
Manually changing the scaleTo manually change the scale of a view, click in the scale box and enter the new scale in the dialog box that appears. (see page 7 for more on the view scale)
Scale and detailThe scale of a map determines how much detail can be seen.
• Large-scale maps (like city maps) show small areas in greater detail.Example - 1:24,000
• Small-scale maps (like road atlases) show larger areas, but in less detail.Example - 1:1,000,000
If this is confusing, remember that the fraction represented by the scale ratio of the small-scale map (1/1,000,000) is much smaller than that of the large-scale map (1/24,000).

ProjectionsA projection mathematically transforms a curved surface onto a fl at map while attempting to preserve the property of area, shape, or distance. (Or any two, but never all three!)
In ArcView, all themes in a view must be in the same projection to display properly.
Changing a view’s projectionIf your theme data are unprojected (that is, in geographic coordinates or decimal degrees), they can be displayed in any of ArcView’s built-in projections.
To change a View’s projection: • Choose View Properties • Click the Projection button • Choose a category and a type of projection from the popup
menus. • Click OK.
Category - The scale of the projection, ranging from pro-jections of the entire world to those of individual states.
Type - Choose from many projection types based on the fundamental projections of cylinder, cone, and plane.
Types of projections
CylindricalThe surface is projected onto a cyl-inder that touches the globe at the equator, maintaining the scale on lines of longitude (meridians) and at the equator. Best used for equatorial projections of the world.
PlanarThe surface is projected onto a plane that touches the globe at one of the poles, the equator, or some other point.
ConicalThe surface is projected onto a cone that touches the globe on any circle drawn around the globe. A conical projection shows true scale along the meridians and one or two circles of latitude (parallels). Most useful for map areas that extend in an East-West direction.
Educator’s Guide to ArcView GIS
Changing scale and projection 13

MeasuringSetting and changing map and distance unitsBefore you can measure distance or area in a view, the map and distance units must be set. To fi nd out if they are already set, choose View Properties…. If the Map Units and/or the Distance Units are listed as unknown, set the known units from the respective popup menus. The map units are determined by the projection. If the data are unprojected, set the map units to decimal degrees. The distance units are determined by the user’s needs. To change map or distance units, choose the desired units from the appropriate popup menu.
Measuring distances To measure distances in a view: • Zoom in using the zoom in tool until the feature(s) you want
to measure fi ll the view window. • Using the measuring tool , click on one feature, move to the
other feature and double-click. The distance will be given in the status bar.
To measure distances along irregular paths: • Click once to begin, single-click at each point where you need
to change direction, then double-click at the end. • The status bar displays the length of the current segment
(since the previous click) as well as a running total of the segment lengths.
Status BarArcView displays measurements on the Status Bar. On the Macintosh, the Status Bar is located immediately below the Tool Bar. On Windows-based computers, the Status Bar is below the View window.
map units - the units the data are stored in. This is determined by the projection.
distance units - The units you want to use for measuring distance and area.
Educator’s Guide to ArcView GIS
14 Measuring

Measuring areas To measure an area: • Choose an appropriate tool from the drawing tools popup
menu. (shown at right) • Draw the shape and read the area on the status bar. For
rectangles, the status bar shows the height and width of the rectangle, for circles the radius, and for polygons the perim-eter. Hold down the shift key to draw squares and circles.
• You can read the area of rectangles and polygons in the status bar by selecting the shape with the pointer tool .
• To delete a drawn shape, select it with the pointer tool and press the delete key.
Measurement accuracyArcView is designed to calculate distances correctly for unprojected data. You can measure distances and areas in projected views, but the accuracy varies with the projection and generally decreases as the view extent increases.
Drawing tools popup menuThe drawing tools popup menu appears when you click and hold the draw point tool on the tool bar:
rectangle tool
ellipse tool
polygon tool
Educator’s Guide to ArcView GIS
Measuring 15

Descriptive information for each feature in a theme is stored in a data-base called an attribute table. Within the table, the data values are arranged in records (rows) and fi elds (columns):
Working with attribute tables
Identifying features in the view window To identify a feature in a view window: • Make the feature’s theme active in the table of contents. • Click on the feature using the identify feature tool . The
attributes for the feature will be displayed in the Identify Results window.
Scroll here to read additional feature attributes, if any.
Click on items in the results list to
view their attri-butes. Scroll the
list to see results for additional fea-
tures, if any.
fi eld names attribute values
Click to clear the results list.
Opening a theme’s attribute table To open a theme’s attribute table: • Make the theme active in the table of contents. • Click the open theme table button .
Field (column) - contains the values of a single attribute for all of the features in the theme.
Value (cell)Record (row) - contains all of the attributes for a single feature.
Scroll bars -scroll to see the rest of the table
drag here to change the column width
Resize box - drag to change the size of the table window.
Educator’s Guide to ArcView GIS
16 Working with attribute tables

Finding features by text attributes
Finding features in View windowsThe fi nd button locates features by name (or other text attribute) and highlights and centers them in the View window.
To fi nd features by name (or other text attribute): • Make the features’ theme active in the table of contents. • Click the fi nd button . • Enter the text you want to fi nd in the Find Text in Attributes
dialog box and click OK. If the text occurs more than once in the table, you must repeat this process until the desired feature is found.
Finding features in Table windowsThe Tables interface also has a fi nd button . This button works the same as in the View window, except that found features are not auto-matically centered in the View window.
Selecting table recordsThere are several ways to select records in a table. In each case, both the selected records in the Table window and the features in the View window will be highlighted yellow.
• In the Table window, by clicking them with the pointer tool . • In the View window, by clicking on features or dragging a rect-
angle around them with the select features tool . • Making a query. (see page 22) • Performing a Select By Theme operation. (see page 24)
Manipulating selected recordsArcView includes additional buttons for manipulating selected records:
Switch Selection To select all of the features that are currently not selected, and deselect the features that are currently selected, click the switch selection button
. This is particularly useful when querying a theme, to get the results that do not meet the query’s selection criteria.
Promote Records Click the promote records button to move all of the selected records to the top of the attribute table. This makes the selected records easier to view.
Educator’s Guide to ArcView GIS
Working with attribute tables 17
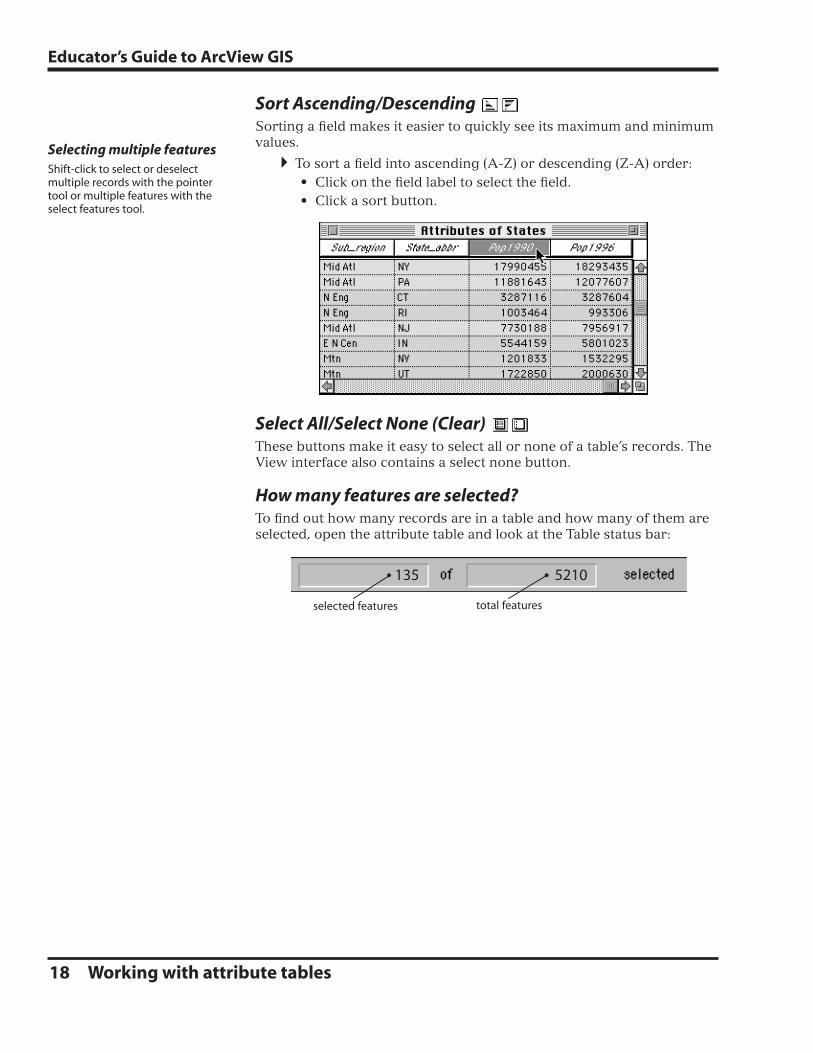
Sort Ascending/Descending Sorting a fi eld makes it easier to quickly see its maximum and minimum values.
To sort a fi eld into ascending (A-Z) or descending (Z-A) order: • Click on the fi eld label to select the fi eld. • Click a sort button.
Select All/Select None (Clear) These buttons make it easy to select all or none of a table’s records. The View interface also contains a select none button.
How many features are selected?To fi nd out how many records are in a table and how many of them are selected, open the attribute table and look at the Table status bar:
Selecting multiple featuresShift-click to select or deselect multiple records with the pointer tool or multiple features with the select features tool.
135 5210
selected features total features
Educator’s Guide to ArcView GIS
18 Working with attribute tables
Editing attribute tablesIf you discover incorrect or outdated information in an attribute table, or want to fi ll in missing attributes, you can edit the table values.
To edit a table: • With the table open, choose Table Start Editing. • Click in the table cell with the edit table tool . • Repeat for additional cells. After editing the last cell, be sure to
press return to accept the last cell value entered. • Choose Table Stop Editing. When prompted to save your
edits, click OK.
Editing features in a viewYou can add new features or edit existing features in a view.
To edit features in a theme: • With the view open, choose Theme Start Editing. • Use the pointer tool to select and move features, and the
vertex edit tool to change their shapes. • When you are fi nished making changes, choose Theme Stop
Editing. When prompted to save your edits, click OK. To add features to a theme: • While in edit mode, use an appropriate drawing tool to draw
the new feature. The tool must match the type of theme—either the point tool, a line tool, or one of the area tools.
• Open the theme’s attribute table and scroll to the bottom record. This is the new record. Enter attribute values as described above.
• Choose either Theme Stop Editing or Table Stop Editing. When prompted to save your edits, click OK.
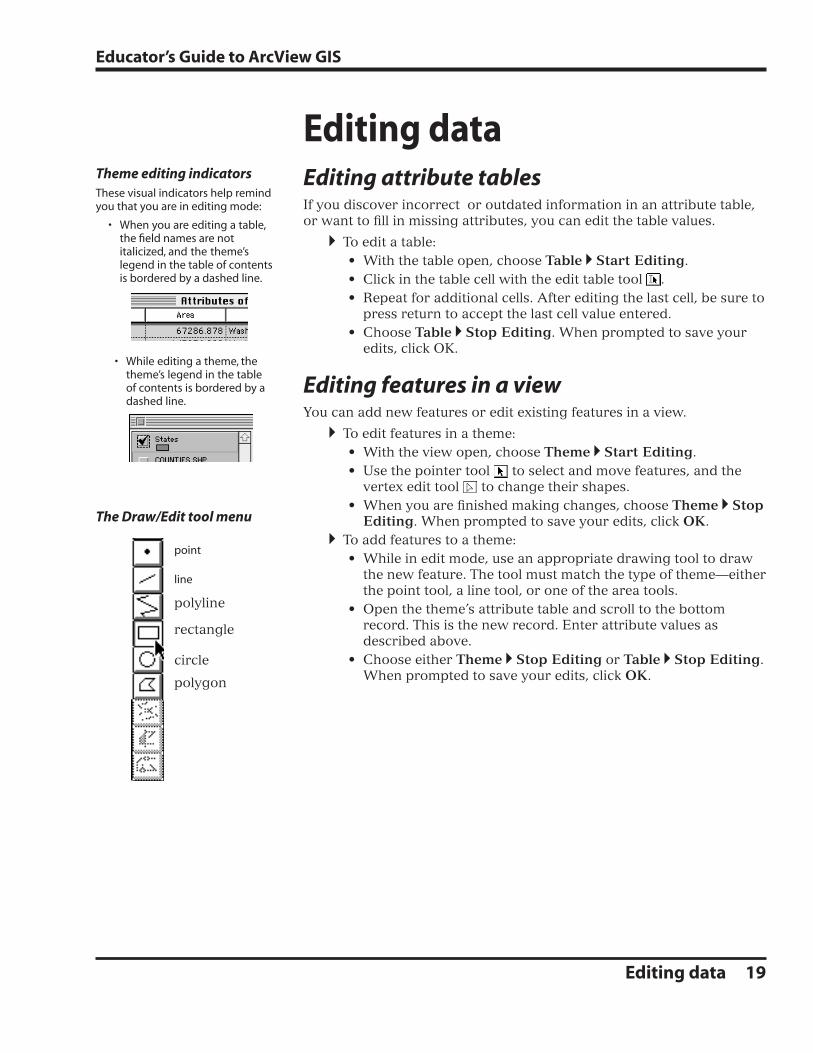
Theme editing indicatorsThese visual indicators help remind you that you are in editing mode:
• When you are editing a table, the fi eld names are not italicized, and the theme’s legend in the table of contents is bordered by a dashed line.
Editing data
The Draw/Edit tool menu
point
line
polyline
rectangle
circle
polygon
• While editing a theme, the theme’s legend in the table of contents is bordered by a dashed line.
Educator’s Guide to ArcView GIS
Editing data 19

A typical use of a GIS is to fi nd features that match certain require-ments. This process is called a query. Designing queries involves logic, and logic uses a special type of mathematics called Boolean mathemat-ics. (see sidebar)
Boolean expressionsSimple queries are Boolean expressions—comparisons of two things using a relational operator. Evaluating an algebraic expression produces a single numerical value; evaluating a Boolean expression produces a single logical value, either TRUE or FALSE.
Boolean operatorsA Boolean or logical operation generally operates on two Boolean expressions and returns a logical value of TRUE or FALSE. Querying selects database records that meet specifi c requirements or criteria.
Sometimes the information you want must meet two or more criteria. You can do this with two or more simple queries, or by making one complex query using logical, or Boolean operators. The three Boolean operators available in ArcView are AND, OR, and NOT.
• AND - selects the features that match both criteria.
Using boolean operationsWho invented Boolean mathematics?Boolean mathematics is named after its inventor, 19th century British mathematician George Boole. It’s a form of logical mathematics where expressions are either TRUE or FALSE.
• OR - selects the features the match either criteria.
• NOT - selects the features that don’t match a given criterion.
A OR B A B
A AND B A B
NOT (A AND B) A B
Educator’s Guide to ArcView GIS
20 Using boolean operations

Set operationsIt’s possible to do quasi-Boolean queries using the Query Builder’s set operation buttons.
• New Set selects all records in the theme that match the criteria.
[Magnitude] >= 5
Result: all earthquakes in the table whose magnitude is greater than or equal to 5.
• Add To Set adds records that satisfy the current query to the set of previously selected records. Add To Set is equivalent to the OR Boolean operation.
[Depth] <= 200
Result: all earthquakes in the table whose magnitudes are greater than or equal to 5 and whose depths are less than 200 kilometers.
• Select From Set refi nes a selection and gets a subset of the previously selected data. Select From Set is equivalent to the AND Boolean operation.
[Location] = “US*”
Result: earthquakes whose magnitudes are greater than or equal to 5, depths are less than 200 kilometers, and that occurred within the United States.
Syntax—grammar for queriesIn ArcView, each table record is evaluated according to the Boolean expression or operation created in the Query Builder and is selected if the record meets the criteria (TRUE) or is excluded if it does not meet the criteria (FALSE).
Queries are written using a set of grammatical rules, called a syntax. The basic syntax for a Boolean expression is:
fi eld name operator value
[Magnitude] >= 6.0
[State] = “Texas”
Field names are enclosed in square brackets, text criteria are enclosed in quotation marks, and numerical criteria are written as decimal numbers without units.
The structure of the Query Builder window also follows this syntax:
Relational operationsRelational operations are used to compare two things. Common relational operators are:
= equal to
<> not equal to
> greater than
>= greater than or equal to
< less than
<= less than or equal to
The result of a query is that both the features that match the criteria are selected (highlighted), both in the view window and the attribute table.
fi eld name relational operator value (double-click) (single-click) (double-click)
set operations
Educator’s Guide to ArcView GIS
Using boolean operations 21

Queries are powerful tools for selecting or displaying the features in a theme that match specifi c requirements, or criteria. Queries are used to investigate problems and answer questions. ArcView provides two types of queries—one for selecting features, and another for fi ltering features.
Selecting featuresA selection query displays all the features in a theme and highlights the features that meet the specifi ed criteria. To make a selection query, click the query builder button .
Set operationsYou can do one of three things with the features selected by a query:
Theme: Earthquakes from 1973 -1999.
New Set highlights all of the features in the entire theme that match the query. For example…
([Magnitude] = 5)
…selects all magnitude 5 earthquakes.
Add To Set combines the features selected by a query to any previously selected features. For example…
([Magnitude] = 6)
…selects magnitude 5 and 6 earthquakes.
Select From Set produces a subset of the selected features. For example…
([Month] = “May”)
…selects magnitude 5 and 6 earthquakes that occurred in the month of May.
Converting selected features to a Shapefi leAfter querying a theme, you can create a new theme containing only the selected features by choosing Theme Convert to Shapefi le.
Unselecting featuresTo unselect features so that they are no longer highlighted, click the clear selected features button in either the view window or the theme table.
Finding features with queries
The basic form of a query is:
Field Name Operation Value Set Operation
To query a theme, turn the question above into an expression using the fi eld names, operations, and values.
• Double-click the Field Name (Magnitude) • Single click the operation (=) • Double-click the Value (5). • Click either New Set, Select from Set, or Add To Set to select
the features that meet your criteria. (see sidebar)
Example“Select the tornados in Arizona that resulted in injuries.”
Before beginning a query, check the Update Values box.
Field Names Operations Values
Set Operations
Result: All tornados are displayed, but injury-causing tornados are highlighted in yellow.
Educator’s Guide to ArcView GIS
22 Finding features with queries

Filtering features (theme table queries)Sometimes a theme has so many features that the view is diffi cult to interpret, or just looks crowded. A fi lter query displays, in the view window, only the features that match the criteria. The features that don’t match the criteria are hidden.
To display all of the features of the theme again, choose Theme Properties, and click the Clear button.
How many features?After querying a theme, the number of features selected is displayed on the status bar. Click the open theme table button to open the active theme’s attribute table.
Spatial QueriesAnother type of query is known as theme-on-theme selection. This allows you to select certain features based on their spatial relationships to features in other themes. This is discussed in the section on Select By Theme on page 24.
The records (table rows) for the features that are selected are also highlighted in yellow. To move all of the selected features to the top of the table, click the promote button
.
For additional information about working with attribute tables, see the section on Tables on page 16.
selected features total features
28 51
Example“Show only the tornados in Ari-zona that resulted in injuries.”
Click here to clear the fi lter and display all features in the theme.
Click here to open the Query Builder window.
Result: Only the injury-causing tornados are displayed in the view and attribute table.
Educator’s Guide to ArcView GIS
Finding features with queries 23

Spatial operationsHere are examples of each type of spatial operation:
“Which lakes and parks are completely within the city limits?” • Active Themes - lakes, parks • Selector Theme - city
boundaries
“Which counties completely contain military bases?” • Active Theme - counties • Selector Theme - military bases
“Which cabins have their center in the national forest?” • Active Theme - cabins • Selector Theme - national forest
“Which school districts contain the center of owl habitats?” • Active Theme - school districts • Selector Theme - owl habitats
“Which parcels of land will the proposed pipeline intersect?” • Active Theme - pipelines • Selector Theme - land parcels
“Which cities are within 100 miles of a national park?” • Active Theme - cities • Selector Theme - national parks
Defi nitions • active themes - the themes
that are active in the current view’s table of contents.
• selector theme - contains the highlighted themes that are used to select features in the active themes.
• selected features - features highlighted in yellow in the View window and in the theme’s attribute table.
Spatial queriesQueries select features according to specifi c criteria. Unfortunately, they work only within a single theme. With ArcView, you can also perform spatial queries between themes. That means you can select features in one or more themes based on their spatial relationship to features in another theme. This is called a theme-on-theme selection. In ArcView, the command that carries out this operation is called Select By Theme.
An exampleLike an attribute query, a spatial query starts with a question:
“Which schools and churches are within 1/2 mile of Central Park?”
To translate this question into a Select by Theme operation: • Use any selection technique to highlight the known feature(s)
in the appropriate theme. [Central Park] • Make the themes containing the features you want to identify
active in the table of contents. (Shift-click on additional themes to activate more than one theme.) [Schools and Churches]
• Choose Theme Select By Theme. • Choose a spatial operation. [Are Within Distance Of] • Choose a selector theme. [City Parks] • Optional - When using Are Within Distance Of, enter a dis-
tance. [0.5 mi] • Click the appropriate set operation button. [New Set]
Using Select By Theme
Visible only when using the Are Within Distance Of operation. Set the distance units in the View Properties dialog box.
Spatial Operation
Selector Theme
Within Distance
setoperationbuttons
Educator’s Guide to ArcView GIS
24 Using Select By Theme

A note on NOTSelecting the features of a theme that do not meet certain criteria—do NOT intersect another theme, or are not within some distance of another theme—takes an added step.
To select the features that do not match your criteria: • Select the features that do meet the criterion using the proce-
dure outlined earlier. • Click the open theme table button to open the active
theme’s attribute table. • Click the switch selection button .
Educator’s Guide to ArcView GIS
Using Select By Theme 25

Creating layoutsA layout is used to present a view, or several views, in a map-like presentation setting, with standard cartographic elements.
Creating automatic layouts To create an automatic layout: • Prepare your map in a view window. • Choose View… Layout and select an appropriate layout
template, and click OK. • You may add, delete, or modify layout elements manually.
Creating custom layouts To make a custom layout: • Select the Layout icon in the Project window and click the
button to create a new layout window. A blank layout page will open with new buttons and tools available.
• The default layout is vertical (portrait format). To make a hori-zontal layout (landscape format), choose File Page Setup….
Elements are added to the layout by creating boxes called frames, and linking them to existing views, tables, charts, or graphics. In addition, you can add standard map features to layouts—legends, scale bars, and north arrows. You can also draw boxes, lines, and other graphic elements directly on layouts.
Editing layoutsThere are other tools that will allow you to edit the appearance of your layout.
• Add text, such as a title to a layout. • Move graphics in front of or behind each other.
Zooming in layoutsThe Layout button bar has several zoom options that are similar in function to the View zoom options.
Frame ToolsThe Frame tools are on a pop-up menu on the Layout tool bar. Use these tools to create frames for views, legends, scale bars, north arrows, tables, and charts to your layout.
To use a frame tool, click and drag to create a rectangular frame on the layout, then choose an existing project element, map feature, or graphic to fi ll the frame.
View Frame Tool Adds a selected view to a
layout.
Legend Tool Adds a legend for a selected
view.
Scale Bar Tool Adds a scale bar for a
selected view.
North Arrow Tool Inserts a North arrow.
Chart Frame Tool Inserts a chart based on one
or more fi elds of a selected theme.
Table Frame Tool Inserts a table from the
selected theme.
Graphic Frame Tool Inserts an imported picture
in a layout.
Educator’s Guide to ArcView GIS
26 Creating layouts