guide to bpg using gm - alberta · 2 1. introduction the use of bridge planning geometry (bpg) tool...
TRANSCRIPT
GuidetoBPGToolApplicationusingGlobalMapperSoftware
Alberta Transportation Bridge Engineering and Water Management Section, Technical Standards Branch, Engineering Services Division Last Updated: December 2012
1
TableofContents 1. Introduction..................................................................................................... 2 2. Walk-Through ................................................................................................. 3 3. Troubleshooting & Tips .................................................................................. 8 4. Sample Screenshots ...................................................................................... 9 5. Sample Figures for Reporting ....................................................................... 12
2
1. Introduction The use of Bridge Planning Geometry (BPG) tool interactively with Global Mapper (GM) software allows for the quick evaluation and 3D visualization of roadway and bridge opening alternatives during the bridge planning phase of a project. These tools can be used for a variety of project types from the Functional Planning Study level to DD drawing development. This guide provides a walk-through of setting up GM and BPG files for Alberta Transportation bridge projects. BPG.xls is a VBA code based tool developed in Excel by the department. It is available for download from AT’s bridge planning website: http://www.transportation.alberta.ca/4869.htm. Global Mapper is a GIS Software used by AT. A free trial version, along with purchase options, is available from the Blue Marble Geographic’s website: http://www.bluemarblegeo.com/global-mapper/. Note that the trial version has limited functionality (including the inability to export data and lack of 3D visualization). Tools required
Global Mapper (or other GIS platform) Bridge Planning Geometry Software (BPG.xls)
Data required
Digital Elevation Model (DEM); sources include LiDAR, survey data, and photogrammetry Satellite and/or air photo Stream layer (optional) Cadastral layer (optional)
Design Parameters
Roadway design parameters: refer to most recent version of Highway Geometric Design Guidelines (HGDG) and/or Roadside Design Guide and/or Design Bulletins
Hydrotechnical design parameters: refer to most recent version of Hydrotechnical Design Guidelines and/or recent Best Practice Guidelines
Notes: - While this guide focuses on the use of BPG with Global Mapper, similar functionality is available with other GIS software, such as ArcGIS. - This guide is based on Global Mapper version 13.0, newer or older versions may differ slightly. - A quick reference guide for BPG is available in the ‘Instructions’ tab within the tool. Comments are also provided for the majority of input cells. - A guide to GIS data sets available for consultant use, including data sources, is available on the AT website (http://www.transportation.alberta.ca/4869.htm). - A PowerPoint Presentation of Conceptual Design using BPG is available on the AT website (http://www.transportation.alberta.ca/PlanningTools/Tools/Planning/Illustrated%20Guide%20to%20Bridge%20Conceptual%20Design.pdf) - Global Mapper help, including tutorials and forums, can be found online at: http://www.globalmapperforum.com/
3
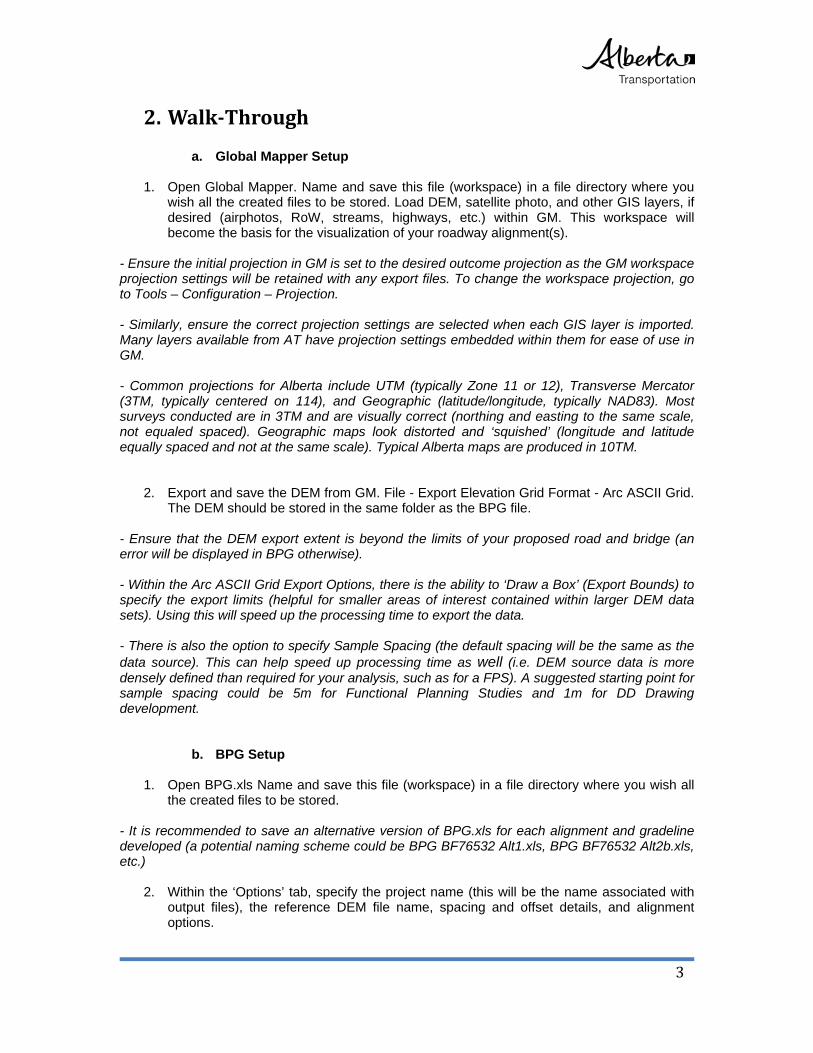
2. Walk‐Through
a. Global Mapper Setup
1. Open Global Mapper. Name and save this file (workspace) in a file directory where you wish all the created files to be stored. Load DEM, satellite photo, and other GIS layers, if desired (airphotos, RoW, streams, highways, etc.) within GM. This workspace will become the basis for the visualization of your roadway alignment(s).
- Ensure the initial projection in GM is set to the desired outcome projection as the GM workspace projection settings will be retained with any export files. To change the workspace projection, go to Tools – Configuration – Projection. - Similarly, ensure the correct projection settings are selected when each GIS layer is imported. Many layers available from AT have projection settings embedded within them for ease of use in GM. - Common projections for Alberta include UTM (typically Zone 11 or 12), Transverse Mercator (3TM, typically centered on 114), and Geographic (latitude/longitude, typically NAD83). Most surveys conducted are in 3TM and are visually correct (northing and easting to the same scale, not equaled spaced). Geographic maps look distorted and ‘squished’ (longitude and latitude equally spaced and not at the same scale). Typical Alberta maps are produced in 10TM.
2. Export and save the DEM from GM. File - Export Elevation Grid Format - Arc ASCII Grid. The DEM should be stored in the same folder as the BPG file.
- Ensure that the DEM export extent is beyond the limits of your proposed road and bridge (an error will be displayed in BPG otherwise). - Within the Arc ASCII Grid Export Options, there is the ability to ‘Draw a Box’ (Export Bounds) to specify the export limits (helpful for smaller areas of interest contained within larger DEM data sets). Using this will speed up the processing time to export the data. - There is also the option to specify Sample Spacing (the default spacing will be the same as the data source). This can help speed up processing time as well (i.e. DEM source data is more densely defined than required for your analysis, such as for a FPS). A suggested starting point for sample spacing could be 5m for Functional Planning Studies and 1m for DD Drawing development.
b. BPG Setup
1. Open BPG.xls Name and save this file (workspace) in a file directory where you wish all the created files to be stored.
- It is recommended to save an alternative version of BPG.xls for each alignment and gradeline developed (a potential naming scheme could be BPG BF76532 Alt1.xls, BPG BF76532 Alt2b.xls, etc.)
2. Within the ‘Options’ tab, specify the project name (this will be the name associated with output files), the reference DEM file name, spacing and offset details, and alignment options.
4
c. Horizontal Alignment
1. Draw preliminary roadway alignment lines in GM. The vertices of these working lines will become your roadway PI’s and are the only input parameters required in BPG.
- Using the Digitizer Tool , right click: Create New Line Feature (Vertex Mode), left click to add points to the line, right click to end the operation. - Within the Digitizer Tool, you may select multiple lines (crtl+left mouse click) and right click: Insert Vertices at Intersections of Selected Features. - To display vertices in GM, use the shortcut Shift + V. - Double clicking on the line with the digitizer tool in GM and clicking the ‘vertices’ button displays attribute data (northing, easting). Alternatively, specific vertex details can be viewed (and edited) by selecting with the digitizer, right clicking – set position of selected vertices.
- Within the right click menu, there is an option to move a selected vertex (helpful for matching an existing alignment. - A line drawn in GM can be exported to a text file (File – Export Vector Format) and vertex data can be copy/pasted into the BPG tool.
2. In BPG, on the ‘Alignment’ sheet, enter Northing, Easting values for points that make up the tangent PIs for the horizontal alignment and assign a station value to the first point (either generic or specific).
- Stationing values will increase from the initial start value entered in the order of the PI’s entered
. - The number of PIs entered is not limited; the code continues to read rows until a blank one is reached.
3. Enter horizontal Radii (and spiral A, if desired, otherwise calculated) values for curves between each adjacent PI. Pressing the "GO" button will generate Centerline data. The horizontal alignment will be calculated with points added to the Align Data sheet and e and Delta values calculated. Three files will be exported (Pts - Horizontal curve transition points, CL - centerline of alignment, and STA - points for marking stations along alignment). Additional files will be created for any offset values entered. These files will be stored in the same directory as the BPG file.
- R, A values should be checked against design standards in the HGDG and relevant Design Bulletins. - Superelevation rates are obtained from a lookup table (Chapter B, HGDG) - If a runtime error is obtained, troubleshooting includes checking that each PI is unique, ensuring that there are no blanks lines between PIs (code stops reading once a blank line is reached), and ensuring that the DEM file name specified in the options tab is identical to the one created during export. - There currently is not the ability to specify a straight portion between two PI’s (i.e. spot replacement on a tangential alignment). A workaround solution is to enter a very large radius or extend the project limits to include a curve.
5
4. The exported files can be dragged into GM for visualization (drag and drop). The
horizontal alignment process can be repeated for various options (PI locations changed, R, A values entered, design speeds etc.).
- The projection settings for the exported files are stored within the files. Visual changes (color, linetype, etc.) can be made within the Options button in the GM Overlay Control Center (Alt + C).
d. Vertical Profile
1. In BPG, on the ‘Profile’ sheet, enter Station (STA) and Elevation (EL) values for VPI points. Enter length of vertical curve, as necessary. Enter stations of interest for additional elevation calculations. Press "GO" button. A file showing the BVC, EVC points (VC – vertical curve) will be exported
- Initial VPI values can be obtained by browsing the "Profile Plot" which will show the ground elevations for the current alignment. Hovering the mouse pointer over a point in Excel displays the x,y values (station and elevation values in the Profile Plot). - Rows contained VPI points can be added or deleted (code will read rows sequentially until a blank row is found). - Sag/crest K values and grades should be checked against the appropriate design standards in the HGDG and relevant Design Bulletins.
2. A plot of the profile will appear on the ‘Profile Plot’ sheet. VPI points can be changed
graphically from the ‘Profile Plot’ (if readily visible and clear of other plot items, in versions prior to Excel 2007) and manually in the ‘Profile’ sheet.
- Data contained within the profile plot can be used in reports and/or CAD drawings. - The Centerline ground and SOD lines are extracted from the DEM.
3. The vertical profile process can be repeated for various options (different grades, VPI’s, etc.).
e. Bridge Details
1. In BPG, on the ‘Bridge’ sheet, enter the data required to define the bridge opening and protection works. Press the "GO" button.
- Details pertaining to each input parameter are included as comments while protection definition sketches are included on the ‘Instructions’ tab. - Hitting GO in this tab will reactivate the alignment and profile tab (step through not required). - In some cases, it may be desirable to work from the toe up to the gradeline. In this section, enter the station and elevation of toe points on both sides of the opening, and the stations of the points where the headslope lines will intersect with the current gradeline will be calculated and presented (current headslope, berm, and skew data will be used). These values can then be rounded and entered in the top of fill station cells, and the bridge calculations re-run.
6
2. A plot of the bridge opening will show on the "Bridge Elevation Plot" sheet and a CSV file
with the data necessary to plot this view in other software (such as CAD via Global Mapper), is exported with the name appended with "Bridge Elevation Data". Export files of the plan view of protection works (headslope protection works, ‘HS RPW’; or guidebank, ‘GB RPW’) for each bank are exported.
3. 3D versions of the protection works, with filename appended with "3D" are also exported
to facilitate viewing in Global Mapper.
4. The “Bridge” sheet also contains 3D structure view options. Enter some basic likely bridge configuration data (spans, structure depth etc.) and click on "3D Bridge". This will result in an export file appended with "Bridge 3D" that will allow for 3D viewing of the bridge in Global Mapper. An outline of the bridge will be shown on the "Structure Outline Plot" tab.
- If no configuration data is entered, assumed values based on the out to out of fills length will be used (assumed values are reported under "Calc Values").
5. The exported files can be dragged into GM for visualization (drag and drop). The 3D bridge process can be repeated for various options (out-to-out lengths, headslope configuration, etc.).
- Minimum deck grades, ensuring spirals are not within the runout length of the bridge deck, bridge rail sight distances, deck drainage, freeboard, and flow constrictions are some of the conditions which should be checked during this stage.
f. Roadway Cross Section
1. In BPG, on the ‘XS’ tab, enter road design parameters to be used in grading volume and cross-section calculations.
2. Entering a STA value and clicking the "Go XS" button will result in the road cross section
plot, ‘XS Plot’ tab, being updated, as well as a few parameters for the XS being presented.
3. Entering starting (STA1) and ending (STA2) station values and clicking the "Go Vol"
button will return volumes of cut and fill between these stations, as well as provide more detailed calculations on the "Vol Calcs" sheet.
4. Clicking the "Make Grading Limits File" button will export vector files for grading limits for
both the road and bridge (based on standard elliptical bridge fills, as per AT’s Specifications for Bridge Construction) on both sides of the river (file name appended with "Grading Limit Near" and "Grading Limit Far"). The area shapes that result in GM can be used for cropping the 3D points files.
5. Clicking the "Make 3D Road Vector File" button will export files (appended with "Road
3D Near" and Road 3D Far") with many area shapes that make up the road and bridge fills that will facilitate 3D viewing of the road and bridge grading in GM.
6. Clicking the "Make 3D Road Pts File" button will export a file with many points on a tight
spacing for both the road and bridge on both sides of the river (file name appended with "Road Surface Near" and "Road Surface Far").
7
- These files can be used to make a 3D surface (DEM) in GM for viewing and cross section checking (select Grading Limit area shape using the digitizer tool, drag and drop road surface file (open as points only, 3rd coordinate as elevation), right click new layer and select "Create Elevation Grid", select "Crop to Selected Area" under Grid Bounds). - 3D surfaces can be edited (color, transparency) in GM through the Options button in the Control Center. The 3D tool in GM can be used along with screenshots for report preparation.
7. The Roadway Cross Section process can be repeated for various options (road width, ditch parameters, etc.).
8
3. Troubleshooting&Tips
Ensure the extents of the DEM cover the extents of your projects (road, SOD lines, fill extents, etc.)
Berm elevation within the ‘Bridge’ tab must be a specified (numeric) value, even
if the berm width is set to zero.
Ensure a constant projection is used when importing/exporting files.
Ensure horizontal curves (may have to modify PIs, curve radii) or vertical curves are not overlapping (may have to modify VPIs, curve lengths).
For volume calculations, ensure stationing lies within your project extents.
VPI graphical drag and drop function is not supported by newer (2007 and 2010)
versions of Excel (manual input is required, with mouse hovering to obtain values).
If you obtain an error and enter into ‘debug’ mode, this pauses the code. To
restart the code, click on reset (looks like a stop button) within the debug window.
Ensure Macros are enabled within BPG and set to a medium or higher security level (Tools – Options – Security – Macro Security). This may require closing the file and reopening.
The Profile Plot, Bridge Elevation Plots, and Site Plan (exported via Global
Mapper) can be used as starting points for DD drawings.
9
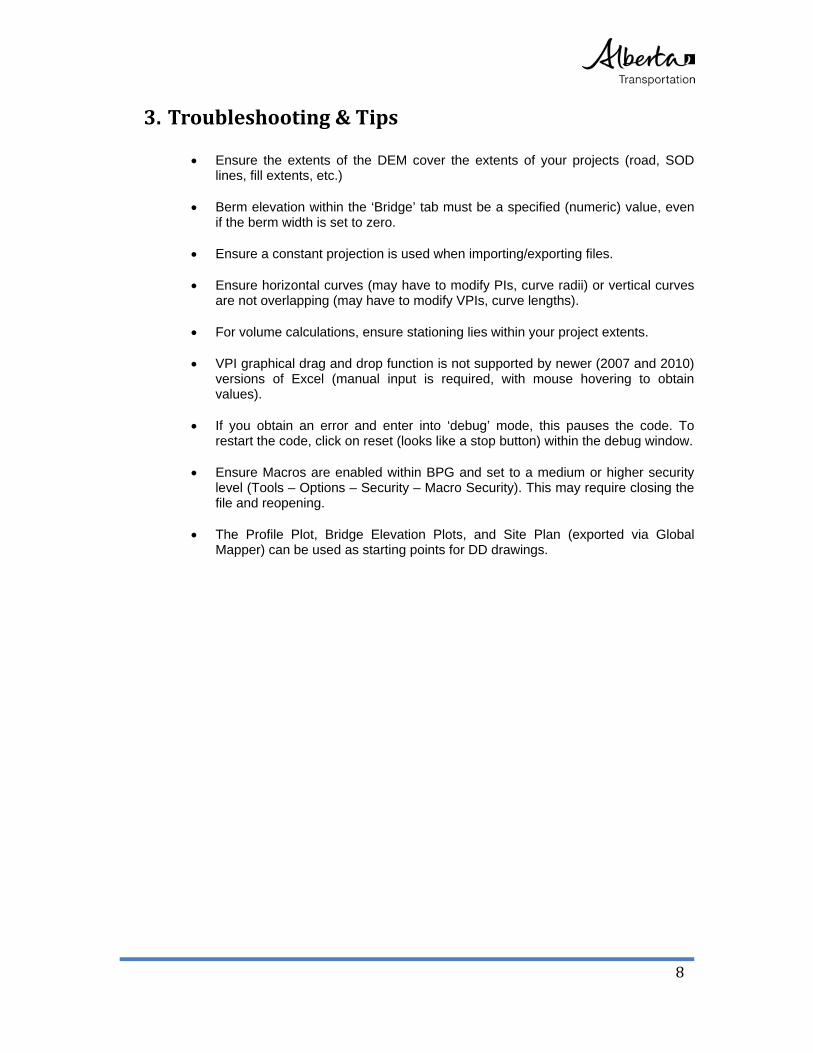
4. SampleScreenshots
Global Mapper showing satellite layer, stream layer, and bridge files layers
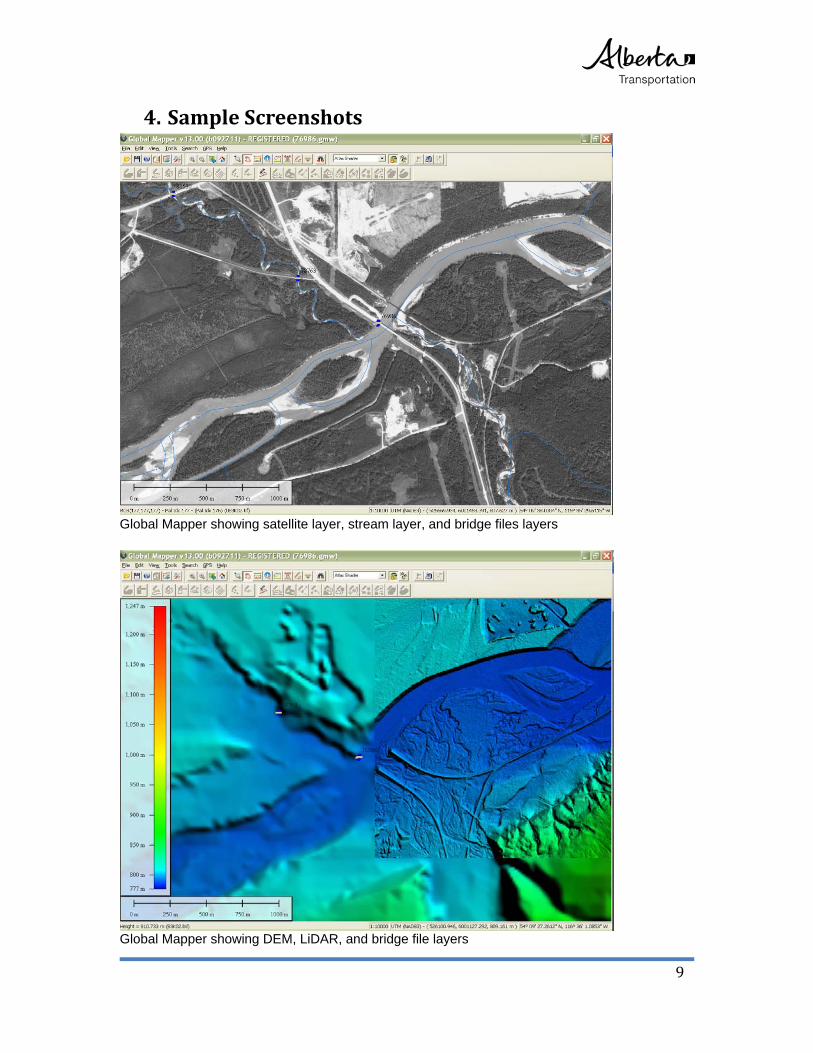
Global Mapper showing DEM, LiDAR, and bridge file layers
10
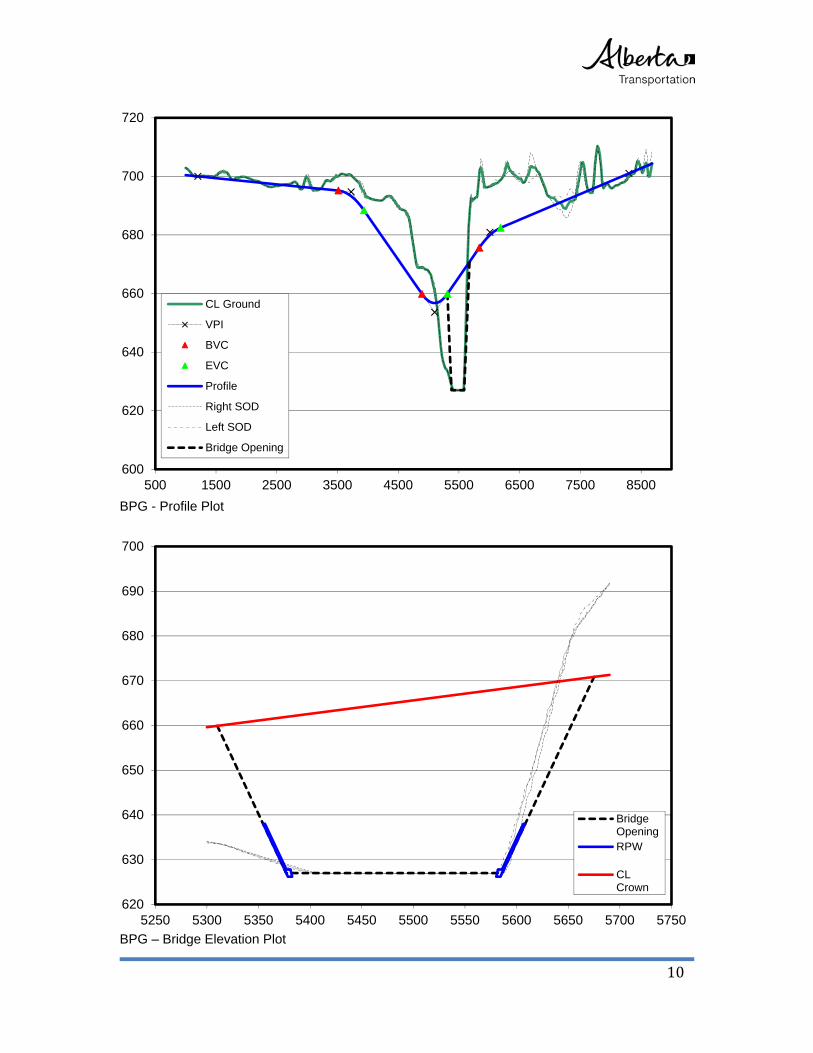
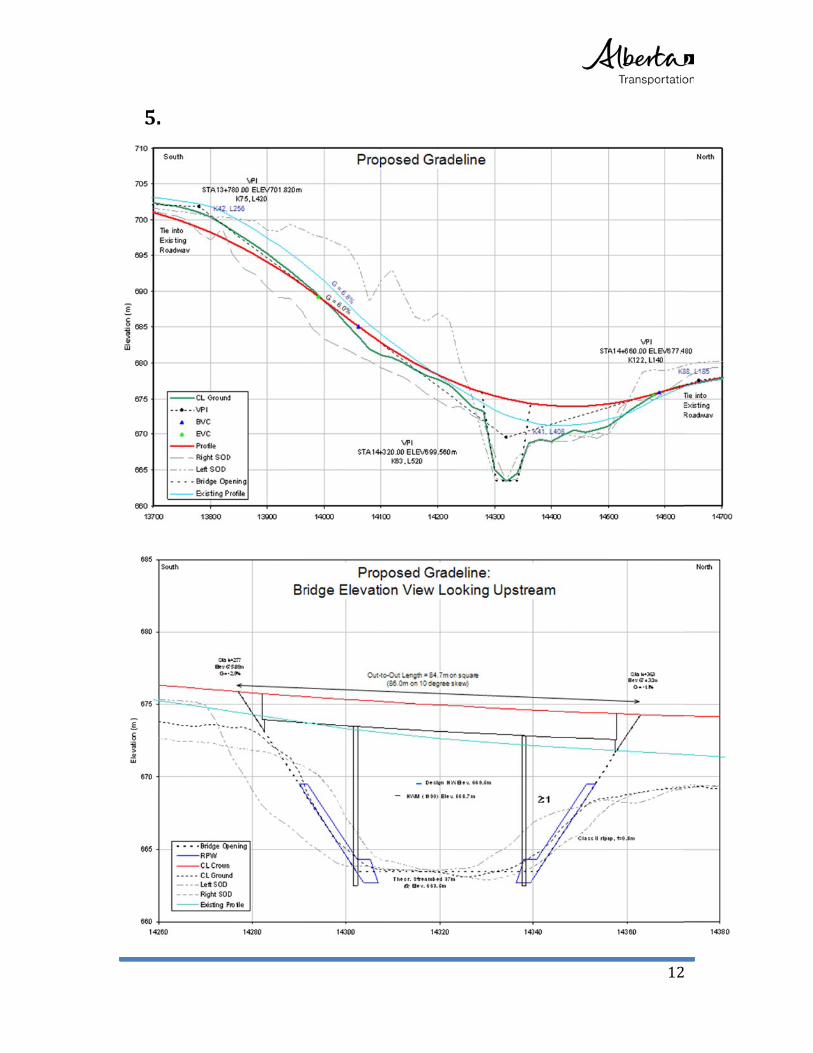
BPG - Profile Plot
BPG – Bridge Elevation Plot
600
620
640
660
680
700
720
500 1500 2500 3500 4500 5500 6500 7500 8500
CL Ground
VPI
BVC
EVC
Profile
Right SOD
Left SOD
Bridge Opening
620
630
640
650
660
670
680
690
700
5250 5300 5350 5400 5450 5500 5550 5600 5650 5700 5750
BridgeOpeningRPW
CLCrown
11
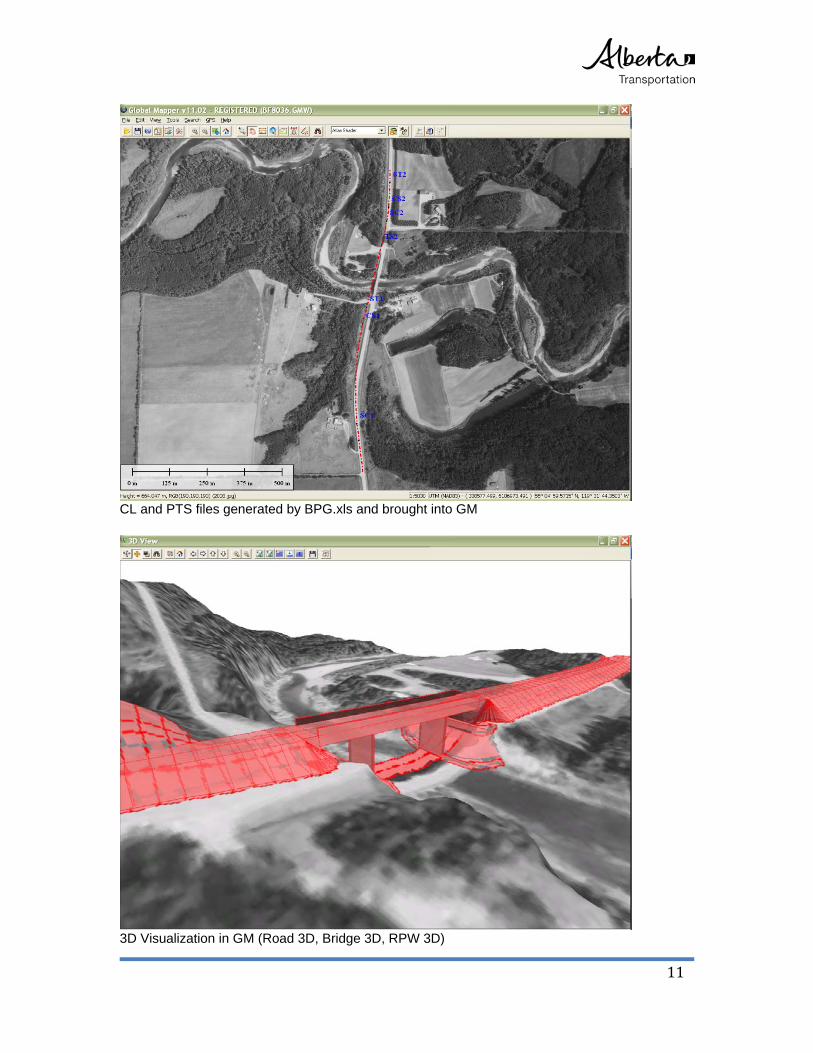
CL and PTS files generated by BPG.xls and brought into GM
3D Visualization in GM (Road 3D, Bridge 3D, RPW 3D)
5
5.
12
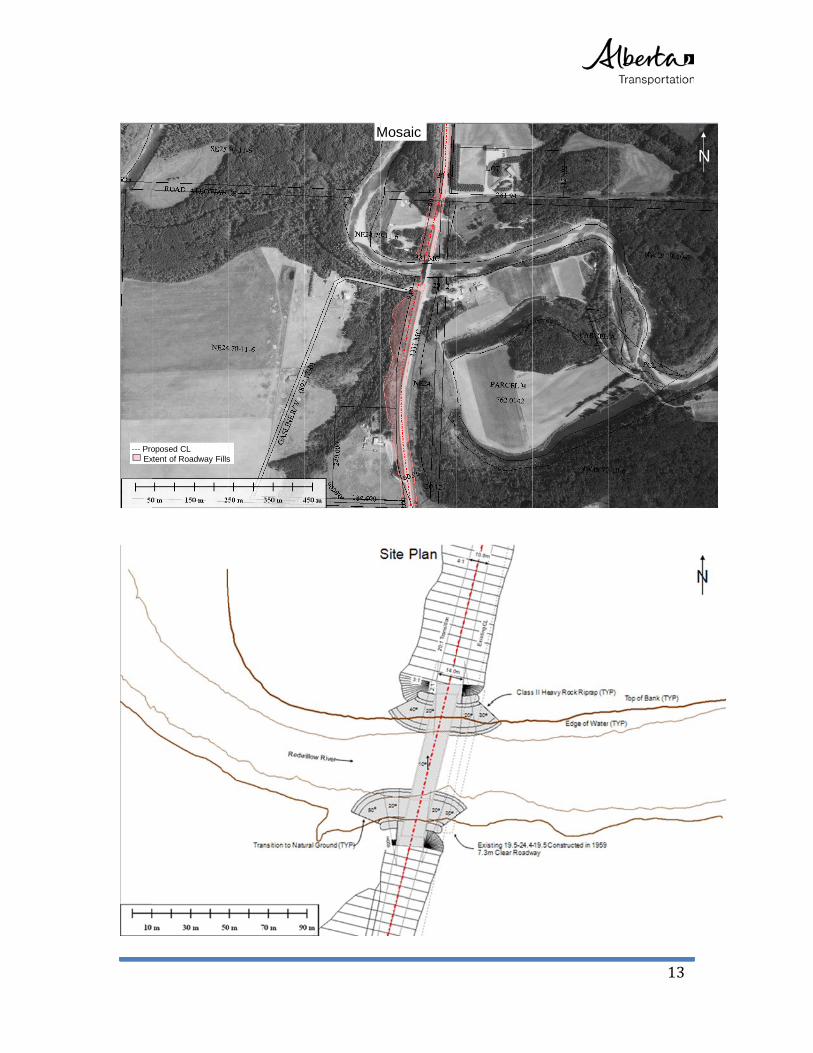
--- ProEx
oposed CLxtent of Roadway Fillss
MMosaic
13
N