guide to report builder - valiant · overview report builder 1 this document contains information...
TRANSCRIPT

Guide to
Report Builder

List of Revisions
Report Builder ii <CONFIDENTIAL> This document contains information proprietary to Valiant, and may not be reproduced, disclosed or used in whole or part without the express written permission of Valiant. Copyright © 2007 Valiant Solutions, Inc. All Rights Reserved.
Date Rev. Description By
8/31/2007 0 Initial draft RAdams

Table of Contents
Report Builder iii <CONFIDENTIAL> This document contains information proprietary to Valiant, and may not be reproduced, disclosed or used in whole or part without the express written permission of Valiant. Copyright © 2007 Valiant Solutions, Inc. All Rights Reserved.
1. Overview .................................................................................................1
1.1 SYSTEM REQUIREMENTS ........................................................................................... 1 1.2 SECURITY CONSIDERATIONS...................................................................................... 1
2. Accessing the Report Builder...............................................................2
3. Run Existing Report...............................................................................3
4. Create New Report .................................................................................4
5. Report Layout.........................................................................................6
5.1 TABLE LAYOUT......................................................................................................... 6 5.2 MATRIX LAYOUT ....................................................................................................... 7 5.3 CHART LAYOUT ........................................................................................................ 9
5.3.1 Chart Data ..................................................................................................................10 5.3.1.1 Category Group..................................................................................................................10 5.3.1.2 Value Group........................................................................................................................11 5.3.1.3 Series Group.......................................................................................................................12
6. Working with Data................................................................................13
6.1 VALIANT SCHEMA ................................................................................................... 13 6.1.1 Valiant Entities...........................................................................................................14
6.2 VALIANT DATA ....................................................................................................... 15 6.3 GROUPING AND SORTING DATA ............................................................................... 16
6.3.1 Grouping Data ...........................................................................................................16 6.3.2 Sorting Data ...............................................................................................................17
6.4 WORKING WITH FORMULAS ..................................................................................... 18 6.4.1 References .................................................................................................................19 6.4.2 Functions ...................................................................................................................19 6.4.3 Literals........................................................................................................................19 6.4.4 Operators ...................................................................................................................20
6.5 CONSTANTS ........................................................................................................... 20 6.6 CREATING A NEW FIELD.......................................................................................... 20
7. Working with Filters.............................................................................22
7.1 ADDING FILTER CONDITIONS ................................................................................... 22 7.1.1 Logical Operators......................................................................................................23 7.1.2 Filtering On Formulas ...............................................................................................23 7.1.3 Prompting for Filter Values ......................................................................................24 7.1.4 Selecting a Comparison Operator for a Filter Condition .......................................24 7.1.5 Filtering Empty or Blank Values ..............................................................................25 7.1.6 Relative Date Ranges................................................................................................25 7.1.7 Relative Date Values .................................................................................................26
7.2 SPECIFYING CRITERIA IN A LIST ............................................................................... 27 7.2.1 Creating a Pre-Filtered List.......................................................................................28
7.3 GROUPING FILTER CONDITIONS ............................................................................... 28

Table of Contents
Report Builder iv <CONFIDENTIAL> This document contains information proprietary to Valiant, and may not be reproduced, disclosed or used in whole or part without the express written permission of Valiant. Copyright © 2007 Valiant Solutions, Inc. All Rights Reserved.
8. Formatting a Report.............................................................................30
8.1 TEXT BOXES .......................................................................................................... 30 8.1.1 Title .............................................................................................................................30 8.1.2 Total Rows .................................................................................................................30 8.1.3 Filter description .......................................................................................................30
8.2 NUMERICAL DATA................................................................................................... 31 8.2.1 Using Decimals..........................................................................................................31 8.2.2 Adding a Thousand Separator .................................................................................31 8.2.3 Indicating a Monetary Value.....................................................................................31 8.2.4 Formatting Negative Numbers .................................................................................31
8.3 ALIGNING DATA, TEXT, AND IMAGES ........................................................................ 31 8.4 FORMATTING DATA, TEXT, AND IMAGES ................................................................... 31 8.5 FORMATTING BORDERS, LINES, AND GRIDLINES ....................................................... 32 8.6 APPLYING BACKGROUND COLORS........................................................................... 32
9. Running a Report .................................................................................33
9.1 WORKING WITH A REPORT IN RUN MODE.................................................................. 33 9.1.1 Viewing Report Contents..........................................................................................33 9.1.2 Refining the Report ...................................................................................................33
10. Saving a Report..................................................................................35
11. Exporting a Report as a Different File Type ....................................36
11.1 EXPORT TO CSV .................................................................................................. 36 11.2 EXPORT TO MICROSOFT EXCEL ............................................................................. 37
11.2.1 Limitations ...............................................................................................................37 11.2.2 Page Layout .............................................................................................................38
11.3 EXPORT TO PDF................................................................................................... 38 11.3.1 Fonts.........................................................................................................................38 11.3.2 Images ......................................................................................................................38

List of Figures
Report Builder v <CONFIDENTIAL> This document contains information proprietary to Valiant, and may not be reproduced, disclosed or used in whole or part without the express written permission of Valiant. Copyright © 2007 Valiant Solutions, Inc. All Rights Reserved.
Figure 2-1. Valiant Applications Page...........................................................................................................2 Figure 3-1. Open File Menus ........................................................................................................................3 Figure 4-1. New Report Menus.....................................................................................................................4 Figure 4-2. Design Report Page ...................................................................................................................4 Figure 4-3. Design Report – Explorer Pane..................................................................................................5 Figure 5-1. Table Layout ...............................................................................................................................6 Figure 5-2. Matrix Layout ..............................................................................................................................7 Figure 5-2. Chart Options..............................................................................................................................9

List of Tables
Report Builder vi <CONFIDENTIAL> This document contains information proprietary to Valiant, and may not be reproduced, disclosed or used in whole or part without the express written permission of Valiant. Copyright © 2007 Valiant Solutions, Inc. All Rights Reserved.
Table 1-1. System Requirements ................................................................................................................1 Table 6-1. Vision Table Notes....................................................................................................................13 Table 6-2. Vault Table Notes .....................................................................................................................13 Table 6-1. Field Types ...............................................................................................................................15 Table 6-2. Literal Symbols .........................................................................................................................19 Table 7-1. Relative Date Range Operators................................................................................................25 Table 7-2. Relative Date Value Operators .................................................................................................27 Table 11-1. CSV File Considerations.........................................................................................................37

Overview
Report Builder 1 <CONFIDENTIAL> This document contains information proprietary to Valiant, and may not be reproduced, disclosed or used in whole or part without the express written permission of Valiant. Copyright © 2007 Valiant Solutions, Inc. All Rights Reserved.
1. Overview Report Builder is a user application that allows you to create your own ad hoc reports using your existing corporate data. Whereas users of the old Valiant Report Writer needed to possess at least an intermediate level of familiarity with Access and the creation of SQL-based queries to create reports, all Report Builder requires is familiarity with the Valiant application’s “masters” and field names used in normal, every day operations. Report Builder supports three main types of reports: tables, matrixes, or charts. Creating a report consists simply of dragging the desired data fields into the design page. There, you can add filters, formulas for calculations, sorting, and format criteria. After the design phase, run your new report instantly. You can then modify it or save it as is, export to a different file type such as .csv, pdf, etc., and publish it for use by others in your organization.
1.1 System Requirements Requirements for running Report Builder are listed in the table below.
Table 1-1. System Requirements
Item Description
“Workstation” Class PC Microsoft Windows XP or later
Web browser
Internet connection
Citrix Login Access to Valiant’s ASP servers
Application Login Access to Vision/Vault
1.2 Security Considerations Unlike the Valiant Report Writer product, which required a separate “superuser” account to create and define access for authorized users, access to corporate data by Report Builder is controlled by the user’s existing permissions in Vault/Vision. In other words, if a user can view or edit certain data in the Vault or Vision application, they can access that same data in Report Builder.
Accessing The Report Builder
Report Builder 2 <CONFIDENTIAL> This document contains information proprietary to Valiant, and may not be reproduced, disclosed or used in whole or part without the express written permission of Valiant. Copyright © 2007 Valiant Solutions, Inc. All Rights Reserved.
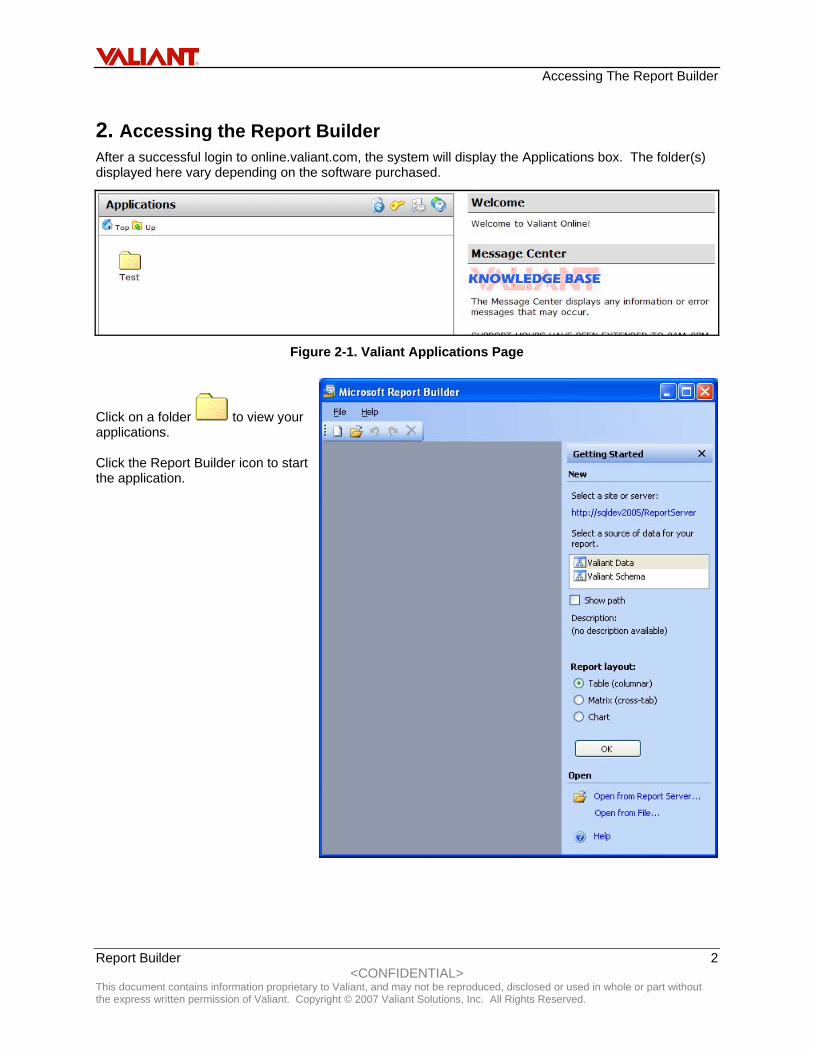
2. Accessing the Report Builder After a successful login to online.valiant.com, the system will display the Applications box. The folder(s) displayed here vary depending on the software purchased.
Figure 2-1. Valiant Applications Page
Click on a folder to view your applications. Click the Report Builder icon to start the application.

Run Existing Report
Report Builder 3 <CONFIDENTIAL> This document contains information proprietary to Valiant, and may not be reproduced, disclosed or used in whole or part without the express written permission of Valiant. Copyright © 2007 Valiant Solutions, Inc. All Rights Reserved.
3. Run Existing Report Reports are stored on the Valiant Report Server and accessible from the File menu, toolbar, or Getting Started pane.
File Menu Toolbar Getting Started Pane
Figure 3-1. Open File Menus To access a report, click on one of the “Open” options above. The system will display the File Explorer window from which you can select the desired report.
If you do not have the required permissions to access a report, or there are no reports available, the system displays an appropriate message.
Once you select the desired report,
click on the Report Builder toolbar. The results are displayed in the Report Builder run mode window.

Create New Report
Report Builder 4 <CONFIDENTIAL> This document contains information proprietary to Valiant, and may not be reproduced, disclosed or used in whole or part without the express written permission of Valiant. Copyright © 2007 Valiant Solutions, Inc. All Rights Reserved.
4. Create New Report Reports are stored on the Valiant Report Server and accessible from the File menu, toolbar, or Getting Started pane.
File Menu Toolbar Getting Started Pane
Figure 4-1. New Report Menus When using one of the “New” options above, the system displays the Design Report page and the Getting Started pane.
Figure 4-2. Design Report Page
Step 2 You must select a Data Source for the report.
Step 1 You must select a Report Layout.

Create New Report
Report Builder 5 <CONFIDENTIAL> This document contains information proprietary to Valiant, and may not be reproduced, disclosed or used in whole or part without the express written permission of Valiant. Copyright © 2007 Valiant Solutions, Inc. All Rights Reserved.
If you double-click the desired Data Source in the Getting Started pane first, without using the “new” dialog, the system displays the Design Report page and lists the entities and fields available from the selected source in the Explorer pane.
Note Before creating a new report via the Data Source selection, review the Report layout selection to ensure the desired report format is created.
Please see the next section for a description of the available layouts.
Figure 4-3. Design Report – Explorer Pane
Create New Report
Report Builder 6 <CONFIDENTIAL> This document contains information proprietary to Valiant, and may not be reproduced, disclosed or used in whole or part without the express written permission of Valiant. Copyright © 2007 Valiant Solutions, Inc. All Rights Reserved.
5. Report Layout Report Builder has three predefined report layouts from which to choose: table, matrix, and chart. Each report layout provides an organizational structure that determines how your data is presented within the report. Before selecting a report layout, you should consider the data that you are using and the purpose of the report. To choose a report layout, select the Table, Matrix, or Chart option in the Getting Started pane. Then, you can begin to add data and text boxes to the layout.
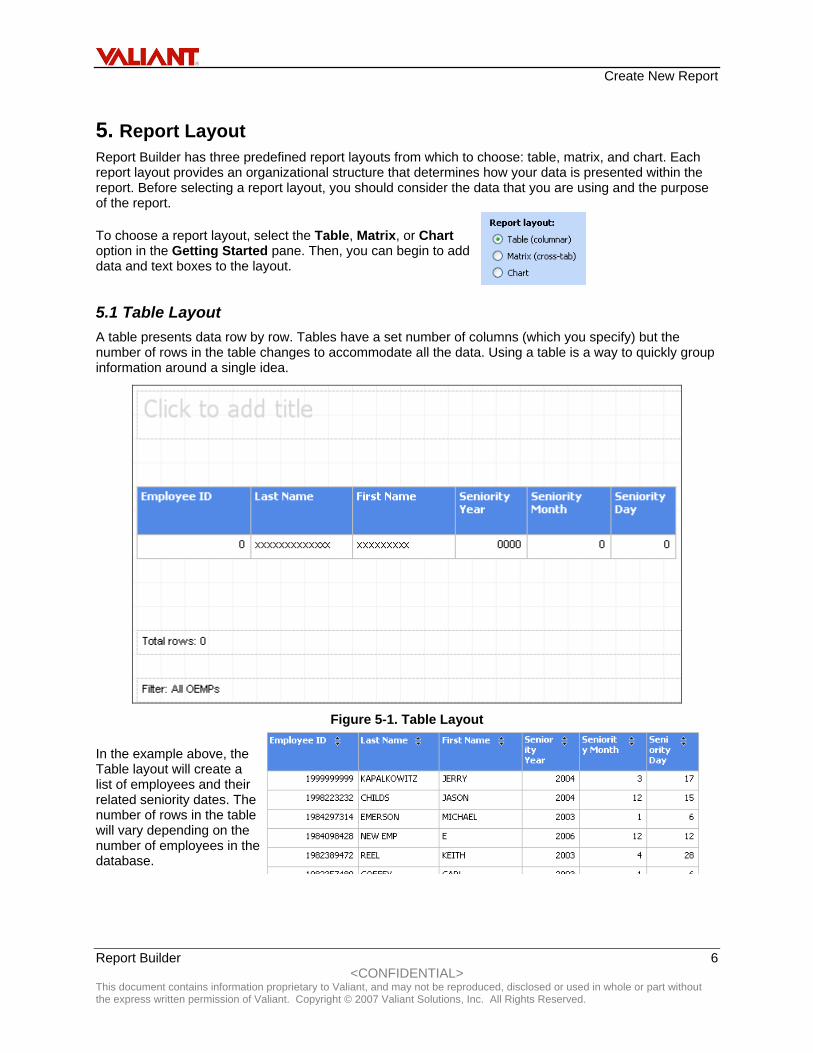
5.1 Table Layout A table presents data row by row. Tables have a set number of columns (which you specify) but the number of rows in the table changes to accommodate all the data. Using a table is a way to quickly group information around a single idea.
Figure 5-1. Table Layout
In the example above, the Table layout will create a list of employees and their related seniority dates. The number of rows in the table will vary depending on the number of employees in the database.

Create New Report
Report Builder 7 <CONFIDENTIAL> This document contains information proprietary to Valiant, and may not be reproduced, disclosed or used in whole or part without the express written permission of Valiant. Copyright © 2007 Valiant Solutions, Inc. All Rights Reserved.
5.2 Matrix Layout In a matrix report, data is arranged into columns and rows. The number of rows and the number of columns changes in a matrix report depending on the data returned. A matrix can have dynamic columns and rows and static columns and rows. Matrices provide functionality similar to cross-tabs and pivot tables. When the report runs, dynamic columns expand across the page for as many columns as there are groups. Dynamic rows expand down the page. The data that appear in the report are summary values of data based on the intersections of columns and rows. For example, suppose you want to create a report that displays the quarterly sales for the past year for customers in the Northwest sales territory. You would probably add the following fields to your matrix design: Territory, Customer Name, Ship Year, and Sum Total Due. To return just the data for the Northwest Territory, you would also need to apply a filter. Your report layout design looks similar to the following image.
Figure 5-2. Matrix Layout When you run this report, it looks similar to the following image.
You can add multiple dynamic columns and rows to your matrix report. Dynamic columns and rows are used to group data by field. When you add a new dynamic column or row, the new header is nested within the original header. When you run the report, the new header is repeated within the original header. For example, suppose the Ship Quarter field is added to the matrix report in the previous

Create New Report
Report Builder 8 <CONFIDENTIAL> This document contains information proprietary to Valiant, and may not be reproduced, disclosed or used in whole or part without the express written permission of Valiant. Copyright © 2007 Valiant Solutions, Inc. All Rights Reserved.
example. When the report is run, four quarter columns are nested below each year column similar to the following image.

Create New Report
Report Builder 9 <CONFIDENTIAL> This document contains information proprietary to Valiant, and may not be reproduced, disclosed or used in whole or part without the express written permission of Valiant. Copyright © 2007 Valiant Solutions, Inc. All Rights Reserved.
5.3 Chart Layout A chart is a graphical representation of the data in a report. Displaying data as a chart is visually appealing and makes it easy for users to see comparisons, patterns, and trends in the data. In Report Builder, you can select from a variety of chart types and change a chart's style to include different colors, symbols, and three dimensional (3-D) effects. Report Builder supports the following chart types: area, bar, column, doughnut, line, and pie. Selecting Chart as the Report layout displays a typical bar chart by default.
To change the Chart type, right-click on the Chart to display the Chart Type menu.
You may select the Chart Type from the menu, or select Chart Options, from which you may select not only the chart type, but also the parameters for the chart.
Figure 5-3. Chart Options

Create New Report
Report Builder 10 <CONFIDENTIAL> This document contains information proprietary to Valiant, and may not be reproduced, disclosed or used in whole or part without the express written permission of Valiant. Copyright © 2007 Valiant Solutions, Inc. All Rights Reserved.
5.3.1 Chart Data Except for Pie and doughnut charts, Report Builder charts use three axes to group the data: Value, Category, and Series. Charts typically have two axes used to categorize and measure the data: a category (x) axis and a value (y) axis. The y-axis is usually the vertical axis and contains the data from the Value tab. The x-axis is usually the horizontal axis and contains the categories from the Category tab. The points on the resulting chart contain the data series from the Series axis. The Series axis is called the (z) axis.
5.3.1.1 Category Group The Category group is used to group your data. The name of each field is used to label the chart elements. For example, in a column chart, the name of each field in the Category group is placed on the x-axis of the chart, one for each set of columns. For the Seniority Report example in the Table format section, we can display a chart that shows us employee seniority by year. To categorize (x-axis) the data by Seniority Year,, drag that field from the Explorer pane to the Category tab.

Create New Report
Report Builder 11 <CONFIDENTIAL> This document contains information proprietary to Valiant, and may not be reproduced, disclosed or used in whole or part without the express written permission of Valiant. Copyright © 2007 Valiant Solutions, Inc. All Rights Reserved.
5.3.1.2 Value Group The Value group is used to determine the size of the chart element for each category group. For example, a Values field determines the height of a column in a column chart or the size of a slice in a pie chart. When you design a chart report, you need to add at least one field to the Value group. To show the number of employees associated with each year, drag the #OEMPs field to the values tab.
Click to view the results.
Create New Report
Report Builder 12 <CONFIDENTIAL> This document contains information proprietary to Valiant, and may not be reproduced, disclosed or used in whole or part without the express written permission of Valiant. Copyright © 2007 Valiant Solutions, Inc. All Rights Reserved.
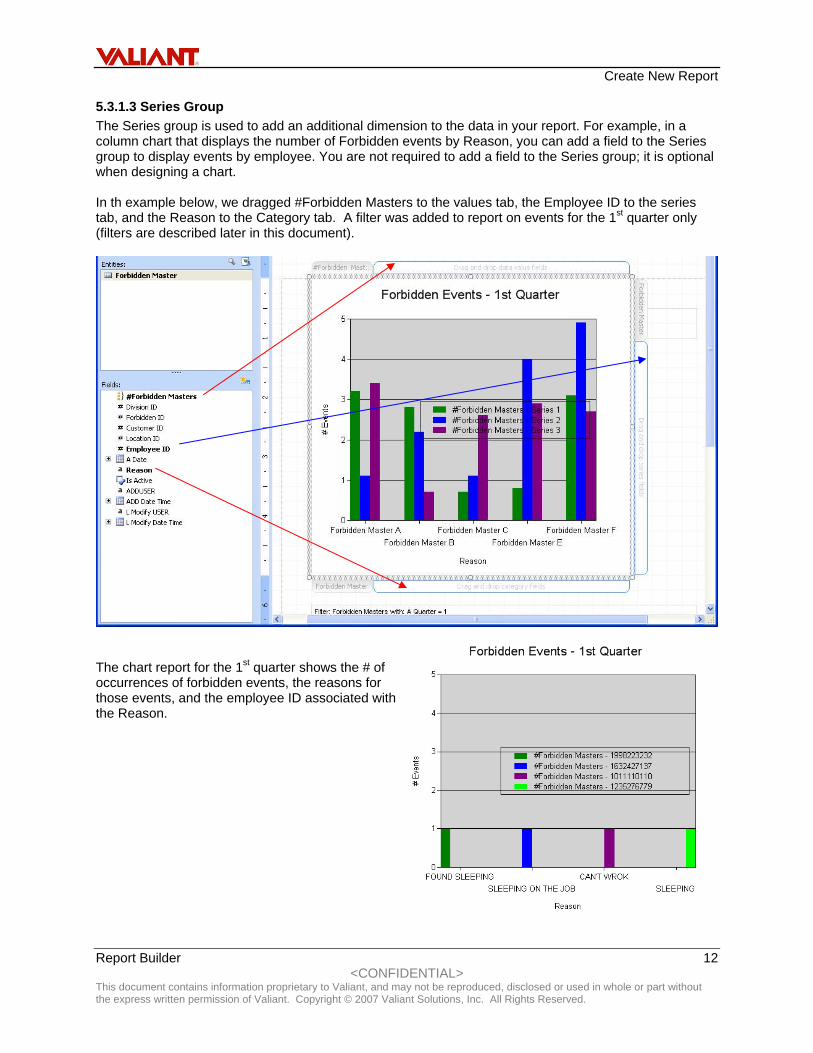
5.3.1.3 Series Group The Series group is used to add an additional dimension to the data in your report. For example, in a column chart that displays the number of Forbidden events by Reason, you can add a field to the Series group to display events by employee. You are not required to add a field to the Series group; it is optional when designing a chart. In th example below, we dragged #Forbidden Masters to the values tab, the Employee ID to the series tab, and the Reason to the Category tab. A filter was added to report on events for the 1st quarter only (filters are described later in this document).
The chart report for the 1st quarter shows the # of occurrences of forbidden events, the reasons for those events, and the employee ID associated with the Reason.

Working With Data
Report Builder 13 <CONFIDENTIAL> This document contains information proprietary to Valiant, and may not be reproduced, disclosed or used in whole or part without the express written permission of Valiant. Copyright © 2007 Valiant Solutions, Inc. All Rights Reserved.
6. Working with Data The data sources available to Report Builder users are created by Valiant in the form of “models”. These models generally conform to the structure of Valiant’s applications – the masters and tabs that make up the “entities” of the database.
6.1 Valiant Schema Using the Valiant Schema data source model displays the available entities. A report may contain information from one or more related entities. In the schema model, the entitities and their perspectives relate directly to the internal database organization (see tables below).
Table 6-1. Vision Table Notes
Vision Table Name Description
SYS________ The system setting tables OSYSTEM Your Division Table OEMP The employee file EmployeeID 1 – 10 are the reserved employees OCUST The Customer Master OLOCATION The Location Master OPOST The Post Master OTOUR The Tour Master OTRANSACTION The Schedule file VTRANF__________ Tables that are populated after you calculate VTRANFBilling Billing Adjustments where SourceType = ‘ADJUSTMENT’ AdjustmentPayroll Payroll Adjustments LKL____ Tables prefixed by LKL_ are lookup tables. If a field name in the
application has a lookup, the associated LKL_ table should have a very similar name.
Table 6-2. Vault Table Notes
Vision Table Name Description
PayDivisions Holds the division information PayYTDPayroll Holds the totals per payroll process for earnings, deductions, taxes and
payments PayTYDEarnings Links to PayYTDPayroll using the payrollID and the other primary keys.
With this table you can get the earnings details. PayTYDDeductions Links to PayYTDPayroll using the payrollID and the other primary keys.
Working With Data
Report Builder 14 <CONFIDENTIAL> This document contains information proprietary to Valiant, and may not be reproduced, disclosed or used in whole or part without the express written permission of Valiant. Copyright © 2007 Valiant Solutions, Inc. All Rights Reserved.
With this table you can get the deductions details. PayTYDTaxes Links to PayYTDPayroll using the payrollID and the other primary keys.
With this table you can get the tax details. PayTYDPayments Links to PayYTDPayroll using the payrollID and the other primary keys.
With this table you can get the payment details. ***Must be careful with this table because this table can have multiple records per payrollID because employee can have Direct deposit split up (50% one account, 50% another account)
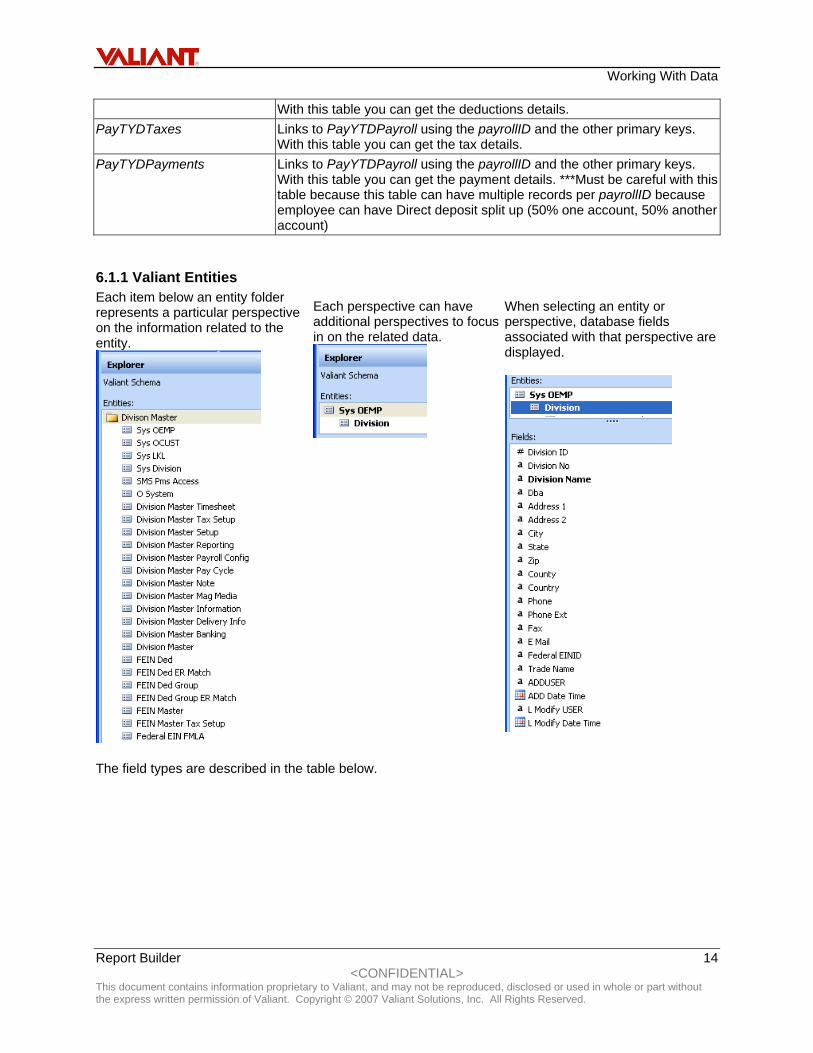
6.1.1 Valiant Entities Each item below an entity folder represents a particular perspective on the information related to the entity.
Each perspective can have additional perspectives to focus in on the related data.
When selecting an entity or perspective, database fields associated with that perspective are displayed.
The field types are described in the table below.
Working With Data
Report Builder 15 <CONFIDENTIAL> This document contains information proprietary to Valiant, and may not be reproduced, disclosed or used in whole or part without the express written permission of Valiant. Copyright © 2007 Valiant Solutions, Inc. All Rights Reserved.
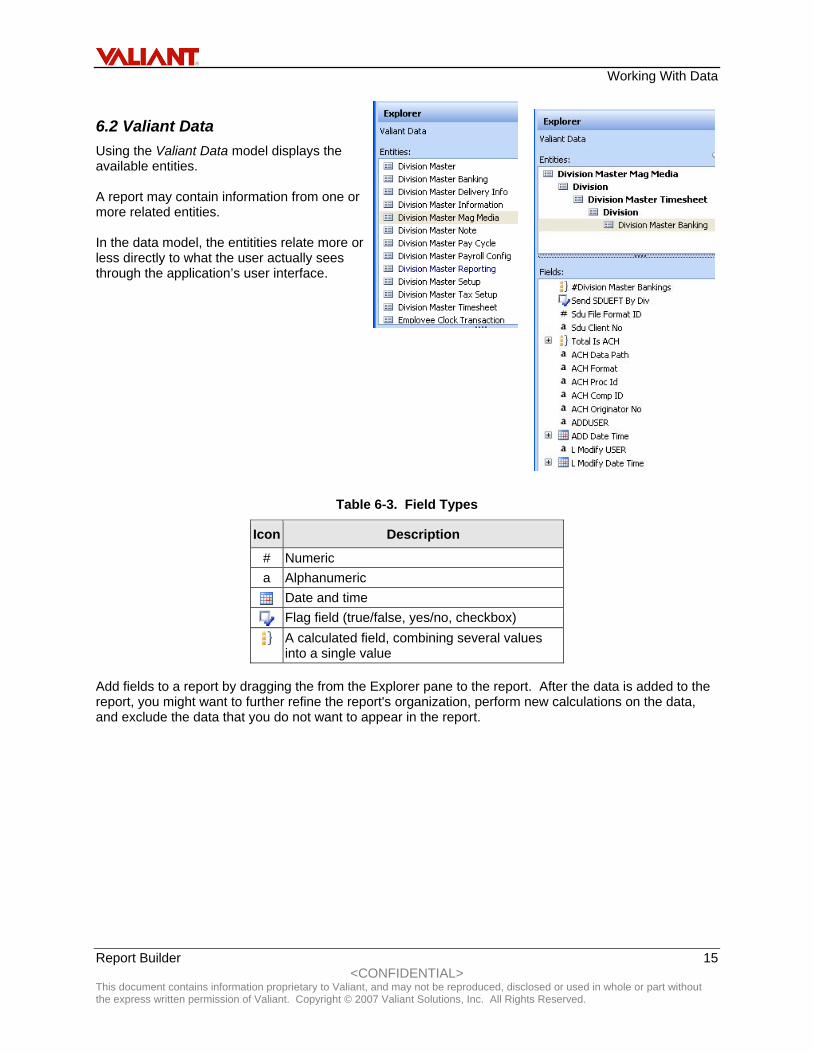
6.2 Valiant Data Using the Valiant Data model displays the available entities. A report may contain information from one or more related entities. In the data model, the entitities relate more or less directly to what the user actually sees through the application’s user interface.
Table 6-3. Field Types
Icon Description
# Numeric a Alphanumeric
Date and time
Flag field (true/false, yes/no, checkbox)
A calculated field, combining several values into a single value
Add fields to a report by dragging the from the Explorer pane to the report. After the data is added to the report, you might want to further refine the report's organization, perform new calculations on the data, and exclude the data that you do not want to appear in the report.

Working With Data
Report Builder 16 <CONFIDENTIAL> This document contains information proprietary to Valiant, and may not be reproduced, disclosed or used in whole or part without the express written permission of Valiant. Copyright © 2007 Valiant Solutions, Inc. All Rights Reserved.
6.3 Grouping and Sorting Data Groups are used to organize data so that the report is displayed in a visual hierarchy and so that you can obtain subtotals. After the data is grouped, you can then sort the data within each group in ascending or descending order to make data easier to locate.
6.3.1 Grouping Data As you drag fields and entities to the design page, data is automatically organized into groups. The broadest group in common to the data appears in the report as the Account Manager, the most specific data is the customer and billed hours.
In this example, suppose you create a sales report that shows billable hours by Account Manager and Customer. By placing the Account Manager in the leftmost tab, you can group the hours by Account Manager and then Customer to see total hours billed by Customer for each Account Manager. When you run the report, Report Builder provides the customer subtotals by Account Manager and grand totals automatically. Click to change the sort sequence, ascending or descending. By default, data is generally listed in the order that Report Builder retrieves the data.
When grouping your data, note that:
You can create as many groups in the report layout template as you want. To add an item to a group or to change the current grouping, drop the field on the group
tab. You can re-arrange the groups by dragging and dropping a group tab on another group tab
in the report layout. When the group is the entity group for a field, the field is added to that group when it is
dropped to the right side of the report layout template. If no entity group exists, a new group for the field is created.
1 2
Working With Data
Report Builder 17 <CONFIDENTIAL> This document contains information proprietary to Valiant, and may not be reproduced, disclosed or used in whole or part without the express written permission of Valiant. Copyright © 2007 Valiant Solutions, Inc. All Rights Reserved.
A new group for a field is created when the field is added to the left side of the report layout template. If the field is an identifying field for the entity, an entity group is created when you add the field to the left side of the report layout template.
When you add an entity to the design area, Report Builder creates a group that uses the entity's name. Adding multiple fields from an entity to the design area also groups the fields using the entity's name.
When you add a single-value field from a related entity to the right side of the report layout template, the field is added as an additional detail to the existing group.
When you add an aggregate field (a field containing a total over a set of values) to the report layout template, the field becomes an additional detail to whichever group it is added.
If there is a one-to-many relationship between two entities, the primary entity in the Explorer pane changes when you add the entity to the design area and then add the second entity. For example, if you add the Customer entity to the design area, the Customer entity becomes the primary entity in the Explorer pane. If you add the Sales Order entity to the design area, the primary entity changes to Sales Order in the Explorer pane.
If you want to create a value group within a particular field, select the field and drag it to the left of the original group. A new group is created that is named after the field.
If you add one or more aggregate fields to the report layout template and there are no groups available to associate with the aggregate, a Total group is created.
When a value or entity group is added to a query with only a total group, the total group is removed and the aggregate fields are added to the value or entity group. If all the value or entity groups are removed from the report layout, the aggregate fields revert to a total group.
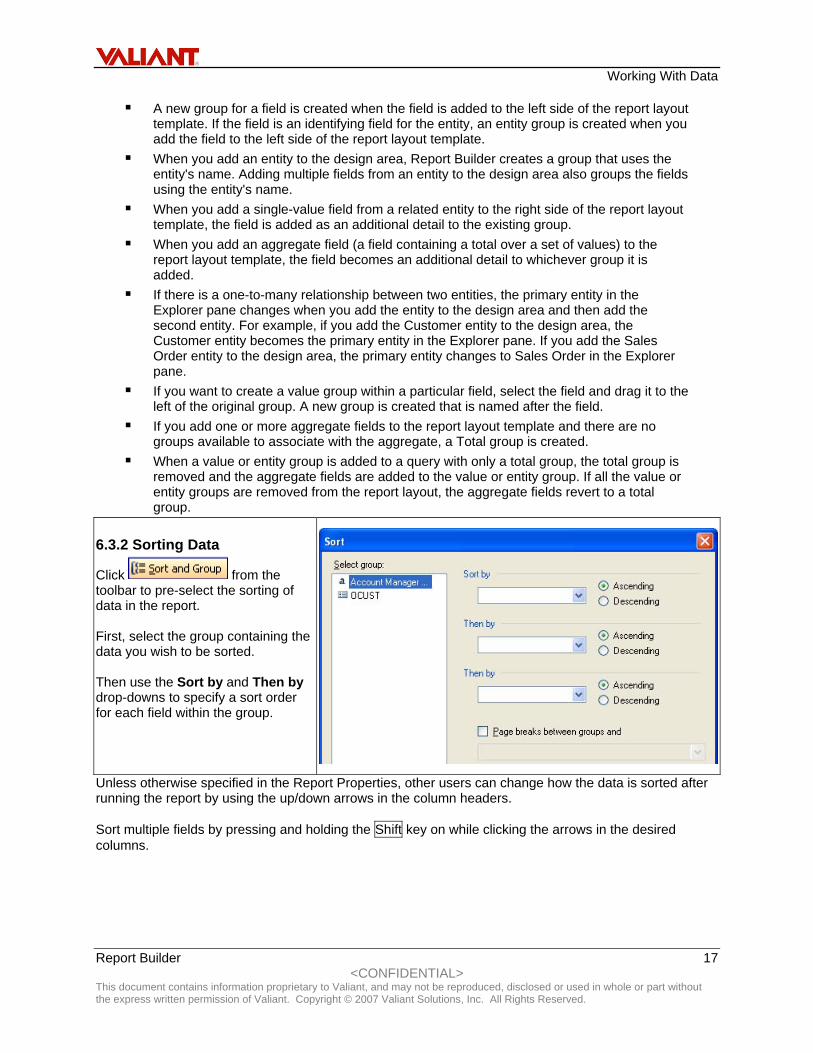
6.3.2 Sorting Data
Click from the toolbar to pre-select the sorting of data in the report. First, select the group containing the data you wish to be sorted. Then use the Sort by and Then by drop-downs to specify a sort order for each field within the group.
Unless otherwise specified in the Report Properties, other users can change how the data is sorted after running the report by using the up/down arrows in the column headers. Sort multiple fields by pressing and holding the Shift key on while clicking the arrows in the desired columns.

Working With Data
Report Builder 18 <CONFIDENTIAL> This document contains information proprietary to Valiant, and may not be reproduced, disclosed or used in whole or part without the express written permission of Valiant. Copyright © 2007 Valiant Solutions, Inc. All Rights Reserved.
6.4 Working with Formulas A formula can contain functions, operators, constants, and references to fields or entities. You can create formulas and save them as new fields; or, you can modify the formulas of existing fields. Right click on the desired field to display the menu and left-click on Edit Formula.
The selected field is displayed in the Define Formula window. The operators are displayed below the formula and can be used to add, subtract, multiply, divide, etc, the field value by another field’s value or logical expresssion. Formulas can look similar to any of the following:
Sum Line Total 6+12 SUM(IF(Finished Goods
Flag, "Finished", "Unfinished"))
For example, to calculate the Total Billed Reg Account as a percentage of accounts receivable, add a “/” and drag the Total AR Account field to the formula. The equals sign (=) is implied.
You can save this formula as a new field by selecting the related check box.

Working With Data
Report Builder 19 <CONFIDENTIAL> This document contains information proprietary to Valiant, and may not be reproduced, disclosed or used in whole or part without the express written permission of Valiant. Copyright © 2007 Valiant Solutions, Inc. All Rights Reserved.
Enter the new field name.
The new field is added to the Field list.
6.4.1 References A reference is a field name. This can be an existing field name within the entity, or a calculated field name that you have created and added to the Fields list. The reference tells Report Builder where to look for the values, or data, you want to use within a formula. You can refer to fields within your context entity and to fields in other entities within one formula or use the value from one field in several formulas.
6.4.2 Functions Functions are predefined formulas that perform calculations by using specific values, called arguments, specified in a particular order. Arguments can be literal values or fields, or combinations of both. When fields are used in formulas, the field name represents each instance of the field. If the argument is a literal value, you may need to indicate that the argument is a literal value using specific characters (see below).
6.4.3 Literals Filter conditions and expressions can both use literals and variables. A literal is a constant value. A variable represents a set of values that can change. For example, suppose you add the literal value #12/15/2005# for a date to a formula. When the results of the formula are displayed, the date "12/15/2005" is displayed as well. If you were to use a variable, the data would change depending on the underlying data source. For example, you might use the field OrderDate in the formula; the result would display each instance of the OrderDate field.
Table 6-4. Literal Symbols
To make the following a literal: Use this symbol:
Date #<Date># For example, the literal date #1/25/2009# renders as: 1/25/2009.
Text "<String>" For example, the literal string "The following bicycle parts are replaceable:" renders as: The following bicycle parts are replaceable:
Decimal <Decimal>m For example, the literal decimal 1.435m renders as: 1.435.
Note the following when working with literals:
Float, integer, and Boolean values do not require a special symbol.

Working With Data
Report Builder 20 <CONFIDENTIAL> This document contains information proprietary to Valiant, and may not be reproduced, disclosed or used in whole or part without the express written permission of Valiant. Copyright © 2007 Valiant Solutions, Inc. All Rights Reserved.
The Define Formula and Filter Data dialog boxes are not case sensitive; therefore, function names and Boolean values can be typed in lowercase or uppercase letters. Case sensitivity of strings depends on the underlying data source.
Report Builder automatically converts a decimal to a floating value when required in the formula; therefore, you can create formulas that require this conversion without having to specify whether the value is a float or a decimal.
6.4.4 Operators Operators specify the type of calculation that you want to perform on the values of a formula. Report Builder includes three different types of calculation operators: arithmetic, comparison, and text. Operators are indicated using symbols, such as the plus sign (+), in Report Builder.
Arithmetic operators perform basic mathematical operations such as addition, subtraction or multiplication, combine numbers, and produce numeric results.
You can compare two values using Comparison operators. When two values are compared by using these operators, the result is a logical value, either TRUE or FALSE.
Use the ampersand (&) to join, or concatenate, one or more text strings to produce a single piece of text.
6.5 Constants A constant is a value that is not calculated and, therefore, does not change. Report Builder uses the following constants: True, False, and Empty. These constants are used to evaluate Boolean fields. For example, suppose you have a field called . The only valid values for this field are True, False, or Empty (" ").
6.6 Creating a New Field When you need to manipulate the data in such a way that none of the available fields represents exactly the data you want to add to your report, you can create new fields. First, select the entity (in this case, OEMP) that contains the data for the new field. Select New Field from the Report menu to display the Define Formula window.
Enter “Employee Full Name” in the Field name field.

Working With Data
Report Builder 21 <CONFIDENTIAL> This document contains information proprietary to Valiant, and may not be reproduced, disclosed or used in whole or part without the express written permission of Valiant. Copyright © 2007 Valiant Solutions, Inc. All Rights Reserved.
In the Formula area of the window, drag the fields and operators needed to create the new field. Drag First Name.
Click (concatenate). Drag Middle Initial.
Click . Drag Last Name.
Click .
The new field is listed in the Fields area. This new field is now part of the current report, available to other users of the report if desired, but it is not part of the Data Source in the database.
Working With Filters
Report Builder 22 <CONFIDENTIAL> This document contains information proprietary to Valiant, and may not be reproduced, disclosed or used in whole or part without the express written permission of Valiant. Copyright © 2007 Valiant Solutions, Inc. All Rights Reserved.
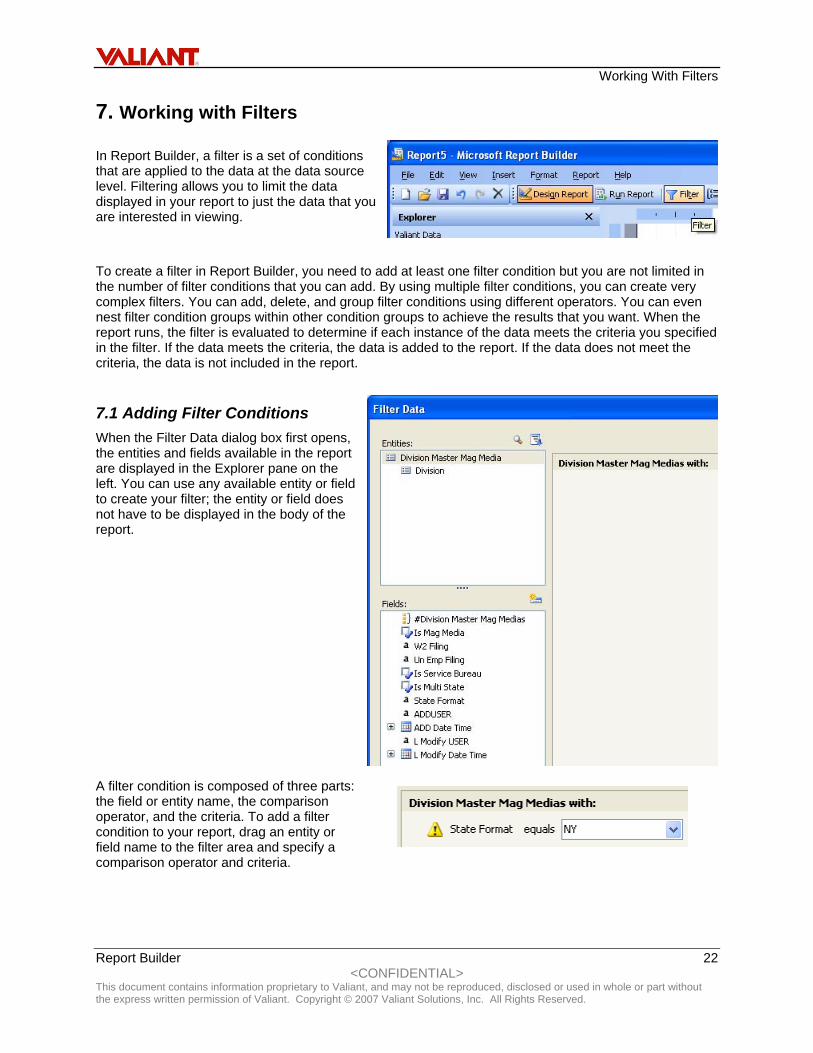
7. Working with Filters In Report Builder, a filter is a set of conditions that are applied to the data at the data source level. Filtering allows you to limit the data displayed in your report to just the data that you are interested in viewing.
To create a filter in Report Builder, you need to add at least one filter condition but you are not limited in the number of filter conditions that you can add. By using multiple filter conditions, you can create very complex filters. You can add, delete, and group filter conditions using different operators. You can even nest filter condition groups within other condition groups to achieve the results that you want. When the report runs, the filter is evaluated to determine if each instance of the data meets the criteria you specified in the filter. If the data meets the criteria, the data is added to the report. If the data does not meet the criteria, the data is not included in the report.
7.1 Adding Filter Conditions When the Filter Data dialog box first opens, the entities and fields available in the report are displayed in the Explorer pane on the left. You can use any available entity or field to create your filter; the entity or field does not have to be displayed in the body of the report.
A filter condition is composed of three parts: the field or entity name, the comparison operator, and the criteria. To add a filter condition to your report, drag an entity or field name to the filter area and specify a comparison operator and criteria.

Working With Filters
Report Builder 23 <CONFIDENTIAL> This document contains information proprietary to Valiant, and may not be reproduced, disclosed or used in whole or part without the express written permission of Valiant. Copyright © 2007 Valiant Solutions, Inc. All Rights Reserved.
After you add the filter condition to the filter area, you can move the condition around the filter area by selecting the entity or field name and dragging it. A filter condition can be moved between groups or it can be moved within the current group. When moved, filter conditions are added to the bottom of the group.
7.1.1 Logical Operators As you add additional filter conditions to the filter area, a logical operator is displayed between each filter condition. Report Builder supports the And and Or logical operators. By default, the logical operator is And, but you can easily change it by clicking And and selecting Or.
7.1.2 Filtering On Formulas You can use Report Builder's function capabilities to filter the entire filter condition as a formula. You can filter on formulas when you want to create a filter clause that requires the manipulation of the formula for the field or on other functionality supported in the Define Formula dialog box, such as aggregation levels or removing duplicates, and this functionality is not in the Filter Data dialog box. For example, suppose you want to include only products in your filter condition that have a Sell Start Date of earlier than 2003. You could edit the Sell Start Date field formula using an available Date function.

Working With Filters
Report Builder 24 <CONFIDENTIAL> This document contains information proprietary to Valiant, and may not be reproduced, disclosed or used in whole or part without the express written permission of Valiant. Copyright © 2007 Valiant Solutions, Inc. All Rights Reserved.
To edit the field formulas in your filter, right-click the field name in the filter condition and select Edit as Formula.
7.1.3 Prompting for Filter Values Prompting allows individuals reading your report to control the content of the report without having to edit the report file. Suppose you create a sales report that displays detailed sales information by territory. Instead of selecting which territory to display in the report, you can select Prompt and then, when the user opens the report on the report server, they can select which territory to view themselves. To use the Prompt option, right-click the field or entity name in the filter condition and select Prompt. If you specify a specific value in the criteria text box, the report will run first using that value.
Then, the person reading your report can select a new value. If you leave the criteria text box blank, the person reading the report must select a value before the report runs. The selection list includes all available values in the database for that field.
7.1.4 Selecting a Comparison Operator for a Filter Condition Comparison operators, such as equals, greater than or less than, are used to evaluate the filter condition for each instance of the entity to determine whether the data should be included in the report. Comparison operators are used with text, numeric, or date data. Equals and Not equals are used with Booleans and EntityKeys. By default, equals is displayed as the comparison operator but you can select from any of the other available options. The available options change depending on the data type of the field or entity added to the filter condition.
The Not option is used to indicate that only those items that do not meet the specified filter condition should be included in the report. For example, suppose you want to see the sales data for all countries
Working With Filters
Report Builder 25 <CONFIDENTIAL> This document contains information proprietary to Valiant, and may not be reproduced, disclosed or used in whole or part without the express written permission of Valiant. Copyright © 2007 Valiant Solutions, Inc. All Rights Reserved.
except the United States. Instead of selecting all the available countries and listing them in your filter condition, simply use the Not option in the filter condition to state that Country field items should not equal the United States. The Not option can be used with any other available comparison operator.
7.1.5 Filtering Empty or Blank Values Some fields or entities in your data source might reference tables in the underlying database that contain blank (" ") or empty (Null) values. For example, suppose your company sells bicycles over the Internet. One of the fields in the online sales order is an e-mail address field; however, customers are not required to complete this field when making a purchase. If the customer submits an e-mail address, that information is added to a field called emailaddress in a database table. If the customer does not provide an e-mail address, the emailaddress field might contain an empty or blank string value instead. Blank only applies to text fields, but empty applies to all data types. When creating and running your reports, the empty or blank information is included in the data returned unless you specifically exclude the data using a filter condition. When filtering empty values, use the Is Empty option. When filtering for blank strings, use the Is Blank option. If you want to filter on both empty and blank values, use the Is Blank or Empty option.
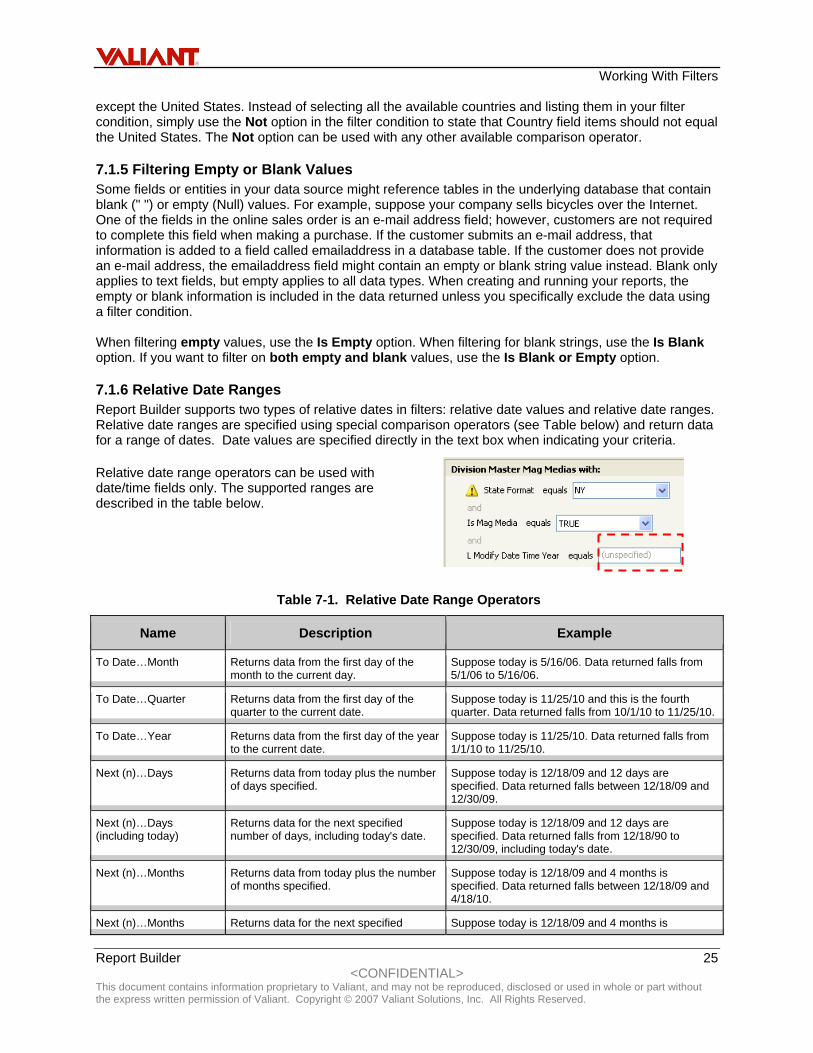
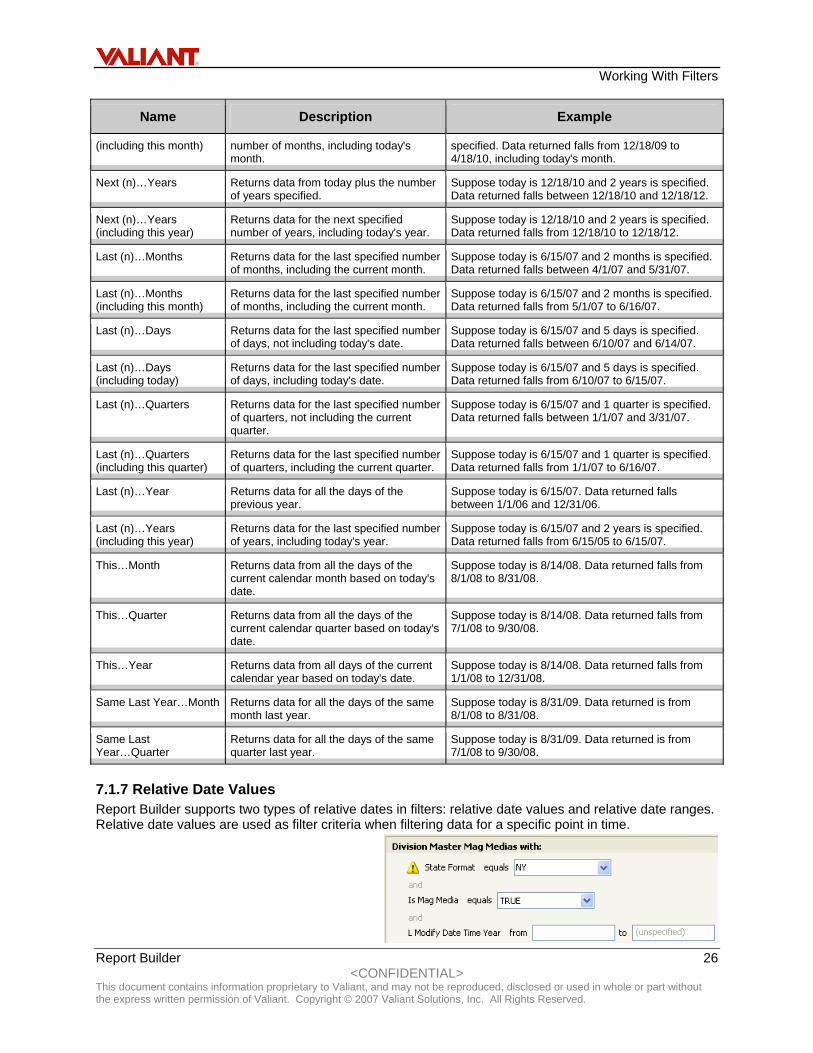
7.1.6 Relative Date Ranges Report Builder supports two types of relative dates in filters: relative date values and relative date ranges. Relative date ranges are specified using special comparison operators (see Table below) and return data for a range of dates. Date values are specified directly in the text box when indicating your criteria. Relative date range operators can be used with date/time fields only. The supported ranges are described in the table below.
Table 7-1. Relative Date Range Operators
Name Description Example
To Date…Month Returns data from the first day of the month to the current day.
Suppose today is 5/16/06. Data returned falls from 5/1/06 to 5/16/06.
To Date…Quarter Returns data from the first day of the quarter to the current date.
Suppose today is 11/25/10 and this is the fourth quarter. Data returned falls from 10/1/10 to 11/25/10.
To Date…Year Returns data from the first day of the year to the current date.
Suppose today is 11/25/10. Data returned falls from 1/1/10 to 11/25/10.
Next (n)…Days Returns data from today plus the number of days specified.
Suppose today is 12/18/09 and 12 days are specified. Data returned falls between 12/18/09 and 12/30/09.
Next (n)…Days (including today)
Returns data for the next specified number of days, including today's date.
Suppose today is 12/18/09 and 12 days are specified. Data returned falls from 12/18/90 to 12/30/09, including today's date.
Next (n)…Months Returns data from today plus the number of months specified.
Suppose today is 12/18/09 and 4 months is specified. Data returned falls between 12/18/09 and 4/18/10.
Next (n)…Months Returns data for the next specified Suppose today is 12/18/09 and 4 months is
Working With Filters
Report Builder 26 <CONFIDENTIAL> This document contains information proprietary to Valiant, and may not be reproduced, disclosed or used in whole or part without the express written permission of Valiant. Copyright © 2007 Valiant Solutions, Inc. All Rights Reserved.
Name Description Example
(including this month) number of months, including today's month.
specified. Data returned falls from 12/18/09 to 4/18/10, including today's month.
Next (n)…Years Returns data from today plus the number of years specified.
Suppose today is 12/18/10 and 2 years is specified. Data returned falls between 12/18/10 and 12/18/12.
Next (n)…Years (including this year)
Returns data for the next specified number of years, including today's year.
Suppose today is 12/18/10 and 2 years is specified. Data returned falls from 12/18/10 to 12/18/12.
Last (n)…Months Returns data for the last specified number of months, including the current month.
Suppose today is 6/15/07 and 2 months is specified. Data returned falls between 4/1/07 and 5/31/07.
Last (n)…Months (including this month)
Returns data for the last specified number of months, including the current month.
Suppose today is 6/15/07 and 2 months is specified. Data returned falls from 5/1/07 to 6/16/07.
Last (n)…Days Returns data for the last specified number of days, not including today's date.
Suppose today is 6/15/07 and 5 days is specified. Data returned falls between 6/10/07 and 6/14/07.
Last (n)…Days (including today)
Returns data for the last specified number of days, including today's date.
Suppose today is 6/15/07 and 5 days is specified. Data returned falls from 6/10/07 to 6/15/07.
Last (n)…Quarters Returns data for the last specified number of quarters, not including the current quarter.
Suppose today is 6/15/07 and 1 quarter is specified. Data returned falls between 1/1/07 and 3/31/07.
Last (n)…Quarters (including this quarter)
Returns data for the last specified number of quarters, including the current quarter.
Suppose today is 6/15/07 and 1 quarter is specified. Data returned falls from 1/1/07 to 6/16/07.
Last (n)…Year Returns data for all the days of the previous year.
Suppose today is 6/15/07. Data returned falls between 1/1/06 and 12/31/06.
Last (n)…Years (including this year)
Returns data for the last specified number of years, including today's year.
Suppose today is 6/15/07 and 2 years is specified. Data returned falls from 6/15/05 to 6/15/07.
This…Month Returns data from all the days of the current calendar month based on today's date.
Suppose today is 8/14/08. Data returned falls from 8/1/08 to 8/31/08.
This…Quarter Returns data from all the days of the current calendar quarter based on today's date.
Suppose today is 8/14/08. Data returned falls from 7/1/08 to 9/30/08.
This…Year Returns data from all days of the current calendar year based on today's date.
Suppose today is 8/14/08. Data returned falls from 1/1/08 to 12/31/08.
Same Last Year…Month Returns data for all the days of the same month last year.
Suppose today is 8/31/09. Data returned is from 8/1/08 to 8/31/08.
Same Last Year…Quarter
Returns data for all the days of the same quarter last year.
Suppose today is 8/31/09. Data returned is from 7/1/08 to 9/30/08.
7.1.7 Relative Date Values Report Builder supports two types of relative dates in filters: relative date values and relative date ranges. Relative date values are used as filter criteria when filtering data for a specific point in time.

Working With Filters
Report Builder 27 <CONFIDENTIAL> This document contains information proprietary to Valiant, and may not be reproduced, disclosed or used in whole or part without the express written permission of Valiant. Copyright © 2007 Valiant Solutions, Inc. All Rights Reserved.
To specify a relative date value, you use the calendar control that appears in the criteria area when you add a date or time field to the filter area and the relative date options from the bottom of the calendar control. Alternatively, you can just type in the appropriate text, for example 'today'. The match is not case sensitive. The supported date values are described in the table below.
Table 7-2. Relative Date Value Operators
Name Description Example
Today Returns data for today's date at midnight (00:00:00 AM).
Suppose today is 10/15/09. Data is returned for the entire day of 10/15/09.
Now Returns data for today's date and time. Suppose it is 1:30 PM on 10/15/09. Data is returned for the date 10/15/09 from midnight to 1:30:00 PM.
Yesterday Returns data for today's date minus one day. If today is 10/15/09. Data is returned for 10/14/09.
Tomorrow Returns data for today's date plus one day. If today is 10/15/09. Data is returned for 10/16/09.
First day of month
Returns data for the first day of the current month based on today's date.
Suppose today is 7/12/07. Data is returned for the date 7/1/07.
First day of quarter
Returns date for the first day of the current quarter based on today's date.
Suppose today is 7/12/07, this is the third quarter of the year. Data is returned for the date 7/1/07.
First day of year
Returns data for the first day of the current year based on today's date.
Suppose today is 7/12/07. Data is returned for the date 1/1/07.
Last day of month
Returns data for the last day of the current month based on today's date.
Suppose today is 7/12/07. Data is returned for the date 7/31/07.
Last day of quarter
Returns data for the last day of the current quarter based on today's date.
Suppose today is 7/12/07, this is the third quarter of the year. Data is returned for the date 9/30/07.
Last day of year
Returns data for the last day of the current year based on today's date.
Suppose today is 7/12/07. Data is returned for the date 12/31/07.
(n) days ago Returns data for a single date that occurs the specified number of days before today.
Suppose today is 7/12/07 and five days are specified. Data is returned for the date 7/8/07.
(n) months ago
Returns data for a single date that occurs the specified number of months before the month of the current day.
Suppose today is 7/12/07 and 2 months are specified. Data is returned for the date 5/12/07.
(n) years ago Returns data for a single date that occurs the specified number of years before the year of the current day.
Suppose today is 7/12/07 and 3 years is specified. Data is returned for the date 7/12/04.
(n) days from now
Returns data for a single date that occurs the specified number of days from today.
Suppose today is 8/15/09 and 10 days is specified. Data is returned for the date 8/25/09.
(n) months from now
Returns data for a single date that occurs the specified number of months from today's month.
Suppose today is 4/3/10 and 5 months is specified. Data is returned for the date 9/3/10.
(n) years from now
Returns data from today's year plus the number of years specified.
Suppose today is 4/3/10 and 2 years is specified. Data is returned for the date 14/3/12.
7.2 Specifying Criteria in a List When using the in a list operator, all of the available items for the field or entity in the filter condition are displayed in a list. To select criteria from this pre-populated list, select the check box for each item you want to use in the filter condition. You can select as many items as you want. Pre-populated lists vary in length depending on the number of items within the entity or field and the defaults set in the data source.
Working With Filters
Report Builder 28 <CONFIDENTIAL> This document contains information proprietary to Valiant, and may not be reproduced, disclosed or used in whole or part without the express written permission of Valiant. Copyright © 2007 Valiant Solutions, Inc. All Rights Reserved.
7.2.1 Creating a Pre-Filtered List In some cases, a pre-populated list is not possible because the number of items displayed would make the list unmanageable. For example, suppose you add the Sales Order entity to your filter condition. Depending on the contents of the database, there could be millions of sales orders from which to choose. Listing each sales order in the list would be impractical. In situations like this, you are prompted to create your own pre-filtered list. Using this pre-filtered list, you can limit the number of items displayed within a pre-populated list. Then, just like any other list, you can select which items to add to the filter condition. For example, if the Sales Order entity contains too many items to pre-populate the list and you want to see only those sales orders that occurred on a specific date, you can pre-filter the list using the Filter List dialog box. Here, you specify a filter condition to locate the sales orders that you want and add them to the Available Data list box. You can, at this point, add all the available data to your Selected Data list box, or select particular items. When you click OK, all items in the Selected Data list box are displayed as a pre-populated list when you click the criterion down arrow in the Filter Data dialog box, allowing you to select which criteria to add to the filter condition. When creating a pre-filtered list, keep in mind that you are not specifying your criteria; you are simply limiting the criteria options available from which to select your filter condition criteria.
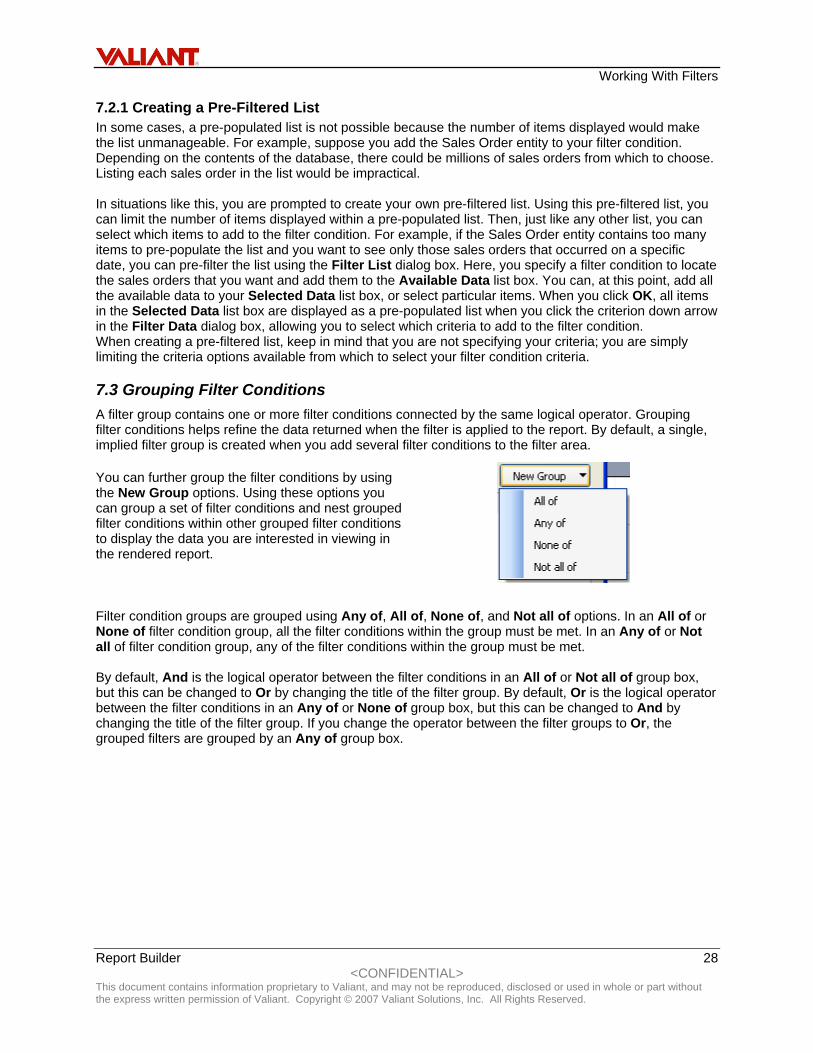
7.3 Grouping Filter Conditions A filter group contains one or more filter conditions connected by the same logical operator. Grouping filter conditions helps refine the data returned when the filter is applied to the report. By default, a single, implied filter group is created when you add several filter conditions to the filter area. You can further group the filter conditions by using the New Group options. Using these options you can group a set of filter conditions and nest grouped filter conditions within other grouped filter conditions to display the data you are interested in viewing in the rendered report.
Filter condition groups are grouped using Any of, All of, None of, and Not all of options. In an All of or None of filter condition group, all the filter conditions within the group must be met. In an Any of or Not all of filter condition group, any of the filter conditions within the group must be met. By default, And is the logical operator between the filter conditions in an All of or Not all of group box, but this can be changed to Or by changing the title of the filter group. By default, Or is the logical operator between the filter conditions in an Any of or None of group box, but this can be changed to And by changing the title of the filter group. If you change the operator between the filter groups to Or, the grouped filters are grouped by an Any of group box.

Working With Filters
Report Builder 29 <CONFIDENTIAL> This document contains information proprietary to Valiant, and may not be reproduced, disclosed or used in whole or part without the express written permission of Valiant. Copyright © 2007 Valiant Solutions, Inc. All Rights Reserved.

Formatting A Report
Report Builder 30 <CONFIDENTIAL> This document contains information proprietary to Valiant, and may not be reproduced, disclosed or used in whole or part without the express written permission of Valiant. Copyright © 2007 Valiant Solutions, Inc. All Rights Reserved.
8. Formatting a Report Formatting the items in your report makes the report look more attractive and enhances its readability. You can format the text boxes, the images, the fields in the report layout, and the data while in design mode. Some items in your report are already pre-formatted for convenience; however, you can change the formatting already in place. In some instances, Report Builder automatically formats the information for you, for example, column heading text is automatically formatted as Bold, and every cell within the report layout has a cell padding of 2 points on each side. In other instances, the data source provides the formatting information for the contents of a field, for example, the person who designed the data source might assign a monetary format to fields that contain monetary values. In this case, when you drag the field to the design area, the monetary field displays placeholder data with a currency symbol and the appropriate number of decimal places as specified in the data source. You can change formatting options by selecting the item you want to format and then using the Format dialog box or the Formatting and Borders toolbars to make your changes. The formatting changes you make to the report are reflected in the design area. You do not need to run the report to see applied formatting.
8.1 Text Boxes A text box is a movable, resizable container for text that appears in a report layout. Text boxes can be moved anywhere within the design area. The text within a text box wraps automatically; however, you need to adjust the size of the text box to accommodate the text. Text boxes can only contain text and special effects cannot be applied; however, the text box and its contents can be formatted. Every Report Builder report layout contains the following two text boxes by default: Title and Filter description. The table report layout also contains a Total rows textbox. In addition, you can add an unlimited number of additional text boxes to your report and move them anywhere within the design area. Hyperlinks cannot be added to a text boxes.
8.1.1 Title By default, every report layout has a Title text box for you to type a title for the report. The text box is positioned above the main body of the report but you can move it to another location within the design area. By default, text is displayed as Arial, 18 point, bold, and left-aligned, but you can change these format options.
8.1.2 Total Rows The Total rows text box only appears in a table report layout. The contents of the text box are automatically updated to display the number of rows returned in the table when the report is run. The text box is positioned below the table by default but you can move or delete it. The text within the box cannot be changed but you can change the formatting.
8.1.3 Filter description The Filter description text box appears in every report layout. The contents of the text box are automatically updated to display a restatement of the filter when you apply a filter to the report. The text box is positioned at the bottom of the report layout by default but you can move or delete it. The text within the box cannot be changed but you can change the formatting. If you do not apply a filter to your report, the filter description does not appear in the report when it is run.
Formatting A Report
Report Builder 31 <CONFIDENTIAL> This document contains information proprietary to Valiant, and may not be reproduced, disclosed or used in whole or part without the express written permission of Valiant. Copyright © 2007 Valiant Solutions, Inc. All Rights Reserved.
8.2 Numerical Data Numeric field data, including dates and monetary values, are formatted using the Number tab of the Format dialog box. The options displayed on the Number tab changes depending on the type of data contained within the cells that you are formatting. If you find that formatting options you want to use are grayed out, it means that the field's data type, which is located in the data source, and the formatting options are not compatible. For example, if the field contains numeric values but the field's data type is "string", numerical data formatting options, such as currency or decimals, cannot be applied and the numerical formatting options are grayed out.
8.2.1 Using Decimals By default, Report Builder displays monetary, percentage, and decimal numbers to the second decimal place. Exponential numbers display six decimal places by default. However, up to 99 decimals places can be displayed. The decimal separator can be displayed as a period or a comma, depending on the locale settings of the data source.
8.2.2 Adding a Thousand Separator To make numbers more readable, you can add a thousand separator. Depending on the locale settings of the data source, the separator is either a comma (,) or a period (.).
8.2.3 Indicating a Monetary Value When formatting numbers as monetary values, a monetary symbol is automatically added. By default, the monetary symbol used is based on the locale settings of the data source. You can change the symbol used by typing a different symbol in the Symbol box on the Number tab.
8.2.4 Formatting Negative Numbers By default, negative numbers are displayed in the following format: -1234.10 but you can change the format to (1234.10).
8.3 Aligning Data, Text, and Images The contents of text boxes and the contents of cells within a table or matrix can be aligned vertically and horizontally. Contents can be horizontally aligned along the left, right or middle of the cell or text box, and vertically aligned along the top, middle or bottom of the cell or text box. Padding can be applied to images, and the contents of text boxes and cells. Padding can help you to refine the alignment of an image, or a cell's or text box's contents. By default, text boxes and cells within the report layout have a padding of 2 points along each side and images have a default of 0 points. Padding can be increased up to 10 points. Padding can only be specified in points. You can drag and drop report items and use the Snap to grid option in the Page Setup dialog box to help you align report items on the page. By default, this option is selected. If you drag report items to a specific gridline on the design area and Snap to grid is selected, the left edge of the item is aligned to the gridline.
8.4 Formatting Data, Text, and Images Font, font style, font size, color, and underline and strikethrough effects can be applied to text within a text box or a report layout cell. By default, report layout text is Tahoma, regular, and 8 points. The title text box is Tahoma, regular, 18 points by default. The Total rows and Filter text boxes, and any text box you add are Arial, regular, and 8 points by default.

Formatting A Report
Report Builder 32 <CONFIDENTIAL> This document contains information proprietary to Valiant, and may not be reproduced, disclosed or used in whole or part without the express written permission of Valiant. Copyright © 2007 Valiant Solutions, Inc. All Rights Reserved.
By using the Format dialog box, you can specify the Alignment, Font, Border and Fill color of the Text box.
You may select the Text box and then apply formatting from the toolbar.
You may also select the Text box and right-click to display the Format option.
Fields that contain images can be added to a table or matrix report layout. If you use an image field, the images appear in the report when the report is run. You can adjust the height and width of the images by dragging the cell borders to increase or decrease the size of the cell. Images, such as a logo, can also be inserted into a report layout. If you use an image in your report layout, you can adjust the height and width of the images by dragging the image handles to increase or decrease the size of the image. By using the Picture tab of the Format dialog box, you can specify how you want to resize an image, for example cropped or in proportion, and then resize the image within the report layout.
8.5 Formatting Borders, Lines, and Gridlines Using the predefined border styles, you can quickly add a border around a cell, a group of cells, a text box, or an image. In addition, you can change the style, width, and color of the borders, lines, and gridlines that you add. To format borders and gridlines in a text box or report layout or around an image, use the Border tab in the Format dialog box. To format lines in a chart, use the Line tab in the Format dialog box.
8.6 Applying Background Colors A solid color can be added to the background of a text box, or to a cell or group of cells within a report layout. By default, the background color is white; however, you can select a color from the Fill tab in the Format dialog box. On the Fill tab, the Sample area provides a larger sample of the selected color.
Running A Report
Report Builder 33 <CONFIDENTIAL> This document contains information proprietary to Valiant, and may not be reproduced, disclosed or used in whole or part without the express written permission of Valiant. Copyright © 2007 Valiant Solutions, Inc. All Rights Reserved.
9. Running a Report While designing your report, you are working with a sample representation of the data. As such, the text is displayed as Xs and the numbers as zeroes (0). The actual data is not visible in the report until it is rendered. To see the data, you need to run, or render, the report. To run a report, click the Run Report button on the Report Builder toolbar. The results are displayed in the Report Builder run mode window. After you run the report, you can continue to refine it, save it, print it, save it as another file type, or simply view the data displayed in your report; and, if your organization is running SQL Server Enterprise edition, you can also drill through the data using clickthrough reports. Before continuing, it might be helpful to understand how Report Builder combines the report layout with the data.
9.1 Working with a Report in Run Mode When you click the Run Report button, the report is displayed in run mode. In Report Builder run mode, you can do the following:
Export a report to a different file type. Print the report. Save the report to the report server or your local computer. Search the contents of your report data. Sort the data. View the data in your report. View clickthrough reports. Zoom in and out of the report page.
9.1.1 Viewing Report Contents Using the Run toolbar, you can see how many pages there are in your report, move between the pages of the report, and view the contents of the report. You can locate specific information within your report by using the Find and Next buttons. For example, suppose you want to locate a specific value, such as a product name, that appears within your report. You can type the value into the Find box and then use the Find and Next buttons to locate all instances of that value within the report. Depending on the number of rows and columns in your report, you might want to adjust the size of the pages in the current report. In run mode, you can zoom in and out of the contents of the report page. Zoom settings can be set from 25% to 500% of the original page size. You can display an entire page within the run area of the window. Choosing the Whole Page option changes the zoom settings of each page, depending on the quantity of data displayed on that page. You can also display the contents of the report so that the report contents span the entire page. If you set the Zoom settings and then save your report, this does not affect the ability of other individuals to control their zoom settings when they view the report.
9.1.2 Refining the Report In run mode, you can continue to refine your report by changing the filter, or sorting and grouping your data. For example, after reviewing the contents and appearance of your report, you might decide to apply page breaks to your report to make the data more readable. Or, suppose you decide to apply a filter to your report so that only the data pertaining to the Manufacturing department is displayed. When you update the report, Report Builder automatically refreshes the data so that you can see how the changes affect the data returned. For example, after you apply page breaks, Report Builder automatically runs the report again and returns the report with the page breaks applied.

Running A Report
Report Builder 34 <CONFIDENTIAL> This document contains information proprietary to Valiant, and may not be reproduced, disclosed or used in whole or part without the express written permission of Valiant. Copyright © 2007 Valiant Solutions, Inc. All Rights Reserved.
The format or design of the report cannot be changed in run mode. Instead, switch back to design mode by clicking the Design Report button on the Report Builder toolbar and then you can continue to work with the report layout. Switching back to design mode requires you to work with representations of the data again. After running your report, you can save the report to the report server or to your computer. If you want to save the report with the data included, you can use one of the export options to save your report as a different file type.

Saving A Report
Report Builder 35 <CONFIDENTIAL> This document contains information proprietary to Valiant, and may not be reproduced, disclosed or used in whole or part without the express written permission of Valiant. Copyright © 2007 Valiant Solutions, Inc. All Rights Reserved.
10. Saving a Report After you create a report in Report Builder, you may want to save it for future use. When you save a Report Builder report, you are saving a description of how the report should look and the queries used to retrieve the data, not the actual data itself. The next time you run the report, the query retrieves the latest available data and formats it based on the report description generated by Report Builder. A saved report is called a report definition. A report definition is an .rdl file that contains report definition language (RDL) and a metadata query. When you run the report, the data returned by your query is combined with the RDL and rendered in Report Builder run mode. You can export the report to another program, like Microsoft Excel, and save the report--along with the data--in that file format. Report Builder report definitions can be saved to the Valiant report server that you have permission to access.
Saving an .rdl file to a report server is also called publishing a report. When you publish the report, you can assign properties to the report that allow others to view it.
Publish the report definition to the report server when you want to regularly run the report and view the current data, or if you want to share the report with others in your organization. After the report is saved, you can continue to open the report, change the report, and save the report definition in Report Builder as often as you want.

Exporting A Report
Report Builder 36 <CONFIDENTIAL> This document contains information proprietary to Valiant, and may not be reproduced, disclosed or used in whole or part without the express written permission of Valiant. Copyright © 2007 Valiant Solutions, Inc. All Rights Reserved.
11. Exporting a Report as a Different File Type When you create your report in Report Builder, you are telling Report Builder what the report layout should look like and what data should be retrieved from the data source. By clicking Run Report, you are telling Report Builder to combine the layout of the report with the data from the data source.
Click if you want to save the report as a different file type. You need to be aware that the exported report will probably not look exactly the same as it did in Report Builder. Some export options, such as CSV, save only the data from the report while other export options, such as MHTML or Excel, save the data and try to save some of the design information so that the exported report looks similar to the report you designed.
Understanding how the available exporting options change the report's look can help you make effective decisions about how best to design your report so that it looks the way you want it to look whatever its final delivery format. Although there are no restrictions or requirements for using the different export options, some export options generate file types that are useful for specific purposes. For example, XML and CSV export options are useful for creating files that can be used as a data feed to another application or process, while MHTML and Excel export options are useful for creating files that look more familiar to report users. Knowing whether an export option produces similar output to another option can help you make decisions about report design. For example, if you are creating reports that are intended for viewing as physical pages, you might want to focus on a design that works well in Report Builder and in the export option file type that you plan to use. Once you have saved your report as a different file type, you can work with the resulting new file just like any other file of that type.
11.1 Export to CSV The Comma-Separated Value (CSV) export option saves report data as comma-delimited plain text files, without any formatting. The file uses a comma (,) to delimit fields and rows.
The resulting file can be opened in a spreadsheet program like Microsoft Excel or used as an import format for other programs. By default, the .csv file opens in Notepad. If accessed as a URL, the .csv file returns a MIME type of text/plain. The files are MIME version 1.0. When exported, a Report Builder report has the following characteristics when saved and opened as a CSV file:
The first text line of the file contains headers for all the columns in the report. All rows have the same number of columns. The field delimiter string is a comma (,). The record delimiter string is an invisible carriage return and line feed (<cr><lf>). The text qualifier string is a quotation mark ("). If the text contains a quotation mark, that quotation mark is doubled (""). If the exported report is a table, at the end of each row is a number that indicates the
number of rows returned in the report. For example, if 330 rows are returned in the report, the number 330 appears at the end of each row in the .csv file.
Formatting and layout are ignored. Fields that contain images as data are ignored.

Exporting A Report
Report Builder 37 <CONFIDENTIAL> This document contains information proprietary to Valiant, and may not be reproduced, disclosed or used in whole or part without the express written permission of Valiant. Copyright © 2007 Valiant Solutions, Inc. All Rights Reserved.
The remaining report items are sorted, from top to bottom, and then left to right. Each item is then saved to a column. The following table lists the considerations applied to items when exporting to a CSV file.
Table 11-1. CSV File Considerations
Item Save behavior
Text box
Saves the contents of the text box. The data is formatted according to the item's Format property.
Table Saves by expanding the table and creating a row and column for each row and column at the lowest level of detail. Subtotal rows and columns do not have column or row headings. Clickthrough reports are not supported.
Matrix Saves by expanding the matrix and creating a row and column for each row and column at the lowest level of detail. Subtotal rows and columns do not have column or row headings. Clickthrough reports are not supported.
Chart Saves a row for one set of the data values, and columns for the other set of data values. Clickthrough reports are not supported.
11.2 Export to Microsoft Excel The Excel export option in Report Builder is compatible with Microsoft Excel 97 and later; it saves the report as an Excel spreadsheet and tries to preserve the layout and original design of the report.
11.2.1 Limitations When saving your report as an Excel file you should be aware of the following limitations:
The maximum number of rows in Excel is 65,536. This is checked by the Excel export option, and an error is displayed in Excel if the limit is exceeded.
The maximum number of columns in Excel is 256. This is checked by the Excel export option, and an error is displayed in Excel if the limit is exceeded.
The maximum column width in Excel is 255 characters or 1,726.5 points. This is not checked by the Excel export option.
The maximum number of characters in a cell is 32,767. This is not checked by the Excel export option.
There is a limit to the number of worksheets that Excel can have per workbook. Each page of the rendered report becomes a worksheet; an error is displayed in Excel if the limit is exceeded.
Excel supports only the following border line widths: 0.5 pt., 1.0 pt., and 1.5 pt. Excel supports only a predefined set of colors. When the report is saved as an Excel file,
Excel takes the colors used in the report and maps them to the best match. Report Builder formulas are not converted to Excel formulas. Instead, the value is placed
directly in the cell. Charts are saved as pictures, not Excel charts. Tables in reports are saved as a set of formatted cells in Excel, similar to the rows and
columns within the report when you run it. Matrices in reports are saved as a set of formatted cells in the Excel file, much like the
report when you run it. Matrix subtotals are not saved as formulas, and the matrix is not saved as an Excel PivotTable. Matrix data regions are fully expanded when saved in Excel.
Text boxes are exported and appear as formatted text in the Excel file. If the text string is longer than one cell width, multiple cells are merged to accommodate the text.

Exporting A Report
Report Builder 38 <CONFIDENTIAL> This document contains information proprietary to Valiant, and may not be reproduced, disclosed or used in whole or part without the express written permission of Valiant. Copyright © 2007 Valiant Solutions, Inc. All Rights Reserved.
Fields in Report Builder can contain images. When images are rendered to Excel, they are rendered as static pictures.
11.2.2 Page Layout A report can consist of multiple pages of data. Excel preserves layout and page breaks in an exported report. All page break information is written into the worksheet for printer pagination. However, tables and matrices that contain other elements that have page breaks might not save correctly. The layout of the data becomes a table generated from the entire report. Cells are merged as necessary to let report items cover their allotted area. Overlapping elements are handled by placing them next to each other. Rows and columns are sized to match the layout of the original report. If the layout has too many rows or columns for Excel, the export option generates an error and the report is not processed. The paper height and width are compared to an internal table containing the most common paper sizes and orientations. If there is a match, that paper size is used, and the orientation is set to Portrait. If the height and width are not found, the internal paper size table is searched again with the width and height reversed. If a match is found, then the paper size is used but the orientation is set to Landscape. If still no match is found, orientation is determined by comparing the height to the width. If the paper height is greater than the width, the orientation is set to Portrait; otherwise it is set to Landscape.
11.3 Export to PDF The PDF export option saves report data to a file that can be opened in Adobe Acrobat and other third-party PDF viewers that support PDF 1.3. Although PDF 1.3 is compatible with Adobe Acrobat 4, Report Builder supports Adobe Acrobat 6 or later. PDF viewers such as Adobe Acrobat are required for viewing or printing a report that is exported to a PDF format.
11.3.1 Fonts When the PDF export option saves a report as a PDF file, it uses the information stored in the Report Builder fonts used in the report to create character mappings within the PDF file. The PDF export option does not embed fonts. If the font used in the report is not installed on the report server, the resulting PDF file might not contain the correct mappings and might not display correctly when viewed. In addition, the computer that you use to view the report must also have the correct font installed. If the font is not installed, the report might not display correctly. Differences in PDF output occur most often when the report uses Arial and it includes non-Latin characters. Before sharing your report as a PDF file, you should test the PDF file on several different computers to verify that the report appears correctly.
11.3.2 Images If an image in the report is originally stored in JPEG format, the PDF file will contain that image in JPEG format. Images originally stored in other formats appear in PNG format.