guide to risk assessment for reservoir safety management
TRANSCRIPT
Guide to risk assessment for reservoir safety management Piloting summary report Report – SC090001/R3

ii Risk Assessment in Reservoir Safety Management: Piloting summary report
The Environment Agency is the leading public body protecting and improving the environment in England.
It’s our job to make sure that air, land and water are looked after by everyone in today’s society, so that tomorrow’s generations inherit a cleaner, healthier world.
Our work includes tackling flooding and pollution incidents, reducing industry’s impacts on the environment, cleaning up rivers, coastal waters and contaminated land, and improving wildlife habitats.
This report is the result of research commissioned by the Environment Agency’s Evidence Directorate and funded by the joint Environment Agency/Defra Flood and Coastal Erosion Risk Management Research and Development Programme.
Published by: Environment Agency, Horizon House, Deanery Road, Bristol, BS1 5AH www.environment-agency.gov.uk ISBN: 978-1-84911-305-2 © Environment Agency – August 2013 All rights reserved. This document may be reproduced with prior permission of the Environment Agency. The views and statements expressed in this report are those of the author alone. The views or statements expressed in this publication do not necessarily represent the views of the Environment Agency and the Environment Agency cannot accept any responsibility for such views or statements. Further copies of this report are available from our publications catalogue: http://publications.environment-agency.gov.uk or our National Customer Contact Centre: T: 08708 506506 E: [email protected].
Author(s): Alan Brown Michael Wallis Dissemination Status: Publicly available Keywords: Reservoir, Dam, Risk Analysis, Safety, Risk Assessment, Failure, Breach, Consequences, Tolerability, Evaluation Research Contractor: HR Wallingford, Howbery Park, Wallingford, Oxfordshire. OX10 8BA +44 (0) 1491 835381 HR Wallingford Ref no: MCR4751-RT003-R02-00 Environment Agency’s Project Manager: Dave Hart, Evidence Directorate Collaborator(s): Atkins Ltd, Jacobs, Sayers & Partners, RAC Engineers & Economists, Stillwater Associates, Samui Ltd, United Utilities Project Number: SC090001/R3

Risk Assessment in Reservoir Safety Management: Piloting summary report iii
Evidence at the Environment Agency Evidence underpins the work of the Environment Agency. It provides an up-to-date understanding of the world about us, helps us to develop tools and techniques to monitor and manage our environment as efficiently and effectively as possible. It also helps us to understand how the environment is changing and to identify what the future pressures may be.
The work of the Environment Agency’s Evidence Directorate is a key ingredient in the partnership between research, guidance and operations that enables the Environment Agency to protect and restore our environment.
This report was produced by the Scientific and Evidence Services team within Evidence. The team focuses on four main areas of activity:
Setting the agenda, by providing the evidence for decisions;
Maintaining scientific credibility, by ensuring that our programmes and projects are fit for purpose and executed according to international standards;
Carrying out research, either by contracting it out to research organisations and consultancies or by doing it ourselves;
Delivering information, advice, tools and techniques, by making appropriate products available.
Miranda Kavanagh
Director of Evidence

iv Risk Assessment in Reservoir Safety Management: Piloting summary report
Executive summary It is a considerable challenge to ensure acceptable performance from dam assets and to manage risk in the short to longer term through physical interventions to maintain, repair, improve or replace assets, while avoiding unnecessary expenditure. The wide variety of dam types and forms and their physical settings complicates the task. Within this complex setting, the concepts of risk and performance provide dam managers with a consistent framework to analyse and understand the critical components of their dam, and to target effort in further data collation, assessment or intervention appropriately.
A scoping study conducted by the Environment Agency in 2009 (SC070087/R1) established the need to update the Interim Guide to Quantitative Risk Assessment for UK Reservoirs, originally published in 2004, to provide a tool for the management of reservoir safety. It was recommended that this update should include a review of the risk management framework so that this meets a wider range of reservoir owner/undertaker and industry needs as well as fitting with current UK government flood risk assessment policy and practice.
Reservoir safety management involves managing the risk of an uncontrolled release of the contents of a reservoir. This new document has sought to explain and guide the user through the steps of the risk informed approach to reservoir safety management. This provides an introduction and explanation of basic concepts and a detailed application of the methods and appropriate links to other reference documents and guidance.
This report presents the evaluation of the results and outputs of risk assessments completed on a sample of reservoir dams in England and Wales using the methods in the new guide. The results were calibrated and validated using established ranges of reservoir risk measures for the UK as well as previous risk assessments and engineering judgement.
The results indicate that the guidance, when properly applied, should not lead to a change in the range of results compared with evidence from previous studies. However, the findings also confirm that care is needed in the application of the methodologies and that confidence in the outputs relies on good engineering judgement. Reviews of the outputs are important steps in the process and should be conducted as recommended in the guidance.

Risk Assessment in Reservoir Safety Management: Piloting summary report v
Acknowledgements This document has been prepared by the Environment Agency with significant assistance from HR Wallingford and Stillwater Associates. The data were provided from pilot studies conducted during the development of the updated guidance on risk assessment for reservoirs guidance published in May 2013 by the joint Environment Agency/Defra Flood and Coastal Erosion Risk Management Research and Development Programme.
The pilot risk assessments were conducted by engineers at Jacobs, Atkins Ltd and HR Wallingford with assistance from the reservoir owners and engineers who provided funding, data and information on the reservoir dams including:
Severn Trent Water
Dŵr Cymru Welsh Water
United Utilities
Bristol Water
Northumbrian Water
Canal and River Trust

vi Risk Assessment in Reservoir Safety Management: Piloting summary report
Contents 1 Introduction 1
2 Overview of the pilots 2
2.1 Methodology / approach 2
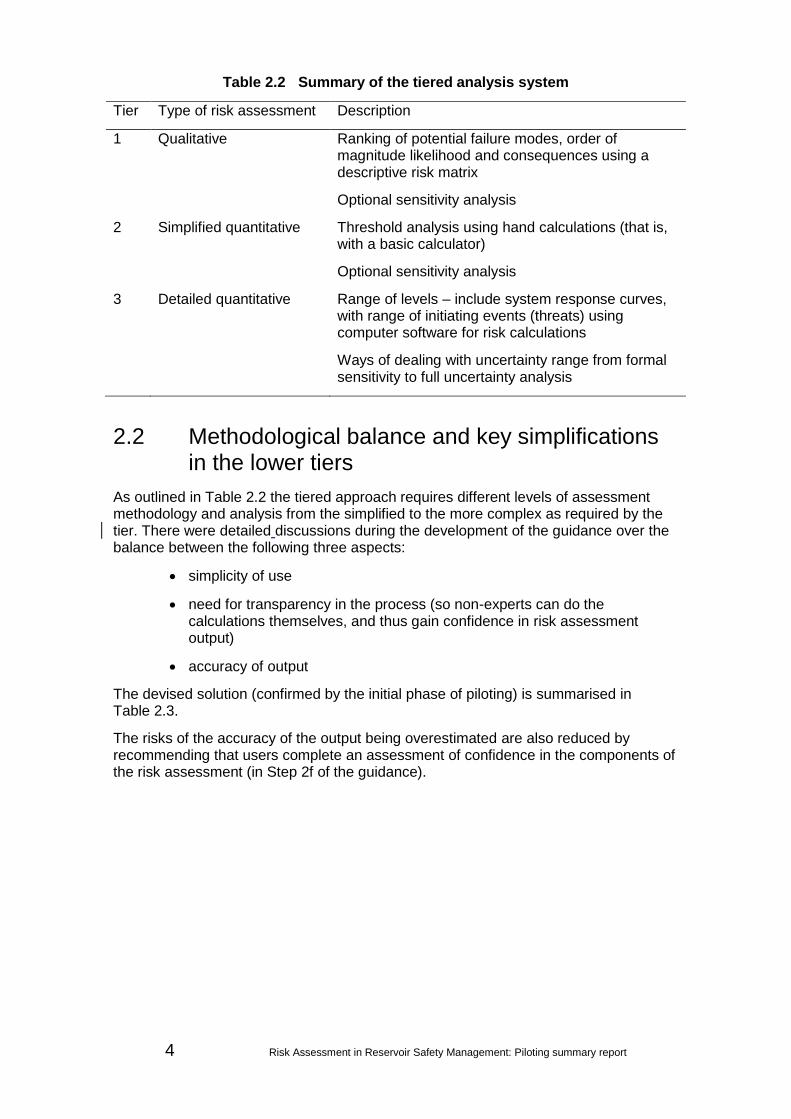
2.2 Methodological balance and key simplifications in the lower tiers 4
3 Outcomes from the pilot assessments 6
3.1 The results of the assessments 6
3.2 Refinements to the guide 6
3.3 Review of pilot results / outputs 7
4 Conclusions 11
References 12
List of abbreviations 13
Appendix A: Methodologies matrix 14
Appendix B: Example assessment outputs 18
Example Tier 1 output 19
Example Tier 2 output 27
Appendix C: Tables of results 33
Appendix D: Plots of results 36 Table 2.1 Main characteristics of the dams piloted in the study 2 Table 2.2 Summary of the tiered analysis system 4 Table 2.3 Compromise between accuracy of output and simplicity incorporated in the guidance 5 Table 3.1 Summary of adjustments to elements of the methodology 6 Table 3.2 Evaluation of the assessment for reasonableness of the results 9 Table 4.1 Areas for potential research to improve future guidance 11 Table C1 Tier 1 pilot results 34 Table C2 Tier 2 pilot results 35 Figure D1 Dam height vs. reservoir volume 37 Figure D2 Cumulative distribution of total probability of failure 38 Figure D3 Probability of failure of internal threats – New South Wales method vs. Interim Guide method 39 Figure D4 Annual probability of failure vs. date of construction 40 Figure D5 Cumulative distribution of average societal life loss 41 Figure D6 Average societal life loss vs. damages 42 Figure D7 Probability of failure Tier 1 vs. Tier 2 43 Figure D8 Average societal life loss Tier 1 vs. Tier 2 44 Figure D9 Tier 2 risk as F-N chart 45 Figure D10 Tier 1 risk as F-N chart 46

Risk Assessment in Reservoir Safety Management: Piloting summary report 1
1 Introduction This report assesses the results of the piloting of the risk assessment methodology conducted on a range of UK reservoirs as part of the joint Defra / Environment Agency Flood and Coastal Erosion Risk Management Research and Development Programme funded project SC09001 ‘Risk Assessment for Reservoirs’. This project produced updated guidance on risk assessment in reservoir management (Defra/Environment Agency 2013a,b).
The assessment set out to test whether the outputs of the new risk assessment methodology are reasonable, or whether the methodology needed some adjustment to obtain reasonable estimates. The basis of validation of the output was to use the published data listed in section 15.2.4 of Volume 2 of the guidance (Defra/Environment Agency 2013b) and to compare the results with previous risk analyses where available.

2 Risk Assessment in Reservoir Safety Management: Piloting summary report
2 Overview of the pilots
2.1 Methodology / approach
A number of dam owners in England and Wales generously supported the development of the risk assessment for reservoirs guidance by offering dams from their portfolios to trial the new methodologies and guidance (Environment Agency 2013a,b).
The project team defined an ‘ideal’ requisite list and combination of characteristics for dams that would represent the widest possible population of UK dams and also meet the requirements for the trials. From those dams offered by owners the team selected a range of ages, sizes and types that most closely matched the ‘ideal’ list of characteristics. Table 2.1 lists the main characteristics of the dams selected.
Table 2.1 Main characteristics of the dams piloted in the study
Composition Height (m) (approx.)
Reservoir capacity (m3) (approx.)
Consequence category
1 Earth embankment 6 300,000 C
2 Earth embankment 9 >500,000 C
3 Earth embankment 12 50,000,000 A
4 Earth/clay core 12 1,100,000 A
5 Earth/clay core 13 >20,000,000 A
6 Earth homogenous 14 1,600,000 A
7 Concrete 17 >600,000 A
8 Earth/clay core 20 2,200,000 A
9 Composite concrete/earth 25 41,000 A
10 Earth/ shale – zoned/clay core 48 20,000 A
11 Concrete buttress 72 50,000,000 A
As well as structure type, height, reservoir capacity and consequence category, several other ‘ideal’ requirements were met by the choice of dams including:
age (from ~40 to over 200 years old)
penetrating structures (for example, pipes and cut-offs)
range of construction methods and materials
range of condition grades
reservoir system type (that is, cascade, rural, urban and so on)
spillways
The best match of dams with parameters close to the ‘ideal’ list were made from the dams on offer. However, the range of characteristics of the dams meant some selection criteria had to be compromised compared with the ‘ideal’ list. For example, no

Risk Assessment in Reservoir Safety Management: Piloting summary report 3
‘B’ consequence category dams were offered. However, two dams on the final list are borderline; they have been categorised as A and B at different times and their classification remains debateable. As shown in Figure D6 in Appendix D, the sample does cover a wide range of average societal life loss (ASLL) and damages. Because the focus of the trials was more about testing the methods for determining probabilities of failure than the consequences (which have more established/less contentious analysis methods), the consequence categorisation was considered less of a governing parameter than others in terms of choice of dam. (At the time, the reservoir risk categorisation method was also under review.)
Risk assessments were conducted on 12 dams including nine embankment dams and three concrete dams. One embankment dam was the associated saddle dam to one of the concrete dams for which risk assessments were combined to provide the overall probability of failure (POF).
A first round of piloting (Phase 1) was conducted by members of the project team on a small number of these dams to check the capability and appropriateness of the methods developed. Some refinements (see section 3) and calibrations were then made to the methods and guidance before a second round (Phase 2) was undertaken by agroup of engineers who had been involved in the development of the guidance. Engineers with a range of experience were deliberately chosen to test the usability of the guide. The results of these assessments were collated and validated using established and known ranges of reservoir risk measures for the UK, previous risk assessments and engineering judgement. Where available, previous risk assessments for some dams were also consulted to examine and evaluate differences in the results obtained.
A limiting factor in the pilot studies was the ability to test all three tiers of the methodology (Table 2.2). Although the approaches and analytical methods in Tiers 1 and 2 were applied, the testing was not extended to include those outlined in Tier 3. Tier 3 analyses are complex and costly to perform; they will be undertaken by a team of specialist engineers, using numerical/computer models. Piloting these techniques would not have added l value to the guidance or benefited the user group. Where application of Tier 3 analyses would have benefitted an assessment (for example, to reduce uncertainty or improve accuracy), this was identified in the pilot reporting as part of the assessment process and captured as a recommendation (making such recommendations to move to another tier or type of analysis is an outcome of the risk assessment methodology itself).
4 Risk Assessment in Reservoir Safety Management: Piloting summary report
Table 2.2 Summary of the tiered analysis system
Tier Type of risk assessment Description
1 Qualitative Ranking of potential failure modes, order of magnitude likelihood and consequences using a descriptive risk matrix
Optional sensitivity analysis
2 Simplified quantitative Threshold analysis using hand calculations (that is, with a basic calculator)
Optional sensitivity analysis
3 Detailed quantitative Range of levels – include system response curves, with range of initiating events (threats) using computer software for risk calculations
Ways of dealing with uncertainty range from formal sensitivity to full uncertainty analysis
2.2 Methodological balance and key simplifications in the lower tiers
As outlined in Table 2.2 the tiered approach requires different levels of assessment methodology and analysis from the simplified to the more complex as required by the tier. There were detailed discussions during the development of the guidance over the balance between the following three aspects:
simplicity of use
need for transparency in the process (so non-experts can do the calculations themselves, and thus gain confidence in risk assessment output)
accuracy of output
The devised solution (confirmed by the initial phase of piloting) is summarised in Table 2.3.
The risks of the accuracy of the output being overestimated are also reduced by recommending that users complete an assessment of confidence in the components of the risk assessment (in Step 2f of the guidance).

Risk Assessment in Reservoir Safety Management: Piloting summary report 5
Table 2.3 Compromise between accuracy of output and simplicity incorporated in the guidance
Element of risk assessment
Compromise Practical drawbacks
Failure modes identification
Tier 1 structured as core threats,* with user to identify additional failure mode, rather than brainstorming from blank page
Increased risk of overlooking critical failure mode
Partitioning of load domain
Tier 1 and 2 both consider single ‘dam critical’ load rather than curves of load vs. probability, which are then integrated with curves for system response.
May overlook critical response at intermediate load. Position of step may not be best estimate.
Reservoir level vs. time
Assume normally full. Although this is valid for many UK reservoirs (for example, amenity lakes), it will be conservative where the lake is well below top water level (TWL) for significant proportions of the year.
System response Tier 1 and 2 both consider single (step) response (probability), rather than two (or multiple) point fragility curve.
As above
Consequence scenarios
Tier 1 and 2 limited to one and two scenarios respectively.
Less accurate (probably conservative)
Tools to identify and quantify number of receptors
Tier 1 and 2 allow use of published 1:25,000 scale map, rather than requiring computer based assessment.
Less accurate identification and quantification of receptors
Presentation of risk output
Tier 1 and 2 limited to total probability, rather than individual failure modes (and uncertainty bounds on those estimates)
Need to drill down into individual failure mode to understand the critical threats
Notes: * Analysis undertaken when developing the Interim Guide (Brown and
Gosden 2004) and other portfolio risk analysis in UK concluded that the threat to UK reservoirs from earthquakes is not significant compared with other threats. Earthquakes have therefore not been included as a core threat in Tier 1 or Tier 2 (unless there is a liquefiable foundation). Where mining activity has been commonplace in the area of the dam, the effects of subsidence on the dam may be included. However, such analyses are likely to be very site-specific and specialist, and would warrant a Tier 3 analysis. The susceptibility of all dams and reservoirs to acts of vandalism or terrorism should be considered as part of routine reservoir safety management and are not considered further separately in the guidance.

6 Risk Assessment in Reservoir Safety Management: Piloting summary report
3 Outcomes from the pilot assessments
3.1 The results of the assessments
Example Tier 1 and Tier 2 risk assessment report forms from the pilots are shown in Appendix B. The outputs from all 11 risk assessments have been collated and are tabulated in Appendix C. An evaluation and validation of the results of the risk assessments is given in section 3.3.
3.2 Refinements to the guide
The methods of analysis considered for the guidance included a range of tried and tested methods (that produce reasonable results), some of which had not been used together before. Some methods were different approaches to the analysis of the same issue (for example, determination of dam condition) and a decision had to made about which to adopt. We considered which methods are appropriate for each level of asessment (Tier 1, 2 or 3). The pilots tested the approach ‘in the round’ andthe ability of the analyses to deliver appropriate results for the level of detail of the tier in which they are used. The project team agreed on the methods outlined in the matrix in Appendix A. (Example outputs for main stages of the analyses were subsequently included as part of the guidance document.)
As a result, aside from the many There were changes made to the guide during its development addressing comments from the project team and steering group reviews, the methodology in the draft guide (issued January 2013) was also refined where the piloting suggested that the output was ‘not reasonable’ (and the results of the pilots adjusted for the revised methodology) as summarised in Table 3.1.
Table 3.1 Summary of adjustments to elements of the methodology
Tier Element of methodology
Aspect causing concern
Change
1+2 Probability of failure of embankments due to slope instability
Probability of failure too high
Added conditional probability of release of reservoir, given slope failure.
2 Routing of dam break failure
Rate of attenuation too low
Added advice to use Tarrant et al. (1994) to set maximum distance for extent of total and partial destruction.
2 Method for annual probability of failure (APF) due to internal threats
Two methods provided: New South Wales and cumulative scoring
Simplified to one method (conservative).
2 Upstream dam Not included Added text explaining why.
2 Probability of failure due to water coming out of chute
Including bends is too complex
Methodology dealing with bends moved to Part 2.

Risk Assessment in Reservoir Safety Management: Piloting summary report 7
3.3 Review of pilot results / outputs
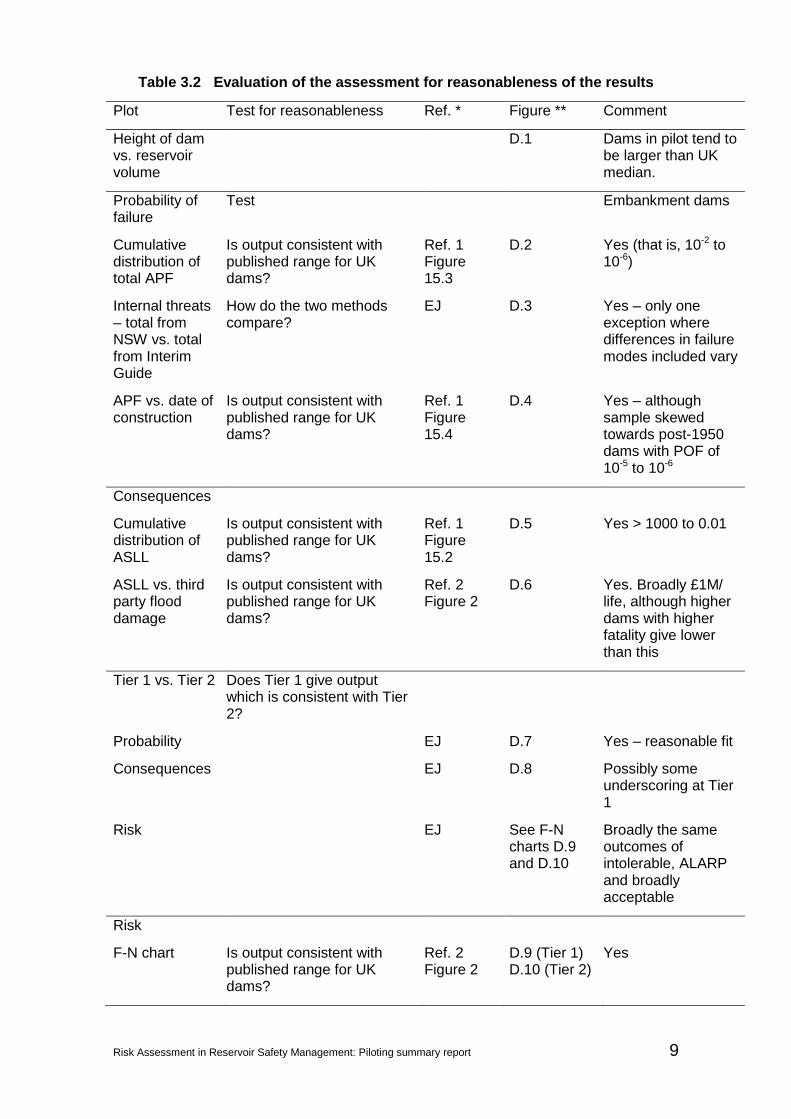
A number of tests were applied to the data to check the reasonableness of the outputs from the reservoir risk assessments. These tests are listed in Table 3.1. These and the comments provided should be considered in conjunction with the plots in Appendix D.
The criteria used to assess reasonableness included:
Ref. 1 – as described in Chapter 15 of Volume 2 of the guide (Defra/Environment Agency 2013b)
Ref. 2 – Application of the Interim Guide to Quantitative Risk Assessment across multiple dam owners by multiple Jacobs offices (Brown et al. 2008)
EJ – Engineering judgement
For inter-tier comparison purposes, numeric values were assigned to (Tier 1) probability and consequence levels as per Table 15.3 of Volume 2 of the guide (Defra/Environment Agency 2013b).
3.3.1 Tier 1 review
The Tier 1 outputs were assessed by converting the verbal description to numeric value for the mid-point for that range, using Table 15.3 (in Volume 2 of the guide) and then plotting overall probability and consequences against Tier 2. Although the results were reasonable in overall terms, some further adjustments were made for stability of concrete dams and average societal life loss (ASLL), which were under predicting the magnitude of risk.
3.3.2 Tier 2 review
The overall range of total probability of failure using the Tier 2 methods is reasonable,
varying from 10-2 to 5 10-6. Similarly the overall range of estimated ASLL is reasonable; varying from 0.01 to between 1,000 and 5,000, and the range of plots on a F-N chart corresponds to the previously noted range of results for UK dams.
The outlier on Figure D3 in Appendix D can be attributed to the inclusion of the spillway of the dam in the pilot risk assessment that wasn’t considered in the New South Wales (NSW) method (see section 17.3 of Volume 2 of the guide). This failure mechanism dominated other internal threats.
Figure D5 shows one dam with a very low ASLL (which is correct – one dam was in a very rural and remote location with no consequences). No other dams in the sample returned an ASLL <400.
Figure D6 shows one dam with relatively low damages (~0.15) but with a very high ASLL. This is attributed to the exclusion of direct damages (only third party damages were included in the calculation).
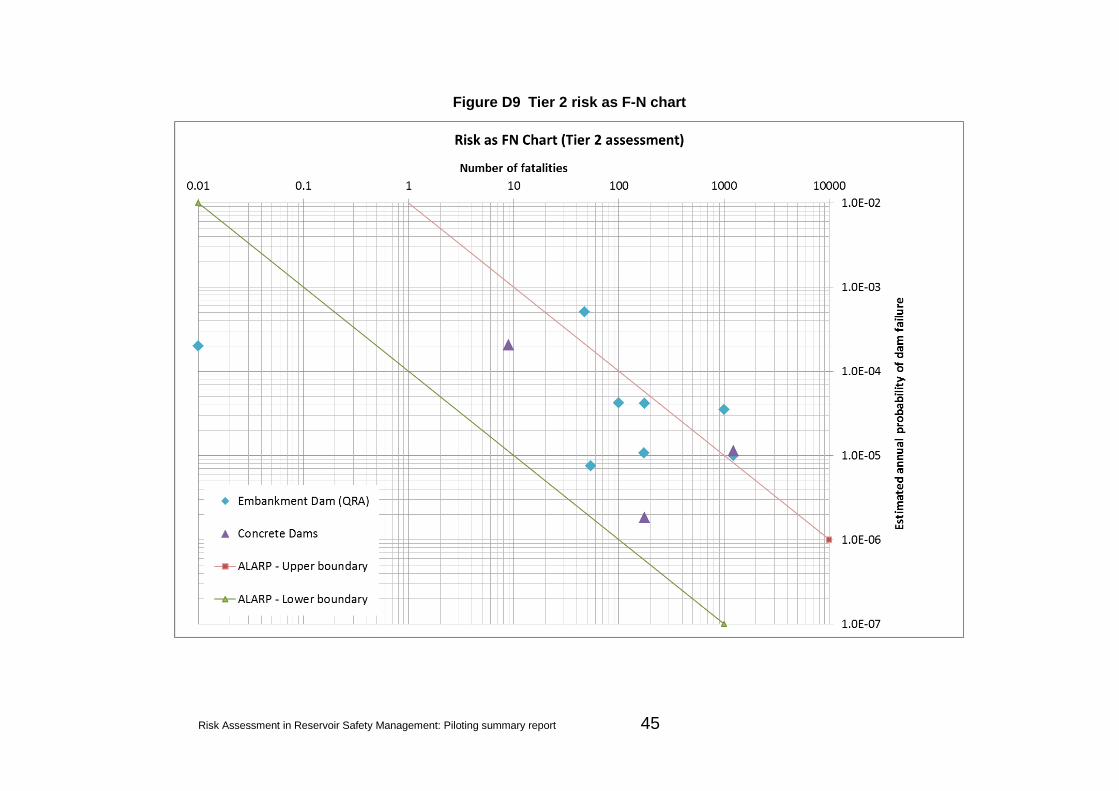
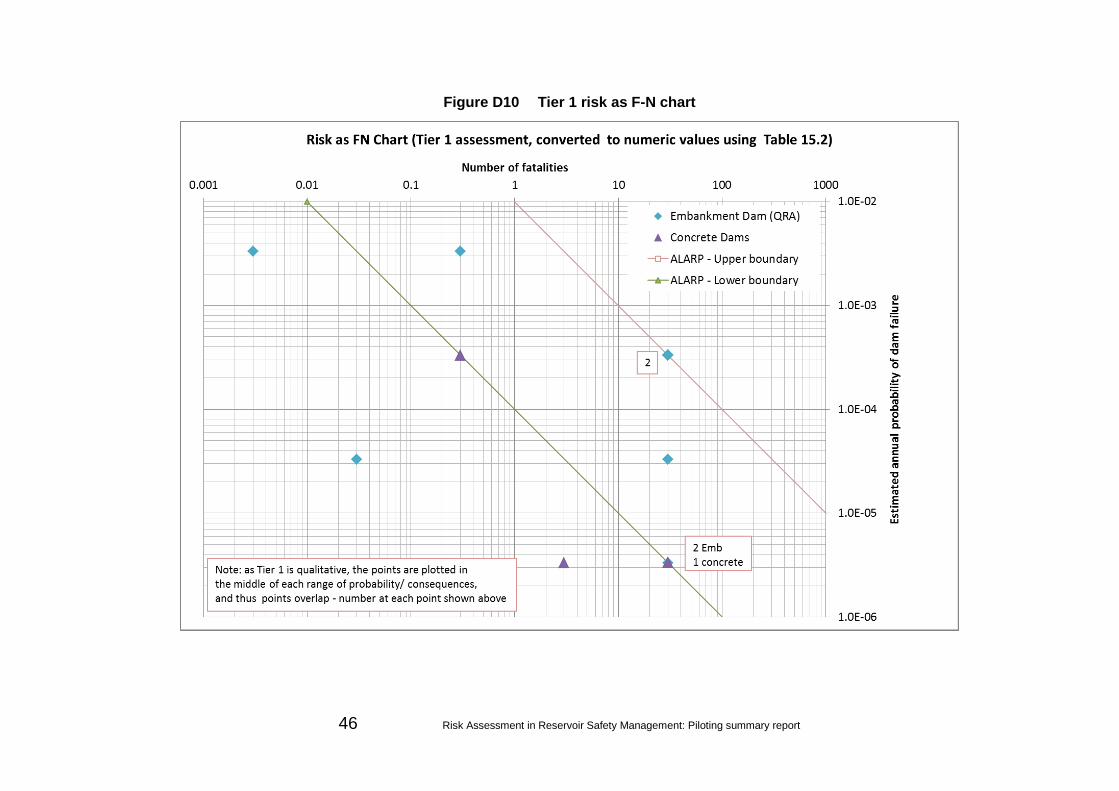
Figure D7 indicates that there is a general consistency in overall probability of failure between Tiers 1 and 2, although Figure D8 suggests that Tier 1 may slightly underscore ASLL. Figure D10 reflects the less precise results and wider spread from Tier 1 (as expected) compared with those of Tier 2 in Figure D9.
Further comments on all of the plots shown in Appendix D are given in Table 3.2.
8 Risk Assessment in Reservoir Safety Management: Piloting summary report
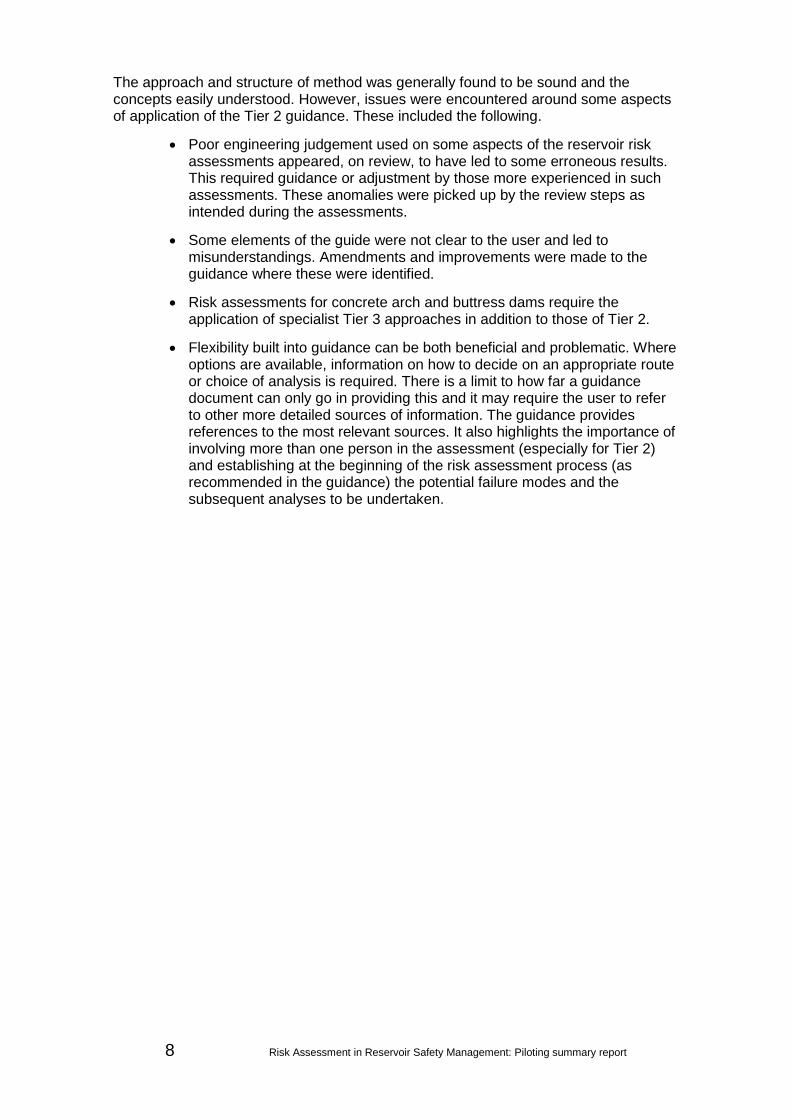
The approach and structure of method was generally found to be sound and the concepts easily understood. However, issues were encountered around some aspects of application of the Tier 2 guidance. These included the following.
Poor engineering judgement used on some aspects of the reservoir risk assessments appeared, on review, to have led to some erroneous results. This required guidance or adjustment by those more experienced in such assessments. These anomalies were picked up by the review steps as intended during the assessments.
Some elements of the guide were not clear to the user and led to misunderstandings. Amendments and improvements were made to the guidance where these were identified.
Risk assessments for concrete arch and buttress dams require the application of specialist Tier 3 approaches in addition to those of Tier 2.
Flexibility built into guidance can be both beneficial and problematic. Where options are available, information on how to decide on an appropriate route or choice of analysis is required. There is a limit to how far a guidance document can only go in providing this and it may require the user to refer to other more detailed sources of information. The guidance provides references to the most relevant sources. It also highlights the importance of involving more than one person in the assessment (especially for Tier 2) and establishing at the beginning of the risk assessment process (as recommended in the guidance) the potential failure modes and the subsequent analyses to be undertaken.
Risk Assessment in Reservoir Safety Management: Piloting summary report 9
Table 3.2 Evaluation of the assessment for reasonableness of the results
Plot Test for reasonableness Ref. * Figure ** Comment
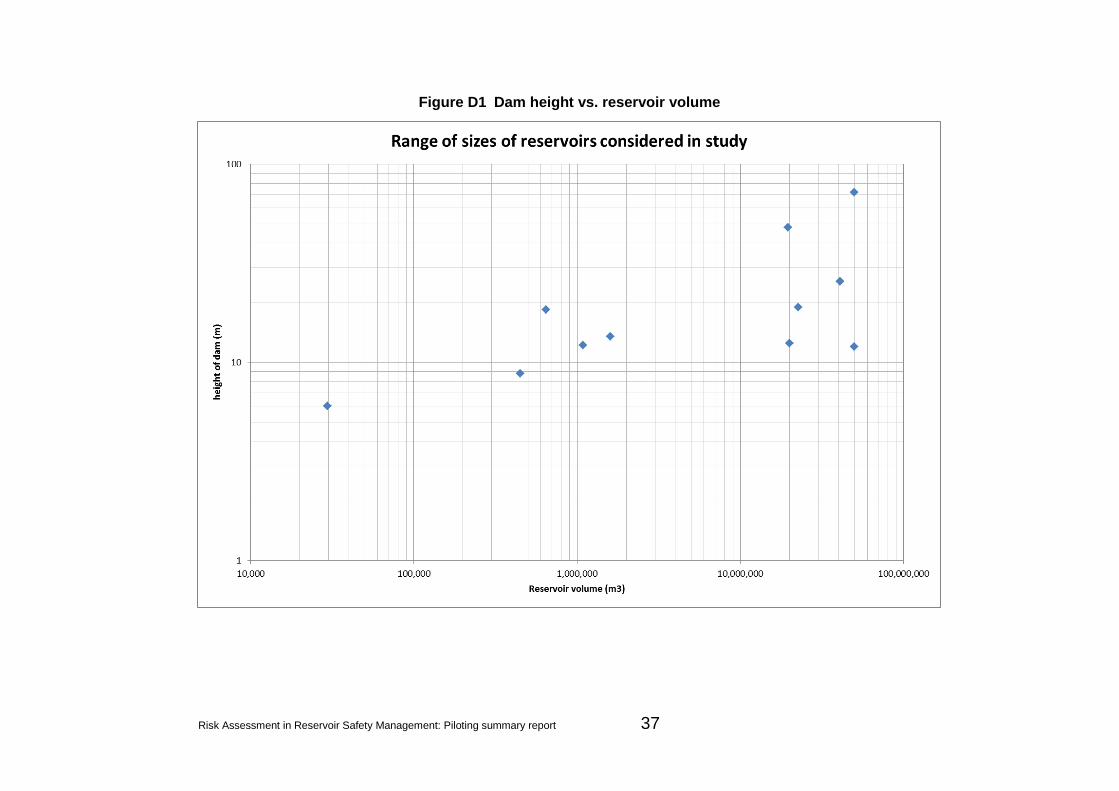
Height of dam vs. reservoir volume
D.1 Dams in pilot tend to be larger than UK median.
Probability of failure
Test Embankment dams
Cumulative distribution of total APF
Is output consistent with published range for UK dams?
Ref. 1 Figure 15.3
D.2 Yes (that is, 10-2 to 10-6)
Internal threats – total from NSW vs. total from Interim Guide
How do the two methods compare?
EJ D.3 Yes – only one exception where differences in failure modes included vary
APF vs. date of construction
Is output consistent with published range for UK dams?
Ref. 1 Figure 15.4
D.4 Yes – although sample skewed towards post-1950 dams with POF of 10-5 to 10-6
Consequences
Cumulative distribution of ASLL
Is output consistent with published range for UK dams?
Ref. 1 Figure 15.2
D.5 Yes > 1000 to 0.01
ASLL vs. third party flood damage
Is output consistent with published range for UK dams?
Ref. 2 Figure 2
D.6 Yes. Broadly £1M/ life, although higher dams with higher fatality give lower than this
Tier 1 vs. Tier 2 Does Tier 1 give output which is consistent with Tier 2?
Probability EJ D.7 Yes – reasonable fit
Consequences EJ D.8 Possibly some underscoring at Tier 1
Risk EJ See F-N charts D.9 and D.10
Broadly the same outcomes of intolerable, ALARP and broadly acceptable
Risk
F-N chart Is output consistent with published range for UK dams?
Ref. 2 Figure 2
D.9 (Tier 1) D.10 (Tier 2)
Yes

10 Risk Assessment in Reservoir Safety Management: Piloting summary report
Notes: * See section 3.3. ** In Appendix D of this report ALARP = as low as reasonably practicable
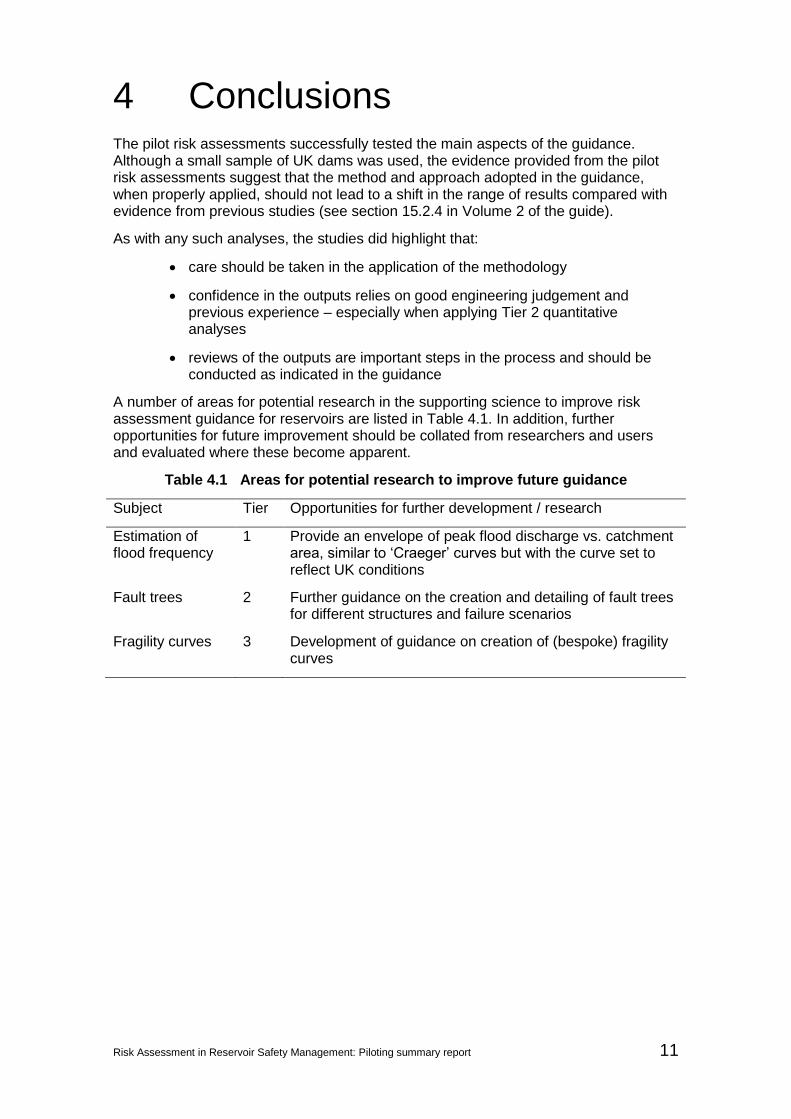
Risk Assessment in Reservoir Safety Management: Piloting summary report 11
4 Conclusions The pilot risk assessments successfully tested the main aspects of the guidance. Although a small sample of UK dams was used, the evidence provided from the pilot risk assessments suggest that the method and approach adopted in the guidance, when properly applied, should not lead to a shift in the range of results compared with evidence from previous studies (see section 15.2.4 in Volume 2 of the guide).
As with any such analyses, the studies did highlight that:
care should be taken in the application of the methodology
confidence in the outputs relies on good engineering judgement and previous experience – especially when applying Tier 2 quantitative analyses
reviews of the outputs are important steps in the process and should be conducted as indicated in the guidance
A number of areas for potential research in the supporting science to improve risk assessment guidance for reservoirs are listed in Table 4.1. In addition, further opportunities for future improvement should be collated from researchers and users and evaluated where these become apparent.
Table 4.1 Areas for potential research to improve future guidance
Subject Tier Opportunities for further development / research
Estimation of flood frequency
1 Provide an envelope of peak flood discharge vs. catchment area, similar to ‘Craeger’ curves but with the curve set to reflect UK conditions
Fault trees 2 Further guidance on the creation and detailing of fault trees for different structures and failure scenarios
Fragility curves 3 Development of guidance on creation of (bespoke) fragility curves
12 Risk Assessment in Reservoir Safety Management: Piloting summary report
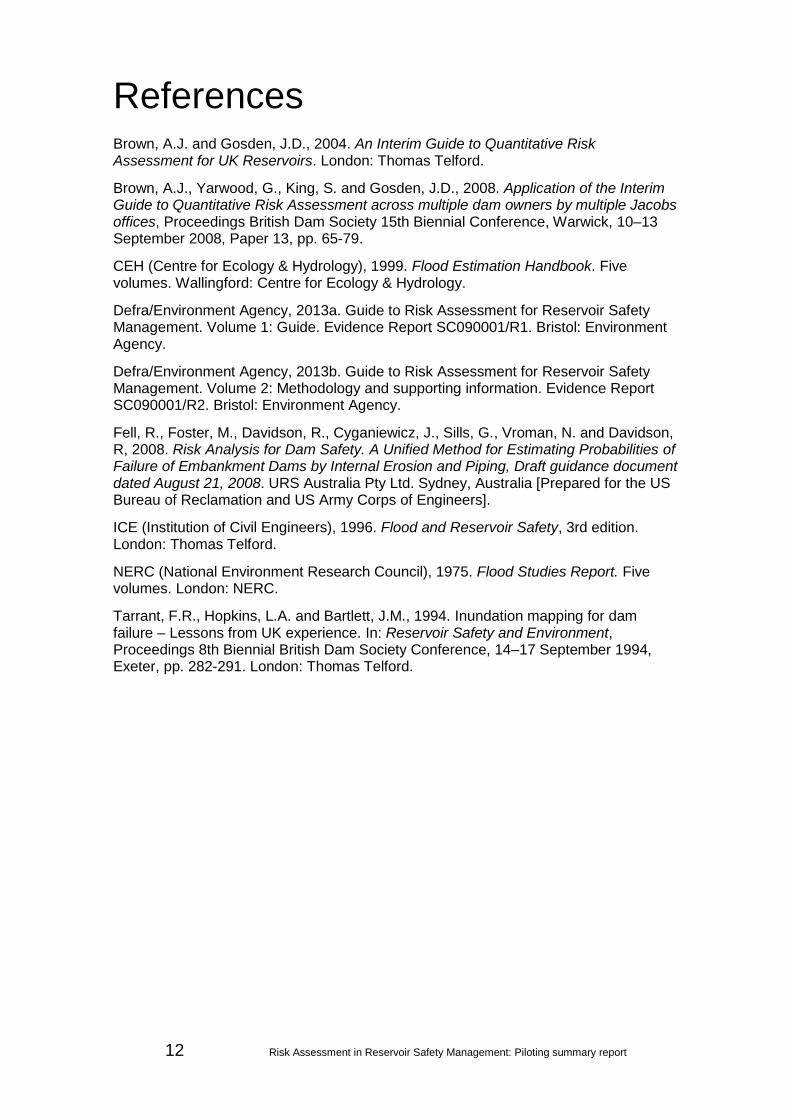
References Brown, A.J. and Gosden, J.D., 2004. An Interim Guide to Quantitative Risk Assessment for UK Reservoirs. London: Thomas Telford.
Brown, A.J., Yarwood, G., King, S. and Gosden, J.D., 2008. Application of the Interim Guide to Quantitative Risk Assessment across multiple dam owners by multiple Jacobs offices, Proceedings British Dam Society 15th Biennial Conference, Warwick, 10–13 September 2008, Paper 13, pp. 65-79.
CEH (Centre for Ecology & Hydrology), 1999. Flood Estimation Handbook. Five volumes. Wallingford: Centre for Ecology & Hydrology.
Defra/Environment Agency, 2013a. Guide to Risk Assessment for Reservoir Safety Management. Volume 1: Guide. Evidence Report SC090001/R1. Bristol: Environment Agency.
Defra/Environment Agency, 2013b. Guide to Risk Assessment for Reservoir Safety Management. Volume 2: Methodology and supporting information. Evidence Report SC090001/R2. Bristol: Environment Agency.
Fell, R., Foster, M., Davidson, R., Cyganiewicz, J., Sills, G., Vroman, N. and Davidson, R, 2008. Risk Analysis for Dam Safety. A Unified Method for Estimating Probabilities of Failure of Embankment Dams by Internal Erosion and Piping, Draft guidance document dated August 21, 2008. URS Australia Pty Ltd. Sydney, Australia [Prepared for the US Bureau of Reclamation and US Army Corps of Engineers].
ICE (Institution of Civil Engineers), 1996. Flood and Reservoir Safety, 3rd edition. London: Thomas Telford.
NERC (National Environment Research Council), 1975. Flood Studies Report. Five volumes. London: NERC.
Tarrant, F.R., Hopkins, L.A. and Bartlett, J.M., 1994. Inundation mapping for dam failure – Lessons from UK experience. In: Reservoir Safety and Environment, Proceedings 8th Biennial British Dam Society Conference, 14–17 September 1994, Exeter, pp. 282-291. London: Thomas Telford.

Risk Assessment in Reservoir Safety Management: Piloting summary report 13
List of abbreviations ALARP as low as reasonably practicable
APF annual probability of failure
ASLL average societal life loss
IE internal erosion
NSW New South Wales [method]
PMF probable maximum flood
POF probability of failure
QRA qualitative risk assessment
RIM reservoir inundation mapping

14 Risk Assessment in Reservoir Safety Management: Piloting summary report
Appendix A: Methodologies matrix

Risk Assessment in Reservoir Safety Management: Piloting summary report 15
Step Tier 1 Tier 2 Tier 3
1a Failure modes identification (FMI) Reviews all available information. Interview supervising engineer and reservoir owner. Identifies potential failure modes (likely using core failure modes). Classifies credible and significant failure modes.
As Tier 1 As Tier 2 and, in addition, involve reservoir team. Detailed description of each credible and significant failure mode. Uses preliminary event trees or fault trees.
1b Identify potential consequences Subjective, review of step 1a implications
1c Review, scope risk analysis Subjective, determines the risk assessment scope
2a Likelihood of failure due to internal threats
Embankment dams Uses a matrix of intrinsic condition and current condition.
Uses the probability of failure for the average dam from historic data. Then adjusts to the specific dam using condition mapping score, and adjusts to probability.
Uses event trees.
Concrete and masonry dams Uses a matrix of intrinsic condition and current condition.
Simplified event trees using limited calculations based on sliding and overtopping.
Uses event trees built on detailed analysis and use of US Bureau of Reclamation toolbox on piping failure (see Fell et al. 2008). Service reservoirs Simplified event trees using
limited calculations based on cantilever walls and piping.
2b Likelihood of failure due to external threats
Floods and waves (overtopping) Simple assessment of weir capacity, spillway capacity
As Floods & Reservoir Safety (ICE 1996) Appendix 1
Full Flood Studies Report (FSR) (NERC 1975) and Flood

16 Risk Assessment in Reservoir Safety Management: Piloting summary report
Step Tier 1 Tier 2 Tier 3
approach Estimation Handbook (FEH) (CEH 1999) analysis
Stability analysis – embankment dams
Review against similar dams. Slope stability charts (earthquake not normally critical)
Stability / seismic analysis
Stability analysis – concrete and masonry dams
Review against similar dams. Stability analysis, including earthquake
Stability analysis, including earthquake
Stability analysis – service reservoirs
Review against similar dams. Stability analysis, including earthquake
Stability analysis, including earthquake
Other external threats Not normally considered. Not normally considered. Not normally considered.
2c Dambreak and flood routing Existing maps or proportion of dam height plus estimated inundation area
Simplified breach (Froehlich) and modified CIRIA C542
Full breach analysis and inundation modelling
2d Consequence analysis Uses a qualitative assessment of broad scale number of houses, using a 25,000 scale map
Uses as simplified quantitative assessment using 25,000 map and drive down valley
Uses a GIS-based assessment.
2e Determine level of risk Uses a matrix plotting the likelihood of downstream flooding and the magnitude of consequences given downstream flooding.
Uses the conditional probability of the failure mode and the consequence scenarios to determine the probability of risk.
Uses a quantitative assessment considering multiple failure modes and consequence scenarios.
2f Review outputs Subjective, determines the risk assessment structure
3a Review tolerability of risk Review on tolerability/ALARP matrix.
Review tolerability/ALARP matrix and F-N chart.
Review

Risk Assessment in Reservoir Safety Management: Piloting summary report 17
Step Tier 1 Tier 2 Tier 3
3b Review options to reduce risk Review Review Review
3c Proportionality Review (broadly) Review (qualitative) Review (qualitative)
3d Other considerations Review Review Review
3e Review and make recommendations
Recommendations may include undertaking a Tier 2 or 3 assessment
Recommendations may include undertaking a Tier 3 assessment
Recommendations

18 Risk Assessment in Reservoir Safety Management: Piloting summary report
Appendix B: Example assessment outputs

Risk Assessment in Reservoir Safety Management: Piloting summary report 19
Example Tier 1 output
Summary Sheet – Tier 1 Assessment
Dam details
Dam name X Dam
Grid reference ST XXX XXX
Location, description X km NE of nearby town / village in area / region X
Dam age X years
Dam height X m
Reservoir volume XXXXXXXX m3
Flood category X
Assessment reference XX/XX/XXXX-XX (assessor’s name)
Date of assessment --/--/----
Step 1 - Risk identification
Failure mode ID
Description of failure modes Credible? Justification Significant? Justification Initiation
(threat) Progression
(failure mode) Breach
Internal
Db10 High water level during flood Deterioration
Cracked core and internal erosion of embankment fill
Full breach
Yes Puddle clay core with selected fine material both sides before general fill. Chimney drain in middle of downstream shoulder of unknown grading. Unlikely to be in filter compatibility. Risk of sandstone bands in general fill
Yes Too many unknowns. However no signs of significant settlement apart from adjacent to the spillway works. Several features present aimed at reducing risk (zoning of embankment, chimney drain and rock toe), suggesting that vulnerability is weighted more towards unlikely than likely.

20 Risk Assessment in Reservoir Safety Management: Piloting summary report
Df10 High water
level during
flood
Deterioration
Internal
erosion from
embankment
into soil
foundation
Embank
ment
collapse
Yes Two possible
mechanisms: (a) clay core
directly into foundation;
and (b) downstream
shoulder into foundation;
sand blanket could protect
but grading unknown;
grading of alluvium
unknown but potential for
presence of sands/gravels
Yes Too many unknowns. Provision
of sand blanket suggests that
vulnerability is weighted more
towards unlikely than likely.
Ds10 High water
level during
flood
Deterioration
Internal
erosion from
embankment
into rock
foundation
Embank
ment
collapse
Yes Sides of clay core at
interface between general
foundation stripping level
and concrete cut-off is the
area of risk; not certain of
treatment in this area;
could be a particular issue
where sandstone bands
intersect the core
foundation.
Yes Too many unknowns. No
evidence of treatment of
sandstone bands suggests that
vulnerability is weighted more
towards likely than unlikely.
Df10 High water
level during
flood
Deterioration
Internal
erosion in
foundation
Embank
ment
collapse
Yes Concrete cut-off through
foundation; as built
records show extended
where fault found
No Unlikely to be a significant
through 5 ft thick concrete wall.

Risk Assessment in Reservoir Safety Management: Piloting summary report 21
Di10 Deterioration
of foundation
along
interface
Internal
erosion along
outside of
outlet culvert
Full
breach
No Concrete tunnel fully
embedded in concrete cut-
off; away from cut-off not
clear if cast against marl or
backfilled. Concrete cut-off
at interface between wet
and dry sections of culvert
No Located just outside alluvium in
marl; reliant on effectiveness of
5 ft thick concrete cut-off
Di10 Deterioration
of foundation
along
interface
Internal
erosion along
outside of
spillway
Partial
breach
Collapse
of
spillway
walls and
erosion
of slot
through
abutment
Yes Cut-off wall extends under
spillway but upstream of
road bridge; thus
vulnerable area between
cut-off and road bridge;
base is concrete slab with
open (previously bitumen
filled) joints. Side walls
mass concrete with rear of
wall drainage; Side walls
probably continuous
spillway with no joints.
Yes However, spillway is situated
high up on abutment and would
only lose limited depth of
reservoir. Single estimate of
consequences would
overestimate the impact.
External
Fl.1 Flood Overtopping of
crest and
erosion of
downstream
face
Full
breach
Yes Risk of blockage at bridge Yes
Fl.2 Flood Overtopping of
chute and
erosion of fill
Full
breach
No Chute entirely within
abutment and directed
well downstream of toe

22 Risk Assessment in Reservoir Safety Management: Piloting summary report
AW.5 High water
level, wave
overtopping,
extreme
rainfall
Downstream
slope failure,
followed by
loss of
freeboard and
erosion of
downstream
face from
overtopping
flow
Full
breach
Yes Yes Take through but crest road
likely to result in low risk of loss
of reservoir

Risk Assessment in Reservoir Safety Management: Piloting summary report 23
Step 2 – Risk analysis
Probability of failure
Failure mode ID
Progression (failure mode) Likelihood Comments
Internal
Db10 Cracked core and internal
erosion of embankment fill
Moderate Visited once every seven days to take underdrain readings; walkover
supposed to take place monthly but in practice is less frequent. No
symptoms of general seepage (other than near spillway) apart from that
collected in toe drains. Toe drain flow is occasionally opaque and sump filled
with silt in 2011. Flows are not plotted so trends are difficult to discern.
Recent peak is around 1 l/s.
Db10 Internal erosion from
embankment into soil foundation
Moderate
Db10 Internal erosion from
embankment into rock foundation
High
Di10 Internal erosion along outside of
spillway
High Collapse of spillway walls and erosion of slot through abutment
External
Fl1 Overtopping of crest and erosion
of downstream face
Low Embankment collapse
AW5 Downstream slope failure,
followed by loss of freeboard and
erosion of downstream face from
overtopping flow
Moderate Embankment collapse
Overall likelihood of failure High

24 Risk Assessment in Reservoir Safety Management: Piloting summary report
Consequences
Receptor Measure Consequence scenario Comments
Human health Human life (properties used as surrogate)
4 Over 2,000 properties at risk
Community health assets affected
4 Hospital, six schools and five sewage treatment
works, that is, one CH1 and several CH2, mostly at
moderate risk (few areas fall into partial or total
destruction zones). Because of number of assets,
classify as very high.
Economic Non-residential / commercial properties affected
4 Around 200 buildings
Transport distribution 4 Six A-roads, railway and canal. Because of number
affected, classify as very high.
Environment Designated sites / affected areas
Not investigated as already very high risk.
Cultural heritage Designated sites, listed buildings, scheduled monuments affected
Not investigated as already very high risk.
Overall consequence class 4

Risk Assessment in Reservoir Safety Management: Piloting summary report 25
Level of risk
Likelihood of downstream flooding
Potential magnitude of consequences given downstream flooding
Level 0 Level 1 Level 2 Level 3 Level 4
Extreme ALARP ALARP ALARP Unacceptable Unacceptable
Very High Tolerable ALARP ALARP ALARP Unacceptable
High Tolerable Tolerable ALARP ALARP ALARP
Moderate Tolerable
Tolerable Tolerable ALARP ALARP
Low Tolerable
Tolerable Tolerable Tolerable ALARP
Very Low Tolerable
Tolerable Tolerable Tolerable Tolerable
RISK

26 Risk Assessment in Reservoir Safety Management: Piloting summary report
Step 3 – Risk evaluation
Recommendations
Failure mode Recommendation / Comments
Undertake a Tier 2 analysis
Additional comments
A lesser consequence scenario should be considered for failure mode Di10. All significant dam failure scenarios are considered. Internal erosion risk into the rock foundation and along the spillway channel govern probability of complete failure. Although failure associated with the spillway will only release part of the reservoir. Total consequences governed by large population affected by peak discharge, which is three times probable maximum flood (PMF) inflow to reservoir. Gaps are around improving the understanding of the risks of internal erosion.

Risk Assessment in Reservoir Safety Management: Piloting summary report 27
Example Tier 2 output
Dam details
Dam name X Dam
Grid reference ST XXX XXX
Location, description X km NE of nearby town / village in area / region X
Date built X years
Dam height X.XX m
Reservoir volume XXXXXXXX m3
Flood category X
Assessment reference XX/XX/XXXX-XX (assessor’s name)
Date of assessment --/--/----
Step 1 – Risk identification
Failure mode ID
Description of failure modes Credible? Justification Significant? Justification
Initiation (threat) Progression (failure
mode) Breach
Embankment dam – Internal
Db.10 Body of the dam deterioration
Internal erosion (IE)
Full breach Yes Earth embankment
Yes Core threat
Df.10 Foundation deterioration
IE Full breach Yes On glacial deposits, probably boulder clay
Yes
Ds.10 Deterioration of dam/ foundation
IE from embankment into foundation (or vice versa)
Full breach Yes Earth embankment, on glacial deposits, probably boulder clay
Yes

28 Risk Assessment in Reservoir Safety Management: Piloting summary report
Di Deterioration of dam/ foundation
IE along concrete/ embankment dam interface
Full breach Yes Historically most likely source of leakage
Yes
Embankment dam – External
FL.1 Flood Scour, overtopping Full breach Yes Impounding reservoir
Yes
Eq.6 Seismic Crack/ internal erosion along concrete – embankment interface
Full breach Yes Uncertainty of interface behaviour
No Protected by filter
Concrete dam – Internal
Df7 Foundation deterioration
Sliding in foundation
Blocks move downstream
Yes Core threat Yes Core threat at Tier 1
Ds7 Pipe burst in tower Floods drainage gallery and ‘relief wells’ – increase in uplift and sliding
Yes Yes 4 900 mm pipes into tower. No large diameter exit (galley concreted in)
Df7 Blockage of foundation drains
Rise in pore pressures, sliding in foundation
Blocks move downstream
Yes No NW monitor flows, carry out periodic flushing
Concrete dam – External
FL6 Flood (excessive inflow)
Failure on lift joint Blocks slide/ overturn
Yes Yes 2003 S10 states horizontal cracks due to shrinkage
FL7 Flood (excessive inflow)
Failure at foundation contact
Blocks slide/ overturn
Yes Physically possible
Yes More likely than earthquake
Aw6 Ice Overturning on lift joint
Y No Mesh reinforcement on spillway section, ice modest proportion of load on 25 m high dam

Risk Assessment in Reservoir Safety Management: Piloting summary report 29
Step 2 – Risk analysis
Probability of failure
Failure mode ID
(Table 7.2)* Initiation Progression (failure mode) Probability Comments
Embankment – Internal Method NSW – base (corrected
for condition) Interim Guide (modified)
Db.10 Embankment deterioration
Internal erosion (IE) 2.5 10-8 (2 10-9) 1.5 10-6 Draft RARS used for pilots (v2.15) has two alternative methods. The final RARS guide adopted the QRA and it those values that are used here.
Df.10 Foundation deterioration IE 4 10-5, (4 10-6)
Ds.10 Deterioration of dam/ foundation
IE embankment into foundation
7.7 10-7 (8 10-8)
Di Deterioration of dam/ foundation
IE along concrete/ embankment dam interface
No method available 1.2 10-7 Treat as if buried structure.
Embankment – External
FL.1 Flood Scour, overtopping 9 10-7 Flood calculations in 1997 S10 show routed PMF 445 m3/s out. Assume failure when flood at two-thirds height crest wall (that is, crest wall is mortared stone 0.45 m wide, 1.2 m high so fails under wave load).
Concrete – Internal
Df7 Foundation deterioration Sliding in foundation 1.3 10-6
Ds7 Pipe burst in tower Floods drainage gallery and ‘relief wells’
4.4 10-7 POF reduced as is new pipe, modern concrete dam that should have reasonable strength on lift joints.
Concrete – External
FL6 Flood Failure on lift joint 3.7 10-9 Maximum water level 491.13 mOD (0.55 m above underside of spillway bridge). Risk of blockage set to zero as no trees.
FL7 Flood Failure at foundation contact 3.6 10-9
Eq6 Seismic Failure on lift joint 7.4 10-8
Overall 4.3 10-6
* Volume 2 of guide RARS – Risk Assessment for Reservoir Safety

30 Risk Assessment in Reservoir Safety Management: Piloting summary report
Dambreak
Breach flow Downstream extent Inundation mapping Comments
Needed to get Q/W and thus fatality rate. Peak flow 5000 m3/s (takes 4 hours to empty)
Reservoir inundation mapping (RIM) unhelpful, as includes breach from cascade failures of xxxx and xxxxx and extends 70 km to sea
Use RIM mapping on internet.
Adjust rapid dambreak by
increasing rate of attenuation so
limit of total destruction is at 35 km.
Consequences
Base measure of consequences Value Comments
Highest individual vulnerability 80% Fatality rate 100% Exposure (% of time in house, Table 9.2 in Volume 2 of guide) 80% = 80%
Average societal life loss (ASLL) 176
Damages (£ million) 55
Other indicators of consequences Level Comments
Community health assets 3 Assume power supply would be affected
Transport 3 A-roads likely to be affected
Agriculture Not checked
Environment, habitats and species 4 Many designated sites (that is, SSSI, NNR, SAC)
Cultural heritage Not checked
Level of risk
Total probability of failure Value Comments
4.3 10-6 Overall for embankment and concrete dams combined
Consequence of failure Risk
Parameter Units Value Units Value
Average social life loss Societal life loss per year 176 Lives per year 7.6 10-4
Individual vulnerability Individual risk of death per year 80% Chance per year 3.5 10-6
Economic damage to third parties Damage to third parties (£ million) £55 million £ per year £237 million
Other: Specify
NNR = National Nature Reserve; SAC = Special Area of Conservation; SSSI = Site of Special Scientific Interest

Risk Assessment in Reservoir Safety Management: Piloting summary report 31
Step 3 – Risk evaluation
Tolerability of risk
Value Tolerability Comments
Highest individual risk (HIR) 3.5 10-6 ALARP
Average societal life loss (ASLL) 7.6 10-4 ALARP
Economic damage to third parties £237,000 -
Community health assets 3 - Power supply assumed to be affected
Transport 3 - Disruption to A-roads likely
Agriculture - - Not checked – consider requirement for further analysis
Environment 4 - Consider likely extent of impacts to designated sites (that is, SSSI, NNR, SAC)
Cultural heritage - - Not checked – consider requirement for further analysis
Options for risk reduction
Aim Options
Likelihood of failure PV of project
cost (= 30 annual cost)
Cost to save a
life Existing After risk reduction works
Improve detection Increase frequency of visual from weekly to twice a week.
3.7 10-6 Assume reduce POF by factor of five
£300,000 £19 million
PV = present value

32 Risk Assessment in Reservoir Safety Management: Piloting summary report
0.0000001
0.000001
0.00001
0.0001
0.001
0.01
0.1
0.01 0.1 1 10 100 1000 Number of fatalities
ALARP upper boundary
ALARP lower boundary
Total probability of failure
Tolerable
Esti
mat
ed
an
nu
al p
rob
abili
ty o
f fa
ilure
ALARP Intolerable

Risk Assessment in Reservoir Safety Management: Piloting summary report 33
Appendix C: Tables of results

34 Risk Assessment in Reservoir Safety Management: Piloting summary report
Table C1 Tier 1 pilot results
Embankment Concrete
(Table 4.1) Threat Failure mode 1 2 3 4 5 6 7 8 10 11 12
FL.1 Flood/ scour crest erosion L M H L L M H L
Fl.2 Flood/ scour chute M VL
Fl.6 Flood/ scour body of dam M H L
Fl.7 Flood/ scour found'n instability M M L
Wi.5 Waves stability H L M E L
Internal threats
Db.10 body of dam int'l erosion M M L M H L H
Df.10 deter'n of found'n int'l erosion H L L M L VH L H
Di.10 appurtenant wks int'l eros'n culvert M L M L H L
Di.10 appurtenant wks into erosion spilwlay H VL H
Db.6 body body of conc' dam L
Df.7 foundation diff'l settlement L
DS.7 Pipe burst found'n ailure L
Total H M L VH H VH M H H L L
Plots 3.3E-04 3.3E-05 3.3E-06 3.3E-03 3.3E-04 3.3E-03 3.3E-05 3.3E-04 3.3E-04 3.3E-06 3.3E-06
Consequences
ASLL 4 1 VH 0 4 2 4 H 2 3 4
30 0.03 30 0.003 30 0.3 30 30 0.3 3 30
Damage 4 1 1 4 3 3 1 4 4
Other 4 1 Not asses 2 3 4 4 1 3 3
Transport Econ Econ + Cult H Transport Environ Transport Des SitesTransport +
Envir
Overall 4 1 4 2 4 4 4 3 2 4 4
Risk
Tolerability Societal Unacceptable Tolerable ALARP Tolerable ALARP Unacceptable ALARP ALARP Tolerable ALARP ALARP
Likelihood of failure
Risk Assessment in Reservoir Safety Management: Piloting summary report 35
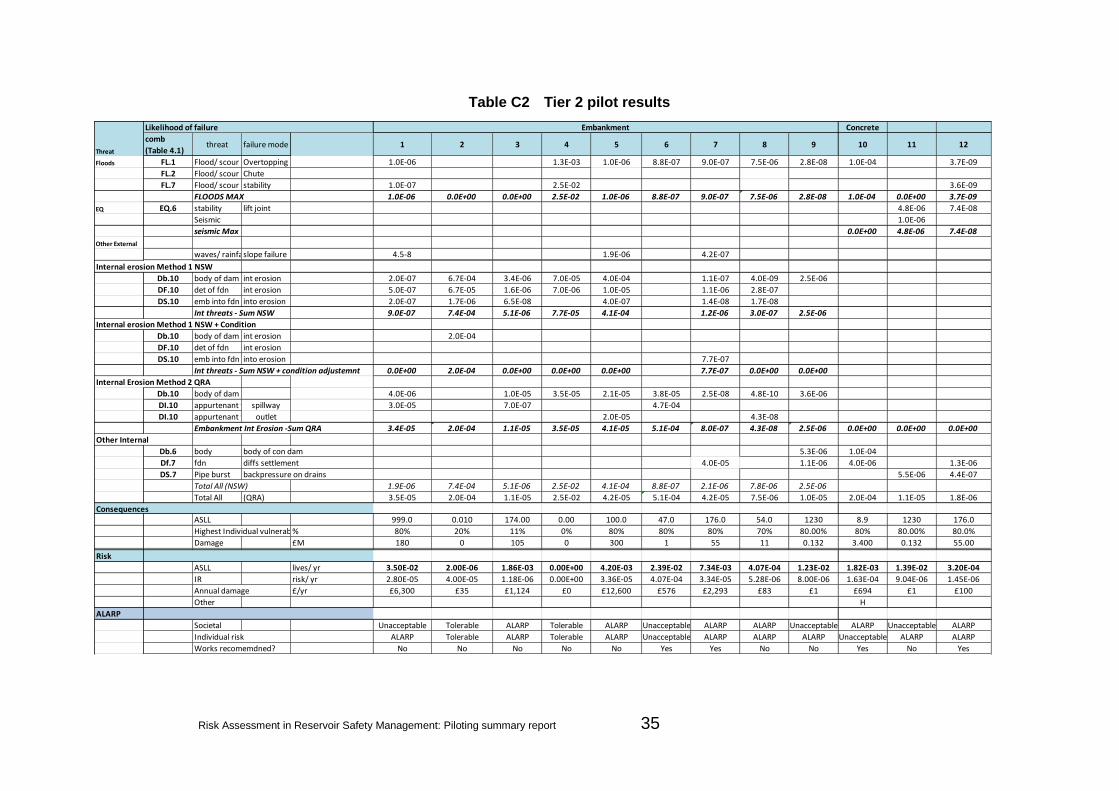
Table C2 Tier 2 pilot results
Likelihood of failure Embankment Concrete
Threat
comb
(Table 4.1) threat failure mode 1 2 3 4 5 6 7 8 9 10 11 12
Floods FL.1 Flood/ scour Overtopping 1.0E-06 1.3E-03 1.0E-06 8.8E-07 9.0E-07 7.5E-06 2.8E-08 1.0E-04 3.7E-09
FL.2 Flood/ scour Chute
FL.7 Flood/ scour stability 1.0E-07 2.5E-02 3.6E-09
FLOODS MAX 1.0E-06 0.0E+00 0.0E+00 2.5E-02 1.0E-06 8.8E-07 9.0E-07 7.5E-06 2.8E-08 1.0E-04 0.0E+00 3.7E-09
EQ EQ.6 stability lift joint 4.8E-06 7.4E-08
Seismic 1.0E-06
seismic Max 0.0E+00 4.8E-06 7.4E-08
Other External
waves/ rainfallslope failure 4.5-8 1.9E-06 4.2E-07
Internal erosion Method 1 NSW
Db.10 body of dam int erosion 2.0E-07 6.7E-04 3.4E-06 7.0E-05 4.0E-04 1.1E-07 4.0E-09 2.5E-06
DF.10 det of fdn int erosion 5.0E-07 6.7E-05 1.6E-06 7.0E-06 1.0E-05 1.1E-06 2.8E-07
DS.10 emb into fdn into erosion 2.0E-07 1.7E-06 6.5E-08 4.0E-07 1.4E-08 1.7E-08
Int threats - Sum NSW 9.0E-07 7.4E-04 5.1E-06 7.7E-05 4.1E-04 1.2E-06 3.0E-07 2.5E-06
Internal erosion Method 1 NSW + Condition
Db.10 body of dam int erosion 2.0E-04
DF.10 det of fdn int erosion
DS.10 emb into fdn into erosion 7.7E-07
Int threats - Sum NSW + condition adjustemnt 0.0E+00 2.0E-04 0.0E+00 0.0E+00 0.0E+00 7.7E-07 0.0E+00 0.0E+00
Internal Erosion Method 2 QRA
Db.10 body of dam 4.0E-06 1.0E-05 3.5E-05 2.1E-05 3.8E-05 2.5E-08 4.8E-10 3.6E-06
DI.10 appurtenant wksspillway 3.0E-05 7.0E-07 4.7E-04
DI.10 appurtenant wks outlet 2.0E-05 4.3E-08
Embankment Int Erosion -Sum QRA 3.4E-05 2.0E-04 1.1E-05 3.5E-05 4.1E-05 5.1E-04 8.0E-07 4.3E-08 2.5E-06 0.0E+00 0.0E+00 0.0E+00
Other Internal
Db.6 body body of con dam 5.3E-06 1.0E-04
Df.7 fdn diffs settlement 4.0E-05 1.1E-06 4.0E-06 1.3E-06
DS.7 Pipe burst backpressure on drains 5.5E-06 4.4E-07
Total All (NSW) 1.9E-06 7.4E-04 5.1E-06 2.5E-02 4.1E-04 8.8E-07 2.1E-06 7.8E-06 2.5E-06
Total All (QRA) 3.5E-05 2.0E-04 1.1E-05 2.5E-02 4.2E-05 5.1E-04 4.2E-05 7.5E-06 1.0E-05 2.0E-04 1.1E-05 1.8E-06
Consequences ASLL 999.0 0.010 174.00 0.00 100.0 47.0 176.0 54.0 1230 8.9 1230 176.0
Highest Individual vulnerability% 80% 20% 11% 0% 80% 80% 80% 70% 80.00% 80% 80.00% 80.0%
Damage £M 180 0 105 0 300 1 55 11 0.132 3.400 0.132 55.00
Risk
ASLL lives/ yr 3.50E-02 2.00E-06 1.86E-03 0.00E+00 4.20E-03 2.39E-02 7.34E-03 4.07E-04 1.23E-02 1.82E-03 1.39E-02 3.20E-04
IR risk/ yr 2.80E-05 4.00E-05 1.18E-06 0.00E+00 3.36E-05 4.07E-04 3.34E-05 5.28E-06 8.00E-06 1.63E-04 9.04E-06 1.45E-06
Annual damage £/yr £6,300 £35 £1,124 £0 £12,600 £576 £2,293 £83 £1 £694 £1 £100
Other H
ALARP
Societal Unacceptable Tolerable ALARP Tolerable ALARP Unacceptable ALARP ALARP Unacceptable ALARP Unacceptable ALARP
Individual risk ALARP Tolerable ALARP Tolerable ALARP Unacceptable ALARP ALARP ALARP Unacceptable ALARP ALARP
Works recomemdned? No No No No No Yes Yes No No Yes No Yes

36 Risk Assessment in Reservoir Safety Management: Piloting summary report
Appendix D: Plots of results
Risk Assessment in Reservoir Safety Management: Piloting summary report 37
Figure D1 Dam height vs. reservoir volume

38 Risk Assessment in Reservoir Safety Management: Piloting summary report
Figure D2 Cumulative distribution of total probability of failure

Risk Assessment in Reservoir Safety Management: Piloting summary report 39
Figure D3 Probability of failure of internal threats – New South Wales method vs. Interim Guide method

40 Risk Assessment in Reservoir Safety Management: Piloting summary report
Figure D4 Annual probability of failure vs. date of construction

Risk Assessment in Reservoir Safety Management: Piloting summary report 41
Figure D5 Cumulative distribution of average societal life loss

42 Risk Assessment in Reservoir Safety Management: Piloting summary report
Figure D6 Average societal life loss vs. damages

Risk Assessment in Reservoir Safety Management: Piloting summary report 43
Figure D7 Probability of failure Tier 1 vs. Tier 2

44 Risk Assessment in Reservoir Safety Management: Piloting summary report
Figure D8 Average societal life loss Tier 1 vs. Tier 2
Risk Assessment in Reservoir Safety Management: Piloting summary report 45
Figure D9 Tier 2 risk as F-N chart
46 Risk Assessment in Reservoir Safety Management: Piloting summary report
Figure D10 Tier 1 risk as F-N chart

We are The Environment Agency. It's our job to look after your environment and make it a better place – for you, and for future generations.
Your environment is the air you breathe, the water you drink and the ground you walk on. Working with business, Government and society as a whole, we are making your environment cleaner and healthier.
The Environment Agency. Out there, making your environment a better place.
Published by: Environment Agency Horizon House, Deanery Road Bristol BS1 5AH Tel: 0117 934 4000 Email: [email protected] www.environment-agency.gov.uk © Environment Agency All rights reserved. This document may be reproduced with prior permission of the Environment Agency.
Further copies of this report are available from our publications catalogue: http://publications.environment-agency.gov.uk or our National Customer Contact Centre: T: 08708 506506
