guide to using the system level measures framework for ... · acute hospital bed days per capita...
TRANSCRIPT
Version 2: May 2018
Guide to Using the System Level
Measures Framework for Quality
Improvement

2 | P a g e
Contents
1. Purpose of this Guide ........................................................................................................... 3
2. Measures and the Health System ......................................................................................... 3
2.1. The purposes of measurement ................................................................................................ 3
3. About the System Level Measures Framework ..................................................................... 3
3.1. How and why the System Level Measures were chosen ............................................................ 4
3.2. Current System Level Measures ............................................................................................... 5
4. Alignment with the Health Strategy ..................................................................................... 8
5. The Library of Measures ...................................................................................................... 8
6. Role of District Alliances in the Implementation of System Level Measures ........................... 8
7. Improvement Plan Development ....................................................................................... 11
8. Quality Improvement Activities ......................................................................................... 11
9. Contributory Measures ...................................................................................................... 12
10. Definitions – National Health Targets, Improvement Milestones and Contributory
Measures ................................................................................................................................. 12
11. Using the Framework – Improvement Science ................................................................ 13
11.1. Steps towards improvement .............................................................................................. 13
11.2. Local variation and equity .................................................................................................. 14
12. Basic Tools for Quality Improvement .............................................................................. 14
12.1. Monitoring data over time – run charts and control charts.................................................. 14
12.2. Drilling down ..................................................................................................................... 16
12.3. Driver diagrams ................................................................................................................. 16
12.4. Funnel plots ....................................................................................................................... 17
12.5. Balancing measures ........................................................................................................... 18
13. Other Quality Improvement Initiatives ........................................................................... 18
13.1. Local reporting .................................................................................................................. 18
13.2. Dashboards ....................................................................................................................... 19
Appendix One: Example of Developing an Improvement Approach for ASH Rates 0-4 year olds 20
Appendix Two: Resources for Improvement Science .................................................................. 21

3 | P a g e
1. Purpose of this Guide
This guide explains how System Level Measures can be used to support improvements in the health system
and address equity for Māori and other population groups with significant health disparities.
The guide can be used by district alliances in the development of their System Level Measures improvement
plans. It provides useful information about the System Level Measures framework, how the System Level
Measures relate to measurement in the broader health system, descriptions of individual System Level
Measures and the basic concepts of improvement science. Sections 11, 12 and 13 provide suggested tools
and approaches that could be used by clinicians and managers involved in the development, implementation
and monitoring of System Level Measures improvement plans.
2. Measures and the Health System
2.1. The purposes of measurement
Measures are used for three main purposes: accountability (judgement), improvement or research.1
Measurement for accountability is undertaken for the purpose of benchmarking (comparing different
hospitals or primary health organisations (PHOs)), incentivising performance, accreditation of health facilities
or staff, public reporting and to ensure public confidence in the health system. They have clear attribution to
results and contribute to measuring outcomes. National health targets are accountability measures.
Measures for improvement are used for continuous quality improvement. They help identify problems that
need attention, and in particular focus on groups that have poorer access to health care and poorer health
outcomes. They are used to find out if interventions or processes have been effective.
Measures for research are complex and precise, used to test a hypothesis or objective and intend to produce
new knowledge or data that may not be practical to implement.
System Level Measures are measures for improvement, while contributory measures are measures for
accountability at a local level.
3. About the System Level Measures Framework
The System Level Measures Framework aims to improve health outcomes for people by supporting district
health boards (DHBs) to work in collaboration with health system partners (primary, community and hospital)
using specific quality improvement measures. They provide a framework for continuous quality improvement
and system integration.
Improving equity underpins the System Level Measures framework. It focuses on improving health outcomes
for children and youth, and reducing equity gaps for Māori, Pacific and other population groups that
consistently experience poorer health outcomes.
The framework relies on System Level Measures which:
are outcomes focussed
1 Solberg, Mosser, McDonald. 1997. The Three Faces of Performance Measurement, J. Quality Improvement 23, 135-147.
4 | P a g e
are set nationally are designed to create system-wide responses that are not limited to specific programmes or
diseases
are designed to focus health services on outcomes for patients and populations reflect health system performance achieved through integration highlight equity gaps for Māori, Pacific and other population groups who experience disparity connect to contributory measures.
Contributory measures:
contribute to achievement of System Level Measures are frontline service-level measurements of health processes or activity – tangible and clinically
meaningful are used to measure local progress on quality improvement activities are relevant to local needs, service configuration and demographics.
3.1. How and why the System Level Measures were chosen
System Level Measures were selected through a co-design process including reaching agreement on
principles for selection and using an iterative process to finalise the measures.
The measures were chosen to reflect the New Zealand Triple Aim for quality improvement:
improved quality, safety and experience of care
improved health and equity for all populations
best value for public health system resources.2
Several focus areas were considered when selecting measures.
Measures that identify known disparities in health outcomes for population subgroups were considered.
These groups include Māori, Pacific people, those living in areas of high socioeconomic deprivation, and those
living with poor mental health or intellectual impairment. Measures were also considered across the different
life stages – from conception, infancy, childhood, adolescence, adulthood and older age.
The goal of a modern health system is to maximise the length of life lived in good health. It can do this by
reducing morbidity and health-related disability.
The New Zealand Burden of Disease study3 findings were taken into account when choosing the System Level
Measures. The study comments on changes in New Zealand’s population structure and patterns of disease.
Life expectancy is increasing, and people are living longer in good health but also longer in poor health, and
the gains are not shared equally by all population groups. The study shows poor health due to alcohol and
drug use and mental health disorders has increased, and that health gains over time have been much slower
for children and young people. Infectious diseases and neonatal disorders are still common in childhood.
A health system should identify people living with multiple long-term conditions and manage their illnesses
appropriately. People need to be supported to manage their own health and to learn how to get the best
2 http://www.hqsc.govt.nz/about-the-commission/ 3 Ministry of Health. 2013. Health Loss in New Zealand: A report from the New Zealand Burden of Diseases, Injuries and Risk Factors Study, 2006–2016. Wellington: Ministry of Health.

5 | P a g e
out of the health system. Services need to respond to individual as well as population needs and focus on
those who are less able to access health care to ensure equitable care is provided across the whole patient
journey. There needs to be a greater focus on prevention.
Taking these factors into account, it was agreed the most health benefit would come from a focus on:
maternity care and having healthy babies
the health of children and young adults, including a focus on respiratory illness and gastroenteritis,
mental health and injury
prevention, early detection and effective management of long-term health conditions
delivering patient-centred care by design
using health resources effectively.
The measures were developed by clinicians from primary and secondary care, academics, data analysts,
managers, patient groups and others. The measures cover different life stages and the continuum of health
care (primary, community and secondary care). There are only a small number of measures, to ensure district
alliances focus on the identification of activities and the development of realistic and achievable
improvement plans. It is likely the measures will be revised over time in response to feedback and their
impact on performance improvement.
3.2. Current System Level Measures
The System Level Measures are:
Ambulatory Sensitive Hospitalisation (ASH) rates for 0–4 year olds (that is, keeping children out of hospital)
acute hospital bed days per capita (that is, using health resources effectively)
patient experience of care (that is, person-centred care)
amenable mortality rates (that is, prevention and early detection)
babies living in smokefree homes (that is, a healthy start)
youth access to and utilisation of youth appropriate health services (that is, youth are healthy, safe and supported).
ASH rates in 0–4 year olds seeks to reduce admission rates to hospital for a set of diseases and conditions
that are potentially avoidable through prevention or management in primary care. In children, these
conditions are mainly respiratory illnesses, gastroenteritis, dental conditions, and skin infections.
ASH rates are higher for Māori and Pacific children and addressing this inequity would significantly reduce
potentially avoidable hospitalisation rates. Analysing ASH rates by ethnicity and deprivation level will
highlight the effects of the broader determinants of health such as housing and access to primary care. 4
Acute hospital bed days per capita measures the use of hospital resources, predominantly relating to adults
and older people. Effective management of long-term illnesses and disease prevention in primary care prior
to hospitalisation and the provision of effective care in the community after discharge have the potential to
reduce hospital bed days. For example, access to primary care, streamlined diagnostic and treatment
processes, discharge planning and community based health and restorative care. Good communication
4 Scott N and Lawrenson R. May 2015. Potential for health gain equity. NZMJ. Vol 128, No 1415.

6 | P a g e
between clinicians across the health care continuum is vital. The rate of acute bed day use is higher for Māori
and Pacific people.
The patient experience of care measurement tools in primary and secondary care give insight into how
patients experience the health care system, and how integrated their care was. In their review of evidence
on the links between patient experience and clinical safety and health outcomes, Doyle et al5 concluded that
patient experience is positively associated with adherence to recommended medication and treatments,
engagement in preventive care such as screening services and immunisations and ability to use the health
resources available effectively. This measure will provide new information about how people experience
health care. It may highlight areas that districts need to have a greater focus on, such as health literacy and
communication. Further information on the survey tools, guidance on how to use the results for quality
improvement and results from the surveys can be found on the Health Quality & Safety Commission website.
Amenable mortality is a measure of the effectiveness of health care-based prevention programmes, early
detection of illnesses, effective management of long-term conditions and equitable access to health care. It
is a measure of premature deaths that could have been avoided through effective health interventions at an
individual or population level. Health care service improvement across the system, including access to
diagnostic and secondary care services, may lead to a reduction in amenable mortality. Amenable mortality
rates are higher in Māori and Pacific people. Rates have reduced over time, but not as quickly for Pacific
people as for Māori and other population groups. The amenable mortality measure applies to the under-75
population. The Guide to using Amenable Mortality as a System Level Measure explains the concept of
amenable mortality, how it is measured, and how this measure can be used to improve health system
performance and reduce health inequity for Māori and Pacific people.
Babies living in smokefree homes aims to reduce the rate of infant exposure to cigarette smoke by focussing
attention beyond maternal smoking to the home and family/whānau environment. The measure at six weeks
aligns with the first core contact which is when the handover from maternity to Well Child Tamariki Ora
providers and general practitioners occurs. Smoking during pregnancy and exposure to smoking in early
childhood strongly influence pregnancy and early childhood health outcomes. This measure promotes the
roles which collectively, service providers play in the infants’ life and the many opportunities for smoking
interventions to occur. It also enables the health sector to connect infants and their family/whānau with
maternity and childhood health care such as immunisation.
Youth access to and utilisation of youth appropriate health services (10–24-year age group) focuses on
behavioural factors, mental health conditions, sexual and reproductive health, alcohol and other drug use,
and injury prevention. Engagement with education, employment and training is critical as is building healthy
relationships and making good choices. Rates of pregnancy and mental health conditions are higher among
Māori and Pacific youth and those living in low socioeconomic areas.
This System Level Measure consists of five domains, with corresponding outcomes and national health
indicators (shown in table one).
5 Doyle C, Lennox L, Bell D. 2013. A systematic review of evidence on the links between patient experience and clinical safety and effectiveness. BMJ Open, 3:e001570.doi:10.1136/bmjopen-2012-001570.

7 | P a g e
Table 1: Domains, outcomes and national indicators of youth System Level Measure
Domain Outcome National Indicator
Youth Experience of Health System
Young people feel safe and supported by health services
Child and Adolescent Mental Health Services (CAMHS) Real-Time Survey results for 10-24 year olds
Sexual and Reproductive Health
Young people manage their sexual and reproductive health safely and receive youth-friendly care
Chlamydia testing coverage for 15-24 year olds
Mental Health and Wellbeing
Young people experience less mental distress and disorder and are supported in times of need
Self-harm hospitalisations and short stay ED presentations for <24 year olds
Alcohol and Other Drugs
Young people experience less alcohol and drug related harm and receive appropriate support
Alcohol-related ED presentations for 10-24 year olds
Access to Preventive Services
Young people receive the services they need to keep healthy
Adolescent oral health utilisation for school year 9-17 years of age
The Youth System Level Measure was co-developed with input from a broad range of people with a particular
interest in youth health including: Ministry for Social Development, Ministry of Education, Office of the
Children’s Commissioner, sector groups such as Ara Taiohi, Youth One Stop Shops, clinicians from across
primary and secondary care, academia, and the Ministry of Health. The Ministry also worked with youth
agencies to facilitate several youth focus groups and one-on-one interviews to seek feedback from young
people on what was meaningful to them and what this System Level Measure should look like. This is
reflected in the choice of domains and indicators.
The Youth engagement story board is available on the Ministry website.
After the youth System Level Measure was implemented in July 2017, the Ministry ran a survey to seek
feedback from different parts of the health sector on the five domains and indicators to see if any
amendments were required. Most respondents felt the five domains were appropriate, but time was needed
for the measure to be established. About half of the survey respondents were involved in the implementation
of the youth System Level Measure in their districts. The survey identified that better engagement and
communication is required from both the Ministry and district alliances. Given the results of the survey, the
youth System Level Measure, the five domains and their associated national indicators will remain
unchanged. The Survey story board presents the full results of the survey.
Data for the five national indicators are provided by the Ministry on the Nationwide Service Framework
Library.
The technical definitions of the measures are held in the measures library at HQMNZ.

8 | P a g e
4. Alignment with the Health Strategy
The New Zealand Health Strategy: Future direction, outlines a high-level direction for New Zealand’s health
system.
System Level Measures align with all five themes of the Health Strategy:
Value and high performance – Provides an outcomes focussed system performance framework.
One team – System performance goals are achieved by integration of services and by clinicians and
managers having a shared vision for their population.
Closer to home – Access to good primary and community care, providing a greater range of services,
reduces demand on hospital resources.
People powered – People are always at the centre and experience integrated and safe health care.
Smart system – Sharing of health information to enable effective reach, response and better
understanding of people’s health needs and circumstances.
5. The Library of Measures
System Level and contributory measures are published on Health Quality Measures New Zealand (HQMNZ): www.hqmnz.org.nz.
HQMNZ is a sector-wide library of measures used within the New Zealand health system. It is a single
collection point for all measures and their definitions.
A System Level Measures ‘stack’ (under which all of the System Level and contributory measure definitions
are loaded), has been created on the HQMNZ. A link to this stack can be found on the HQMNZ homepage.
Measures can be located by either using the search box function, or by browsing through the stack.
The library includes precise definitions of System Level and contributory measures (such as numerator and
denominator descriptions), data sources and calculation methods. It includes the rationale for using
measures, standardisation methods, data sources and the inter-relationships of measures (eg, where these
can be used as balancing measures [see section 12.5]).
The library has the status of each measure – ‘In development’, ‘Active’ or ‘Abandoned’. Measures that are
‘Active’ have had their definitions agreed, been peer reviewed and have data available for analysis.
Measures ‘In development’ are currently being modelled or tested. Where development has stalled,
measures have the status of ‘Abandoned’. In these instances, the library will note why development has
stopped and library users will be able to advocate and work on further development of these measures.
The library can be used to support collaborative learning networks across districts so quality improvement
expertise can be shared.
6. Role of District Alliances in the Implementation of System Level Measures
The System Level Measures framework recognises that good health outcomes are best achieved when all
parts of the health system work together. District alliances (DHB of domicile with their alliancing partners)
are responsible for implementing System Level Measures. No one health care provider can be accountable
for a particular System Level Measure, although each alliancing partner is accountable for playing their part.

9 | P a g e
The intent of this framework is to involve as many players as possible in quality improvement. These players
also have responsibility for implementation of the improvement plan at a district alliance level.
District alliances should be clinically led and use an integrated approach to planning, measurement, service
provision and quality across a local population. Form and function of alliances varies across the country, with
some being a partnership of the DHB of domicile and its PHOs only. Others have much broader alliance
partners, including patient and community representatives, ambulance, pharmacy, midwives, community
providers, public health etc.
District alliances are responsible for:
• harnessing perspectives from all relevant parts of the health system to identify a shared vision and
key objectives to improve health outcomes of their population
• having a whole-of-system focus
• having a clear focus on delivery of integrated care by placing their population and patient at the
centre at all times
• applying alliancing principles (ways of working) – developing local relationships and trust between
the health system partners in their district
• using System Level Measures to drive system integration in their districts
• leading the development of the System Level Measures improvement plan
• allocating resources required for the development, implementation, monitoring and reporting of the
System Level Measures in their districts.
It is envisaged that all district alliances will broaden over time to include perspectives from all the health
system partners including patient and community perspectives and will use a joint decision-making approach
to system integration and service planning.
Equity gaps for Māori and Pacific populations are evident in all System Level Measures and in nearly all
districts. The Ministry provides both identifiable and aggregate data for all System Level Measures by
ethnicity and deprivation index. This enables the district alliances to examine their data, understand the
health needs of their population, identify patients and population groups that experience disparity in access
to health care and health outcomes and target their activities and investment to provide equitable health
care and improve their health outcomes.
DHB populations differ considerably in the proportion that are Māori, Pacific or Asian; in some districts
reporting Pacific and Asian breakdown is not appropriate because of small numbers. Contributory measures
data is provided by the Ministry, DHB, PHO and community providers.
Locally chosen (district alliance level) contributory measures have relevance to the local population, and are
a catalyst for quality initiatives that are meaningful, relevant and able to be influenced by those providing
health services. Partners to the alliance must agree where responsibilities lie. The contributory measures
should be chosen to track the progress of these local responsibilities, directly connected to the alliance’s
improvement plan.
The quality and effectiveness of alliances is critical to developing an appropriate quality improvement
environment. Developing the necessary processes and programmes to improve quality (ie, the improvement
plan) are dependent on alliances embracing the culture and principles outlined in the Alliance Charter. The

10 | P a g e
development and implementation of the improvement plan is an opportunity to align current work
programmes under one banner (eg, acute demand, Diabetes Care Improvement Package, ASH).
The district alliance leadership team should:
have an agreed terms of reference that includes purpose, outcomes sought, mandate, scope, membership, member selection process, accountability, work plans, meeting details, reporting, conflict of interests, review process, responsibilities of the alliance, roles of chair and members, and resources required for the alliance to function
understand the reasons for investing in the System Level Measures
align System Level Measures with other strategic and annual plans, activities and outcomes
include System Level Measures as part of the alliance work programme
assess the data available and identify the local population needs
assess current initiatives and understand their impact on patient and local population health outcomes
appoint a dedicated project manager to coordinate the development and implementation of System Level Measures
confirm the mandate and functions of the project manager with alliance partner organisations
appoint Service Level Alliances for each System Level Measure with clinical champions
enable data sharing for quality improvement
agree the resources required to implement the initiatives identified by the Service Level Alliances
establish a clear reporting structure
agree the System Level Measures improvement plan
ensure the improvement plan is realistic and achievable
monitor and report the progress of implementation of the System Level Measures improvement plan
reflect on successes and failures, and identify and share insights for future.
The Service Level Alliances should:
be clinically led and have appropriate involvement from relevant health partners and community representatives – this group includes all partners who may influence the System Level Measures
understand how each partner could influence the System Level Measures
provide the link between the alliance leadership team and frontline staff
seek input from frontline staff from across the health system
study the data available and identify the local population needs
identify the area of focus for quality improvement (identify and define the problem)
set local improvement milestones for the System Level Measures
identify the initiatives to be undertaken that will have the biggest impact
identify the resource required
identify local performance goals
select contributory measures to track local performance goals
monitor progress on local performance goals and improvement milestone

11 | P a g e
ensure regular reporting to both the alliance leadership team and frontline staff on the progress of initiatives, successes and challenges, and potential solutions
have an agreed terms of reference that includes purpose, outcomes sought, mandate, scope, membership, member selection process, accountability, work plans, meeting details, reporting, conflict of interests, review process, responsibilities of the alliance, roles of chair and members, and resources required for the alliance to function.
The Ministry has profiled some of the alliances and their approaches for the development and
implementation of the improvement plan. These profiles, along with previous years’ improvement plans, are
available on the Nationwide Service Framework Library.
7. Improvement Plan Development
The improvement plan submitted to the Ministry of Health should include:
improvement milestones that is a number that shows improvement (either for Māori, the total
population or a specifically identified population with equity gap) for each of the six System Level
Measures
brief description of activities to be undertaken by alliancing partners (primary, secondary and
community) to achieve the System Level Measures milestones
contributory measures for each of the six System Level Measures. These measures are chosen by
the district alliance based on local needs, demographics and service configurations. Contributory
measures enable the alliance to measure local progress against the System Level Measures
activities
signatures of all district alliance partners to demonstrate am integrated and partnership approach
to the development and implementation of the improvement plan.
Improvement milestones should be based on a district’s trend data and baseline and be appropriate for the
needs and priorities of local communities and health services. The improvement milestone is decided by the
district alliance and should be achievable in one year.
For the Youth System Level Measure, district alliances are expected to work with the relevant health and
wider sector partners as appropriate, to implement this System Level Measure. A youth Service Level Alliance
team that includes perspectives of youth health across DHBs and the community, is the most appropriate
forum to determine the priorities for youth in the district, and lead the development and implementation of
the youth health System Level Measure.
District alliances are required to select a minimum of one domain and use the national indicator for that
domain to set an improvement milestone, and select quality improvement activities and contributory
measures that are appropriate to this domain. There must be a clear line of sight between the activities and
contributory measures and the national indicator. The selected domain should reflect the domain in greatest
need of improvement locally.
8. Quality Improvement Activities
Quality improvement activities should be determined using improvement science to ensure a strong
evidence base (see sections 11, 12 and 13).

12 | P a g e
District alliance and senior leaders play a vital role in creating and supporting the environment for quality
improvement. For quality improvement activities to succeed, clinicians need to be involved in planning,
leading and supporting new quality improvement activities, steering change and influencing their
colleagues and peers. Patients also need to be part of the quality improvement teams to enable design and
delivery of patient-centred services.
The district alliance needs to ensure quality improvement activities:
are action focused and achievable in one year
will contribute to the achievement of the improvement milestone
reflect the integrated approach across the health system
reflect the health investment needed based on local population needs, demographics and service
configurations
have been selected based on health information tools and improvement science methods.
9. Contributory Measures
Contributory measures are tools selected and used at the local level for quality improvement, according to
DHB context (eg, population need relative to current service provision). They measure specific health care
activities or services that can be influenced by frontline clinical health care services and contribute to the
achievement of System Level Measures.
Contributory measures must:
be measurable – have a clearly defined numerator, denominator and data standard
focus on the delivery of specific health care services or activities for defined patient populations and
groups experiencing disparities
have a clear line of sight to the improvement milestones and quality improvement activities
be service-level measurements that are meaningful to clinicians
be chosen locally by the district alliance
be reported and monitored at the district alliance level.
By identifying and implementing the appropriate initiatives to improve the quality of care based on local
context and identifying the right contributory measures to measure local progress against the initiatives, it is
expected the System Level Measure will improve.
The National Health Targets will continue, including the requirements to meet the national target and
report quarterly. PHOs and DHBs are expected to meet the targets identified in each individual National
Health Target. National Health Targets may be used as contributory measures in the improvement plan.
10. Definitions – National Health Targets, Improvement Milestones and Contributory Measures
Different terms have been used to ensure there is no confusion about the difference between National
Health Targets and the performance expected for System Level Measures and contributory measures. Table
two explains these different terms.
13 | P a g e
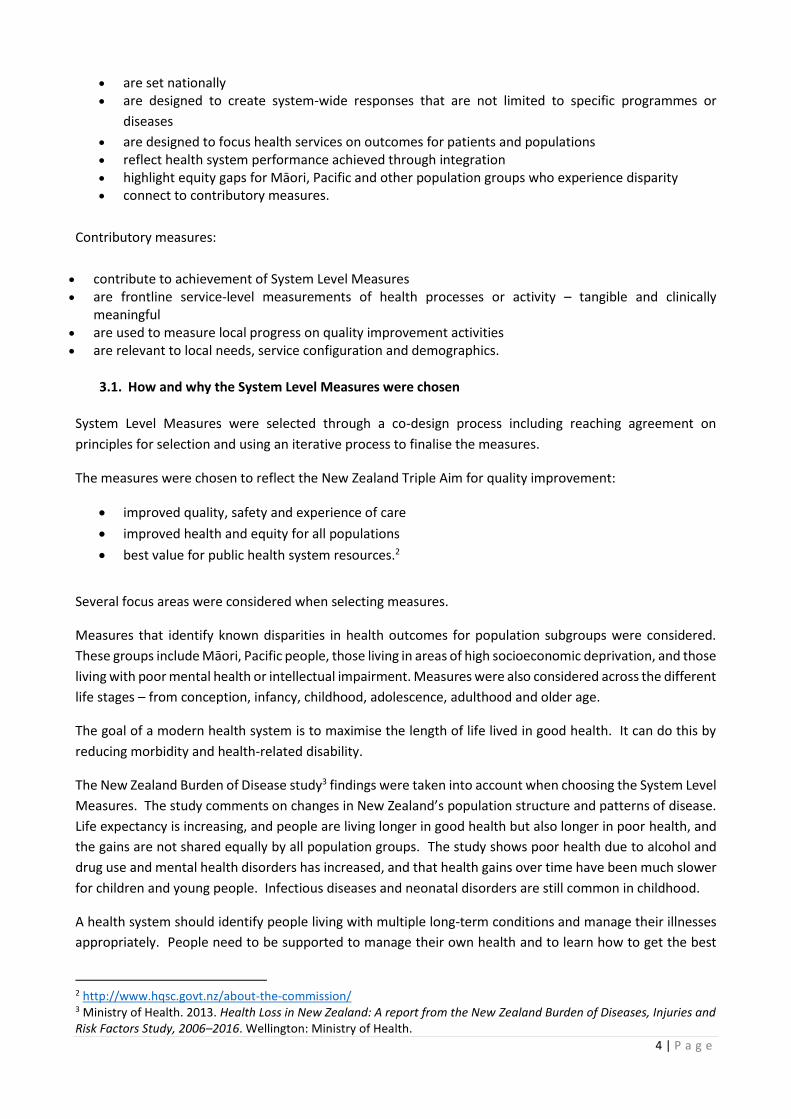
Table 2: Definitions – Health Targets, improvement milestones and contributory measure goals
11. Using the Framework – Improvement Science
11.1. Steps towards improvement
Confidence, skill sets and resourcing for conducting improvement activities is variable between districts. This
section has additional guidance and/or expertise about improvement science and how to use it to develop
the improvement plan. It provides a possible approach, along with potential tools that could be used, to
develop an improvement plan.
Using the System Level Measures Framework involves a series of steps (see Appendix One).
a) The Ministry of Health provides national comparative data for System Level Measures stratified by
ethnicity and deprivation level of domicile, and time trends on the Nationwide Service Framework
Library. Alliance partners use this data to determine what issues need to be addressed – for example,
variance from the national or peer group6 average, high levels of inequity in the measure, or negative
change over time.
b) Alliances convene multidisciplinary quality improvement teams to focus on the areas for improvement.
Teams have wide representation of clinical, analytic and managerial knowledge and should include
patients.
c) For each improvement project, scope the problems using direct observation, data collection and analysis,
and structured enquiry methods including interviews with clinical and administrative staff and patient
engagement. The best improvement ideas often come from those directly involved in or affected by
health care.
6 Districts with similar socio-demographic characteristics.
Health Targets
•Six Health Targets
•Reflect government priorities
•Targets set nationally by the Ministry
•Performance reported each quarter
•Public reporting of performance against the targets using league tables
•PHOs paid on Quarter 4 performance of two primary care targets
Improvement Milestones
•Six System Level Measures set nationally
•Outcomes focussed
•No national targets
•Improvement milestones set by district alliances
•Progress reported quarterly on the implementation of the improvement plan
•No public reporting or league tables
•Quarter 4 payment for PHOs is based on implementation of the improvement plan and achievement of the improvement milestones for three System Level Measures
Contributory Measures
•Number of measures defined by district alliances
•Measures align with activities in alliance improvement plans
•Measures contribute to achievement of the System Level Measures improvement milestones
•Progress and performance reported locally at district alliance level
•District alliances may choose to incentivise
•No public reporting of performance

14 | P a g e
d) For each improvement project, create a process map or flow chart, including specific decision points
where processes might fail and lead to poor outcomes. Create a driver diagram to identify root causes
and opportunities for improvement (see section 12.3). A prioritisation tool such as a Pareto chart7 can
help to identify where quality improvement is likely to be most effective. This can be done by creating a
frequency chart of poor outcomes or deficiencies in processes.
e) Using contributory measures (data provided by alliance partners), undertake further variation, time trend
and equity analysis to identify priorities for action. Contributory measures can be sourced from the
measures library, or other local measures can be used. Look for population groups that have inequitable
access to health care and poor health outcomes. Remember that disparities may be missed if the wrong
measures are chosen or analysis is inadequate.
f) Undertake quality improvement activities such as PDSA (plan, do, study and act)8 cycles to test and
develop local responses to improve performance on contributory measure(s), including targets for
improvement.9 Using a structured approach ensures testing is based on a theory of change, and data is
collected that shows whether the test was successful or requires further adaptation. Using this approach,
teams can find solutions that best fit the local context and improvement is more likely to be sustained.
g) Routinely monitor and report contributory measure(s) and identify balancing measures (see section 12.5)
that track unintended consequences or possible perverse incentives. A dashboard (see section 13.2) is a
useful tool for this local performance management. Use statistical process control tools (see section
12.1) to identify whether improvement is occurring and identify further opportunities.
h) Continue to discuss the opportunities for reducing disparity and improving outcomes for all populations
with frontline clinicians and managers.
i) There are also many excellent resources available for further information, a list of these can be found in
Appendix Two.
11.2. Local variation and equity
Although analysis of variation between districts is useful, an apparently ‘average’ result for a particular
measure may be hiding local variation between population groups. This is particularly the case for areas
where there is considerable ethnic or socio-economic diversity. Health equity can usually be improved and
measures should be examined to see if any particular group in a population is disadvantaged in access,
experience or outcome of health service.
Equity is one of the key dimensions of quality. The Health Quality & Safety Commission’s Atlas of Healthcare
Variation equity domain provides approaches to undertaking this type of analysis.
12. Basic Tools for Quality Improvement
12.1. Monitoring data over time – run charts and control charts
Even if a result for a given measure is unremarkable, and there is no unwarranted variation, there may still
be a positive or negative change over time. Knowing whether a change is an improvement and not just part
of random variation is important. Statistical process control is a tool to tell which changes are meaningful. It
can also identify extreme outlying data points that might indicate the data is incorrect.
7 Pareto analysis shows that a relatively small number of very heavy users of services can by themselves be a large driver of many of these measures. Specific individualised interventions for these people can be the most appropriate approach to improving overall performance. 8 http://www.ihi.org/sites/search/pages/results.aspx?k=pdsa 9 http://www.ihi.org/resources/Pages/HowtoImprove/default.aspx
15 | P a g e
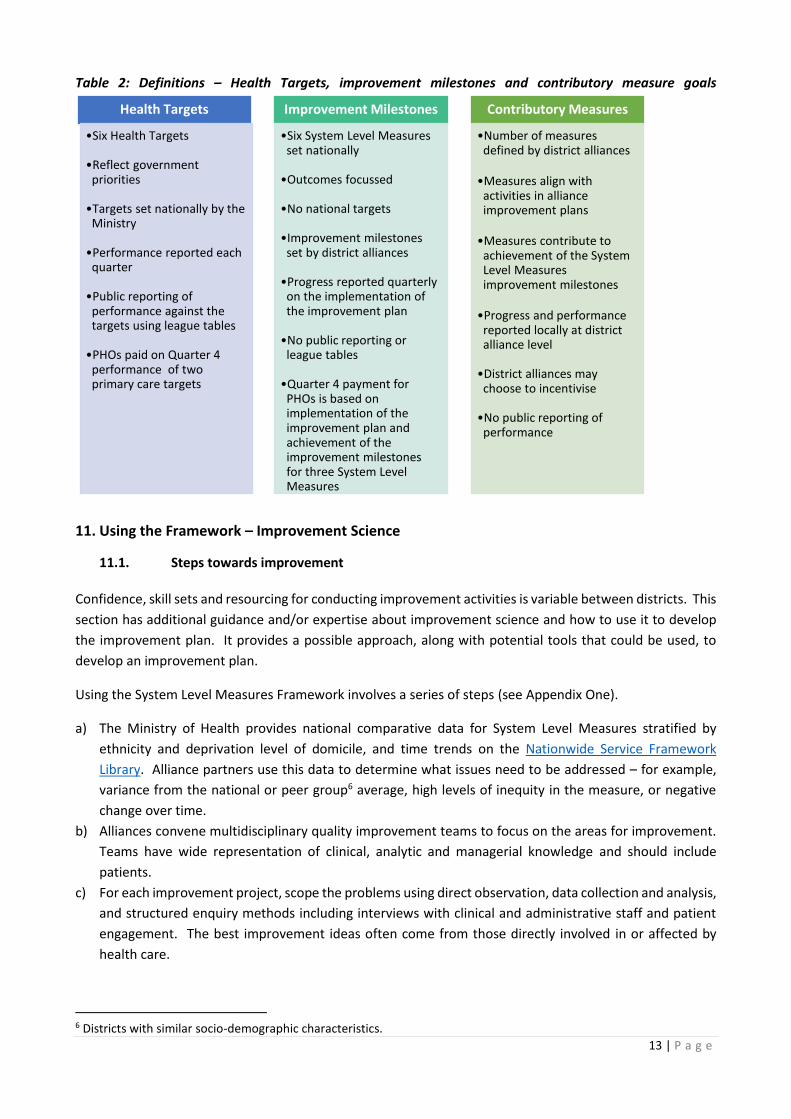
The simplest form of this analysis is known as a run chart.10 For small scale local improvements, the run chart
can be sufficient. Trends in data can be identified by plotting data for each time period against the median
value for the whole period.
There is a trend when there are six or more consecutive points one side above or below the median line. This
identifies a statistically significant sustained change in performance. Once a shift is observed, the median line
can be moved to reflect the post-shift median. Figure 1 looks at the rate of in-hospital falls over time. It shows
a run chart with a statistically significant sustained change in performance. Ideally this would reflect a new
process or activity as a result of a quality improvement initiative.
Figure 1: In-hospital falls with fractured neck of femur per 100,000 hospital admissions aged 15+
A control chart (Figure 2) is a more sophisticated version of a run chart. It sets the average (mean) level and
shows control limits, set three standard deviations away from the mean. Points outside of the control limits
are described as outliers – they have a difference from the average so great that this cannot be due to chance
alone (ie, statistically significant). There are also rules concerning shifts; in this case eight points one side or
other of the mean is a sustained shift up or down.
10 http://qualitysafety.bmj.com/content/20/1/46.full.pdf+html
0.0
2.0
4.0
6.0
8.0
10.0
12.0
14.0
16.0
18.0
20.0
Jul-
12
Au
g-1
2Se
p-1
2O
ct-1
2N
ov-
12
De
c-1
2Ja
n-1
3Fe
b-1
3M
ar-1
3A
pr-
13
May
-13
Jun
-13
Jul-
13
Au
g-1
3Se
p-1
3O
ct-1
3N
ov-
13
De
c-1
3Ja
n-1
4Fe
b-1
4M
ar-1
4A
pr-
14
May
-14
Jun
-14
Jul-
14
Au
g-1
4Se
p-1
4O
ct-1
4N
ov-
14
De
c-1
4Ja
n-1
5Fe
b-1
5M
ar-1
5A
pr-
15
May
-15
Jun
-15
Jul-
15
Au
g-1
5Se
p-1
5
In-h
osp
ital
falls
wit
h f
ract
ure
d n
eck
of
fem
ur
per
10
0,0
00
ho
spit
al
adm
issi
on
s ag
ed 1
5+*
Falls with FNOF per 100,000 hospitaladmissionsMedian

16 | P a g e
Figure 2: Post-operative DVT/PE per 1,000 at-risk admissions with fractured neck of femur per 100,000
hospital admissions
Further information about statistical process control is available at
http://www.npaihb.org/images/training_docs/NARCH/2010/Amin%20Control%20Charts%20101%20Qualit
y%20Management%20in%20Health%20Care%202001.pdf
Excel templates for statistical process charts are available from
http://www.vertex42.com/ExcelTemplates/control-chart.html.
12.2. Drilling down
Drilling down is the process of undertaking targeted analyses of particular conditions, populations, pathways
or outcomes to find out what is causing the high-level result.
12.3. Driver diagrams
The driver diagram is a tool for quality improvement.11 Having an end goal, and primary and secondary
drivers, identifies what needs to be addressed and how to address it. A driver diagram should identify a
range of interventions which may drive improvements.
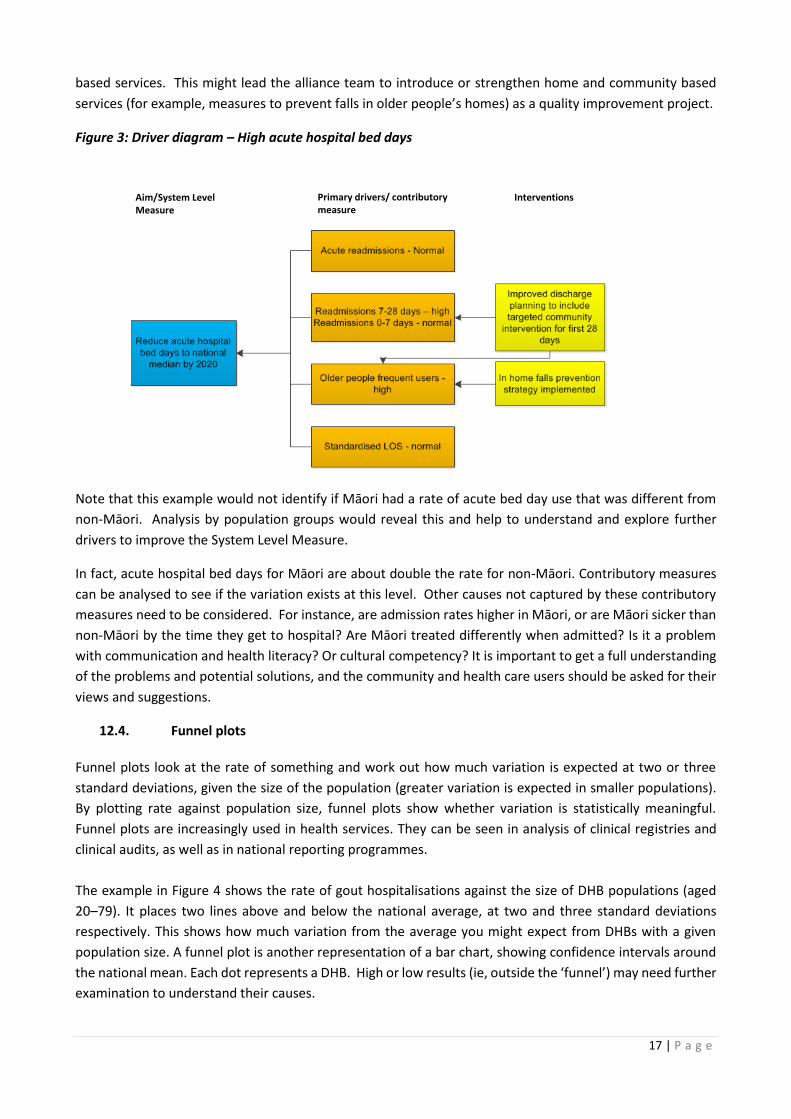
For example, for the acute hospital bed days measure, the goal might be to reduce the high number of
occupied bed days associated with acute admissions in the next four years to a rate similar to the national
average. A multidisciplinary team thinks about possible underlying causes (drivers) and asks ward staff,
administrators and managers what they think the issues are. Contributory measures show the potential
immediate drivers: longer length of stay, more acute admissions, more readmissions or more older people
entering the system.
Through additional local analysis these measures can help identify what is causing high acute hospital bed
days (Figure 3). For example, a high readmission rate between 7 and 28 days, combined with a large number
of older people entering the hospital as an emergency on a recurrent basis, may point to a gap in community
11 http://www.apiweb.org/QP_whats-your-theory_201507.pdf
0.0
1.0
2.0
3.0
4.0
5.0
6.0
Q3
…Q
4…
Q1
…Q
2…
Q3
…Q
4…
Q1
…Q
2…
Q3
…Q
4…
Q1
…Q
2…
Q3
…Q
4…
Q1
…Q
2…
Q3
…Q
4…
Q1
…Q
2…
Q3
…Q
4…
Q1
…Q
2…
Q3
…Q
4…
Q1
…Q
2…
Q3
…Q
4…
Q1
…Q
2…
Q3
…Q
4…
Q1
…Q
2…
Q3
…Q
4…
Q1
…Q
2…
Q3
…
DVT/PE per 1000at risk admissions
average
Lower controllimit
17 | P a g e
based services. This might lead the alliance team to introduce or strengthen home and community based
services (for example, measures to prevent falls in older people’s homes) as a quality improvement project.
Figure 3: Driver diagram – High acute hospital bed days
Note that this example would not identify if Māori had a rate of acute bed day use that was different from
non-Māori. Analysis by population groups would reveal this and help to understand and explore further
drivers to improve the System Level Measure.
In fact, acute hospital bed days for Māori are about double the rate for non-Māori. Contributory measures
can be analysed to see if the variation exists at this level. Other causes not captured by these contributory
measures need to be considered. For instance, are admission rates higher in Māori, or are Māori sicker than
non-Māori by the time they get to hospital? Are Māori treated differently when admitted? Is it a problem
with communication and health literacy? Or cultural competency? It is important to get a full understanding
of the problems and potential solutions, and the community and health care users should be asked for their
views and suggestions.
12.4. Funnel plots
Funnel plots look at the rate of something and work out how much variation is expected at two or three
standard deviations, given the size of the population (greater variation is expected in smaller populations).
By plotting rate against population size, funnel plots show whether variation is statistically meaningful.
Funnel plots are increasingly used in health services. They can be seen in analysis of clinical registries and
clinical audits, as well as in national reporting programmes.
The example in Figure 4 shows the rate of gout hospitalisations against the size of DHB populations (aged
20–79). It places two lines above and below the national average, at two and three standard deviations
respectively. This shows how much variation from the average you might expect from DHBs with a given
population size. A funnel plot is another representation of a bar chart, showing confidence intervals around
the national mean. Each dot represents a DHB. High or low results (ie, outside the ‘funnel’) may need further
examination to understand their causes.
Aim/System Level Measure
Primary drivers/ contributory measure
Interventions

18 | P a g e
Figure 4: Hospital admissions for gout/1,000 population
See: http://handbook.cochrane.org/chapter_10/10_4_1_funnel_plots.htm for more information about funnel plots. An easy-to-use funnel plot generating tool for Excel is available from http://www.kurtosis.co.uk/technique/funnel_plot.htm.
12.5. Balancing measures
Balancing measures track whether a perverse effect has occurred. For example, length of stay and
readmissions may work as balancing measures to each other because reduced length of stay may be achieved
by inappropriately early discharge. This early discharge might then increase readmissions; whereas,
readmissions may be reduced by keeping patients in hospital for too long. The best way to identify balancing
measures is to ask those delivering and using services for their views, and by analysing data.
13. Other Quality Improvement Initiatives
13.1. Local reporting
A King’s Fund review reported that boards of high-performing hospitals are more likely to be familiar with
measures of quality used, be familiar with their hospital’s external ratings of performance on quality, and
regularly review a quality dashboard.12 For these reasons, it is recommended quality improvement activity is
reported to the alliance on a monthly basis. The use of quality dashboards or other graphical formats makes
it easy to streamline reporting by taking snapshots, and providing the most recent updates of relevant
measures.
12 Alimo-Metcalfe B. 2012. Engaging boards – the relationship between governance and leadership, and improving the quality and safety of patient care. King’s Fund.

19 | P a g e
13.2. Dashboards
Improvement dashboards combine ongoing monitoring, quality and improvement activities, reporting and
quality accounts with measures used to judge the performance of the whole health system. Dashboards
should be tailored to the specific audience (eg, alliance level versus local clinical peer review forum).
Dashboards can be used to report quality to alliances and can be shared regionally and nationally for
benchmarking purposes.
Local data can be presented in a graphical way in a quality dashboard. Local datasets that provide real-time
information and can be monitored daily, weekly or monthly are likely to be the best data source for some
contributory measures.
A dashboard allows providers to visualise key measures for the system, and clinical teams to monitor, analyse
and improve quality. Dashboards are increasingly being used by DHBs to monitor their own performance,
identify ‘special cause’ variation, find improvement opportunities and maintain quality.
The data presented in the dashboard should show run and control charts with measurement of change over
time.

20 | P a g e
Appendix One: Example of Developing an Improvement Approach for ASH Rates 0-4 year olds
ASH rates in 0-4 year olds
Improvement milestone Actions/Activities Contributory measures
ASH rates for Māori and Pacific children fall 2% (432) by end of June 2018
Introduce healthy homes initiative through NGO or Public Health Unit
Comprehensive diagnosis and treatment of asthma in primary and community care including general practice, pharmacies and ambulance
Hospital admissions for children aged five years with a primary diagnosis of asthma
Undertake promotion of B4 School Checks to Māori and Pacific families, with aim of 90% of children receiving a B4 School Check by end June 2018
Four year old children who have received a B4 School Check
Smoke-free homes campaign launched, focusing on Māori and Pacific families
Four year old children living in smoke-free homes
System Level Measure
Identify activities and
partners that will
contribute to the
milestone
Analyse your local data
and Identify main
contributors to ASH
rates in your district
Select most relevant
contributory measures
Use Ministry of Health and Health Roundtable data to identify the percentage of avoidable hospital admissions of children 0-4 in your
district alliance
Break down by ethnicity and deprivation level to identify equity gaps
Look at most common conditions in children: respiratory illness, gastroenteritis, dental conditions and cellulitis
Identify other health system partners that may influence this System Level Measure
ASH rates in 0-4 year olds: Reduce hospital admission rates for conditions avoidable through prevention or management in primary care
See the ASH contributory measures on the Health Quality Measures website
Most relevant include:
Hospital admissions for children aged five years with a primary diagnosis of asthma
Four year old children who have received a B4 School Check
Four year old children living in smoke-free homes
To impact the milestone with focus on Māori and Pacific families:
Introduce healthy homes initiative through NGO or Public Health Unit
Undertake promotion of B4 School Checks to Māori and Pacific families, with aim of 90% of children receiving a B4 School Check by end June 2018
Smoke-free homes campaign launched, focusing on Māori and Pacific families
Comprehensive diagnosis and treatment of asthma in primary and community care including general practice, pharmacies and
ambulance
ASH improvement milestone: ASH rates for Māori and Pacific children fall by 2% (432) by end June 2018
Develop and submit
improvement plan to the
Ministry with signatures
of appropriate partners
Identify improvement
milestone for ASH
21 | P a g e
Appendix Two: Resources for Improvement Science
http://www.ihi.org/resources/Pages/default.aspx
Martin LA, Nelson EC, Lloyd RC, Nolan TW. 2007. Whole System Measures. IHI Innovation Series
whitepaper. Cambridge, Massachusetts: IHI.
http://www.cincinnatichildrens.org/about/quality-measures/system-level-measures/default/
http://improvementmethodology.govt.nz/home
http://www.hqsc.govt.nz/
http://www.hqontario.ca/Quality-Improvement
http://isrn.net/about/improvement_science.asp
http://www.health.org.uk/sites/default/files/ImprovementScience.pdf
http://koawatea.co.nz/wp-content/uploads/2016/03/6ICEGE-PAPERS-apac15final00121.pdf
Doolan-Noble FB, Lyndon M, Hau S, Hill A, Gray J, Gauld R. 2015. Developing and implementing a
framework for System Level Measures: Lessons from New Zealand.
http://www.apiweb.org/QP_whats-your-theory_201507.pdf
http://qualitysafety.bmj.com/content/20/1/46.full.pdf+html