guideline 3 - hydrogeologic investigations, groundwater monitoring · pdf file ·...
TRANSCRIPT

Page1of29
GUIDELINE 3 - HYDROGEOLOGIC INVESTIGATIONS, GROUNDWATER MONITORING
NETWORKS, AND GROUNDWATER SAMPLING FOR SOLID WASTE MANAGEMENT
FACILITIES North Dakota Department of Health - Division of Waste Management 918 E. Divide Ave., 3rd Fl., Bismarck, ND 58501-1947 Telephone: 701.328.5166 Fax: 701.328.5200 Website: www.ndhealth.gov/wm Updated 04-2009
I. Introduction
This document provides recommendations for hydrogeologic investigations, groundwater networks (systems),
and groundwater monitoring for solid waste facilities. Its intended use is primarily for landfills, but it can also be
used for other facilities including waste impoundments, waste piles, landfarms, and other similar facilities. This
document presents the Department's concept of the order in which a hydrogeologic investigation and
groundwater network (system) should proceed and the type and level of information which should result. The
document is intended to:
$ Establish the minimal scope of work for hydrogeologic investigations of solid waste landfills.
$ Provide permittees with a reference for use in preparing requests or proposals for hydrogeologic
investigations of their landfills.
$ Increase consistency between hydrogeologic investigations conducted at different solid waste landfills.
The document does not require specific methods or procedures other than those provided by statute or rule. In
the few instances where methods are specified, alternative procedures may be proposed.
This document has been prepared by the Department for the purpose of assisting owners and operators of the
sites of solid waste management facilities where hydrogeologic investigations are necessary to fulfill regulatory
or permit requirements. Questions and comments are welcome by contacting the Division of Waste
Management, North Dakota Department of Health, 918 E. Divide Ave., 3rd Fl., Bismarck, ND 58501-1947,
telephone 701-328-5166.
II. Preliminary Evaluation Report and Geotechnical Investigation Workplan
A. Introduction. The purpose of the Preliminary Evaluation Report is to summarize and evaluate existing
information (NDAC 33-20-03.1-01). This report will be used by Department to review and comment on
the proposed workplan.
The following items should be included in the Preliminary Evaluation Report:
1. Existing Conditions Plot Plan
The existing condition=s plot plan, referenced to the National Geodetic Vertical Datum, should show the
following:
a. Property lines;
b. Location(s) and types of solid waste;
c. Locations and identification of previous soil borings and wells, including abandoned and destroyed
wells and surface water monitoring points.

Page2of29
d. Highways and roads;
e. Surface water bodies including springs, wetlands, lakes, ponds, rivers and streams;
f. Buildings;
g. Engineering structures including drainageways, diversion ditches, drain tiles, manholes or other
leachate monitoring points, lined areas, leachate collection systems;
h. Cross-section lines (for part I.A.2 below);
i. Scale, north-arrow, explanation, base-map sources and bench mark; and
j. Outcrops, roadcuts, faults, sinkholes, quarries and gravel pits (active and abandoned).
2. Preliminary Cross-Sections
Two preliminary cross-sections at orientations of 90 degrees from each other in which each cross-section
line extends through the landfill should be prepared. Where sufficient data exist, the cross-sections should
be drawn perpendicular and parallel to the direction of groundwater flow. The cross-sections should be
based on available water well records, landfill operating records, geologic reports, geophysical studies and
hydrogeologic studies. Sufficient information to prepare preliminary cross-section is not always available.
When feasible, cross-sections should be developed and should show:
a. Soil boring logs, water well records, outcrops, or other geologic control;
b. Soil and bedrock stratigraphy;
c. Geologic structures;
d. Fill boundaries and depths;
e. Property boundaries of the landfill;
f. Surface water bodies as listed in I.B.1.e.;
g. Engineering structures as listed in I.B.1.g.;
h. Scale, vertical exaggeration and orientation;
i. Existing and final contours; and
j. Other information as dictated by site conditions.
3. Available Information
Available information which pertains to the facility or the area of the facility should be reviewed and
summarized. The summary should include:
a. A brief discussion of the regional and local hydrogeology.
Page3of29
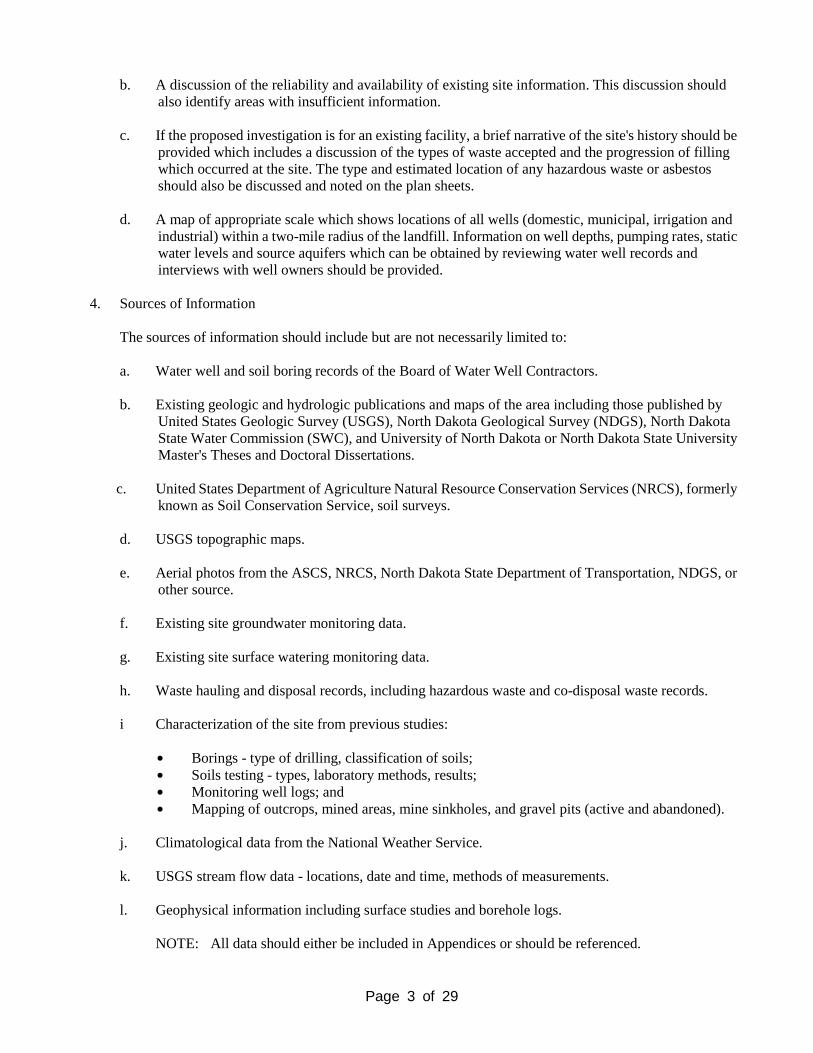
b. A discussion of the reliability and availability of existing site information. This discussion should
also identify areas with insufficient information.
c. If the proposed investigation is for an existing facility, a brief narrative of the site's history should be
provided which includes a discussion of the types of waste accepted and the progression of filling
which occurred at the site. The type and estimated location of any hazardous waste or asbestos
should also be discussed and noted on the plan sheets.
d. A map of appropriate scale which shows locations of all wells (domestic, municipal, irrigation and
industrial) within a two-mile radius of the landfill. Information on well depths, pumping rates, static
water levels and source aquifers which can be obtained by reviewing water well records and
interviews with well owners should be provided.
4. Sources of Information
The sources of information should include but are not necessarily limited to:
a. Water well and soil boring records of the Board of Water Well Contractors.
b. Existing geologic and hydrologic publications and maps of the area including those published by
United States Geologic Survey (USGS), North Dakota Geological Survey (NDGS), North Dakota
State Water Commission (SWC), and University of North Dakota or North Dakota State University
Master's Theses and Doctoral Dissertations.
c. United States Department of Agriculture Natural Resource Conservation Services (NRCS), formerly
known as Soil Conservation Service, soil surveys.
d. USGS topographic maps.
e. Aerial photos from the ASCS, NRCS, North Dakota State Department of Transportation, NDGS, or
other source.
f. Existing site groundwater monitoring data.
g. Existing site surface watering monitoring data.
h. Waste hauling and disposal records, including hazardous waste and co-disposal waste records.
i Characterization of the site from previous studies:
$ Borings - type of drilling, classification of soils;
$ Soils testing - types, laboratory methods, results;
$ Monitoring well logs; and
$ Mapping of outcrops, mined areas, mine sinkholes, and gravel pits (active and abandoned).
j. Climatological data from the National Weather Service.
k. USGS stream flow data - locations, date and time, methods of measurements.
l. Geophysical information including surface studies and borehole logs.
NOTE: All data should either be included in Appendices or should be referenced.
Page4of29
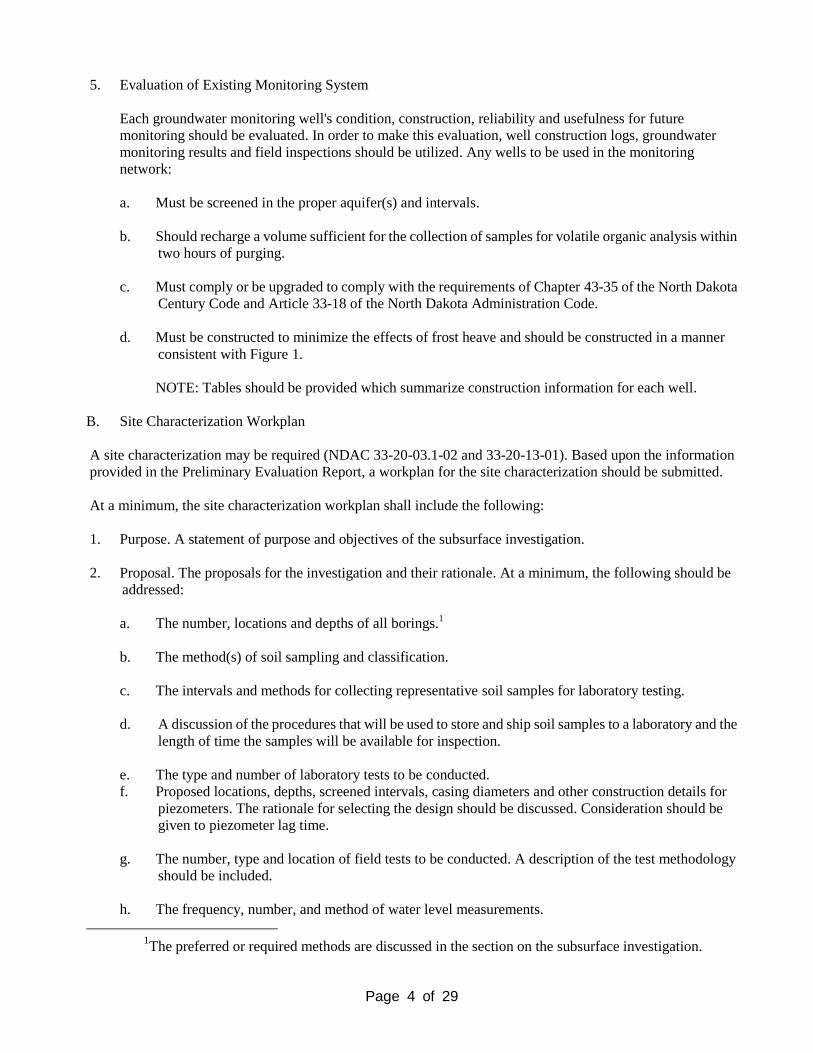
5. Evaluation of Existing Monitoring System
Each groundwater monitoring well's condition, construction, reliability and usefulness for future
monitoring should be evaluated. In order to make this evaluation, well construction logs, groundwater
monitoring results and field inspections should be utilized. Any wells to be used in the monitoring
network:
a. Must be screened in the proper aquifer(s) and intervals.
b. Should recharge a volume sufficient for the collection of samples for volatile organic analysis within
two hours of purging.
c. Must comply or be upgraded to comply with the requirements of Chapter 43-35 of the North Dakota
Century Code and Article 33-18 of the North Dakota Administration Code.
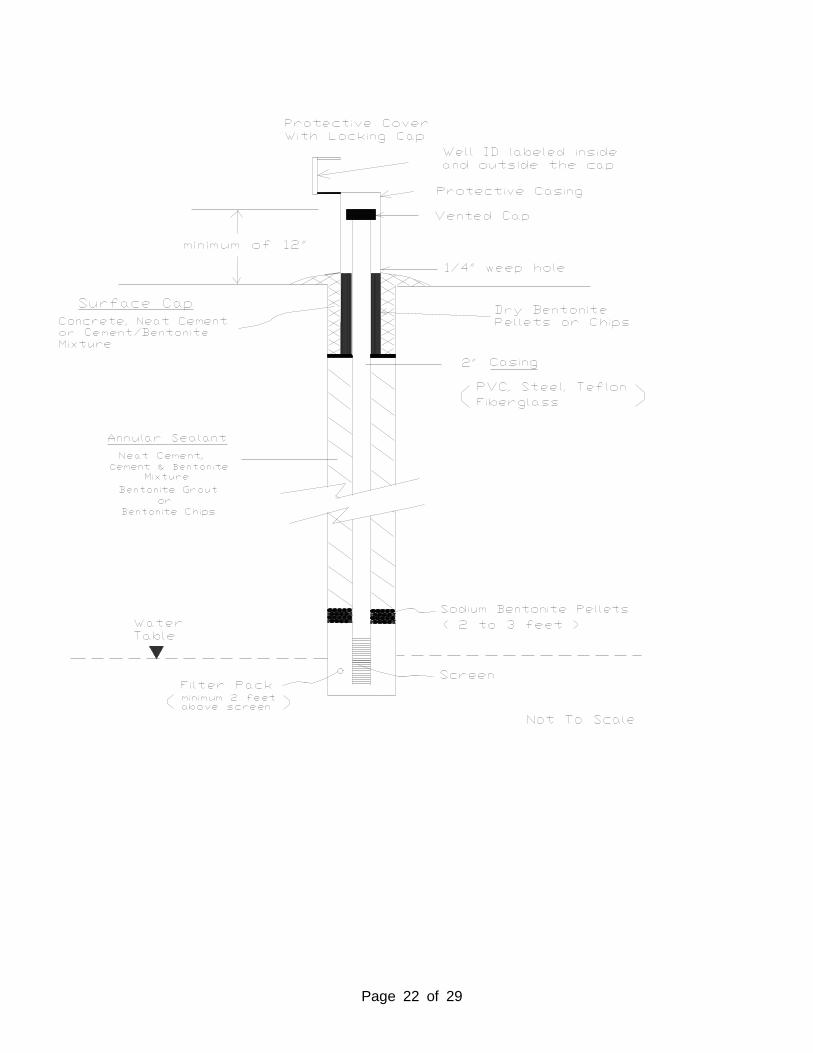
d. Must be constructed to minimize the effects of frost heave and should be constructed in a manner
consistent with Figure 1.
NOTE: Tables should be provided which summarize construction information for each well.
B. Site Characterization Workplan
A site characterization may be required (NDAC 33-20-03.1-02 and 33-20-13-01). Based upon the information
provided in the Preliminary Evaluation Report, a workplan for the site characterization should be submitted.
At a minimum, the site characterization workplan shall include the following:
1. Purpose. A statement of purpose and objectives of the subsurface investigation.
2. Proposal. The proposals for the investigation and their rationale. At a minimum, the following should be
addressed:
a. The number, locations and depths of all borings.1
b. The method(s) of soil sampling and classification.
c. The intervals and methods for collecting representative soil samples for laboratory testing.
d. A discussion of the procedures that will be used to store and ship soil samples to a laboratory and the
length of time the samples will be available for inspection.
e. The type and number of laboratory tests to be conducted.
f. Proposed locations, depths, screened intervals, casing diameters and other construction details for
piezometers. The rationale for selecting the design should be discussed. Consideration should be
given to piezometer lag time.
g. The number, type and location of field tests to be conducted. A description of the test methodology
should be included.
h. The frequency, number, and method of water level measurements.
1The preferred or required methods are discussed in the section on the subsurface investigation.
Page5of29
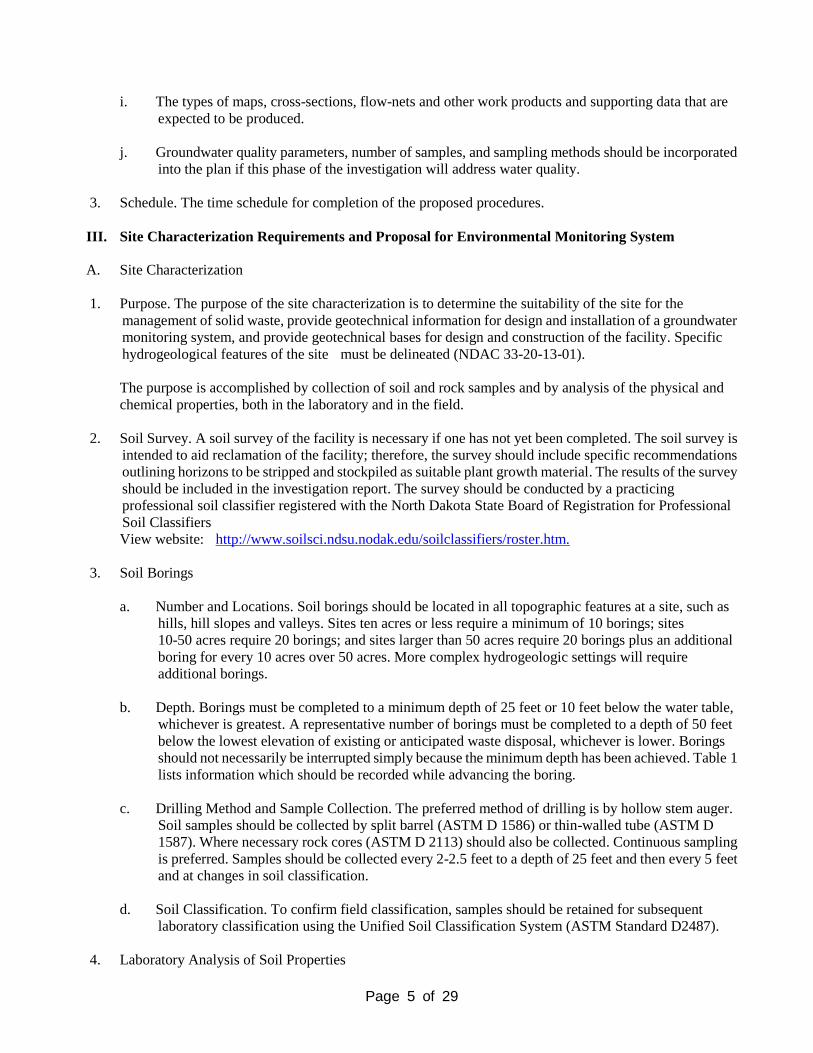
i. The types of maps, cross-sections, flow-nets and other work products and supporting data that are
expected to be produced.
j. Groundwater quality parameters, number of samples, and sampling methods should be incorporated
into the plan if this phase of the investigation will address water quality.
3. Schedule. The time schedule for completion of the proposed procedures.
III. Site Characterization Requirements and Proposal for Environmental Monitoring System
A. Site Characterization
1. Purpose. The purpose of the site characterization is to determine the suitability of the site for the
management of solid waste, provide geotechnical information for design and installation of a groundwater
monitoring system, and provide geotechnical bases for design and construction of the facility. Specific
hydrogeological features of the site must be delineated (NDAC 33-20-13-01).
The purpose is accomplished by collection of soil and rock samples and by analysis of the physical and
chemical properties, both in the laboratory and in the field.
2. Soil Survey. A soil survey of the facility is necessary if one has not yet been completed. The soil survey is
intended to aid reclamation of the facility; therefore, the survey should include specific recommendations
outlining horizons to be stripped and stockpiled as suitable plant growth material. The results of the survey
should be included in the investigation report. The survey should be conducted by a practicing
professional soil classifier registered with the North Dakota State Board of Registration for Professional
Soil Classifiers
View website: http://www.soilsci.ndsu.nodak.edu/soilclassifiers/roster.htm.
3. Soil Borings
a. Number and Locations. Soil borings should be located in all topographic features at a site, such as
hills, hill slopes and valleys. Sites ten acres or less require a minimum of 10 borings; sites
10-50 acres require 20 borings; and sites larger than 50 acres require 20 borings plus an additional
boring for every 10 acres over 50 acres. More complex hydrogeologic settings will require
additional borings.
b. Depth. Borings must be completed to a minimum depth of 25 feet or 10 feet below the water table,
whichever is greatest. A representative number of borings must be completed to a depth of 50 feet
below the lowest elevation of existing or anticipated waste disposal, whichever is lower. Borings
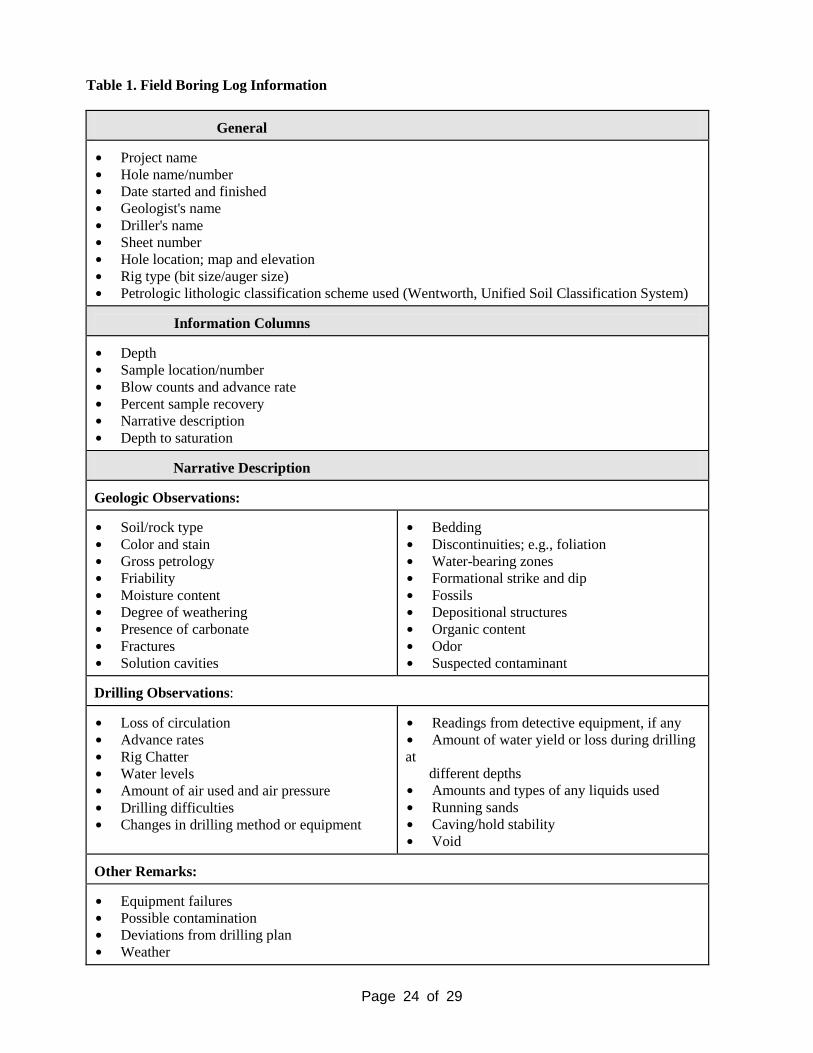
should not necessarily be interrupted simply because the minimum depth has been achieved. Table 1
lists information which should be recorded while advancing the boring.
c. Drilling Method and Sample Collection. The preferred method of drilling is by hollow stem auger.
Soil samples should be collected by split barrel (ASTM D 1586) or thin-walled tube (ASTM D
1587). Where necessary rock cores (ASTM D 2113) should also be collected. Continuous sampling
is preferred. Samples should be collected every 2-2.5 feet to a depth of 25 feet and then every 5 feet
and at changes in soil classification.
d. Soil Classification. To confirm field classification, samples should be retained for subsequent
laboratory classification using the Unified Soil Classification System (ASTM Standard D2487).
4. Laboratory Analysis of Soil Properties

Page6of29
Based on a review of water well records, existing soil borings and in-field examination of soil samples, the
soil strata which significantly affect the site's hydrology should be identified. Aquifers, confining layers,
perching layers, coal seams, coarse-grained bodies, and other important soils should be identified. Once
these strata are identified, their physical and hydraulic properties should be determined so that an estimate
of their ability to transmit or restrict groundwater movement can be made. Quantifying the soil properties
should include both laboratory and in situ testing.
Samples for laboratory analysis should be selected to represent the areal distribution of each stratum. This
soil sampling schedule will require the collection of a large number of thin-walled tube samples for
potential analysis. Samples should be preserved and transported to the laboratory in accordance with
ASTM Standard D 4220.
a. Hydraulic Conductivity. Hydraulic conductivity tests should be conducted on the thin-walled tube
samples; this may be accomplished by extrusion, trimming and isolation of the sample within a
flexible membrane, triaxial apparatus, or other appropriate methodology. Such a test quantifies the
vertical hydraulic conductivity of the enclosed sample. If the analytical results from several samples
from the same stratum are within the same order of magnitude, it will usually be unnecessary to test
all the samples collected from that stratum.
b. Particle Size Analysis. Particle size analysis should be conducted by standard test methods ASTM
D 422 and ASTM D 1140. Analysis should be conducted on a sufficient number of samples to assist
in correlating soils across the site and for the design of the monitoring wells.
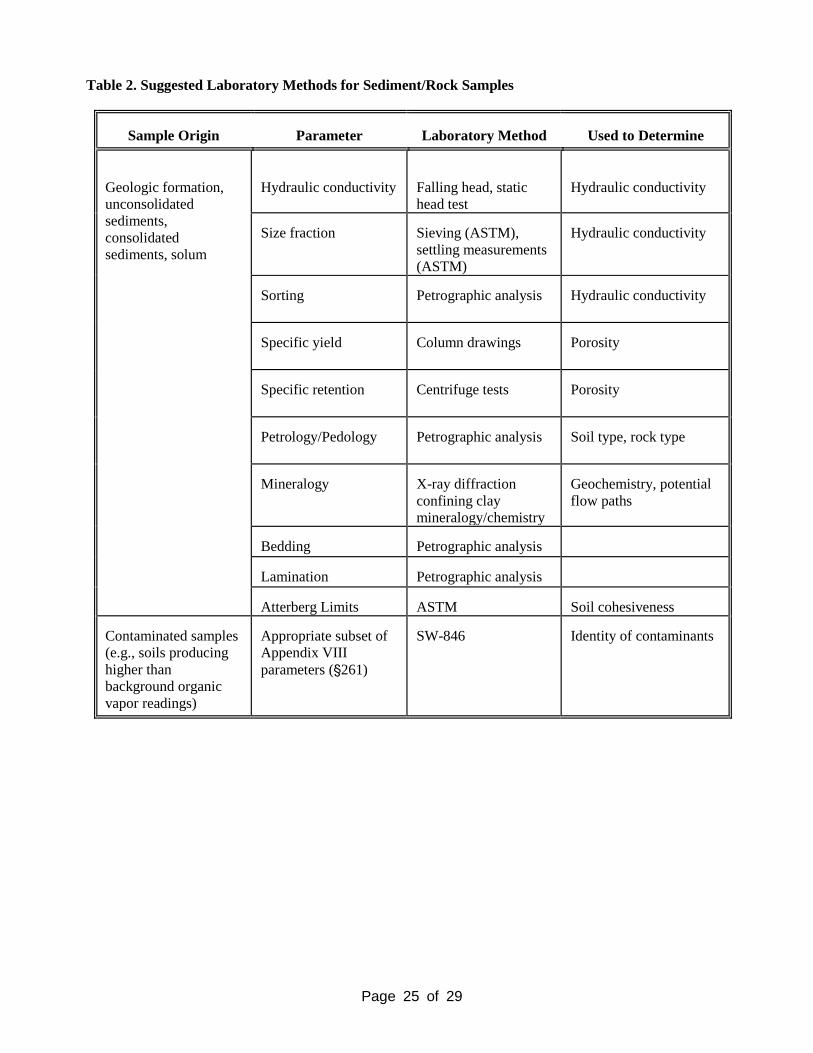
c. Additional Laboratory Tests. Additional scientific and engineering tests should be conducted
when necessary. These may include Atterberg limits, soil mineralogy, cation exchange capacity,
moisture content, etc. Table 2 provides some typical laboratory methods.
5. Piezometer Construction
a. After soil sampling and laboratory testing to determine those strata of hydrologic importance,
piezometers should be installed. Although they are often used to collect groundwater samples,
piezometers are not necessarily designed as water quality monitoring wells. They are designed to
allow measurement of hydrostatic pressure at discrete points in the soils and to perform in situ tests
of soil properties. As such, they must be constructed to respond to changes in hydrostatic pressure in
a reasonable amount of time. The design and construction of a piezometer should be based on the
estimated hydrologic properties of the stratum. The lower the estimated permeability, the more
critical the construction.
Piezometers must meet all the requirements of Chapter 43-35 of the North Dakota Century Code, and the
Standards for Water Well Construction and Water Well Pump Installation of Article 33-18 of the North
Dakota Administration Code.
b. Location and Number. Sufficient piezometers and piezometer nests are needed so that
hydrogeological conditions are determined throughout the permitted site. This requires locating
piezometers to determine the groundwater flow directions as it moves across the entire site.
A set of three piezometers in the same hydrogeologic unit in a triangular pattern is the minimum needed to
establish a generalized flow direction. The relationship between hydrogeologic units within the local and
regional hydrogeologic system should be considered. Large sites and/or those having variable soil,
topographic, or hydrogeologic conditions will require more than three piezometers.

Page7of29
c. Depth. One set of (three or more) piezometers should be placed to define the slope of the water table.
Additional set(s) of piezometers should be placed in the underlying confined aquifer(s) to determine
the hydraulic head differences (hence the gradients) between the aquifers and the flow directions in
the confined aquifers. If the upper (water table) aquifer is thick, piezometer nests should be installed
to determine the gradient within the aquifer. A nest is a group of closely spaced (a few feet apart)
piezometers screened at different depths.
d. Diameter. The diameter of the piezometer standpipe and the diameter of the screen should also be
designed to reflect the estimated permeability of the water-bearing stratus under consideration. The
higher the permeability, the smaller the diameter of the standpipe. Conversely, the lower the
permeability, the larger the diameter of the screen. A piezometer placed in a highly permeable sand
can likely be constructed of standard 2-inch PVC standpipe and screen whereas in a sandy clay, a
1-inch standpipe (or smaller) with a 4-inch (or larger) screen may be more appropriate. The reader is
referred to Hvorslev (1951), Cooper et al. (1967), and Papadopulos et al. (1973), for discussions of
piezometer construction and soil permeabilities.
e. Length. The length of a piezometer screen should generally be as short as possible. The piezometer
is meant to measure the hydraulic head at discrete points. Screens should never interconnect
separate aquifers.
6. In situ Testing
After the piezometers are installed, their water levels should be allowed to stabilize. An estimate of the
time required for this to occur can be made by consulting the references cited above. These estimates can
be confirmed by periodic water level measurements. Once stabilization is reached, the stratum's horizontal
hydraulic conductivity should be determined. Methods for determining hydraulic conductivity include bail
tests, plug tests, slug tests, and pump tests.
B. Site Characterization Investigation Report
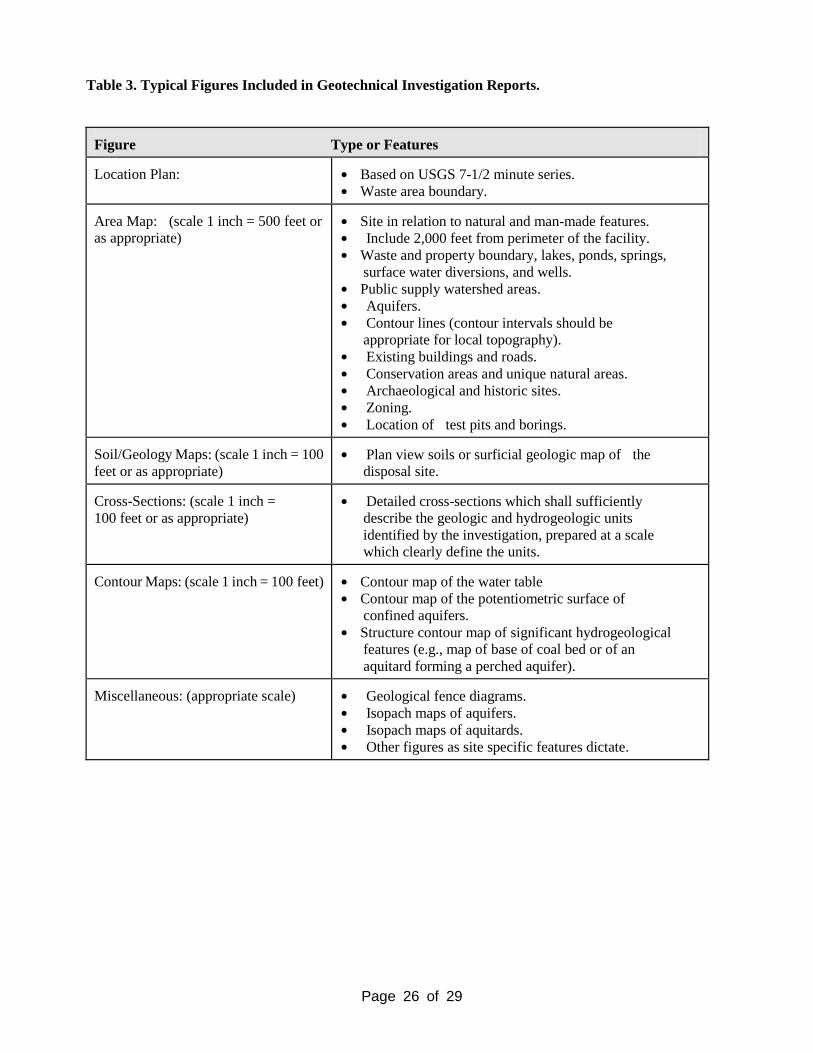
A report detailing the findings of the Site Characterization should be submitted. The report should address the
following and include graphs, maps, tables and cross-sections to illustrate the discussions. Some typical figures
are listed in Table 3.
1. Description of Geologic Units. The composition, structure and distribution of each soil, sediment, and
bedrock unit, and the range of variation in each including the soil or rock description and classification; the
lateral and vertical extent of the unit at the site; grain size distributions; mineralogy, cementation, and
other characteristics as appropriate; strike, dip, folding, faulting, jointing, and other significant regional or
local structural features; horizontal and vertical permeabilities; porosity, hydraulic conductivity, and other
hydraulic properties as appropriate; and descriptions of lenses or other discontinuous deposits, voids and
solution openings, layering, fractures, and any other inhomogeneities.
2. Description of Hydrologic Units. Descriptions of the hydrologic units within the saturated zone including
their thickness, hydraulic properties (as appropriate), such as transmissivity and storage coefficient or
specific yield; descriptions of the role of each as confining beds, aquifers, or perched saturated zones; and
their actual or potential use as water supply aquifers.
3. Description of the Flow System. Description of the groundwater flow system, illustrated with
equipotentials and streamlines on appropriate cross-sections and plans, and specifically describing the
following and discussing their significance with respect to groundwater and contaminant movement:
a. Local, intermediate and regional flow systems.

Page8of29
b. Groundwater recharge and discharge areas, and groundwater interaction with perennial or
intermittent surface waters.
c. Direction and rates of groundwater movement within the identified hydrologic units, including the
vertical components of flow.
d. Existing or proposed groundwater and surface water withdrawals.
e. The role of inhomogeneities, fractures, and anisotropy in influencing or controlling groundwater
movement.
f. Seasonal or other temporal fluctuations in potentiometric head.
g. The change in recharge rates that has occurred and will occur due to the presence of the facility.
h. The role of confining beds with regard to limiting downward movement of high-specific gravity,
immiscible or poorly soluble components of leachate.
C. Environmental Monitoring Network Workplan
Purpose. A workplan or proposal for the monitoring well network (system) should be submitted (NDAC
33-20-13-02(3)). The workplan should include a written narrative which describes the proposed design and
locations of the monitoring wells. All monitoring wells and piezometers shall be installed in accordance with
Chapter 43-35 NDCC and Article 33-18 NDAC. In addition, the wells should be consistent with Figure 1. The
following items should be considered:
1. Location and Depth. The groundwater must be monitored both upgradient and downgradient from the site
(NDAC 33-20-13-02). The number of monitoring wells and depths of those wells are site-specific should
be determined based on the Preliminary Evaluation Report and Geotechnical Investigation. If more than
one flow system exists, monitoring wells may be required both upgradient and downgradient in each of the
potentially affected systems.
2. Rate of Recharge. Consideration should be given to the rate of recharge which is based in hydrologic
properties of the soils and monitoring well construction. Wells should be constructed to recharge a
sufficient sample volume within two hours.
Numerous analytic and predictive equations have been developed for specific geologic conditions and
monitoring well constructions. A more in-depth examination of time-lag theory and examples of its
application to specific well constructions are provided by Hvorslev (1951) and Papadopulos et al. (1973).
3. Casing. Length, diameter and material.
4. Screen. Length, diameter, material, slot size and packing.
5. Well development. All monitoring wells should be developed and stabilized. Well development
procedures should be described in the workplan. The following excerpt (EPA, 1986) provides a short
discussion on well development:
"After the owner/operator completed constructing monitoring wells, natural hydraulic conductivity of the
formation should have been restored and all foreign sediment removed to ensure turbidity-free
groundwater samples.
Page9of29
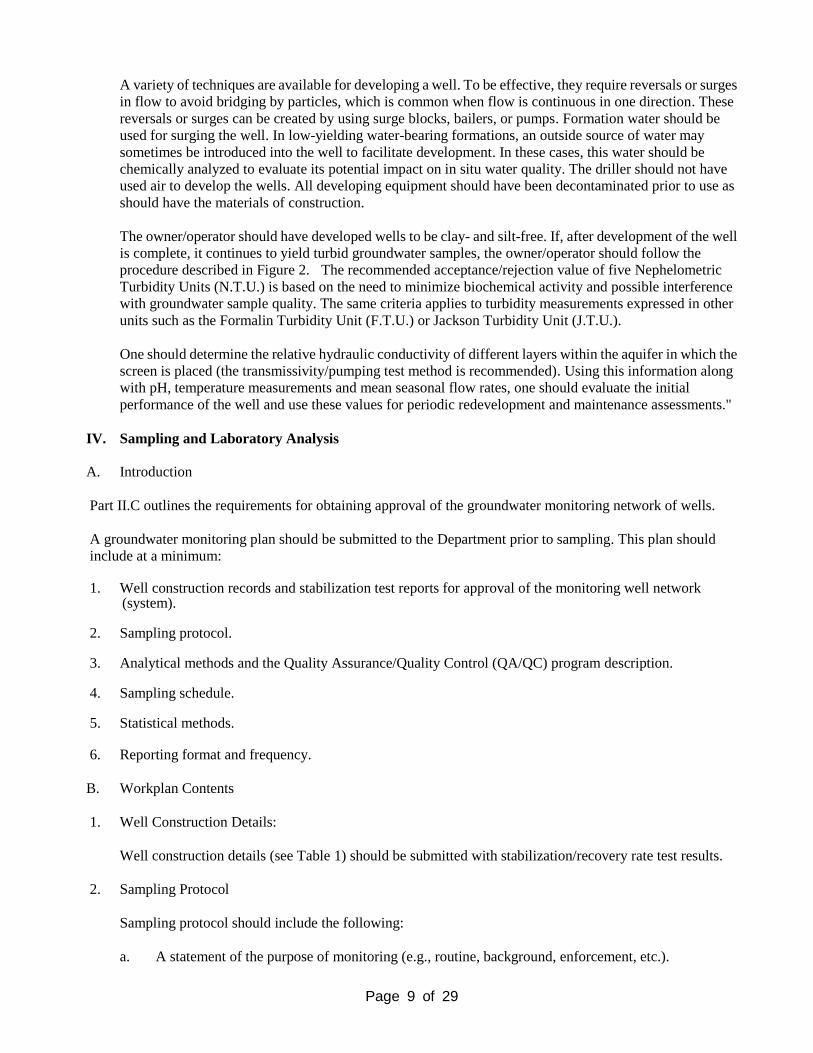
A variety of techniques are available for developing a well. To be effective, they require reversals or surges
in flow to avoid bridging by particles, which is common when flow is continuous in one direction. These
reversals or surges can be created by using surge blocks, bailers, or pumps. Formation water should be
used for surging the well. In low-yielding water-bearing formations, an outside source of water may
sometimes be introduced into the well to facilitate development. In these cases, this water should be
chemically analyzed to evaluate its potential impact on in situ water quality. The driller should not have
used air to develop the wells. All developing equipment should have been decontaminated prior to use as
should have the materials of construction.
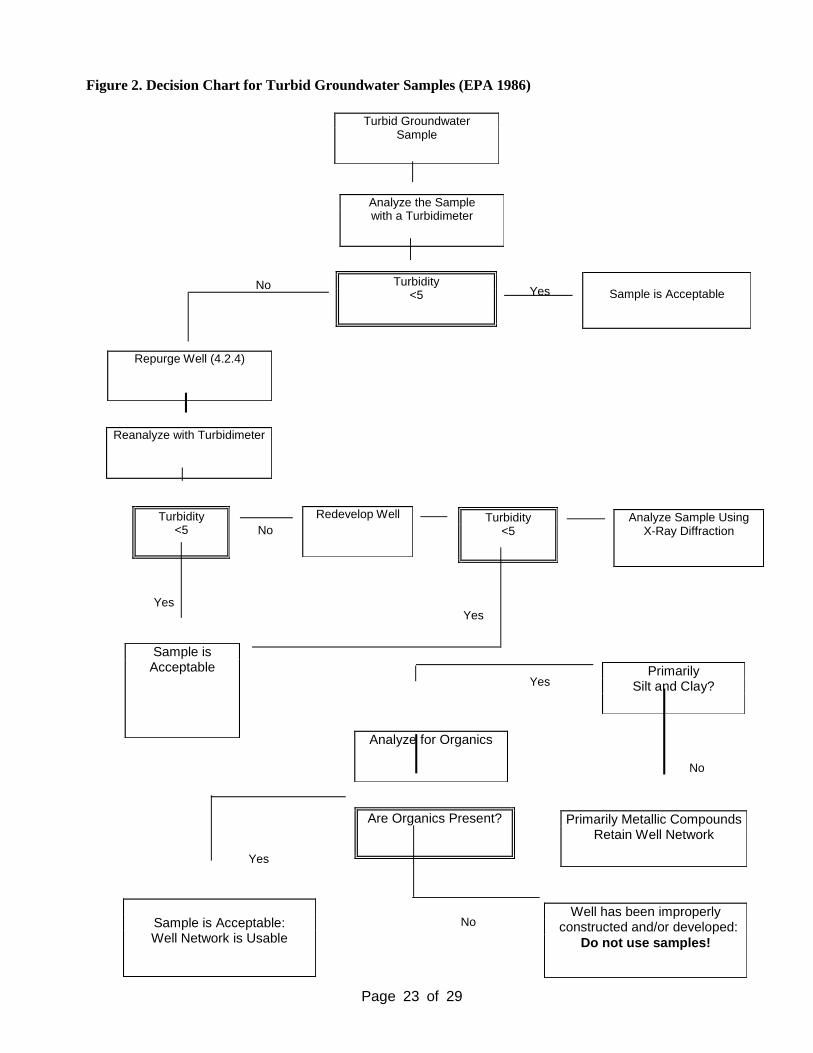
The owner/operator should have developed wells to be clay- and silt-free. If, after development of the well
is complete, it continues to yield turbid groundwater samples, the owner/operator should follow the
procedure described in Figure 2. The recommended acceptance/rejection value of five Nephelometric
Turbidity Units (N.T.U.) is based on the need to minimize biochemical activity and possible interference
with groundwater sample quality. The same criteria applies to turbidity measurements expressed in other
units such as the Formalin Turbidity Unit (F.T.U.) or Jackson Turbidity Unit (J.T.U.).
One should determine the relative hydraulic conductivity of different layers within the aquifer in which the
screen is placed (the transmissivity/pumping test method is recommended). Using this information along
with pH, temperature measurements and mean seasonal flow rates, one should evaluate the initial
performance of the well and use these values for periodic redevelopment and maintenance assessments."
IV. Sampling and Laboratory Analysis
A. Introduction
Part II.C outlines the requirements for obtaining approval of the groundwater monitoring network of wells.
A groundwater monitoring plan should be submitted to the Department prior to sampling. This plan should
include at a minimum:
1. Well construction records and stabilization test reports for approval of the monitoring well network
(system). 2. Sampling protocol. 3. Analytical methods and the Quality Assurance/Quality Control (QA/QC) program description. 4. Sampling schedule. 5. Statistical methods. 6. Reporting format and frequency.
B. Workplan Contents
1. Well Construction Details:
Well construction details (see Table 1) should be submitted with stabilization/recovery rate test results.
2. Sampling Protocol
Sampling protocol should include the following:
a. A statement of the purpose of monitoring (e.g., routine, background, enforcement, etc.).

Page10of29
b. A list of the parameters for which each well will be sampled and the order in which the samples will
be collected from the wells (e.g., volatiles, metals, etc.).
c. The methods which will be followed for establishing static water level, stabilizing the well,
evacuating of the well, and obtaining a sample.
d. A list and description of the field equipment which will be used for sampling such as the pump,
bailer, bailer line, tape, M Scope, meters, filters, containers, etc.
e. The amount of water in gallons and well volumes which will be evacuated from each well prior to
sampling based on stabilization tests, pump tests or other methods which should be described in
detail.
f. The order in which the wells will be sampled and rationale for this order.
g. The procedures and materials which will be used to clean equipment between wells, such as cleaning
solutions and the volumes used.
h. Sample preservation methods such as filtering, acidification, cooling and holding times.
i. A sample chain-of-custody form which will be used by the sampler.
j. Shipping and handling procedures and time schedule from the field to the laboratory to the actual
analysis.
3. Analytical Methods
Analytical methods and QA/QC program proposal should include the following:
a. The EPA or Standard Methods which will be used by the laboratory for each parameterCother
methods may be proposed, but will have to be approved. Volatile organics must be analyzed
according to the Purge and Trap Method listed in EPA Documents: EPA #600/4-81-057, EPA
#600/4-81-059 or EPA #600/4-82-057.
b. The lowest detection limits expected for the method and equipment to be used.
c. The types of laboratory equipment, makes, and model numbers.
d. The laboratory's equipment maintenance schedule.
e. The number and frequency of quality control samples (e.g., blanks, spikes, replicates, duplicates,
etc.) to be analyzed. A minimum of one in ten is required in general and at changes of sample
matrix.
V. Sampling Schedule and Parameters
A. Sampling Schedule
The scheduled sampling dates should be indicated so that the Department has an opportunity to split samples,
inspect the wells, and observe the procedures used to collect the samples. The schedule should also specify
which parameter list will be utilized for each sampling event. The parameters for which landfills monitor consist
Page11of29
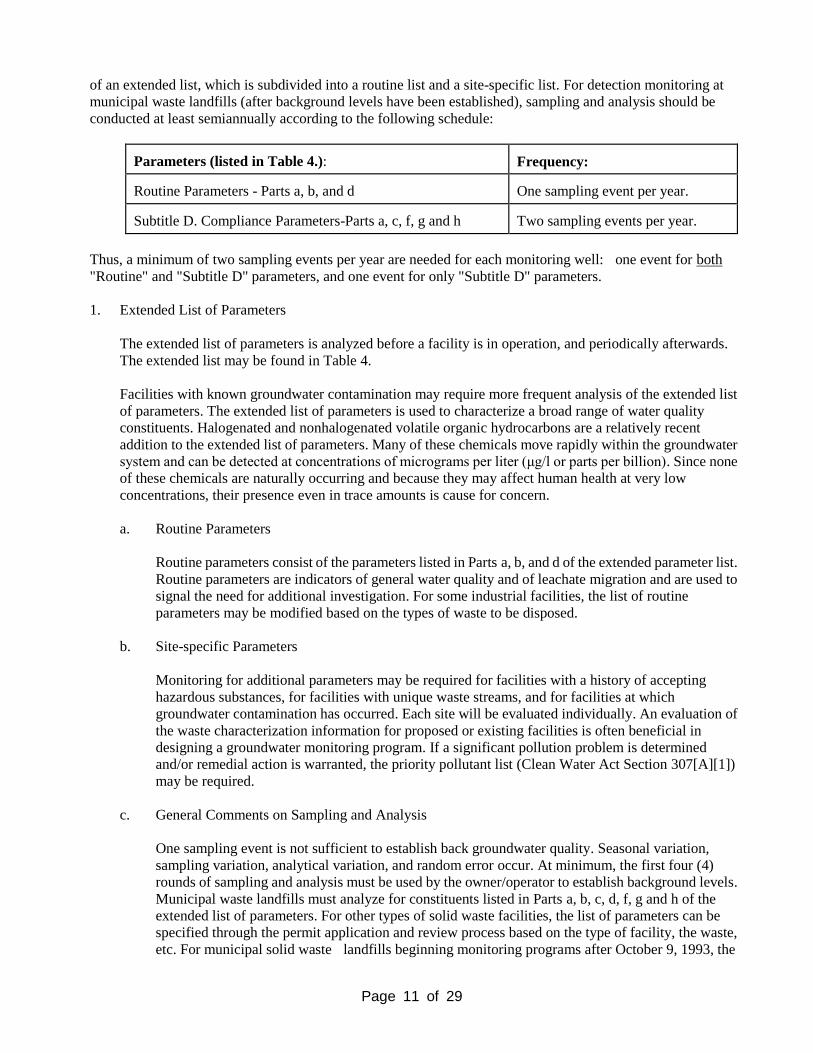
of an extended list, which is subdivided into a routine list and a site-specific list. For detection monitoring at
municipal waste landfills (after background levels have been established), sampling and analysis should be
conducted at least semiannually according to the following schedule:
Parameters (listed in Table 4.):
Frequency:
Routine Parameters - Parts a, b, and d
One sampling event per year.
Subtitle D. Compliance Parameters-Parts a, c, f, g and h
Two sampling events per year.
Thus, a minimum of two sampling events per year are needed for each monitoring well: one event for both
"Routine" and "Subtitle D" parameters, and one event for only "Subtitle D" parameters.
1. Extended List of Parameters
The extended list of parameters is analyzed before a facility is in operation, and periodically afterwards.
The extended list may be found in Table 4.
Facilities with known groundwater contamination may require more frequent analysis of the extended list
of parameters. The extended list of parameters is used to characterize a broad range of water quality
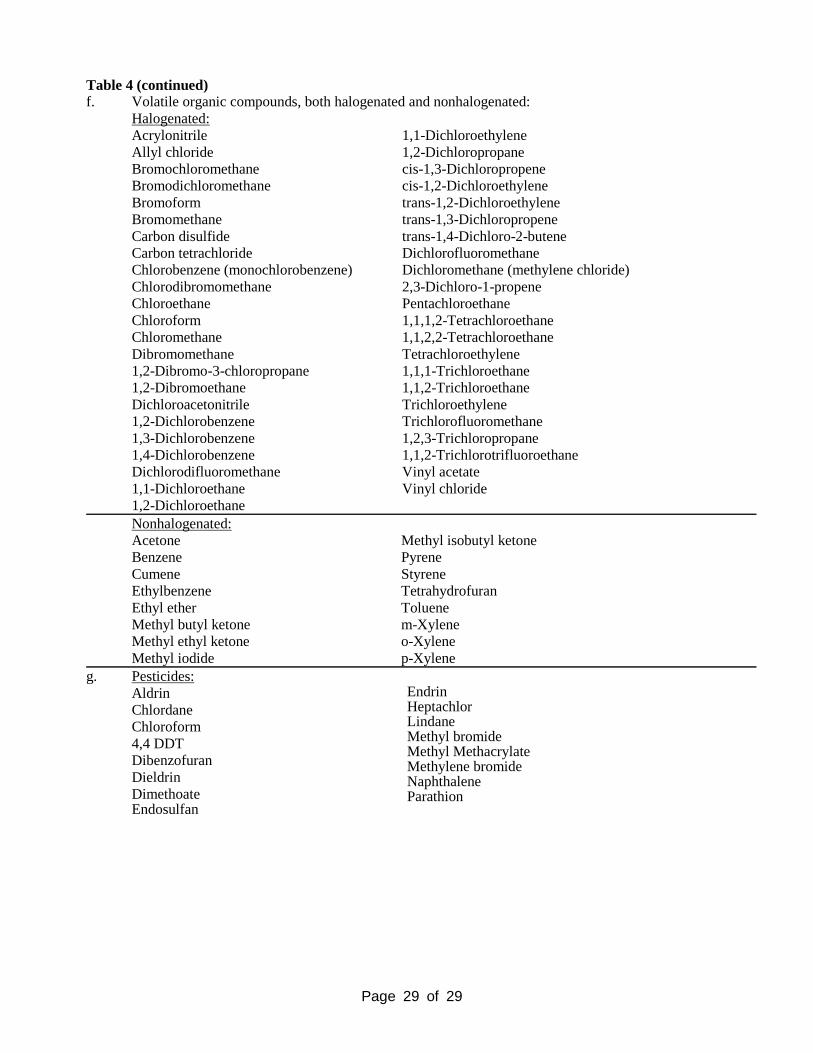
constituents. Halogenated and nonhalogenated volatile organic hydrocarbons are a relatively recent
addition to the extended list of parameters. Many of these chemicals move rapidly within the groundwater
system and can be detected at concentrations of micrograms per liter (μg/l or parts per billion). Since none
of these chemicals are naturally occurring and because they may affect human health at very low
concentrations, their presence even in trace amounts is cause for concern.
a. Routine Parameters
Routine parameters consist of the parameters listed in Parts a, b, and d of the extended parameter list.
Routine parameters are indicators of general water quality and of leachate migration and are used to
signal the need for additional investigation. For some industrial facilities, the list of routine
parameters may be modified based on the types of waste to be disposed.
b. Site-specific Parameters
Monitoring for additional parameters may be required for facilities with a history of accepting
hazardous substances, for facilities with unique waste streams, and for facilities at which
groundwater contamination has occurred. Each site will be evaluated individually. An evaluation of
the waste characterization information for proposed or existing facilities is often beneficial in
designing a groundwater monitoring program. If a significant pollution problem is determined
and/or remedial action is warranted, the priority pollutant list (Clean Water Act Section 307[A][1])
may be required.
c. General Comments on Sampling and Analysis
One sampling event is not sufficient to establish back groundwater quality. Seasonal variation,
sampling variation, analytical variation, and random error occur. At minimum, the first four (4)
rounds of sampling and analysis must be used by the owner/operator to establish background levels.
Municipal waste landfills must analyze for constituents listed in Parts a, b, c, d, f, g and h of the
extended list of parameters. For other types of solid waste facilities, the list of parameters can be
specified through the permit application and review process based on the type of facility, the waste,
etc. For municipal solid waste landfills beginning monitoring programs after October 9, 1993, the

Page12of29
first four (4) rounds of sampling and analysis must occur within the first six (6) months of facility
operation. For other landfills with monitoring wells, semiannual sampling and analysis of
appropriate parts of the extended list of parameters is generally acceptable for obtaining background
data and for detection monitoring after background levels are established. The Department may
require more frequent monitoring, depending on the facility and the local hydrogeologic conditions.
In general, the opportunities for contaminating a sample increase as the number of persons handling
the sample increase. The chain-of-custody document must list all persons who collect, transport, and
receive the sample bottles. The use of an independent laboratory to collect, transport, and analyze the
samples is strongly recommended.
2. Reports
Reports on sampling events are required periodically as part of the continuing Groundwater Monitoring
Program and are also an integral portion of the report on the Hydrogeology Investigation. These reports
should contain, at a minimum, the following:
a. The static water level for each well to the nearest 0.01 foot from the surveyed reference point.
b. The stabilization test results for each well.
c. The number of gallons of water and the number of well volumes removed before sampling.
d. Sampler's field comments regarding anything unusual about the well such as: obstructions
removed before sampling, well seal deterioration, vandalism, unlocked caps, excessive sediment in
or coloration of the sample, odor, unexpectedly high or low static water level, bailer lost in the well,
etc.
e. A statement about any deviations in sampling or analysis techniques or equipment used from that
stated in the workplan.
f. The laboratory results of each sample analysis along with the quality control sample (e.g., blank,
spikes, duplicates) analysis. An analysis of a field blank for each sampling event for volatile
organics must be included.
g. A water table or potentiometric map of each hydrogeological unit being monitored. This map should
also depict the locations of any wells screened in the unit in relationship to waste disposal cells and
other appropriate features.
h. Data should be provided in a readily comprehensible form, such as tables, in addition to copies of the
lab reports.
The Department will review this workplan and provide written comments to the permittee. Once any necessary
modifications to the workplan are completed, sampling may proceed.
VI. Data Analysis and Impact Identification
Part V details the requirements for presenting the analytical data and assessing the actual and/or potential
impacts of the facility on the residents or environment of the surrounding area.
A. Summary
Page13of29
The author should provide a summary which presents the conclusions and briefly states the conceptual model
that most adequately explains the hydrogeology and contaminant movement (if applicable). The supporting data
pertinent to the theory should also be summarized.
B. Identification of Receptors
Based on the site investigation, the resources (receptors) which have been impacted or are to be protected should
be identified from the list prepared for the Evaluation Report and the location indicted on maps and
cross-sections of appropriate scale. These receptors include:
1. Aquifers. The report must identify the following beneath the facility:
a. All perched aquifers.
b. The first two aquifers or separate saturated zones.
c. All contaminated aquifers.
d. The next aquifer beneath the lowest known contaminated aquifer.
e. All confining/separating units.
If there are wells which have allowed or could allow contaminants to move from one aquifer to another, the
potentially affected aquifer(s) should also be identified.
2. Wells. The report should identify all wells within one mile downgradient of the disposal facility or one
mile downgradient of the leading edge of the plume of contamination.
3. Surface Waters. The report should identify any surface water bodies within one mile of the facility which
have been affected or are to be protected.
4. Conduits. The report should identify and show on maps of appropriate scale all drain tiles, sewer lines or
other potential conduits on or adjacent to the subject property which could intercept leachate or
leachate-contaminated groundwater. The discharge point for the drain tile shall also be identified.
C. Data Presentation
1. Monitoring Points. The purpose of each monitoring point shall be explained. As an example, monitoring
wells should be identified by the aquifer they are monitoring and whether they are upgradient,
downgradient, or lateral to the fill or plume. Downgradient wells should be described as being in or near
the area which might be expected to have the highest level of contamination, be on the edges of the plume,
etc.
2. Tabulation of Data. The report should present all of the water quality and water level data in tabular form.
If data is available but is judged as unrepresentative of actual groundwater conditions, the reasons for not
using the data in the analysis should be stated. The discarded data must be included in the Appendices, but
need not be tabulated in the report.
3. Graphical Presentation. If a sufficient amount of data is available, it should be presented in graphical form.
This may include, but not necessarily be limited to:
a. Time versus concentration graphs.
Page14of29
b. Correlations or regression analysis.
c. Stiff, bar, radial coordinate, or pie diagrams for major ion analysis.
d. Trilinear diagrams.
e. Isogram (isopleth) maps of contaminant concentration, in plan view and cross-section.
f. Well hydrographs.
4. A statistical analysis and summary of the water quality data. The Department has prepared a document
containing recommended statistical methods for the analysis. U.S. EPA (1986, 1988) provides some
discussion of appropriate statistical methods to use in performing the analyses.
D. Impact Analysis
The report should discuss the actual/potential impact on each of the previously identified receptors. This should
be based on the data which has been presented and assessed. Inconsistencies between groundwater quality data
and groundwater hydraulics or between groundwater quality data and known or expected wastes and areas of
disposal should be pointed out. The report should state all assumptions made and test the critical
assumptions/estimates to determine the impact on the conclusions.
Where groundwater models are used as predictive tools, the report shall describe: the type and applicability of
the model; the equation being solved; all model assumptions; and, the initial and boundary conditions. The
report shall provide complete documentation of the model or reference to the documentation. The report should
also discuss how the accuracy of the modeling results have been or will be determined (e.g., calibration and
sensitivity analysis).
E. Alternative Explanations: The report should state and discuss alternative explanations and why they were
discarded from further consideration.
F. Recommendations for Further Study: If there is not enough information available to draw the conclusions
on impacts or if there is more than one plausible explanation, recommendations for additional work and a
workplan should be presented.
G. Recommendations: Where sufficient data exists to properly evaluate the facility, recommendations
should be made concerning the necessity of additional action.
H. Sample Calculations: A sample calculation using actual data with units should be included for each type
of calculation.
I. Raw Data: All raw data should be included as Appendices.
J. References: All references should be included.
VII. Well and Borehold Abandonment
Monitoring well abandonment is as important as well installation. Abandonment must be consistent with
Article 33-18 NDAC. The objective of boring and well abandonment is to close off the boring or well
completely in order to prevent future contamination of the groundwater. Abandonment of wells includes sealing
both the inside and outside of the well casing. The materials used to abandon a well must be impermeable,
continuous and not subject to chemical or physical change. The methods used will vary with the type and
location of the well or boring.
Page15of29
A. Soil Borings
Begin borehole abandonment by extending a tremie tube to the bottom of the hole. Apply bentonite and/or grout
slurry through the tube to the bottom of the hole and raise the tremie tube as the hole is filled from the bottom
upward. Keep the end of the tremie tube submerged in the grout while filling. Fill the boring hole from the base
of the boring all the way to the natural ground surface. Document,, in writing, the exact location of the
abandoned soil boring with reference to the landfill's coordinate system.
B. Monitoring Wells
There are several options for abandoning monitoring wells, depending on existing well construction and
available drilling equipment. Before abandoning any well, remove any existing protective metal casing by
vertically pulling it off the existing monitoring location. If the well is known to be constructed properly with
impermeable cement-based backfill that was installed from the bottom up using a tremie tube, it is sufficient to
fill the inner well PVC casing with impermeable grout, also via the tremie tube.
If well construction techniques are improper or undocumented, there are two methods available for abandoning
the wells.
One method is for PVC well casings. First, fill the well casing with grout so that if the abandonment attempt
fails, the well casing itself will not act as a direct conduit to groundwater. Drill out the PVC well casing using a
standard casing bit of sufficient outside diameter. This method destroys the well. Advance the bit and drill
casing past the bottom of the existing monitoring well to the maximum depth of the previously drilled boring,
unless the deep part of the boring is documented to have been properly sealed. Clean all drilling debris from the
interior of the drill casing. Extract the drill casing in 5-foot increments. After extracting each casing flight, use a
tremie tube to grout the hole with an impermeable grout. Keep the tremie tube submerged in the grout at all
times. Alternatively, fill the drill casing with grout before withdrawing each casing flight. This may be easier
than using a tremie tube. If the soils are cohesive, a solid stem auger may be used instead of the bit and casing. In
this case, retract all the augers and fill the hole immediately with impermeable backfill using a tremie tube.
A second alternative for undocumented installations is appropriate for both steel and PVC well casings in
cohesionless soils. Do not fill the inner well casing with grout. Drill around the well casing with a hollow stem
auger of large inside diameter. (An inside diameter of less than 3 inches is too small for a 2-inch diameter well
casing.) A large diameter auger is less likely to veer off the path of the well casing during drilling. Drill to the
maximum depth of the previously drilled boring. If the well casing is steel, attempt to pull out the well, either
incrementally or in one long "string." If the steel well casing breaks or gets stuck, try jetting the well out by
forcing water down the well casing and out the screen. If that fails, extract the augers one by one and cut off
5-foot lengths of the well casing until the well casing is removed. Then replace the hollow stem augers to the
bottom of the hole. Clean the drilling debris from the interior of the auger and extract the augers one by one.
Alternate extracting augers with filling the hole with impermeable grout using a tremie tube. The procedure for
PVC wells is slightly different. First, try to jet the PVC casing out by using water, then try to pull the well out. If
the well breaks or becomes lodged, drill the casing out using a "central cleaning bit" or "central coring plug,"
which is a fish-tail bit attached to the "A" rod. This method uses water as a drilling fluid to flush out the cuttings.
After cleaning out the hole, install the backfill as described for steel well casings, noted above.
After 24 hours, "retop" the grout if it has settled below the existing ground surface. Document the location and
method of abandoning the well.
C. Wells In Future Fill Areas
If a well is in a particularly sensitive area, such as in an area that may be used for waste disposal in the future,
extra precautionary measures must be taken. First, remove the well and seal the hole as described above. Then,

Page16of29
dig a pit around the well 5 feet below the ground surface or 5 feet below the base of the proposed landfill
excavation, whichever is deeper. Fill the pit above the abandoned borehole with compacted 1-foot (maximum)
lifts of clay having a hydraulic conductivity of 1 x 10⁻⁷
cm/sec or less. Again, be sure to document the location
and method of abandoning the well.
VIII. Evaluation of Alternative Municipal Waste Landfill (MWLF) Designs
Alternative designs for MWLFs are allowed by state rule to allow design innovation and consideration of
site-specific conditions (NDAC 33-20-06.1-02(2,g)). The design must ensure that the Maximum Contaminant
Levels (MCLs) listed in Table 5 are not exceeded in groundwater at the compliance boundary. The compliance
boundary is normally located at the waste management unit boundary or, if approved by the Department, up to a
maximum of 150 meters from the waste management unit boundary.
When evaluating an alternative design, owners/operators should consider at least three factors: (1) the
hydrogeologic characteristics of the facility and surrounding land; (2) the climate of the area; and (3) the volume
and physical and chemical composition of the leachate.
The performance and design standards for new municipal solid waste landfills and lateral expansion of
municipal solid waste landfills are addressed in NDAC 33-20-06.1. The rule allows for the use of either a
four-foot thick compacted clay liner, a composite liner consisting of a minimum of two feet of compacted clay
and a synthetic liner that is at least 60-mil thick, or another alternative design. Owners or operators proposing to
use the four-foot thick clay liner or an alternative design must demonstrate the capability of maintaining
contaminant concentrations below maximum contaminant levels (MCLs) at the facility's relevant point of
compliance.
A. Demonstration Requirements
The demonstration requirements apply to any municipal waste landfill designs proposing a four-foot clay liner
system and a leachate collection system or another alternative design as well as for other solid waste facilities
such as small volume industrial waste and special waste landfills as described in Chapter 33-20-07.1. The
owner/operator must demonstrate to the Department that the design will not allow contamination of
groundwater at the relevant point of compliance to exceed the EPA established MCLs listed in Table 5 as well
as the standards identified in 33-20-13-03 NDAC and, if necessary, constituents in excess of any secondary
maximum contaminant levels or in excess of any health advisories.
Any demonstration should consider an assessment of leachate quality and quantity, leachate leakage to the
subsurface, and subsurface transport to the compliance boundary. These factors are governed by the waste
characteristics, site hydrogeology, and climatic factors. The nature of the demonstration is essentially an
assessment of the potential for leachate production and leakage from the landfill to groundwater and the
anticipated fate and transport of constituents to the compliance boundary at the facility. Inherent to this type of
approach is the need to evaluate leachate quality and quantity and obtain sufficient site-specific data to
adequately characterize the existing groundwater quality and the existing groundwater flow regime (e.g., flow
direction, horizontal and vertical gradients, hydraulic conductivity, stratigraphy and aquifer thickness).
The assessment should be made of the effect the waste management facility construction will have on site
hydrogeology. The assessment should focus on the reduced infiltration over the landfill area, increased
infiltration from any ponds etc., and the effects of altered surface water runoff patterns. Changes in recharge and
changes in surface water patterns resulting from landfill construction may affect upward groundwater gradients
in some cases and result in changes in lateral flow direction in others.
B. Leachate Characterization

Page17of29
Leachate characterization should include an assessment of both the quantity and composition of leachate
anticipated at the proposed facility. The demonstration should be supported with an historic evaluation of
precipitation events and the likelihood for flooding of the unit through heavy rains, surface runoff, or high water
tables. The demonstration should evaluate whether constituents can be expected to be produced in
concentrations greater than those discussed above. It is plausible that the toxicity of leachate from household
wastes may be controlled, particularly if the area served by the unit has an effective toxic waste prevention and
segregation program that prevents the disposal of wastes of concern as well as consumer goods containing
significant quantities of the pesticides, herbicides, solvents, and metals.
When leachate constituents can be expected to exceed the established standards, then the demonstration should
focus on developing a profile of leachate quality and production rates (volume) sufficient to be used in
evaluating its fate and transport from point of release to the relevant point of compliance.
If leachate composition data that are representative of the proposed facility are not available, then leachate data
with a similar expected composition should be presented. Landfill leachate composition is influenced by:
1. The annual precipitation infiltration and rate of leaching;
2. The type and relative amounts of materials in the waste stream; and
3. The age and the biological maturity of the landfill that may affect types of organic and inorganic acids
generated, oxidation/reduction potential (Eh), and pH conditions.
An existing landfill in the region, with a similar waste stream, may be able to provide information that will
allow the owner or operator to anticipate leachate composition of the proposed landfill. A review of
technical literature may also be required to assess anticipated leachate composition if actual data are
unavailable (see USEPA 1987b). A wide range of leachate concentrations are reported in the literature
with higher concentrations of specific constituents typically reported for the initial leachate from
laboratory or field experimental test fills or test cells. These "batch" one-day landfills do not account for
the long-term climatic and meteorological influences of a full-scale landfill operation and leachate
generation.
Volumetric production rates of leachate are important in evaluating the fate and transport of the
constituents listed in Table 5. Leachate production depends on rainfall incident to the unit, run-on, runoff,
evapotranspiration, water table elevation relative to the bottom of the landfill, and prevention of liquid
disposal at the site. Run-on, runoff and water table factors can be eliminated traditionally through design
and operational controls. Incident precipitation and evapotranspiration can be evaluated using the HELP
model or other more site-specific methods of estimating leachate production. It is reasonable to expect that
leachate production may assume seasonal cyclical characteristics of low and high flows.
Once leachate composition and production have been estimated, it is possible to predict the fate and
transport of contaminants at the compliance boundary. Alternately, the demonstration could take the
following approach:
a. Use the maximum allowable contaminant concentrations at the relevant point of compliance;
b. Back-calculate point of leakage (e.g., the landfill liner); and
c. Project the appropriate combination of concentration and leachate volumes that, if not exceeded,
would not cause the maximum allowable contaminant concentration values to be exceeded at the
compliance boundary.
Page18of29
This latter approach should provide the planner with information needed to define the performance
standard of an alternate design for the active life of the unit. Once the municipal solid waste landfill unit is
closed, leachate volume and concentration can be expected to decrease over time assuming the final cover
is intact. Therefore, the combination of leachate volume and leachate concentration controlling the
assessment can be expected to change during the active life of the unit.
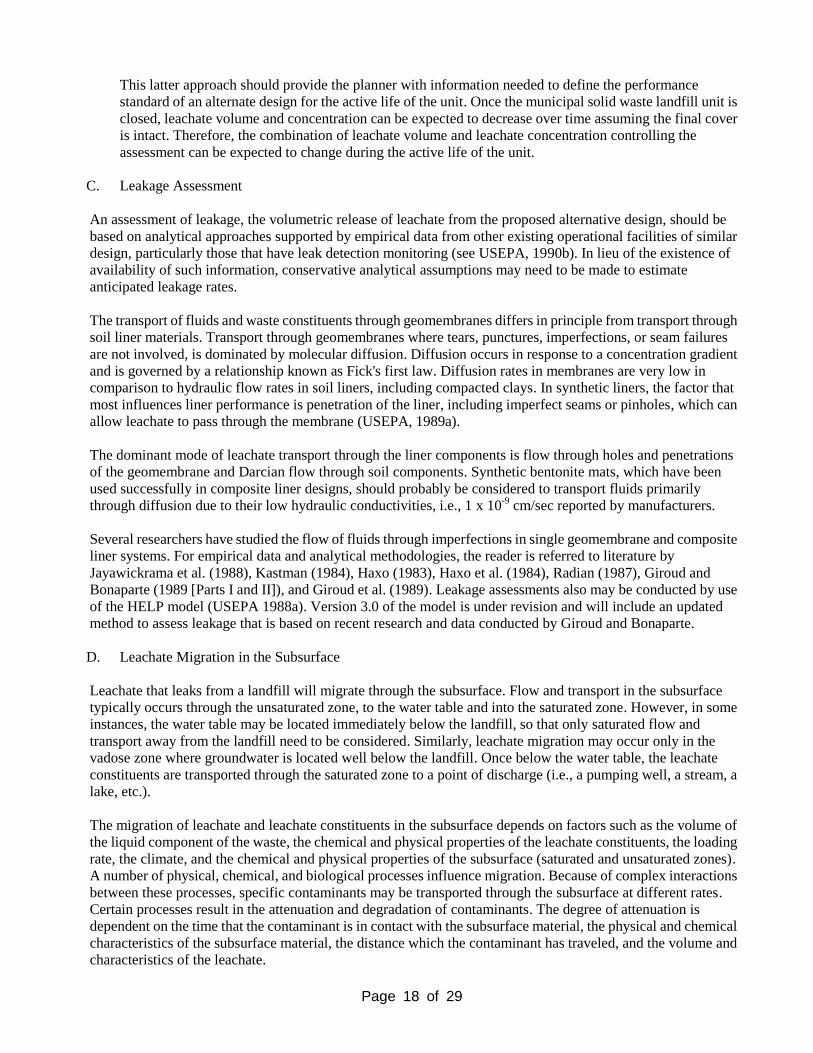
C. Leakage Assessment
An assessment of leakage, the volumetric release of leachate from the proposed alternative design, should be
based on analytical approaches supported by empirical data from other existing operational facilities of similar
design, particularly those that have leak detection monitoring (see USEPA, 1990b). In lieu of the existence of
availability of such information, conservative analytical assumptions may need to be made to estimate
anticipated leakage rates.
The transport of fluids and waste constituents through geomembranes differs in principle from transport through
soil liner materials. Transport through geomembranes where tears, punctures, imperfections, or seam failures
are not involved, is dominated by molecular diffusion. Diffusion occurs in response to a concentration gradient
and is governed by a relationship known as Fick's first law. Diffusion rates in membranes are very low in
comparison to hydraulic flow rates in soil liners, including compacted clays. In synthetic liners, the factor that
most influences liner performance is penetration of the liner, including imperfect seams or pinholes, which can
allow leachate to pass through the membrane (USEPA, 1989a).
The dominant mode of leachate transport through the liner components is flow through holes and penetrations
of the geomembrane and Darcian flow through soil components. Synthetic bentonite mats, which have been
used successfully in composite liner designs, should probably be considered to transport fluids primarily
through diffusion due to their low hydraulic conductivities, i.e., 1 x 10⁻⁹
cm/sec reported by manufacturers.
Several researchers have studied the flow of fluids through imperfections in single geomembrane and composite
liner systems. For empirical data and analytical methodologies, the reader is referred to literature by
Jayawickrama et al. (1988), Kastman (1984), Haxo (1983), Haxo et al. (1984), Radian (1987), Giroud and
Bonaparte (1989 [Parts I and II]), and Giroud et al. (1989). Leakage assessments also may be conducted by use
of the HELP model (USEPA 1988a). Version 3.0 of the model is under revision and will include an updated
method to assess leakage that is based on recent research and data conducted by Giroud and Bonaparte.
D. Leachate Migration in the Subsurface
Leachate that leaks from a landfill will migrate through the subsurface. Flow and transport in the subsurface
typically occurs through the unsaturated zone, to the water table and into the saturated zone. However, in some
instances, the water table may be located immediately below the landfill, so that only saturated flow and
transport away from the landfill need to be considered. Similarly, leachate migration may occur only in the
vadose zone where groundwater is located well below the landfill. Once below the water table, the leachate
constituents are transported through the saturated zone to a point of discharge (i.e., a pumping well, a stream, a
lake, etc.).
The migration of leachate and leachate constituents in the subsurface depends on factors such as the volume of
the liquid component of the waste, the chemical and physical properties of the leachate constituents, the loading
rate, the climate, and the chemical and physical properties of the subsurface (saturated and unsaturated zones).
A number of physical, chemical, and biological processes influence migration. Because of complex interactions
between these processes, specific contaminants may be transported through the subsurface at different rates.
Certain processes result in the attenuation and degradation of contaminants. The degree of attenuation is
dependent on the time that the contaminant is in contact with the subsurface material, the physical and chemical
characteristics of the subsurface material, the distance which the contaminant has traveled, and the volume and
characteristics of the leachate.

Page19of29
E. Leachate Migration Models
After defining the hydrogeologic characteristics of the site, the nature of leakage, and leachate concentrations, it
may be appropriate to develop a mathematical model to describe and simulate the expected fate and transport of
the contaminants to the unit's compliance boundary. Solute transport and groundwater modeling efforts should
be conducted by a qualified groundwater scientist. It is necessary to address many factors when selecting and
applying a model to a site. Travers and Shart-Hansen (1991) provide a thorough review of these issues. The text
provided below is excerpted from their report.
F. Overview of the Modeling Process
A number of factors can influence leachate migration from solid waste management facilities. These include,
but are not limited to, climatic effects, the hydrogeological setting, and the nature of the disposed waste. Each
facility is different, and no one generic model will be appropriate in all situations.
To develop a model for a site, the modeling needs and the objectives of the study should be determined first.
Next, it will be necessary to collect data for characterizing the hydrological, geological, chemical, and
biological conditions present in the system. These data are used to assist in the development of a conceptual
model of the system, including spatial and temporal characteristics and boundary conditions. The conceptual
model and data are then used to select a mathematical model that accurately represents the conceptual model.
The model selected should have been tested and evaluated by qualified investigators, should adequately
simulate the significant processes present in the actual system, and should be consistent with the complexity of
the study area, amount of available data, and objectives of the study.
Three basic decisions are required when selecting a model for soil and groundwater contamination (Boutwell et
al., 1986). First, the necessity for a model should be determined. Not all studies require the use of a
mathematical model. This decision should be made at the beginning of the study since modeling requires a
substantial amount of resources and effort. Next, the level of modeling required for a specific study should be
determined. Boutwell et al. (1986) classify models into Level I (simple/analytical) and Level II
(complex/numerical) models. Finally, the model capabilities which will be necessary for representing a
particular system should be considered. Several models may be equally suitable for a particular study:
conversely, a suitable model may not be available to simulate a given system. In some cases, it may be
necessary to link or couple two or more computer codes to accurately represent the processes at the site. In the
section which follows, specific issues which should be considered when developing a scenario and selecting a
model(s) will be described.
Because all models are a simplified representation of the real system, no model will ever reproduce the exact
characteristics of a site. Errors are introduced because of: (1) assumptions and simplifications; (2) a lack of
data; and (3) a poor understanding of some processes influencing the fate and transport of contaminants.
Therefore, model results should always be interpreted as estimates of groundwater flow and contaminant
transport. Bond and Hwang (1988) recommend that models be used for comparing various cases or scenarios,
since all cases are subject to the same limitations and simplifications.
The quality of model results can depend to a large extent on the experience and judgement of the modeler, and
on the quality of the data used to develop model input. The process of applying the model may delineate data
deficiencies which may require additional data collection. The model results should be calibrated to obtain the
best fit to the observed data. After that, the accuracy of the results which are obtained from the mathematical
model should be validated. Model validation, which is the comparison of model results with numerical data
independently derived from experiments or observations of the environment, is a critical aspect of model
application, and is particularly important for site-specific studies.
Page20of29
Several recent reports present detailed discussions of the issues surrounding model selection, application and
validation. Donigian and Rao (1990) address each of these issues, and present several considerations for
developing a generalized framework for model validation. EPA's Exposure Assessment Group has developed
suggested definitions and guidance on model validation (Versar Inc., 1987). A recent report by the National
Resource Council (1989) discusses the issues related to model application and validation, and provides
recommendations for the proper use of groundwater models. Weaver et al. (1989) discuss considerations for
selection and field validation of mathematical models.
IX. References
Bond, F. and S. Hwang. 1988. Selection Criteria for Mathematical Models Used in Exposure Assessments:
Groundwater Models. EPA/600/8-88/075, U.S. Environmental Protection Agency, Washington, DC.
Boutwell, S.H., Brown, S.M., Roberts, B.R., and Atwood, D.F. 1986. Modeling Remedial Actions at
Uncontrolled Hazardous Waste Sites: EPA/540/2-85/001, U.S. Environmental Protection Agency, Athens,
Georgia.
Bouwer, Herman and Rice, R.C. 1976. A Slug Test for Determining Hydraulic Conductivity of Unconfined
Aquifers With Completely or Partially Penetrating Wells: Water Resources Research, Vol. 12, No. 3.,
pp. 423-428.
Cooper, H.H. Jr., Bredehoeft, J.D., and Papadopulos, I.S. 1967. Response of a Finite Diameter Well to an
Instantaneous Charge of Water: Water Resources Research, Vol. 3, No. 1., pp. 263-269.
Donigian, A.S. and Rao, P.S.C. 1990. Selection, Application, and Validation of Environmental Models. In:
Proceedings of the International Symposium on Water Quality Modeling of Agricultural Non-Point Sources,
Part 2. D.G. DeCoursey (ed.): ARS-81, U.S. Department of Agriculture, Agricultural Research Services,
pp. 577-600.
Giroud, J.P. and Bonaparte, R. 1989. Leakage Through Liners Constructed with Geomembranes -Part II:
Composite Liners; Geotextiles and Geomembranes 8(2), 0266-1144/89, pp. 71-111: Elsevier Science
Publishers Ltd., England, Great Britain.
Giroud, J.P., Khatami A., and Badu-Tweneboah, K. 1989. Technical Note - Evaluation of the Rate of Leakage
Through Composite Liners, Geotextiles and Geomembranes 8, 0266-1144/89, pp. 337-340: Elsevier Science
Publishers Ltd., England, Great Britain.
Haxo, H.E. Jr. 1983. Analysis and Fingerprinting of Unexposed and Exposed Polymeric Membrane Liners,
Proceedings of Ninth Annual Research Symposium: Land Disposal, Incineration, and Treatment of Hazardous
Waste, EPA/600/9-83/018: U.S. EPA, Cincinnati, Ohio.
Haxo, H.E. Jr., Miedema, J.A., and Nelson, H.A. 1984. Permeability of Polymeric Membrane Lining Materials:
Matrecon, Inc., Oakland, California; International Conference on Geomembranes, Denver, Colorado.
Hvorslev, M.J. 1951. Time Lag and Soil Permeability in Groundwater Observations: U.S. Army Corps of
Engineers Waterways Experiment Station, Bulletin No. 36, 50 p.
Jayawickrama, P.W., Brown, K.W., Thomas, J.C., and Lytton, R.L. 1988. Leakage Rates Through Flaws in
Membrane Liners: Journal of Environmental Engineering, Vol. 114, No. 6, December 1988.
Kastman, Kenneth A. 1984. Hazardous Waste Landfill Geomembrane: Design, Installation and Monitoring:
Woodward-Clyde Consultants, Chicago, Illinois; International Conference on Geomembranes, Denver,
Colorado.

Page21of29
National Resource Council. 1990. Groundwater Models: Scientific and Regulatory Applications: National
Academy Press, Washington, DC, 320 p.
Papadopulos, S.S., Bredehoeft, J.D., and Cooper, H.H., Jr. 1973. On the Analysis of "Slug Test" Data: Water
Resources Research, Vol. 9, No. 4., pp. 1087-1089.
Radian Corporation. 1987. Technical Data Summary: Hydraulic Performance of Minimum Technology Double
Liner Systems: Radian Corporation, Austin, Texas 78766 for U.S. EPA, Contract No. 68-01-7310, Task 7-4.
Travers, C.L. and Sharp-Hansen, S. 1991. Leachate Generation and Migration at Subtitle D Facilities: A
Summary and Review of Processes and Mathematical Models: Prepared for U.S. Environmental Protection
Agency, Environmental Research Laboratory, Athens, Georgia.
U.S. Environmental Protection Agency. 1986. RCRA Groundwater Monitoring Technical Enforcement
Guidance Document: Office of Solid Waste and Emergency Response, 208 p.
U.S. Environmental Protection Agency. 1987b. Characterization of MWC Ashes and Leachates from Municipal
Solid Waste Landfills, Monofills and Co-Disposal Sites: Volume VI of VII, Characterization of Leachates from
Municipal Solid Waste Disposal Sites and Co-Disposal Sites: EPA/530/SW-87/028F, Washington, DC NTIS
PB-88-127998.
U.S. Environmental Protection Agency. 1988. Statistical Analysis of Groundwater of RCRA Facilities - Draft
Guidance: Office of Solid Waste, 106 p.
U.S. Environmental Protection Agency. 1988a. Guide to Technical Resources for the Design of Land Disposal
Facilities: EPA/625/6-88/018, U.S. EPA, Risk Reduction Engineering Laboratory, Center for Environmental
Research Information, Cincinnati, Ohio.
U.S. Environmental Protection Agency. 1989a. Seminar Publication - Requirements for Hazardous Waste
Landfill Design, Construction and Closure: EPA/625/4-89/022, U.S. EPA, Center for Environmental Research
Information, Office of Research and Development, Cincinnati, Ohio.
U.S. Environmental Protection Agency. 1990b. Draft - LDCRS Flow Data from Operating Units - Technical
Support for Proposed Liner/Leak Detection System Rule: Geoservices, Inc. Consulting Engineers, Norcross,
Georgia.
Versar, Inc. 1987. Current and Suggested Practices in the Validation of Exposure Assessment Models, Draft
Report: Prepared for U.S. EPA Office of Health and Environmental Assessment, Exposure Assessment Group,
Washington, DC, EPA Contract No. 69-02-4254, Work Assignment No. 55.
Weaver, J., Enfield, C.G., Yates, S., Kreamer, D., and White, D. 1989. Predicting Subsurface Contaminant
Transport and Transformation: Considerations for Model Selection and Field Validation: U.S. Environmental
Protection Agency, Ada, Oklahoma.
Figure 1. Observation Well Installation Diagram
Page22of29
Page23of29
Turbid Groundwater Sample
Analyze the Sample with a Turbidimeter
Turbidity <5
Sample is Acceptable
No Yes
Repurge Well (4.2.4)
Reanalyze with Turbidimeter
Turbidity <5
Redevelop Well Turbidity <5
Analyze Sample Using X-Ray Diffraction No
Yes Yes
Sample is Acceptable Primarily
Silt and Clay?
Yes
Analyze for Organics
No
Primarily Metallic Compounds Retain Well Network
Are Organics Present?
Yes
Sample is Acceptable: Well Network is Usable
Well has been improperly constructed and/or developed:
Do not use samples!
No
Figure 2. Decision Chart for Turbid Groundwater Samples (EPA 1986)
Page24of29
Table 1. Field Boring Log Information
General $ Project name $ Hole name/number $ Date started and finished $ Geologist's name $ Driller's name $ Sheet number $ Hole location; map and elevation $ Rig type (bit size/auger size) $ Petrologic lithologic classification scheme used (Wentworth, Unified Soil Classification System) Information Columns $ Depth $ Sample location/number $ Blow counts and advance rate $ Percent sample recovery $ Narrative description $ Depth to saturation Narrative Description Geologic Observations: $ Soil/rock type $ Color and stain $ Gross petrology $ Friability $ Moisture content $ Degree of weathering $ Presence of carbonate $ Fractures $ Solution cavities
$ Bedding $ Discontinuities; e.g., foliation $ Water-bearing zones $ Formational strike and dip $ Fossils $ Depositional structures $ Organic content $ Odor $ Suspected contaminant
Drilling Observations: $ Loss of circulation $ Advance rates $ Rig Chatter $ Water levels $ Amount of air used and air pressure $ Drilling difficulties $ Changes in drilling method or equipment
$ Readings from detective equipment, if any $ Amount of water yield or loss during drilling
at different depths $ Amounts and types of any liquids used $ Running sands $ Caving/hold stability $ Void
Other Remarks: $ Equipment failures $ Possible contamination $ Deviations from drilling plan $ Weather
Page25of29
Table 2. Suggested Laboratory Methods for Sediment/Rock Samples
Sample Origin
Parameter
Laboratory Method
Used to Determine
Geologic formation,
unconsolidated sediments,
consolidated
sediments, solum
Hydraulic conductivity
Falling head, static
head test
Hydraulic conductivity
Size fraction
Sieving (ASTM),
settling measurements
(ASTM)
Hydraulic conductivity
Sorting
Petrographic analysis
Hydraulic conductivity
Specific yield
Column drawings
Porosity
Specific retention
Centrifuge tests
Porosity
Petrology/Pedology
Petrographic analysis
Soil type, rock type
Mineralogy
X-ray diffraction confining clay mineralogy/chemistry
Geochemistry, potential flow paths
Bedding
Petrographic analysis
Lamination
Petrographic analysis
Atterberg Limits
ASTM
Soil cohesiveness
Contaminated samples
(e.g., soils producing
higher than
background organic
vapor readings)
Appropriate subset of
Appendix VIII
parameters ('261)
SW-846
Identity of contaminants
Page26of29
Table 3. Typical Figures Included in Geotechnical Investigation Reports.
Figure Type or Features Location Plan:
$ Based on USGS 7-1/2 minute series. $ Waste area boundary.
Area Map: (scale 1 inch = 500 feet or
as appropriate)
$ Site in relation to natural and man-made features. $ Include 2,000 feet from perimeter of the facility. $ Waste and property boundary, lakes, ponds, springs, surface water diversions, and wells. $ Public supply watershed areas. $ Aquifers. $ Contour lines (contour intervals should be appropriate for local topography). $ Existing buildings and roads. $ Conservation areas and unique natural areas. $ Archaeological and historic sites. $ Zoning. $ Location of test pits and borings.
Soil/Geology Maps: (scale 1 inch = 100
feet or as appropriate)
$ Plan view soils or surficial geologic map of the disposal site.
Cross-Sections: (scale 1 inch =
100 feet or as appropriate)
$ Detailed cross-sections which shall sufficiently describe the geologic and hydrogeologic units identified by the investigation, prepared at a scale which clearly define the units.
Contour Maps: (scale 1 inch = 100 feet)
$ Contour map of the water table $ Contour map of the potentiometric surface of confined aquifers. $ Structure contour map of significant hydrogeological features (e.g., map of base of coal bed or of an aquitard forming a perched aquifer).
Miscellaneous: (appropriate scale)
$ Geological fence diagrams. $ Isopach maps of aquifers. $ Isopach maps of aquitards. $ Other figures as site specific features dictate.

Page27of29
Table 4. Extended List of Parameters for Assessing Groundwater Quality at ND Landfills - 01/2009
The operator must determine the concentration or value of the following parameters for assessing groundwater
quality. Metal parameters should be reported as total.
a. Parameters measured in the field:
(1) Appearance (including color, foaming, and odor)
(2) pH1
(3) Specific conductance2
(4) Tempe
(5) Water elevation3
b. General geochemical parameters:
1Two measurements: (1) in field; and (2) immediately upon sample=s arrival in laboratory.
2As measured in field.
3As measured to the nearest 0.01 foot in field before pumpoing or bailing.

Page28of29
(1) Ammonia nitrogen
(2) Total hardness
(3) Iron
(4) Calcium
(5) Magnesium
(6) Manganese
(7) Potassium
(8) Total alkalinity
(9) Bicarbonate
(10) Carbonate
(11) Chloride
(12) Fluoride
(13) Nitrate + Nitrite, as N
(14) Total phosphorus
(15) Sulfate
(16) Sodium
(17) Total dissolved solids (TDS)
(18) Total suspended solids (TSS)
(19) Cation/anion balance
c. Heavy metals:
Group A: Group B:
(1) Arsenic (9) Antimony
(2) Barium (10) Beryllium
(3) Cadmium (11) Cobalt
(4) Chromium (12) Copper
(5) Lead (13) Nickel
(6) Mercury (14) Thallium
(7) Selenium (15) Vanadium
(8) Silver (16) Zinc
d. Total organic carbon (TOC)
Chemical oxygen demand (COD)
e. Naturally occurring radionuclides:
(1) Radon
(2) Radium
(3) Uranium
Page29of29
Table 4 (continued) f. Volatile organic compounds, both halogenated and nonhalogenated:
Halogenated:
Acrylonitrile
Allyl chloride
Bromochloromethane
Bromodichloromethane
Bromoform
Bromomethane
Carbon disulfide
Carbon tetrachloride
Chlorobenzene (monochlorobenzene)
Chlorodibromomethane
Chloroethane
Chloroform
Chloromethane
Dibromomethane
1,2-Dibromo-3-chloropropane
1,2-Dibromoethane
Dichloroacetonitrile
1,2-Dichlorobenzene
1,3-Dichlorobenzene
1,4-Dichlorobenzene
Dichlorodifluoromethane
1,1-Dichloroethane
1,2-Dichloroethane
1,1-Dichloroethylene
1,2-Dichloropropane
cis-1,3-Dichloropropene
cis-1,2-Dichloroethylene
trans-1,2-Dichloroethylene
trans-1,3-Dichloropropene
trans-1,4-Dichloro-2-butene
Dichlorofluoromethane
Dichloromethane (methylene chloride)
2,3-Dichloro-1-propene
Pentachloroethane
1,1,1,2-Tetrachloroethane
1,1,2,2-Tetrachloroethane
Tetrachloroethylene
1,1,1-Trichloroethane
1,1,2-Trichloroethane
Trichloroethylene
Trichlorofluoromethane
1,2,3-Trichloropropane
1,1,2-Trichlorotrifluoroethane
Vinyl acetate
Vinyl chloride
Nonhalogenated:
Acetone
Benzene
Cumene
Ethylbenzene
Ethyl ether
Methyl butyl ketone
Methyl ethyl ketone
Methyl iodide
Methyl isobutyl ketone
Pyrene
Styrene
Tetrahydrofuran
Toluene
m-Xylene
o-Xylene
p-Xylene g. Pesticides:
Aldrin
Chlordane
Chloroform
4,4 DDT
Dibenzofuran
Dieldrin
Dimethoate Endosulfan
Endrin Heptachlor Lindane Methyl bromide Methyl Methacrylate Methylene bromide Naphthalene Parathion