guideline for 3 g rf optimization
TRANSCRIPT
GUIDELINES Version Status RF Optimization Guideline for AMX 3G Rollout 1 Consulting and System Integrations August, 27th 2007 Revised by: Danilo Cabral Raj Sandhu, Allan Bispo and Daniel Platero
GUIDELINE for 3G RF OPTIMIZATION America Movil LATAM Projects
Owner: NSN Scope: Guidelines Originator: Raj Sandhu, Allan Bispo and Daniel Platero Revised by: Danilo Cabral Status: Version 1.1 Document ID: Location: NSN BR

GUIDELINES Version Status RF Optimization Guideline for AMX 3G Rollout 1 Consulting and System Integrations August, 27th 2007 Revised by: Danilo Cabral Raj Sandhu, Allan Bispo and Daniel Platero
Table of Content DOCUMENT HISTORY .......................................................................................................................5 1. Introduction ..................................................................................................................................6
1.1 Purpose.................................................................................................................................6 1.2 Overview ...............................................................................................................................6
2. RF Cluster Acceptance ................................................................................................................8 2.1 Preparation Phase.................................................................................................................8
2.1.1 Compilation of planning data ..........................................................................................9 2.1.2 Site Clustering ................................................................................................................9 2.1.3 Drive Routes and Site Selection for Stationary Test, IRAT and RAU ..............................9 2.1.4 Field Measurement Tools .............................................................................................10 2.1.4.1 Field Measurement Tools Setup ...............................................................................11 2.1.5 Post Processing Tools..................................................................................................11 2.1.6 Consistency Check.......................................................................................................12 2.1.7 Alarm Check.................................................................................................................12 2.1.8 PrxNoise Check............................................................................................................12 2.1.9 Cell Availability .............................................................................................................13
2.2 Optimization Phase..............................................................................................................13 2.2.1 Stationary Testing.........................................................................................................13 2.2.2 IRAT Testing ................................................................................................................15 2.2.3 RAU Testing .................................................................................................................15 2.2.4 Mobile Testing ..............................................................................................................15 2.2.5 Cluster KPI References ................................................................................................16 2.2.6 Drive-test UE Distribution – Cluster Level.....................................................................16 2.2.7 Data Processing, Analysis and Report..........................................................................17 2.2.8 Change Request...........................................................................................................17
2.3 Acceptance Phase...............................................................................................................18 3. RF PROJECT Acceptance.........................................................................................................19
3.1 Preparation Phase...............................................................................................................20 3.2 Optimization Phase..............................................................................................................20
3.2.1 IRAT Testing ................................................................................................................21 3.2.2 Mobile Testing ..............................................................................................................21 3.2.3 Cluster KPI References ................................................................................................21 3.2.4 Drive-test UE Distribution – Project Level .....................................................................21 3.2.5 Data Processing, Analysis and Report..........................................................................22 3.2.6 Change Request...........................................................................................................22
3.3 Acceptance Phase...............................................................................................................22 4. Radio Optimization Guide ..........................................................................................................23
4.1 Initial Tuning ........................................................................................................................23 4.1.1 Definitions.....................................................................................................................23 4.1.2 Initial Tuning Procedure – Overview .............................................................................24 4.1.2.1 Preparation Phase ....................................................................................................24 4.1.2.2 Measurement Collection ...........................................................................................25 4.1.2.3 Post-processing and Reporting .................................................................................30 4.1.2.4 RF Analysis...............................................................................................................30 4.1.3 Pilot Pollution................................................................................................................38 4.1.4 Coverage for different services.....................................................................................39 4.1.5 Handover Verifications..................................................................................................39 4.1.5.1 Soft-Handover Area Distribution................................................................................40 4.1.5.2 Neighbour List Optimization ......................................................................................41 4.1.5.3 Missing Neighbour ....................................................................................................43 4.1.5.4 Inter-system Handover Verification (IRAT HO)..........................................................44 4.1.6 Other Issues not related to RF optimization ..................................................................45

GUIDELINES Version Status RF Optimization Guideline for AMX 3G Rollout 1 Consulting and System Integrations August, 27th 2007 Revised by: Danilo Cabral Raj Sandhu, Allan Bispo and Daniel Platero
4.1.6.1 UE Issues .................................................................................................................45 4.1.6.2 UTRAN HW and SW Issues......................................................................................46 4.1.6.3 CORE Issues ............................................................................................................46 4.1.6.4 Drive-test Equipment Issues .....................................................................................46
4.2 Optimization ........................................................................................................................47 4.2.1 Common performance issues that affect any service....................................................47 4.2.2 Video Call Performance Issues.....................................................................................50 4.2.3 PS Call Performance Issues.........................................................................................50 4.2.4 IRAT performance ........................................................................................................52 4.2.5 OSS KPI’s optimization.................................................................................................53 4.2.5.1 Accessibility related problems...................................................................................53 4.2.5.2 Retainability related problems...................................................................................53 4.2.5.3 Availability and Usage related problems (Capacity optimization)...............................54 4.2.5.4 Mobility related problems ..........................................................................................54 4.2.5.5 Integrity related problems..........................................................................................54
5. Database parameters check and optimization............................................................................54 5.1 Parameter groups in RNC Database ...................................................................................55 5.2 Consistency Check..............................................................................................................56 5.3 Parameter optimization........................................................................................................56
5.3.1 RNC Parameters ..........................................................................................................56 5.3.2 COCO Parameters .......................................................................................................56 5.3.3 WANE and WGS Parameters.......................................................................................56 5.3.4 WLCSE and WSMLC Parameters ................................................................................57 5.3.5 FMCI, HOPI and ADJI Parameters ...............................................................................57 5.3.6 WBTS Parameters........................................................................................................57 5.3.7 WCEL...........................................................................................................................57 5.3.8 FMCS ...........................................................................................................................58 5.3.9 FMCG...........................................................................................................................60 5.3.10 HOPS .......................................................................................................................60 5.3.11 HOPG.......................................................................................................................61 5.3.12 ADJS ........................................................................................................................61 5.3.13 ADJG........................................................................................................................62
6. Appendix....................................................................................................................................63 6.1 KPI Targets .........................................................................................................................63 6.2 Drive-test KPI Measurements – Detailing of Layer 3 Messages...........................................64
6.2.1 Drive-test KPI Measurements – CS Voice Service........................................................65 6.2.1.1 CS Voice Service: Voice Call Setup Success Rate ...................................................65 6.2.1.2 CS Voice Service: Voice Call Setup Time .................................................................65 6.2.1.3 CS Voice Service: Voice Call Drop Rate ...................................................................66 6.2.1.4 CS Voice Service: Voice Call BLER DL.....................................................................67 6.2.1.5 CS Voice Service: Voice IRAT Handover – from 3G to 2G........................................68 6.2.1.6 CS Voice Service: Voice IRAT Handover – from 2G to 3G........................................69 6.2.2 Drive-test KPI Measurements – CS UDI Video Service ................................................70 6.2.2.1 CS UDI Video Service: Video Call Setup Success Rate............................................70 6.2.2.2 CS UDI Video Service: CS Video Call Setup Elapsed Time < 20 seconds ................70 6.2.2.3 CS UDI Video Service: CS Video Call Drop Rate......................................................71 6.2.2.4 CS UDI Video Service: CS Video Call BLER DL .......................................................72 6.2.3 Drive-test KPI Measurements – PS Realese 99 Data Service ......................................73 6.2.3.1 PS Realese 99 Data Service: PS RAB Establishment Success Rate ........................73 6.2.3.2 PS Realese 99 Data Service: PS Round Trip Time...................................................74 6.2.3.3 PS Realese 99 Data Service: PS RAB Drop Rate.....................................................75 6.2.3.4 PS Realese 99 Data Service: PS DL Throughput......................................................76 6.2.3.5 PS Realese 99 Data Service: PS UL Throughput......................................................77 6.2.4 Drive-test KPI Measurements – PS HSDPA Data Service ............................................78

GUIDELINES Version Status RF Optimization Guideline for AMX 3G Rollout 1 Consulting and System Integrations August, 27th 2007 Revised by: Danilo Cabral Raj Sandhu, Allan Bispo and Daniel Platero
6.2.4.1 PS HSDPA Data Service: PS Round Trip Time.........................................................78 6.2.4.2 PS HSDPA Data Service: PS HSDPA Throughput....................................................79 6.2.5 Drive-test KPI Measurements – TCP Setting for Data Services....................................80 6.2.6 Drive-test KPI Measurements – Multi-RAB Service ......................................................81 6.2.6.1 Multi-RAB Services: AMR Voice CSSR during PS Calls ...........................................81 6.2.6.2 Multi-RAB Services: PS Data CSSR during AMR Voice Calls ...................................83 6.2.7 Drive-test KPI Measurements – Others Services..........................................................85 6.2.7.1 Others Services: SMS Success Rate ........................................................................85 6.2.7.2 Others Services: SMS Delivery Time < 40 seconds ..................................................86 6.2.7.3 Others Services: WAP Failure Rate ..........................................................................87 6.2.7.4 Others Services: WAP Session Establishment Elapsed Time < 13 seconds .............88 6.2.7.5 Others Services: MMS Success Rate .......................................................................89 6.2.7.6 Others Services: MMS Delivery Time < 40 seconds..................................................90 6.2.8 Drive-test KPI Measurements – RAU Testing ...............................................................91
7. References ................................................................................................................................92
GUIDELINES Version Status RF Optimization Guideline for AMX 3G Rollout 1 Consulting and System Integrations August, 27th 2007 Revised by: Danilo Cabral Raj Sandhu, Allan Bispo and Daniel Platero DOCUMENT HISTORY
DATE ISSUE EDITED BY SUMMARY OF CHANGES
Aug 23th 07 V1.0 Allan Bispo and Daniel Platero
Initial version.
Aug 27th 07 V1.1 Allan Bispo and Danilo Cabral
Revision 1

GUIDELINES Version Status RF Optimization Guideline for AMX 3G Rollout 1 Consulting and System Integrations August, 27th 2007 Revised by: Danilo Cabral Raj Sandhu, Allan Bispo and Daniel Platero 1. INTRODUCTION
1.1 Purpose
This document describes the processes for Radio Access Network (RAN) optimization of the AMX LATAM WCDMA based third generation radio access network. The focus of this document is on the Radio Frequency (RF) optimization and acceptance criteria.
1.2 Overview
The figure below shows the overview of acceptance requirement for the AMX LATAM project.
Figure 1 : AMX Acceptance Overview – NSN proposed version
Site implementation acceptance is carried out by the implementation team after the site has been commissioned and put on air. Once site implementation acceptance has been granted and the cluster is deemed fit for optimization, RF cluster acceptance will begin. Here stationary and drive testing will be carried out. Once the KPI’s are achieved for all clusters, the RF project acceptance could begin. At this phase all tests carried out at the cluster acceptance will be done again at project level. The main diference here is, besides the amout of points of interstes of the stationary tests, the coverage test. Coverage verification at project level is carried out under 50% load. The other tests do not need this additional loading. After that Provisional Acceptance (PAC) can be granted. For the Final Acceptance (FAC) many key performance indicators need to be above the customer target during a certain stability period.
The figure below shows the relationship between all acceptance stages.
Site Implementation
Acceptance
RF Cluster Acceptance
RF Project Acceptance
PAC FAC

GUIDELINES Version Status RF Optimization Guideline for AMX 3G Rollout 1 Consulting and System Integrations August, 27th 2007 Revised by: Danilo Cabral Raj Sandhu, Allan Bispo and Daniel Platero
Figure 2 : Overview of the Acceptance Stages – NSN proposed version

GUIDELINES Version Status RF Optimization Guideline for AMX 3G Rollout 1 Consulting and System Integrations August, 27th 2007 Revised by: Danilo Cabral Raj Sandhu, Allan Bispo and Daniel Platero 2. RF CLUSTER ACCEPTANCE
The figure below gives an overview of the RF Cluster Acceptance process.
Figure 3 : RF Cluster Acceptance Process Overview
* Only for clusters which contain 3G/2G borders sites The RF cluster acceptance process can be grouped into 3 main sections which are the preparation phase, optimization phase and the acceptance phase. 2.1 Preparation Phase
This phase is triggered once the rollout phase is approaching its end. The objective of this phase is to prepare all the pre-requisites for the optimization phase. This can be broken down as below:
V Compilation of planning data
V Site Clustering
Perform Mobile Testing
Data Processing, Analysis & Report
KPIs Achieved
Submit Report to AMX
Network Optimization & Change Request
RF Cluster Acceptance
Project Acceptance Phase
Y
N
Network Planning Rollout Phase
Perform Stationary Testing
Preparation Stage for Cluster Acceptance Testing
Perform IRAT Testing*
Preparation Phase
Optimization Phase
Acceptance Phase
Perform RAU Testing

GUIDELINES Version Status RF Optimization Guideline for AMX 3G Rollout 1 Consulting and System Integrations August, 27th 2007 Revised by: Danilo Cabral Raj Sandhu, Allan Bispo and Daniel Platero
V Drive Routes & Site Selection for IRAT and Stationary Test
V Field Measurement Tools
V Post-processing Tools
V Parameter Consistency Check
V Alarm Monitoring
V PrxNoise Check
V Cell Availability
2.1.1 Compilation of planning data
It is essential that all the planning data be collected and saved in an organized manner in order to be useful during the optimization phase. The required information from planning stage is:
V Technical Site Survey Report (TSSR) including panoramic pictures
V As-built Site Drawing
V Complete Site Database including Site_ID, Cell_ID, RNC_ID, BTS_ID, LAC, RAC, URA, SAC, Antenna Type, Antenna Height, Azimuth, Tilt (Mechanical and Electrical), Scrambling Code, ATM layer parameters, Iu parameters, IP settings etc
V Coverage plots for Loaded and Unloaded cases
V Service Area plots for the services that require optimization
2.1.2 Site Clustering
The clusters shall be defined by Nokia Siemens Networks and documented. Following criteria shall be used in defining the cluster:
1. Each cluster shall comprise a contiguous network area of approximately 10 to 15 sites.
2. Cluster shall not be defined across RNC boundary.
2.1.3 Drive Routes and Site Selection for Stationary Test, IRAT and RAU
The drive routes for cluster acceptance will be mutually agreed by America Movil LatAm and NOKIA SIEMENS NETWORKS. Drive Routes must cover all main avenues and large streets within in the cluster. Main avenues should be driven in both directions as possible. The drive routes shall be selected such that the drive route can be completed, regarding all tests scenarios mutually agreed with the customer, in one (1) day. IRAT and stationary tests will demand one (1) additional day.
Target sites for Stationary testing, IRAT and RAU will be mutually agreed by America Movil LatAm and NOKIA SIEMENS NETWORKS. The IRAT sites will also be known as 3G/2G Border Sites.
Ensure the following has been carried out
V The stationary test locations have been mutually agreed by America Movil LatAm and NOKIA SIEMENS NETWORKS. This should not be more then 20% of the total sites in the cluster and should be carried out in all sectors of the selected sites.
GUIDELINES Version Status RF Optimization Guideline for AMX 3G Rollout 1 Consulting and System Integrations August, 27th 2007 Revised by: Danilo Cabral Raj Sandhu, Allan Bispo and Daniel Platero
V The IRAT and RAU drive routes have been mutually agreed by America Movil LatAm and NOKIA SIEMENS NETWORKS.
V The mobile drive routes for cluster acceptance have been mutually agreed by America Movil LatAm and NOKIA SIEMENS NETWORKS.
2.1.4 Field Measurement Tools
The cluster acceptance test shall consist of drive tests using Field Measurement Tools (FMT) to verify that the call set-up and soft handovers are working properly, to detect bad quality and interference areas, to detect unexpected lack of coverage and to test the Radio Access Bearers (RAB) that are used to support the required services as specified in the contract. The chosen FMT should be at least be able to measure the required data in order to calculate the KPIs for cluster acceptance. It is extremely important to have the right FMT to carry out the RF cluster acceptance.
The FMT comprises of the following:
V Notebook equipped with the FMT software
The notebook is used to record all the measurement from the FMT. Ensure the Notebook has specification in accordance with the FMT requirement which depends on the FMT tool used. Also the Notebook should NOT be a NOKIA SIEMENS NETWORKS customized notebook as these normally have encrypted hard drives and lots of security software which can affect the results of testing. This notebook should be used dedicated for the drive or stationary testing only.
V GPS for latitude/longitude information
V UEs
These UEs should be supported by the FMT tool.
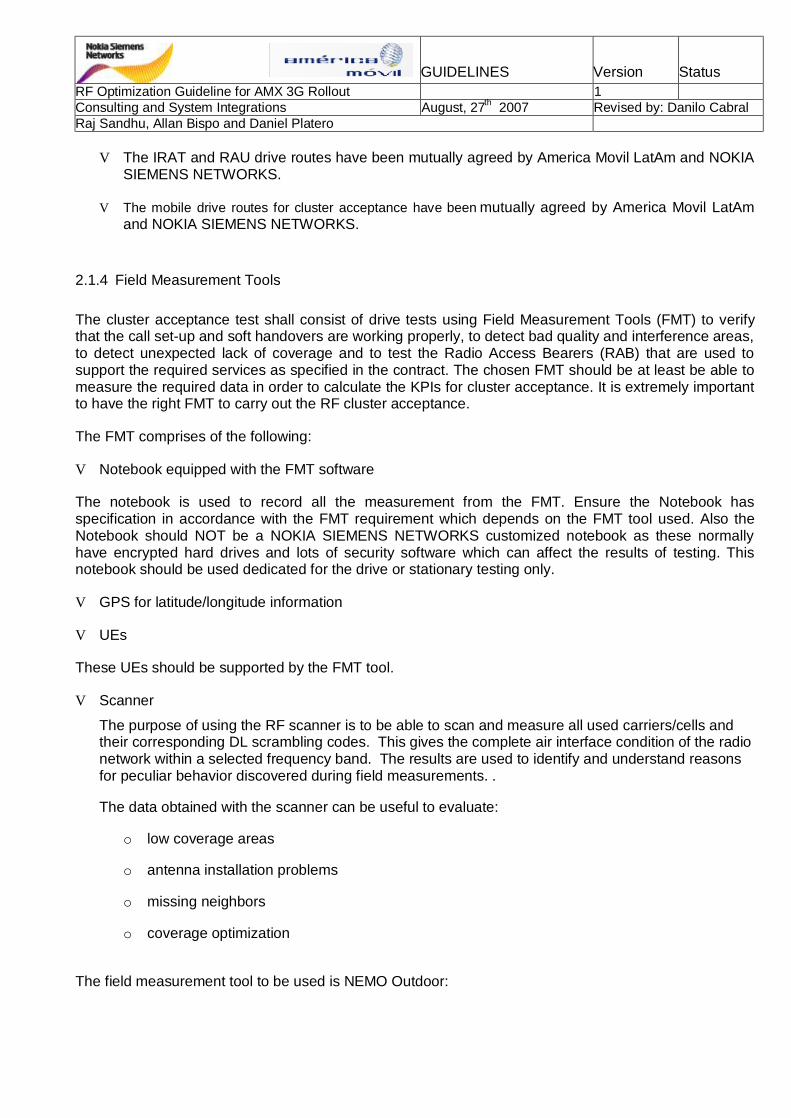
V Scanner
The purpose of using the RF scanner is to be able to scan and measure all used carriers/cells and their corresponding DL scrambling codes. This gives the complete air interface condition of the radio network within a selected frequency band. The results are used to identify and understand reasons for peculiar behavior discovered during field measurements. .
The data obtained with the scanner can be useful to evaluate:
o low coverage areas
o antenna installation problems
o missing neighbors
o coverage optimization
The field measurement tool to be used is NEMO Outdoor:

GUIDELINES Version Status RF Optimization Guideline for AMX 3G Rollout 1 Consulting and System Integrations August, 27th 2007 Revised by: Danilo Cabral Raj Sandhu, Allan Bispo and Daniel Platero
Figure 4: Field Measurement Tool Analysis
2.1.4.1 Field Measurement Tools Setup
For the coverage verifications in Cluster Acceptance phase, the terminal antenna must be situated external to the vehicle, and the UE must be in idle mode. Coverage test at Project Level will be carried out with UE in connected mode in order to obtain an UE Tx power map.
For all field QoS drives and verifications in Cluster and Project Acceptance phases, an external antenna must not be used.
The UEs are part of the FMT. Below is showed a distribution of UE required to fullfil the most important 3G tests:
ü PS Rel 99 UE: AMR Voice Calls, PS Rel99 Data Calls, PS Rel Multi-RAB, RAU, IRAT HO and coverage verification (in idle mode as well);
ü HSDPA UE (Cat 12): HSDPA Multi-RAB calls and Data Calls; CS video;
ü HSDPA Datacard (Cat 6): PS HSDPA Data Calls
In the Figures 6 and 9 these UEs are arranged in order to fulfill the AMX acceptance tests.
2.1.5 Post Processing Tools
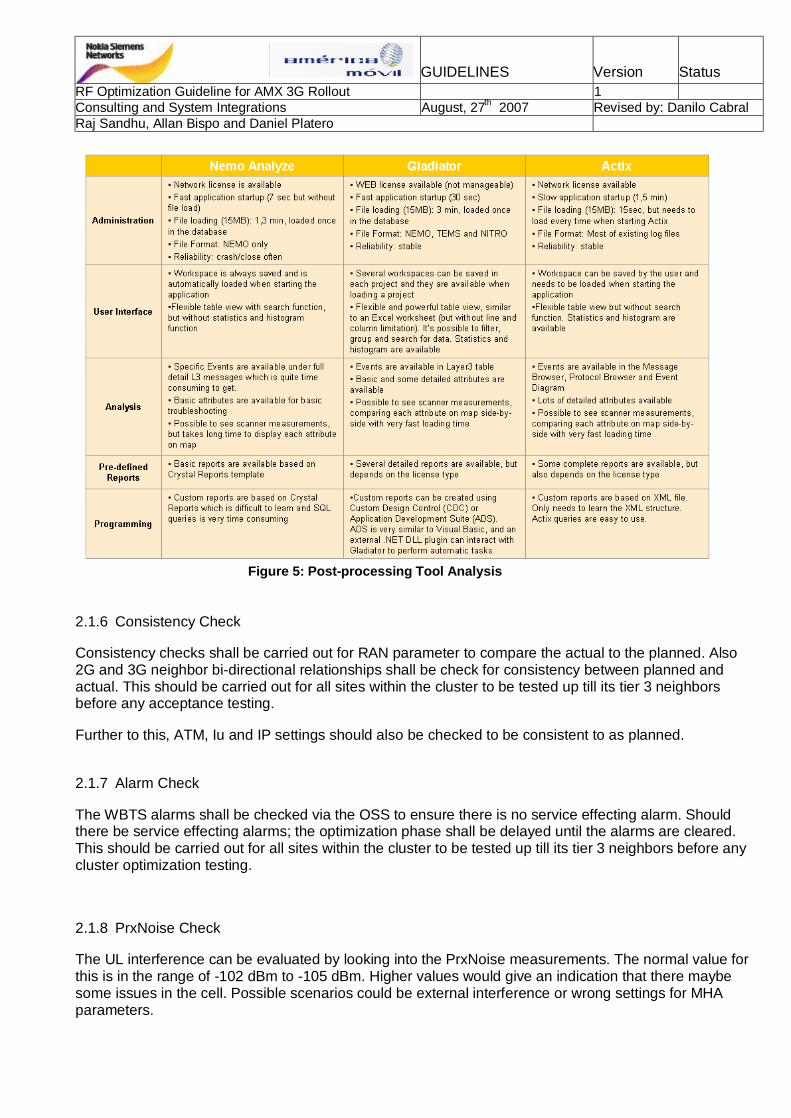
The post processing tools are used for the purpose of analyzing performance related issues during the optimization phase. It is important that the analysis tool works well with the FMT in order to be able to capture all the events reported in the FMT. The outcome of the analysis tools will be used to generate the RF Cluster Acceptance Report. For the AMX project there are 3 options of post-processing tools being analyzed, as could be seen below. Gladiator is the first option until now because fulfills all technical requirements, allows implementing automatic analysis and reporting, and finally, is being offered by a competitive price. The other two options, Nemo Analyzer and Actix, also fulfill the technical requirements but do not allow any automatization. Nemo Analyzer is quite chipper than Gladiator while Actix is much more expensive.
GUIDELINES Version Status RF Optimization Guideline for AMX 3G Rollout 1 Consulting and System Integrations August, 27th 2007 Revised by: Danilo Cabral Raj Sandhu, Allan Bispo and Daniel Platero
Figure 5: Post-processing Tool Analysis
2.1.6 Consistency Check
Consistency checks shall be carried out for RAN parameter to compare the actual to the planned. Also 2G and 3G neighbor bi-directional relationships shall be check for consistency between planned and actual. This should be carried out for all sites within the cluster to be tested up till its tier 3 neighbors before any acceptance testing.
Further to this, ATM, Iu and IP settings should also be checked to be consistent to as planned.
2.1.7 Alarm Check
The WBTS alarms shall be checked via the OSS to ensure there is no service effecting alarm. Should there be service effecting alarms; the optimization phase shall be delayed until the alarms are cleared. This should be carried out for all sites within the cluster to be tested up till its tier 3 neighbors before any cluster optimization testing.
2.1.8 PrxNoise Check
The UL interference can be evaluated by looking into the PrxNoise measurements. The normal value for this is in the range of -102 dBm to -105 dBm. Higher values would give an indication that there maybe some issues in the cell. Possible scenarios could be external interference or wrong settings for MHA parameters.

GUIDELINES Version Status RF Optimization Guideline for AMX 3G Rollout 1 Consulting and System Integrations August, 27th 2007 Revised by: Danilo Cabral Raj Sandhu, Allan Bispo and Daniel Platero 2.1.9 Cell Availability
The cell availability of the sites gives an indication of the health of the WBTS. Prior to starting the cluster acceptance drive testing, at least 3 days data of cell availability should be looked at to ensure that the site has been in working condition. If there are periods of unavailability which has not been planned, then there may be issues on the cell. This has to be investigated prior to starting the cluster optimization.
2.2 Optimization Phase
Once the mains sites defined in the target cluster have achieved all integration and site acceptance requirement, Nokia Siemens Networks will initiate the RF cluster optimization, being a requisite to that the sites in a cluster must not have any impeditive restriction.
The technical aspects related to the optimization activities for cluster optimizaion are available at the chapter “Radio Optimizaiton Guide”.
The optimization phase can be divided to 4 main activities: the Stationary Testing, IRAT Testing, RAU Testing and Mobile Testing. These are explained in more detailed below.
2.2.1 Stationary Testing
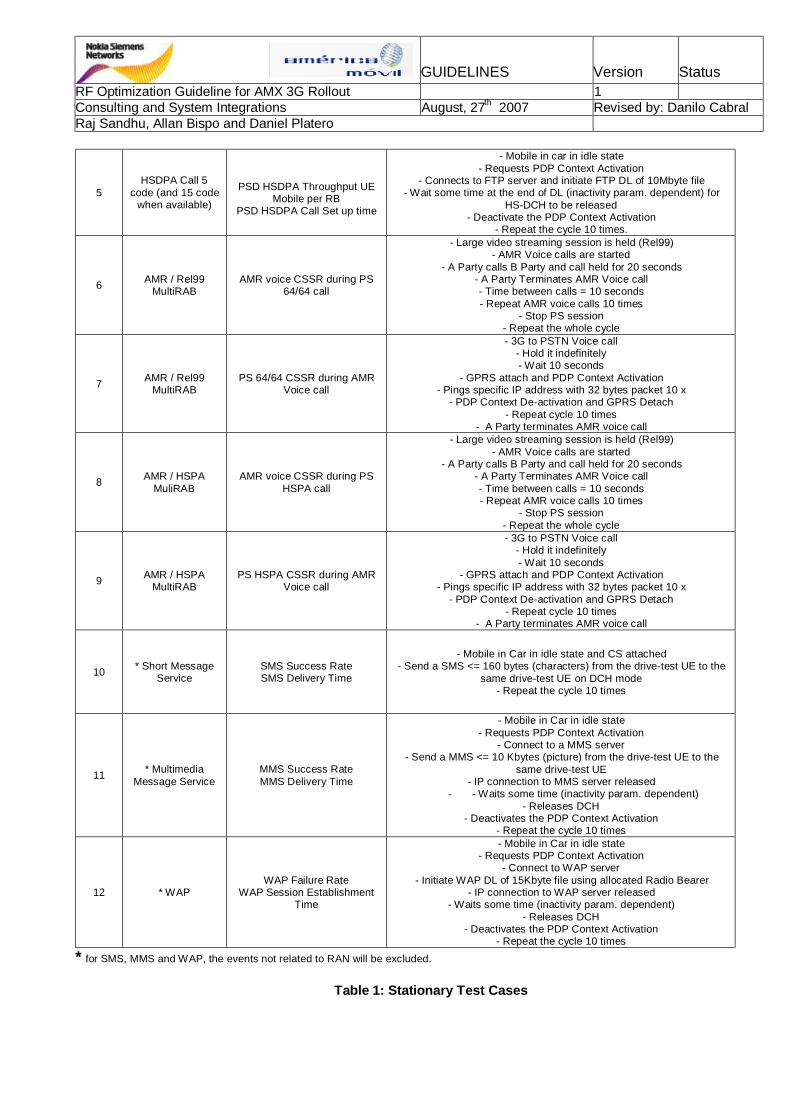
Stationary Testing will be carried out on the predefined Sites which have been mutually agreed between Nokia Siemens Networks and America Movil LatAm. This should not be more then 20% of the total sites in the cluster and should be carried out in all sectors of the selected sites. The figure below shows the Stationary Test Cases to be carried out.
Stationary testing Test ID Test case KPI collected Description
1 PS Rel99 RTT PS Data Latency (release 99)
- Mobile is in idle mode - Requests PDP Context Activation - Large ping to force DCH channel
- Pings specific IP address with 32 bytes packet - Set 100 pings - Repeat cycle
2 PS Rel99 DL Throughput
PSD Throughput UE Mobile per RB
PSD Call Set up time
- Mobile in car in idle state - Requests PDP Context Activation
- Connects to FTP server and initiate FTP DL of 1Mbyte file - Wait some time at the end of DL (inactivity param. dependent) for
DCH to be released - Deactivate the PDP Context Activation
- Repeat the cycle 10 times.
3 PS Rel99 UL Throughput
PSD Throughput UE Mobile
per RB PSD Call Set up time
- Mobile in car in idle state - Requests PDP Context Activation
- Connects to FTP server and initiate FTP UL of 200 kbyte file - At the end, waits 15 sec. for DCH to be released
- Deactivate the PDP Context Activation - Repeat the cycle 10 times.
4 PS HSDPA RTT PS Data Latency (release 5)
- Mobile is in idle mode - Requests PDP Context Activation
- Large ping to force HS-DCH channel - Pings specific IP address with 32 bytes packet
- Set 100 pings - Repeat cycle
GUIDELINES Version Status RF Optimization Guideline for AMX 3G Rollout 1 Consulting and System Integrations August, 27th 2007 Revised by: Danilo Cabral Raj Sandhu, Allan Bispo and Daniel Platero
5 HSDPA Call 5
code (and 15 code when available)
PSD HSDPA Throughput UE
Mobile per RB PSD HSDPA Call Set up time
- Mobile in car in idle state - Requests PDP Context Activation
- Connects to FTP server and initiate FTP DL of 10Mbyte file - Wait some time at the end of DL (inactivity param. dependent) for
HS-DCH to be released - Deactivate the PDP Context Activation
- Repeat the cycle 10 times.
6 AMR / Rel99 MultiRAB
AMR voice CSSR during PS 64/64 call
- Large video streaming session is held (Rel99) - AMR Voice calls are started
- A Party calls B Party and call held for 20 seconds - A Party Terminates AMR Voice call - Time between calls = 10 seconds - Repeat AMR voice calls 10 times
- Stop PS session - Repeat the whole cycle
7 AMR / Rel99 MultiRAB
PS 64/64 CSSR during AMR Voice call
- 3G to PSTN Voice call - Hold it indefinitely - Wait 10 seconds
- GPRS attach and PDP Context Activation - Pings specific IP address with 32 bytes packet 10 x
- PDP Context De-activation and GPRS Detach - Repeat cycle 10 times
- A Party terminates AMR voice call
8 AMR / HSPA MuliRAB
AMR voice CSSR during PS HSPA call
- Large video streaming session is held (Rel99) - AMR Voice calls are started
- A Party calls B Party and call held for 20 seconds - A Party Terminates AMR Voice call - Time between calls = 10 seconds - Repeat AMR voice calls 10 times
- Stop PS session - Repeat the whole cycle
9 AMR / HSPA MultiRAB
PS HSPA CSSR during AMR Voice call
- 3G to PSTN Voice call - Hold it indefinitely - Wait 10 seconds
- GPRS attach and PDP Context Activation - Pings specific IP address with 32 bytes packet 10 x
- PDP Context De-activation and GPRS Detach - Repeat cycle 10 times
- A Party terminates AMR voice call
10 * Short Message Service
SMS Success Rate SMS Delivery Time
- Mobile in Car in idle state and CS attached - Send a SMS <= 160 bytes (characters) from the drive-test UE to the
same drive-test UE on DCH mode - Repeat the cycle 10 times
11 * Multimedia Message Service
MMS Success Rate MMS Delivery Time
- Mobile in Car in idle state - Requests PDP Context Activation
- Connect to a MMS server - Send a MMS <= 10 Kbytes (picture) from the drive-test UE to the
same drive-test UE - IP connection to MMS server released
- - Waits some time (inactivity param. dependent) - Releases DCH
- Deactivates the PDP Context Activation - Repeat the cycle 10 times
12 * WAP WAP Failure Rate
WAP Session Establishment Time
- Mobile in Car in idle state - Requests PDP Context Activation
- Connect to WAP server - Initiate WAP DL of 15Kbyte file using allocated Radio Bearer
- IP connection to WAP server released - Waits some time (inactivity param. dependent)
- Releases DCH - Deactivates the PDP Context Activation
- Repeat the cycle 10 times
* for SMS, MMS and WAP, the events not related to RAN will be excluded.
Table 1: Stationary Test Cases

GUIDELINES Version Status RF Optimization Guideline for AMX 3G Rollout 1 Consulting and System Integrations August, 27th 2007 Revised by: Danilo Cabral Raj Sandhu, Allan Bispo and Daniel Platero 2.2.2 IRAT Testing
IRAT Testing will be carried out on a predefined route and predefined sites in the clusters that contain 3G/2G border sites. Voice calls will be make in order to evaluate the IRAT Handover Failures. It should be carried out as functionality test at a defined 3G/2G border, repeting the process 10 times. The figure below shows the IRAT Test Cases to be carried out.
IRAT testing
Test ID Test case KPI collected Description
1 Handover from UTRAN for CS voice service
Voice ISHO Success Rate (3G to 2G)
- AMR continuous call (dual mode) established on the 3G side - DT car moves toward the 2G network
- IRAT handover - Ends call in the 2G side
- Repeat cycle.
2 Handover to
UTRAN for CS voice service
Voice ISHO Success Rate (2G to 3G)
- Voice continuous call (dual mode) established on the 2G side - DT car moves toward the 3G network
- IRAT handover - Ends call in the 3G side
- Repeat cycle.
Table 2: IRAT Test Cases 2.2.3 RAU Testing
Routing Area Update (RAU) Testing will be carried out on a border of routing areas inside of the same SGSN footprint, for that clusters that contain different RAs, or are located on a border of RAs. RAU Testing will be carried out for Packet Calls evaluating the intra SGSN routing area update time. It is recommended repeating the cycle 10 times in both RA directions. The figure below shows the RAU Test Cases to be carried out.
RAU testing
Test ID Test case KPI collected Description
1 PS Continuous Call (Dual Mode)
Intra SGSN Routing Area Update Time
- Mobile in Car in idle state, no PDP context established - UE enters in a new Routing Area - Requests PDP Context Activation - UE requests Routing Area update
- UE grants a new Routing Area - Repeat the cycle 10 times in both RA directions
Table 3: RAU Test Cases
2.2.4 Mobile Testing
Mobile testing will be carried out on the route defined to the acceptance which has mutually been agreed between Nokia Siemens Networks and America Movil LatAm. The table below shows the Mobile test cases to be carried out.
Mobile testing Test ID Test case KPI collected description

GUIDELINES Version Status RF Optimization Guideline for AMX 3G Rollout 1 Consulting and System Integrations August, 27th 2007 Revised by: Danilo Cabral Raj Sandhu, Allan Bispo and Daniel Platero
1 Idle Mode Coverage Verification - drive on the test route with UE in idle mode using an external antenna kit.
2 AMR Short Call (3G to PSTN)
Voice CSSR (call setup success rate)
Voice CST (call setup time) Voice Drop Rate
Voice BLER
- 3G to PSTN Voice call - Originating side located in the vehicle, terminating side (an answer
machine) located in the customer MSC of the test area - A Party calls B Party and call held for 60 seconds
- A Party Terminates - Time between calls = 10 seconds
3 Video Short Call (3G to 3G)
CS Video CSSR (call setup success rate)
CS Video Call Setup Elapsed Time
Voice Drop Rate Voice BLER
- 3G to 3G Video call - Originating side located in the vehicle
- Terminating side located in office - A Party calls B Party
- Call held for 60 seconds after app. level has been set up - A Party Terminates
- Time between calls = 10 seconds
4 DL PS Rel99
DL WCDMA User Throughput PS RAB Establishment
Success PS RAB Drop
- Mobile in car in idle state - Requests PDP Context Activation
- Connects to a customer FTP server and initiate FTP DL of 1Mbyte file - Wait some time at the end of DL (inactivity param. dependent) for DCH to
be released - Deactivate the PDP Context Activation
- Repeat the cycle 10 times.
5 UL PS Rel99
UL WCDMA User Throughput PS RAB Establishment
Success PS RAB Drop
- Mobile in car in idle state - Requests PDP Context Activation
- Connects to a customer FTP server and initiate FTP UL of 200 kbyte file - At the end, waits 15 sec. for DCH to be released
- Deactivate the PDP Context Activation - Repeat the cycle 10 times.
6
DL HSDPA Call 5 code (and 15
code when available)
DL HSDPA User Throughput
- Mobile in car in idle state - Requests PDP Context Activation
- Connects to a customer FTP server and initiate FTP DL of 10Mbyte file - Wait some time at the end of DL (inactivity param. dependent) for HS-
DCH to be released - Deactivate the PDP Context Activation
- Repeat the cycle 10 times. Table 4: Mobile Test Cases
2.2.5 Cluster KPI References
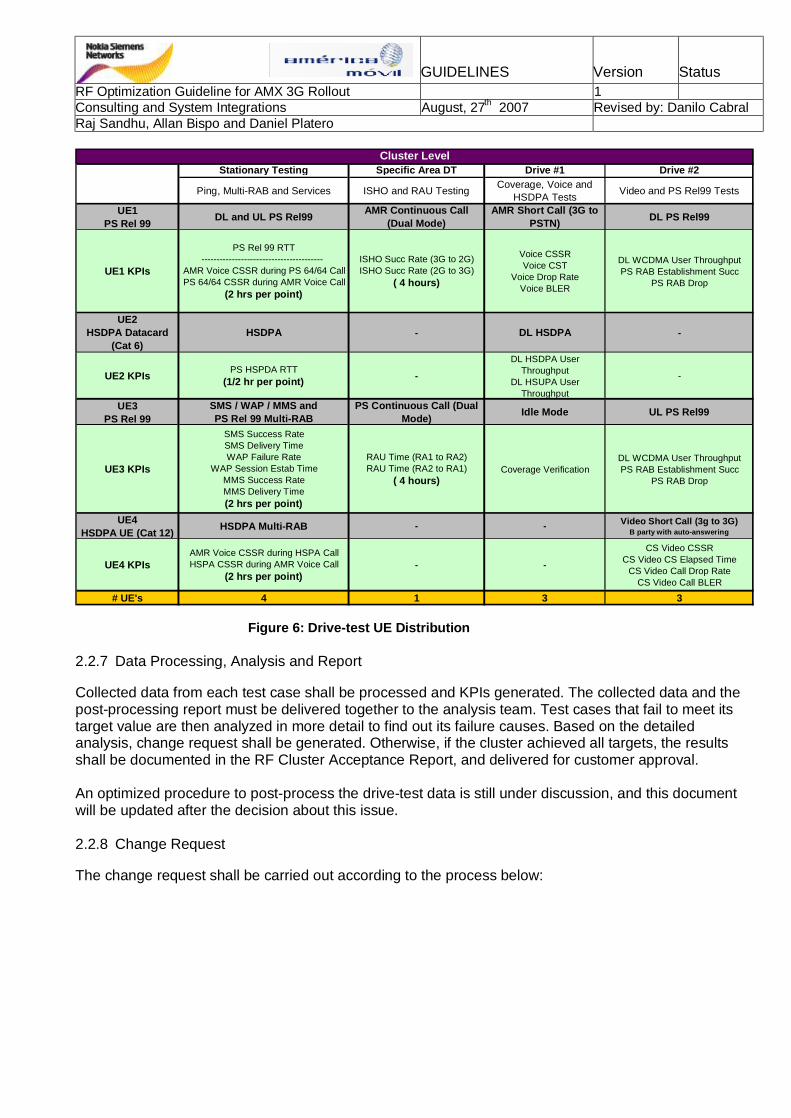
See appendix in the end of the document. 2.2.6 Drive-test UE Distribution – Cluster Level
In order to reduce the number of UEs to cover all measurements requested by the AMX the distribution below is showed. Additionally, this array avoids too much load on the sites during the tests that can jeopardize the quality of the system.
GUIDELINES Version Status RF Optimization Guideline for AMX 3G Rollout 1 Consulting and System Integrations August, 27th 2007 Revised by: Danilo Cabral Raj Sandhu, Allan Bispo and Daniel Platero
Stationary Testing Specific Area DT Drive #1 Drive #2
Ping, Multi-RAB and Services ISHO and RAU Testing Coverage, Voice and HSDPA Tests Video and PS Rel99 Tests
UE1PS Rel 99 DL and UL PS Rel99 AMR Continuous Call
(Dual Mode)AMR Short Call (3G to
PSTN) DL PS Rel99
UE1 KPIs
PS Rel 99 RTT----------------------------------------
AMR Voice CSSR during PS 64/64 CallPS 64/64 CSSR during AMR Voice Call
(2 hrs per point)
ISHO Succ Rate (3G to 2G)ISHO Succ Rate (2G to 3G)
( 4 hours)
Voice CSSRVoice CST
Voice Drop RateVoice BLER
DL WCDMA User ThroughputPS RAB Establishment Succ
PS RAB Drop
UE2HSDPA Datacard
(Cat 6)HSDPA - DL HSDPA -
UE2 KPIs PS HSPDA RTT(1/2 hr per point) -
DL HSDPA User Throughput
DL HSUPA User Throughput
-
UE3PS Rel 99
SMS / WAP / MMS andPS Rel 99 Multi-RAB
PS Continuous Call (Dual Mode) Idle Mode UL PS Rel99
UE3 KPIs
SMS Success RateSMS Delivery TimeWAP Failure Rate
WAP Session Estab TimeMMS Success RateMMS Delivery Time(2 hrs per point)
RAU Time (RA1 to RA2)RAU Time (RA2 to RA1)
( 4 hours)Coverage Verification
DL WCDMA User ThroughputPS RAB Establishment Succ
PS RAB Drop
UE4HSDPA UE (Cat 12) HSDPA Multi-RAB - - Video Short Call (3g to 3G)
B party with auto-answering
UE4 KPIsAMR Voice CSSR during HSPA CallHSPA CSSR during AMR Voice Call
(2 hrs per point)- -
CS Video CSSRCS Video CS Elapsed Time
CS Video Call Drop RateCS Video Call BLER
# UE's 4 1 3 3
Cluster Level
Figure 6: Drive-test UE Distribution 2.2.7 Data Processing, Analysis and Report
Collected data from each test case shall be processed and KPIs generated. The collected data and the post-processing report must be delivered together to the analysis team. Test cases that fail to meet its target value are then analyzed in more detail to find out its failure causes. Based on the detailed analysis, change request shall be generated. Otherwise, if the cluster achieved all targets, the results shall be documented in the RF Cluster Acceptance Report, and delivered for customer approval. An optimized procedure to post-process the drive-test data is still under discussion, and this document will be updated after the decision about this issue. 2.2.8 Change Request
The change request shall be carried out according to the process below:

GUIDELINES Version Status RF Optimization Guideline for AMX 3G Rollout 1 Consulting and System Integrations August, 27th 2007 Revised by: Danilo Cabral Raj Sandhu, Allan Bispo and Daniel Platero
Figure 7: Change Request Process
Template for Change Request has not been created at this time. Master Database to track the change request has not been created at this time. 2.3 Acceptance Phase
The acceptance phase shall commence once the entire cluster KPIs have been reached. The acceptance phase shall involve the process of generating the RF Cluster Acceptance Report , submitting this report for internal review and then getting the reported approved by America Movil LatAm. After that the project level tests can be started. These tests will be detailed in the next chapter. The RF Cluster Acceptance Report template is presented below:
KPIs Passed
Detail Analysis
Submit Change Request for Internal Review
Perform Changes
Document changes in master change request database
Initiate redrive to evaluate changes
Generate KPIs
Generate Final Acceptance Report
Y
N
Template on the intranet site

GUIDELINES Version Status RF Optimization Guideline for AMX 3G Rollout 1 Consulting and System Integrations August, 27th 2007 Revised by: Danilo Cabral Raj Sandhu, Allan Bispo and Daniel Platero 3. RF PROJECT ACCEPTANCE
The Project Acceptance Report is the RF document that will allow America Movil LatAm to grant the Provisional Acceptance (PAC) to Nokia Siemens Networks. In small cities where a site division in clusters is not necessary, it will be possible to go direct to the Project Acceptance Tests, taking in consideration all requisites described in the Cluster Acceptance Tests. This means, in case of project tests only, all activities in the preparation phase and optimization phase must be done considering the differences related to target KPI values and procedure tests between cluster and project level testing. The figure below gives an overview of the RF Project Acceptance process.
Figure 8: RF Project Acceptance * only in the 3G/2G networks border
The RF project acceptance process also can be grouped into 3 main sections, which are: the preparation phase, optimization phase and the acceptance phase.
Perform Mobile Testing
Data Processing, Analysis & Report
KPIs Achieved
Submit Report to AMX
Network Optimization & Change Request
RF Project Acceptance
3G Network Launch
Y
N
Perform Stationary Testing
Preparation Stage for Project Acceptance Testing
Perform IRAT Testing*
Preparation Phase
Optimization Phase
Acceptance Phase
Perform RAU Testing

GUIDELINES Version Status RF Optimization Guideline for AMX 3G Rollout 1 Consulting and System Integrations August, 27th 2007 Revised by: Danilo Cabral Raj Sandhu, Allan Bispo and Daniel Platero 3.1 Preparation Phase
This phase is triggered once the RF cluster tests present satisfactory KPI values. The objective here is to prepare all the pre-requisites for the optimization phase, if necessary, in the project test level. This phase can be broken down as below:
V Compilation of planning data
Many planning data were already collected during the RF cluster activities. TSSR and As-built remain the same, however all site database items, coverage plots and service plots must be updated considering the entire network.
V Drive Routes & Site Selection for Stationary test, IRAT and RAU tests
The drive routes for project acceptance will be mutually agreed by America Movil LatAm and NOKIA SIEMENS NETWORKS. Drive Routes must cover all main avenues and 70% of large streets inside of the project area. Main avenues should be driven in both directions as possible.
Target sites for Stationary testing, IRAT and RAU tests will be mutually agreed by America Movil LatAm and NOKIA SIEMENS NETWORKS. See details in the cluster level description.
V Field Measurement Tools
Same as in cluster level description. It’s necessary to consider for coverage tests a bunch of UEs to generate 50% load in the system. The amount of required UE for 50% uplink Load should be validated with field mearurements and Prxnoise from online monotoring.
V Post-processing Tools
V Parameter Consistency Check
V Alarm Monitoring
V PrxNoise check
V Cell Availability
3.2 Optimization Phase
Once at least 90% of the sites in the project area have achieved all integration and site acceptance requirements, and the RF cluster acceptance campaign has been finished successfully, Nokia Siemens Networks can initiate the RF project verification, being a requisite to that no impeditive restriction in any of the 90% sites of the project area.
In case of problems to achieve the KPI for project acceptance, the appropriate optimization actions must be taken in order to guarantee a good performance, according to the optimization process detailed in the previous chapter.
The technical aspects related to the optimization activities for project optimizaion are available at the chapter “Radio Optimizaiton Guide”.
Stationary testing and RAU testing can be removing from this phase since already carried out on cluster level phase. Otherwise, if the rollout goes direct to the project level, these two tests must be considered.
See cluster level description.
GUIDELINES Version Status RF Optimization Guideline for AMX 3G Rollout 1 Consulting and System Integrations August, 27th 2007 Revised by: Danilo Cabral Raj Sandhu, Allan Bispo and Daniel Platero IRAT testing and Mobile testing have to be carried out following the strategy of the detailed in the cluster level activities. Some differences are explained below.
3.2.1 IRAT Testing
The test is the same as in cluster level; however the 3G/2G border sites and the IRAT drive-test route will be mutually agreed by Nokia Siemens Networks and America Movil LatAm in a project level basis.
3.2.2 Mobile Testing
The measurements are equal to that ones in the cluster level, therfore the strategy remains the same as showed in the previous chapter.
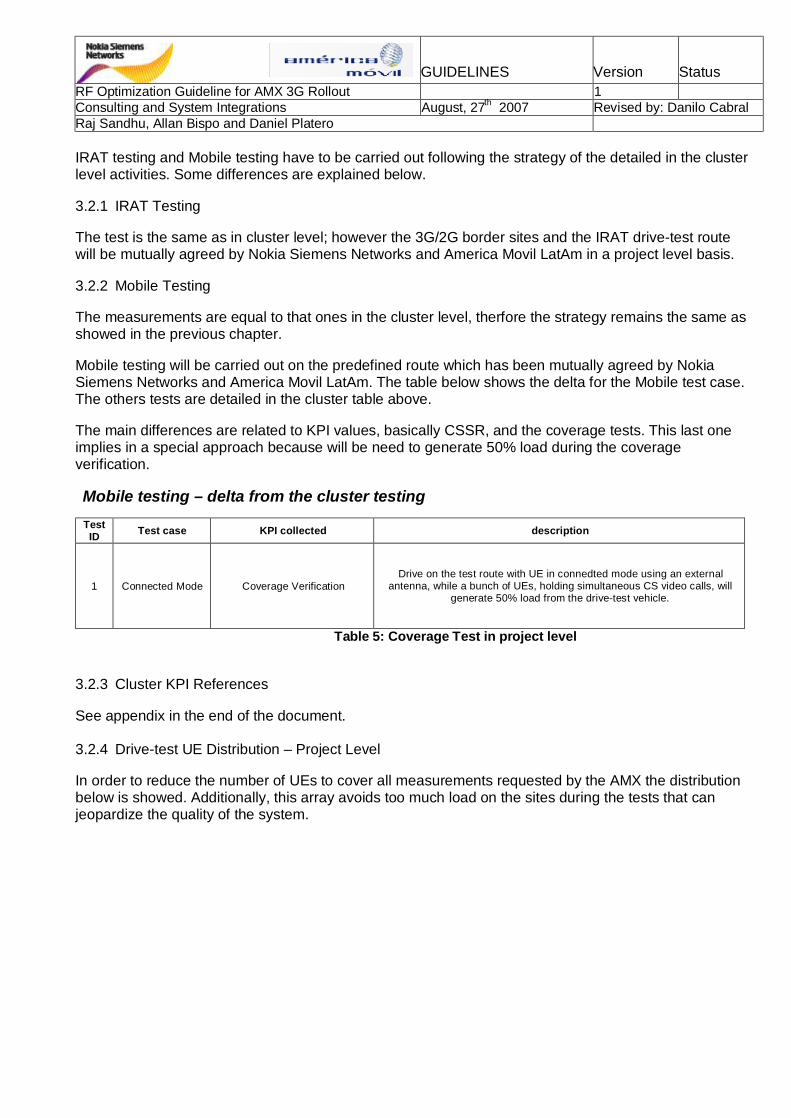
Mobile testing will be carried out on the predefined route which has been mutually agreed by Nokia Siemens Networks and America Movil LatAm. The table below shows the delta for the Mobile test case. The others tests are detailed in the cluster table above.
The main differences are related to KPI values, basically CSSR, and the coverage tests. This last one implies in a special approach because will be need to generate 50% load during the coverage verification.
Mobile testing – delta from the cluster testing Test ID Test case KPI collected description
1 Connected Mode Coverage Verification Drive on the test route with UE in connedted mode using an external
antenna, while a bunch of UEs, holding simultaneous CS video calls, will generate 50% load from the drive-test vehicle.
Table 5: Coverage Test in project level
3.2.3 Cluster KPI References
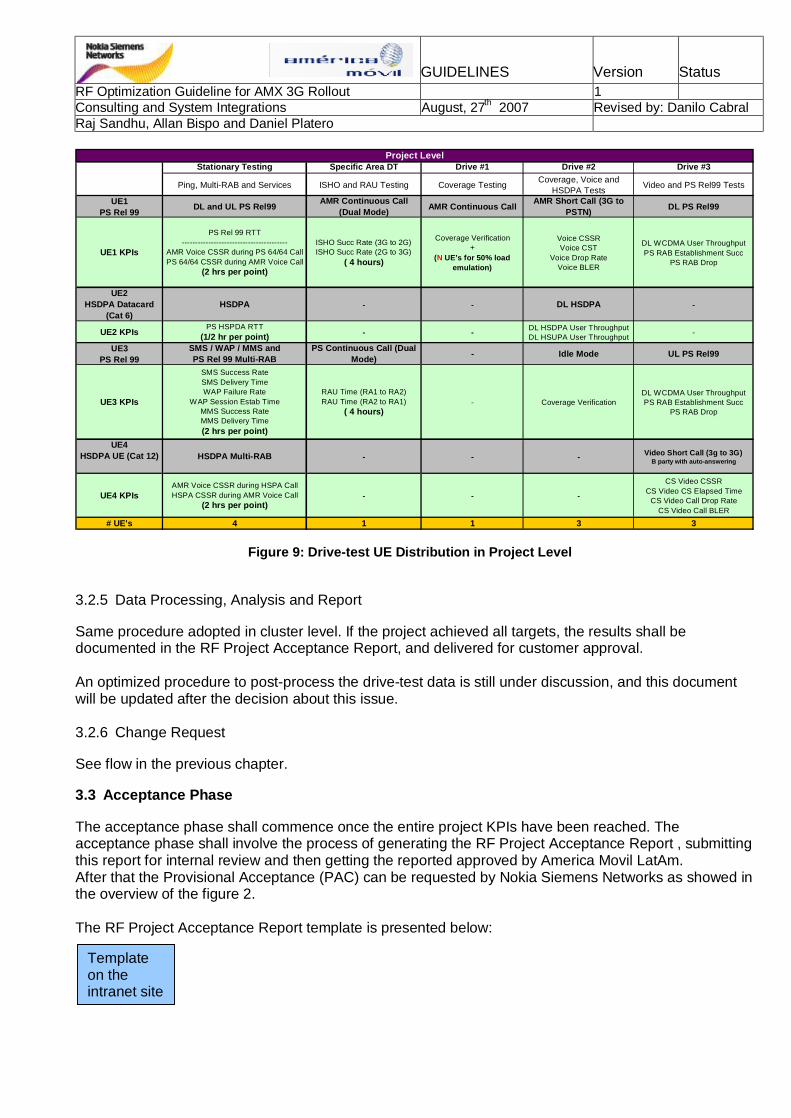
See appendix in the end of the document. 3.2.4 Drive-test UE Distribution – Project Level
In order to reduce the number of UEs to cover all measurements requested by the AMX the distribution below is showed. Additionally, this array avoids too much load on the sites during the tests that can jeopardize the quality of the system.
GUIDELINES Version Status RF Optimization Guideline for AMX 3G Rollout 1 Consulting and System Integrations August, 27th 2007 Revised by: Danilo Cabral Raj Sandhu, Allan Bispo and Daniel Platero
Stationary Testing Specific Area DT Drive #1 Drive #2 Drive #3
Ping, Multi-RAB and Services ISHO and RAU Testing Coverage Testing Coverage, Voice and HSDPA Tests Video and PS Rel99 Tests
UE1PS Rel 99 DL and UL PS Rel99 AMR Continuous Call
(Dual Mode) AMR Continuous Call AMR Short Call (3G to PSTN) DL PS Rel99
UE1 KPIs
PS Rel 99 RTT----------------------------------------
AMR Voice CSSR during PS 64/64 CallPS 64/64 CSSR during AMR Voice Call
(2 hrs per point)
ISHO Succ Rate (3G to 2G)ISHO Succ Rate (2G to 3G)
( 4 hours)
Coverage Verification+
(N UE’s for 50% load emulation)
Voice CSSRVoice CST
Voice Drop RateVoice BLER
DL WCDMA User ThroughputPS RAB Establishment Succ
PS RAB Drop
UE2HSDPA Datacard
(Cat 6)HSDPA - - DL HSDPA -
UE2 KPIs PS HSPDA RTT(1/2 hr per point) - - DL HSDPA User Throughput
DL HSUPA User Throughput -
UE3PS Rel 99
SMS / WAP / MMS andPS Rel 99 Multi-RAB
PS Continuous Call (Dual Mode) - Idle Mode UL PS Rel99
UE3 KPIs
SMS Success RateSMS Delivery TimeWAP Failure Rate
WAP Session Estab TimeMMS Success RateMMS Delivery Time(2 hrs per point)
RAU Time (RA1 to RA2)RAU Time (RA2 to RA1)
( 4 hours)- Coverage Verification
DL WCDMA User ThroughputPS RAB Establishment Succ
PS RAB Drop
UE4HSDPA UE (Cat 12) HSDPA Multi-RAB - - - Video Short Call (3g to 3G)
B party with auto-answering
UE4 KPIsAMR Voice CSSR during HSPA CallHSPA CSSR during AMR Voice Call
(2 hrs per point)- - -
CS Video CSSRCS Video CS Elapsed Time
CS Video Call Drop RateCS Video Call BLER
# UE's 4 1 1 3 3
Project Level
Figure 9: Drive-test UE Distribution in Project Level
3.2.5 Data Processing, Analysis and Report
Same procedure adopted in cluster level. If the project achieved all targets, the results shall be documented in the RF Project Acceptance Report, and delivered for customer approval. An optimized procedure to post-process the drive-test data is still under discussion, and this document will be updated after the decision about this issue. 3.2.6 Change Request
See flow in the previous chapter.
3.3 Acceptance Phase
The acceptance phase shall commence once the entire project KPIs have been reached. The acceptance phase shall involve the process of generating the RF Project Acceptance Report , submitting this report for internal review and then getting the reported approved by America Movil LatAm. After that the Provisional Acceptance (PAC) can be requested by Nokia Siemens Networks as showed in the overview of the figure 2. The RF Project Acceptance Report template is presented below:
Template on the intranet site

GUIDELINES Version Status RF Optimization Guideline for AMX 3G Rollout 1 Consulting and System Integrations August, 27th 2007 Revised by: Danilo Cabral Raj Sandhu, Allan Bispo and Daniel Platero
4. RADIO OPTIMIZATION GUIDE
This chapter gives an overview of the common pre-launch optimization activities carried out. Here you can find information about Network Initial Tuning, OSS KPI optimization and Parameters optimization.
It’s also recommended to check the last release of the following documents: WCDMA RAN Key Performance Indicators, Optimizing WCDMA RAN and Interdependencies of Telecom Features (all from system documentation) and RANPAR, RANOP1 and RANOP2 courses. This document is based on RAS05.1.
This chapter shows the main performance issues, how to identify then, what could be done to fix it and the related parameters to optimize.
The Performance Issues are organized in two main topics:
- Initial Tuning Issues
- Optimization Issues
4.1 Initial Tuning
4.1.1 Definitions
Initial Tuning is the activity of optimization related to Pre-Launch of a network. It includes finding and solving any discrepancies between the design and the real network. It’s mainly related to site installation problems, database checks, coverage problems and handover / neighbour list problems.
In W-CDMA there is no clear distinction between initial tuning and optimization. Arbitrarily it can be said, that semi-static parameters i.e. parameters that will not vary a lot when traffic is loading the network can be assessed and adjusted at the initial stages of the network just before launch (initial tuning). However virtually all parameters associated with the performance of a W-CDMA network are affected by system load thus should be optimized when the network is up and running and a sufficient number of “live” network measurements is available.
Initial Tuning could be performed in four steps:
1. Collection of information about the network planning (RF threshold and targets) and definition of test areas & routes of drive tests
2. Performing drive tests in existing network, collecting data of network performance by use of RF UMTS Field Measurement Tools
3. Evaluation of measurement results, Analysis and reporting
4. Final tuning and optimization of W-CDMA network by evaluation of test measurement results (coverage optimization, parameter adjusting)

GUIDELINES Version Status RF Optimization Guideline for AMX 3G Rollout 1 Consulting and System Integrations August, 27th 2007 Revised by: Danilo Cabral Raj Sandhu, Allan Bispo and Daniel Platero 4.1.2 Initial Tuning Procedure – Overview
Initial tuning is a process from the very beginning of radio network planning to an iterative process of adjusting specific cells within network in active mode, in order to receive an optimal tuned W-CDMA network.
Figure 10: Initial Tuning Procedure
4.1.2.1 Preparation Phase
This is the starting phase. It is very important to define the following items for each desired service, and for all possible types of environment (dense urban, urban, suburban, rural and road):
ü Link budget for dedicated channels (incl. a certain cell load)
ü Link budget for CPICH (Common Pilot Channel)
ü Minimum required RSCP level (Received Signal Code Power)
ü Minimum required Ec/Io including a margin for network load (Received Energy per Chip divided by the Power Density in the band)
ü Maximum allowable pathloss for up- and downlink
These values are taken as reference during the field activities and post-processing. Thus it is essential to jointly define the mentioned figures and share all the relevant data (between Radio Network Planning and Initial Tuning Team).
Preparation Phase
• Link Budget definitions
• Required RF targets
• Services and Areas definitions
• Complete Site / RNC Database
• Routes Definition
• Technical Site Survey Report (TSSR)
• As-built Site Drawing
• Coverage plots
• Service Area plots
Post-Processing & Reporting
• Route post-processing
• Maps & graph preparation
• Generation of reports and statistics
Analysis and Definition of Changes
• Coverage Analysis
• Pilot Pollution
• Missing Neighbor
• Neighbor List Optimization
• External Interference Verification
• HW problems Identification
• RF Parameters Tuning
• Changes Request Elaboration
TUNED NETWORK
NETWORK
IMPLEMENTATION
Measurement Collection
• Drive-test

GUIDELINES Version Status RF Optimization Guideline for AMX 3G Rollout 1 Consulting and System Integrations August, 27th 2007 Revised by: Danilo Cabral Raj Sandhu, Allan Bispo and Daniel Platero
Additionally the service/bearer that will be used during the initial tuning and the optimization activities must be ones that more represent the customer network reality. These services and bearer types generally are the same that were the reference for the network planning.
The initial tuning area is customer dependent also; however it shall be the network planning deployed area.
It is imperative that a complete Site/RNC database has to be available before the beginning of the initial tuning analysis. It must include at least: Site_ID, Cell_ID, RNC_ID, BTS_ID, LAC, RAC, URA, SAC, Antenna Type, Antenna Height, Azimuth, Tilt (Mechanical and Electrical), Scrambling Code, ATM layer parameters, Iu/Iur/Iub parameters, IP settings etc.
Drive-test routes must cover all main avenues and large streets within in the cluster. Main avenues should be driven in both directions as possible.
Technical Site Survey Report (TSSR) including panoramic pictures and as-built Site Drawing are also important information sources to support the initial tuning and optimization activities.
From an updated network planning tool (NetAct for example) coverage plots for loaded and unloaded cases, and service area plots for the services that require optimization have to be obtained.
4.1.2.2 Measurement Collection
The Initial Tuning is based on drive tests analysis to find installation problems and to check real site coverage versus planned coverage.
For the Drive Test setup it’s common to have, at least, 1 scanner WCDMA, 1 scanner GSM, 1 UE for idle mode, 1 UE for active mode. Depending on what kind of test is needed this configuration has to be changed. The WCDMA scanner is used to find actual coverage for each site, pilot pollution, optimizing the neighbour list and to find out the coverage gaps and Inter-RAT HOs locations. The GSM scanner is used to find the GSM Neighbour list and coverage holes. The UE in idle mode is used to test cell selection and reselection. The UE in active mode is used to test system access, various services and mobility.
The following topics detail some test configuration that can be used during the initial tuning:
a) Basic set – GPS, WCDMA scanner and release 99 UE
Drive-test Software
Scanner
GPS
Drive-test Software
Scanner
GPS
UE R99UE R99

GUIDELINES Version Status RF Optimization Guideline for AMX 3G Rollout 1 Consulting and System Integrations August, 27th 2007 Revised by: Danilo Cabral Raj Sandhu, Allan Bispo and Daniel Platero
Figure 11: Basic Set for IT Drive-test
At this configuration, one of the most common, it is possible to carry out the main tests for an initial tuning, for example:
ü Coverage verification based on WCDMA scanner – RSSI, CPICH RSCP, CPICH EcIo, DL pathloss, pilot pollution, missing neighbour, cross-cabling, external interference and so on;
ü Coverage verification based on R99 UE (service dependent) - CPICH RSCP, CPICH EcNo, DL BLER, SIR, UE Tx power, SHO investigation, pilot pollution, missing neighbour, IRAT handover and so on.
ü QoE measurements based on R99 UE (service dependent) –
o CS AMR voice and UDI video
§ Accessibility – call setup success rate (CSSR), call setup time (CST)
§ Retainability – call drop rate (CDR)
§ Integrity – DL BLER, UE Tx power, SIR, IRAT handover
o PS data R99
§ Accessibility – PS data Establishment Rate
§ Retainability – PS session drop rate
§ Integrity – PS data throughput, RTT, DL BLER, UE Tx Power, SIR, IRAT handover
A limitation from this set is that in order to have data from CS and PS services to optimize the network it will be necessary to create a long drive-test script in the collect’s tool that allows an alternation between CS and PS. Nevertheless this variation leads to a lack of CS or PS data in some part of the drive-test route which could imply in error decision on the RF tuning.
b) Recommended set – GPS, Dual scanner (WCDMA/GSM) and release 99 UEs (UE1 in idle mode, UE2 for CS and UE3 for PS)

GUIDELINES Version Status RF Optimization Guideline for AMX 3G Rollout 1 Consulting and System Integrations August, 27th 2007 Revised by: Danilo Cabral Raj Sandhu, Allan Bispo and Daniel Platero
Figure 12: Recommended Set for IT Drive-test
This recommended configuration brings the following delta:
ü CHANGE of the single WCDMA scanner for a DUAL WCDMA/GSM scanner - besides to do all verifications described above, dual scanner will allow to optimize the IRAT handovers, once it will be possible to analyze the GSM neighbours based on the scanners data, not based on the UE neighbour list only;
ü ADDITION of an external antenna kit for the UE1 - scanner does not do cell reselection and selection; keeping UE1 in idle mode, and using an external antenna with its gain adjusted in such way that there is no attenuation to the antenna system of the scanner, it will be possible to tune the coverage from the end user point of view, and the cell selection and reselection procedures as well;
ü ADDITION of two release 99 UEs – with one UE dedicated to CS and other to PS, all QoE measurements could be entirely carried out not generating service gaps along the drive-test route due to alternation on scripts; it is just necessary to choose which CS service will be measured.
The recommended set supports all measurements in the basic set but improves the initial tuning with:
ü Coverage verification based on DUAL scanner – GSM measurements for IRAT handover optimization and external interference in GSM band
ü Coverage verification based on R99 UE (service dependent) – coverage in idle for cell selection and reselection procedure
ü QoE measurements based on R99 UE (service dependent) –
o CS AMR voice or UDI video – full data along the whole drive-test route
§ Integrity – improved IRAT handover optimization capability
o PS data R99 – full data along the whole drive-test route
§ Integrity – improved IRAT handover optimization capability
Drive-test Software
Dual Scanner
GPS
Drive-test Software
Dual Scanner
GPS
UE2 R99UE2 R99 UE3 R99UE3 R99UE1 R99
external antenna kit
UE1 R99
external antenna kit

GUIDELINES Version Status RF Optimization Guideline for AMX 3G Rollout 1 Consulting and System Integrations August, 27th 2007 Revised by: Danilo Cabral Raj Sandhu, Allan Bispo and Daniel Platero
c) Advanced set – GPS, Dual scanner (WCDMA/GSM), release 99 UEs (UE1 in idle mode, UE2 for CS and UE3 for PS) and a HSDPA PC Card
Figure 13: Advanced Set for IT Drive-test
This advanced configuration brings the following delta:
ü ADDITION of a HSDPA PC Card – with this special UE all PS data QoE measuring described above will be obtained also for release 5 (HSDPA); furthermore with a data card the difference in the link budget to an UE could be evaluated.
ü CHANGE of an UE R99 – it is optional the use of a Rel5 UE (HSDPA) besides the PC card.
The advanced set supports all measurements in the recommended set but improves the initial tuning with:
ü QoE measurements based on HSDPA UE (service dependent) –
o PS data HSDPA – full data along the whole drive-test route
§ Accessibility – PS data Establishment Rate
§ Retainability – PS session drop rate
§ Integrity – PS data throughput, RTT, DL BLER, UE Tx Power, SIR, improved IRAT handover optimization capability
o Multi-RAB with HSDPA services (R5 UE only)
In the first moment of the optimization activities, especially the initial tuning is not essential to carry out HSDPA as the principal one for PS data. At the firsts rounds of optimization, when the gross of the change request are done in order to improve the general coverage and probability service, PS data Rel99 are enough. After that a HSDPA drive-test should be carried out.
In the advanced set proposed above the multi-RAB tests regarding HSDPA will be only possible to carry out if the UE3 is release 5 capable. Otherwise just release 99 will be
Drive-test Software
Dual Scanner
GPS
UE2 R99UE2 R99 UE3 R99 / R5UE3 R99 / R5UE1 R99
external antenna kit
UE1 R99
external antenna kit
HSDPA PC Card

GUIDELINES Version Status RF Optimization Guideline for AMX 3G Rollout 1 Consulting and System Integrations August, 27th 2007 Revised by: Danilo Cabral Raj Sandhu, Allan Bispo and Daniel Platero
verified. An additional issue is that HSDPA UEs, in an area where HSDPA is available, will just make PS data calls in HSDPA. Release 99 will be carried out by this kind of UE if the system in the area does support HSDPA only.
A Drive Test Script has to be created in order to do all needed tests in a standardized way, speeding up the drive test analysis process. It means that the number of mobiles, sequence of UE’s (e.g. idle, active CS, active PS, etc.), sequence of scanners and sequence of tests should be equal to all drive tests teams, then all analysis teams can merge the data and analyze it the same way.
An example of minimum procedures for drive-test scripts is in the table below:
Call SetupCall setup is a procedure in which the UE calls the B party. In most of the DT equipments if the call setup takes more than 20 seconds a call setup failure is reported.
Call HoldingIt is recommended 60 to 90 seconds at maximum for each call.
Wait An idle period of 10 seconds is satisfactory between calls.
GPRS attach
- UE performs cell search and RRC Connection Establishment in the same way as for an AMR call- the UE registers with the PS-CN through the GPRS Attach procedure
PDP Context Activate
- UE sends message with the requested QoS fields- Typically the UE requests all of the QoS parameters ‘Subscribed’ which means that the network uses HLR QoS profile to set-up the QoS
FTP (10x)Transfering of files 10 times from a server at the network. In case of DL test the proceudre is to get files from the server, otherwise the procedure is to put files into the server.
PDP Context Deactivate Release of the PDP ContextGPRS Dettach Release of the GPRS Mobility resources
Procedures for Drive-test Script
AMR Voice or CS Video
PS Data Rel99 or HSDPA
Table 6: DT Script Procedure
For the CS services the only differentiation is the B party. AMR voice calls have to be made to an answering machine located at the CS core, avoiding the PSTN delay at the UTRAN measurements. CS UDI video calls must be made to another UE phone not located in the same drive-test vehicle.
The procedure for PS data calls is valid for WCDMA and HSDPA. It is important to highlight that HSDPA UEs in areas where the HSDPA service is available will just make PS calls in HSDPA mode. In this case is possible to carry out Rel99 PS call with WCDMA UEs only.
The exact way that the procedures above are written depends on each drive-test tool.
An example of file size for download and upload is presented below:
DOWNLOAD 1M byteUPLOAD 200K bytes
PS Data HSDPA DOWNLOAD 4M bytes
PS Data Rel99
Table 7: Suggestion for Data File Size

GUIDELINES Version Status RF Optimization Guideline for AMX 3G Rollout 1 Consulting and System Integrations August, 27th 2007 Revised by: Danilo Cabral Raj Sandhu, Allan Bispo and Daniel Platero 4.1.2.3 Post-processing and Reporting
Once the drive-test data are available the post-processing and reporting activities have to be initiated. The result from these activities could be a technical detailed report that will be delivered to the RF analysis team.
The report has to be fulfilled with the drive-test route, technical maps, histograms, graphs and statistics.
For each performed drive test with W-CDMA scanner, the following technical information shall be created for a detailed analysis:
• RSCP for each decoded scrambling code (best code, 2nd best code, 3rd best code, etc…)
• CPICH Ec/Io or CPICH Ec/N0 for each decoded scrambling code (best code, 2nd best code, 3rd best code, etc…)
• Decoded Scrambling Codes (best server plot)
• Estimated downlink path loss
• Pilot pollution areas (areas with more than 3 codes within a 6dB-window)
For each performed drive test with test mobile, the following technical information can be created for a detailed analysis:
• CPICH EcNo map
• CPICH RSCP map
• UE Tx-Power map
• Number of links the mobile is connected to
• Real Soft Handover areas (active set size or active set composition)
• SIR map
• Downlink BLER map
• A map showing critical events (e.g. call drop, HO failure, ...)
• For PS calls if possible: mean downlink throughput maps
• Real cell selection and reselection areas
4.1.2.4 RF Analysis
The most important step in the Initial Tuning is to guarantee that the pilot coverage measured (Scanner CPICH RSCP) is exactly as planned in simulation tool (model tuning should be performed before). This way all services should works properly as planned and the network KPI’s will be reached easily.

GUIDELINES Version Status RF Optimization Guideline for AMX 3G Rollout 1 Consulting and System Integrations August, 27th 2007 Revised by: Danilo Cabral Raj Sandhu, Allan Bispo and Daniel Platero
This part involves many drive tests, site visits, antenna panning, antenna tilting, etc. It’s also necessary to do another drive test to check the effect and if another change is needed. All network changes should be done one at time for a problem area, to be able to analyze the effectiveness of these changes. This process must be performed as long as the real network does not reflect the planned objectives and before the Acceptance Drive Test Procedure, to ensure that the KPI’s will be reached.
4.1.2.4.1 Tuning Process
The general guideline for the tuning activities is shown in the picture below.
Figure 14: RF Initial Tuning Process
* increasing of the CPICH Tx power has to be analyzed carefully. As the others common channels are relative to the CPICH power, a change on it could affect the power availability to the others common channels, besides to increase interference to others neighbours cells. Actually, it must be the last option anyway or even it should be avoided. A review on the radio network planning aspects can be a good option.
4.1.2.4.2 Initial Tuning Parameters
The following parameter should be considered for the initial tuning:
ü Antenna System tuning – electrical and mechanical tilting, azimuth tuning, change the antenna bearing angle, change the antenna pattern and antenna height tuning.

GUIDELINES Version Status RF Optimization Guideline for AMX 3G Rollout 1 Consulting and System Integrations August, 27th 2007 Revised by: Danilo Cabral Raj Sandhu, Allan Bispo and Daniel Platero
ü CPICH Tx Power *
To change these two parameters is almost sufficient for initial tuning. The flow above shows this, the main RF optimization actions for initial tuning are related to changes at the antenna system or at the CPICH Tx power*. For all other parameter in the network default parameter setting should be used.
The first important step is to optimize the antenna system. Tilting the antennas has a big influence for network performance. The correct antenna downtilt in UMTS has more impact on the network performance compared to GSM. Besides that, changes at azimuth, bearing angle, pattern and height complement downtilt optimization.
Only if the antenna system optimization is finished, but it is still needed RF tuning at the area, then a CPICH Tx power* optimization can be performed as next tuning step for the network. However it will be necessary a deep analysis in order to avoid either reduction of the system coverage or either reduction of the system capacity, see possible effects on the CPICH power modification below:
Figure 15: CPICH Transmit Power Consequences
* increasing of the CPICH Tx power has to be analyzed carefully. As the others common channels are relative to the CPICH power, a change on it could affect the power availability to the others common channels, besides to increase interference to others neighbours cells. Actually, it must be the last option anyway or even it should be avoided. A review on the radio network planning aspects can be a good option.
4.1.2.4.3 Relations of Ec/No and RSCP
As can be seen in the flow above, for initial tuning of a network, two RF measuring are very important: CPICH RSCP (Received Signal Code Power) and CPICH Ec/N0 (Energy per Code over Noise). Both are related to each other.
GUIDELINES Version Status RF Optimization Guideline for AMX 3G Rollout 1 Consulting and System Integrations August, 27th 2007 Revised by: Danilo Cabral Raj Sandhu, Allan Bispo and Daniel Platero
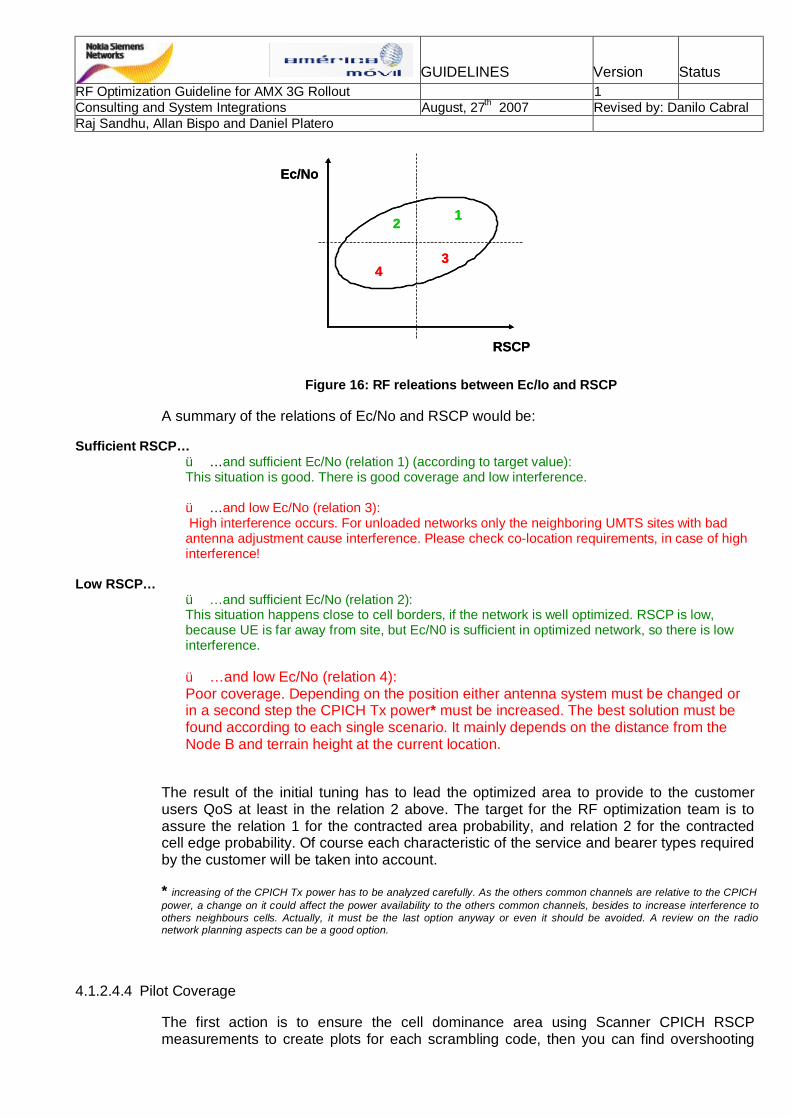
Figure 16: RF releations between Ec/Io and RSCP
A summary of the relations of Ec/No and RSCP would be:
Sufficient RSCP… ü …and sufficient Ec/No (relation 1) (according to target value): This situation is good. There is good coverage and low interference. ü …and low Ec/No (relation 3): High interference occurs. For unloaded networks only the neighboring UMTS sites with bad antenna adjustment cause interference. Please check co-location requirements, in case of high interference!
Low RSCP… ü …and sufficient Ec/No (relation 2): This situation happens close to cell borders, if the network is well optimized. RSCP is low, because UE is far away from site, but Ec/N0 is sufficient in optimized network, so there is low interference.
ü …and low Ec/No (relation 4): Poor coverage. Depending on the position either antenna system must be changed or in a second step the CPICH Tx power* must be increased. The best solution must be found according to each single scenario. It mainly depends on the distance from the Node B and terrain height at the current location.
The result of the initial tuning has to lead the optimized area to provide to the customer users QoS at least in the relation 2 above. The target for the RF optimization team is to assure the relation 1 for the contracted area probability, and relation 2 for the contracted cell edge probability. Of course each characteristic of the service and bearer types required by the customer will be taken into account.
* increasing of the CPICH Tx power has to be analyzed carefully. As the others common channels are relative to the CPICH power, a change on it could affect the power availability to the others common channels, besides to increase interference to others neighbours cells. Actually, it must be the last option anyway or even it should be avoided. A review on the radio network planning aspects can be a good option.
4.1.2.4.4 Pilot Coverage
The first action is to ensure the cell dominance area using Scanner CPICH RSCP measurements to create plots for each scrambling code, then you can find overshooting
12
34
Ec/No
RSCP
12
34
Ec/No
RSCP
GUIDELINES Version Status RF Optimization Guideline for AMX 3G Rollout 1 Consulting and System Integrations August, 27th 2007 Revised by: Danilo Cabral Raj Sandhu, Allan Bispo and Daniel Platero
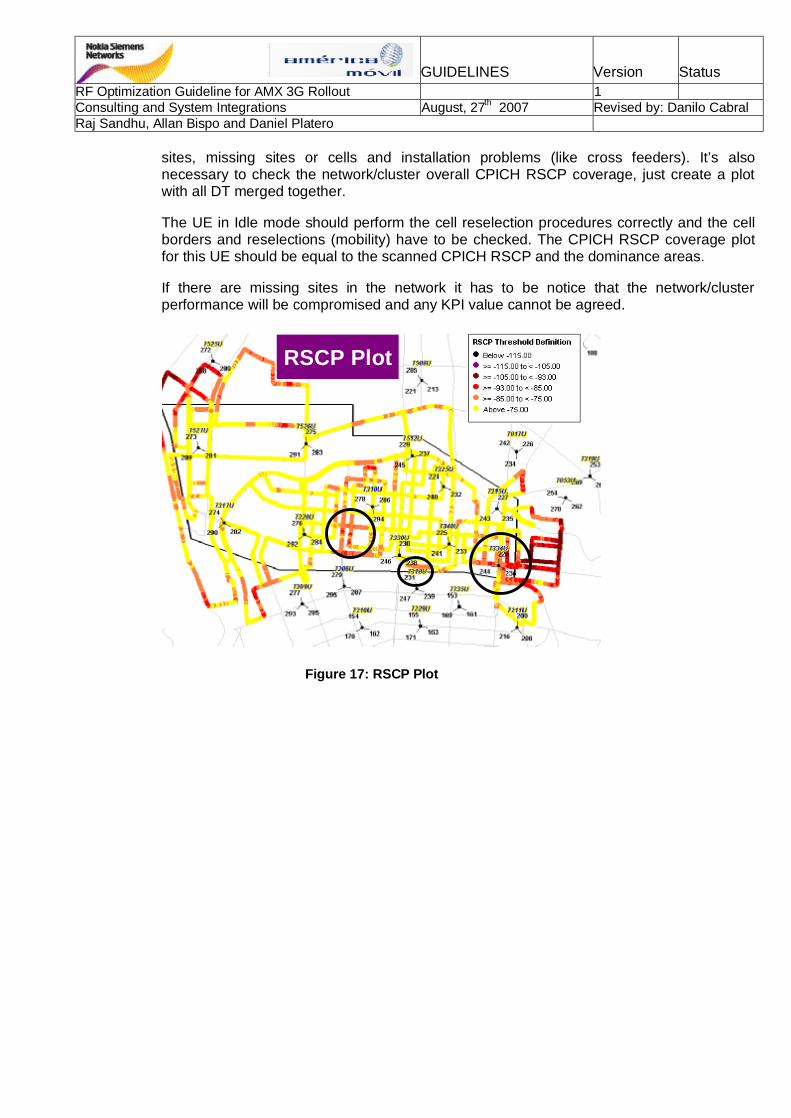
sites, missing sites or cells and installation problems (like cross feeders). It’s also necessary to check the network/cluster overall CPICH RSCP coverage, just create a plot with all DT merged together.
The UE in Idle mode should perform the cell reselection procedures correctly and the cell borders and reselections (mobility) have to be checked. The CPICH RSCP coverage plot for this UE should be equal to the scanned CPICH RSCP and the dominance areas.
If there are missing sites in the network it has to be notice that the network/cluster performance will be compromised and any KPI value cannot be agreed.
Figure 17: RSCP Plot
RSCP Plot

GUIDELINES Version Status RF Optimization Guideline for AMX 3G Rollout 1 Consulting and System Integrations August, 27th 2007 Revised by: Danilo Cabral Raj Sandhu, Allan Bispo and Daniel Platero
Figure 18: Ec/No Plot
Figure 19: Best Server Scrambling Code Plot
The coverage plots above show some typical problems that are faced by the optimization team during the initial tuning:
V coverage problem areas – between the sites 7328U and 7330U, northern and western of the site 7310U (easily seen in RSCP Plot)
EcNo Plot

GUIDELINES Version Status RF Optimization Guideline for AMX 3G Rollout 1 Consulting and System Integrations August, 27th 2007 Revised by: Danilo Cabral Raj Sandhu, Allan Bispo and Daniel Platero
V dominance problem areas – close to the sector 2 (SC238) of the site 7330U, northern of the site 7310U (easily seen in Best Server Scrambling Code Plot)
V missing site – site 7334U was not on-air during the drive-test
Below are described some hints about tuning the network for coverage holes and dominance problems, but before taking any action it’s necessary to check the best choice.
4.1.2.4.4.1 Tuning methods for Coverage Problem Area
V Up-tilting of serving cell’s antenna to extend coverage radius and to improve unsatisfied coverage area
V Change Antenna Bearing Angle: Focus the main beam of antenna to coverage holes and low RSCP area
V Change Antenna Pattern: Displace with higher gain antenna with adequate antenna tilting
V Increase serving cell’s antenna height to get higher effective antenna gain but there is risk to make undesirable inter-cell interference to adjacent cells
V Increase CPICH Tx Power* of serving cell
4.1.2.4.4.2 Tuning methods for Dominance Problem Area
V Down-tilting of interfering cells’ antenna, which generate pilot pollution
V Change antenna bearing angles of cells involved in pilot pollution
V Change antenna patterns of cells involved in pilot pollution. Smaller gains for interfering cells and higher gain for victim cell
V Decrease antenna height of interfering cells and increase antenna height of victim cell with adequate tilting angle
V Change CPICH Tx Power*: Increase serving cell’s Tx power but decrease interfering cell’s Tx power
* increasing of the CPICH Tx power has to be analyzed carefully. As the others common channels are relative to the CPICH power, a change on it could affect the power availability to the others common channels, besides to increase interference to others neighbours cells. Actually, it must be the last option anyway or even it should be avoided. A review on the radio network planning aspects can be a good option.
4.1.2.4.4.3 Cross feeder
One of the activities deployed during the initial tuning is the verification of HW problems or bad error installation in the Node-Bs.
Cross feeder is a serious mistake that can be committed by the implementation team and has more impact on the network performance of WCDMA compared to GSM, once in WCDMA there is no frequency plan to minimize the interference problems.
GUIDELINES Version Status RF Optimization Guideline for AMX 3G Rollout 1 Consulting and System Integrations August, 27th 2007 Revised by: Danilo Cabral Raj Sandhu, Allan Bispo and Daniel Platero
A way to detect this problem is to visually verify the best server scrambling code (SC) map from the scanner of the investigated area. It is necessary to compare the printed SC along the drive-test route with the SC and azimuth database. As an example take a look at the Best Server Scrambling Code Plot above.
If a Node-B has their azimuths on certain directions, consequently their planned scrambling codes should be being radiated on these same directions. The scanner data from the drive-test equipment must confirm that the scrambling codes are on the planned direction. Otherwise it is characterized a cross feeder.
Certainly cross feeder will also be manifested by EcNo degradation because the neighbour list planning will not be ready to add the wrongly irradiated SC in the UE active set at that direction.
Based on that an action request has to be opened to the implementation team in order to fix the problem. It is essential to highlight that the RF analyst need to be 100% sure there is no mistake in the cell parameters in the database.
4.1.2.4.5 Definition of Changes and Information Control
Once the RF analysis has pointed out the RF failures and shortages from the drive-test tool, the tuning team must define which changes are more appropriated to request in order to solve or minimize the problem.
A change request for that could include:
ü Antenna tuning – azimuth, mechanical tilt, electrical tilt, height, pattern and so on;
ü CPICH Tx power tune;
ü RNC / Cell parameter change;
ü Site verification – cross feeder, antenna system, transmission failure, equipment operation, alarm/warning check, etc.
Another relevant aspect of the initial tuning is to provide RF data from the real network to correct and improve the network planning and implementation.
As the NSN official radio network tool is NetAct, after the conclusion of any change request the NetAct database must be updated. With this practice the rollout will always have reliable RF information.
It is extremely necessary to establish a process in the project in order to keep the NetAct database updated.
The following chart shows an example of process to be carried out during the initial tuning in order to keep the RF data updated.

GUIDELINES Version Status RF Optimization Guideline for AMX 3G Rollout 1 Consulting and System Integrations August, 27th 2007 Revised by: Danilo Cabral Raj Sandhu, Allan Bispo and Daniel Platero
Figure 20: Information Control during Initial Tuning
4.1.3 Pilot Pollution
The next step is to check the Quality of the pilot coverage CPICH Ec/No. The pilot pollution case occurs when there is more pilots then can be added to the active set of the UE. Hence it will cause interference to the rest of the pilots connected to the UE.
Since the maximum pilots that can be added to the active set is 3, if there are 4 or more pilots at similar and strong RSCP then pilot pollution occurs.
One way to check for pilot pollution is by carrying out a plot for the 4th best server from the scanner. Using this, data where the 4th best server’s RSCP is within 6 db of the best server’s RSCP can be classified as potential pilot pollution area and needs to be looked at in more detail. Here, the possible action is to find the main interferer and reducing its power in the problem area via down tilting or panning the antenna.
Figure 21: Pilot Pollution by 4th Best Server RSCP
Pilot Pollution – 4th Best Server RSCP

GUIDELINES Version Status RF Optimization Guideline for AMX 3G Rollout 1 Consulting and System Integrations August, 27th 2007 Revised by: Danilo Cabral Raj Sandhu, Allan Bispo and Daniel Platero
Figure 22: Number of Pilots 5dB from the best pilot
Other useful way to analyse pilot pollution is by the amount of pilots that have enough EcNo to be added into the “add window”, see figure 22 above. As the active set in WCDMA admits 3 scrambling code at maximum, the remains pilots, who are strong enough to be in the active set (EcNo <= 5dB from the best server) but could not be because it already has 3 pilots there, will be considered polluters in potential.
The UE’s in active mode can present some fails due to high interference, it’s also interesting to check this failure locations if there are no pilot pollution or missing neighbours.
Poor coverage areas can still have good Ec/No if there is dominating server.
4.1.4 Coverage for different services
The UE (or UE’s) in connected mode should perform tests of accessibility for CS and PS services, and test the mobility of the system.
When a service is in use different services need different RSCP levels and Eb/No quality, which has to be tested and verified. In addition, RSCP and EcIo are constantly reported by the CPICH, and SIR and BLER measuring are available to evaluate the quality while the UE is in connected mode.
4.1.5 Handover Verifications
Handover and reselection in WCDMA systems are essential besides due to mobility reasons, also due to the control of interference. Handover control helps the power control mechanisms to keep the noise rise as lower than possible.
# Pilots with EcNo -5db from Best Server
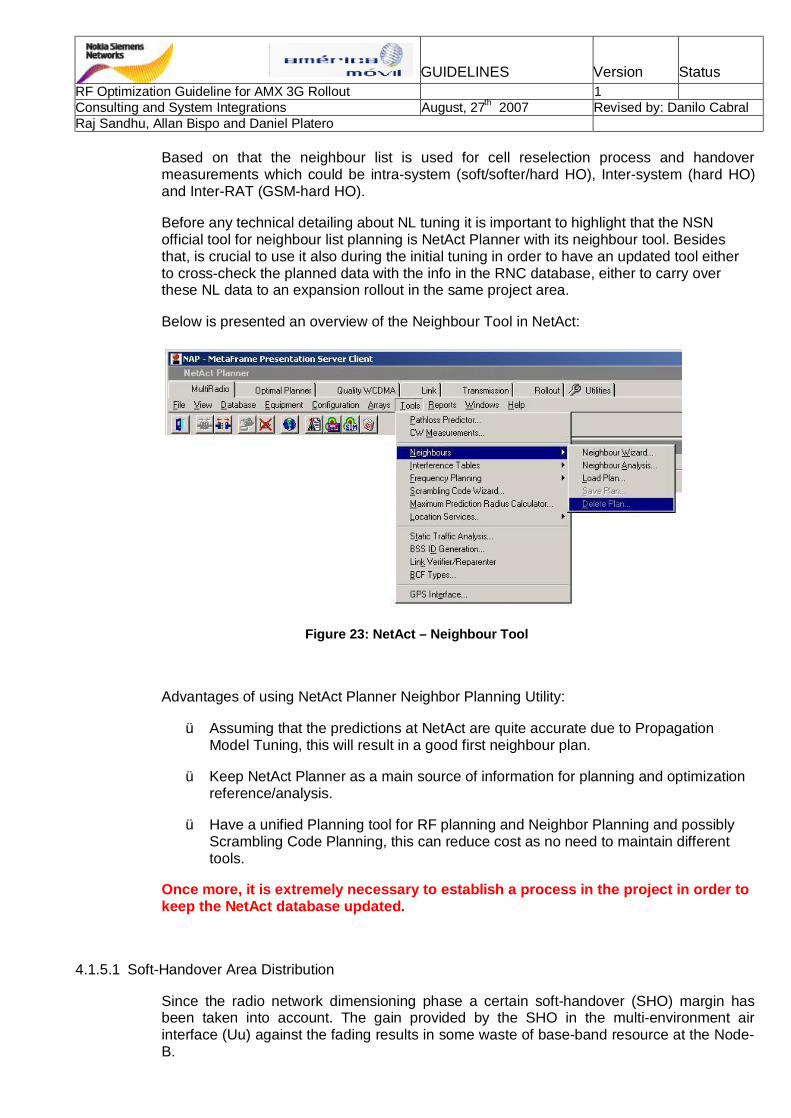
GUIDELINES Version Status RF Optimization Guideline for AMX 3G Rollout 1 Consulting and System Integrations August, 27th 2007 Revised by: Danilo Cabral Raj Sandhu, Allan Bispo and Daniel Platero
Based on that the neighbour list is used for cell reselection process and handover measurements which could be intra-system (soft/softer/hard HO), Inter-system (hard HO) and Inter-RAT (GSM-hard HO).
Before any technical detailing about NL tuning it is important to highlight that the NSN official tool for neighbour list planning is NetAct Planner with its neighbour tool. Besides that, is crucial to use it also during the initial tuning in order to have an updated tool either to cross-check the planned data with the info in the RNC database, either to carry over these NL data to an expansion rollout in the same project area.
Below is presented an overview of the Neighbour Tool in NetAct:
Figure 23: NetAct – Neighbour Tool
Advantages of using NetAct Planner Neighbor Planning Utility:
ü Assuming that the predictions at NetAct are quite accurate due to Propagation Model Tuning, this will result in a good first neighbour plan.
ü Keep NetAct Planner as a main source of information for planning and optimization reference/analysis.
ü Have a unified Planning tool for RF planning and Neighbor Planning and possibly Scrambling Code Planning, this can reduce cost as no need to maintain different tools.
Once more, it is extremely necessary to establish a process in the project in order to keep the NetAct database updated.
4.1.5.1 Soft-Handover Area Distribution
Since the radio network dimensioning phase a certain soft-handover (SHO) margin has been taken into account. The gain provided by the SHO in the multi-environment air interface (Uu) against the fading results in some waste of base-band resource at the Node-B.

GUIDELINES Version Status RF Optimization Guideline for AMX 3G Rollout 1 Consulting and System Integrations August, 27th 2007 Revised by: Danilo Cabral Raj Sandhu, Allan Bispo and Daniel Platero
In order to keep the percentage of SHO overhead close to the RNC dimensioned value, the SHO area distribution has to be coherent with the distribution obtained during the planning, avoiding waste of capacity.
From the drive-test analysis tool is possible to obtain a good map to evaluate how good the SHO distribution is. The number of radio links in the UE active set shows that if inside of a cell coverage area the UE has 2 or 3 radio links from different sites in its active set, probably there is dominance area problem or pending optimization action to do at the neighbour cells. It is expected that active set equal to 3 results on degradation of the UL BLER of the related cells.
It is expected that at the end of an initial tuning a cluster had a SHO distribution like that: 60% single radio connection and 40% 2 or 3 radio links at the active set located at the cell border only.
Using of visual check over a map of best scrambling code is other approach to analyze the SHO. This means that in areas where there is no cell dominance, especially close to the site, the UE active set will have a pilot server which should not be there. This leads to a waste of capacity.
4.1.5.2 Neighbour List Optimization
As mentioned above handover is very important for a WCDMA system, hence during the initial tuning the neighbour list and parameters have to be updated and optimized.
There are a number of approaches that can be used to both plan and verify the neighbour plan:
Figure 24: Neighbour Creation and Verification Methods
The neighbour list verification can be done manually, using the negihbour planning module of the radio network planning tool (NetAct), using software like MapInfo, or automatically using Scanner measurements and a post-processing tool to generate the list, or using network OSS measurements (when there are enough samples to consider).
Time-to-time a cross-verification should be carried out in order to raise any discrepancy between the neighbour list programmed into the RNC and that one planned by the radio
Drive Testing
Neighbour Creation Manual Check Analytical
Planning Tool
Other
Neighbour Creation Neighbour Verification
Manual Check
Measured
Network Stats

GUIDELINES Version Status RF Optimization Guideline for AMX 3G Rollout 1 Consulting and System Integrations August, 27th 2007 Revised by: Danilo Cabral Raj Sandhu, Allan Bispo and Daniel Platero
network planning team. This will allow a more reliable neighbour list optimization during the initial tuning.
As mentioned before, NSN strongly recommends using NetAct Planner as the reference and database for all optimization activities, specially neighbour list verification. Thus the project could have a reliable planning database for audit the RNC database and to have a pre-optimized network planning at future expansion rollout.
An incorrect neighbour list handling can cause problems both in idle mode (for cell selection and reselection) and in DCH mode (in HO handling), then first optimization of a neighbour list shall occur still during the planning phase.
There is a know problem in the UMTS standards about the SIB 11/12 messages which limits the neighbour list size in 47 neighbours including all types of HO. Since this size depends on how many parameters configures this neighbours it’s recommended to have maximum 45, and 35 if HCS is used. For more information about this issue find in NOLS the document TN_RNC_SW_2004_046.
Considering the above described problems, it is suggested to consider the following indications for a good radio network planning:
ü Each cell should have in maximum 15 intra frequency neighbour cells. In general could be assumed:
o ADJS = 15, ADJG = 15, ADJI = 15, which leads to a “realistic worst case values”, SIB11 length = 3187.5 < 3552 -> OK!!
ü If under special conditions a cell needs more than 15 intra frequency neighbours:
o all possible active set combinations must be checked, if the maximum of 32 will not exceeded (to prevent Handover problems)
ü Size of SIB 11 must not be exceeded (to avoid camping failure problems)
o avoid setting AdjsQoffset2 values, different CPICH values or other parameters used to tune cell reselection or handover
ü The better the radio network planning, the easier this recommendation can be fulfilled (clear cell boarders, no cell fragmentation, no pilot pollution, etc.)
Specifically regarding the initial tuning process the neighbour list verification is based on drive-test data analyzed in the post-processing tool, manual check and re-planning in the radio network planning tool (NetAct). Its input data and source are:
Input Data Source
CPICH Scrambling code Ec/Io Scanner
Measurement position Scanner
Cell ID, cell position, cell azimuth Planning Tool
Cell scrambling code Radio Design
Cell neighbour list Planning Tool
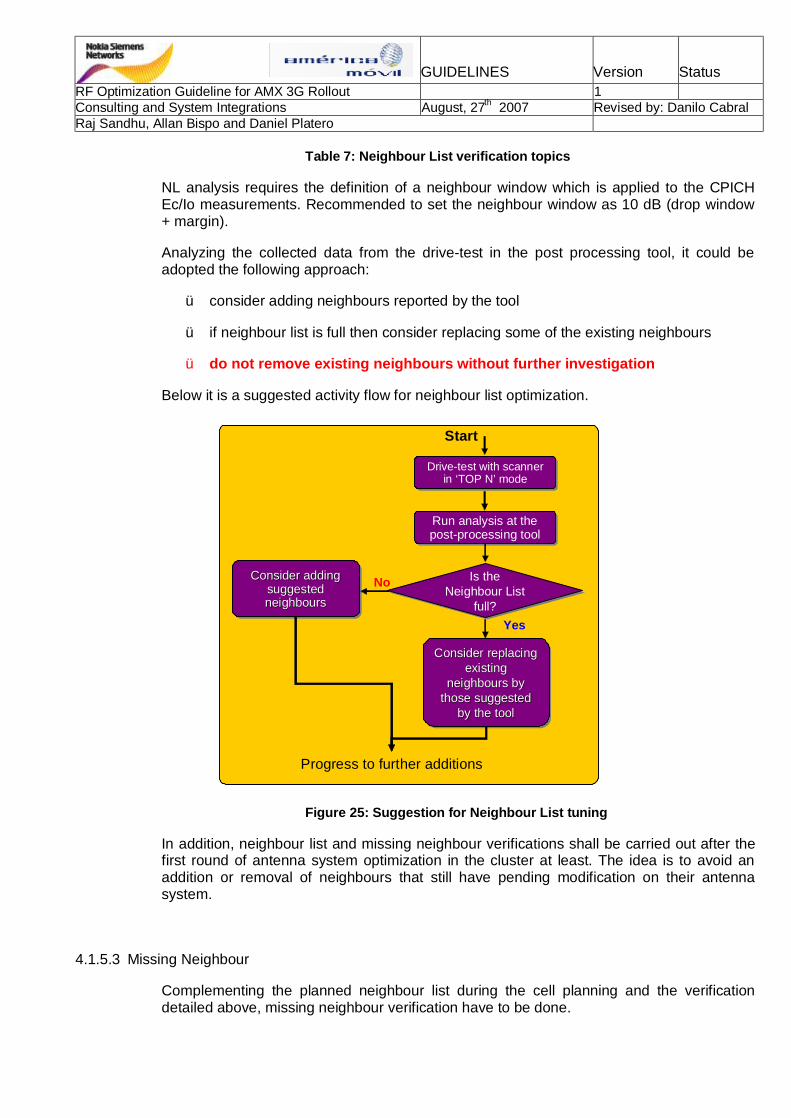
GUIDELINES Version Status RF Optimization Guideline for AMX 3G Rollout 1 Consulting and System Integrations August, 27th 2007 Revised by: Danilo Cabral Raj Sandhu, Allan Bispo and Daniel Platero
Table 7: Neighbour List verification topics
NL analysis requires the definition of a neighbour window which is applied to the CPICH Ec/Io measurements. Recommended to set the neighbour window as 10 dB (drop window + margin).
Analyzing the collected data from the drive-test in the post processing tool, it could be adopted the following approach:
ü consider adding neighbours reported by the tool
ü if neighbour list is full then consider replacing some of the existing neighbours
ü do not remove existing neighbours without further investigation
Below it is a suggested activity flow for neighbour list optimization.
Figure 25: Suggestion for Neighbour List tuning
In addition, neighbour list and missing neighbour verifications shall be carried out after the first round of antenna system optimization in the cluster at least. The idea is to avoid an addition or removal of neighbours that still have pending modification on their antenna system.
4.1.5.3 Missing Neighbour
Complementing the planned neighbour list during the cell planning and the verification detailed above, missing neighbour verification have to be done.
Run analysis at the post-processing toolRun analysis at the post-processing tool
NoConsider adding suggested neighbours
Consider adding Consider adding suggested suggested neighboursneighbours
Start
Progress to further additions
Is the Neighbour List
full?
Is the Neighbour List
full?
Consider replacing existing
neighbours by those suggested
by the tool
Consider replacing Consider replacing existing existing
neighbours by neighbours by those suggested those suggested
by the toolby the tool
Drive-test with scanner in ‘TOP N’ mode
Drive-test with scanner in ‘TOP N’ mode
Yes
GUIDELINES Version Status RF Optimization Guideline for AMX 3G Rollout 1 Consulting and System Integrations August, 27th 2007 Revised by: Danilo Cabral Raj Sandhu, Allan Bispo and Daniel Platero
Mistakes during the planning phase or during the creation of the RNC database can lead to this problem. Other problem is that after the first round of tuning at the antenna system some scrambling code can still present a large footprint due to RF tunneling effect at the street level for example. This would lead to the need of to add this missing scrambling code into the neighbour list of its adjacent cells.
The missing neighbour can be found by comparing the UE received neighbour list (in case of soft handover a combined neighbour list is used) with the scanner receiver pilots. From this comparison, the pilots seen from the scanner but not in the UE neighbour list can be classified as potential missing neighbour. This needs to be evaluated on a case by case basis as this case could also be related to overshooting pilots.
A common effect from missing neighbour is a degrading of the EcNo in the analyzed area. Consequently RF failures, call drops or IRAT handovers could happen.
Some missing neighbour can also appear after the integration of a new site/cell in an area where the initial tuning already optimized the NL. In this case is important to consider an optimization at the NL since the planning. During the load in the RNC of the new site, all NL modifications in the existing sites surrounding the area should be updated. Besides that the drive-test verifications in this new site will feedback whether there is a missing neighbour or not.
4.1.5.4 Inter-system Handover Verification (IRAT HO)
A main characteristic of the UMTS is its full compatibility with GSM. Any WCDMA UE has to support 2G services generating world wide coverage. From the technical point of view, a 3G UE can go through GSM either by an access attempt after a 2G cell selection, due to ending of the WCDMA coverage for example; or either by a mobility procedure: reselection or handover, in order to ensure service continuity.
As the initial tuning is a normal feedback to the cell planning, the inter-system handover verification (IRAT HO), specially 3G to 2G, could provide valuable data about 3G coverage gaps in the cluster and interference problems. It is expected to have IRAT HO at the system border, however, 3G-2G HO inside of a dense-urban cluster, for example, could imply on bad parameterization, UE problem, indoor coverage problems, coverage hole due to missing site or interference problem due to poor optimization.
NSN recommends planning inter-system neighbours for all cells at the network, respecting the NL limitation explained above. In a 3G/2G overlay network at least the co-site neighbours plus the 1st tier 2G neighbours and the GSM neighbours at the WCDMA system border must be implemented.
During the IRAT tests from 3G to 2G the first task should be verification if the RNC database is fullfiled with the parameters values planned to the inter-system handovers. At this point an IRAT drive-test route should be already defined in mutually agreement with the customer. On this drive-test route both WCDMA and GSM coverages should be compared in order to find the most suitable neighbors. The FMT has to be set with a WCDMA/GSM scanner and dual UE.
The 3G-2G IRAT tuning could be divided in three parts:
1. Triggers - as this is an emengent HO, possibly the call is facing serious quality problems, then is crutial to investigate if the 3G-2G trigger was reached. It depends
GUIDELINES Version Status RF Optimization Guideline for AMX 3G Rollout 1 Consulting and System Integrations August, 27th 2007 Revised by: Danilo Cabral Raj Sandhu, Allan Bispo and Daniel Platero
on the trigger method configured at the RNC: CPICH RSCP or CIPCH EcIo or UE Tx power, for example. Each of this method compounds of a bunch of parameters that define the starting of the GSM measurements: filters, hysteresis, timers and thresholds;
2. GSM measuring – during this phase the UE will measure the GSM network by the compressed mode (CM). To follow to the next step the UE must measure GSM according to the parameters at the RNC;
3. HO decision – after the selection of the GSM cell in the best target cell, the HO decision can be made if a minimum RX level of the GSM cell is provided.
It is important to check when and where the compressed mode is being activated, and where the unsuccessful/successful IRAT HO events are ocourring. If the inter-system handover is not being triggered at the planned location by the planned parameters values, a change request must be done in order to solve the problem.
Furthermore, IRAT HO is an emergency procedure, and it shall be interpreted as a good opportunity to verify if, at the location where this handover occurred, there is a coverage gap or an interference problem, as mentioned previously.
For further technical details about IRAT HO looks at the RANOP1 documentation.
4.1.6 Other Issues not related to RF optimization
When analyzing some specific problems in Initial Tuning and optimization activities, sometimes it’s very hard to find the main cause of these problems. After taking all actions described above and not finding an answer it’s time to consider that maybe this case is not related to RF optimization.
A way to verify non RF issues that could affect the drive-test data is by a comparison between the UE on the drive-test set. If the RF environment is poor for one UE, possibly the others UEs will be facing similar degrading. Besides that, it is valid to carry out an elimination analysis among the network elements. This will lead to isolate the problem at the correct network element, i.e. UE, Node-B, RNC, SGSN or MSC.
In some cases it is vital to cross check your conclusions with a protocol analyzer. This kind of equipment allows checking the others network interfaces and layers.
4.1.6.1 UE Issues
Sometimes UE’s does not have good performance. The reasons for that could be many:
ü Bad functioning on the UE RF circuits – in WCDMA the UE performs many measuring that will be used during procedures like SHO, power control, admission control and so on; if the Rx or Tx circuits in the UE are reporting wrong measuring, the decision for the procedures will be made incorrectly. In this case is important to check if the others UEs are measuring a similar RF condition, or even repeat the test with other UE in the drive-test set.
ü Chipset – some UE models show problems due to incompatibility between its chipset version (Qualcomm chipset for example) and the main UTRAN procedures;

GUIDELINES Version Status RF Optimization Guideline for AMX 3G Rollout 1 Consulting and System Integrations August, 27th 2007 Revised by: Danilo Cabral Raj Sandhu, Allan Bispo and Daniel Platero
in these cases the first action is to assure that the RF environment is good, and there is no problem with core. After that is important to check with the principal engineers if there is any claim reported by other projects around the world against that UE model.
ü Compressed Mode – UE performs measurements for inter-system and inter-frequency handovers by compressed mode procedure. As theses kind of handovers are emergency ones, they are tried in bad RF conditions always. If if the HO attempt failures, but the parameters in the RNC database are correct, it will be important to check, besides the core and GSM BSS sides, if the UE is performing the CM well.
ü UE SW release – in WCDMA there are many RAB available, however some UE could present accessibility problems due to does not have the capability to access a certain RAB; it is valid to verify with the UE provider if the handset is updated to the test scope.
4.1.6.2 UTRAN HW and SW Issues
Please check in NOLS for latest release of the following two documents related to WCDMA RAN and Flexi WCDMA Base Station (in Maintenance Documentation):
o List of active HW and SW TNs for RNC PL
o Generic Failure Status Report
These documents contain the valid list for Technical Notes and the Failures Reports.
Verification on the alarm status at UTRAN elements before the tests could provide a good indication of potential problems.
4.1.6.3 CORE Issues
The recommended drive-test set allows carrying out tests in CS and PS cores. If a certain UE is facing accessibility problems in CS and not in PS, but the RF is good, then this could indicate problem with CS and not in the UTRAN.
Another issue is the core SW release must be updated to support all the UTRAN and UE functionalities.
Verification on the alarm status at CORE elements before the tests could provide a good indication of potential problems.
4.1.6.4 Drive-test Equipment Issues
The drive-test equipment must be calibrated and verified constantly in order to avoid generation of bad measuring and false RF events.

GUIDELINES Version Status RF Optimization Guideline for AMX 3G Rollout 1 Consulting and System Integrations August, 27th 2007 Revised by: Danilo Cabral Raj Sandhu, Allan Bispo and Daniel Platero 4.2 Optimization
After Network’s commercial launch, and new user’s income in the network, it’s time to optimize according to the users behavior.
The optimization issues can be divided into the following sections:
V Common performance issues that affect any service
V CS Video call performance
V PS call performance
V IRAT performance
4.2.1 Common performance issues that affect any service
Behavior Problem Description Possible solutions Call set-up failure Call drop
Poor coverage area
If problem is poor coverage, this means poor RSCP (<-95 dBm) thus also the EcNo derades very rapidly (< -12 dB) when the coverage border is reached.
If the poor coverage area occurs close to the site: Check Antenna line installation (Length and quality of antenna line is important, Check the VSWR reading to see if the return loss is at an acceptable value) Check Antenna type and quality. (Check presence of shadowing obstacles within close proximity of the antenna) If poor coverage observed at boundaries between cells. Check that CPICH powers are balanced between the studied cells. If poor coverage observed at the cell edges. Compare measured pathloss with simulated pathloss to evaluate accuracy of planning tool, Add a site to the area if really needed.
Call set-up failure Call drop
Poor dominance area.
No main server in the area, too many cells with weak CPICH level. CPICH EcNo is usually very bad even the RSCP is good e.q. RSCP –80…-90 dBm but EcNo about –10 dB
Use buildings and other environmental structures to isolate cell(s) coverage. Down tilt antennas to make cells dominant and limit effects of interfering cell(s). Check antenna bearing. Add a site.

GUIDELINES Version Status RF Optimization Guideline for AMX 3G Rollout 1 Consulting and System Integrations August, 27th 2007 Revised by: Danilo Cabral Raj Sandhu, Allan Bispo and Daniel Platero
Behavior Problem Description Possible solutions Call set-up failure Call drop
Pilot Pollution Bad CPICH Ec/Io (<-12 dB) level although CPICH RSCP level is good. High site in the neighbourhood may cause interference.
Find interfering cell from Scanner results. Adjust antenna bearing and down tilt or lower the antenna height (too much tilt will break the dominance). Add interfering cell to the neighbour of the serving cell.
Dropped call/SHO failure
Missing neighbour
A good usable neighbour is present within cells coverage area, can cause DL interference if it is not in the active set. Swapped sectors in WBTS.
Check scanner data and look for missing neighbours. Check the cabling in antenna line.
Call set-up Failure Call drop
High PrxTotal due to UL External interference
The PrxTotal level is significantly higher than expected in no/low load conditions.
Try to figure the possible area/direction of the interference by checking PrxTotal level on neighboring cells. Alternatively use spectrum analyzer & directive antenna to locate interferer. Inform operator/regulator about the found conditions. Check if auto tuning range is large enough (20 dB).
Call set-up failure Call drop
High PrxToatal due to wrong MHA settings
The PrxTotal level is significantly higher than expected in no/low load conditions. MHA settings should be checked, see more in reference
In case of MHA is used in BTS check MHA and cables loss parameters, otherwise PrxTotal value will be too high. (If MHA parameter is set to ON, Cableloss WCEL parameter is used, Cable loss = Real MHA gain = Feeder loss parameter)
Call set-up failure Call drop
High Prxtotal due to Installation problems
The PrxTotal level is significantly higher than expected in no/low load conditions.
Check the antenna installation as the last alternative in high PrxNoise case.
Cell set-up failure
Bad RRC connection set-up success rate due to slow UE cell reselection
RRC connection set-up complete message not heard by BTS.
Set WCEL parameters so that reselection process will start earlier: Qqualmin, Sintrasearch and Qhyst2 as per latest recommendation

GUIDELINES Version Status RF Optimization Guideline for AMX 3G Rollout 1 Consulting and System Integrations August, 27th 2007 Revised by: Danilo Cabral Raj Sandhu, Allan Bispo and Daniel Platero
Behavior Problem Description Possible solutions Long call set-up time
Long time interval for sync between RNC and BTS before connection
The value of Parameter N312 is too high: maximum number of “in sync” indications received from L1 during the establishment of a physical channel
Use smaller value N312 (2, recommendation is 4). Use Actix for checking the call set-up delay (L3 messages). Check the RNC parameters ActivationTimeOffset and StandAloneDCCHBitRate, be aware that changing this parameters affect all RNC.
Dropped call
SHO to wrong cell will cause drop call.
Overshooting cell come temporarily into active set and forces a suitable serving cell to be dropped out. Later RSCP suddenly drops in the “wrong cell” and causes a dropped call because there is no neighbour defined.
Pan away overshooting cell if it is too close to the serving cell, otherwise apply down tilting as well.
Dropped call
Cell suffering from UL interference = DL (CPICH) coverage much bigger than UL coverage
As the UE Tx power is not enough for target cell synchronization, the SHO fails which will cause call drop later.
Use cell individual offset (negative value) ADJS parameter AdjsEcNoOffset to balance the DL and UL coverage. Check traffic direction of in-car UEs to decide which cell requires offsets.
Dropped call
DL CPICH coverage < UL coverage
Cell with lower CPICH power than the surrounding is having “too good” UL performance, as this cells’ UL cannot be used efficiently due to SHO is decided upon DL (CPICH Ec/No).
Use cell individual offset (positive value) ADJS parameter AdjsEcNoOffset to balance the DL and UL coverage. Note: Cell individual offsets are not taken into account when calculating the added cell Tx power.
Dropped call
Round the corner effect
The call drops due to too rapid CPICH coverage degradation for Cell A, and therefore there is not enough time for SHO.
Use cell individual offset (positive value) ADJS parameter AdjsEcNoOffset to balance the DL and UL coverage. Note: Cell individual offsets are not taken into account when calculating the added cell Tx power.
Dropped call/SHO failure
Too many neighbours
In SHO area the number of combined neighboring cells becomes more than 31. HO list is created using RNC algorithm in the final stage some of the neighbours will randomly be removed.
Delete unnecessary neighbours. Improve dominance.
Table 8: Common Performance
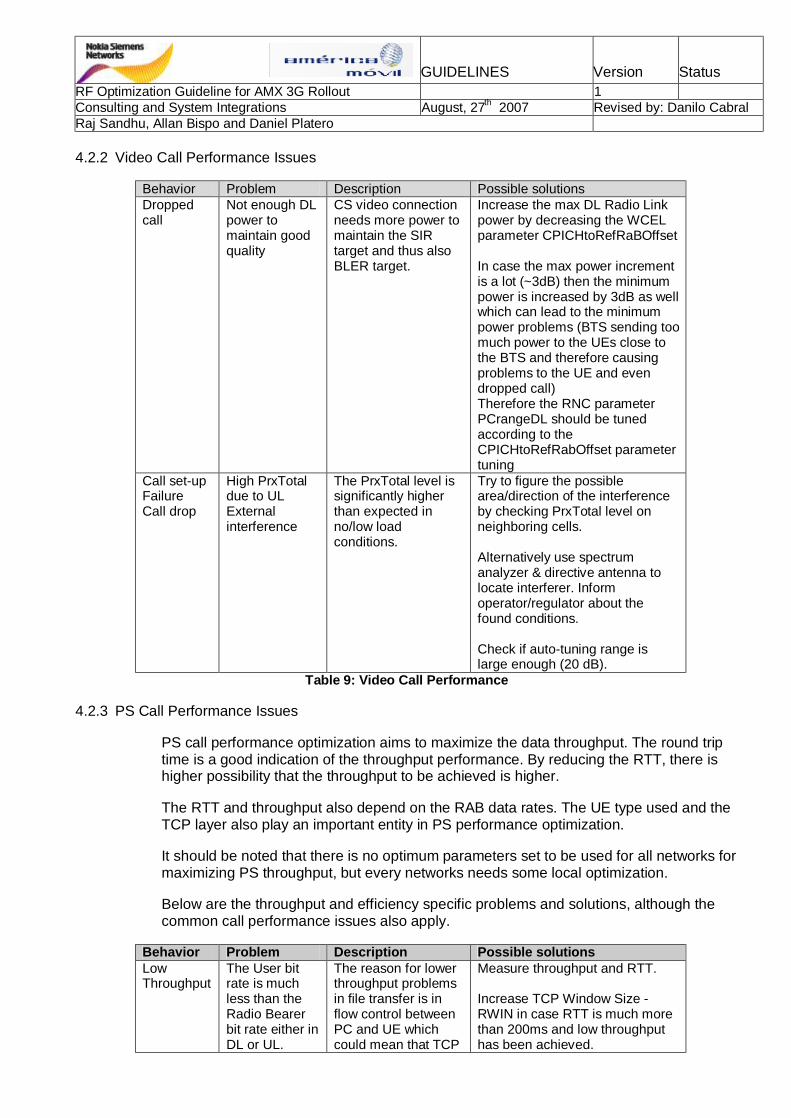
GUIDELINES Version Status RF Optimization Guideline for AMX 3G Rollout 1 Consulting and System Integrations August, 27th 2007 Revised by: Danilo Cabral Raj Sandhu, Allan Bispo and Daniel Platero 4.2.2 Video Call Performance Issues
Behavior Problem Description Possible solutions Dropped call
Not enough DL power to maintain good quality
CS video connection needs more power to maintain the SIR target and thus also BLER target.
Increase the max DL Radio Link power by decreasing the WCEL parameter CPICHtoRefRaBOffset In case the max power increment is a lot (~3dB) then the minimum power is increased by 3dB as well which can lead to the minimum power problems (BTS sending too much power to the UEs close to the BTS and therefore causing problems to the UE and even dropped call) Therefore the RNC parameter PCrangeDL should be tuned according to the CPICHtoRefRabOffset parameter tuning
Call set-up Failure Call drop
High PrxTotal due to UL External interference
The PrxTotal level is significantly higher than expected in no/low load conditions.
Try to figure the possible area/direction of the interference by checking PrxTotal level on neighboring cells. Alternatively use spectrum analyzer & directive antenna to locate interferer. Inform operator/regulator about the found conditions. Check if auto-tuning range is large enough (20 dB).
Table 9: Video Call Performance
4.2.3 PS Call Performance Issues
PS call performance optimization aims to maximize the data throughput. The round trip time is a good indication of the throughput performance. By reducing the RTT, there is higher possibility that the throughput to be achieved is higher.
The RTT and throughput also depend on the RAB data rates. The UE type used and the TCP layer also play an important entity in PS performance optimization.
It should be noted that there is no optimum parameters set to be used for all networks for maximizing PS throughput, but every networks needs some local optimization.
Below are the throughput and efficiency specific problems and solutions, although the common call performance issues also apply.
Behavior Problem Description Possible solutions Low Throughput
The User bit rate is much less than the Radio Bearer bit rate either in DL or UL.
The reason for lower throughput problems in file transfer is in flow control between PC and UE which could mean that TCP
Measure throughput and RTT. Increase TCP Window Size - RWIN in case RTT is much more than 200ms and low throughput has been achieved.
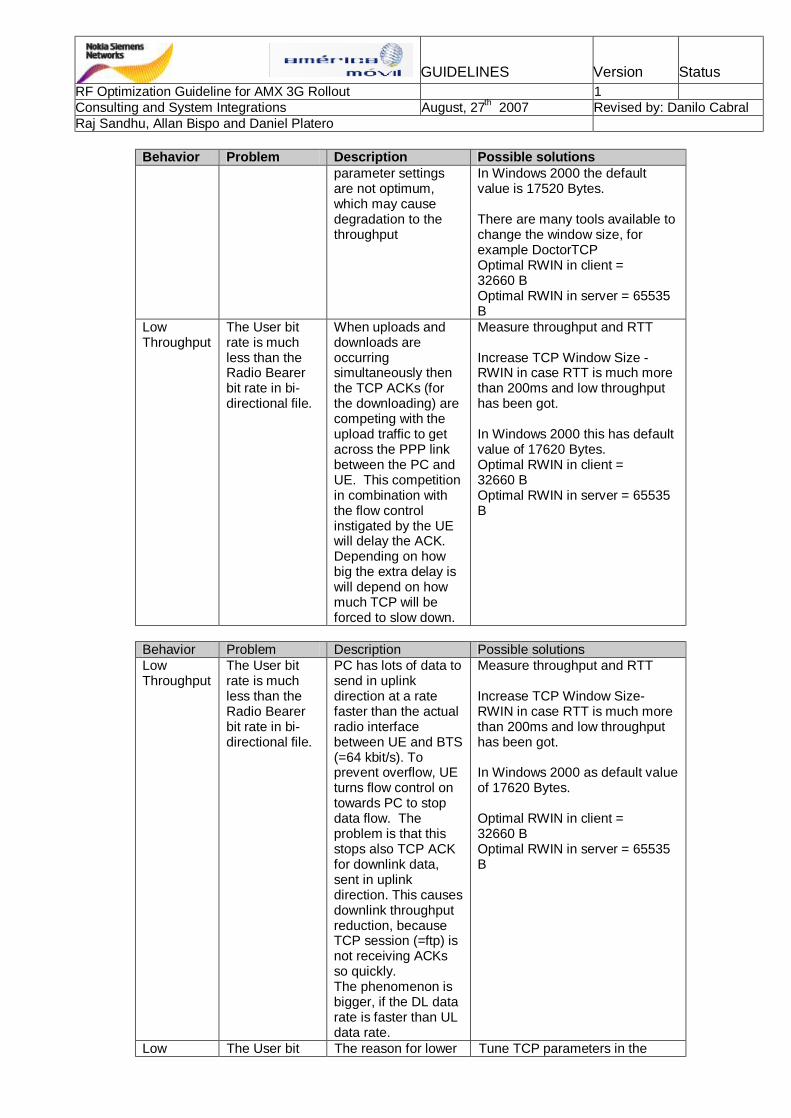
GUIDELINES Version Status RF Optimization Guideline for AMX 3G Rollout 1 Consulting and System Integrations August, 27th 2007 Revised by: Danilo Cabral Raj Sandhu, Allan Bispo and Daniel Platero
Behavior Problem Description Possible solutions parameter settings are not optimum, which may cause degradation to the throughput
In Windows 2000 the default value is 17520 Bytes. There are many tools available to change the window size, for example DoctorTCP Optimal RWIN in client = 32660 B Optimal RWIN in server = 65535 B
Low Throughput
The User bit rate is much less than the Radio Bearer bit rate in bi-directional file.
When uploads and downloads are occurring simultaneously then the TCP ACKs (for the downloading) are competing with the upload traffic to get across the PPP link between the PC and UE. This competition in combination with the flow control instigated by the UE will delay the ACK. Depending on how big the extra delay is will depend on how much TCP will be forced to slow down.
Measure throughput and RTT Increase TCP Window Size - RWIN in case RTT is much more than 200ms and low throughput has been got. In Windows 2000 this has default value of 17620 Bytes. Optimal RWIN in client = 32660 B Optimal RWIN in server = 65535 B
Behavior Problem Description Possible solutions Low Throughput
The User bit rate is much less than the Radio Bearer bit rate in bi-directional file.
PC has lots of data to send in uplink direction at a rate faster than the actual radio interface between UE and BTS (=64 kbit/s). To prevent overflow, UE turns flow control on towards PC to stop data flow. The problem is that this stops also TCP ACK for downlink data, sent in uplink direction. This causes downlink throughput reduction, because TCP session (=ftp) is not receiving ACKs so quickly. The phenomenon is bigger, if the DL data rate is faster than UL data rate.
Measure throughput and RTT Increase TCP Window Size- RWIN in case RTT is much more than 200ms and low throughput has been got. In Windows 2000 as default value of 17620 Bytes. Optimal RWIN in client = 32660 B Optimal RWIN in server = 65535 B
Low The User bit The reason for lower Tune TCP parameters in the

GUIDELINES Version Status RF Optimization Guideline for AMX 3G Rollout 1 Consulting and System Integrations August, 27th 2007 Revised by: Danilo Cabral Raj Sandhu, Allan Bispo and Daniel Platero
Throughput rate is much less than the Radio Bearer bit rate either in DL or UL.
throughput problems in file transfer could be wrong parameters in server.
Server: MSS = Maximum Segment Size (in bytes) = TCP payload MTU = Maximum Transmission Unit (in bytes) = IP packet size MTU = MSS + TCP Header (20 bytes) + IP Header (20 bytes) Optimal MTU in client and server =1460 B
Low Throughput
The User bit rate is much less than the Radio Bearer bit rate in bi-directional file
There is Problem in FTP server
Change the FTP server. In general FTP server should be located right after the GGSN (not behind the public internet) so it would be recommended to have test FTP server located right to the GGSN. Make several FTP sessions instead of one to increase the throughput. Try with stream
Behavior Problem Description Possible solutions Low Throughput
The User bit rate is much less than the Radio Bearer bit rate in bi-directional file
Bluetooth connection has been used between UE and PC.
Use USB connection instead of Bluetooth.
Low Efficiency
BTS Power resources are wasted in case high bit rates are used but throughput is low.
Dynamic Link Optimization (DyLo) parameters are not set optimum.
Adjust the WCEL parameter PtxDLAbsMax to trigger DyLo earlier. It’s recommended and already configured as 3dB lower then the maximum NodeB power.
Table 10: PS Call Performance
4.2.4 IRAT performance
Behavior Problem Description Possible solutions Call drop Failure to
decode BSIC before the call drop.
CM starts too late Set higher ISHO thresholds: FMCS: HHoEcNoThreshold, HHoRSCPThreshold. ADJG: AdjgTxPwrMaxRACH, AdjgTxPwrMaxTCH.
Call drop Failure to decode BSIC before the call drop.
BSIC verification takes too much time.
Set smaller measurement time for GSM cells, FMCG: Maximum measurement period, Minimum measurement interval,
Table 11: IRAT Performance

GUIDELINES Version Status RF Optimization Guideline for AMX 3G Rollout 1 Consulting and System Integrations August, 27th 2007 Revised by: Danilo Cabral Raj Sandhu, Allan Bispo and Daniel Platero 4.2.5 OSS KPI’s optimization
In this phase the users in the network are generating calls triggering the RNC counters than the statistical data can be used. Using these counters we can create some KPI’s formulas which helps us to identify and take the more accurate action to fix:
V Accessibility problems;
V Retainability problems;
V Availability and Usage related problems;
V Mobility problems;
V Integrity problems.
Below you can find the main KPI’s defined by NSN:
4.2.5.1 Accessibility related problems
4.2.5.1.1 Call Setup Success Ratio (different applications)
4.2.5.1.2 RRC Setup and Access Complete Ratio (NW and User)
4.2.5.1.3 RAB Setup and Access Complete Ratio (different bearers)
4.2.5.1.4 HSDPA Accessibility Ratio (different bearers)
4.2.5.1.5 AAL2 Resource Accessibility Ratio
4.2.5.2 Retainability related problems
4.2.5.2.1 Call Success Ratio (different applications)
4.2.5.2.2 RRC Success Ratio (NW and User)
4.2.5.2.3 RAB Success Ratio (different bearers)

GUIDELINES Version Status RF Optimization Guideline for AMX 3G Rollout 1 Consulting and System Integrations August, 27th 2007 Revised by: Danilo Cabral Raj Sandhu, Allan Bispo and Daniel Platero 4.2.5.3 Availability and Usage related problems (Capacity optimization)
4.2.5.3.1 Noise Floor
4.2.5.3.2 Cell Availability
4.2.5.3.3 Channel Element Utilization (UL and DL)
4.2.5.3.4 Logical Interfaces Availability (Iu and Iur)
4.2.5.3.5 Iub capacity for HSDPA
4.2.5.3.6 Average Load (dBm) (UL and DL)
4.2.5.3.7 Average Throughput (RACH, FACH, PCH and SAB)
4.2.5.3.8 Allocated Dedicated Channel Capacity (UL and DL)
4.2.5.3.9 Used Bandwidth (different applications)
4.2.5.3.10 Net Throughput (different Bearers)
4.2.5.3.11 ATM Throughput
4.2.5.4 Mobility related problems
4.2.5.4.1 Soft Handover Success Rate
4.2.5.4.2 Soft Handover Overhead
4.2.5.4.3 Intra System Hard Handover Success Ratio
4.2.5.4.4 HSDPA Serving Cell Change Success Ratio
4.2.5.4.5 Inter System Hard Handover Success Ratio
4.2.5.5 Integrity related problems
4.2.5.5.1 NRT Retransmission Ratio
4.2.5.5.2 Block Error Ratio (BLER)
5. DATABASE PARAMETERS CHECK AND OPTIMIZATION
This part of the document shows the main parameters for optimization purpose in the initial tuning project phase complementing the information from RANPAR and RANOP1 courses, which should be used to help understanding the basic of parameters description and correct values usage. It’s also recommended to check the last release of the WCDMA RAS_XX Parameter Dictionary from system documentation. This document is based on RAS05.1.

GUIDELINES Version Status RF Optimization Guideline for AMX 3G Rollout 1 Consulting and System Integrations August, 27th 2007 Revised by: Danilo Cabral Raj Sandhu, Allan Bispo and Daniel Platero
It has to be created a database change control procedure, including that, for any parameter change, it has to be approved, documented and the effect verified afterwards.
The change approval has to follows specific rules where, depending on the parameter, the permission has to be asked to different levels. The levels are Network Planning Engineer, Network Planning Responsible and Parameter Experts.
Any parameter not described here should not be changed, and always follows the recommended ones.
5.1 Parameter groups in RNC Database
All the parameters in the database are organized in groups. There are some specific effects in changing parameters regarding this kind of organization.
The groups and the effects are described bellow:
o RNC: these parameters controls all procedures in an RNC level, which means that all cells, users, calls, NodeBs, etc. will be affected by change these kind of parameter.
o COCO: these parameters refer to Connection Configuration in the RNC.
o WANE and WGS: these parameters are related to IMSI based HO.
o WLCSE and WSMLC: these parameters are related to Location Based Services.
o WBTS: these parameters are related to the NodeB configuration. Changing parameters in this group will affect all WCEL’s related to this WBTS.
o WCEL: these parameters are related to the cells configuration in the NodeB.
o FMCS, FMCI and FMCG: these parameters are related to Frequency Measurements for Intra-System, Inter-Frequency and Inter-RAT (GSM) Handovers respectively. It configures the UE to how /when do the measurements for RNC HO decision. These parameters are sent to UE via BCCH SIB messages and DCH Measurement Control Messages. FMCxs objects are created in the RNC and then associated to the WCELs, which means that changing FMCxs parameters will affect all WCEL’s associated to them. There are 8 FMCxs defaults values created in the database depending on service type and NodeB output power: RT_40W, NRT_40W, HSDPA_40W, RT_HSDPA_40W, RT_20W, NRT_20W, HSDPA_20W and RT_HSDPA_20W. It’s possible to created new FMCxs, and the parameters have to be analyzed and approved by the Parameter Experts.
o ADJS, ADJI and ADJG: these are the neighbour relations between the NodeB cells for Intra-System Handovers, Inter-Frequency Handovers and Inter-RAT Handovers (GSM) respectively.
o HOPS, HOPI and HOPG: these parameters are related to Handover Paths. They are used for configuring the UE for Cell Reselection procedures and used by RNC for Handover decisions for Intra-System, Inter-Frequency and Inter-RAT (GSM) neighbours respectively. These parameters are sent to UE via BCCH SIB messages. HOPxs objects are created in the RNC and then associated to the ADJxs, which means that changing HOPxs parameters will affect all ADJxs associated to them. There are 4 HOPxs defaults values created in the database depending on service type:

GUIDELINES Version Status RF Optimization Guideline for AMX 3G Rollout 1 Consulting and System Integrations August, 27th 2007 Revised by: Danilo Cabral Raj Sandhu, Allan Bispo and Daniel Platero
RT, NRT, HSDPA and RT_HSDPA. It’s possible to created new HOPxs, and the parameters have to be analyzed and approved by the Parameter Experts.
5.2 Consistency Check
The first activity in parameter optimization is to check if the configured parameters met the default and recommended ones for the project. For AMX Projects there are 2 default values to use: one for 20W NodeB and another to 40W NodeB.
5.3 Parameter optimization
5.3.1 RNC Parameters
Any RNC parameter change has to be analyzed and approved by the Parameters Experts.
The parameters below were configured in the best way to get our Acceptance and could only be optimized depending on Parameter Experts analysis and approval:
o ActivationTimeOffset: also known as ATO, it’s configured as 700ms in our recommendation. It gave us better UE and KPI performance (RAB Acc AMR) but longer Call Setup Time. Configuring to 300ms would decrease the setup time by 400ms for each leg, but declines the Call Setup Success Rate of 0.2-0.4%. The reduction of this ATO value does not necessarily mean a decline to Call Setup Success Rate. This is dependent on UE performance. The effect of decreasing the ATO is that it reduces the delay in the activation time in RAB setup message for CS call and the RAB reconfiguration message for PS call. In some UE, a small value of 300ms for ATO is insufficient to setup the RAB and hence results in call setup failure. So in case this parameter is changed the effects to call setup time and call setup success rate has to be observed from counters.
o StandAloneDCCHBitRate: configures the signaling radio bearer type (SRB), it’s configured as 13.6 in our recommendation. SRB 13.6 gives approximately 1-2 sec faster call setup time and gives 30% faster GPRS attach time and PDP activation time than SRB 3.4, but also requires more capacity on Iub during the call setup phase.
5.3.2 COCO Parameters
Not described in this document, and should not be changed without the Parameters Experts analysis and approval.
5.3.3 WANE and WGS Parameters
IMSI based HO is not active and depends on the operator strategy. These parameters are not described in this document, and should not be changed without the Parameters Experts analysis and approval.
GUIDELINES Version Status RF Optimization Guideline for AMX 3G Rollout 1 Consulting and System Integrations August, 27th 2007 Revised by: Danilo Cabral Raj Sandhu, Allan Bispo and Daniel Platero 5.3.4 WLCSE and WSMLC Parameters
Not described in this document, and should not be changed without the Parameters Experts analysis and approval.
5.3.5 FMCI, HOPI and ADJI Parameters
In the beginning all networks will have only one carrier, so all the parameters related to Inter-Frequency configuration are not discussed here. In the case of going to the second carrier the recommended parameter has to be used, and also should consider the optimization done for Inter-RAT (GSM) Handovers. Any change in recommended parameter has to be approved by Parameter Experts. In the ADJI neighbours relations it has always to be checked if the correct HOPI is configured.
5.3.6 WBTS Parameters
All the parameters values were configured based on previous experiences and could be optimized depending on Parameter Experts analysis and approval.
5.3.7 WCEL
It’s necessary to check if the correct FMCxs are configured and also and if any special FMCxs created is being correctly used.
The parameters below were configured based on previous experiences and recommended values:
o Qhyst2: this parameter defines the Cell Reselection Histeresys, and in our database recommendation is configured to 2dB to avoid ping-pong effect. To accelerate cell reselection processes for high mobility area the value 0 dB can be used, and for WCDMA cells near different LA 4dB can be used to avoid ping-pong effect and also for low mobility UEs. Check the parameter AdjsQoffset2 (HOPS) if it’s not compensation this histeresys. It should be optimized after Drive testing by the Network Planning Engineers.
o QqualMin: The minimum required quality level in the cell (Ec/No) for UE cell reselection and it’s configured to -18dB. This parameter has also impact to initial cell selection if it’s set with low value. With high value unnecessary cell selection can start. This parameter is sent to UE over the BCCH SIB messages. This parameter change has to be approved by the Network Planner Group Responsible.
o QrxlevMin: The minimum required RX level in the cell (RSCP) for UE cell reselection and it’s configured to -115dBm. This parameter is also used to create value for the parameter DeltaQrxlevmin to be sent in SIB3/4 when the used value is < -115dBm. This parameter is sent to UE over the BCCH SIB messages. This parameter change has to be approved by the Network Planner Group Responsible.
o Treselection: This parameter configures the cell reselection triggering time, and its configured equal to 2s. This time helps avoid too many cell reselections between cells and hence LA/RA updates when crossing LA/RA border avoiding ping-pong
GUIDELINES Version Status RF Optimization Guideline for AMX 3G Rollout 1 Consulting and System Integrations August, 27th 2007 Revised by: Danilo Cabral Raj Sandhu, Allan Bispo and Daniel Platero
effect. Thus there are less signaling and less call failures at LA/RA border due to LA/RA update. Configuring equal to 0s could be used in areas having high mobility like in highways, accelerating the cell reselection process. This parameter change has to be approved by the Network Planner Group Responsible.
o Sintrasearch: The threshold for intra-frequency measurements, and its configured equal to 10dB. This parameter is used by the UE to calculate the threshold (CPICH Ec/No) to start intra frequency (SHO) measurements (Sintrasearch above QqualMin value = -18 +10 = -8dB). This parameter change has to be approved by the Network Planner Group Responsible.
o PtxPrimaryCPICH: This is the transmission power of the primary common pilot channel and it’s defined as 10% of the total NodeB Tx Power. For 20W NodeB is configured as 33dBm, and for 40W NodeB is configured as 36dBm. The P-CPICH physical channel carries the common pilots of the cell, which is defined in the cell setup. The transmission power of the CPICH physical channel defines the actual cell size, so for optimization purpose like solving Pilot Pollution problems and CPICH Imbalance problems this parameter could be changed 0-3dB maximum range. This parameter is used, for example, for neighbour measurements, critical for the network performance. All other control and signaling channels transmission power parameters are related to PtxPrimaryCPICH. This parameter change has to be approved by the Network Planner Group Responsible.
o CPICHtoRefRaBOffset: The parameter defines the offset of the primary CPICH transmission power, and the maximum DL transmission power of the reference service channel in DL power allocation. The maximum transmission power of the reference service is calculated (in dBm) by subtracting the value of the parameter from the transmission power of the primary CPICH. It’s configured to 0dB.
o CableLoss: This parameter defines the difference in DL link loss in relation to UL link loss when the mast head amplifier (MHA or TMA) is used. Its value is subtracted from the antenna connector power value of the primary CPICH read from the management parameter PtxPrimaryCPICH, while producing the CPICH power value for the needs of the UL DPCH open loop power control to calculate the initial PRACH preamble transmission power. The feeder loss value can be entered regardless of using or not the MHA. If MHA is not in use, the feeder loss value will be ignored during the UL RSSI calculations. Otherwise it is used together with the MHA gain parameter. The effect of setting this parameter wrongly when MHA is in used is that too much or too little power is allocated to the first PRACH preamble. This parameter change has to be approved by the Network Planner Group Responsible.
5.3.8 FMCS
This parameter change has to be approved by the Network Planner Group Responsible.
The parameters below were configured based on previous experiences and recommended values:
o AdditionWindow: Addition Window determines the relative threshold used by the UE to calculate the reporting range of event 1A, and it’s configured as 4dB. The threshold is either relative to the CPICH Ec/No measurement result of the best active set cell, or to the sum of active set measurement results, depending on the
GUIDELINES Version Status RF Optimization Guideline for AMX 3G Rollout 1 Consulting and System Integrations August, 27th 2007 Revised by: Danilo Cabral Raj Sandhu, Allan Bispo and Daniel Platero
value of the parameter Active Set Weighting Coefficient. When the CPICH Ec/No measurement result of a monitored cell enters the reporting range, the UE transmits a Measurement Report to the RNC. When the RNC decides to add to the active set the monitored cell, it sends the Active Set Update message to the UE. The bigger the addition window the wider the SHO area and the SHO overhead. If it is set too high, unnecessary SHO branches will be added. This increases the signaling load and for PS connection could reduce the DL throughput. If it is set too low, SHO overhead would be too small and this in turn reduces the UL macro-diversity gain. As a result the UL throughput could suffer. Also if the additional window and the drop windows are set too small, ping pong effect can be observed. This would also cause an increasing in signaling load.
o Addition time: When a monitored cell enters the reporting range (addition window), the cell must continuously stay within the reporting range for a given period of time before the UE can send a Measurement Report to the RNC in order to add the cell into the active set (event 1A). The length of this period is controlled by the parameter Addition Time and it’s configured as 100ms. Setting this parameter too lower value will make the UE send the Measurement Report Message faster, sometimes due to quick changes in radio conditions, increasing the SHO overhead. Setting this parameter too high value means more delays in the Measurement Report message and failures could happen due to high interference meaning that pilots with good EcNo are not in UE active set.
o DropWindow: Drop Window determines the relative threshold which is used by the UE to calculate the reporting range of event 1B, and it’s configured as 6dB. The threshold is either relative to the CPICH Ec/No measurement result of the best active set cell or to the sum of active set measurement results, depending on the value of the parameter Active Set Weighting Coefficient. When the CPICH Ec/No measurement result of an active set cell leaves the reporting range, the UE transmits a Measurement Report to the RNC. When the RNC decides to remove the cell from the active set, it sends the Active Set Update message to the UE. If this is set too high, unnecessary SHO branches will remain in the active set leading to higher SHO overhead. If it is set too low, i.e., too close or equal to addition window, then this will result in a lot of pilots added and removed from the active set causing a high signaling overhead.
o Drop time: When an active set cell leaves the reporting range (drop window), the cell must continuously stay outside the reporting range for a given period of time before the UE can send a Measurement Report to the RNC in order to remove the cell from the active set (event 1B). The length of this period is controlled by the parameter Drop Time and it’s configures as 640ms. Setting this parameter too lower value will make the UE send the Measurement Report Message faster, sometimes due to quick changes in radio conditions and the UE will suffer with higher interference. Setting this parameter too high value means more delays in the Measurement Report message and unnecessary SHO overhead, meaning pilots in UE’s Active Set with bad EcNo.
o ReplacementWindow: When the number of cells in the active set has reached the maximum specified by the parameter MaxActiveSetSize (always=3) and a monitored cell becomes better than an active set cell, the UE transmits a Measurement Report to the RNC in order to replace the active cell with the monitored cell (event 1C).The parameter Replacement Window it’s configured equal to 2dB and determines the margin by which the CPICH Ec/No measurement result of the monitored cell must exceed the CPICH Ec/No measurement result of the an active set cell before the UE

GUIDELINES Version Status RF Optimization Guideline for AMX 3G Rollout 1 Consulting and System Integrations August, 27th 2007 Revised by: Danilo Cabral Raj Sandhu, Allan Bispo and Daniel Platero
can send the event 1C triggered Measurement Report to the RNC. If this is set too high, worst pilots will remain in the active set leading to higher interference. If it is set too low, then this will result in a lot of pilots added and removed from the active set causing a high signaling overhead and ping-pong effect.
o Replacement Time: When the number of cells in the active set has reached the maximum, and a monitored cell enters the reporting range (replacement window), the monitored cell must continuously stay within the reporting range for a given period of time before the UE can send a Measurement Report to the RNC in order to replace an active set cell with the monitored cell (event 1C). The length of this period is controlled by the parameter Replacement Time and it’s configured as 100ms. Setting this parameter too lower value will make the UE send the Measurement Report Message faster, sometimes due to quick changes in radio conditions and the UE will suffer with higher interference. Setting this parameter too high value means more delays in the Measurement Report message and also more interference, meaning pilots in UE’s Active Set with bad EcNo while pilots with good EcNo are not in UE’s Active Set.
o HHoEcNoThreshold: If the inter-frequency or inter-RAT (GSM) handover caused by low measured absolute CPICH Ec/No is enabled, the UE transmits an event 1F triggered measurement report to the RNC when the CPICH Ec/No measurement result of an active set cell becomes worse than or equal to an absolute CPICH Ec/No threshold. It’s configured as -12dB. The parameter HHoEcNoThreshold determines the absolute CPICH Ec/No threshold which is used by the UE to trigger the reporting event 1F. When the measured CPICH Ec/No of all active set cells has become worse than or equal to the threshold in question, the RNC starts inter-frequency or inter-RAT (GSM) measurements in compressed mode for the purpose of hard handover.
o HHoRscpThreshold: If the inter-frequency or inter-RAT (GSM) handover caused by a low measured CPICH RSCP is enabled, the UE transmits an event 1F triggered measurement report to the RNC when the CPICH RSCP measurement result of an active set cell becomes worse than or equal to an absolute CPICH RSCP threshold. It’s configured as -105dBm. The parameter HHoRscpThreshold determines the absolute CPICH RSCP threshold which is used by the UE to trigger the reporting event 1F. When the measured CPICH RSCP of all active set cells has become worse than or equal to the threshold in question, the RNC starts inter-frequency or inter-RAT (GSM) measurements in compressed mode for the purpose of hard handover.
5.3.9 FMCG
Any parameter change has to be approved by the Network Planner Group Responsible.
All the parameters values were configured based on previous experiences and recommended values.
5.3.10 HOPS
This parameter change has to be approved by the Network Planner Group Responsible.

GUIDELINES Version Status RF Optimization Guideline for AMX 3G Rollout 1 Consulting and System Integrations August, 27th 2007 Revised by: Danilo Cabral Raj Sandhu, Allan Bispo and Daniel Platero
The parameters below were configured based on previous experiences and recommended values:
o AdjsQoffset1: This parameter is used in the cell re-selection and ranking between WCDMA cells. It’s configured equal to 0dB. The value of this parameter is subtracted from the measured CPICH RSCP of the neighbour cell before the UE compares the quality measure with the cell re-selection/ranking criteria.
o AdjsQoffset2: This parameter is used in the cell re-selection and ranking between WCDMA cells. It’s configured equal to 0 dB. The value of this parameter is subtracted from the measured CPICH Ec/No of the neighbour cell before the UE compares the quality measure with the cell re-selection/ranking criteria.
o AdjsQqualMin: Determines the minimum required CPICH Ec/No level which must be exceeded by the measurement result of the neighboring cell before the cell re-selection becomes possible. It’s configured as -18dB.
o AdjsQrxlevMin: Determines the minimum required CPICH RSCP level which must be exceeded by the measurement result of the neighboring cell before the cell re-selection becomes possible. It’s configure as -115dBm.
5.3.11 HOPG
This parameter change has to be approved by the Network Planner Group Responsible.
The parameters below were configured based on previous experiences and recommended values:
o AdjgRxLevMinHO: This parameter determines the minimum required GSM RSSI level which the averaged RSSI value of the GSM neighbour cell must exceed before the coverage (or quality) reason handover to GSM is possible. It’s configured as -95dBm.
o AdjgQrxlevMin: Determines the minimum required RSSI level which the measurement result of the GSM neighbour cell must exceed before the cell re-selection becomes possible. It’s configured as -101dBm.
o AdjgQoffset1: This parameter is used in the cell re-selection and ranking between WCDMA and GSM cells. The value of this parameter is subtracted from the measured GSM carrier RSSI of the neighboring cell before the UE compares the quality measure with the cell re-selection/ ranking criteria. It’s configured equal to 0dB.
5.3.12 ADJS
It’s necessary to check the parameters RtHopsIdentifier, NrtHopsIdentifier, HSDPAHopsIdentifier and RTWithHSDPAHopsIdentifier if the correct HOPS are used and if any special HOPS created is being correctly used.
The parameters below were configured based on previous experiences and recommended values:
GUIDELINES Version Status RF Optimization Guideline for AMX 3G Rollout 1 Consulting and System Integrations August, 27th 2007 Revised by: Danilo Cabral Raj Sandhu, Allan Bispo and Daniel Platero
o AdjsCPICHTxPwr: Check if it's correctly configured for all Neighbours mapping from WCEL PtxPrimaryCPICH parameter. Recommendation: PtxPrimaryCPICH within neighbours should be within 0-3 dB range to avoid CPICH Imbalance Problems. For networks using mixed 20W and 40W NodeB’s configuration and/or Pico/Micro/Macro strategy, CPICH Imbalance problems should be analyzed. This parameter change has to be approved by the Network Planner Group Responsible.
o AdjsEcNoOffset: The CPICH Ec/No Offset determines an offset value, which the UE adds to the CPICH Ec/No measurement result of the neighboring cell before it compares the Ec/No value with the reporting criteria. It should be optimized after Drive testing by the Network Planning Engineers.
5.3.13 ADJG
It's recommended to check if the GSM parameters values are correct and equal to the actual used in the 2G network.
It’s necessary to check if the correct HOPG are used. If any HOPG different than the recommended ones is used it's also necessary to check the parameters RtHopgIdentifier and NrtHopgIdentifier.
All the parameters values were configured based on previous experiences and recommended values.
Any parameter change has to be approved by the Network Planner Group Responsible.

GUIDELINES Version Status RF Optimization Guideline for AMX 3G Rollout 1 Consulting and System Integrations August, 27th 2007 Revised by: Danilo Cabral Raj Sandhu, Allan Bispo and Daniel Platero 6. APPENDIX
6.1 KPI Targets
The table below gives a summary of the AMX drive-test KPIs and its targets for cluster and project acceptance.
KPI CLUSTER PROJECTVoice CSSR >=97% >98%Inter RAT HO Succ Rate (3G to 2G) >=97% >98%Inter RAT HO Succ Rate (2G to 3G) >=97% >98%Voice Call Drop Rate <=2% <=2%Voice Call BLER (UL / DL) <=2% <=2%Call Setup Time - TBDCS Video CSSR >= 97% >98%CS Video CS Elapsed Time < 20 sec >95% >95%CS Video Call Drop Rate <=2% <=2%CS Video Call BLER (UL / DL) <=2% <=2%RTT / WCDMA <150ms @ 90% -Ping test (32 Bytes) <160ms @ 95% -DL WCDMA User Throughput avg > 150 kbps avg > 150 kbpsUL WCDMA User Throughput avg > 64 kbps avg > 64 kbpsPS RAB Establishment Succ >97% >98%PS RAB Drop <2% <2%RTT / HSxPA <80ms @ 90% -Ping test (32 Bytes) <70 ms @95% -
avg > 1.2 Mbps avg > 1.2 Mbps>70% Peak @ 30% >70% Peak @ 30%avg > 150 kbps avg > 150 kbps>70% Peak @ 30% >70% Peak @ 30%
AMR Voice CSSR during HSPA Call >97% >98%AMR Voice CSSR during PS 64/64 call >97% >98%HSPA CSSR during AMR Voice Call >98% >98%PS 64/64 CSSR during AMR Voice call >97% >98%SMS Success Rate >95% >95%SMS Delivery Time < 40s >90% >90%WAP Failure Rate <5% <5%WAP Session Estab. Elapsed Time < 13s >90% >90%MMS Success Rate >95% >95%MMS Delivery Time < 40s >90% >90%Intra SGSN Routing Area Update Time <10s <10s
Voice
UDI
PS R99
HSxPA
MULTI-RAB
OTHER SERVICES
DL HSDPA User Throughput
DL HSUPA User Throughput
Table 12: AMX Drive-test KPIs

GUIDELINES Version Status RF Optimization Guideline for AMX 3G Rollout 1 Consulting and System Integrations August, 27th 2007 Revised by: Danilo Cabral Raj Sandhu, Allan Bispo and Daniel Platero 6.2 Drive-test KPI Measurements – Detailing of Layer 3 Messages
This topic describes in details the KPIs for drive-test that are basically based on the layer 3 messages. Its structure is divided as below:
§ Measuring – describes how the measuring will be carried out;
§ Triggers – shows in which step of the signaling flow the start and end of the measuring are;
§ Formula – it is a generic statistics to evaluate the KPIs;
§ Signaling Flow – it is the proposed flow for the KPIs;
§ NSN comments – recommendations and considerations that are very important to keep the optimization process and acceptance procedure more coherent with the terms of the contract.
In addition, the KPIs are grouped per type of bearer: CS voice, CS UDI video, PS release 99 data, PS HSDPA data, Multi-RAB, Other services and routing area update.
There some messages which are commum for more than one KPI. In this case the triggers and signalling will be the same, in other cases the measuring will be the same. Sometimes the same flow will be employed for more than one KPI as well.
In the following pages all KPIs for drive-test related to the AMX acceptance will be detailed.

GUIDELINES Version Status RF Optimization Guideline for AMX 3G Rollout 1 Consulting and System Integrations August, 27th 2007 Revised by: Danilo Cabral Raj Sandhu, Allan Bispo and Daniel Platero 6.2.1 Drive-test KPI Measurements – CS Voice Service
6.2.1.1 CS Voice Service: Voice Call Setup Success Rate
6.2.1.2 CS Voice Service: Voice Call Setup Time
VOICE CALL SETUP SUCCESS RATE (%): Voice CSSR is the ratio between successful CS voice call establishments compared to the overall number of voice call establishment attempts.
Description VOICE CALL SETUP TIME (sec.): during a mobile originating voice call (MOC), the call setup time is the interval between the submission of the RRC message CONNECTION REQUEST and the reception of the layer 3 message CC: ALERTING at a UE.
Measuring
- 3G to PSTN Voice call
- Originating side located in the vehicle, terminating side (an answer machine) located in the customer MSC of the test area
- A Party calls B Party and call held for 60 seconds
- A Party Terminates
- Time between calls = 10 seconds
Trigger
Call setup trigger point:
Party A’s UE sends 1st ‘RRC Connection Request’
Call setup completion trigger point:
Party A’s UE receives Layer3 message ‘CC: ALERTING’
Successful completion if:
Evaluate the CSSR (from RRC Conn Request to CC: Alerting)
Voice Call Set-up Success Rate (%) =
(# CC Alerting / # first RRC Connection Request)*100
Formulas Voice Call Set-up Time (sec.) =
CC Alerting_time – RRC Connection Request_time
Note: samples with problems or delays due to non NSN equipments should be excluded of the calculation.

GUIDELINES Version Status RF Optimization Guideline for AMX 3G Rollout 1 Consulting and System Integrations August, 27th 2007 Revised by: Danilo Cabral Raj Sandhu, Allan Bispo and Daniel Platero 6.2.1.3 CS Voice Service: Voice Call Drop Rate
VOICE CALL DROP RATE (%): the call will be dropped in case RRC connection release (not normal release) message has been sent from RNC to UE. So, voice CDR is the ratio between abnormally released voice calls and the overall number of established voice calls.
Measuring
- 3G to PSTN Voice call
- Originating side located in the vehicle, terminating side (an answer machine) located in the customer MSC of the test area - A Party calls B Party and call held for 60 seconds - A Party Terminates
- Time between calls = 10 seconds
Trigger
Call trigger point:
3G UE receives ‘RRC: Downlink Direct Transfer (CC: Alerting)’
Call setup completion trigger point:
3G UE sends ‘ last RRC Connection Release Complete’
Successful completion if:
60 sec call duration (from RRC Conn Request to RRC Conn Release)
3G UE sends ‘ last RRC Connection Release Complete’
Formula Voice Call Drop Rate (%) = (1 – Call Completion) * 100
Note: samples with problems due to non NSN equipments should be excluded of the calculation.
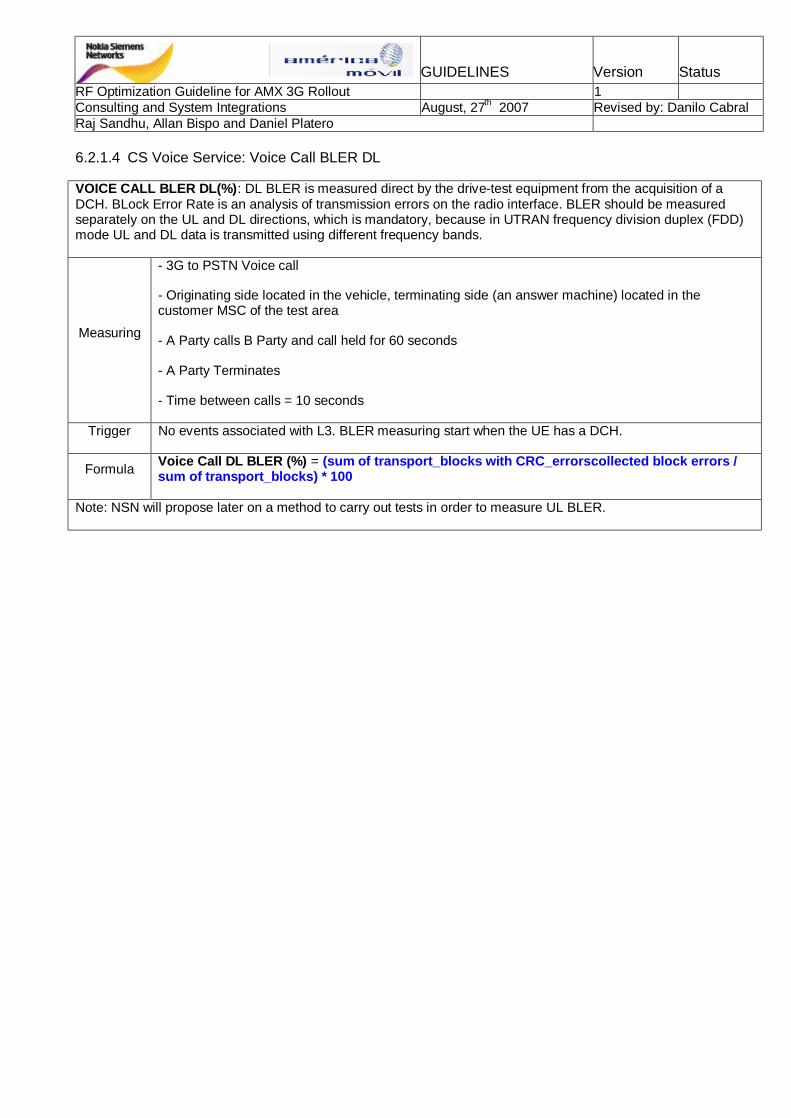
GUIDELINES Version Status RF Optimization Guideline for AMX 3G Rollout 1 Consulting and System Integrations August, 27th 2007 Revised by: Danilo Cabral Raj Sandhu, Allan Bispo and Daniel Platero 6.2.1.4 CS Voice Service: Voice Call BLER DL
VOICE CALL BLER DL(%): DL BLER is measured direct by the drive-test equipment from the acquisition of a DCH. BLock Error Rate is an analysis of transmission errors on the radio interface. BLER should be measured separately on the UL and DL directions, which is mandatory, because in UTRAN frequency division duplex (FDD) mode UL and DL data is transmitted using different frequency bands.
Measuring
- 3G to PSTN Voice call
- Originating side located in the vehicle, terminating side (an answer machine) located in the customer MSC of the test area
- A Party calls B Party and call held for 60 seconds
- A Party Terminates
- Time between calls = 10 seconds
Trigger No events associated with L3. BLER measuring start when the UE has a DCH.
Formula Voice Call DL BLER (%) = (sum of transport_blocks with CRC_errorscollected block errors / sum of transport_blocks) * 100
Note: NSN will propose later on a method to carry out tests in order to measure UL BLER.

GUIDELINES Version Status RF Optimization Guideline for AMX 3G Rollout 1 Consulting and System Integrations August, 27th 2007 Revised by: Danilo Cabral Raj Sandhu, Allan Bispo and Daniel Platero 6.2.1.5 CS Voice Service: Voice IRAT Handover – from 3G to 2G
VOICE IRAT HO SUCCESS RATE 3G – 2G (%): is a measure to indicate how many UMTS to GSM handover procedures have been executed successfully for CS services. The successful IRAT HO 3G–2G procedure on the UE side is a ratio between number of 2G L3 HANDOVER COMPLETE msg from the 2G MSC being received by the UE, and the number of RRC HANDOVER FROM UTRAN msg according to being received by the UE.
Measuring
- AMR continuous call (dual mode) established on the 3G side
- DT car moves toward the 2G network
- IRAT handover
- Ends call in the 2G side
- Repeat cycle.
Trigger
3G to 2G HO start point:
UE dual mode receives ‘RRC: Handover From UTRAN Command’
3G to 2G HO completion trigger point:
UE dual mode sends ‘Handover Complete to 2G BSS’
Successful completion if:
UE dual mode sends ‘Handover Complete to 2G BSS’
Formula
Voice IRAT HO Success Rate 3G – 2G (%) = (# GSM_L3_Handover_Complete / # Handover From UTRAN) * 100
Note: Minimum required GSM RSSI level = -95 dBm

GUIDELINES Version Status RF Optimization Guideline for AMX 3G Rollout 1 Consulting and System Integrations August, 27th 2007 Revised by: Danilo Cabral Raj Sandhu, Allan Bispo and Daniel Platero 6.2.1.6 CS Voice Service: Voice IRAT Handover – from 2G to 3G
VOICE IRAT HO SUCCESS RATE 2G – 3G (%): is a measure to indicate how many GSM to UMTS handover procedures have been executed successfully for CS services. The successful IRAT HO 2G–3G procedure on the UE side is a ratio between number of RRC: Handover to UTRAN Complete msg from the UE to the RNC, and the number of GSM L3 HANDOVER TO UTRAN msg according to being received by the UE.
Measuring
- Voice continuous call (dual mode) established on the 2G side
- DT car moves toward the 3G network
- IRAT handover
- Ends call in the 3G side
- Repeat cycle.
Trigger
2G to 3G HO start point:
UE dual mode receives ‘Handover to UTRAN Command’
2G to 3G HO completion trigger point:
UE dual mode sends ‘Handover to UTRAN Complete to 3G RNS’
Successful completion if:
UE dual mode sends ‘Handover to UTRAN Complete to 3G RNS’
Formula
Voice IRAT HO Success Rate 2G – 3G (%) = (# Handover to UTRAN Complete / # GSM_L3_Handover_to_UTRAN_Command) * 100
Note: It is not a 3G KPI, it is more related to the GSM network.

GUIDELINES Version Status RF Optimization Guideline for AMX 3G Rollout 1 Consulting and System Integrations August, 27th 2007 Revised by: Danilo Cabral Raj Sandhu, Allan Bispo and Daniel Platero 6.2.2 Drive-test KPI Measurements – CS UDI Video Service
6.2.2.1 CS UDI Video Service: Video Call Setup Success Rate
6.2.2.2 CS UDI Video Service: CS Video Call Setup Elapsed Time < 20 seconds
CS VIDEO CALL SETUP SUCCESS RATE (%): Video CSSR is the ratio between successful CS voice call establishments compared to the overall number of voice call establishment attempts.
CS VIDEO CALL SETUP ELAPSED TIME < 20 sec (%): during a mobile originating 3G - 3G video call, the Video CS Elapsed Time is the interval between the submission of the RRC CONNECTION REQUEST msg, and the reception of the L3 msg CC: ALERTING at a UE.
Measuring
- 3G to 3G Video call
- Originating side located in the vehicle
- Terminating side located in office
- A Party calls B Party
- Call held for 60 seconds after app. level has been set up
- A Party Terminates
- Time between calls = 10 seconds
Trigger
Video Call Setup trigger point:
Party A’s UE sends 1st ‘RRC Connection Request’
Video Call Setup completion trigger point:
Party A’s UE receives Layer3 message ‘CC: ALERTING’
Successful completion if:
Evaluate the video CSSR (from RRC Conn Request to CC: Alerting)
Video Call Set-up Success Rate (%) = (# ‘CC: alerting‘/ # ‘RRC Conn Rqst’)*100
Formula Video Call Set-up Elapsed Time (sec.) = (# total CS video calls w/ elapsed time < 20sec) / (# total of video call completed))*100
Note: samples with problems or delays due to non NSN equipments should be excluded of the calculation.

GUIDELINES Version Status RF Optimization Guideline for AMX 3G Rollout 1 Consulting and System Integrations August, 27th 2007 Revised by: Danilo Cabral Raj Sandhu, Allan Bispo and Daniel Platero 6.2.2.3 CS UDI Video Service: CS Video Call Drop Rate
CS VIDEO CALL DROP RATE (%): the call will be dropped in case RRC connection release (not normal release) message has been sent from RNC to UE. So, CS Video CDR is the ratio between abnormally released CS Video calls and the overall number of established CS Video calls.
Measuring
- 3G to 3G Video call
- Originating side located in the vehicle
- Terminating side located in office
- A Party calls B Party
- Call held for 60 seconds after app. level has been set up
- A Party Terminates
- Time between calls = 10 seconds
Trigger
Video call trigger point:
3G UE receives ‘RRC: Downlink Direct Transfer (CC: Alerting)’
Video call setup completion trigger point:
3G UE sends ‘ last RRC Connection Release Complete’
Successful completion if:
60 sec call duration (from RRC Conn Request to RRC Conn Release)
3G UE sends ‘ last RRC Connection Release Complete’
Formula CS Video Call Drop Rate (%) = (1 – Call Completion) * 100
Note: samples with problems due to non NSN equipments should be excluded of the calculation.
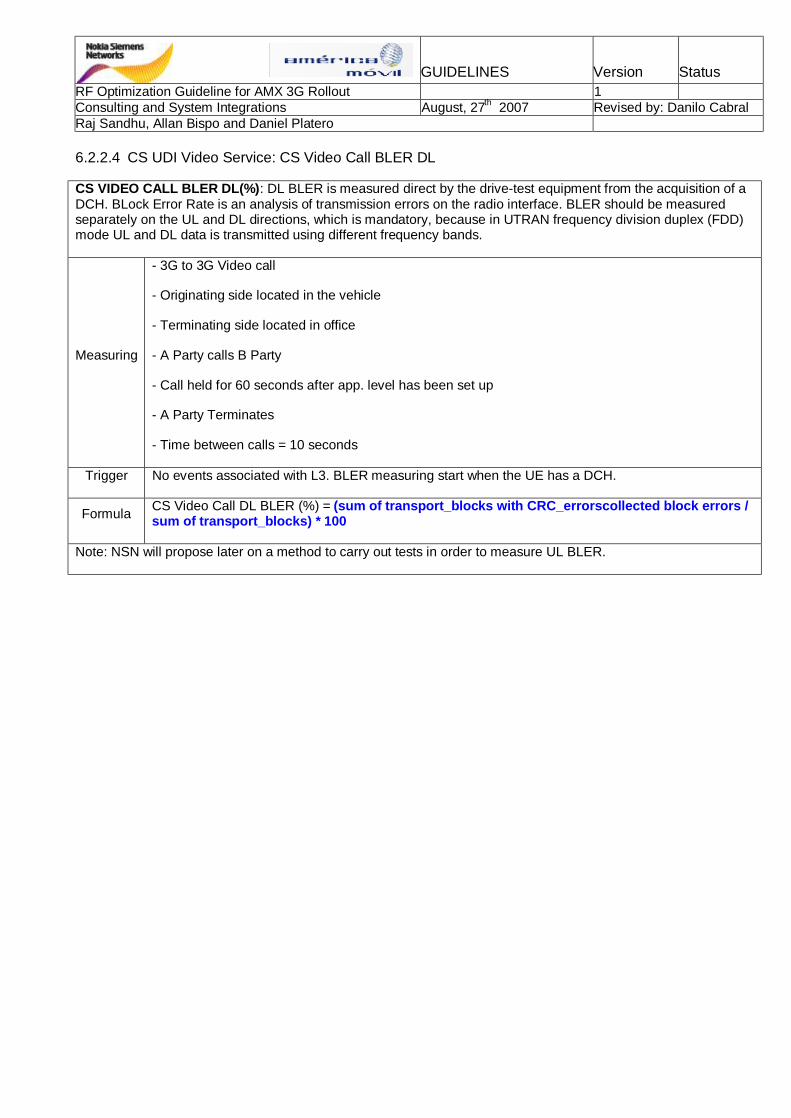
GUIDELINES Version Status RF Optimization Guideline for AMX 3G Rollout 1 Consulting and System Integrations August, 27th 2007 Revised by: Danilo Cabral Raj Sandhu, Allan Bispo and Daniel Platero 6.2.2.4 CS UDI Video Service: CS Video Call BLER DL
CS VIDEO CALL BLER DL(%): DL BLER is measured direct by the drive-test equipment from the acquisition of a DCH. BLock Error Rate is an analysis of transmission errors on the radio interface. BLER should be measured separately on the UL and DL directions, which is mandatory, because in UTRAN frequency division duplex (FDD) mode UL and DL data is transmitted using different frequency bands.
Measuring
- 3G to 3G Video call
- Originating side located in the vehicle
- Terminating side located in office
- A Party calls B Party
- Call held for 60 seconds after app. level has been set up
- A Party Terminates
- Time between calls = 10 seconds
Trigger No events associated with L3. BLER measuring start when the UE has a DCH.
Formula CS Video Call DL BLER (%) = (sum of transport_blocks with CRC_errorscollected block errors / sum of transport_blocks) * 100
Note: NSN will propose later on a method to carry out tests in order to measure UL BLER.

GUIDELINES Version Status RF Optimization Guideline for AMX 3G Rollout 1 Consulting and System Integrations August, 27th 2007 Revised by: Danilo Cabral Raj Sandhu, Allan Bispo and Daniel Platero 6.2.3 Drive-test KPI Measurements – PS Realese 99 Data Service
6.2.3.1 PS Realese 99 Data Service: PS RAB Establishment Success Rate
PS RAB ESTABLISHMENT SUCCESS RATE (%): is the ratio between successful PS PDP CONTEXT ACTIVATION procedures (Activate PDP Context Accept at the UE) compared to the number of PDP CONTEXT ACTIVATION attempts (submission of RRC CONNECTION REQUEST msg by the UE).
Measuring
- Mobile in Car in idle state
- Requests PDP Context Activation
- Connect to a customer FTP server
- Initiate FTP DL of 1Mbyte file using allocated Radio Bearer
- Waits some time (inactivity param. dependent)
- Releases DCH
- Deactivates the PDP Context Activation
- Repeat the cycle 10 times
Trigger
PS PDP activation trigger point:
UE not GPRS attached
UE sends 1st RRC Connection Request
PS PDP activation completion trigger point:
UE receives ‘RRC: Downlink Direct Transfer (SM: Activate PDP Context Accept)’
Successful completion if:
UE receives ‘RRC: Downlink Direct Transfer (SM: Activate PDP Context Accept)’
Formula
PS RAB Establishment Success Rate (%) = (# Activate_PDP_Context_Accept / # first RRC Connection Request) *100
Note: samples with problems due to non NSN equipments should be excluded of the calculation.

GUIDELINES Version Status RF Optimization Guideline for AMX 3G Rollout 1 Consulting and System Integrations August, 27th 2007 Revised by: Danilo Cabral Raj Sandhu, Allan Bispo and Daniel Platero 6.2.3.2 PS Realese 99 Data Service: PS Round Trip Time
PS R99 Round Trip Time (ms): is a measure to determine the end-to-end delay when a packet is transferred across the WCDMA network. A PING application is deployed to determine RTT on an end-to-end base. The RTT is defined as the interval between submission of a datagram (e.g. ICMP ECHO REQUEST) from the UE, and the reception of the corresponding reply datagram (e.g. ICMP ECHO REPLY) back at the UE side.
Measuring
- Mobile is in idle mode
- Requests PDP Context Activation
- Large ping to force DCH channel
- Pings specific IP address with 32 bytes packet
- Set 100 pings
- Repeat cycle
Trigger
PS Rel99 RTT trigger point:
UE sends datagram ICMP ECHO REQUEST
PS Rel99 RTT completion trigger point:
UE receives datagram ICMP ECHO REPLY
Successful completion if:
UE receives datagram ICMP ECHO REPLY
Formula PS REL99 Round Trip Time (ms) = ICMP ECHO REPLY_time – ICMP ECHO REQUEST_time
Note: samples with problems or delays due to non NSN equipments should be excluded of the calculation.
The PING server should be defined as a test server within the core network (within the Gi interface).
NSN suggests carrying out RTT: as stationary test only and excluding the first 5 pings due to TCP slow start.

GUIDELINES Version Status RF Optimization Guideline for AMX 3G Rollout 1 Consulting and System Integrations August, 27th 2007 Revised by: Danilo Cabral Raj Sandhu, Allan Bispo and Daniel Platero 6.2.3.3 PS Realese 99 Data Service: PS RAB Drop Rate
PS RAB DROP RATE (%): it also is an abnormal PDP Context drop due to an abnormal Iu release.
Measuring
- Mobile in Car in idle state
- Requests PDP Context Activation
- Connect to a customer FTP server
- Initiate FTP DL of 1Mbyte file using allocated Radio Bearer
- Waits some time (inactivity param. dependent)
- Releases DCH
- Deactivates the PDP Context Activation
- Repeat the cycle 10 times
Trigger
PS RAB Drop trigger point:
UE receives ‘RRC: Downlink Direct Transfer (SM: Activate PDP Context Accept)’
PS RAB Drop completion trigger point:
UE receives ‘RRC: Downlink Direct Transfer (SM: Deactivate PDP Context Accept)’
Successful completion if:
UE receives ‘RRC: Downlink Direct Transfer (SM: Deactivate PDP Context Accept)’
Formula PS RAB Drop Rate (%) = (1 - # Successful PDP Deactivation / # Successful PDP Activations) *100
Note: samples with problems or delays due to non NSN equipments should be excluded of the calculation.
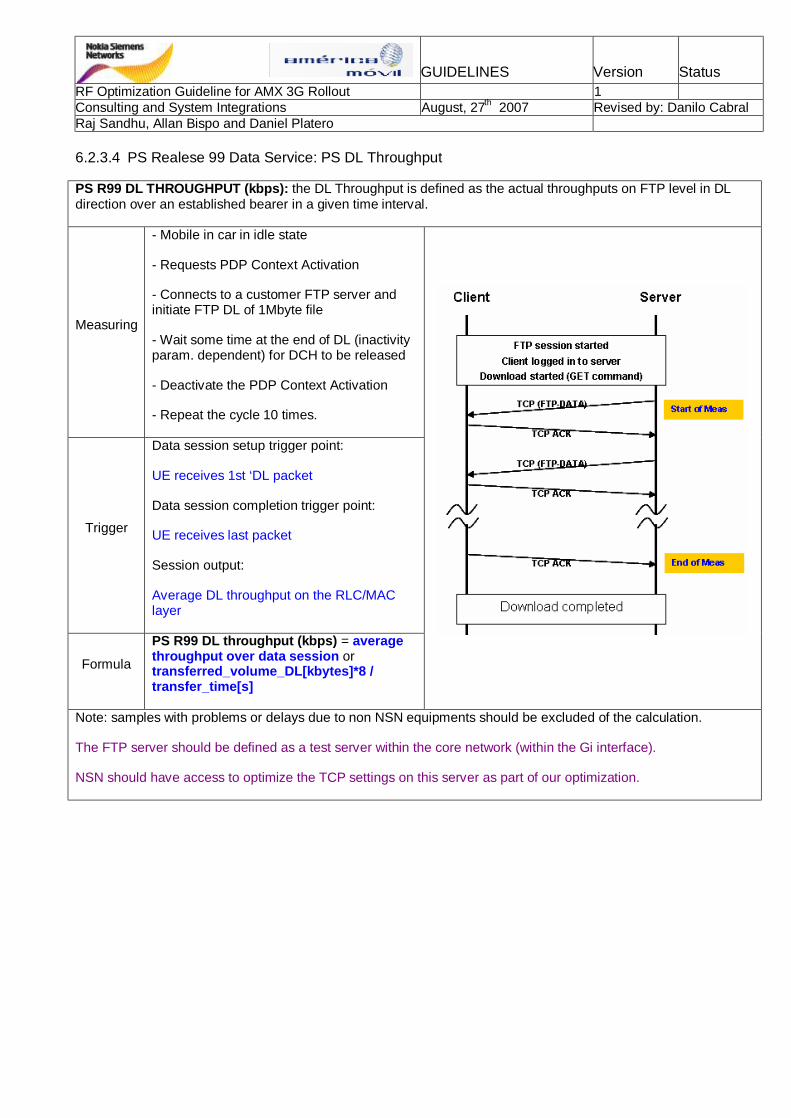
GUIDELINES Version Status RF Optimization Guideline for AMX 3G Rollout 1 Consulting and System Integrations August, 27th 2007 Revised by: Danilo Cabral Raj Sandhu, Allan Bispo and Daniel Platero 6.2.3.4 PS Realese 99 Data Service: PS DL Throughput
PS R99 DL THROUGHPUT (kbps): the DL Throughput is defined as the actual throughputs on FTP level in DL direction over an established bearer in a given time interval.
Measuring
- Mobile in car in idle state
- Requests PDP Context Activation
- Connects to a customer FTP server and initiate FTP DL of 1Mbyte file
- Wait some time at the end of DL (inactivity param. dependent) for DCH to be released
- Deactivate the PDP Context Activation
- Repeat the cycle 10 times.
Trigger
Data session setup trigger point:
UE receives 1st ‘DL packet
Data session completion trigger point:
UE receives last packet
Session output:
Average DL throughput on the RLC/MAC layer
Formula
PS R99 DL throughput (kbps) = average throughput over data session or transferred_volume_DL[kbytes]*8 / transfer_time[s]
Note: samples with problems or delays due to non NSN equipments should be excluded of the calculation.
The FTP server should be defined as a test server within the core network (within the Gi interface).
NSN should have access to optimize the TCP settings on this server as part of our optimization.

GUIDELINES Version Status RF Optimization Guideline for AMX 3G Rollout 1 Consulting and System Integrations August, 27th 2007 Revised by: Danilo Cabral Raj Sandhu, Allan Bispo and Daniel Platero 6.2.3.5 PS Realese 99 Data Service: PS UL Throughput
PS R99 UL THROUGHPUT (kbps): the UL Throughput is defined as the actual throughputs on FTP level in UL direction over an established bearer in a given time interval.
Measuring
- Mobile in car in idle state
- Requests PDP Context Activation
- Connects to a customer FTP server and initiate FTP UL of 200 kbyte file
- At the end, waits 15 sec. for DCH to be released
- Deactivate the PDP Context Activation
- Repeat the cycle 10 times.
Trigger
Data session setup trigger point:
UE sends 1st ‘UL packet
Data session completion trigger point:
UE receives last TCP ACK
Session output:
Average UL throughput on the RLC/MAC layer
Formula
PS R99 UL throughput (kbps) = average throughput over data session or transferred_volume_UL[kbytes]*8 / transfer_time[s]
Note: samples with problems or delays due to non NSN equipments should be excluded of the calculation.
The FTP server should be defined as a test server within the core network (within the Gi interface).
NSN should have access to optimize the TCP settings on this server as part of our optimization.

GUIDELINES Version Status RF Optimization Guideline for AMX 3G Rollout 1 Consulting and System Integrations August, 27th 2007 Revised by: Danilo Cabral Raj Sandhu, Allan Bispo and Daniel Platero 6.2.4 Drive-test KPI Measurements – PS HSDPA Data Service
6.2.4.1 PS HSDPA Data Service: PS Round Trip Time
PS HSDPA Round Trip Time (ms): is a measure to determine the end-to-end delay when a packet is transferred across the HSDPA network. A PING application is deployed to determine RTT on an end-to-end base. The RTT is defined as the interval between submission of a datagram (e.g. ICMP ECHO REQUEST) from the UE, and the reception of the corresponding reply datagram (e.g. ICMP ECHO REPLY) back at the UE side.
Measuring
- Mobile is in idle mode
- Requests PDP Context Activation
- Large ping to force HS-DCH channel
- Pings specific IP address with 32 bytes packet
- Set 100 pings
- Repeat cycle
Trigger
PS HSDPA RTT trigger point:
UE sends datagram ICMP ECHO REQUEST
PS HSPDA RTT completion trigger point:
UE receives datagram ICMP ECHO REPLY
Successful completion if:
UE receives datagram ICMP ECHO REPLY
Formula PS REL99 Round Trip Time (ms) = ICMP ECHO REPLY_time – ICMP ECHO REQUEST_time
Note: samples with problems or delays due to non NSN equipments should be excluded of the calculation.
The PING server should be defined as a test server within the core network (within the Gi interface).
NSN suggests carrying out RTT: as stationary test only and excluding the first 5 pings due to TCP slow start.
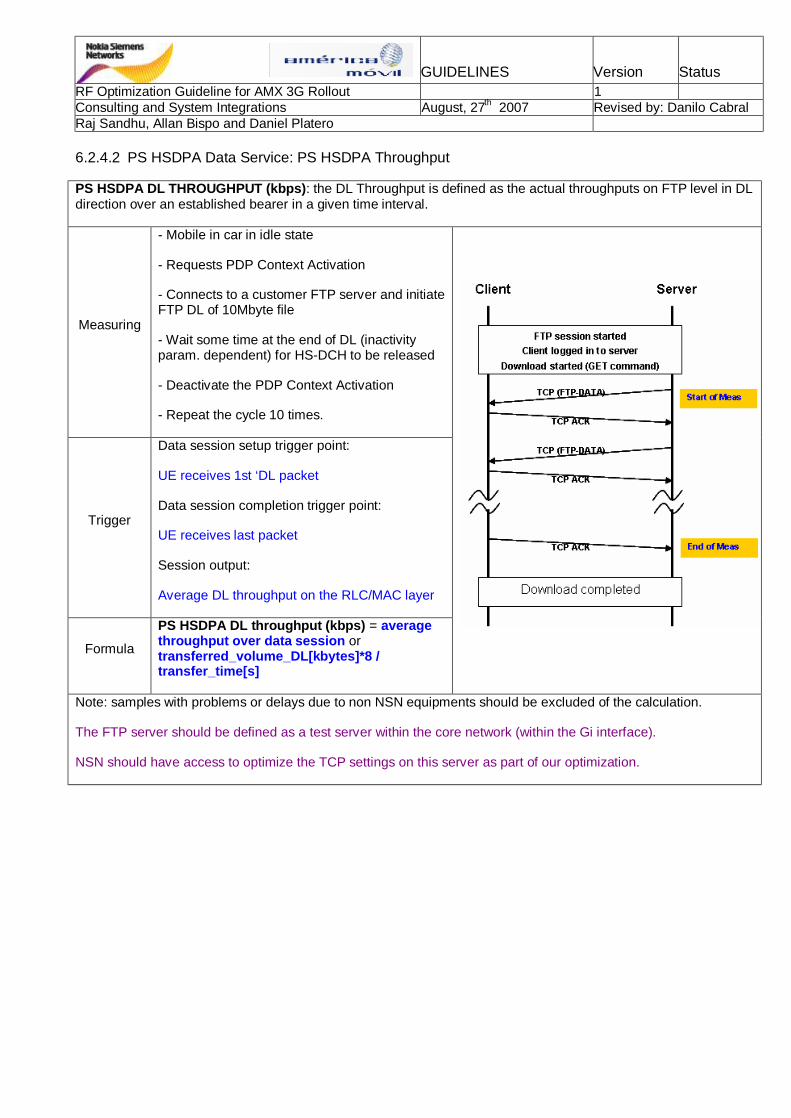
GUIDELINES Version Status RF Optimization Guideline for AMX 3G Rollout 1 Consulting and System Integrations August, 27th 2007 Revised by: Danilo Cabral Raj Sandhu, Allan Bispo and Daniel Platero 6.2.4.2 PS HSDPA Data Service: PS HSDPA Throughput
PS HSDPA DL THROUGHPUT (kbps): the DL Throughput is defined as the actual throughputs on FTP level in DL direction over an established bearer in a given time interval.
Measuring
- Mobile in car in idle state
- Requests PDP Context Activation
- Connects to a customer FTP server and initiate FTP DL of 10Mbyte file
- Wait some time at the end of DL (inactivity param. dependent) for HS-DCH to be released
- Deactivate the PDP Context Activation
- Repeat the cycle 10 times.
Trigger
Data session setup trigger point:
UE receives 1st ‘DL packet
Data session completion trigger point:
UE receives last packet
Session output:
Average DL throughput on the RLC/MAC layer
Formula
PS HSDPA DL throughput (kbps) = average throughput over data session or transferred_volume_DL[kbytes]*8 / transfer_time[s]
Note: samples with problems or delays due to non NSN equipments should be excluded of the calculation.
The FTP server should be defined as a test server within the core network (within the Gi interface).
NSN should have access to optimize the TCP settings on this server as part of our optimization.

GUIDELINES Version Status RF Optimization Guideline for AMX 3G Rollout 1 Consulting and System Integrations August, 27th 2007 Revised by: Danilo Cabral Raj Sandhu, Allan Bispo and Daniel Platero 6.2.5 Drive-test KPI Measurements – TCP Setting for Data Services
From the PS point of view, mobility and RF conditions are limiting factors for release 99 and HSDPA data bearers; however HSDPA is more vulnerable to these aspects.
Another limiting factor for throughput performance is TCP Window Size at the user side. Especially for UE’s Category 6, where higher data rates are achievable, due to time delays large Window Size is required.
During the optimization activities will be verified if the TCP settings are tuned to allow a better UE performance.
NSN suggestions:
The TCP window is the amount of unacknowledged data in flight between the sender and the receiver.
If the transmission delay between sender and receiver is long, this means very low throughput.
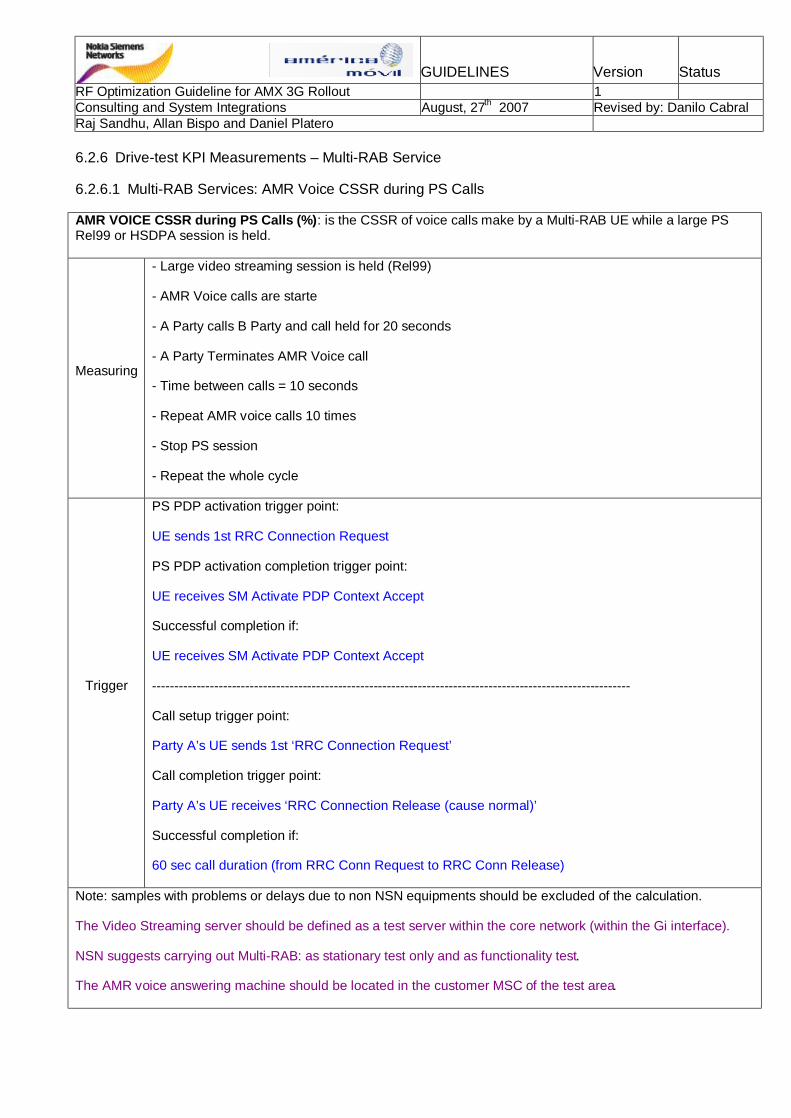
GUIDELINES Version Status RF Optimization Guideline for AMX 3G Rollout 1 Consulting and System Integrations August, 27th 2007 Revised by: Danilo Cabral Raj Sandhu, Allan Bispo and Daniel Platero 6.2.6 Drive-test KPI Measurements – Multi-RAB Service
6.2.6.1 Multi-RAB Services: AMR Voice CSSR during PS Calls
AMR VOICE CSSR during PS Calls (%): is the CSSR of voice calls make by a Multi-RAB UE while a large PS Rel99 or HSDPA session is held.
Measuring
- Large video streaming session is held (Rel99)
- AMR Voice calls are starte
- A Party calls B Party and call held for 20 seconds
- A Party Terminates AMR Voice call
- Time between calls = 10 seconds
- Repeat AMR voice calls 10 times
- Stop PS session
- Repeat the whole cycle
Trigger
PS PDP activation trigger point:
UE sends 1st RRC Connection Request
PS PDP activation completion trigger point:
UE receives SM Activate PDP Context Accept
Successful completion if:
UE receives SM Activate PDP Context Accept
------------------------------------------------------------------------------------------------------------
Call setup trigger point:
Party A’s UE sends 1st ‘RRC Connection Request’
Call completion trigger point:
Party A’s UE receives ‘RRC Connection Release (cause normal)’
Successful completion if:
60 sec call duration (from RRC Conn Request to RRC Conn Release)
Note: samples with problems or delays due to non NSN equipments should be excluded of the calculation.
The Video Streaming server should be defined as a test server within the core network (within the Gi interface).
NSN suggests carrying out Multi-RAB: as stationary test only and as functionality test.
The AMR voice answering machine should be located in the customer MSC of the test area.
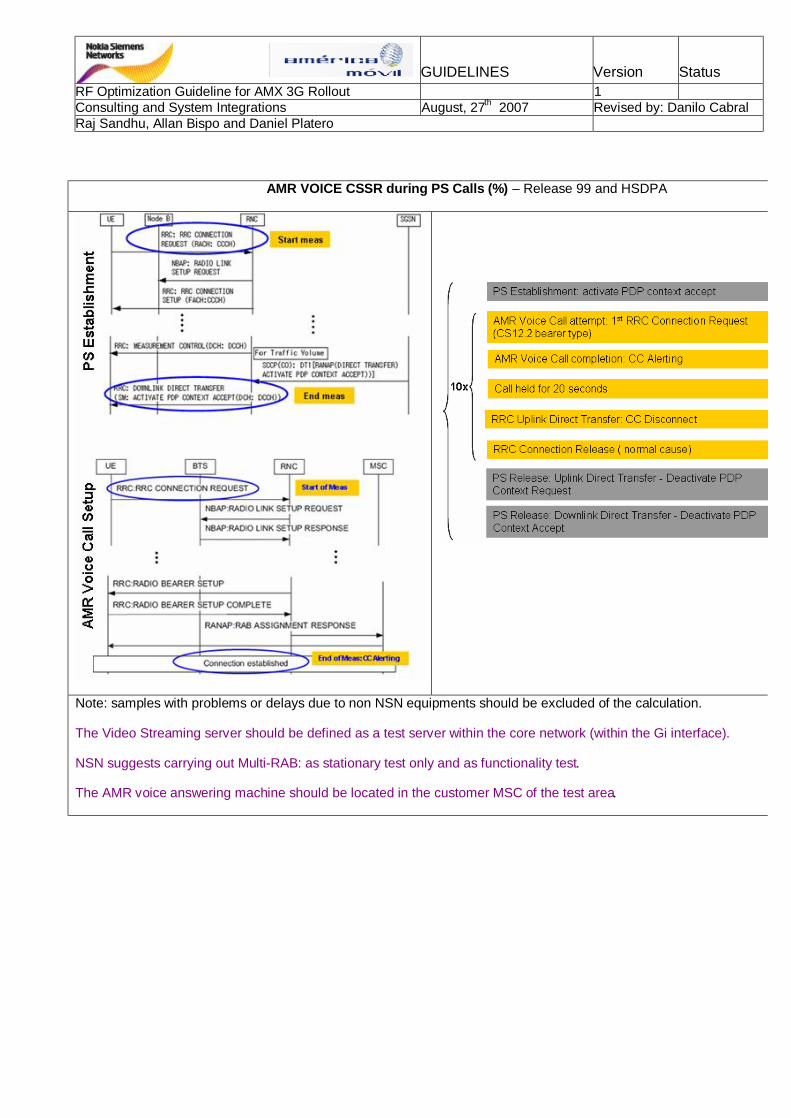
GUIDELINES Version Status RF Optimization Guideline for AMX 3G Rollout 1 Consulting and System Integrations August, 27th 2007 Revised by: Danilo Cabral Raj Sandhu, Allan Bispo and Daniel Platero
AMR VOICE CSSR during PS Calls (%) – Release 99 and HSDPA
Note: samples with problems or delays due to non NSN equipments should be excluded of the calculation.
The Video Streaming server should be defined as a test server within the core network (within the Gi interface).
NSN suggests carrying out Multi-RAB: as stationary test only and as functionality test.
The AMR voice answering machine should be located in the customer MSC of the test area.

GUIDELINES Version Status RF Optimization Guideline for AMX 3G Rollout 1 Consulting and System Integrations August, 27th 2007 Revised by: Danilo Cabral Raj Sandhu, Allan Bispo and Daniel Platero 6.2.6.2 Multi-RAB Services: PS Data CSSR during AMR Voice Calls
PS CSSR during AMR Voice Calls (%): is the CSSR of data calls ( PS Rel99 or HSDPA) make by a Multi-RAB UE, while a continuous AMR voice call is held.
Measuring
- 3G to PSTN Voice call
- Hold it indefinitely
- Wait 10 seconds
- GPRS attach and PDP Context Activation
- Pings specific IP address with 32 bytes packet 10 x
- PDP Context De-activation and GPRS Detach
- Repeat cycle 10 times
- A Party terminates AMR voice call
Trigger
Call setup time trigger point:
Party A’s UE sends 1st ‘RRC Connection Request’
CS Time completion trigger point:
Party A’s UE receives Layer3 message ‘CC: ALERTING’
Successful completion if:
Evaluate the CST interval (from RRC Conn Rqst to CC: Alerting)
-----------------------------------------------------------------------------------------------------------------
PS PDP activation trigger point:
UE sends 1st RRC Connection Request
PS PDP activation completion trigger point:
UE receives SM: Activate PDP Context Accept
Successful completion if:
UE receives SM: Activate PDP Context Accept
Note: samples with problems or delays due to non NSN equipments should be excluded of the calculation.
The Ping Application server should be defined as a test server within the core network (within the Gi interface).
NSN suggests carrying out Multi-RAB: as stationary test only and as functionality test.
The AMR voice answering machine should be located in the customer MSC of the test area.

GUIDELINES Version Status RF Optimization Guideline for AMX 3G Rollout 1 Consulting and System Integrations August, 27th 2007 Revised by: Danilo Cabral Raj Sandhu, Allan Bispo and Daniel Platero
PS CSSR during AMR VOICE Call (%) – Release 99 and HSDPA
Note: samples with problems or delays due to non NSN equipments should be excluded of the calculation.
The Ping Application server should be defined as a test server within the core network (within the Gi interface).
NSN suggests carrying out Multi-RAB: as stationary test only and as functionality test.
The AMR voice answering machine should be located in the customer MSC of the test area.
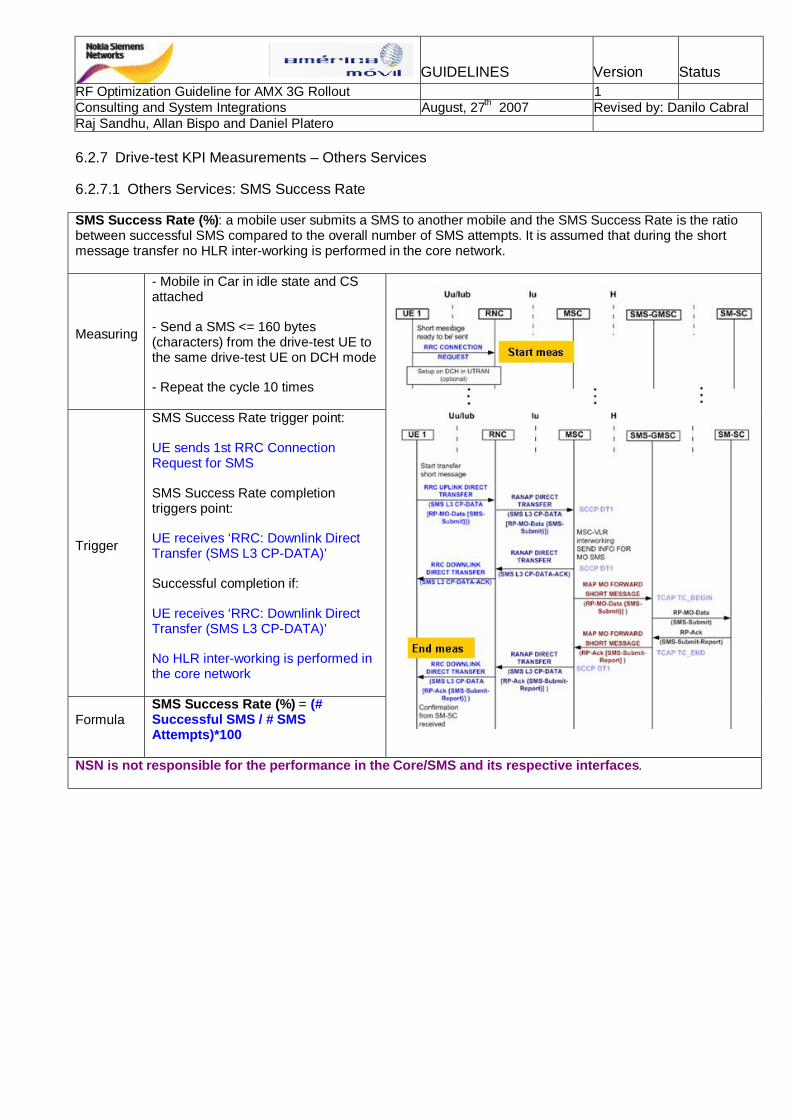
GUIDELINES Version Status RF Optimization Guideline for AMX 3G Rollout 1 Consulting and System Integrations August, 27th 2007 Revised by: Danilo Cabral Raj Sandhu, Allan Bispo and Daniel Platero 6.2.7 Drive-test KPI Measurements – Others Services
6.2.7.1 Others Services: SMS Success Rate
SMS Success Rate (%): a mobile user submits a SMS to another mobile and the SMS Success Rate is the ratio between successful SMS compared to the overall number of SMS attempts. It is assumed that during the short message transfer no HLR inter-working is performed in the core network.
Measuring
- Mobile in Car in idle state and CS attached
- Send a SMS <= 160 bytes (characters) from the drive-test UE to the same drive-test UE on DCH mode
- Repeat the cycle 10 times
Trigger
SMS Success Rate trigger point:
UE sends 1st RRC Connection Request for SMS
SMS Success Rate completion triggers point:
UE receives ‘RRC: Downlink Direct Transfer (SMS L3 CP-DATA)’
Successful completion if:
UE receives ‘RRC: Downlink Direct Transfer (SMS L3 CP-DATA)’
No HLR inter-working is performed in the core network
Formula SMS Success Rate (%) = (# Successful SMS / # SMS Attempts)*100
NSN is not responsible for the performance in the Core/SMS and its respective interfaces.

GUIDELINES Version Status RF Optimization Guideline for AMX 3G Rollout 1 Consulting and System Integrations August, 27th 2007 Revised by: Danilo Cabral Raj Sandhu, Allan Bispo and Daniel Platero 6.2.7.2 Others Services: SMS Delivery Time < 40 seconds
SMS Delivery Time < 40s (%): a mobile user submits a SMS to another mobile and the SMS Delivery Time is the interval between the submission of the first RRC message CONNECTION REQUEST, and the reception of the SMS L3 message CP-DATA at a UE. It is assumed that during the short message transfer no HLR inter-working is performed in the core network.
Measuring
- Mobile in Car in idle state and CS attached
- Send a SMS <= 160 bytes (characters) from the drive-test UE to the same drive-test UE on DCH mode
- Repeat the cycle 10 times
Trigger
SMS Delivery Time trigger point:
UE sends 1st RRC Connection Request for SMS
SMS Delivery Time completion trigger point:
UE receives ‘RRC: Downlink Direct Transfer (SMS L3 CP-DATA)’
Successful completion if:
UE receives ‘RRC: Downlink Direct Transfer (SMS L3 CP-DATA)’ in less than 40 seconds
No HLR inter-working is performed in the core network
Formula
SMS Delivery Time < 40 sec. (%) = (# total SMS w/ delivery time < 40sec) / (# total of SMS completed)*100
NSN is not responsible for the performance in the Core/SMS and its respective interfaces.

GUIDELINES Version Status RF Optimization Guideline for AMX 3G Rollout 1 Consulting and System Integrations August, 27th 2007 Revised by: Danilo Cabral Raj Sandhu, Allan Bispo and Daniel Platero 6.2.7.3 Others Services: WAP Failure Rate
WAP Failure Rate (%): is related to the ratio between successful retrieval of the WAP page content WSP RSLT (CONR) at the receiving UE, compared to the number of PDP CONTEXT ACTIVATION attempts (submission of the first RRC Conn REQUEST msg by the UE).
Measuring
- Mobile in Car in idle state
- Requests PDP Context Activation
- Connect to WAP server
- Initiate WAP DL of 15Kbyte file using allocated Radio Bearer
- IP connection to WAP server released
- Waits some time (inactivity param. dependent)
- Releases DCH
- Deactivates the PDP Context Activation
- Repeat the cycle 10 times
Trigger
WAP Failure Rate trigger point:
UE not GPRS attached
UE sends 1st RRC Connection Request
WAP Failure Rate completion trigger point:
UE receives the WAP page content (WSP RSLT - CONR)
Successful completion if:
UE receives the last WAP page content (WSP RSLT - CONR)
Formula WAP Failure Rate (%) = (1 - # Successful WAP download / # WAP download Attempts)*100
NSN is not responsible for the performance in the PS Core/WAP and its respective interfaces.

GUIDELINES Version Status RF Optimization Guideline for AMX 3G Rollout 1 Consulting and System Integrations August, 27th 2007 Revised by: Danilo Cabral Raj Sandhu, Allan Bispo and Daniel Platero 6.2.7.4 Others Services: WAP Session Establishment Elapsed Time < 13 seconds
WAP Session Estab Elapsed Time (%): is the interval between the submission of the RRC message CONNECTION REQUEST at the submitting UE, and the successful retrieval of the WAP page content WSP RSLT (CONR) at the receiving UE.
Measuring - Mobile in Car in idle state
- Requests PDP Context Activation
- Connect to WAP server
- Initiate WAP DL of 15Kbyte file using allocated Radio Bearer
- IP connection to WAP server released
- Waits some time (inactivity param. dependent)
- Releases DCH
- Deactivates the PDP Context Activation
- Repeat the cycle 10 times
Trigger WAP Session Establishment trigger point:
UE not GPRS attached
UE sends 1st RRC Connection Request
WAP Session Establishment completion trigger point:
UE receives the WAP page content (WSP RSLT - CONR)
Successful completion if:
UE receives the last WAP page content (WSP RSLT - CONR) in less than 13 seconds.
Formula WAP Session Estab Elapsed Time < 13 sec. (%) = (# total WAP Session Estab w/ elapsed time < 13sec) / (# total of WAP Session Estab successfully)*100
NSN is not responsible for the performance in the PS Core/WAP and its respective interfaces.
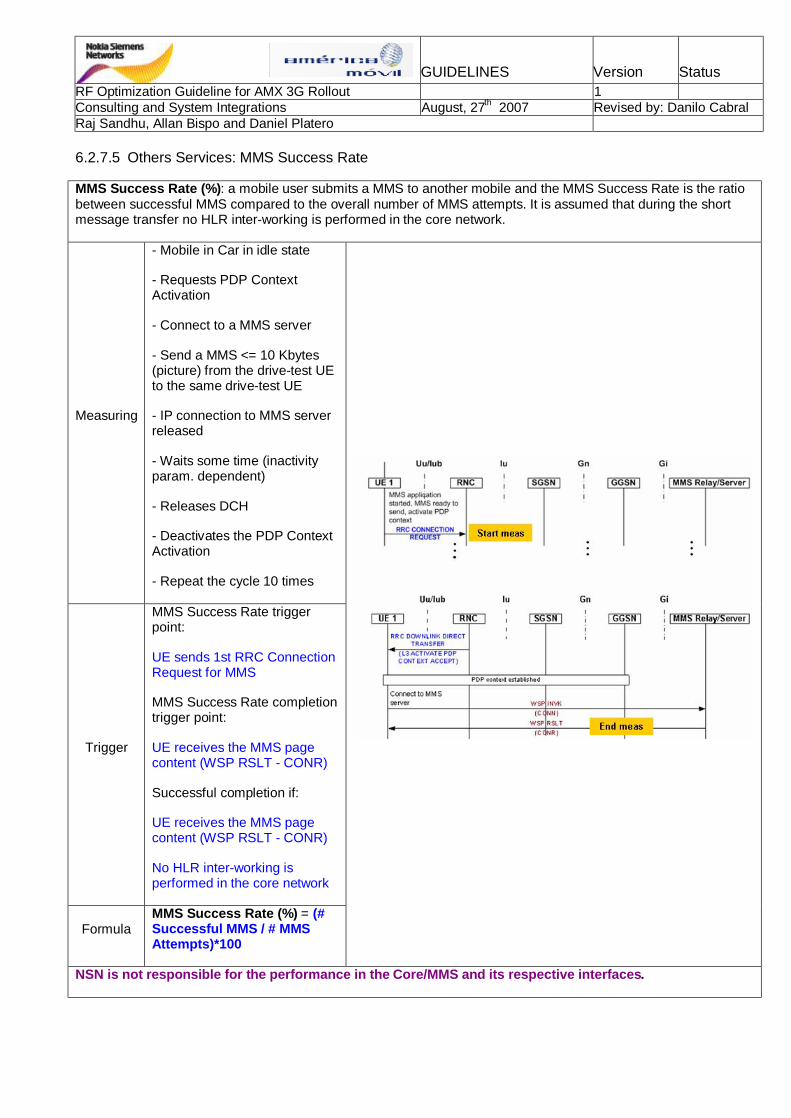
GUIDELINES Version Status RF Optimization Guideline for AMX 3G Rollout 1 Consulting and System Integrations August, 27th 2007 Revised by: Danilo Cabral Raj Sandhu, Allan Bispo and Daniel Platero 6.2.7.5 Others Services: MMS Success Rate
MMS Success Rate (%): a mobile user submits a MMS to another mobile and the MMS Success Rate is the ratio between successful MMS compared to the overall number of MMS attempts. It is assumed that during the short message transfer no HLR inter-working is performed in the core network.
Measuring
- Mobile in Car in idle state
- Requests PDP Context Activation
- Connect to a MMS server
- Send a MMS <= 10 Kbytes (picture) from the drive-test UE to the same drive-test UE
- IP connection to MMS server released
- Waits some time (inactivity param. dependent)
- Releases DCH
- Deactivates the PDP Context Activation
- Repeat the cycle 10 times
Trigger
MMS Success Rate trigger point:
UE sends 1st RRC Connection Request for MMS
MMS Success Rate completion trigger point:
UE receives the MMS page content (WSP RSLT - CONR)
Successful completion if:
UE receives the MMS page content (WSP RSLT - CONR)
No HLR inter-working is performed in the core network
Formula MMS Success Rate (%) = (# Successful MMS / # MMS Attempts)*100
NSN is not responsible for the performance in the Core/MMS and its respective interfaces.

GUIDELINES Version Status RF Optimization Guideline for AMX 3G Rollout 1 Consulting and System Integrations August, 27th 2007 Revised by: Danilo Cabral Raj Sandhu, Allan Bispo and Daniel Platero 6.2.7.6 Others Services: MMS Delivery Time < 40 seconds
MMS Delivery Time < 40s (%): a mobile user submits a MMS to another mobile and the MMS Delivery Time is the interval between the submission of the first RRC message CONNECTION REQUEST, and the reception of the MMS message WSP RSLP (CONR) at a UE. It is assumed that during the short message transfer no HLR inter-working is performed in the core network.
Measuring
- Mobile in Car in idle state
- Requests PDP Context Activation
- Connect to a MMS server
- Send a MMS <= 10 Kbytes (picture) from the drive-test UE to the same drive-test UE
- IP connection to MMS server released
- Waits some time (inactivity param. dependent)
- Releases DCH
- Deactivates the PDP Context Activation
- Repeat the cycle 10 times
Trigger
MMS Delivery Time trigger point:
UE sends 1st RRC Connection Request for MMS
MMS Delivery Time completion trigger point:
UE receives the MMS page content (WSP RSLT - CONR)
Successful completion if:
UE receives the MMS page content (WSP RSLT - CONR)
No HLR inter-working is performed in the core network
Formula
MMS Delivery Time < 40 sec (%) = (# total MMS w/ delivery time < 40sec) / (# total of MMS completed)*100
NSN is not responsible for the performance in the Core/MMS and its respective interfaces.

GUIDELINES Version Status RF Optimization Guideline for AMX 3G Rollout 1 Consulting and System Integrations August, 27th 2007 Revised by: Danilo Cabral Raj Sandhu, Allan Bispo and Daniel Platero 6.2.8 Drive-test KPI Measurements – RAU Testing
PS Routing Area Update Time (sec): a mobile user is GPRS-attached and UE detects that has entered in new Routing Area (RA) or periodic RA update timer has expired. The PS RAU Time is the interval between the submission of the RRC CONNECTION REQUEST, and the reception of the a ROUING AREA UPDATE ACCEPT at a UE.
Measuring
- Mobile in Car in idle state, no PDP context established
- UE enters in a new Routing Area
- Requests PDP Context Activation
- UE requests Routing Area update
- UE grants a new Routing Area
- Repeat the cycle 10 times in both RA directions
Trigger
Routing Area Update time trigger point:
UE in a new Routing Area
UE sends 1st RRC Connection Request
Routing Area Update time completion trigger point:
UE receives ‘RRC: Downlink Direct Transfer (L3: Routing Area Update Accept)’
Successful completion if:
UE receives ‘RRC: Downlink Direct Transfer (L3: Routing Area Update Accept)’
UE grants a new Routing Area in less than 10 sec.
Formula
PS Routing Area Update Time (sec) = ROUTING AREA UPDATE ACCEPT_time – ROUTING AREA UPDATE REQUEST_time
Note: samples with problems or delays due to non NSN equipments should be excluded of the calculation.
NSN suggests carrying out RAU at specific locations.

GUIDELINES Version Status RF Optimization Guideline for AMX 3G Rollout 1 Consulting and System Integrations August, 27th 2007 Revised by: Danilo Cabral Raj Sandhu, Allan Bispo and Daniel Platero 7. REFERENCES
Training documentation:
o RANPAR
o RANOP1
o RANOP2
System Documentation (NOLS):
o WCDMA RAN Key Performance Indicators
o Optimizing WCDMA RAN
o Interdependencies of Telecom Features
o WCDMA RAS05.1 Parameter Dictionary
Maintenance Documentation (NOLS):
o List of active HW and SW TNs for RNC PL
o Generic Failure Status Report
IMS Related links:
o WCDMA Optimization Course Material
https://sharenet-ims.inside.nokiasiemensnetworks.com/livelink/livelink?func=ll&objId=362678508&objAction=Browse&viewType=1
o Mobile Radio Community
https://sharenet-ims.inside.nokiasiemensnetworks.com/livelink/livelink?func=ll&objId=357445821&objAction=Browse&viewType=1