guideline on the use of sand in road construction in the ... · pdf fileguideline on the use...
TRANSCRIPT

Guideline on the Use of Sand inRoad Construction in the SADC Region
AFCAP/GEN/028/C
InfraAfrica (Pty) Ltd, BotswanaCSIR, South AfricaTRL Ltd, UKRoughton International, UKCPP Botswana (Pty) Ltd
May 2013

This project was funded by the AfricaCommunity Access Programme(AFCAP) which promotes safe andsustainable access to markets,healthcare, education, employmentand social and political networks forrural communities in Africa.
Launched in June 2008 and managedby Crown Agents, the five year-long,UK government (DFID) funded project,supports research and knowledgesharing between participatingcountries to enhance the uptake of lowcost, proven solutions for rural accessthat maximise the use of localresources.
The programme is currently active inEthiopia, Kenya, Ghana, Malawi,Mozambique, Tanzania, Zambia, SouthAfrica, Democratic Republic of Congoand South Sudan and is developingrelationships with a number of othercountries and regional organisationsacross Africa.
This material has been funded byUKaid from the Department forInternational Development, howeverthe views expressed do not necessarilyreflect the department’s or themanaging agent’s official policies.
For further information visithttps://www.afcap.org
The main purpose of this Guideline on the Use of
Sand in Road construction in the SADC Region is
to provide practitioners with a good understanding
of the engineering properties of one of the most
abundant, naturally occurring materials found in
the Southern African region – sand – so as to
facilitate the more wide-spread use of this
ubiquitous material in the construction of low volume
roads.
The need for the guideline has been identified as
a priority by SADC member states and, with the
support of AFCAP, the project is being carried out
for the Research and Development Standing
Committee of the Association of Southern African
National Road Authorities (ASANRA).
The application of the guideline, especially in
areas where traditional road building materials
may be scarce, is timely and is likely to be very
beneficial to practitioners in the SADC region.
Range of sand colours found in the SADC region.Source: SAND: A Journey Through Science and theImagination, Michael Welland, Oxford University Press, 2010.

i
ACKNOWLEDGEMENTS
The Association of Southern African National Roads Agencies (ASANRA) wishes to
acknowledge the valuable support that was provided by the United Kingdom Department for
International Development (DFID) for the preparation of the Guideline on the Use of Sand
in Road Construction in the SADC Region. The project was carried out under the aegis of
the Africa Community Access Programme (AFCAP) – a DFID-funded research programme
that promotes safe and sustainable access for rural communities in Africa.
The project benefitted from the valuable inputs provided by a Technical Working Group
comprising professionals from member states of SADC who participated in workshop
discussions during the process of development of the Guideline.
Project Management
The project was managed by the Crown Agents and carried out under the general
guidance of the AFCAP Technical Services Manager, Mr. R. Geddes.
Manual Development
The manual was developed by a consortium of the following consulting organisations:
- InfraAfrica (Pty) Ltd, Botswana
Mr. M. I. Pinard
- Council for Scientific and Industrial Research (CSIR), South Africa.
Dr. P Paige-Green
- Transport Research Laboratory (TRL), UK.
Mr. K. Mukura
- CPP Botswana (Pty) Ltd, Botswana
Mr. K. J. Motswagole
Peer Review
The Guideline was reviewed by the following:
- Dr. Frank Netterberg, Pavement Materials and Geotechnical Specialist, South Africa
- Dr. Harold Bofinger, Roughton International, UK.
Photographs
The photographs included in the Guideline were provided by the following:
- Dr. F. Netterberg
- Dr. P. Paige-Green
- Ms. D. Elsmere, (Freetrans, Free State, South Africa)
- M. I. Pinard
- K. Mukura
- K. Motswagole

ii
TABLE OF CONTENTS
Acknowledgements .......................................................................................................... i
List of Tables .............................................................................................................. iii
List of Figures .............................................................................................................. iii
List of Photographs…………………………………………………………………………….. v
List of Abbreviations………………………………………………………………………….. vi
Glossary of Terms………………………………………………………………………………..vii
1. INTRODUCTION........................................................................................1
1.1 Background ...........................................................................................................1
1.2 Purpose of Guideline ..............................................................................................2
1.3 Scope of Guideline..................................................................................................3
1.4 Structure of Guideline ............................................................................................3
2. GENERAL CHARACTERISTICS OF SANDS ..............................................4
2.1 Introduction ............................................................................................................4
2.2 Definition ................................................................................................................4
2.3 Formation ..............................................................................................................5
2.4 Composition ...........................................................................................................5
2.5 Distribution .............................................................................................................6
2.6 Geology and Origin.................................................................................................7
2.7 Classification ..........................................................................................................8
3. PROSPECTING FOR AND TESTING OF SANDS.......................................12
3.1 Introduction ..........................................................................................................12
3.2 Prospecting...........................................................................................................12
3.3 Testing..................................................................................................................16
4. PROPERTIES OF SANDS .......................................................................20
4.1 Introduction ..........................................................................................................20
4.2 Locations of Sands Investigated ...........................................................................20
4.3 Laboratory Testing................................................................................................23
4.4 Physical Properties .............................................................................................24
4.5 Mineralogical and Chemical Properties .................................................................34
4.6 Engineering properties..........................................................................................38
5. DESIGN, SPECIFICATION AND USE OF SANDS.....................................43
5.1 Introduction………………………………………………………………………………. 43
5.2 Design .................................................................................................................43
5.3 Specification of Sands .........................................................................................46
5.4 Use of Untreated Sands ......................................................................................50
5.5 Stabilisation of Sands...........................................................................................53

iii
6. CONSTRUCTION ISSUES .....................................................................................62
6.1 Introduction.........................................................................................................62
6.2 General Guidance ..............................................................................................62
6.3 Compaction Aspects ...........................................................................................63
6.4 Construction Aspects ..........................................................................................65
7. SUMMARY AND WAY FORWARD .......................................................................69
7.1 General Summary...............................................................................................69
7.2 Way Forward.......................................................................................................70
REFERENCES ........................................................................................72
ANNEXES
Annex A – Use of the Phi scale for the analysis of sands.............................................78
Annex B – Examples of use of neat sand as base course............................................80
LIST OF TABLES
Table 2-1: AASHTO classification system for soils and soil-aggregate mixtures .............9
Table 4-1: Average sand, silt and clay content and PI of sands in relation to colour .....30
Table 4-2: Results of particle density tests....................................................................32
Table 4-3: Classification of sand maturity. ...................................................................34
Table 4-4: Results of oxide content determinations.......................................................35
Table 4-5: Collapse potential related to severity of problem..........................................39
Table 4-6: Typical properties of collapsible reddish brown sand ..................................39
Table 4-7: Typical permeability coefficients for sands ...................................................40
Table 5-1: DCP design catalogue or different traffic classes .........................................44
Table 5-2: Australian specifications for red clayey or silty sand for use as base course 46
Table 5-3: Zimbabwean specifications for use of sand as base course (stockpile)........47
Table 5-4: Soil stabiliser and related type of stabilisation..............................................53
LIST OF FIGURES
Figure 1-1: Distribution of transported soils in Southern Africa ........................................1
Figure 2-1: Formation of sand by erosion and weathering of rocks..................................5
Figure 2-2: Distribution of sands in Southern Africa .........................................................6
Figure 2-3: Map of Botswana showing the four major sand areas....................................7
Figure 2-4: Alternative measures of grain size (Φ , mm and microns)............................10
Figure 3-1: Flow diagram stages for sand prospecting .................................................12
Figure 3-2: Pedological classes of soils in southern Africa.............................................13
Figure 3-3: Particle size distribution (Phi units) related to performance zones ...............15
Figure 3-4: Distribution of mean (Phi units) of sands in Mozambique ............................15
Figure 3-5: Distribution of standard deviation (Phi units) of sands in Mozambique.........15
iv
Figure 3-6: Distribution of mean (Phi units) of sands in Namibia....................................16
Figure 3-7: Distribution of standard deviation (Phi units) of sands in Namibia................16
Figure 3-8: Density/voids relationship ............................................................................18
Figure 3-8: Typical forms of compaction curves for sand...............................................18
Figure 3-9: CBR/compaction relationship ......................................................................18
Figure 4-1: Location of sand samples in Mozambique ..................................................21
Figure 4-2: Location of sand samples in Namibia .........................................................22
Figure 4-3: (a) Definition of hue; (b) Definition of value; (c) definition of chroma ............24
Figure 4-4: Typical range of colours of sands in Mozambique and Namibia ..................25
Figure 4-5: Grading envelope – Namibia sands ..................................................................26
Figure 4-6: Grading envelope – Mozambique sands ..........................................................26
Figure 4-7: Classification of Mozambique sands based on grading (Phi units) ..............26
Figure 4-8: Classification of Namibia sands based on grading (Phi units) .....................27
Figure 4-9: Mozambique – Grading envelope for sands in B zone of Wylde Chart.........28
Figure 4-10: Namibia – Grading envelope for sands in B zone of Wylde Chart .............28
Figure 4-11: Classification of all sands based on grading (Phi Units).............................29
Figure 4-12: Particle shape............................................................................................31
Figure 4-13: Degree of particle roundness.....................................................................31
Figure 4-14: Field moisture equivalent versus roundness ..............................................32
Figure 4-15: Factors affecting sand texture ...................................................................32
Figure 4-16: Degree of sorting.......................................................................................33
Figure 4-17: Iron oxide content versus clay fraction (Botswana sands)..........................36
Figure 4-18: Graphical illustration of collapsible sand fabric and mechanism of collapse . 38
Figure 4-19: Soil suction/moisture content relationship ..................................................40
Figure 4-20: Variation in CBR strength at various densities and moisture contents .......41
Figure 4-21: Variation in CBR strength at various densities and moisture contents .......42
Figure 5-1: Flow diagram of DCP design procedure ......................................................43
Figure 5-2: Comparison of DCP design profile and in situ strength profile .....................44
Figure 5-3: LSD for various traffic classes .....................................................................45
Figure 5-4: Grading envelopes for sand.........................................................................48
Figure 5-5: Lab CBR of Kalahari sand sample at various moisture content ratios ..........51
Figure 5-6: Guide to method of stabilisation...................................................................54
Figure 5-7: Results of mechanical blending of calcrete with sand ..................................55
Figure 6-1: Illustration of concept of “Compaction to refusal” .........................................63
Figure 6-2: Deflection/life relationship............................................................................63
Figure 6-3: Grader side-casting of in situ material..........................................................66
Figure 6-4: Minimum crown height for low volume sealed road......................................67
Figure 6-5: Potential drainage problems associated with depressed pavement .............68

v
LIST OF PHOTOGRAPHS
Photo 3-1: Botanical indicator Acacia haematoxylon .....................................................14
Photo 4-1: Colour scale used for ranking of sands by darkness.....................................27
Photo 4-2: Figure 4-2: Example of well rounded, well sorted sand.................................31
Photo 4-3: Example of poorly sorted, angular to sub-rounded sand .....................................31
Photo 4-4: Example of discolouration of NaOH solution with organic content ................37
Photo 4-5: Collapse settlement of sand subgrade..........................................................39
Photo 5-1: Blending of nodular calcrete and sand..........................................................55
Photo 5-2: ETB construction-labour based approach ....................................................58
Photo 5-3: ETB construction-plant based approach.......................................................58
Photo 5-4: Sand filling of geocell by front end loader .....................................................59
Photo 5-4: Use of sand-filled geocell by 40 tonne truck .................................................59
Photo 6-1: Compaction of subgrade/fill by impact compactor.........................................65

vi
LIST OF ABBREVIATIONS
AASHTO American Association of State Highway and Transport Officials
AFCAP Africa Community Access Programme
ANE Administração Nacional de Estradas
ASANRA Association of Southern African National Roads agencies
BRDM Botswana Road Design Manual
BLS Bar Linear Shrinkage
BS British Standard
BSM Bitumen Sand Mix
CBR California Bearing Ratio
COLTO Committee of Land Transport Officials
CSIR Council for Scientific and Industrial Research
Cu Uniformity Coefficient
DCP Dynamic Cone Penetrometer
ESA Equivalent Standard Axle
ETB Emulsion Treated Base
FI Fineness Index
GEMS Granular Emulsion Mixes
GM Grading Modulus
ITS Indirect Tensile Strength
LL Liquid Limit
LOI Loss on Ignition
LVR Low Volume Road
LVSR Low Volume Sealed Road
MDD Maximum Dry Density
NAASRA National Association of Australian State Road Authorities
OMC Optimum Moisture Content
PI Plasticity index
PL Plastic Limit
PM Plastic Modulus
P425 Percentage Material Passing the 0.425 mm Sieve
P075 Percentage Material Passing the 0.075 mm Sieve
RD Roads Department
SABITA South African Bitumen Association
SADC Southern Africa Development Community
SAMDP South African Mechanistic Design Procedure
SANS South African National Standard
STE Sand Treated with Emulsion
TMH Technical Methods for Highways
TRL Transport Research Laboratory
XRD X-Ray Diffraction
XRF X-Ray Fluorescence

vii
GLOSSARY OF TERMS
Aeolian Wind borne; sediments transported and deposited by wind action
Bioturbation Soil that has been reworked or mixed by living organisms
Colluvial Weathered material transported by gravity
Deposition Laying down of material by agents of erosion
Fluvial Related to streams and rivers, i.e. deposited by a stream or a river
Kurtosis The sharpness of the peak of a frequency-distribution curve
Lacustrine Relating to lakes or a lake environment
Lithified Conversion to rock-like material
Skewness Degree of slant of the slope of a frequency-distribution curve
Soil suction A negative pore water pressure within soil due to capillary and salt effects;
it is measured in a log scale of pF units (i.e. 1pF = 10 cm head of water).
Transported soil A soil which has been removed from its place of formation and
redeposited
1
1. INTRODUCTION
1.1 Background
In many parts of the Southern Africa Development Community (SADC) region, good quality road-
building materials are becoming increasingly scarce, especially for the construction of all-weather
roads in rural areas where traffic volumes are generally relatively low (less than about 300 vehicles
per day). The principal road building material for these roads is gravel which, in many areas, has
been heavily utilized and depleted through ongoing construction and maintenance activities; and in
extreme circumstances, no suitable gravel is now available for road construction and maintenance
purposes. In addition, the haulage of good quality gravel from other areas, over long distances, is
prohibitively expensive. Hence, the innovative use of locally available materials, which would have
been considered marginal or rejected by traditional specifications for road construction, needs to
be investigated for use in the construction of low volume roads (LVRs) in the region.
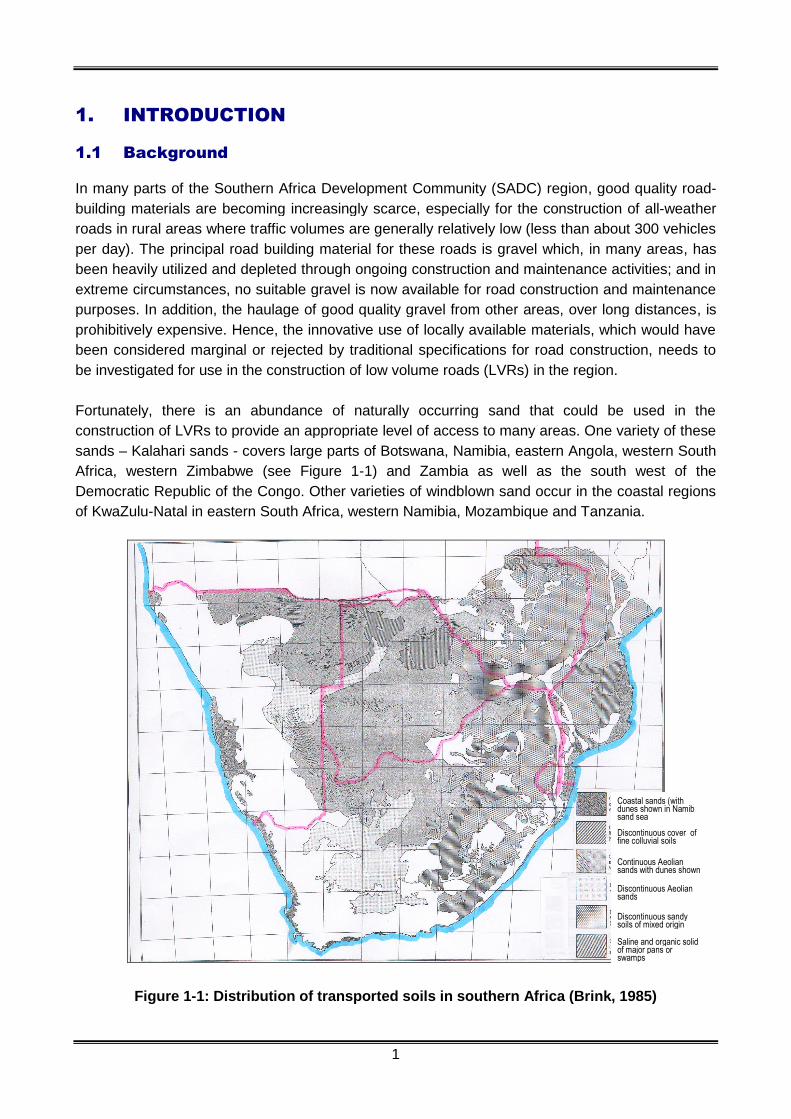
Fortunately, there is an abundance of naturally occurring sand that could be used in the
construction of LVRs to provide an appropriate level of access to many areas. One variety of these
sands – Kalahari sands - covers large parts of Botswana, Namibia, eastern Angola, western South
Africa, western Zimbabwe (see Figure 1-1) and Zambia as well as the south west of the
Democratic Republic of the Congo. Other varieties of windblown sand occur in the coastal regions
of KwaZulu-Natal in eastern South Africa, western Namibia, Mozambique and Tanzania.
Figure 1-1: Distribution of transported soils in southern Africa (Brink, 1985)
Coastal sands (withdunes shown in Namibsand sea
Discontinuous cover offine colluvial soils
Continuous Aeoliansands with dunes shown
Discontinuous Aeoliansands
Discontinuous sandysoils of mixed origin
Saline and organic solidof major pans orswamps

2
Even though naturally occurring sands seldom satisfy the requirements of traditional specifications
for use as a pavement material, especially in their untreated state, they have, nonetheless, been
used successfully on a number of road projects at least in Botswana, Namibia, Malawi, South Africa,
Zambia and Zimbabwe and elsewhere in the world such as in Western Australia and Brazil.
Technical guidelines for the use of untreated Kalahari sand for the construction of low traffic roads
have been successfully developed and utilized in Botswana. Also, the use of wind blown and
coastal sands has been investigated to a limited extent in Mozambique, South Africa and
Zimbabwe. However, the appropriateness and suitability of the technologies used in those
countries, along with other appropriate technologies developed and investigated subsequently,
need to be extended to all countries within the SADC region.
Successful use of the Kalahari sands in Botswana has led to the development of a Guideline
document (BRD, 2010) to assist with their wider use as a road construction material. In addition,
some information is available on the relatively limited use of windblown and coastal sands in
Namibia, Mozambique and South Africa which has been extended and enhanced by further
investigations carried out as part of this project.
1.2 Purpose of Guideline
The main purpose of this Guideline on the Use of Sand in Road construction in the SADC Region
is to provide practitioners with a good understanding of the properties of one of the most abundant,
naturally occurring materials found in the SADC region – sand – so as to facilitate the more wide-
spread use of this ubiquitous material in the construction of low volume roads.
The need for the guideline has been identified as a priority by SADC member states and, with the
support of AFCAP, the project is being carried out for the Research and Development Standing
Committee of the Association of Southern African National Road Authorities (ASANRA). The
application of the guideline, especially in areas where traditional road building materials may be
scarce, is timely and is likely to be very beneficial to practitioners in the SADC region.
It should be stressed that the most economic use of sands in LVR construction will be achieved when
this material is used as a base layer in its neat (i.e. untreated) state. In the past, the use of sand in this
manner would generally not have been considered to be feasible largely because of lack of a thorough
understanding of the characteristics and properties of this material, coupled with its lack of compliance
with conventional specifications. Fortunately, however, research and experience in some SADC
countries, notably Botswana and South Africa, as well as in Australia, has demonstrated that, when
correctly selected, tested, designed and constructed, sand of appropriate quality can provide a suitable
construction material in all layers of a road pavement (see Annex B for such examples).
Unfortunately, no long-term performance of roads constructed with unstabilized sand bases is
available from either Namibia or Mozambique. Conclusions related to likely performance can thus
only be reached by comparing the properties of the sands from these two countries with the known
properties and performance of sands in other countries, namely Botswana and Australia. Thus, the
research work carried out previously in these countries has provided the basis by which the sands
from Namibia and Mozambique have been evaluated for use in the various layers of a LVSR
pavement. The recommendations in the Guideline apply to all SADC countries

3
1.3 Scope of Guideline
The focus of the Guideline is on the use of neat sand as a pavement material for both paved and
unpaved roads. However, the Guideline also briefly considers other uses of sand in road
construction including:
proprietary chemicals and polymers to improve performance of the structural layers of
both sealed and unsealed roads;
cement, lime, bitumen and tar stabilization (including foamed bitumen) for use as
structural layers in sealed roads;
blending (mechanical stabilization) with other materials to improve performance of the
structural layers of both sealed and unsealed roads;
sand cushioning and track stabilization procedures aimed at improving unsealed road
performance;
geocells for sand containment, erosion control and slope stability improvement.
1.4 Structure of Guideline
The Guideline comprises seven chapters as follows:
Chapter 1 (this chapter): Provides the background to the project including its purpose, scope and
structure.
Chapter 2: Presents the general characteristics of including their definition, formation, composition,
distribution, geology, origin and classification.
Chapter 3: Outlines the approach to prospecting for sands and discusses the various tests used to
evaluate their properties for design purposes.
Chapter 4: Provides information on the locations of the sand sampling sites and the laboratory
tests carried out and discusses the results, in terms of the physical, mineralogical, chemical and
engineering properties of the sands.
Chapter 5: Discusses the design, specifications and use of sands in road construction.
Chapter 6: Considers various issues related to the construction of roads using sand.
Chapter 7: Summarises the outcome of the project and proposes the way forward.
References: Lists the references used in the development of the Guideline.
Annex A: Provides an example of the use of the Phi Scale for the analysis of sands.
Annex B: Presents examples of the use of neat sand as base course of LVSRs.
4
2. GENERAL CHARACTERISTICS OF SANDS
2.1 Introduction
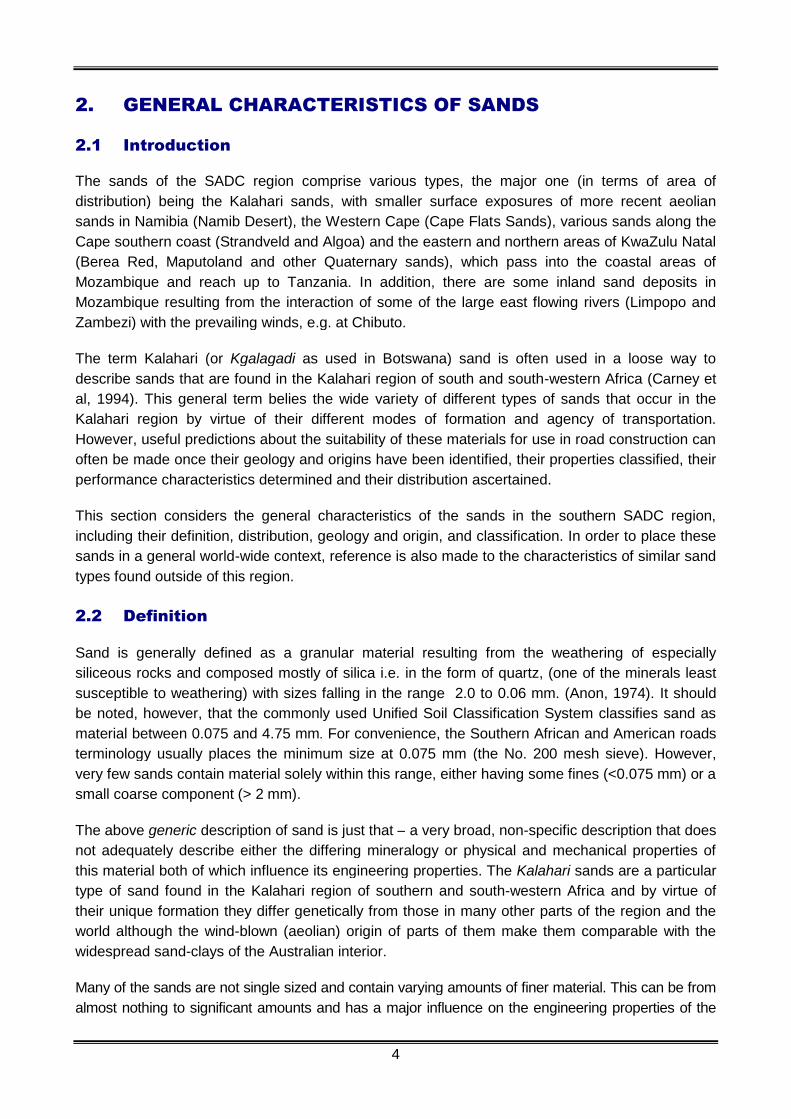
The sands of the SADC region comprise various types, the major one (in terms of area of
distribution) being the Kalahari sands, with smaller surface exposures of more recent aeolian
sands in Namibia (Namib Desert), the Western Cape (Cape Flats Sands), various sands along the
Cape southern coast (Strandveld and Algoa) and the eastern and northern areas of KwaZulu Natal
(Berea Red, Maputoland and other Quaternary sands), which pass into the coastal areas of
Mozambique and reach up to Tanzania. In addition, there are some inland sand deposits in
Mozambique resulting from the interaction of some of the large east flowing rivers (Limpopo and
Zambezi) with the prevailing winds, e.g. at Chibuto.
The term Kalahari (or Kgalagadi as used in Botswana) sand is often used in a loose way to
describe sands that are found in the Kalahari region of south and south-western Africa (Carney et
al, 1994). This general term belies the wide variety of different types of sands that occur in the
Kalahari region by virtue of their different modes of formation and agency of transportation.
However, useful predictions about the suitability of these materials for use in road construction can
often be made once their geology and origins have been identified, their properties classified, their
performance characteristics determined and their distribution ascertained.
This section considers the general characteristics of the sands in the southern SADC region,
including their definition, distribution, geology and origin, and classification. In order to place these
sands in a general world-wide context, reference is also made to the characteristics of similar sand
types found outside of this region.
2.2 Definition
Sand is generally defined as a granular material resulting from the weathering of especially
siliceous rocks and composed mostly of silica i.e. in the form of quartz, (one of the minerals least
susceptible to weathering) with sizes falling in the range 2.0 to 0.06 mm. (Anon, 1974). It should
be noted, however, that the commonly used Unified Soil Classification System classifies sand as
material between 0.075 and 4.75 mm. For convenience, the Southern African and American roads
terminology usually places the minimum size at 0.075 mm (the No. 200 mesh sieve). However,
very few sands contain material solely within this range, either having some fines (<0.075 mm) or a
small coarse component (> 2 mm).
The above generic description of sand is just that – a very broad, non-specific description that does
not adequately describe either the differing mineralogy or physical and mechanical properties of
this material both of which influence its engineering properties. The Kalahari sands are a particular
type of sand found in the Kalahari region of southern and south-western Africa and by virtue of
their unique formation they differ genetically from those in many other parts of the region and the
world although the wind-blown (aeolian) origin of parts of them make them comparable with the
widespread sand-clays of the Australian interior.
Many of the sands are not single sized and contain varying amounts of finer material. This can be from
almost nothing to significant amounts and has a major influence on the engineering properties of the

5
sand to the extent that in Australia, many of the useful sands are actually classified as sand-clays (this
definition would not comply with the Unified Soil Classification System nomenclature (ASTM D 2487)
for a clayey sand.
For the purposes of this Guideline, the discussion in this report is focused on the typical sands found in
the SADC region, including the Kalahari sands, as well as those in the coastal areas of the region.
2.3 Formation
It is generally accepted that there are three conditions necessary for the formation of large bodies
of sands (Bagnold, 1941). These are:
sufficient sources of materials;
geological forces (wind, water, etc.) for continual transportation of sand material from one
place to another and topography conducive for continued deposition;
favourable climatic conditions.
Once disaggregated from the original source rock, the resulting material is then eroded and
transported by either wind, water or ice, often ending up as the deposits of rivers or lakes, as sand
dunes or desserts, or ultimately as sediment in the sea.
Figure 2-1: Formation of sand by erosion and weathering of rocks
After deposition, the sands are, over time, reworked by the movement and infiltration of surface water
and environmental forces. These tend to alter their mineralogical composition through weathering,
leaching and enrichment. In addition, the physical properties of the sand mass and particles are
changed through weathering, cementation, consolidation, particle leaching and/or disintegration.
2.4 Composition
The composition of sand varies from place to place and is largely dependent on the nature of the
source material as well as the weathering process (physical, chemical or both) acting on rock
masses which determine the mineralogical composition of the unconsolidated sands, silts and
clays produced. Transportation of these particles by water and wind will further modify the material
in terms of its particulate size, shape and mineralogical sorting, physical distribution and the
degree and type of secondary consolidation – all of which influence the geotechnical behaviour of
sands in road construction.
For example, the sands found in desert areas, such as the Kalahari Desert in Botswana, tend to be
aeolian (windblown) deposits which have undergone deposition by wind, while those found on
beaches, such as in Cape Town in South Africa, are both commonly dominated by silica (silicon
dioxide SiO2), in the form of quartz (one of the minerals least susceptible to weathering) which has
been derived from weathering and erosion of the mountain ranges nearby.
Many of the sands investigated in this project are clearly of mixed origin, containing particles with a
wide range of sizes, shapes and angularity.

6
2.5 Distribution
The arid and semi-arid areas of the world, which together occupy more than a third of the earth’s
land surface, have a number of characteristics in common, one of which is the occurrence of sands
and sandy materials over large areas of their surface. These sands occur in all seven continents of
the world and, collectively, contain probably the largest source of a naturally occurring material for
possible use in road construction.
As shown in Figure 2-2, there are vast inland deposits of Kalahari sands that cover large areas of
southern Africa, south of the equator. It should be noted that this map only indicates thick inland
sands and does not include areas of sand that may be between 1 and possibly 5 m thick, that
extend well eastwards of the zone indicated. This material forms what is believed to be the largest
continuous stretch of sand in the world. Today, they begin north of the Orange River in South
Africa, embrace the western two-thirds of Botswana, more than a third of Namibia, and stretch
north through eastern Angola, western Zimbabwe and Zambia to the Democratic Republic of the
Congo. Figure 2-2 also shows the extensive deposits of coastal aeolian, littoral and fluvial sands
which occur sporadically around the coast of Southern African.
Figure 2-2: Distribution of sands in southern Africa (Cooke, 1964)
The sands in Botswana are part of a continuous mass of sand extending from the Northern Cape in
South Africa to north of the equator. In South Africa the equivalent sands are classified as the Gordonia
Sand Formation within the Kalahari Group (Brink, 1985; Partridge and Maud, 1987). Kalahari Group
deposits have been intensively studied and found to thicken from their southern limits towards
Botswana, where they occur in deep palaeovalleys, up to 300 m thick, just south of the Botswana
border. The sands of the Gordonia Formation, however, are generally not more than 30 m thick.
Namib

7
More specifically, Baillieul (1975) identified four major sand areas in Botswana, each having distinct
types of Kalahari sand depending on their mode of formation. These are shown in Figure 2-3.
Figure 2-3: Map of Botswana showing the
four major sand areas (after Baillieul, 1975)
2.6 Geology and Origin
The geology and origin of the wide range of sand types that occur worldwide varies considerably.
However, most of them have been produced by some form of rock weathering in which the
constituents have subsequently been transported by wind or water. The following examples
illustrate the diversity of geology and origin of sands worldwide:
Australia: the sand-clays in South Australia (Wylde, 1979) are derived from stranded beach
ridges and consist of rounded to sub-angular quartz grains, cemented together and containing
some clay and iron staining (Sandman et al, 1974). Other Australian sands have been
described as river channel to flood plain, deltaic or wind-blown (Wylde, 1982).
Brazil: the Brazilian sands tend to be derived from the weathering and transport of sandstones
and consist of sand-size quartz with kaolinite and ferruginous oxides (Aranovich and Heyn,
1984).
Fiji: the coral sands of Fiji are derived from the coastal erosion of limestones and consist
predominantly of calcium or magnesium carbonate.
Southern Africa: The original Kalahari sands were derived from the erosion of underlying rock
and subsequent transport and redistribution. This was carried out by rivers into lakes and by
wind. The surficial sands observed today were deposited primarily by wind.
Description of Sand TypesArea I: Fine grained (mean diameter 0.17 to 0.23 mm),well to moderately well sorted, quartz sand with theparticles coated with a skin of red iron oxide. Where theparticles have been affected by water, (fluctuating watertable or adjacent to the Okavango Delta) this coating hasbeen removed and the sands are grey in colour. Thesands have been formed in an aeolian environment.
Area II: The sands are slightly finer (mean diameter 0.14to 0.2 mm) than those from Area I with similar sorting.They comprise particles of two distinct origins - well-rounded polished quartz grains of aeolian origin and finer(0.125 mm), angular feldspathic particles derived fromthe underlying Ghanzi sandstones.
Area III: These sands are similar to those of Area II butlack the feldspathic component. Their compositionreflects that of the underlying Karoo sandstones. Theystill, however, show evidence of an aeolian origin.
Area IV: The sands in Area IV are thin and are directlyrelated to the underlying bedrock. They are coarser thanthe other three types and have been derivedpredominantly by fluvial action and bioturbation.

8
South-eastern South Africa: The Berea Red Sands have a distinct origin, resulting from the
weathering of Mio-Pliocene aeolian calcareous deposits. The feldspathic component of this
material produced a significant clay content (3 to 40%) (Maud and Botha, 2000).
Namibia: The Kalahari Sequence is contiguous with and mostly similar to the Kalahari sands of
Botswana and South Africa and consists primarily of vegetated static dunes. The Sossus Sand
formation of the Namib Sand Sea (desert) is a highly active more recent sand formation
consisting of a wide range of dune types (Lancaster, 1986). These sands are predominantly
quartz with up to 10% feldspar. Coastal sands also occur extensively in the country. A
comprehensive description of the Geology of Namibia has been published which gives more
information on the sands in the country (Miller, 2008).
Mozambique: The sands are mostly the extensive coastal dunes, inland dunes in the southern
provinces, and the sandy terrigenous deposits of the Mocambique and Rovuma sedimentary
basins and Karoo depressions. A number of red and brown sands are listed as Berea-type red
sand and calcareous (i.e. carbonate-containing) and non-calcareous sands. A list of the best
known building sand deposits is given in the Geology and Mineral Resources of Mozambique.
Republica de Mocambique Minesterio dos Recursos Minerais e Energia, Maputo, (Lachelt,
2004).
2.7 Classification
Various systems have been developed to classify soils and provide only a general guide to their
engineering properties of which particle size distribution and plasticity are the principal ones. This
enables engineers to understand the general, rather than the particular, properties of the soils of
other countries or regions.
2.7.1 AASHTO Classification System
An example of such a system that is commonly used in the region is the AASHO (now AASHTO M-
145) system in which soils having approximately the same general load bearing capacity are
grouped together to form seven basic groups which are designated from A-1 to A-7 (Table 2-1). In
general, the best soils for subgrades are classified A-1 and the poorest A-7. Thus, it may be
assumed generally that structural thickness requirements of the pavement progressively increase
as the soil classification group increases from A-1 to A-7.

9
Table 2-1: AASHTO M-145 Classification System for Soils and Soil-Aggregate Mixtures (M145)
The Kalahari and coastal sands typically classify as A-3 or A-2-4 with a few A-1-b materials in both
Mozambique and Namibia (about 4 in each country) and no A-2-5 materials with the AASHTO
classification and SM in the Unified Soil Classification System (ASTM D 2487-06). By way of
comparison, the typical sands in Australia classify similarly (Jewell, 1970; Pederson, 1978; Paige-
Green, 1983) those in Brazil classifying predominantly as A-4 but also as A-2-4, although plasticity
indices are generally higher (Utiyama, 1977). Sands in parts of the Middle East are similar to the
Kalahari sands, classifying primarily as A-3 and A-2-4 with some A-4 materials (Bindra, 1987). The
French have their own 6-group classification system for soils using grading, plasticity and sand
equivalent (Chauvin, undated) – sands are classified as A (1-4) or B (1-6).
The Berea Red Sands of South Africa which grade into southern Mozambique generally classify as
A-2-4 but some of them have been classified as A-6 (Bergh et al, 2008).
2.7.2 British Standard Classification System
This system classifies sand on the basis of three grain sizes as follows:
Coarse: 0.6 – 2.0 mm
Medium: 0.2 – 0.6 mm
Fine: 0.06 – 0.2 mm
The AASHTO, Unified and British classification systems for engineering purposes differentiate sand
type on the basis of differences between the grain diameters. However, such systems may not be
the most useful or convenient scale to use when geological processes which affect the
characteristics of sands that are to be examined (Bagnold, 1941). In such cases, it has been found
far better to use a log-scale which exhibits the ratios between the grain diameters (McManus, 1982).

10
2.7.3 Wentworth Particle Size Classification System (Wentworth, 1922)
The Wentworth scale for measuring grain size uses a geometric interval of ½ to define the limits of
each size fraction in which sand is divided into five sub-categories based on size as follows:
Very coarse sand: 1 – 2 mm
Coarse sand: 0.5 – 1 mm
Medium sand: 0.25 – 0.5 mm
Fine sand: 0.125 – 0.25 mm
Very fine sand: 0.0625 – 0.125 mm
The above sizes are based on the “Φ sediment size scale”, a size scale which is commonly used
in sedimentology (Krumbein and Pettijohn,1938; Folk, 1954) and in which Φ (phi) is the negative
logarithm to the base 2 of the grain diameter. In this scale the use of Φ, an arbitrary and artificially
derived grain size unit, allows the particle size distribution (PSD) to be represented as a single
point on a plot of mean particle size against standard deviation in Φ units and thus allows other
properties of the sands to be related to that plot – an approach that has been used for improved
selection procedures of sand in road construction (Metcalf and Wylde, 1984).
For comparative purposes, Figure 2-4 shows the relationship between grain size data expressed in
Φ units, millimetres and microns (micro meters) (Anderson, undated).
Figure 2-4: Alternative measures of grain size (Φ, mm and microns)
The Phi scaleIn previous research on sediments,
grain size data is given in phi (Ф)
intervals rather than in microns or mm
as statistical and graphic
presentations are much simpler when
phi diameters are used. Phi is defined
as:
Φ = -log2d
where d = particle size in mm.
(A particle size of 0.5 mm = φ of 1 and
a particle size of 0.125 mm = φ value
of 3).
mm

11
In general, the major role of international classification systems, such as the AASHTO system, is to
enable engineers to understand the general, rather than particular, properties of the soils of other
countries and to be able to communicate on a common basis. Thus, a regional system, based on
the properties of regional of sands, will generally be preferable and should be used in conjunction
with broader classifications. This is one of the major aims of the guideline – to customise a broad,
international classification system for sands in general, to one that reflects the performance
characteristics of sands that occur in the SADC region.
As would be apparent from the various classification systems, there are differences in the particle
size range used to define sands with the minimum size varying from 0.06 mm (BS classification) to
0.075 mm (AASHTO classification system). However, from a practical point of view, the difference
in particle size distribution is very small, typically < 1%). Hence, in this manual the different sizes
used to describe sands are used interchangeably.
12
3. PROSPECTING FOR AND TESTING OF SANDS
3.1 Introduction
Because of their extensive occurrence in southern and western Africa, sands are of potentially
major engineering importance for use in the construction of LVRs. However, in an area that is
vast, and has such a variable climate and vegetation as the southern African region, the major
challenge is to find a reliable procedure for locating those sands that are likely to be suitable for
incorporation in a LVR pavement.
3.2 Prospecting
3.2.1 General procedure
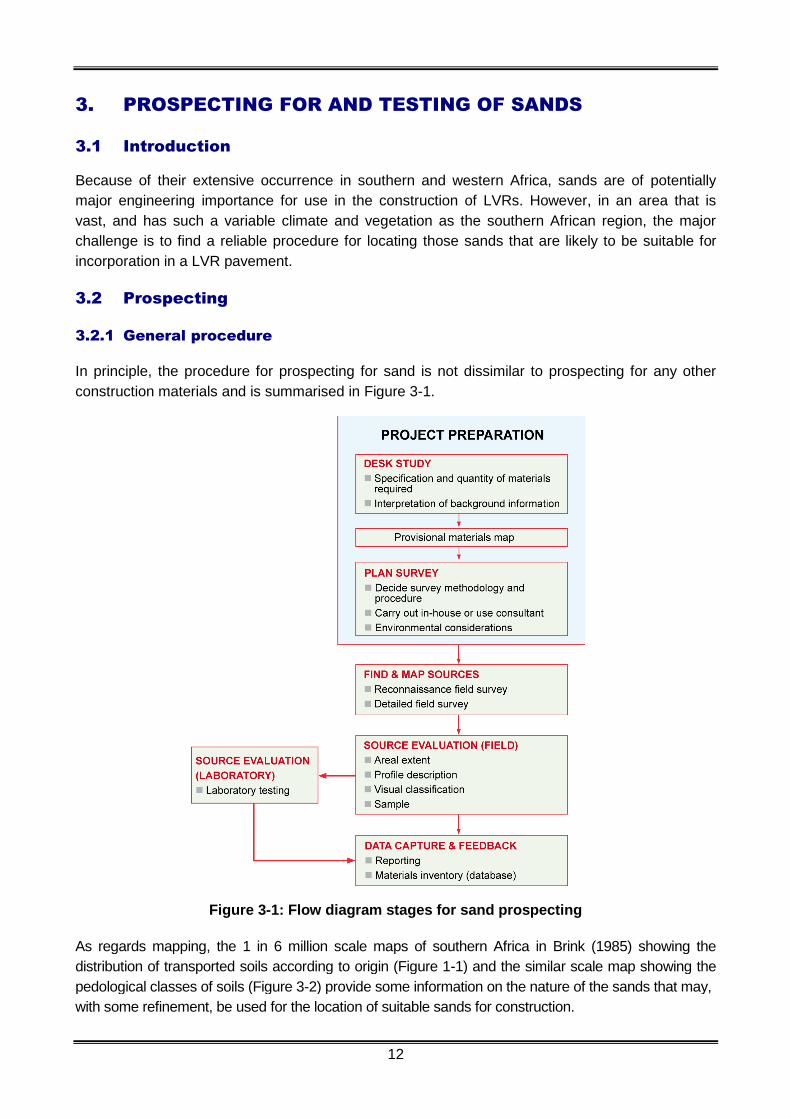
In principle, the procedure for prospecting for sand is not dissimilar to prospecting for any other
construction materials and is summarised in Figure 3-1.
Figure 3-1: Flow diagram stages for sand prospecting
As regards mapping, the 1 in 6 million scale maps of southern Africa in Brink (1985) showing the
distribution of transported soils according to origin (Figure 1-1) and the similar scale map showing the
pedological classes of soils (Figure 3-2) provide some information on the nature of the sands that may,
with some refinement, be used for the location of suitable sands for construction.
13
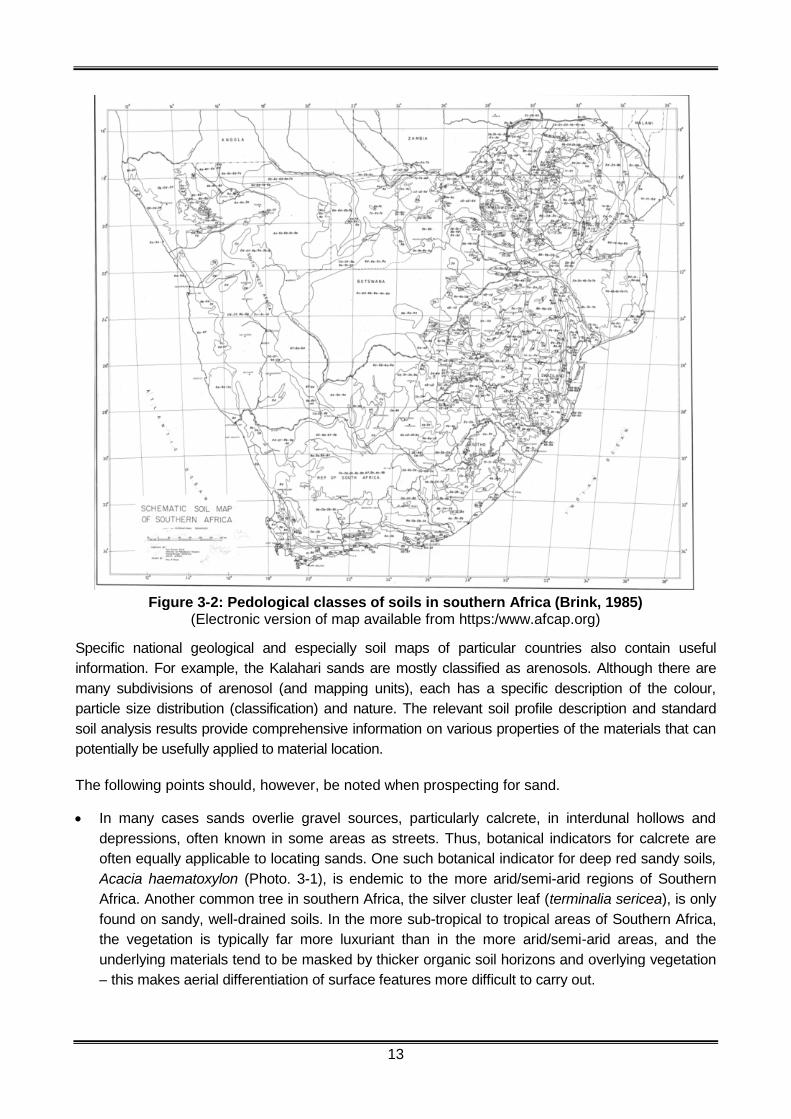
Figure 3-2: Pedological classes of soils in southern Africa (Brink, 1985)(Electronic version of map available from https:/www.afcap.org)
Specific national geological and especially soil maps of particular countries also contain useful
information. For example, the Kalahari sands are mostly classified as arenosols. Although there are
many subdivisions of arenosol (and mapping units), each has a specific description of the colour,
particle size distribution (classification) and nature. The relevant soil profile description and standard
soil analysis results provide comprehensive information on various properties of the materials that can
potentially be usefully applied to material location.
The following points should, however, be noted when prospecting for sand.
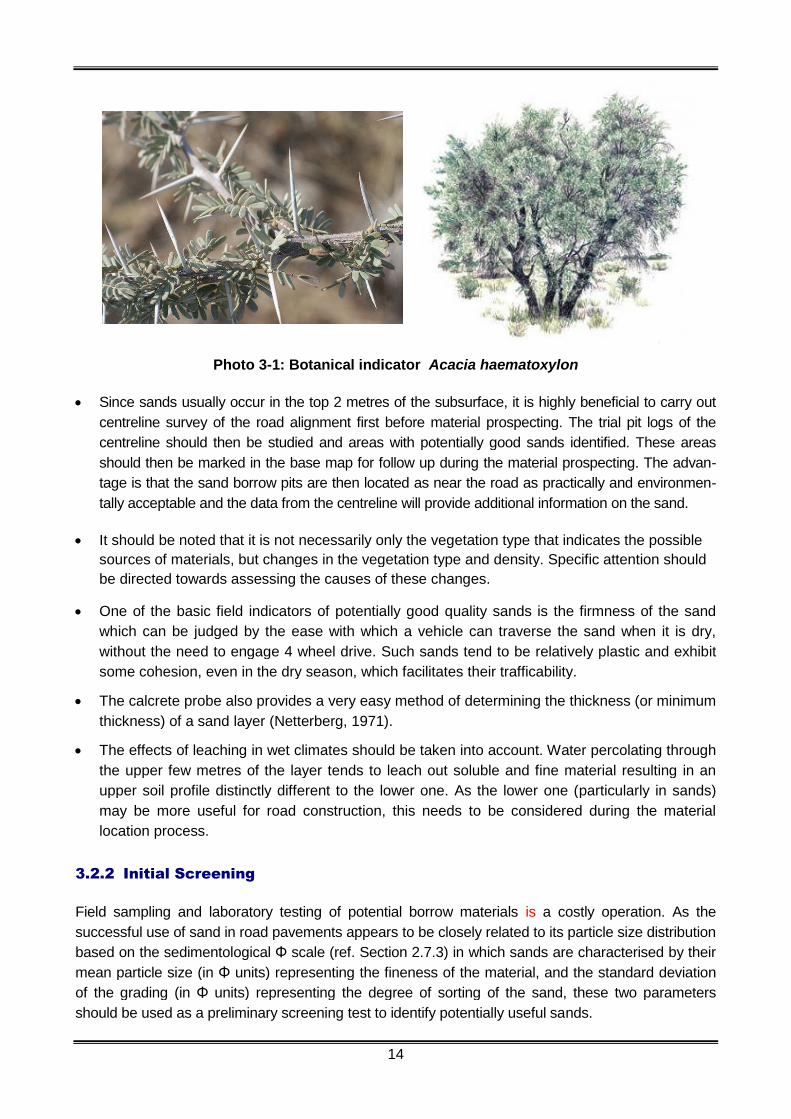
In many cases sands overlie gravel sources, particularly calcrete, in interdunal hollows and
depressions, often known in some areas as streets. Thus, botanical indicators for calcrete are
often equally applicable to locating sands. One such botanical indicator for deep red sandy soils,
Acacia haematoxylon (Photo. 3-1), is endemic to the more arid/semi-arid regions of Southern
Africa. Another common tree in southern Africa, the silver cluster leaf (terminalia sericea), is only
found on sandy, well-drained soils. In the more sub-tropical to tropical areas of Southern Africa,
the vegetation is typically far more luxuriant than in the more arid/semi-arid areas, and the
underlying materials tend to be masked by thicker organic soil horizons and overlying vegetation
– this makes aerial differentiation of surface features more difficult to carry out.
14
Photo 3-1: Botanical indicator Acacia haematoxylon
Since sands usually occur in the top 2 metres of the subsurface, it is highly beneficial to carry out
centreline survey of the road alignment first before material prospecting. The trial pit logs of the
centreline should then be studied and areas with potentially good sands identified. These areas
should then be marked in the base map for follow up during the material prospecting. The advan-
tage is that the sand borrow pits are then located as near the road as practically and environmen-
tally acceptable and the data from the centreline will provide additional information on the sand.
It should be noted that it is not necessarily only the vegetation type that indicates the possible
sources of materials, but changes in the vegetation type and density. Specific attention should
be directed towards assessing the causes of these changes.
One of the basic field indicators of potentially good quality sands is the firmness of the sand
which can be judged by the ease with which a vehicle can traverse the sand when it is dry,
without the need to engage 4 wheel drive. Such sands tend to be relatively plastic and exhibit
some cohesion, even in the dry season, which facilitates their trafficability.
The calcrete probe also provides a very easy method of determining the thickness (or minimum
thickness) of a sand layer (Netterberg, 1971).
The effects of leaching in wet climates should be taken into account. Water percolating through
the upper few metres of the layer tends to leach out soluble and fine material resulting in an
upper soil profile distinctly different to the lower one. As the lower one (particularly in sands)
may be more useful for road construction, this needs to be considered during the material
location process.
3.2.2 Initial Screening
Field sampling and laboratory testing of potential borrow materials is a costly operation. As the
successful use of sand in road pavements appears to be closely related to its particle size distribution
based on the sedimentological Φ scale (ref. Section 2.7.3) in which sands are characterised by their
mean particle size (in Φ units) representing the fineness of the material, and the standard deviation
of the grading (in Φ units) representing the degree of sorting of the sand, these two parameters
should be used as a preliminary screening test to identify potentially useful sands.

15
The use of the relatively simple sedimentological Φ scale, which is illustrated in Figure 3-3 (Wylde,
1979), can be beneficial as a preliminary screening test before carrying out large scale sampling and
laboratory testing. Sands suitable for base course would typically plot in Zone B whilst those that that
plot in Zones A, C or D would not be expected to perform satisfactorily due to insufficient fines to bind
the material (Zone A), or being difficulty to handle during construction (Zones C and D).
Figure 3-3: Particle size distribution (Phi units) related to performance zones
Figures 3-4, 3-5 and 3-6, 3-7 show the distribution of the mean (Phi units) and standard deviation
(Phi units) of the sands from Mozambique and Namibia respectively using a kriging technique. The
B indicators on all the maps fall within the B zone of the Wylde Chart
Figure 3-4: Distribution of mean (Phi units) Figure 3-5: Distribution of SD (Phi units)
of sands in Mozambique of sands in Mozambique

16
Figure 3-6: Distribution of mean (Phi units) Figure 3-7: Distribution of SD (Phi units)
of sands in Namibia of sands in Namibia
From the Mozambique distribution, it appears that the southern Limpopo river area (and the
Olifants River (Rio dos Elefantes) towards the west) show a strong trend of coarser and better
sorted materials.
From the Namibian distribution it appears that the coarser materials occur in the Namib desert
areas becoming slightly finer towards the east and significantly finer towards the north. The
materials also become better sorted towards the east and poorly sorted as one moves north.
These trends can be used as early indicators during material location exercises, but need
additional data to fill the larger gaps for material selection for specific projects.
3.3 Testing
The testing of sands should generally follow standard techniques, although certain inherent
characteristics of this material require special consideration as discussed below.
3.3.1 Test methods
It should be noted that there are significant differences between certain test methods specified by
the BS standards and the TMH methods, particularly with respect to plasticity index and bar linear
shrinkage. Moreover, some countries (e.g. Botswana, Namibia and South Africa) use TMH1-type
test methods whilst other countries in the SADC region (e.g. Tanzania, Malawi) use BS methods. It
is therefore important not to mix test methods because the differences in some test procedures will
produce different results. The recently revised South African SANS test methods have been used,
where available, to replace the TMH1 test methods, in the testing of the sand samples.

17
3.3.2 Grading
The grading of sands should always be carried out using a wet preparation method such as SANS
3001: GR1 (equivalent to TMH1 Methods A1(a) and A5 (NITRR, 1986) in order to ensure that all
cementing bridges are broken and that the small quantities of plastic fines are released for
determination of the Atterberg Limits. The standard range of sieves employed and recommended
in TMH1 includes only the 0.425 and 0.075 mm screens that will typically retain any sand material.
It is recommended that for these materials, the 0.300 (or (0.250) and 0.150 screens are also
included and where the fraction passing 0.075 mm exceeds about 12 per cent, a hydrometer or
pipette analysis is also carried out using ASTM, BS or SANS GR3:2012). This will give a better
indication of the distribution and sorting of the material.
Studies in Australia (Wylde, 1982) indicate that, despite the relatively fine nature of sands, the
process of excavation, mixing and compaction physically damages the sand constituents, particularly
releasing the fines. It is thus desirable that grading analyses for design are carried out on material
that has been subjected as far as possible to a process or processes that simulate these actions.
This, of course, applies to materials complying with any specification, e.g. COLTO, 1998.
3.3.3 Atterberg Limits and Linear Shrinkage (Soil Constants)
Routine testing of the Atterberg Limits following TMH1 Methods A2 and A3 (NITRR, 1986) (SANS:
3001: GR10, GR11 and GR12) usually indicates that the materials are non- or slightly plastic. For
sands, it is imperative that the Atterberg Limits are determined on the fraction finer than 0.075 mm,
this almost invariably giving a Plasticity Index (PI) in the range 5 to 27 in the samples tested, with
more than 9 samples giving a PI in excess of 20%. This property can then be expressed as the
Fineness Index (FI) (Mainwaring, 1968), which is the product of the PI on 0.075 mm sieve and the
percentage passing the 0.075 mm sieve. This property is a useful indicator of the compactability of
sandy materials. as discussed in a following section.
From experience of testing the Kalahari sands in Botswana, it is noteworthy that the use of the
Cassagrande bowl type Liquid Limit Device (as adopted in TMH1) proved to be unsuitable for
determining the Liquid limit of the relatively less plastic sands. This was because there was a
tendency for the groove that was cut in the paste either not to close or to slump on the first blow
during the operation of the device. For this reason, it was necessary to resort to the use of the BS
1377 Cone Penetrometer for determining the Liquid Limit of the sand samples. It is important to note
that both the BS cone and cup Liquid Limit devices yield a Liquid Limit and therefore also a PI on
average 4 units higher than the TMH1 ASTM type of LL device (Sampson and Netterberg, 1984).
The bar linear shrinkage should always be measured with the Atterberg Limits which should also be
done on the minus 75 μm fraction. A method of preparing the 0.075mm fines for the determination of
soil constants is given in SANS 3001-GR1.
3.3.4 Compaction characteristics
Laboratory investigations carried out by many practitioners reveal that Kalahari sands do not
always exhibit the typical parabolic dry density/moisture content curve exhibited by other soils
(Figure 3-8). Instead, the compaction characteristics of some of these sands are such that they
can be compacted over a wide range of moisture contents, without a significant change in density.

18
Figure 3-8: Typical forms of compaction curve for sands.
For some Kalahari sands, the density obtained in a dry condition can be markedly greater than that
obtained at any finite moisture content. However, as much as there may be a temptation to employ
“dry compaction” in practice, other pertinent factors are noteworthy. For example, high air voids
and high soil suction values both have a potential for causing post-construction problems (albeit
reduced ones in semi-arid climates) such as greater susceptibility to loss of strength, should the
degree of saturation increase in service, resulting in deformation of the pavement structure.
Materials compacted in their dry state also do not have an inherent strength developed by soil
suction as they dry back from the optimum moisture content. It is often necessary to place a thin
rubber disk on the sand during laboratory compaction in order to facilitate densification of the upper
layer. During the compaction of the red sands investigated in this work, rubber disks were not
necessary.The laboratory compaction of fine cohesionless materials using dynamic compaction
methods (e.g. TMH1 method A7 (NITRR, 1986) (SANS 3001: GR30) can be difficult, producing
unreliable results due to shearing of the material during compaction. The use of the BS 1377
vibrating hammer method (Test 14) (British Standards Institution, 1990) is thus recommended. As
indicated from research work carried out in Botswana (Guideline No. 11 – The Use of Kgalagadi
Sands in Road Construction) and illustrated in Figures 3-8 and 3-9, the benefits of using vibratory
over dynamic compaction for a given sand type are: (1) a reduction in air voids, (2) an increase in
density and (3) an increase in strength (CBR).
Figure 3-9: Density/voids relationship Figure 3-10: CBR/compaction relationship

19
In practice, therefore, the full strength potential of sand can be better exploited by specifying that
the stipulated maximum dry density be assessed by the laboratory vibrating test method rather
than the dynamic test method.
Sands with little or no cohesion can be compacted using the traditional TMH1 dynamic compaction
technique, but they usually require a rubber mat on the surface to avoid excessive displacement of the
sand.
3.3.5 Strength
The California Bearing Ratio (CBR) is traditionally used for the specification and control of road
construction materials. This test normally uses a dynamic compaction technique. Where the
density of the material is specified to be tested using a vibrating hammer, the CBR should be
carried out on specimens prepared in the same manner and to the same density. However, the use
of the Dynamic Cone Penetrometer (DCP) for measuring a soils resistance to penetration (DN
value), both in the field and the laboratory, is considered to be a simpler and more appropriate
approach than the laboratory CBR based methods. The DN values provide a critical input to the
DCP pavement design method which is described in Chapter 7.
3.3.6 Salinity
Salinity of the sands can be tested using the electrical conductivity as described in Guideline 6
(Botswana Roads Department, 2001). It is suggested that either the quick method provided in
Guideline 6 or the TMH1 (Method A21) (NITRR, 1986)is used.
3.3.7 Durability
The durability of sand as a construction material is seldom a problem. Materials with high non-
quartz contents may include soft feldspar or basalt grains. The effect of these can be assessed by
carrying out an extended sand equivalent test. In this test, the standard method is followed and the
test is repeated with 10 minutes of agitation. A significant increase in the sand equivalent value for
the latter test indicates the potential for softer particles to degrade in service.
3.3.8 Collapse settlement
Where it is suspected that the material may have a collapsible structure, for example, when the
material excavated from an inspection pit is insufficient to re-fill the pit, oedometer testing should
be carried out to assess the collapse potential. Although the double oedometer test is regarded as
the classical means of quantifying collapse, a single oedometer test known as the collapse
potential test is simpler and quicker. In this test, a sample is loaded to 200 kN and then saturated
(Brink, 1985). The reduction in voids ratio is mathematically expressed as the collapse potential
and this related to the thickness of potentially collapsible material can quantify the magnitude of
collapse that could occur.
3.3.9 Mineralogy and chemical properties
Specialised techniques such as X-ray diffraction (XRD) and X-ray fluorescence (XRF) can be used
to determine the mineralogical and chemical composition of sands respectively. However, these
techniques are relatively expensive to use and only in exceptional cases will provide any additional
information that will materially affect the use of the sand.

20
4. PROPERTIES OF SANDS
4.1 Introduction
As may be inferred from the work done by Baillieul (1975) and others (Carney, et al, 1994; Brink,
1985) the sands of the Kalahari region occur either as:
aeolian (windblown) deposits which have undergone redistribution by wind, or as
soils of mixed origin which have resulted through the operation of a number of processes
including bioturbation, redistribution by wind during arid periods, and pedogenesis.
Because of their different modes of formation, the sands in the SADC region would be expected to
display very different engineering properties which affect their use in road construction. In order to
investigate these properties, an extensive sampling and laboratory testing programme was carried
out in Namibia and Mozambique as described below.
4.2 Locations of Sands Investigated
4.2.1 General approach
The sand sampling sites have been identified on the basis of expected differences in the sand
properties and with the objective of achieving as wide a geographical coverage as possible. The
sites were selected based on consideration of the following:
satellite imagery,
soils and geology maps,
local information from the roads agencies
discussions with other individuals familiar with the local terrain
The maps showing the distribution of transported soils in southern Africa provided in Brink (Brink,
1985) proved particularly useful to differentiate between the sand types in Namibia and
Mozambique.
Once the different areas had been delimited on the maps, Google Earth was used to identify
approximately fifty sites each in Namibia and Mozambique where 10 kg samples were to be
obtained for laboratory testing. In order to ensure that the samples were representative of those
likely to be used in practice, existing (old) borrow pits that could be located on Google Earth were
used as far as possible. However, during the sample collection, minor changes were made as
necessary to locate suitable materials. Some of the expected borrow pits were no longer visible or
accessible. In many cases, samples were taken at two depths in order to obtain both leached and
unleached materials.
Investigations were also undertaken to locate roads in Mozambique, Namibia and South Africa
where sand had been used as neat base course. The occurrence of such roads would provide an
excellent opportunity to evaluate their performance and to extract samples for appropriate
laboratory testing to compare the properties of the sands used in their construction with those
sands in Botswana that had performed successfully as neat base course over an extended period
of time.

21
4.2.2 Site locations - Mozambique
The majority of sands in Mozambique occur in the southern half of the country, although the
coastal sands re-appear in the extreme north eastern areas running into Tanzania. Sampling was
thus mainly centred in the coastal areas of the south and eastern regions and the interior fluvio-
aeolian sands.
The sites chosen for sampling are pin-pointed on the Google Earth map and are presented in
Figure 4-1. The co-ordinates of the sampling locations are presented in the Sampling, Laboratory
Testing and Analysis of Results report (InfraAfrica et al, 2012). These coordinates were not meant
to precisely define the sand sample location but, rather, to provide guidance on the approximate
location of the sample which, in the field, depended on the prevailing ground conditions and other
related considerations.
Figure 4-1: Location of sand samples in Mozambique
22
One site was located on an experimental section on the Cuabama-Chacane road in Inhambane
Province where a 2 km section of neat, red sand was used as base course. This experimental
section was constructed in May 2011 as part of an AFCAP supported project – Targeted
Interventions on Low Volume Rural Roads in Mozambique. Bulk samples were extracted for
appropriate laboratory testing.
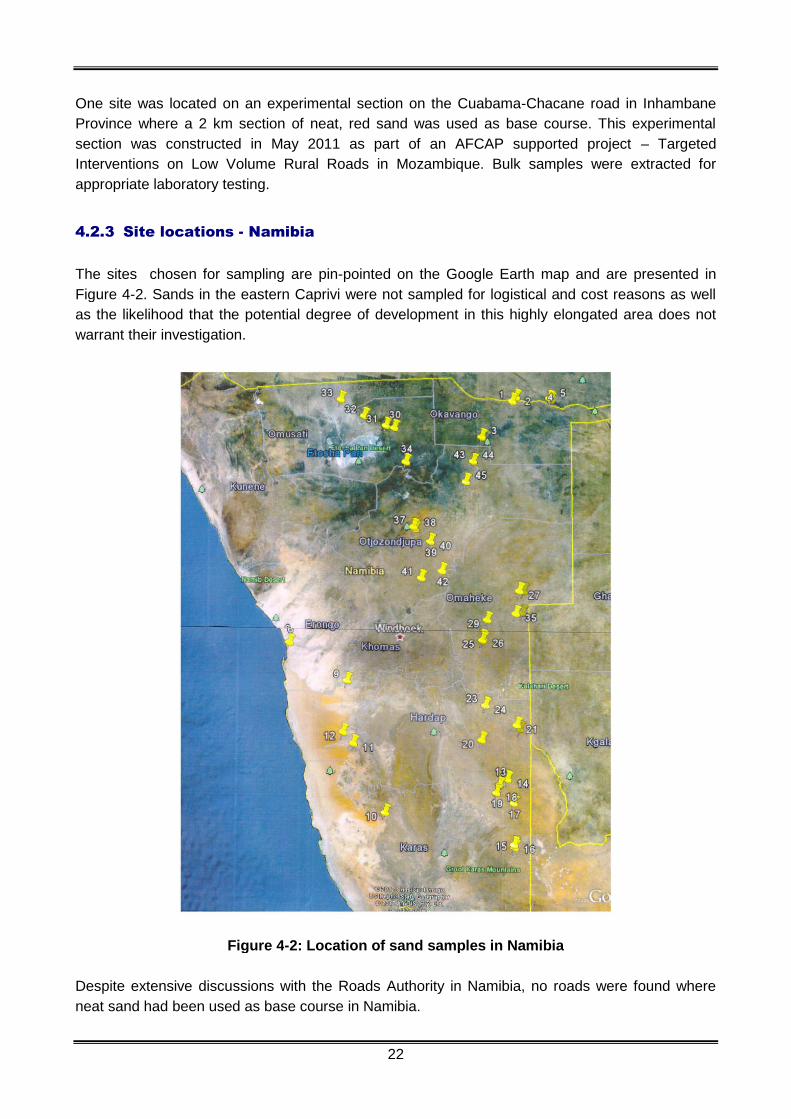
4.2.3 Site locations - Namibia
The sites chosen for sampling are pin-pointed on the Google Earth map and are presented in
Figure 4-2. Sands in the eastern Caprivi were not sampled for logistical and cost reasons as well
as the likelihood that the potential degree of development in this highly elongated area does not
warrant their investigation.
Figure 4-2: Location of sand samples in Namibia
Despite extensive discussions with the Roads Authority in Namibia, no roads were found where
neat sand had been used as base course in Namibia.
23
4.2.4 Site locations – South Africa
One site was located in the Free State Province in South Africa along the Hoopstad-Bultfontein
road where a neat, 90m long road section with a red sand base course was constructed in 1962 as
part of a soil stabilisation experimental project. Bulk samples were extracted from the section for
laboratory testing similar to that carried out for the on-road sections from Mozambique.
4.3 Laboratory Testing
A wide-ranging laboratory testing programme was developed to fully characterise the properties of
the sands. The following tests were carried out:
4.3.1 Sand samples
(1) Particle size distribution- Sieve analysis – Standard SANS 3001: GR1:2011 test with extra sieves (0.3 mm, 0.6
mm, 0.85 mm and 1.18 mm).
- Hydrometer analysis - SANS 3001:GR3 (oven-dried preparation)
(2) Atterberg limits (on fraction passing 0.425 mm and 0.075 mm sieves)
- Liquid Limit (SANS GR12:2010)
- Plastic Limit and Bar Linear shrinkage (SANS 3001: GR10:2011)
- Liquid Limit using BS 1377-2 1990.
(3) Description
- Soil classification (AASHTO M145 and ASTM D2487)
- Soil colour (Munsell Colour (air dried and at the liquid limit (on minus 0.425 mm fraction
used for bar linear shrinkage test before placing in oven to dry)
4.3.2 Selected representative samples
- Field Moisture Equivalent (FME) (AASHTO T93-86). - to determine particle shape and
texture.
- Pedological description and origin
- Free Fe and Al contents – CBD method (Loock, 1990), XRD and XRF methods
- Organic matter content
4.3.3 Bulk samples (from road sections)
- All tests listed in Section 4.3.1
- MDD/OMC/CBR
3 compactive efforts
CBR at varying moisture contents (soaked, OMC (after 4 days equilibriation), and
dried back after 4 days equilibriation to 75, 50 and 25% OMC.
24
4.4 Physical Properties
4.4.1 Colour
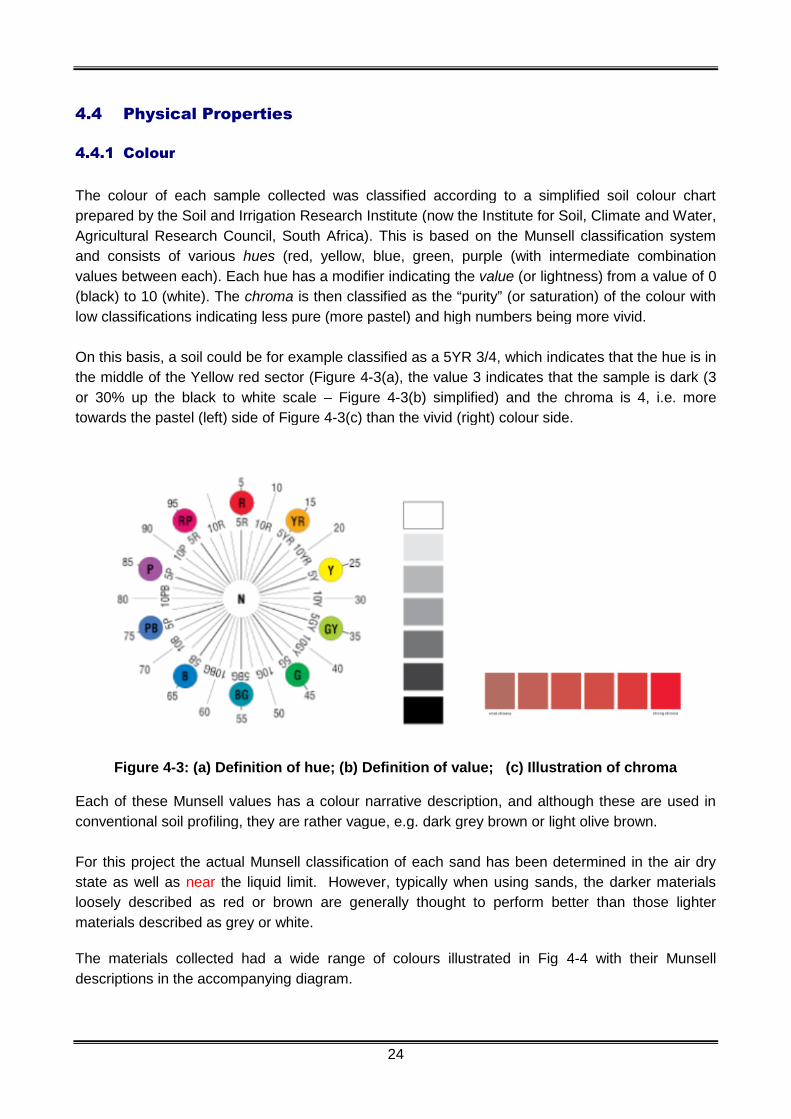
The colour of each sample collected was classified according to a simplified soil colour chart
prepared by the Soil and Irrigation Research Institute (now the Institute for Soil, Climate and Water,
Agricultural Research Council, South Africa). This is based on the Munsell classification system
and consists of various hues (red, yellow, blue, green, purple (with intermediate combination
values between each). Each hue has a modifier indicating the value (or lightness) from a value of 0
(black) to 10 (white). The chroma is then classified as the “purity” (or saturation) of the colour with
low classifications indicating less pure (more pastel) and high numbers being more vivid.
On this basis, a soil could be for example classified as a 5YR 3/4, which indicates that the hue is in
the middle of the Yellow red sector (Figure 4-3(a), the value 3 indicates that the sample is dark (3
or 30% up the black to white scale – Figure 4-3(b) simplified) and the chroma is 4, i.e. more
towards the pastel (left) side of Figure 4-3(c) than the vivid (right) colour side.
Figure 4-3: (a) Definition of hue; (b) Definition of value; (c) Illustration of chroma
Each of these Munsell values has a colour narrative description, and although these are used in
conventional soil profiling, they are rather vague, e.g. dark grey brown or light olive brown.
For this project the actual Munsell classification of each sand has been determined in the air dry
state as well as near the liquid limit. However, typically when using sands, the darker materials
loosely described as red or brown are generally thought to perform better than those lighter
materials described as grey or white.
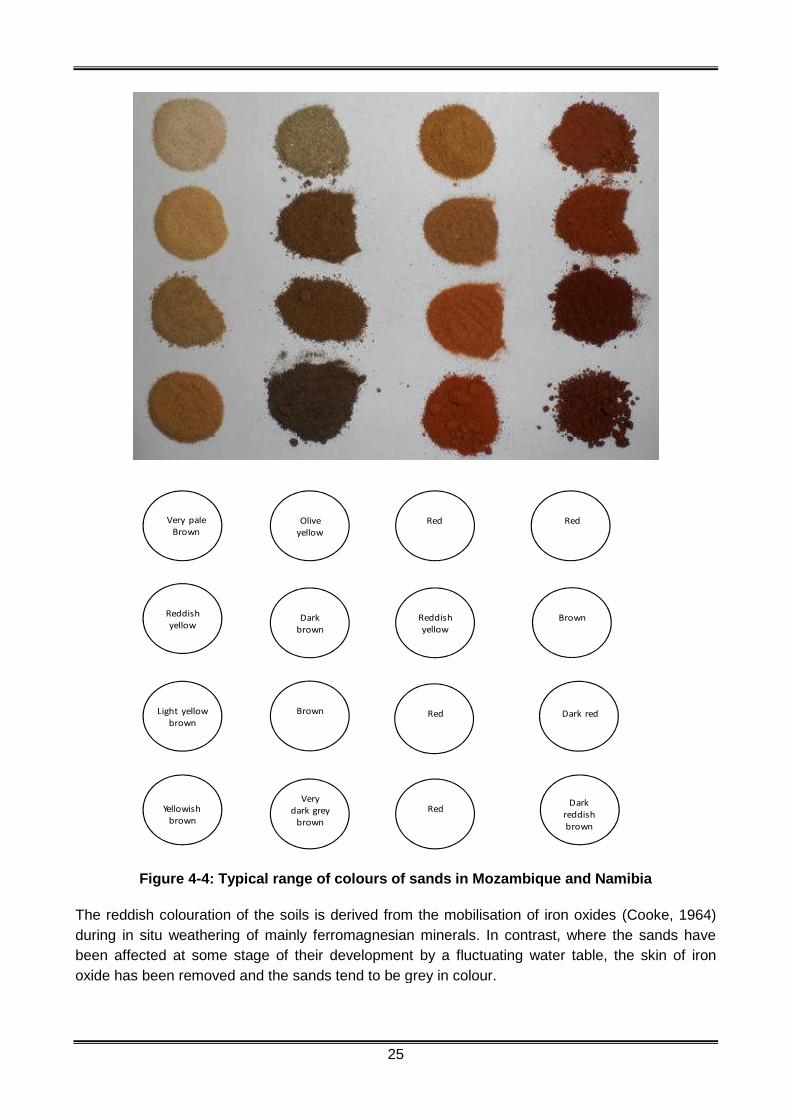
The materials collected had a wide range of colours illustrated in Fig 4-4 with their Munsell
descriptions in the accompanying diagram.
25
Very paleBrown
Oliveyellow
Darkbrown
Brown
Verydark grey
brown
Yellowishbrown
Light yellowbrown
Reddishyellow
Brown
Red
Red
Red
Reddishyellow
Red
Darkreddishbrown
Dark red
Figure 4-4: Typical range of colours of sands in Mozambique and Namibia
The reddish colouration of the soils is derived from the mobilisation of iron oxides (Cooke, 1964)
during in situ weathering of mainly ferromagnesian minerals. In contrast, where the sands have
been affected at some stage of their development by a fluctuating water table, the skin of iron
oxide has been removed and the sands tend to be grey in colour.
26
4.4.2 Grading
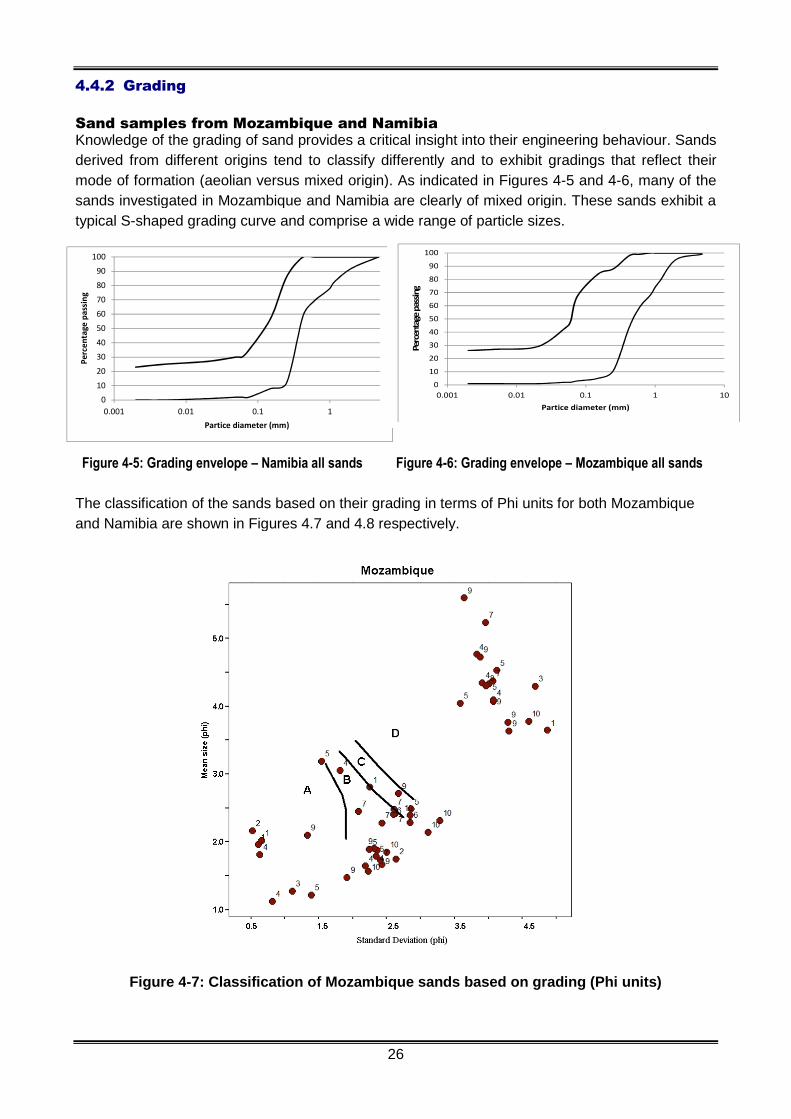
Sand samples from Mozambique and NamibiaKnowledge of the grading of sand provides a critical insight into their engineering behaviour. Sands
derived from different origins tend to classify differently and to exhibit gradings that reflect their
mode of formation (aeolian versus mixed origin). As indicated in Figures 4-5 and 4-6, many of the
sands investigated in Mozambique and Namibia are clearly of mixed origin. These sands exhibit a
typical S-shaped grading curve and comprise a wide range of particle sizes.
Figure 4-5: Grading envelope – Namibia all sands Figure 4-6: Grading envelope – Mozambique all sands
The classification of the sands based on their grading in terms of Phi units for both Mozambique
and Namibia are shown in Figures 4.7 and 4.8 respectively.
Figure 4-7: Classification of Mozambique sands based on grading (Phi units)
0
10
20
30
40
50
60
70
80
90
100
0.001 0.01 0.1 1
Per
cen
tage
pas
sin
g
Partice diameter (mm)
0
10
20
30
40
50
60
70
80
90
100
0.001 0.01 0.1 1 10
Perc
enta
gepa
ssin
gPartice diameter (mm)
27
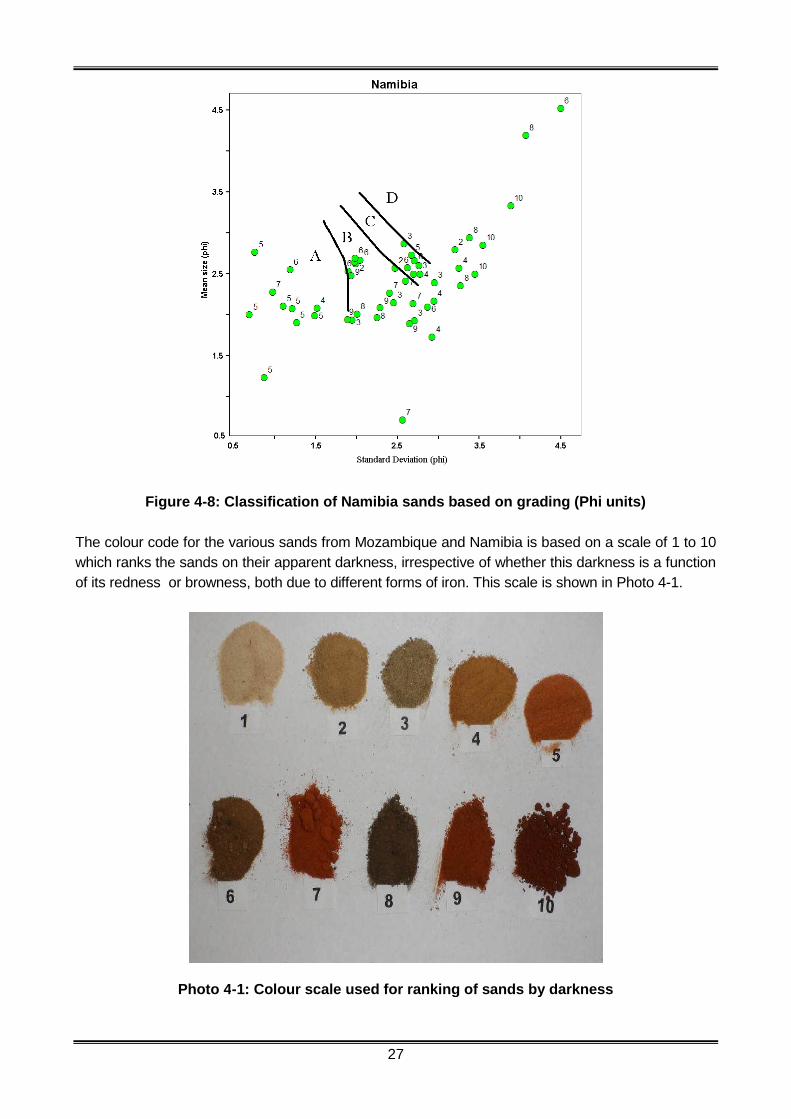
Figure 4-8: Classification of Namibia sands based on grading (Phi units)
The colour code for the various sands from Mozambique and Namibia is based on a scale of 1 to 10
which ranks the sands on their apparent darkness, irrespective of whether this darkness is a function
of its redness or browness, both due to different forms of iron. This scale is shown in Photo 4-1.
Photo 4-1: Colour scale used for ranking of sands by darkness

28
Of the 99 samples collected and tested (the results of 3 were disregarded as they were classified
as gravels and not sands) 36 of them (36.4% of the total) plot within the Wylde chart B zone and,
based on experience in Australia and Botswana, are potentially suitable for use as neat base
course in a low volume road pavement. These 36 samples were subjected to detailed examination
which revealed the following observations.
Sands from Mozambique and Namibia plotting in Zone B exhibit a wide range of colours –
not just red/dark red (Code 4, 5, 7, 9 and 10 in Figure 5) as was the case in the
experimental road section in Botswana where red sand was used successfully as neat base
course.
Only 9 samples (24.0%) were red coloured sands whilst 17 samples (47.2%) were dark
sands (colour code > 6) and the remaining 10 samples (27.8%) were light coloured sands
(colour code < 3).
Significantly, the red sands used as neat base course in the ANE sections in Mozambique
plot in Zone B of the Wylde Chart, as was the case with the red sands that were used
successfully as experimental neat base course in Botswana.
An analysis of the particle size distribution of the sands from Mozambique and Namibia that plot in
Zone B is shown in Figures 4-9 and 4-10 respectively.
Figure 4-9: Mozambique: Grading envelope Figure 4-10: Namibia: Grading envelope forfor sands in B Zone (red) of the Wylde Chart sands in B Zone (red) of the Wylde Chart
From analysis of the sands that plot in Zone B of the Wylde Chart, the following findings emerge:
The grading moduli of the Namibian sands in Zone B ranged between 0.82 and 1.34 and
those from Mozambique between 0.83 and 1.24, a relatively wide range for sands. This
indicates the coarseness of some of these sands, comparable with the range for selected
red and yellow sands from Mozambique described by de Vos (2007). It also indicates that
there are no significant differences in the gradings of the different coloured materials that
plot within the B zone of the chart.
Within the red sands alone from Namibia, the GM varied between 0.91 and 1.24 and from
Mozambique between 0.65 and 1.34
As would be apparent from Figures 4-9 and 4-10, the grading envelopes for both the Mozambique
and Namibia sands are somewhat narrower (P075 of 2-12%) than the envelope for the entire
Mozambican and Namibian data as presented in Figures 4-5 and 4-6 (P075 of 2 – 25%). It seems
likely, therefore, that the shear strength of the sands reduces when fines exceed about 12%. Thus,
it would appear that grading is the dominant feature affecting the potential performance of sands
as structural materials, with aspects such as the colour and angularity probably having a
secondary influence. As a result, grading in Phi units should be considered as the primary indicator
for identifying potentially useful sands.

29
Sand samples from experimental sections
In addition to the sand samples collected from Mozambique and Namibia, samples were also
collected from the base course of two experimental sections where neat sand had been used as
base course - one in Botswana from the Serowa-Orapa experimental section and the other in
South Africa from the Hoopstad-Bultfontein experimental section. These experimental sections
have performed satisfactorily for 23 and 50 years respectively and have both carried in the region
of ± 0.5 MESA.
Plotting the results obtained from the Serowe-Orapa and Hoopstad – Bultfontein experimental
sections, indicates that these materials do not fall into Zone B but all fall in Zone A (ref. Figure 4-
11). It would thus appear that although the materials do not have as much fines (as wide a grading)
as those in Zone B, they are generally a little finer and the upper portion of the line separating
Zones A and B could perhaps be moved towards the left to include these materials as indicated in
Figure 4-11. This can only be checked against more performance-related samples and further
comparison of these materials based, for example, on DCP/DN tests as discussed in Section 5-2.
0.5
1.5
2.5
3.5
4.5
0.5 1.5 2.5 3.5 4.5
Mean
size
(phi
)
Standard Deviation (phi)
Wylde Plot Namibia
Namibia
Hoopstad drainage
Orapa
Hoopstad road
B
CD
A
Figure 4-11: Classification of all sands based on grading (Phi units)
It should also be noted that the Hoopstad-Bultfontein samples were brown and not red as many of
the other successful samples have been.
4.4.3 Plasticity
Sands exhibit some variation in plasticity depending primarily on their mode of formation and the
consequent presence or not of either clay minerals or, possibly in some cases, salts deposited by
the evaporation of salt-laden ground water. Determination of plasticity in the traditional manner,
i.e. on material passing the 0.425 mm sieve (P425), invariably tends to mask the plasticity that can
be mobilised in the silt and clay fraction of the sand (P075). Many sands show non- or only slight
plasticity on the P425 fraction but significant plasticity on the P075 fraction. This characteristic is of
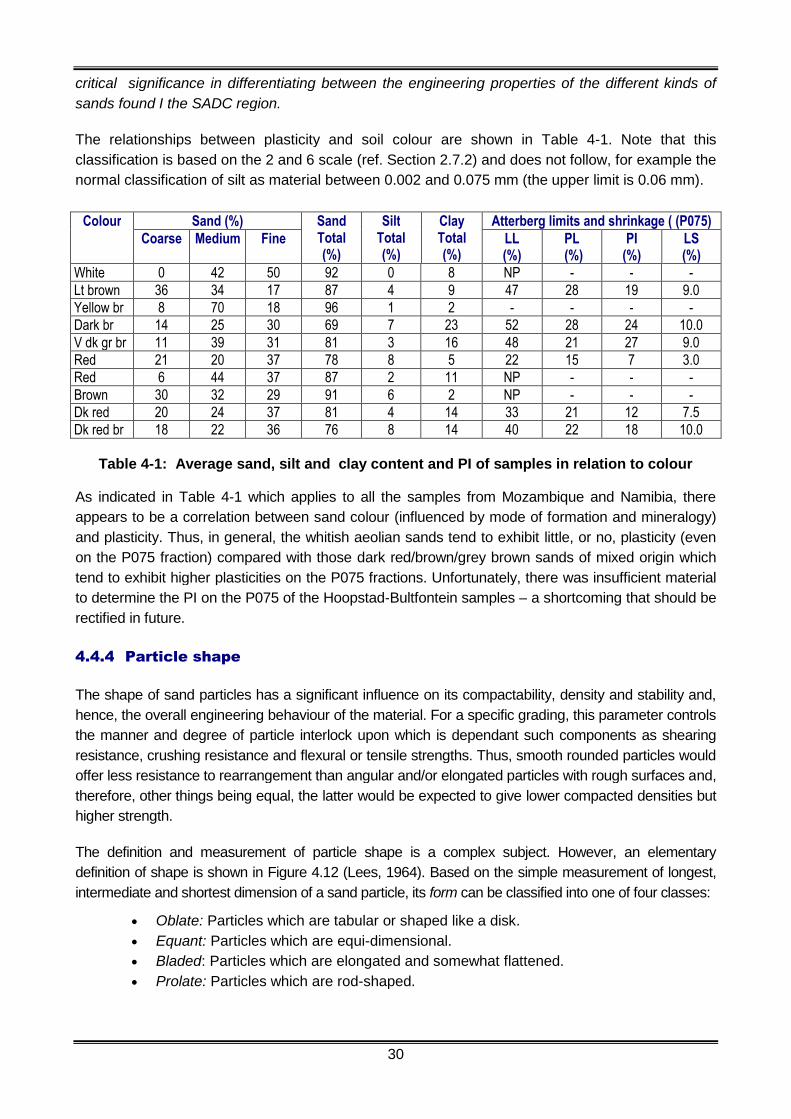
30
critical significance in differentiating between the engineering properties of the different kinds of
sands found I the SADC region.
The relationships between plasticity and soil colour are shown in Table 4-1. Note that this
classification is based on the 2 and 6 scale (ref. Section 2.7.2) and does not follow, for example the
normal classification of silt as material between 0.002 and 0.075 mm (the upper limit is 0.06 mm).
Sand (%) Atterberg limits and shrinkage ( (P075)ColourCoarse Medium Fine
SandTotal(%)
SiltTotal(%)
ClayTotal(%)
LL(%)
PL(%)
PI(%)
LS(%)
White 0 42 50 92 0 8 NP - - -Lt brown 36 34 17 87 4 9 47 28 19 9.0Yellow br 8 70 18 96 1 2 - - - -Dark br 14 25 30 69 7 23 52 28 24 10.0V dk gr br 11 39 31 81 3 16 48 21 27 9.0Red 21 20 37 78 8 5 22 15 7 3.0Red 6 44 37 87 2 11 NP - - -Brown 30 32 29 91 6 2 NP - - -Dk red 20 24 37 81 4 14 33 21 12 7.5Dk red br 18 22 36 76 8 14 40 22 18 10.0
Table 4-1: Average sand, silt and clay content and PI of samples in relation to colour
As indicated in Table 4-1 which applies to all the samples from Mozambique and Namibia, there
appears to be a correlation between sand colour (influenced by mode of formation and mineralogy)
and plasticity. Thus, in general, the whitish aeolian sands tend to exhibit little, or no, plasticity (even
on the P075 fraction) compared with those dark red/brown/grey brown sands of mixed origin which
tend to exhibit higher plasticities on the P075 fractions. Unfortunately, there was insufficient material
to determine the PI on the P075 of the Hoopstad-Bultfontein samples – a shortcoming that should be
rectified in future.
4.4.4 Particle shape
The shape of sand particles has a significant influence on its compactability, density and stability and,
hence, the overall engineering behaviour of the material. For a specific grading, this parameter controls
the manner and degree of particle interlock upon which is dependant such components as shearing
resistance, crushing resistance and flexural or tensile strengths. Thus, smooth rounded particles would
offer less resistance to rearrangement than angular and/or elongated particles with rough surfaces and,
therefore, other things being equal, the latter would be expected to give lower compacted densities but
higher strength.
The definition and measurement of particle shape is a complex subject. However, an elementary
definition of shape is shown in Figure 4.12 (Lees, 1964). Based on the simple measurement of longest,
intermediate and shortest dimension of a sand particle, its form can be classified into one of four classes:
Oblate: Particles which are tabular or shaped like a disk.
Equant: Particles which are equi-dimensional.
Bladed: Particles which are elongated and somewhat flattened.
Prolate: Particles which are rod-shaped.

31
Figure 4-12: Particle shape
The above classification is a broad one and shape can be further described in terms of different
degrees of roundness as illustrated in shown in Figure 4-13.
Figure 4-13: Degree of particle roundness
The particle shape of representative samples was examined visually using a low magnification
binocular microscope. As indicated in Photos 4-2 and 4-3, the sands exhibit a wide range in
particle shape, which is influenced by their mode of formation. In this regard, aeolian sands tend to
exhibit a more rounded shape (Photo 4-2) than sands of mixed origin (Photo 4-3). This is a factor
that significantly influences their compactability characteristics and related strength and bearing
capacity as discussed above (Semmelink, 1992).
4.4.5 Particle density
Testing of the apparent and bulk relative density (ARD and BRD) and water absorption (WA) was
carried out. The results are summarised in the Table 4-2.
Photo 4-2: Example of well rounded, wellsorted sand (circled particle = 0.5 mm dia.)
Photo 4-3: Example of poorly sorted, angular tosub-rounded sand (circled particle = 1 mm in dia.)
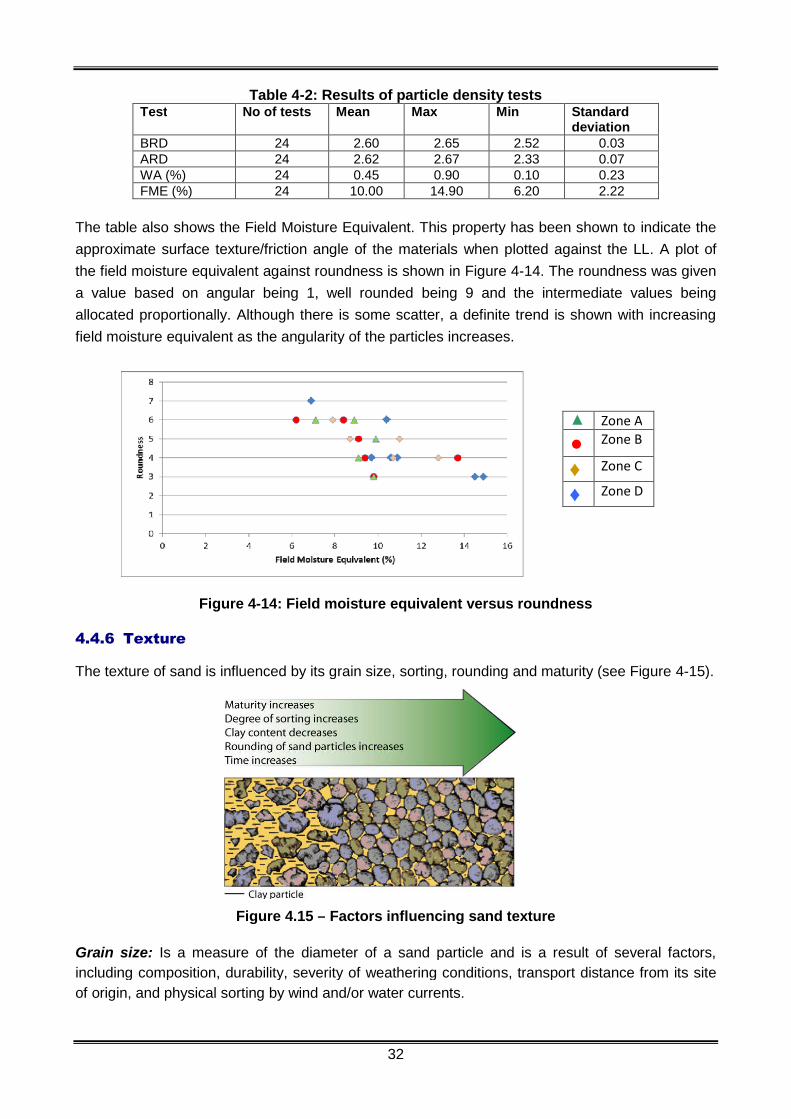
32
Table 4-2: Results of particle density testsTest No of tests Mean Max Min Standard
deviationBRD 24 2.60 2.65 2.52 0.03ARD 24 2.62 2.67 2.33 0.07WA (%) 24 0.45 0.90 0.10 0.23FME (%) 24 10.00 14.90 6.20 2.22
The table also shows the Field Moisture Equivalent. This property has been shown to indicate the
approximate surface texture/friction angle of the materials when plotted against the LL. A plot of
the field moisture equivalent against roundness is shown in Figure 4-14. The roundness was given
a value based on angular being 1, well rounded being 9 and the intermediate values being
allocated proportionally. Although there is some scatter, a definite trend is shown with increasing
field moisture equivalent as the angularity of the particles increases.
Figure 4-14: Field moisture equivalent versus roundness
4.4.6 Texture
The texture of sand is influenced by its grain size, sorting, rounding and maturity (see Figure 4-15).
Figure 4.15 – Factors influencing sand texture
Grain size: Is a measure of the diameter of a sand particle and is a result of several factors,
including composition, durability, severity of weathering conditions, transport distance from its site
of origin, and physical sorting by wind and/or water currents.
▲ Zone A
● Zone B
♦ Zone C
♦ Zone D
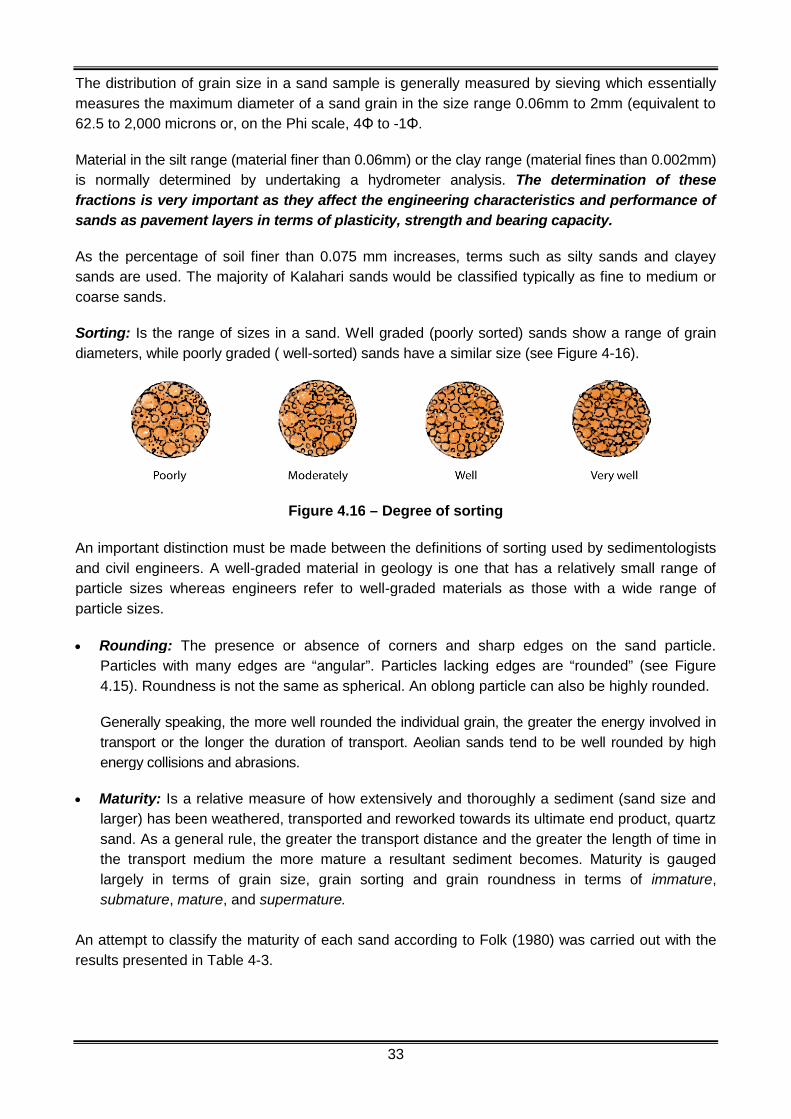
33
The distribution of grain size in a sand sample is generally measured by sieving which essentially
measures the maximum diameter of a sand grain in the size range 0.06mm to 2mm (equivalent to
62.5 to 2,000 microns or, on the Phi scale, 4Φ to -1Φ.
Material in the silt range (material finer than 0.06mm) or the clay range (material fines than 0.002mm)
is normally determined by undertaking a hydrometer analysis. The determination of these
fractions is very important as they affect the engineering characteristics and performance of
sands as pavement layers in terms of plasticity, strength and bearing capacity.
As the percentage of soil finer than 0.075 mm increases, terms such as silty sands and clayey
sands are used. The majority of Kalahari sands would be classified typically as fine to medium or
coarse sands.
Sorting: Is the range of sizes in a sand. Well graded (poorly sorted) sands show a range of grain
diameters, while poorly graded ( well-sorted) sands have a similar size (see Figure 4-16).
Figure 4.16 – Degree of sorting
An important distinction must be made between the definitions of sorting used by sedimentologists
and civil engineers. A well-graded material in geology is one that has a relatively small range of
particle sizes whereas engineers refer to well-graded materials as those with a wide range of
particle sizes.
Rounding: The presence or absence of corners and sharp edges on the sand particle.
Particles with many edges are “angular”. Particles lacking edges are “rounded” (see Figure
4.15). Roundness is not the same as spherical. An oblong particle can also be highly rounded.
Generally speaking, the more well rounded the individual grain, the greater the energy involved in
transport or the longer the duration of transport. Aeolian sands tend to be well rounded by high
energy collisions and abrasions.
Maturity: Is a relative measure of how extensively and thoroughly a sediment (sand size and
larger) has been weathered, transported and reworked towards its ultimate end product, quartz
sand. As a general rule, the greater the transport distance and the greater the length of time in
the transport medium the more mature a resultant sediment becomes. Maturity is gauged
largely in terms of grain size, grain sorting and grain roundness in terms of immature,
submature, mature, and supermature.
An attempt to classify the maturity of each sand according to Folk (1980) was carried out with the
results presented in Table 4-3.

34
Table 4-3: Classification of sand maturity (Folk, 1980)
Immature Sub-mature Mature Super-matureSorting Extremely poorly
to very poorlysorted. σ < 2.00φ
Poorly tomoderately sorted2.00 < σ < 1.00φ
Moderately to wellsorted 1.00 < σ <0.5φ
Well to very wellsorted > 0.5φ
Grain size Very coarse> 1 mm (0φ)
Coarse0.5 – 1.0 mm(0 - 1φ)
Medium0.25 – 0.5 mm(1 - 2φ)
Medium0.25 – 0.5 mm(1 - 2φ)
Roundness Angular Sub-angular Rounded Well rounded
Unfortunately, the Folk classification is one that incorporates the mutual exclusion of properties
within each class. It was found in this work that, although the principle of maturity makes sense on
the basis of common expectation, the actual data recorded were not mutually exclusive. In other
words, it was for example, possible to get a coarse, well sorted and rounded material. In most
cases, however, the degree of roundness covered a wide range of classifications, probably
indicative of a mixed origin for the sand. In general, however, one would expect beach and littoral
sands to be mature and aeolian and fluvial sands to be less mature.
Both shape and texture play an important role in the performance of sand as a pavement material.
Although the influence of shape and texture is not very critical in terms of the compactability of
sand, they are very critical in terms of strength (DN) and bearing capacity and most likely in terms
of elastic properties as well (Semmelink, 1992). As the sand grading changes from a well-graded
material to a uniformly or poorly graded one the influence of shape and texture on strength and
bearing capacity is reduced.
4.5 Mineralogical and Chemical Properties
4.5.1 Mineralogy
Knowledge of the mineralogy can assist in assessing the expected performance of the sands. This
is particularly applicable to the fine or clay component and whether the grains are quartz or less
durable feldspars, basalt or other rock and/or mineral types. Similarly, the chemical properties may
also be useful indicators of the behaviour of the materials.
The presence of iron and/or aluminum oxides in the sand clays of Western Australia certainly
appears to facilitate “self cementation” as shown by Emery et al (2007) where indirect tensile
strengths (ITS) between 250 and 570 kPa were measured on materials extracted from roads as
well as after drying back in the laboratory (Main Roads, 2002).
In order to determine the iron oxide (Fe2O3) and aluminium oxide (Al2O3) contents of the sand
samples, as part of the full elemental analysis, Citrate-Bicarbonate-Dithionite (CBD), X-Ray
Fluorescence (XRF) and X-Ray Diffraction (XRD) testing were carried out. The latter testing
techniques produced more meaningful results than those determined using the CBD method. The
results of the XRF tests are presented in Table 4-4.

35
Table 4-4: Results of oxide content determinations (XRF test)
Sample Orapa Orapa 1402 4020 4021 4036 4037 4042 4048 4049 4065 4073 4081 4092 4117 Hoopstad
SiO2 93.24 93.71 94.06 83.92 89.37 84.29 82.68 89.70 94.56 93.44 97.04 91.25 93.07 92.22 91.90 91.89
TiO2 0.21 0.22 0.21 0.26 0.18 0.56 0.57 0.35 0.26 0.29 0.11 0.26 0.16 0.42 0.32 0.33
Al2O3 1.83 1.79 1.80 6.87 5.64 5.89 7.08 3.87 2.81 2.80 1.57 4.99 3.33 4.91 4.19 2.85
Fe2O3 3.02 1.78 1.90 1.92 1.08 3.50 3.77 1.73 1.23 1.11 0.71 1.53 0.96 1.56 1.35 1.69
MnO 0.019 0.026 0.018 0.022 0.024 0.048 0.054 0.030 0.014 0.027 0.007 0.016 0.013 0.016 0.018 0.027
MgO 0.08 0.11 0.07 0.65 0.16 0.37 0.44 0.17 0.08 0.38 0.01 0.04 0.04 0.02 0.06 0.16
CaO 0.11 0.28 0.08 0.29 0.33 0.36 0.40 0.18 0.07 0.24 0.05 0.02 0.16 0.02 0.68 0.42
Na2O <0.01 0.02 <0.01 0.34 <0.01 0.24 0.22 0.24 0.10 0.29 0.08 0.02 0.32 0.03 0.03 0.07
K2O 0.29 0.30 0.31 2.38 0.20 1.08 1.09 0.97 0.67 0.80 0.67 0.69 1.03 0.82 0.56 0.74
P2O5 0.014 0.014 0.011 0.030 0.016 0.037 0.035 0.026 0.015 0.014 0.010 0.015 0.013 0.013 0.017 0.023
Cr2O3 0.008 0.004 0.004 0.001 <0.001 0.007 0.009 0.002 0.003 <0.001 <0.001 0.004 0.013 0.024 0.003 0.006
LOI 0.85 0.82 0.75 2.14 1.53 2.11 2.52 1.17 0.78 0.81 0.15 1.56 1.42 0.48 1.33 1.42
Total 99.68 99.08 99.23 98.84 98.50 98.50 98.87 98.44 100.59 100.21 100.40 100.41 100.52 100.53 100.47 99.63
H2O- 0.54 0.54 0.53 2.32 1.28 1.04 1.73 0.42 0.36 0.62 0.10 0.40 0.29 0.17 0.38 0.64
LOI–H2O- 0.31 0.28 0.22 0 0.25 1.07 0.79 0.75 0.42 0.19 0.05 1.16 1.13 0.31 0.95 0.78Al2O3 +Fe2O3 4.85 3.57 3.70 8.80 6.72 9.40 10.85 5.60 4.04 3.91 2.28 6.52 4.29 6.47 5.54 4.54
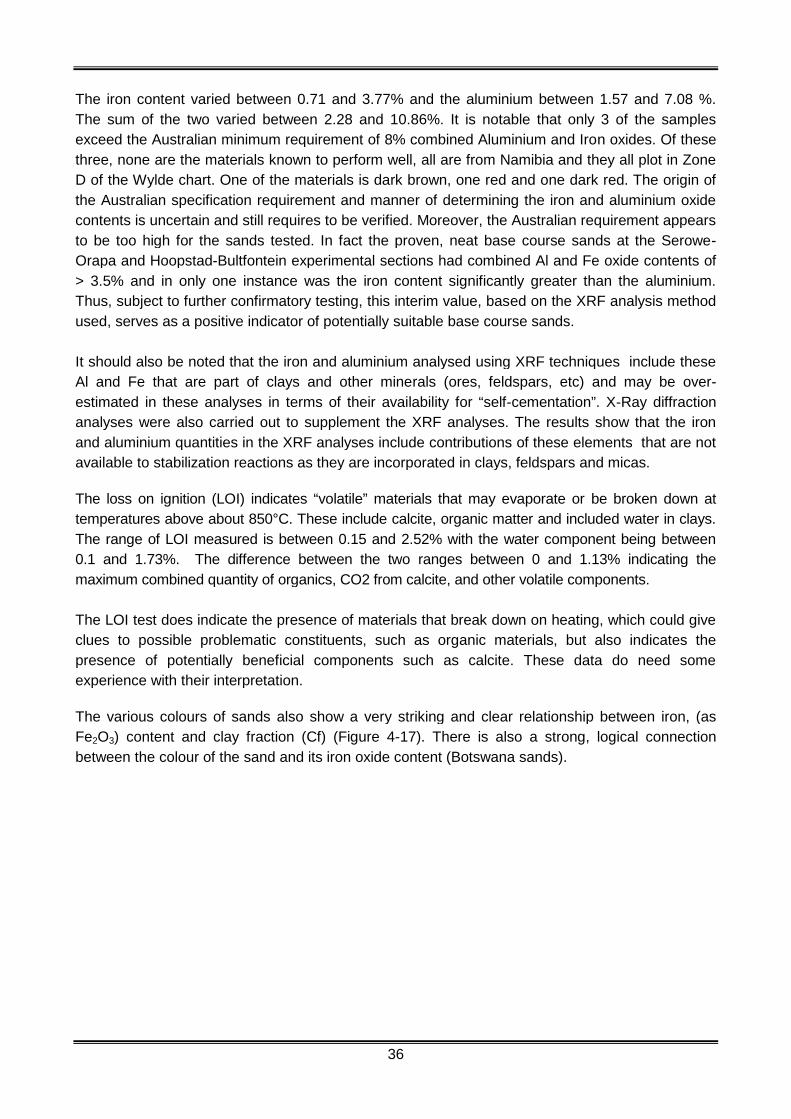
36
The iron content varied between 0.71 and 3.77% and the aluminium between 1.57 and 7.08 %.
The sum of the two varied between 2.28 and 10.86%. It is notable that only 3 of the samples
exceed the Australian minimum requirement of 8% combined Aluminium and Iron oxides. Of these
three, none are the materials known to perform well, all are from Namibia and they all plot in Zone
D of the Wylde chart. One of the materials is dark brown, one red and one dark red. The origin of
the Australian specification requirement and manner of determining the iron and aluminium oxide
contents is uncertain and still requires to be verified. Moreover, the Australian requirement appears
to be too high for the sands tested. In fact the proven, neat base course sands at the Serowe-
Orapa and Hoopstad-Bultfontein experimental sections had combined Al and Fe oxide contents of
> 3.5% and in only one instance was the iron content significantly greater than the aluminium.
Thus, subject to further confirmatory testing, this interim value, based on the XRF analysis method
used, serves as a positive indicator of potentially suitable base course sands.
It should also be noted that the iron and aluminium analysed using XRF techniques include these
Al and Fe that are part of clays and other minerals (ores, feldspars, etc) and may be over-
estimated in these analyses in terms of their availability for “self-cementation”. X-Ray diffraction
analyses were also carried out to supplement the XRF analyses. The results show that the iron
and aluminium quantities in the XRF analyses include contributions of these elements that are not
available to stabilization reactions as they are incorporated in clays, feldspars and micas.
The loss on ignition (LOI) indicates “volatile” materials that may evaporate or be broken down at
temperatures above about 850°C. These include calcite, organic matter and included water in clays.
The range of LOI measured is between 0.15 and 2.52% with the water component being between
0.1 and 1.73%. The difference between the two ranges between 0 and 1.13% indicating the
maximum combined quantity of organics, CO2 from calcite, and other volatile components.
The LOI test does indicate the presence of materials that break down on heating, which could give
clues to possible problematic constituents, such as organic materials, but also indicates the
presence of potentially beneficial components such as calcite. These data do need some
experience with their interpretation.
The various colours of sands also show a very striking and clear relationship between iron, (as
Fe2O3) content and clay fraction (Cf) (Figure 4-17). There is also a strong, logical connection
between the colour of the sand and its iron oxide content (Botswana sands).

37
Figure 4-17: Iron oxide content versus clay fraction (Botswana sands)
4.5.2 Organic content
The presence of organic matter in the sands was identified using a simplified version of the
standard test for determination of organic matter in concrete sands (SANS 5832:2006) in which a
3% solution of sodium hydroxide is added to a small sample of the sand. If there is NaOH –soluble
organic matter present, the solution turns dark and a qualitative estimate of the organic matter can
be obtained. The results of this testing are summarised in the addendum to this guideline –
Summary of Laboratory Testing Results whilst Figure 4-20 illustrates the manner of interpreting the
test in terms of the discolouration of sodium hydroxide (NaOH) solution with organic content.
Photo: 4-4: Example of discolouration of NaOH solution with organic content
(From left to right – Strong, moderate, weak, trace, none).
In general, the organic content is restricted to the upper portions of the soil profile. When using
sands, this material would normally be stripped off and retained for rehabilitation of the borrow pit, as
the humus, nutrients and seeds would be included in the material. The effect of excessive organic
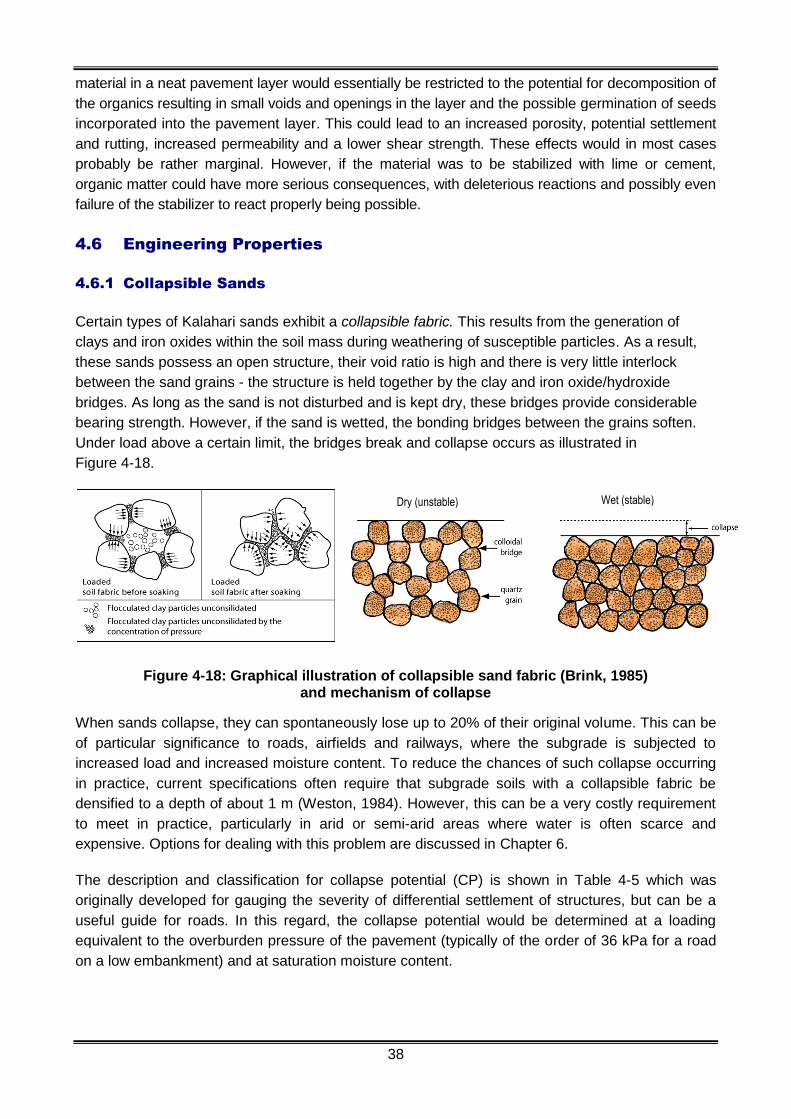
38
material in a neat pavement layer would essentially be restricted to the potential for decomposition of
the organics resulting in small voids and openings in the layer and the possible germination of seeds
incorporated into the pavement layer. This could lead to an increased porosity, potential settlement
and rutting, increased permeability and a lower shear strength. These effects would in most cases
probably be rather marginal. However, if the material was to be stabilized with lime or cement,
organic matter could have more serious consequences, with deleterious reactions and possibly even
failure of the stabilizer to react properly being possible.
4.6 Engineering Properties
4.6.1 Collapsible Sands
Certain types of Kalahari sands exhibit a collapsible fabric. This results from the generation of
clays and iron oxides within the soil mass during weathering of susceptible particles. As a result,
these sands possess an open structure, their void ratio is high and there is very little interlock
between the sand grains - the structure is held together by the clay and iron oxide/hydroxide
bridges. As long as the sand is not disturbed and is kept dry, these bridges provide considerable
bearing strength. However, if the sand is wetted, the bonding bridges between the grains soften.
Under load above a certain limit, the bridges break and collapse occurs as illustrated in
Figure 4-18.
Figure 4-18: Graphical illustration of collapsible sand fabric (Brink, 1985)and mechanism of collapse
When sands collapse, they can spontaneously lose up to 20% of their original volume. This can be
of particular significance to roads, airfields and railways, where the subgrade is subjected to
increased load and increased moisture content. To reduce the chances of such collapse occurring
in practice, current specifications often require that subgrade soils with a collapsible fabric be
densified to a depth of about 1 m (Weston, 1984). However, this can be a very costly requirement
to meet in practice, particularly in arid or semi-arid areas where water is often scarce and
expensive. Options for dealing with this problem are discussed in Chapter 6.
The description and classification for collapse potential (CP) is shown in Table 4-5 which was
originally developed for gauging the severity of differential settlement of structures, but can be a
useful guide for roads. In this regard, the collapse potential would be determined at a loading
equivalent to the overburden pressure of the pavement (typically of the order of 36 kPa for a road
on a low embankment) and at saturation moisture content.
Dry (unstable) Wet (stable)

39
Table 4-5: Collapse potential related to severity of problem (Jennings and Knight, 1975)
Collapse Potential Severity of Problem
0 – 1% No problem
1 – 5% Moderate trouble
5 – 10% Trouble
10 – 20% Severe trouble
> 20% Very severe trouble
An example of the properties of a typical collapsible Kalahari sand in Botswana and the effect of
application of compaction using a high energy impact compactor are shown in Table 4-6.
Table 4-6: Typical properties of collapsible reddish brown sand (Serowe-Orapa Road, Botswana)
Collapse PotentialDepth below
surface (mm) (200 kPa)* (36 kPa)**
Property BRDM
guideline for
CP
Average
results
200 - 350 11.5% 6.3%
Dry density (kg/m3) < 1600 1432.0 450 – 600 11.2% 7.1%
700 – 850 9.3% 5.0%% passing 2.0 mm and
retained on 0.075 mm
>60% 85.0%
1000 - 1150 7.5% 3.6%
% passing 0.075 mm < 20% 17.5%
Relative density < 85% 75.4%
Based on a guide to the potential severity of the
collapse problem proposed by Jennings and
Knight (1975), the sand subgrade would fall in
the “trouble” to “severe trouble” category.
* as specified by Jennings and Knight
** estimated at in-service loading
4.6.2 Permeability
The permeability of sands is most influenced by compaction as well as the size, shape and
connectivity of the water passages which are themselves largely affected by the grading and
segregation of the soil. In general, an increase in plasticity will reduce permeability whereas
segregation of particle sizes will increase permeability.
Photo 4-5 – Collapse settlement of sandsubgrade: In excess of 150 mm wasobtained along a section of the Serowe-Orapa road in Botswana after compaction tonear refusal by a 25 kJ high energy impactcompactor.

40
Typical permeability coefficients for other sands are shown in Table 4.7 (Lee, White and Ingles, 1983).
Table 4-7: Typical permeability coefficients for sands
Sand Type Coeff. Perm.(cm/sec)
QualitativeDescription
Clean coarse sand 1 – 10-2 Medium
Graded sand 10-2 – 5 x 10⁻³ Medium
Fine sand 5 x 10⁻³ - 10-3 Medium to low
Silty sand 2 x 10⁻³ - 10-4 Low
Very fine uniform sand 6 x 10⁻³ – 10-4 Low
Dune sand 0.1 – 0.3 High
There is a perception that sandy materials are free draining and water-related problems affecting
roads are minimal in sandy areas. This is not necessarily true (Brink, 1985) and has important
implications for the use of Kalahari sands in road pavements, particularly as regards the important
factor of avoiding permeability inversion within the pavement structure. The finer and less well-sorted
sands are, the lower their permeability (Masch and Denny, 1965). This can be observed by the long
periods during which rainwater stands on the sides of roads in, particularly, red sand areas. It is also
common for the fines in the sand to be "washed" to the surface of exposed sands (for example in
drains and adjacent areas) where they decrease the permeability (or infiltration rate) and lead to
ponding of water over long periods.
4.6.3 Suction
Soil suction is primarily a function of the soil grading and inter-particle voids, which are indirectly
indicated by plasticity through the fineness of clay minerals. A typical equilibrium curve showing the
relationship between the moisture content and suction (pF units) for wetting and drying cycles is
shown in Figure 4-19 which indicates that (1) the suction pressure increases with decreasing
moisture content and (2) for any given suction pressure, the moisture content increases with
increase in clay content.
Figure 4-19: Soil suction/moisture content relationship (Wooltorton, 1954)

41
The development of soil suction strength allows some sands (particularly those with an appreciable
fines content) to generate relatively high strengths in service as they dry back from their moisture
content at compaction processing to their equilibrium moisture content – typically 0.6 – 0.7 of OMC
(Emery, 1992). The soil suction generated over this range of moisture content will be considerably
higher than those existing under soaked conditions. However, if the sand is to retain its suction
generated strength then the soil suction must be maintained by ensuring that the moisture content
in the pavement layers does not increase above the OMC of the material. This can only be
achieved if the road surfacing is impermeable and effective drainage is in place.
4.6.4 Strength (CBR and DN)
The strength of the red sands used as neat base course in the ANE experimental sections and at
various densities and moisture contents is shown in Figure 4-20 which shows the variation in
conventional CBR strength of a sand at various compaction densities as well as at various
moisture contents. In the soaked condition, the CBR measures mainly the frictional strength
component of shear strength. As the moisture content of the material decreases, the cohesion
component of the shear strength increases contributing to an increase in total shear strength,
particularly as the density increases.
0
100
200
300
400
500
600
88% 90% 92% 94% 96% 98% 100% 102%
CB
Rst
ren
gth
(%)
Compaction (% of MDD)
Soaked
OMC
75% OMC
50% OMC
25% OMC
Figure 4-20: Variation in CBR strength at various densities and moisture contents
If these data are assessed in term of their corresponding Dynamic Cone Penetration (DCP) rate (in
mm/blow) a similar pattern is observed (Figure 4-21), although the exponential relationship
between the CBR and DN masks the large increases in strength as the material dries out.

42
0
2
4
6
8
10
12
88% 90% 92% 94% 96% 98% 100%
DC
PP
en
etra
tio
nra
te(D
Nin
mm
/bl)
Compaction (% of MDD)
Soaked
OMC
75% OMC
50% OMC
25% OMC
Figure 4-21 - Variation in equivalent DN value at various densities and moisture contents
The above figures illustrate the importance of ensuring that, in service, the moisture in the road
pavement, particularly in the outer wheel path, is maintained at or below OMC. This can be
achieved by a waterproof surfacing that is properly maintained in service as well as by proper
drainage, as discussed in Section 5.4.8.
CBR results from 3 samples from the neat base course of the Hoopstad-Bultfontein experimental
section exhibited values at 98% Mod. AASHTO between 47 and 57% and OMC CBRs of 71 to
90% - much lower than conventional requirements but, nonetheless, performed remarkably well.

43
5. DESIGN, SPECIFICATION AND USE OF SANDS
5.1 Introduction
Sandy materials do not comply with the requirements of conventional road material specifications,
especially for structural pavement layers. They are typically excluded because of their particle size
distributions, although their plasticity and strength characteristics may fulfil the specified
requirements. However, when appropriately designed, specified and constructed, sands can be, and
have been, successfully used in practice in Australia and Brazil for all layers in a LVR pavement and,
in Botswana, as subbase and, experimentally, as a base course.
5.2 Design
5.2.1 Dynamic Cone Penetrometer (DCP) method
The DCP design method is an alternative to the more traditional laboratory CBR based method of
design. The main features of this method are its relative simplicity and ease of use and its ability to
undertake a large number of in situ strength measurements quickly and cost-effectively. The
method makes use of optimising the material properties in terms of the required strength at the
designed moisture and density condition based on material properties obtained from DCP testing.
This involves both field and laboratory testing following the procedure summarised in Figure 5-1.
Figure 5-1: Flow diagram of DCP design procedure
In the field, the existing pavement support/conditions are determined using the DCP and these are
compared with DCP design catalogues (layer strength diagrams) (Figure 5-2) that relate to various
traffic categories and the prevailing local climatic conditions. This data is augmented with
laboratory determined DCP penetration values obtained on the specific sands (selected on the
basis of the Wylde chart classification) at similar moisture and density conditions (Figure 4-25).

44
Figure 5-2: Comparison of DCP design profile and in situ strength profiles
5.2.2 Pavement design catalogue
The DCP design catalogue is presented in Table 5-1 and the equivalent layer-strength diagrams for
the different traffic classes are illustrated in Figure 5-5 for different traffic categories.
Table 5-1: DCP design catalogue for different traffic classes*
Traffic Class
E80 x 106
LE 0.01
0.003 – 0.010
LE 0.03
0.010 – 0.030
LE 0.1
0.030 – 0.100
LE 0.3
0.100 – 0.300
LE 0.7
0.300 – 0.700
LE 1.0
0.700 – 1.0
600- 150mm Base≥ 98% MAASHTO
DN ≤ 8 DN ≤ 5.9 DN ≤ 4 DN ≤ 3.2 DN ≤ 2.6 DN ≤ 2.5
150-300 mm Subbase≥ 95% MAASHTO
DN ≤ 19 DN ≤ 14 DN ≤ 9 DN ≤ 6 DN ≤ 4.6 DN ≤ 4.0
300-450 mm subgrade93% MAASHTO
DN ≤ 33 DN ≤ 25 DN ≤ 19 DN ≤ 12 DN ≤ 8 DN ≤ 6
450-600 mmIn situ material
DN ≤ 40 DN ≤ 33 DN ≤ 25 DN ≤ 19 DN ≤ 14 DN ≤ 13
600-800 mmIn situ material
DN ≤ 50 DN ≤ 40 DN ≤ 39 DN ≤ 25 DN ≤ 24 DN ≤ 23
The design catalogue for this traffic category is only valid if low moisture conditions can be guaranteed in the pavement in service. Ifthere is a risk of moisture ingress the pavement design should be based on the soaked condition.
* Full details of the DCP design method may be found in Ministry of Transport and Public Works, Malawi. 2013. DesignManual for Low Volume Sealed Roads using the DCP Design Method.

45
5.2.3 Layer strength diagram
Figure 5-3 shows the layer strength diagram (LSD) for various traffic categories in terms of the DN
values at a specified density and moisture content. The LSD for a particular traffic category
indicates the required material properties, as represented by the DN values for each 150 mm layer
to a depth of 800 mm. As illustrated in Figure 5-2, the comparison between the in situ strength
profile of the existing pavement structure and that of the designed pavement is used to determine
the appropriate design requirements.
0
100
200
300
400
500
600
700
800
1 10 100
De
pth
(mm
)
DN (mm/blow)
LE 0.01
LE 0.03
LE 0.1
LE 0.3
LE 0.7
LE 1
Figure 5-3: LSD for various traffic classes
Full details of the DCP design method are presented in the Malawi Design Manual for Low Volume
Sealed Roads Using the DCP Design Method (AFCAP, 2013)
5.2.4 Risk factors
It is essential that the following main risks associated with the design of pavements using sand are
fully appreciated and that appropriate measures are taken in practice to minimise them.
Drainage (crown height, cross-section design, sealed shoulders, permeability (internal
drainage) (see Section 6-4).
Materials quality (strength)
Construction control (supervision, thickness control, compaction standards).
Maintenance (routine, periodic)
Traffic (overloading – axle load control)
If any one of the above factors is relaxed, the risks assumed may be acceptable if strict control is
exercised over the other factors. However, if more than one of the above factors is not adhered to,
there is an increased risk of failure.
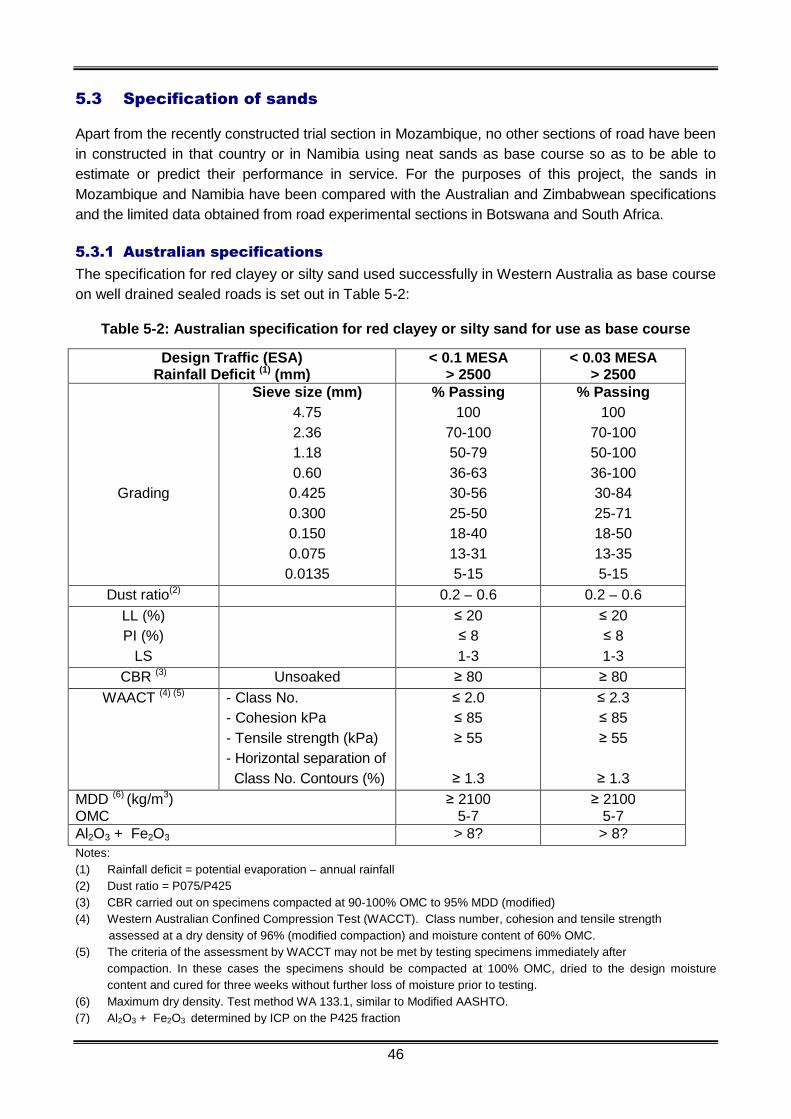
46
5.3 Specification of sands
Apart from the recently constructed trial section in Mozambique, no other sections of road have been
in constructed in that country or in Namibia using neat sands as base course so as to be able to
estimate or predict their performance in service. For the purposes of this project, the sands in
Mozambique and Namibia have been compared with the Australian and Zimbabwean specifications
and the limited data obtained from road experimental sections in Botswana and South Africa.
5.3.1 Australian specifications
The specification for red clayey or silty sand used successfully in Western Australia as base course
on well drained sealed roads is set out in Table 5-2:
Table 5-2: Australian specification for red clayey or silty sand for use as base course
Design Traffic (ESA)Rainfall Deficit (1) (mm)
< 0.1 MESA> 2500
< 0.03 MESA> 2500
Grading
Sieve size (mm)
4.75
2.36
1.18
0.60
0.425
0.300
0.150
0.075
0.0135
% Passing
100
70-100
50-79
36-63
30-56
25-50
18-40
13-31
5-15
% Passing
100
70-100
50-100
36-100
30-84
25-71
18-50
13-35
5-15
Dust ratio(2) 0.2 – 0.6 0.2 – 0.6
LL (%)
PI (%)
LS
≤ 20
≤ 8
1-3
≤ 20
≤ 8
1-3
CBR (3) Unsoaked ≥ 80 ≥ 80
WAACT (4) (5) - Class No.
- Cohesion kPa
- Tensile strength (kPa)
- Horizontal separation of
Class No. Contours (%)
≤ 2.0
≤ 85
≥ 55
≥ 1.3
≤ 2.3
≤ 85
≥ 55
≥ 1.3
MDD (6) (kg/m3)OMC
≥ 21005-7
≥ 21005-7
Al2O3 + Fe2O3 > 8? > 8?
Notes:
(1) Rainfall deficit = potential evaporation – annual rainfall
(2) Dust ratio = P075/P425
(3) CBR carried out on specimens compacted at 90-100% OMC to 95% MDD (modified)
(4) Western Australian Confined Compression Test (WACCT). Class number, cohesion and tensile strength
assessed at a dry density of 96% (modified compaction) and moisture content of 60% OMC.
(5) The criteria of the assessment by WACCT may not be met by testing specimens immediately after
compaction. In these cases the specimens should be compacted at 100% OMC, dried to the design moisture
content and cured for three weeks without further loss of moisture prior to testing.
(6) Maximum dry density. Test method WA 133.1, similar to Modified AASHTO.
(7) Al2O3 + Fe2O3 determined by ICP on the P425 fraction
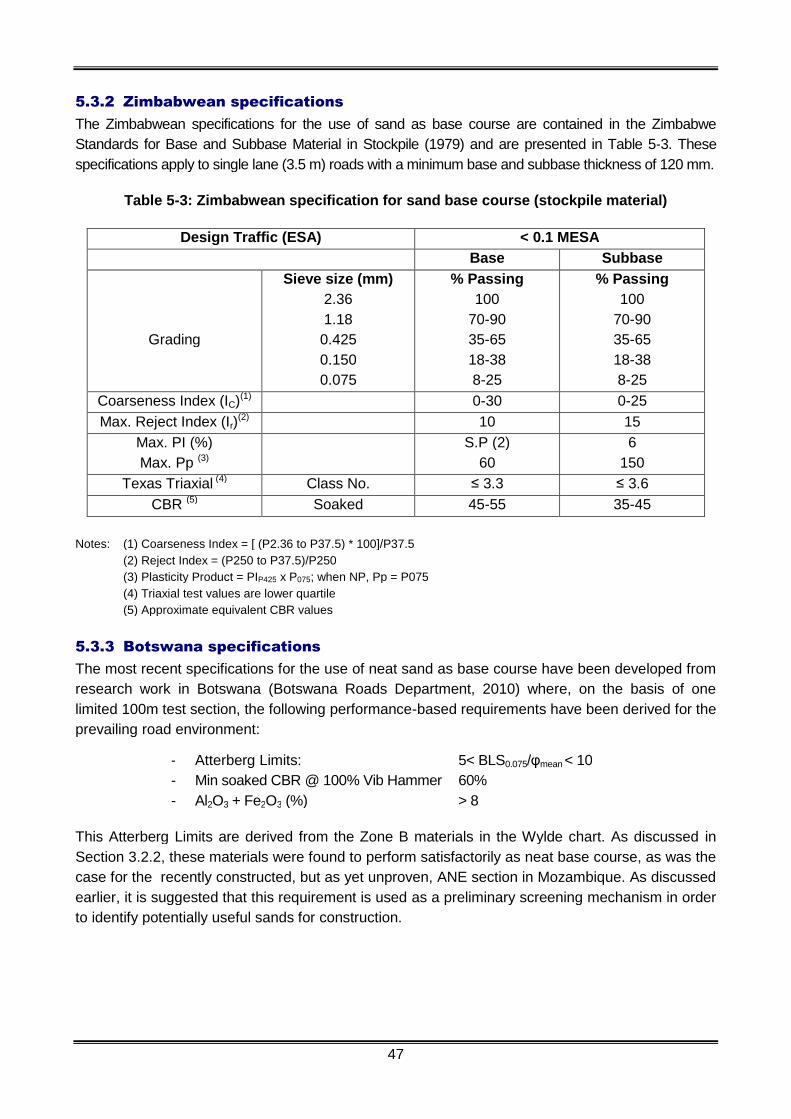
47
5.3.2 Zimbabwean specifications
The Zimbabwean specifications for the use of sand as base course are contained in the Zimbabwe
Standards for Base and Subbase Material in Stockpile (1979) and are presented in Table 5-3. These
specifications apply to single lane (3.5 m) roads with a minimum base and subbase thickness of 120 mm.
Table 5-3: Zimbabwean specification for sand base course (stockpile material)
Design Traffic (ESA) < 0.1 MESA
Base Subbase
Grading
Sieve size (mm)
2.36
1.18
0.425
0.150
0.075
% Passing
100
70-90
35-65
18-38
8-25
% Passing
100
70-90
35-65
18-38
8-25
Coarseness Index (IC)(1) 0-30 0-25
Max. Reject Index (Ir)(2) 10 15
Max. PI (%)
Max. Pp (3)
S.P (2)
60
6
150
Texas Triaxial (4) Class No. ≤ 3.3 ≤ 3.6
CBR (5) Soaked 45-55 35-45
Notes: (1) Coarseness Index = [ (P2.36 to P37.5) * 100]/P37.5
(2) Reject Index = (P250 to P37.5)/P250
(3) Plasticity Product = PIP425 x P075; when NP, Pp = P075
(4) Triaxial test values are lower quartile
(5) Approximate equivalent CBR values
5.3.3 Botswana specifications
The most recent specifications for the use of neat sand as base course have been developed from
research work in Botswana (Botswana Roads Department, 2010) where, on the basis of one
limited 100m test section, the following performance-based requirements have been derived for the
prevailing road environment:
- Atterberg Limits: 5< BLS0.075/φmean < 10
- Min soaked CBR @ 100% Vib Hammer 60%
- Al2O3 + Fe2O3 (%) > 8
This Atterberg Limits are derived from the Zone B materials in the Wylde chart. As discussed in
Section 3.2.2, these materials were found to perform satisfactorily as neat base course, as was the
case for the recently constructed, but as yet unproven, ANE section in Mozambique. As discussed
earlier, it is suggested that this requirement is used as a preliminary screening mechanism in order
to identify potentially useful sands for construction.
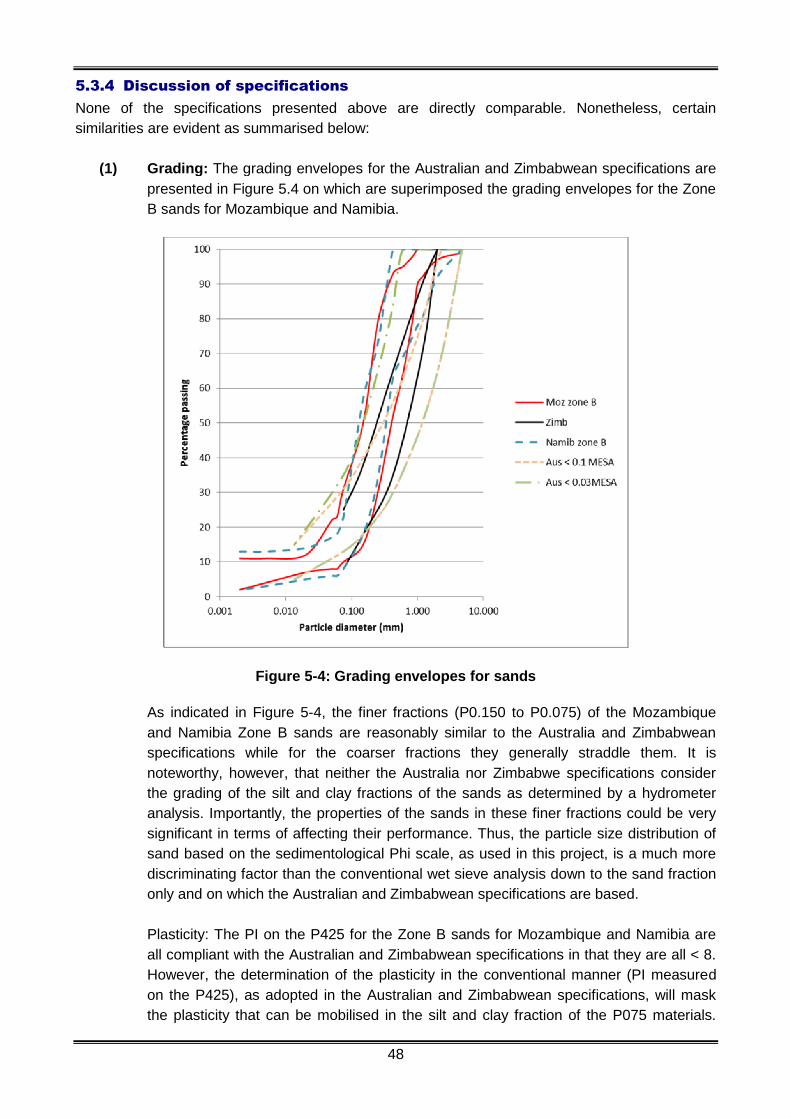
48
5.3.4 Discussion of specifications
None of the specifications presented above are directly comparable. Nonetheless, certain
similarities are evident as summarised below:
(1) Grading: The grading envelopes for the Australian and Zimbabwean specifications are
presented in Figure 5.4 on which are superimposed the grading envelopes for the Zone
B sands for Mozambique and Namibia.
Figure 5-4: Grading envelopes for sands
As indicated in Figure 5-4, the finer fractions (P0.150 to P0.075) of the Mozambique
and Namibia Zone B sands are reasonably similar to the Australia and Zimbabwean
specifications while for the coarser fractions they generally straddle them. It is
noteworthy, however, that neither the Australia nor Zimbabwe specifications consider
the grading of the silt and clay fractions of the sands as determined by a hydrometer
analysis. Importantly, the properties of the sands in these finer fractions could be very
significant in terms of affecting their performance. Thus, the particle size distribution of
sand based on the sedimentological Phi scale, as used in this project, is a much more
discriminating factor than the conventional wet sieve analysis down to the sand fraction
only and on which the Australian and Zimbabwean specifications are based.
Plasticity: The PI on the P425 for the Zone B sands for Mozambique and Namibia are
all compliant with the Australian and Zimbabwean specifications in that they are all < 8.
However, the determination of the plasticity in the conventional manner (PI measured
on the P425), as adopted in the Australian and Zimbabwean specifications, will mask
the plasticity that can be mobilised in the silt and clay fraction of the P075 materials.

49
Thus, the PI on the P075, as used in this project, is of much more significance when
sands are being considered for use as pavement materials.
(2) Strength: The CBR values of the Zone B sands for both Botswana and Mozambique
(no CBR testing on the Namibia sands as none were used neat as base course) are
compliant with the Australian and Zimbabwean specifications in that they are > 80 at
OMC.
Of the 100 sand samples tested, 14 of them from Mozambique and about 21 of them from Namibia
plot within Zone B (or an extrapolation of it). However, only one of the Namibian sands and 4 of the
Mozambique sands comply with the bar linear shrinkage:mean size ratio on the P075 and the
mean particle diameter (in terms of the Φ-scale) included in the Botswana specification. This ratio
should be between 5 and 10.
Non-compliance of the Mozambique and Namibia sands with the bar linear shrinkage:mean size
ratio on the P075 of the preliminary Botswana specification is not necessarily an indication that the
sands are not “fit for purpose”. In fact, numerous investigations in the region have shown that,
while traditional design approaches specify a number of laboratory derived engineering properties
of the materials, such as grading, PI and CBR, these properties often do not correlate significantly
with the performance of LVSRs. It is for this reason that the preferred approach is to express the
required quality of the sands in terms of its DCP resistance to penetration (DN value in mm/blow)
which is an indicator of overall shear strength that is sensitive to density, moisture content, particle
strength, grading and plasticity. Thus, the DN value must be specified at the compaction density
and expected in service moisture condition.
The use of the DN value as the primary materials selection criterion for sands does not detract from the
importance of grading and PI on the performance of the material in service but, rather, it places
secondary importance on these parameters. Thus, a poorly graded, highly plastic material would not be
expected to provide the relatively low DN value that might be specified for the base course layer of a
low volume sealed road.
In view of the above, the two materials parameters that need to be specified for the sand pavement
layers are as follows
(a) Density: The density to which the material in the upper/base layer must be compacted should
be the highest that is practicable, i.e. “compaction to refusal” such that adverse break down of
the material does not occur.
(b) DN value: The DN value of the materials to be used in the upper/base layer of the
pavement at a specified density and moisture content for a particular design traffic loading
(ref. Table 5-1 and Figure 5-3).
A proper evaluation of the suitability of the materials for incorporation in the pavement will require a
knowledge of the DN/moisture/density relationship as illustrated in Figure 4-21.

50
5.4 Use of untreated sands
5.4.1 Subgrade
Many roads constructed in the SADC region will have predominantly sandy subgrades for which
the DN requirements are indicated in Table 5-1. Most sands when compacted to the appropriate
density will easily comply with the specified requirements. However, there may specific
requirements pertaining to materials with potentially collapsible grain structures (Clause 5-102.5.2
(Ministry of Works, Transport and Communications, 1982).
Pavement subgrades usually fail through being too weak to support the applied loads, through
excessive volumetric movement or as a result of insufficient compaction. Provided sand subgrades
are compacted to the required standard, their chance of failure is relatively low.
Where subgrade compaction problems are encountered, particularly with the more uniform sized
sands and manifested as a tendency for shearing of the material during compaction, particularly
when excessive vibration is used (Chauvin, undated; Murphy, 1981) a method specification based
on controlled compaction trials should be considered.
Recent work in Botswana has shown that roads with Kalahari sand subgrades resulted in deep
pavements with n-exponent values (for carrying out traffic equivalency calculations) of less than 2
(Paige-Green and Overby, 2010). This has a significant impact on the determination of equivalent
standard axles in pavement design over sand subgrades.
5.4.2 Fill and selected layers
Materials for fill generally require similar quality as subgrade, the only difference being that they
are imported to provide the required pavement shape and levels. Discussion pertaining to in situ
subgrade is generally relevant to fill materials, although most collapse potential of the material
would generally be lost during extraction from borrow, haulage and compaction.
The non-cohesive nature of the sands, however, can result in compaction difficulties because of
non-confinement. This may require construction of a wider fill in order to provide a greater degree
of confinement in the central pavement area and rolling from the outside inwards only, as should
be standard practice on all layers.
Most sands will comply with the standard fill requirements but good supervision and control of
compaction is essential. It is recommended that the materials be compacted to refusal, rather than the
90 or 93 per cent of BS 1377 Test 14 that is specified, provided that refusal density is in excess of the
specified limit. The South African requirement for sand (with less than 20 per cent finer than 0.075 mm)
in roadbed and fill is a minimum compaction of 100 per cent Mod AASHTO density (COLTO, 1998).
Low densities in fills will result in settlement if the fill becomes submerged and traffic continues to
use the road. The presence of perched water tables can also lead to this problem.
5.4.3 Subbase
Many sands will provide the specified DN values for subbase when compacted to an appropriate
density. Such sands have been successfully used on a number of projects in the region.

51
5.4.4 Base
It is not uncommon for certain untreated sands to exhibit relatively high DN values at the
equilibrium moisture content that typically prevails under paved roads in the southern African
region (Emery, 1992), and these materials when adequately compacted in the field are likely to
perform satisfactorily. Figure 5-5 illustrates the variation in laboratory CBR strength (reasonably
well correlated with DCP CBR value) with moisture content for a red Kalahari sand that was used
successfully as neat base on an experimental section of a low volume road pavement in Botswana
(the Serowe-Orapa experimental section). The sand sample was compacted at OMC and dried
back to various moisture content ratios before its strength was determined.
The reason for the good performance of the red sand has been attributed to the high suctions that
the material exhibits (due to its fine grading and the relatively high plasticity of the minus 75μm
fraction) and the resulting high strengths when dry.
Figure 5-5: Lab CBR of Kalahari sand sample at various moisture content ratios
5.4.5 Surfacing
Sand is generally too fine and uniform for chip seals and is unsuitable for use, even for
conventional sand seals. They have been used locally in Zimbabwe as fine aggregate for
bituminous surfacings, but no details regarding this have been located. Experience in Botswana
indicates that Kalahari sand seals without a surface dressing or graded gravel seal beneath them
deteriorate within a few months due to cattle damage (Overby, 1982).
Sand has, however, been used regularly as a cover seal on single (and occasionally on double) Otta
seals (Botswana Roads Department, 1999). Typically a 60 % Emulsion or an MC3000 binder is
sprayed at between 0.7 and 1.0 ℓ/m2 and immediately covered with Kalahari Sand at a spread rate of
about 0.014 m3/m2. This must be rolled with a pneumatic tyred roller, ensuring that the sand is evenly
spread and rolled. A light drag must be used to remove any unevenness. The road should be
immediately opened to traffic. Sand dislodged by traffic should be broomed back onto the road until
the balance between binder and sand is correct and no further sand is lost or bleeding occurs.

52
The use of Kalahari sands as a sand seal has also been described in Namibia (Marais and
Freeme, 1977) where a single sand seal of windblown sand was placed on a cutback binder
(sprayed at 1.37 to 1.76 ℓ/m2) after allowing it to penetrate the bitumen stabilized sand base and
thicken. No traffic was allowed on the seal for about 2 months and the seal gave good service for
about two years.
The use of primer seals in Australia is almost standard practice in rural areas – these often consist
of local sand placed on a heavy bituminous binder primer, which is provided as an initial waterproof
wearing course until a conventional chip seal is placed during the hot and dry part of the year
(Pederson, 1978). Local river and dune sands have also been successfully used as aggregate for
seals (Pederson, 1978).
5.4.6 Wearing courses for unsealed Roads
Sands are not generally suitable as wearing courses for unsealed roads. Although the fines of some
sands, particularly the red ones which contain iron oxide, also have some plasticity (cohesion), it is
generally insufficient to resist the abrasive forces of moving wheels. Moreover, sands tend to erode
easily with rain and to corrugate rapidly, particularly in dry conditions, and to deteriorate to thick, loose
layers that are impassable to most vehicles.
The sands are, however, very effective for sand cushioning (Jones, 1995). In this process, a well-
compacted gravel wearing course (usually of marginal quality) is covered with a thin layer (about
40 mm) of relatively single-sized sand. This upper sand layer is maintained on a regular basis,
using a towed grader and drag, such that vehicles do not traffic the base material.
5.4.7 Shoulders and side slopes
The use of sands on shoulders and side slopes can result in severe erosion by rainfall, road
surface runoff and wind. A reduction of the pavement and shoulder crossfall to between 1.5 and 2
per cent reduces the velocity of runoff and minimises the potential for erosion. Sideslopes should
be constructed to a maximum batter of 1: 4 or flatter. Although providing structurally sound
shoulders, the problem of erosion of sand-clay shoulders by vehicles and wind generated by
vehicles is severe in Australia (Jewell, 1970; Paige-Green, 1983).
Significant problems with wind erosion of sand shoulders in Australia have been observed. The
wind-shear generated by rapidly moving vehicles, particularly large goods vehicles, results in
detachment of sand grains from the shoulder and loss of shoulder shape. This is exacerbated on
roads with reduced widths, where a tendency for vehicles to move their outside wheels onto the
shoulder when overtaking results in wear of the shoulder.
The application of a bitumen seal to the shoulders, although increasing the cost of the road,
significantly reduces problems related to erosion of the sand.
The establishment of vegetation to protect sand slopes on fill is usually not practical or reliable
enough in the short term. Erosion can be minimised by placing a gravel cladding layer on the
slopes where such material is available. Poor quality calcretes and silcretes that are not suitable
for use in pavement layers will usually perform adequately as side slope cladding in the short term
while vegetation establishes itself.

53
5.4.8 Saline sands
Sands are not usually saline and will therefore not usually cause salt damage. Their fine nature,
which is likely to encourage capillary rise of saline water, and their potential to contain high air
voids, however, make them susceptible to damage by salt crystallisation (Botswana Roads
Department, 2001). Their use in saline environments (e.g. fill over saline materials or when saline
water is present or used for compaction) should therefore be treated with caution (Netterberg and
Bennet, 1993).
Due to the cushioning effect of fine-grained sands, they are well suited for use as a thin cushioning
layer below or above a salt blocking membrane (e.g. plastic sheeting or bitumen used to prevent
the upward migration of saline water to a pavement layer).
5.5 Stabilization of Sands
5.5.1 General
Various types of soil stabilization have been undertaken in the Southern African region for over 50
years in a variety of circumstances and for a variety of reasons using a variety of stabilizing agents
as summarized in Table 5-4.
Table 5-4: Soil stabiliser and related type of stabilisation
Stabilizer Type of stabilization
Granular materials Mechanical stabilization
Portland cement
Lime (quicklime and hydrated lime)
Pozzolans (fly ash)
Bitumen and tar
Chemical stabilization
Proprietary chemicals
The choice of stabilizer is influenced by the properties of the material to be stabilized and the cost of
stabilization. The traditional guidance to the choice of stabilizer is summarized in Figure 5-6. More
recently, combinations of both bitumen and cement have been used, prompted by the evidence that
suggests that adequate strengths can be achieved while cracking is substantially reduced due to a
much lower cement content.

54
Figure 5-6: Guide to the method of stabilization (Austroads, 1998)
5.5.2 Mechanical stabilisationMechanical stabilization is one of the cheaper means of improving the quality of sands. Such
stabilization can be achieved by blending sand with other materials with the following beneficial results:
improved CBR
lowering of PI
lowering of OMC
improved workability
lowering of soluble salt content where salts are present
For example, blending of windblown sands with between 20 and 40 per cent (typically about 25 per
cent) clayey silt or clayey sand has been successfully used in Australia (Leach, 1960). In
Botswana, Kalahari sands have been blended with marginal quality calcretes to improve the quality
of the calcrete gravel material. Material with a plasticity index of about 9 per cent increased in CBR
by about 30 percentage points to in excess of 80 per cent after blending in 20 per cent Kalahari
sand –see Figure 5-7 (Overby, 1981; Strauss and Hugo, 1979).

55
Photo 5-1: N Photo 5-1: Blending of nodular calcrete and sand
Figure 5-7: Results of mechanical blending of calcrete with sand
5.5.3 Lime stabilization
Most sands do not have sufficient clay to react adequately with lime, and cement is the usual choice
for stabilization. However, should there be adequate quantities of amorphous silica in the sand it will
react with the lime to form a strong material adequate for use in a LVR pavement. It is possible (and
often environmentally more friendly) when the lime does not react with the sand to add a pozzolan
such as flyash, ground granulated blastfurnace slag (GGBS) or even such products as rice husks or
bagasse as a stabiliser. In this case all of the reactive components are provided.
Lime can be obtained from commercial sources as well as by burning limestone, shells or other
calcareous materials in small kilns. Success using such lime has been obtained, but the variability
of these needs to be carefully controlled.
There has been mixed success with the use of lime in the Southern African region for which some
examples are presented below.
Namibia: In the 1980s, lime was used on a sandy calcrete section of the Grootfontein-Rundu road in
which both the base and subbase were stabilized (3% and 2% respectively). However, some time after
construction, shallow base and surfacing failures were reported and attributed to the degradation of the
stabilizing agents and their cemented products during exposure before sealing through the process
known as ”carbonation” which can both inhibit the effective formation of, and destroy the cementitious
products in soil-cement and soil-lime reactions (Netterberg and Paige-Green, 1984). In spite of this,
after such areas were repaired the road performed satisfactorily and has only recently been
reconstructed. Many other roads in Namibia with lime stabilised abses have performed well
(Netterberg, 2012, pers. communication).

56
South Africa: Bergh et al (2008) describe the effect of lime treatment on the Berea Red Sands found
in South Africa for which CBR values of untreated material were between 18 and 28% at 98% Mod
AASHTO and increased to in excess of 90% with up to 4% lime. Samples of the stabilised sands that
were collected from these roads indicated that they were still in relatively good condition after more
than 30 years in service and they still exhibited significant strength. In contrast, at least one section of
road with a lime stabilized Berea red sand is known on which scabbing of the surfacing occurred due to
a weak carbonated upper basecourse (Netterberg, personal communication, 2012).
5.5.4 Cement stabilisation
Cement stabilization provides a high strength, relatively stiff and inflexible pavement. This type of
structure requires good support to limit the total pavement deflection to low values and to ensure
that the layers do not fail due to excessive flexing. It is suggested that n- values in excess of 4 (5 or
even up to 6) be used in the calculation of cumulative standard axles for design purposes as
suggested in CSRA (1996) and shown by Paige-Green (2010).
Cement stabilised layers usually produce marked block cracking which can be the result of traffic
loads as well as shrinkage stresses (Bofinger, 1971). Shrinkage is an unavoidable problem but it
should be controlled as much as possible to reduce the damage it causes. Unless sands have a
high clay content, compacted sand-cement mixtures will normally expand if they are sealed to
prevent any drying. If the cement content is increased the expansion will also increase. As soon
as moisture is allowed to escape from the material it will start to shrink. If the material remains
sealed it will continue to increase in strength and the potential total shrinkage will decrease as will
the severity of cracking. If pavements are properly cured for one or two months the drying
shrinkage is likely to be reduced by 50%. However, in practice, this is unrealistic. It is also
recommended that sand cement mixtures are compacted at a moisture content no more than 80%
of the saturation moisture content of the untreated material. Although cement contents as high as
10% have been used in sand-cement layers (this is usually uneconomical) the cracking has not
necessarily been unacceptable.
The rate at which a sand-cement layer dries out depends on the method used to cure it. Most of the
moisture lost from a newly constructed sand-cement layer dries out through the surface so the curing
method becomes critical. For many years the most common curing methods have been to spray
water on the top of the layer two or three times a day or to spray a cut-back bitumen curing
membrane on top of the layer. Both of these methods are completely ineffective for sealing moisture
in the layer and they also encourage carbonation from the top of the layer. If 30 to 40mm of
untreated sand is placed on top of the sand-cement layer and then sprayed three times each day the
loss of moisture is reduced to almost zero. Another excellent curing system is to apply a heavy
spray of slow-breaking emulsion on top of the freshly constructed layer. However, this method can
cause problems with bleeding in a thin bituminous surface placed on top at a later stage.
The surface of roads with sand-cement bases and the cracks which form in them must be carefully
sealed to prevent the ingress of water and the pumping of fines from the base and lower layers.
Care should also be taken to ensure that sands for stabilisation with cement do not contain
excessive deleterious organic material which can interfere with the cementitious reactions.
There has been mixed success with the use of cement in stabilised sand bases in the Southern
African region for which some examples are presented below.

57
Mozambique: Cement stabilization has been used extensively since the mid-1960s on a number of
trunk roads in Mozambique, such as the EN1 road south of the Save river where very high cement
contents (typically 8%) were required to achieve the required strength. However, such high contents
of stabilizer have resulted in significant shrinkage cracking, leading to reflective cracking propagating
through the surfacing and consequent high maintenance requirements (Carvalho, undated).
Examples have also been reported of failures in the top few millimeters immediately beneath the
surfacing layer of sands stabilized with 2% cement (Carvalho, undated). This had caused the
surfacing to become loose, followed by a tendency to strip off. Although not diagnosed as such,
this type of failure has the hallmarks of degradation of the pavement layer due to carbonation as
reported by Netterberg, 1987, 1991 and Paige-green et al, 1990.
More recently, cement stabilization has been the subject of research which aimed to characterize
cement stabilized sand bases under Accelerated Pavement Testing (de Vos, 2007). The main
objective of such work is to develop more appropriate pavement design methods for Mozambique
which take account of the mostly single sized sands found in the coastal plains and dunes in the
country. The development of these new designs is still a work in progress.
Botswana: Cement stabilization of sand has been relatively little used in Botswana. There is one
reported example of a 25km section of the AI highway between Artesia and Dibete which was
stabilized with 3% cement and which has apparently performed satisfactorily for more than 25
years. However, there was scabbing of the surfacing in areas due to a weak, carbonated upper
basecourse (Netterberg, personal communication, 2012).
5.5.5 Bitumen stabilization
Bitumen is used commonly as a stabilizing agent for many materials. However, it is noteworthy that
neither of the older Guides to Bitumen Stabilized Materials (GEMS) (Sabita, 1993) or bitumen
modified bases (ETB) (Sabita, 1999) include the possible use of sands, probably more through a
lack of information than by design. However, the most recent guideline (Asphalt Academy, 2009)
includes a material class (BSM3) that caters for the use of sands.
Successful stabilization of sands has been carried out in a number of countries in Southern Africa
and the use of foamed bitumen is increasing in popularity and success with this technique using
sands for low volume roads having been reported (Paige-Green and Gerryts, 1998). Some
examples of the use of bitumen for stabilization of sands are presented below.
Mozambique: In Mozambique hot sand asphalt was used up to the early 1970s before the war of
Independence (van Wijk and Carvalho, 2003). More recently, cold bitumen sand mixes (BSM) also
referred to as sand treated with emulsion (STE) were constructed as a demonstration project at
Marracuene (Guiamba et al, 2010) with the aim of producing a relatively flexible bitumen
emulsion/sand admixture (5.6% emulsion) that would be more forgiving to axle overloading and
less susceptible to shrinkage cracking commonly associated with cement stabilization.
Experimental trials of emulsion treated base design in accordance with the Technical Guideline:
Bitumen Stabilised Materials (Asphalt Academy, 2009) and comprising 4% - 8% emulsion and up
to 1% cement have also been constructed as part of the AFCAP project - Targeted Interventions
on Low Volume Rural Roads Project – see Photo 5-2). These trials are being monitored and, since
construction in 2012, have performed satisfactorily.

58
Photo 5-3: ETB construction-plant based approach
Namibia: Various types of sand bitumen stabilization have been carried out in Namibia over many
decades using cutback tar and bitumen (emulsion and foam) (Dierks, 1992). For example, on trunk
road 8/6 from Kongola to Katima Mulilo (Trans-Caprivi Highway) a mixture of Kalahari sand and
calcrete nodules was stabilized with 8% bitumen (Strauss and Hugo, 1979) and the road is
reported to have performed satisfactorily over its design life.
Botswana: Bitumen stabilization has been undertaken only in the form of experimental sections.
Such trials were undertaken at Jwaneng in 1980 where both in situ cold mix and foamed asphalt
was used and on the Serowe-Orapa road where various percentages of bitumen emulsion were
used with different types of sand. The lessons learnt from the monitoring of these sections
indicated the scope for using this type of stabilization on full scale projects (Netterberg, 1998).
South Africa: Bergh et al (2008) describe the effect of bitumen emulsion treatment on the Berea
Red Sands. The materials tested had CBR values of 30 to 60 % in the untreated form which
increased to between 58 and 70% on treatment with between 1 and 2% anionic bitumen emulsion
with 1% cement. It was notable that by adding some -9.5 mm graded aggregate, both the natural and
emulsion treated CBR strengths increased significantly (73 to 96 and 112 to > 120% respectively).
Emulsion treated sands have also been used successfully in South Africa (Henderson, 1988).
5.5.6 Bitumen and cement:
In recent years, bitumen emulsion has become more readily available and is increasingly being used
together with cement for stabilization of sands. International evidence suggests that adequate
strengths can be achieved, and cracking can be substantially reduced, due to a much lower cement
content. However, there is still insufficient experience to determine whether pavements constructed
in this way will be sufficiently durable over the intended life of the road, and to establish the optimal
proportion of cement and bitumen binder.
Mozambique: Bitumen/cement stabilization was undertaken on the section of the ENI between
Chicumbane and Xai Xai where 2% cement and 3% bitumen were initially used but subsequently
changed to a more conservative 3% cement and 3% bitumen due to uncertainties over the long
term durability of the cement/bitumen emulsion combination of stabilizing agents. Significant
sections of the road were surfaced with a chip seal and other section with hotmix asphalt.

59
Disconcertingly, a number of failures occurred along the recently completed Xai Xai Chizabuka
section of the road in Gaza to complete failure of the Gorongoza-Caia section in Sofala and the
Macomia-Oasse road in Cabo Delgado. The reasons for such problems have still not been
ascertained and are the subject of on-going investigations.
Namibia: In the upgrading of the Trans-Caprivi highway, both cement and bitumen emulsion were
used together for stabilization of the sandy-calcrete reclaimed old sand asphalt basecourse-Kalahari
sand pavement. However, even during construction, shallow base failures occurred for a variety of
reasons including inadequate mixing of the stabilizers, carbonation of the upper base layer, etc.
(Netterberg, personal communication).
5.5.7 Other
(1) Polymers: There have been other instances where the quality of sands have been
improved using different forms of stabilization. These include the use of proprietary chemical soil
stabilizers and polymers which were investigated in Namibia (Mgangira, 2007) and from which it
was concluded from laboratory results that some Kalahari sands have the potential to improve their
performance when treated with synthetic polymers. However, the use of such polymers in the field
and their long term performance and cost-effectiveness are yet to be ascertained.
(2) Tar: Although there have been many cases of the use of coke-oven tar being used as a
stabiliser for road materials including sands (1970-1990), its use is not discussed further in this
document owing to recent limitations on the use of tar due to its potentially detrimental health effects.
(3) Geocells: These are essentially a form of cellular confinement comprising a geo-synthetic
material designed to confine soil or other cohesionless material. After tensioning, granular
material, coarse aggregate or lean concrete is vibrated into the cells to produce a load distributing
pavement layer.
Geocells have been used in a variety of applications in Southern Africa for which a number of case
studies have been reported (Visser, AT and Hall, S. 2003). Geocells also find application in situations
where very steep grades preclude the use of either gravel or bituminous surfacings. Although geocells
are potentially suitable for use with sand for low volume roads, there are no reported full-scale
examples of this application in the SADC region. However, interestingly, the US Corps of Engineers
report in a sand road case study (Presto Products Company, 1991) the successful use of sand as the
infill material for their Geoweb Cellular Confinement System (a type of geocell) in the construction of
roads in the Algerian Sahara Desert.
Photo 5-4: Sand filling of geocell by front end loader Photo 5-5: Use of sand-filled geocell by 40 tonne truck
60
5.5.8 Summary of experience with stabilization
Experience with the use of chemical stabilization as a means of soil improvement in Southern Africa
has been very mixed. As a result of a number of reported failures in the region, studies were carried out
by the CSIR (Netterberg, 1987, 1991; Paige-green, Sampson and Netterberg, 1990). These studies
indicated that road failures could be attributed partly to the degradation of the stabilising agents and
their cemented products through a process known as “carbonation” (Netterberg and Paige-green,
1984) in which distress manifests itself in roads constructed with stabilized bases as follows:
Surface disintegration of the primed base during construction
Loss of the seal during service
Partial or complete loss of cementation and strength
Rutting, shearing, pumping and cracking
Increasing plasticity index
The above are inter-related effects since some lead on to others. The effects suggest that carbonation
can contribute to premature distress in some circumstances.
As a result of reports circulated at that time to road authorities both in South Africa and elsewhere in
the region, there was a general loss of confidence in the chemical stabilization process and some
countries in the region discontinued the use of chemical stabilization in road projects.
Further studies carried out by the UK Transport Research Laboratory on the Performance of
Chemically Stabilised Road Bases by the UK Transport Research Laboratory (Gourley and
Greening, 1999) have indicated that road failures could be attributed partly to the degradation of the
stabilising agents and their cemented products through ‘carbonation’. However, they also emphasized
that there are also many examples within Southern Africa where the use of chemical stabilization has
been very successful, even on roads that have received little maintenance.
Experience has shown that, provided the initial consumption of stabilizer determined in the
laboratory is exceeded, the potential for detrimental carbonation is minimal (Paige-Green, 2008).
This is probably why there is conflicting evidence on the deleterious affects of carbonation. Only in
cases where insufficient stabilizer has been added have significant problems been encountered.
Nonetheless, this conflicting evidence has resulted in considerable uncertainty about the use of
stabilization as an option for road projects.
More recently, a literature survey undertaken as part of a major project on the Performance
Characterisation of Cement Treated Sand Base Material of Mozambique (de Vos, 2007).
concluded that:
A number of pavement design methods used worldwide are being used in Mozambique.
Some are not necessarily applicable to Mozambican conditions resulting in the
implementation of inappropriate designs and construction techniques leading to poor
performance.
The South African Mechanistic Design Procedure (SAMDP) is extensively used in
Mozambique. However, the SAMDP is based on transfer functions developed for South
African materials and conditions that have been found inappropriate for Mozambican
conditions.

61
The lack of knowledge about the appropriate engineering properties of locally available road
building materials, mostly sands but also finely graded materials, is the main cause of
unsuccessful projects. Main contributors to the premature failures of pavements appear to be:
- specification of incorrect type of stablizer or incorrect stabilizer content;
- inappropriate construction practices;
- lack of understanding of behaviour and the long term performance of the materials;
- very high axle loads and extreme climatic conditions;
- inability to maintain roads due to lack of funds.
In view of the very mixed experience with the use of various stabilizers for use with sands and other
materials in Southern Africa, it is apparent that there is an urgent need to undertake a study with the
following objectives:
a) Establish reasons for the disparate performance of chemically stabilised road bases in the
region
b) Evaluate the performance of chemically stabilised sand road bases in relation to current
pavement design criteria
c) Make recommendations and provide guidelines for the chemical stabilization of sands/sandy
materials which are based on performance data, so that confidence is restored in this method
of improving sands for use in road bases in the region for both low volume and high volume
roads.
The above study would be most beneficial to a country such as Mozambique where sand is generally
the only type of material that can be used for road construction in much of the country.
62
6. CONSTRUCTION ISSUES
6.1 Introduction
Construction of roads using sand should be viewed as a holistic activity that brings together all the
factors that may affect both the short- and long-term performance of the road. Unless the specific
aims and purposes of each factor, i.e. design, selection of materials, limits for moisture control,
etc., are fully understood and achieved during construction, the end product will be unsatisfactory
and a less than acceptable performance is likely to be obtained. The various factors that should be
considered during construction are highlighted below.
6.2 General Guidance
General guidance for construction in Kalahari sand is provided by the Zimbabwe Manual – Part F:
Construction (Ministry of Roads and Road Traffic, 1979) and may be summarized as follows:
Due to the unstable grading and non-plastic properties of many sands, it is not
considered practical or economical to attempt earthworks operations except during or
soon after rains.
As soon as the natural moisture content to a depth of at least 1 m below ground level
reaches the limit at which compaction may be attempted, then the road bed must be
compacted using the heaviest plant available. This will generally cause the road bed level
to drop at least 100 – 150 mm.
Fills should be kept as low as possible and formed with borrow material. Side drains will
only be cut where necessitated by natural cross-fall. It will be sufficient if the lowest edge
of the subgrade is kept 75 mm above original ground level. High fills may be compacted
in large lifts or more using the appropriate (impact) compaction equipment.
Particular care should be taken on all cuts and fills to avoid erosion damage and
reinstatement of natural grass cover should be encouraged. Fills greater than 1.5 m in height
should be clad with suitable cohesive material as soon as possible after construction.
The sand subgrade cuts easily under traffic, and it is, therefore, necessary to keep the
sand wet and graded to shape immediately in front of lorries dumping.
Fill or shoulder slopes constructed of the lighter soils, unless cladded will usually require
protection from road water, particularly on curves. This can be achieved by means of
kerbed and channel shoulder drains discharging at intervals into paved flumes which
carry the water beyond the toe of the slope. The whole slope must be planted with a
suitable grass, a practice which is desirable on all fills, of whatever material.
The face of every cut must be protected from surface water by means of cut-off drains.
Where cuts have a large surface area in plan, it may be desirable to provide surface
water drainage, by means of benches at a suitable slope, to take water to the extremities
of the cut. Great care is required to ensure that these drains will neither silt up nor erode,
otherwise, they may do more damage than they are designed to prevent.
Erosion control in side drains having steepish grades is best achieved by paving or
cement stabilizing the drain.

63
6.3 Compaction Aspects
6.3.1 Achieving maximum density
One of the critical aspects of using sands in road construction is to maximise their strength and
increase their stiffness and bearing capacity by producing the highest possible density in the
subgrade and pavement layers. This can be achieved, not necessarily by compacting to a pre-
determined relative compaction level as is traditionally done but, rather, by compacting to the highest
uniform level of density (“compaction to refusal” where possible (i.e. where there is no significant
breakdown of the soil particles which is unlikely with sands as they are composed mostly of silica
(quartz) – one of the minerals least likely to breakdown under compaction). In so doing, as illustrated
in Figures 6.1 and 6.2, there is a significant gain in density, strength and stiffness, the benefits of
which usually outweigh the costs of a few additional passes of the roller.
The use of dry compaction (i.e., at natural moisture content, which could be between 3 and 4
percent) can produce the same density as conventional compaction at OMC. The air voids are,
however, significantly higher in this material and the benefit of suction forces developed during
drying back of moist compacted materials is lost. Moreover, should wetting up of the relatively high
voided material occur in service, this is likely to lead to loss of strength and consequent
deformation of the pavement. Thus, the implications of this should always be considered when dry
compaction is a possible option.
6.3.2 Compaction moisture
The compaction moisture content is critical to the successful compaction of Kalahari sands. It is
therefore imperative that strict control of moisture is exercised during compaction. This may be
complicated by the fact the OMC differs for different compaction efforts and that the OMC determined
in the laboratory may or may not necessarily be applicable for the plant actually used on site.
Compaction trials are the best way of determining the OMC for any combination of plant. The
recommended technique for this is to prepare strips of material at various moisture contents, partly
compact these with the same number of roller passes and find the one with the highest density (i.e.
OMC for the plant used). Another test strip is then compacted at the identified OMC to determine the
optimum number of passes to achieve maximum density (Wylde, 1979).
No. of rol ler passes
Den
sity
/Sti
ffnes
s
Plastic Elasto-plastic ElasticA B C
I I
D2 IID1
N1 N2
Compaction to refusal
Ma
xA
nnu
alD
efle
ctio
n(m
m)
Pavement Life (E80s)
Increase in life
Reduction in deflection
Deflection/life relationship
Figure 6.2 – Deflection/life relationshipFigure 6.1 – Illustration of concept of“compaction to refusal”

64
It is also necessary to ensure that premature sealing does not lock in construction moisture.
Allowing the material to dry back from its OMC before priming, can minimise the incidence of long
term shrinkage cracks developing through the seal (Sandman, Wall and Wilson, 1974) as well as
allow the sand to develop a large part of its suction strength (Pederson, 1988). It should be noted,
however, that some sands tend to lose density on drying out but are quite firm while still wet. It
would be advisable therefore to cover such sands as soon as possible after compaction.
6.3.3 Surface shear
A frequent problem observed during the compaction of essentially uniform sized sandy materials is
the tendency for shearing of the material during compaction, particularly when excessive vibration
is used (Chauvin, undated; Murphy, 1981). The use of heavy static rollers at slow speeds can
overcome this but generally, it is necessary to carry out compaction trials using combinations of
padfoot or grid rollers, pneumatic tyred rollers and vibratory compactors of different sizes to
determine the optimum combination. Generally high amplitude, low frequency vibrating roller
operations are more likely than low amplitude (< 1.1 mm), high frequency (> 35 Hz) operations to
cause shearing (Murphy, 1981).
6.3.4 Density and strength
In order to maintain its density and strength, sand needs to be confined. This can be achieved by
keeping the pavement levels as low as possible, but this is not always desirable, as the pavement
drainage characteristics are reduced. Widening the layer to be compacted and using flat side slopes
can achieve a similar effect whilst improving the pavement drainage and overall structural capacity. It
may, however, be difficult in many circumstances to achieve high densities with some fine materials
(Murphy, 1981) but as high a density as possible should be achieved. Frequently, compaction of fine
materials can result in the creation of poorly bonded lenses of material, compaction planes and layers
of fines on the surface – in these cases, the top 10 to 20 mm should be cut to waste (Murphy, 1981)
and provision for this should be made in determining the compaction lifts. A weak interlayer between
the base and the seal must be avoided at all costs, even at the expense of surface finish (Netterberg
and de Beer, 2012).
6.3.5 Collapsible sands
The mitigation of collapse of sand requires a high degree of compaction. Using conventional plant
(i.e., heavy vibrating rollers), the application of large quantities of water is necessary. Where
compaction water is scarce or expensive, high-energy impact compaction to pre-collapse the
Kgalagadi sands can be a cost-effective solution compared with more conventional vibratory
rollers. This type of compaction produces a much deeper effect than conventional plant and relies
on high energy to collapse the materials instead of moisture (see Figure 7.3). The use of high-
energy impact compaction to pre-collapse Kgalagadi sands has produced good results (Pinard,
1989) and significant economies in terms of water usage can be achieved.

65
Photo 6-1: Compaction of subgrade/fill by impact compactor
Where collapsible sands exist, the bulk of the collapse potential should be removed from the upper
1 m of the subgrade to ensure stability of the pavement structure (Weston, 1980; Jones and van
Alphen, 1980). This is normally difficult to achieve with conventional plant, although good results
using such plant have been reported from Zimbabwe (Mainwaring, 1968) This approach typically
requires that the sand is brought to a relatively high moisture content prior to compaction – often a
costly and time consuming exercise in hot, arid environments. In these cases, construction should
be programmed to ensure that subgrade compaction is carried out primarily during the rainy
season.
Alternatively, impact compaction can be considered for the reasons stated above for compaction at
depth. Because of the undulations left by the impact compactor (see photo opposite), the
uppermost 100 mm of the compacted layer has to be finished off with a vibratory or static roller.
Prior to such rolling, the top 50 – 100 mm of the impacted layer shall be cut off to remove all
surface irregularities which would otherwise be reflected in the surfacing after some time.
Where the sands have such poor traction (e.g. the more single size white sands) that the impact
compactor is not able to operate efficiently, it is necessary to use a 100 – 150 mm capping layer of
gravel or better quality (more cohesive) sand. The pre-collapsing of the subgrade can then be
applied from the top of the capping layer.
6.4 Construction Aspects
6.4.1 Bush clearing, grubbing and topsoil removal
Bush clearing, grubbing and topsoil should be undertaken in an environmentally and socially sensitive
manner. Damage to the vegetation cover should be minimised and shifting of soil and associated
damage due to erosion avoided. All topsoil that is stripped should be stockpiled for use in areas that are
being reinstated for farming purposes or to promote vegetation. Any vegetation being removed should be
disposed of in a manner that is to the benefit of the community, e.g. for fuel wood. Labour-based
methods should be considered where possible.
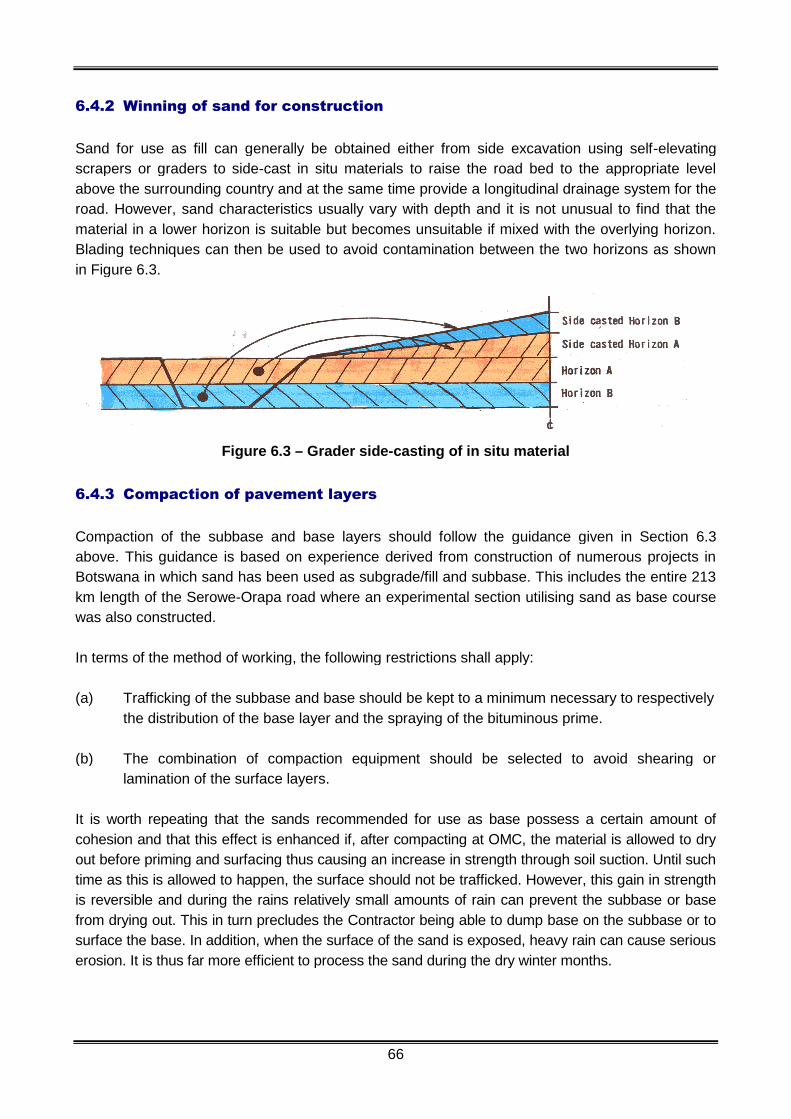
66
6.4.2 Winning of sand for construction
Sand for use as fill can generally be obtained either from side excavation using self-elevating
scrapers or graders to side-cast in situ materials to raise the road bed to the appropriate level
above the surrounding country and at the same time provide a longitudinal drainage system for the
road. However, sand characteristics usually vary with depth and it is not unusual to find that the
material in a lower horizon is suitable but becomes unsuitable if mixed with the overlying horizon.
Blading techniques can then be used to avoid contamination between the two horizons as shown
in Figure 6.3.
Figure 6.3 – Grader side-casting of in situ material
6.4.3 Compaction of pavement layers
Compaction of the subbase and base layers should follow the guidance given in Section 6.3
above. This guidance is based on experience derived from construction of numerous projects in
Botswana in which sand has been used as subgrade/fill and subbase. This includes the entire 213
km length of the Serowe-Orapa road where an experimental section utilising sand as base course
was also constructed.
In terms of the method of working, the following restrictions shall apply:
(a) Trafficking of the subbase and base should be kept to a minimum necessary to respectively
the distribution of the base layer and the spraying of the bituminous prime.
(b) The combination of compaction equipment should be selected to avoid shearing or
lamination of the surface layers.
It is worth repeating that the sands recommended for use as base possess a certain amount of
cohesion and that this effect is enhanced if, after compacting at OMC, the material is allowed to dry
out before priming and surfacing thus causing an increase in strength through soil suction. Until such
time as this is allowed to happen, the surface should not be trafficked. However, this gain in strength
is reversible and during the rains relatively small amounts of rain can prevent the subbase or base
from drying out. This in turn precludes the Contractor being able to dump base on the subbase or to
surface the base. In addition, when the surface of the sand is exposed, heavy rain can cause serious
erosion. It is thus far more efficient to process the sand during the dry winter months.
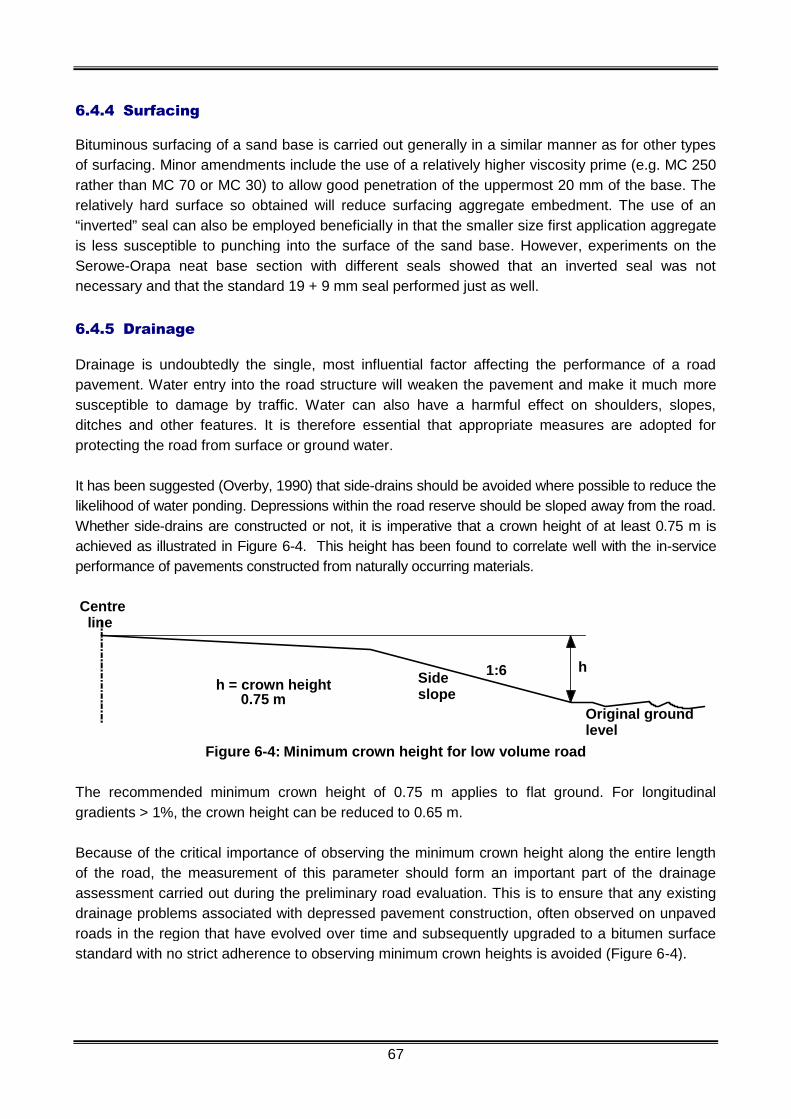
67
6.4.4 Surfacing
Bituminous surfacing of a sand base is carried out generally in a similar manner as for other types
of surfacing. Minor amendments include the use of a relatively higher viscosity prime (e.g. MC 250
rather than MC 70 or MC 30) to allow good penetration of the uppermost 20 mm of the base. The
relatively hard surface so obtained will reduce surfacing aggregate embedment. The use of an
“inverted” seal can also be employed beneficially in that the smaller size first application aggregate
is less susceptible to punching into the surface of the sand base. However, experiments on the
Serowe-Orapa neat base section with different seals showed that an inverted seal was not
necessary and that the standard 19 + 9 mm seal performed just as well.
6.4.5 Drainage
Drainage is undoubtedly the single, most influential factor affecting the performance of a road
pavement. Water entry into the road structure will weaken the pavement and make it much more
susceptible to damage by traffic. Water can also have a harmful effect on shoulders, slopes,
ditches and other features. It is therefore essential that appropriate measures are adopted for
protecting the road from surface or ground water.
It has been suggested (Overby, 1990) that side-drains should be avoided where possible to reduce the
likelihood of water ponding. Depressions within the road reserve should be sloped away from the road.
Whether side-drains are constructed or not, it is imperative that a crown height of at least 0.75 m is
achieved as illustrated in Figure 6-4. This height has been found to correlate well with the in-service
performance of pavements constructed from naturally occurring materials.
h
Centreline
1:6Sideslope
h = crown height0.75 m
Original groundlevel
Figure 6-4: Minimum crown height for low volume road
The recommended minimum crown height of 0.75 m applies to flat ground. For longitudinal
gradients > 1%, the crown height can be reduced to 0.65 m.
Because of the critical importance of observing the minimum crown height along the entire length
of the road, the measurement of this parameter should form an important part of the drainage
assessment carried out during the preliminary road evaluation. This is to ensure that any existing
drainage problems associated with depressed pavement construction, often observed on unpaved
roads in the region that have evolved over time and subsequently upgraded to a bitumen surface
standard with no strict adherence to observing minimum crown heights is avoided (Figure 6-4).

68
Figure 6-5: Potential drainage problems associated with depressed pavement
Where rock or hardpan layers, such as of calcrete or silcrete occur at shallow depths beneath
surficial sand, the possibility of perched water tables is high. Under these situations, precipitation
frequently lies at the surface for weeks or even months and can result in severe softening and/or
collapse of poorly compacted sand layers. The importance of appropriate drainage cannot be
overemphasised. Attempts should be made to fracture hardpan calcrete or silcretes layers forming
perched water tables by ripping with a bull dozer or possibly fracturing with an impact compactor,
in order to reduce the possibility of their stopping the infiltration of water.
It is important to note that, in Zimbabwe, where there is a possibility that the water table rises within
600 mm of the finished road level, the use of untreated sands in the pavement or underlying
Zimbabwe is not permitted in the base (Mitchell, 1982).
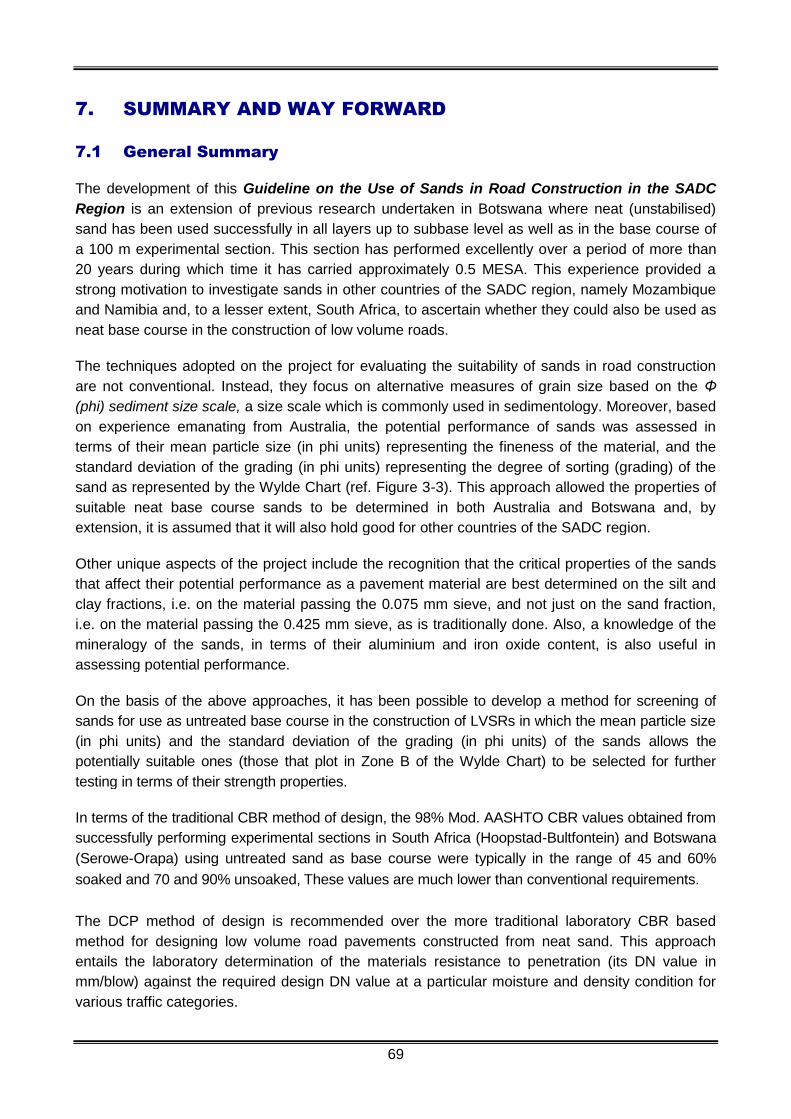
69
7. SUMMARY AND WAY FORWARD
7.1 General Summary
The development of this Guideline on the Use of Sands in Road Construction in the SADC
Region is an extension of previous research undertaken in Botswana where neat (unstabilised)
sand has been used successfully in all layers up to subbase level as well as in the base course of
a 100 m experimental section. This section has performed excellently over a period of more than
20 years during which time it has carried approximately 0.5 MESA. This experience provided a
strong motivation to investigate sands in other countries of the SADC region, namely Mozambique
and Namibia and, to a lesser extent, South Africa, to ascertain whether they could also be used as
neat base course in the construction of low volume roads.
The techniques adopted on the project for evaluating the suitability of sands in road construction
are not conventional. Instead, they focus on alternative measures of grain size based on the Φ
(phi) sediment size scale, a size scale which is commonly used in sedimentology. Moreover, based
on experience emanating from Australia, the potential performance of sands was assessed in
terms of their mean particle size (in phi units) representing the fineness of the material, and the
standard deviation of the grading (in phi units) representing the degree of sorting (grading) of the
sand as represented by the Wylde Chart (ref. Figure 3-3). This approach allowed the properties of
suitable neat base course sands to be determined in both Australia and Botswana and, by
extension, it is assumed that it will also hold good for other countries of the SADC region.
Other unique aspects of the project include the recognition that the critical properties of the sands
that affect their potential performance as a pavement material are best determined on the silt and
clay fractions, i.e. on the material passing the 0.075 mm sieve, and not just on the sand fraction,
i.e. on the material passing the 0.425 mm sieve, as is traditionally done. Also, a knowledge of the
mineralogy of the sands, in terms of their aluminium and iron oxide content, is also useful in
assessing potential performance.
On the basis of the above approaches, it has been possible to develop a method for screening of
sands for use as untreated base course in the construction of LVSRs in which the mean particle size
(in phi units) and the standard deviation of the grading (in phi units) of the sands allows the
potentially suitable ones (those that plot in Zone B of the Wylde Chart) to be selected for further
testing in terms of their strength properties.
In terms of the traditional CBR method of design, the 98% Mod. AASHTO CBR values obtained from
successfully performing experimental sections in South Africa (Hoopstad-Bultfontein) and Botswana
(Serowe-Orapa) using untreated sand as base course were typically in the range of 45 and 60%
soaked and 70 and 90% unsoaked, These values are much lower than conventional requirements.
The DCP method of design is recommended over the more traditional laboratory CBR based
method for designing low volume road pavements constructed from neat sand. This approach
entails the laboratory determination of the materials resistance to penetration (its DN value in
mm/blow) against the required design DN value at a particular moisture and density condition for
various traffic categories.

70
The construction of sand pavements needs to be undertaken carefully. Sands tend to be moisture
sensitive and proper compaction will only be achieved with the correct type of plant operating at
the appropriate moisture content. However, such roads have been successfully constructed before
and there is no reason why they should present insurmountable problems in future. In addition, as
is the case for all roads constructed of natural occurring materials, drainage is of paramount
importance as is maintenance.
In summary, the project has provided appropriate guidance on methods of prospecting for,
screening (use of the Wylde Chart), and testing of sands to ascertain their suitability for use as
neat base course in the construction of low volume sealed road pavements. The focus has been
on the use of neat sand as a pavement layer, more so as base course, rather than on the use of
relatively expensive stabilisation which can be avoided in a number of cases.
Because of the much larger number and variety of sand samples tested, compared with the
previous research work undertaken in Botswana, the project has provided a more complete
understanding of the properties of sands that make them potentially suitable for use as neat base
in LVSR construction. However, as discussed below, further work is still required to facilitate the
more wide-spread use of sands in LVSR construction.
Guidance has also been provided on how to design low volume road pavements using a simplified
method based on the use of the DCP as well as how to construct them use sand as a pavement
material. The stage has therefore been set for considering the more widespread use of sands in
road construction in the SADC region.
7.2 Way Forward
A gradual, staged approach should be followed in ensuring that the outcome of the investigations carried
out in the region are put into practice through the construction of demonstration projects. This has already
begun in Mozambique where ANE has used red coloured sand as neat base course in an experimental
section This type of sand was chosen on the basis of engineering judgement before the outcome of this
project. However, as it happens, the sand is dark red in colour and its properties plot in the desirable
Zone B of the Wylde Chart. The performance of the section needs to be carefully monitored so as to
provide the necessary feedback to the design and construction phases of such roads.
The Hoopstad-Bultfontein experimental section contains a wealth of information which has only been
partially exploited in terms of the relatively limited standard laboratory testing that was carried out.
There is a need to undertake a more comprehensive investigation and write up of this section
including more extensive laboratory DN testing.
There is also scope for undertaking trials in which sands that do not plot in Zone B of the Wylde
Chart, but are nonetheless believed to be suitable for use as neat base course, are investigated. This
will allow the Wylde Chart to be gradually refined on the basis of more extensive regional research.
Finally, it is important to ensure effective technology transfer of the use of sands in road
construction occurs within the region. For this to be achieved, all the links of the technology
transfer chain should be addressed. Figure 7-1 illustrates the typical pathway from research to
implementation of any new technology, such as the use of sands in road construction that should
be followed in the SADC region if it is to be implemented in a sustainable manner.
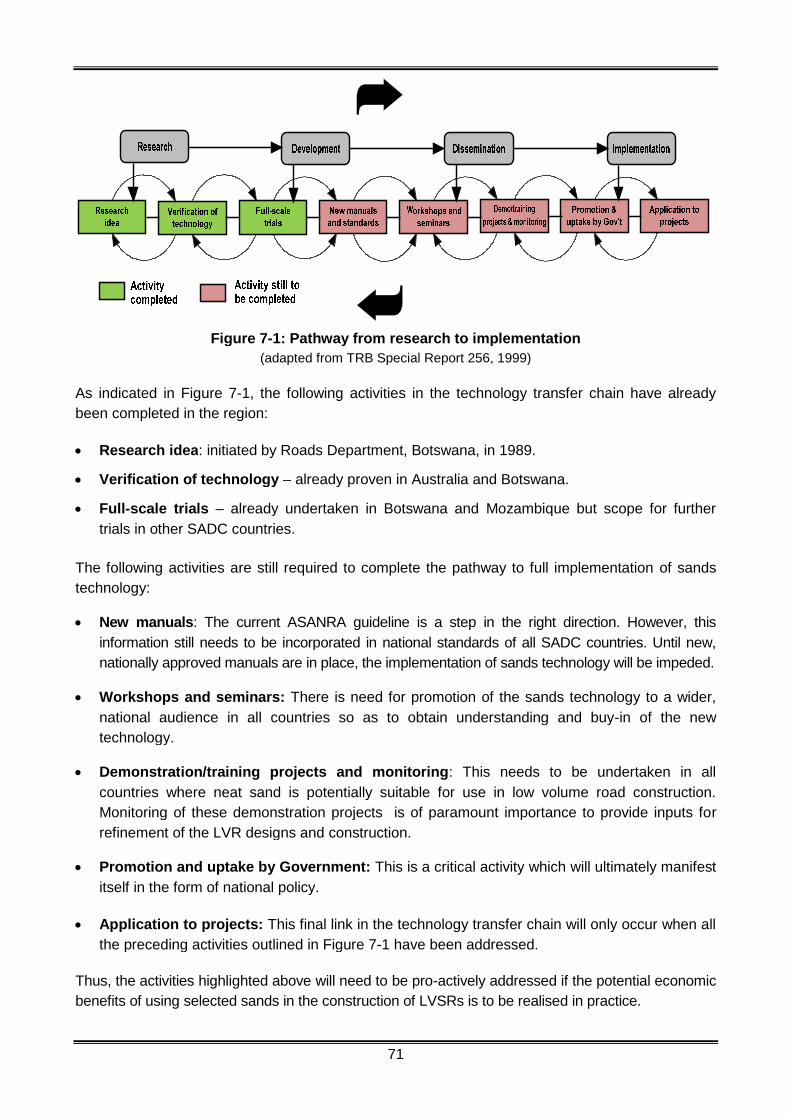
71
Figure 7-1: Pathway from research to implementation
(adapted from TRB Special Report 256, 1999)
As indicated in Figure 7-1, the following activities in the technology transfer chain have already
been completed in the region:
Research idea: initiated by Roads Department, Botswana, in 1989.
Verification of technology – already proven in Australia and Botswana.
Full-scale trials – already undertaken in Botswana and Mozambique but scope for further
trials in other SADC countries.
The following activities are still required to complete the pathway to full implementation of sands
technology:
New manuals: The current ASANRA guideline is a step in the right direction. However, this
information still needs to be incorporated in national standards of all SADC countries. Until new,
nationally approved manuals are in place, the implementation of sands technology will be impeded.
Workshops and seminars: There is need for promotion of the sands technology to a wider,
national audience in all countries so as to obtain understanding and buy-in of the new
technology.
Demonstration/training projects and monitoring: This needs to be undertaken in all
countries where neat sand is potentially suitable for use in low volume road construction.
Monitoring of these demonstration projects is of paramount importance to provide inputs for
refinement of the LVR designs and construction.
Promotion and uptake by Government: This is a critical activity which will ultimately manifest
itself in the form of national policy.
Application to projects: This final link in the technology transfer chain will only occur when all
the preceding activities outlined in Figure 7-1 have been addressed.
Thus, the activities highlighted above will need to be pro-actively addressed if the potential economic
benefits of using selected sands in the construction of LVSRs is to be realised in practice.
72
REFERENCES
Acott, SM. 1979. Sand stabilization using foamed bitumen. Proc 3rd Conf Asphalt Pavements
for southern Africa. Durban, 1979, pp 155 – 171.
AFCAP (2013). Design Manual for Low Volume Sealed Roads Using the DCP Design Method.
Ministry of Transport and Public Works, Lilongwe, Malawi.
Anderson J.R., Department of Geology, Georgia Perimeter College, Dunwoods, GA 30038, USA.
Personal communication.
Anon. 1974. A dictionary of geology. Harmondsworth, England: Penguin.
Aranovich, LAS and Heyn, AT. 1984. Performance of low cost pavements in Parana, Brazil.
Proc Int Conf Roads and Development, Paris, 1984, Vol 2, pp 761-766. (Presses Ponts et
Chaussees).
Baart D., 1961. Road Construction in Kalahari Sands and Associated Formations. Proc.Constr. Engrs. Conf. Ministry of Roads & Road Traffic, Rhodesia, August 1961.
Bagnold, RA. 1941. The physics of blown sands and desert dunes. London; Methuen.
Baillieul, TA. 1975. A reconnaissance survey of the cover sands in the republic of Botswana.
Journal of Sediment Petrology, Vol 45 (2), pp 494-503.
Bergh, AO, Kleyn, EG and McKay, AH. 2008. Preliminary studies on the utilisation of Berea
Red Sands for subbase and base construction. Proc 27th Southern African Transport
Conference. Pretoria, 2008, pp 108-124.
Bindra, SP.1987. An approach to the development of pavement structures for arid regions of
the Middle Eastern countries with special reference to Kuwaiti conditions. Indian Highways,
Vol 15 (2), pp 102-119.
Bofinger, HE. 1971. The Behaviour of Soil cement pavements with Special reference to the
Problems of Cracking. 4th Asian Reg. Conf. on Soil Mechanics and Foundation Engineering,
Bangkok, Thailand, July 1971.
Booth, AR. 1977. Collapse settlement in compacted soils. Pretoria: CSIR Transportek. (CSIRResearch Report 324 or Bulletin 13).
Botswana Roads Department, 1992. Roads in Botswana. Gaborone: Botswana Roads
Department.
Botswana Roads Department. 1999. The Design, Construction and Maintenance of Otta Seals.
Gaborone: Botswana Roads Department. (Guideline No 1).
Botswana Roads Department. 2000. Methods and Procedures for Prospecting for Road
Construction Materials. Gaborone: Botswana Roads Department. (Guideline No 3).
Botswana Roads Department. 2001. The Prevention and Repair of Salt Damage to Roads and
Runways. Gaborone: Botswana Roads Department. (Guideline No 6).
Botswana Roads Department. 2010. The Use of Kgalagadi Sands in Road Construction.
Gaborone: Botswana Roads Department. (Guideline No 11).
Brink, ABA (Editor). 1985. Engineering Geology of Southern Africa. Pretoria: Building
Publications. (Volume 4).

73
British Standards Institution. 1990. Methods of test for soils for civil engineering purposes.
London: British Standards Institution. (BS 1377).
Carvalho, P. Undated. Effective use of sands as a road base under labour-based
construction: experiences in Mozambique.
Carney, JN, Aldiss, DT and Lock, NP. 1994. The Geology of Botswana. Lobatse: Geological
Survey Department. (Bulletin 37).
Chauvin, JJ. (undated). Les sables: Guide pratique d’utilisation routiere. Bordeaux: Institut des
sciences et des techniques de l’equipement et de l’environnement pour le developpement.
(Synthesis).
COLTO. 1998. Standard specifications for road and bridge works for state road authorities.
Pretoria: Committee of Land Transport Officials (COLTO).
Cooke, HBS. 1964. The Pleistocene Environment in southern Africa. In: Ecological studies in
southern Africa (Edited by DHS Davis) The Hague, Holland: Dr W Junk Publishers.
De Vos, ER. 2007. Performance Characterisation of Cement Treated Sand Base Material of
Mozambique. MSc Thesis, University of Srellenbosch, march 2007.
Dierks, k. 1992. Technical Aspects for Appropriate Low-Volume Roads in Namibia. PhD
Thesis, Technical University of berlin, February, 1992.
Dingle, RV, Siesser, WG and Newton, AR. 1983. Mesozoic and Tertiary Geology of Southern
Africa. Rotterdam: A.A. Balkema.
Du Toit, AL. 1954. The Geology of South Africa. Edinburgh: Oliver and Boyd.
Emery, SJ. 1992. The prediction of moisture content in untreated pavement layers and an
application to design in southern Africa. Pretoria: CSIR Transportek. (Bulletin 20).
Emery, SJ, Cocks, G and Keeley, R. 2007. Transportation Research Record, 1989 (2), pp 194-
200.
Folk, RL. 1954. The distinction between grain size and mineral composition in sedimentary
rock nomenclature. The Journal of Geology, V.62, pp344-359.
Geological Survey of Namibia. 2006. Accessed at http://www.mme.gov.na/gsn/namibiageology.htm
on 16/04/2012.
Giffen, JC, Youdale, GP and Walter, PD. 1978. Use of non-standard gravels as bases. Proc 9th
ARRB Conference, Part 4, pp 54-61.
Gourley, CS. and Greening, PAK. 1999. Performance of Chemically Stabilised Road bases:
Results and Recommendations from Studies in Southern Africa. TRL Project Report
PR/OSC/168/99. Project Record No. R6020.
Guiamba, D. Horak, E and Visser, AT. 2010. Comparative studies of non-destructive field
testing devices on BSM-emulsion. Proc. 29th Annual Southern African Transport Conference
and Exhibition (SATC), Pretoria, South Africa.
Henderson, MG. 1988. Emulsion stabilized sand base: An alternative to crushed stone.
SAICE Seminar on Cost Effectiveness for Township Planning, Design and Construction, Cape
Town, July 1988.
74
Horta, JC. 1987. The design and construction of low volume roads in the northwestern
Sahara. Transport Research Record, 1106, Vol 2, pp 278-290.
Jennings, JE and Knight, K. 1975. A guide to construction on or with materials exhibiting
additional settlement due to “collapse” of grain structure. Proceedings of the 6th African
Regional Conference on Soil Mechanics and Foundation Engineering, Durban, September 1975.
Jewell, RJ. 1970. Flexible pavement base course materials selection in western Australia.
Civil Engineering Transactions, April 1970, pp 79-84.
Jones, DJ. 1995. The use of sand cushioning in road maintenance. Proc Annual Transport
Convention, Pretoria.
Krumbein, WC and Pettijohn, FJ. 1938. Manual of sedimentary petrography, New York,
Appleton-Century.
Krumbein, WC and Sloss, LL. 1963. Stratigraphy and Sedimentation. San Francisco: WH
Freeman & Co.
LACHELT, S (2004). Geology and mineral resources of Mozambique. Republica de
Mocambique Minesterio dos Recursos Minerais e Energia, Maputo, 515 pp
Lancaster, N. 1986. Grain size characteristics of linear dunes in the southwestern Kalahari.
Journal of Sedimentary Petrology, 56, 395-400.
Lancaster, N. 2000. Eolian Deposits. In: The Cenozoic of Southern Africa (Edited by TC
Partridge and RR Maud). New York: Oxford University Press, pp 73-87.
Leach, JD. 1960. Low cost roads – New Australian developments. African Roads and
Transport, July/August 1960, pp 7-27.
Lee, IK, Weeks W. and Ingles OG. 1983. Geotechnical Engineering. Pitman Books Ltd., London.
Lees, G. 1964. The measurement of Particle Shape and Its Influence in Engineering
Materials. Journal of the British Granite and Whinstone Federation, Vol. 4, No. 2.
Loock, A. (ed). 1990. Handbook of standard testing methods for advisory purposes. Soil
Science Society of South Africa, Pretoria.
Masch, FD and Denny, KJ. 1965. Grain size distribution and its effect on the permeability of
unconsolidated sands. Water Resource Research Journal, Vol 2 (4), pp 665-689.
Main Roads Department. 1975. Western Australia Confined Compression Test. Perth: Main
Roads Department, Western Australia. (Test method S17-75).
Main Roads. 2002. Selection and use of naturally occurring materials as base and subbase.
Perth: Main Roads Department.
Mainwaring, P. 1968. The reconstruction of the Bulawayo to Victoria Falls Road. The
Rhodesian Engineer, Vol 6(2), pp 646-656.
Marais, CP and Freeme, CR. 1977. Performance study of asphalt road pavement with
bituminous stabilised sand bases. Trans Res Record, 641, pp 52-61.
Mc Manus, DA. 1982. Phi and sediment size analysis: Discussion. Journal of Sedimentary
Research, 52:1011-1014.
75
Maud, RR and Botha, GA. 2000. Deposits of the South Eastern and Southern Coasts. In: The
Cenozoic of Southern Africa (Edited by TC Partridge and RR Maud). New York: Oxford University
Press, pp 19-32.
Mayer, JJ. 1986. Differential erosion of possible Kalahari aeolian deposits along the Vaal-
Orange drainage basin and the upper reaches of the Harts river. Trans Geol Soc S Afr, 89, pp
401-407.
Metcalf, JB and Wylde, LJ. 1984. A re-examination of specification parameters for sandy soil
roadbase materials. Bull Int Ass Engng Geol, No 30, pp 435-437.
Mgangira, MB. Characterisation of some particle properties of Kalahari Sands. Proc 14th
Africa Reg Conf Soil Mech and Geotechnical Engng, Yaounde, Cameroon, Nov 2007, Vol 1, pp141
– 146.
Miller, R McG. 2008. The Geology of Namibia (Volume 3): Ministry of Mines and Energy,
Windhoek.
Ministry of Works, Transport and Communications. 1982. Botswana Road Design Manual.
Gaborone: Ministry of Works, Transport and Communications.
Ministry of Works, Transport and Communications. 1983. Standard Specification for Roads and
Bridge Works. Gaborone: Ministry of Works, Transport and Communications.
Mitchell, RL. 1982. Flexible pavement design in Zimbabwe. Proc Instn Civ Engrs, Part 1, August
1982, pp 333-354.
Mitchell, RL. 1959. Road construction on Aeolian sands. Proc 2nd Reg Conf on Soil Mechanics
and Foundation Engineering, Lourenco Marques, 1959, pp187-192.
Mockett, LD and Barton, ME. 1990. Report on the Engineering Geological Characteristics of
sand samples from the Serowe-Orapa Road, Botswana. Transport and Road Research
Laboratory, Crowthorne, Berkshire.
Murphy, HW. 1981. The use of non-standard road making materials. Townsville: Queensland
Main Roads Department. (Unpublished report).
National Association of Australian Road Authorities. 1980. Pavement materials: Part 2: natural
gravel, sand clay and soft and fissile rock. Sydney: National Association of Australian Road
Authorities.
Netterberg, F and Paige-Green, P. 1988. Pavement materials for low volume roads in southern
Africa: A review. Proc Annual Transportation Convention, Pretoria, July 1988, Vol 2D, pp 2D-
1 to 2D-51.
Netterberg, F. (1987). Durability of stabilized materials. Proc. Nat. Inst. Transp. Road Res.
Roads Branch Info. Forum, NITRR Rep. TS/9/87, April 1987, CSIR, Pretoria.
Netterberg, FN. 1998. Orapa Kalahari Sand base Experiments: Results of Inspections in 1995
and 1997 and Some Additional Observations. Roads Department, Gaborone.
Netterberg, F. (1991). Durability of lime and cement stabilization. In: Concrete in pavementengineering, Portland Cement Inst., Halfway House.
Netterberg, FN. 2012. Personal communication. Pretoria.

76
Netterberg, F and de Beer, M. (2012). Weak interlayers in flexible and semi-flexible road
pavements : Part 1. Journal of the South African Institution of Civil Engineering, 54, (1), 32-42.
NITRR. 1986. Standard Methods of Testing Road Construction Materials. Pretoria:
Department of Transport. (Technical Methods for Highways, TMH 1).
Nogami, JS and Villibor, DF. 1992. Use of lateritic fine-grained soils in road pavement base
courses. Geotechnical and Geological Engineering, Vol 9, pp 167-182.
Overby, C. 1981. Tsabong-Makopong Road: km 0-16.0: Construction of a bituminous road
1980-1981. Gaborone: Ministry of Works and Communications. (Report 27).
Overby, C. 1982. Material and pavement design for sealed low volume roads in Botswana
1974-1981. Oslo: Public Roads Administration. (NRRL Report 1042).
Overby, C. 1990. Monitoring of sealed low volume roads in Botswana 1980-1989. Oslo: Public
Roads Administration. (NRRL Report 1478).
Paige-Green, P. 1983. Sand as a construction material in Australia. Pretoria: National Institute
for Transport and Road Research, CSIR. (Technical Report TS 21/83).
Paige-green, P., Netterberg, FN. and Sampson. LR. (1990). The carbonation of chemically
stabilized road construction materials: a guide to its identification and treatment. DRTT
Report DPNT-123, CSIR, Pretoria.
Paige-Green, P and Gerryts, E. 1998. An innovative solution for township roads in sandy
areas. The Civil Engineering and Building Contractor, May 1998, pp 74- 77.
Paige-Green, P. 2008. The durability of stabilized materials. Proc 12th Int Conf of the Int Assocfor Computer Methods and Advances in Geomechanics, Goa, India, October 2008, pp 3787 - 3793
Paige-Green, P. 2010. Analysis of Botswana pavement monitoring sections. Pretoria: CSIR
Research Report. (CSIR/BE/IE/ER/2010/0001/B).
Paige-Green, P and Overby, C. 2010. Aspects regarding the use of local materials in roads in
Botswana. Proc 11th Congress of IAEG, Sept, 2010, Auckland, pp 4409 -4418.
Paige-Green P and Pinard, M. 2011. The Use of a Sedimentological Technique for Assessing
the Engineering Performance of Sands in Roads. Proc 15th Africa Reg Conf Soil Mech and
Geotechnical Engng, Maputo, June, 2011, pp 431-438.
Palmer, WT, Viljoen, DP and van der Walt, N. 1992. The Compaction of Kalahari Sand at In-situ
Moisture Content. Proc Annual Transport Convention, Pretoria.
Pederson, TA. 1978. Low cost road construction techniques in western Australia. 2nd Conf
Road Engineering Assoc of Asia and Australia, Manilla, Oct 1978, Vol 5, pp 1-13.
Pinard, MI, Obika, B and Motswagole, KJ. 1999. Developments in Innovative Low-Volume Road
Technology in Botswana. Transportation Research Record 1652, Vol 1, pp 68-75.
Presto Products Company. 1991. Sand Road Case Study: We’ve Got the Answer for Building
Sand Roads. Appleton, Wisconsin.
Sabita. 1999. ETB – The design and use of emulsion-treated bases. Cape Town: Sabita.
(Manual 21).
77
Sandman, R, Wall, R and Wilson, N. 1974. Use of natural materials for pavement construction
in South Australia. Adelaide: Highways Department, South Australia. (Report MS 26).
Schwartz, K, Yates, JRC and Tromp, BE. 1981. In situ compaction of aeolian Kalahari sands.
Proc 10th Int Conf on Soil Mech and Found Engng, Stockholm, pp 773-776.
Semmelink, CJ. 1992. The Effect of Shape and Texture of Road Building Material Particles on
Their Compactability and Bearing Capacity, Report No. PR 91/185, CSIR, Pretoria .
Smit, 1977. The geohydrology in the catchment area of the Molopo River in the northern
Kalahari (in Afrikaans). Unpublished PhD Thesis, University of Orange, Free State, Bloemfontein,
South Africa.
Strauss, PJ and Hugo, F. 1979. Innovations in design and construction of a low volume low
cost road on windblown sands. Transp Res Record, 702, pp 208-214.
Utiyama, H, Nogami, JS, Correa, FC and Vilibor, DF. 1977. Pavimentacao Economica: Solo
arenoso fino. Sao Paulo: Revista Departmento de Estradas de Rodagem. (No 124).
van der Merwe, CP. 1959. Stabilization of an aeolian sand. Proc 2nd Reg Conf Africa on Soil
Mechanics and Foundation Engineering. Lourenco Marques (Maputo), Mozambique, pp 199-204.
van Wijk, I, and Carvalho, P. 2002. Innovative Use of Sands in pavement Layers: Experience
in Mozambique. 2nd World Enginering Congress, Sarawak, malaysis, 22-25 July 2002.
Wentworth, CK. (1922). A scale of grade and class terms for clastic sediments, J. Geology V.
30, 377-392 (1922).
Weston, D. 1980. Compaction for collapsing sand roadbeds. Proc 7th Reg Conf Africa on Soil
Mech and Found Engng, Vol 1, Accra, pp 341-354
Wolmarans, CA and Clifford, JM. 1975. An evaluation of the CSIR impact roller. Proc 6th Reg
Conf Africa on Soil Mech and Found Engng, Vol 2, Durban, pp 33-39.
Wooltorton, FLD. (1954). The Scientific Basis of Road Design. Edward Arnold Ltd. London.
Wylde, LJ. 1979. Marginal quality aggregates used in Australia. Melbourne: ARRB (Report
ARR No 97).
Wylde, LJ. 1982. Personal Communication, Adelaide, Australia.
Zimbabwe Ministry of Roads and Road Traffic (1979). Manual. Part F: Construction. Ministry of
Roads and Road Traffic, Harare.

78
ANNEX A
Use of the Phi scale for analysis of sands
In many sedimentological studies of fine sandy materials the phi (Ø) scale is used to represent the sievesizes instead of the more usual logarithmic scale to base 10. The phi (Ø) scale is also a logarithmic scale butis to base 2 instead of 10 and is negative as follows.
Ø = - log 2 (particle size in mm) Equation A-1
This means that each standard phi unit represents half the size of the previous unit. The cumulativepercentage passing (or retained) each sieve can then be plotted against the phi scale as for any particle sizedistribution, making small differences in particle size distributions of fine materials more easily discernible(Figure 1).
The determination of the particle mean size and standard deviation can also be easily calculated from theparticle size distribution on a phi scale.
It should be noted that this type of analysis as applied to the Kgalagadi sands in this document uses thepercentage retained on each sieve (or remaining in suspension in the case of the hydrometer test) asopposed to the percentage passing used more commonly in civil engineering analyses. Hydrometer analysesare required when the upper percentiles (84 and 95) include material finer than 0.075 mm.
The phi scale for standard sieves is provided below and can be calculated from Equation 1 or in an Excelspreadsheet cell as “log (sieve size, 2)” (Table 1).
Table 1: Relationship between particle size and phi unitsSieve size (mm) 53 37.5 26.5 19 13.2 9.5 4.75 2 1.18Phi value -5.7 -5.2 -4.7 -4.2 -3.7 -3.2 -2.2 -1.0 -0.2Sieve size (mm) 0.425 0.25 0.15 0.075 0.048 0.029 0.012 0.006 0.002Phi value 1.2 2.0 2.7 3.7 4.4 5.1 6.4 7.4 9.0
An example of a typical plot of Kgalagadi sand data (Table 2) is given in Figure 1.
The statistical parameters of the grading analysis can be determined by reading various percentile values offthe cumulative particle size distribution, in terms of percentage retained (Figure 1).
The mean particle size (M) is determined using the following formula:
3
845016 M
where Ø16 = the 16th
percentile, Ø50 = 50th
percentile, etc.
The standard deviation (σ) is calculated from:
6.6
595
4
1684
These calculations can all be done simply using an Excel spreadsheet although it is generally simpler to readthe percentiles off the cumulative distribution curve as shown in Figure 1.
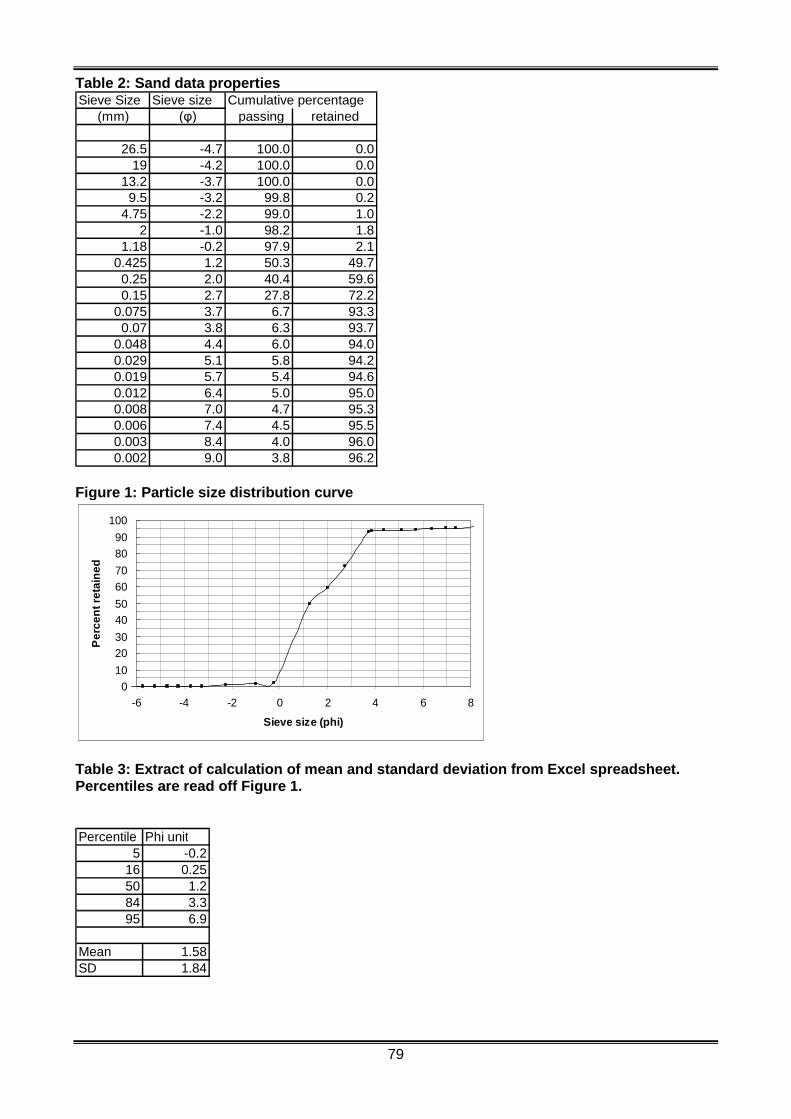
79
Table 2: Sand data propertiesSieve Size Sieve size
(mm) (φ) passing retained
26.5 -4.7 100.0 0.019 -4.2 100.0 0.0
13.2 -3.7 100.0 0.09.5 -3.2 99.8 0.2
4.75 -2.2 99.0 1.02 -1.0 98.2 1.8
1.18 -0.2 97.9 2.10.425 1.2 50.3 49.70.25 2.0 40.4 59.60.15 2.7 27.8 72.2
0.075 3.7 6.7 93.30.07 3.8 6.3 93.7
0.048 4.4 6.0 94.00.029 5.1 5.8 94.20.019 5.7 5.4 94.60.012 6.4 5.0 95.00.008 7.0 4.7 95.30.006 7.4 4.5 95.50.003 8.4 4.0 96.00.002 9.0 3.8 96.2
Cumulative percentage
Figure 1: Particle size distribution curve
0
10
20
30
40
50
60
70
80
90
100
-6 -4 -2 0 2 4 6 8
Sieve size (phi)
Pe
rce
nt
reta
ine
d
Table 3: Extract of calculation of mean and standard deviation from Excel spreadsheet.Percentiles are read off Figure 1.
Percentile Phi unit5 -0.2
16 0.2550 1.284 3.395 6.9
Mean 1.58SD 1.84

80
ANNEX BExamples of use of neat sand as base course
Hoopstad-Bultfontein Experimental Section, South Africa. Constructed in 1962.
+/- 0.5 MESA
January 2013 ADT = 667ADTT = 24 (5-7 No. 6-7 axles)Traffic carried to date >> 0.5 MESA
Note: There was no significant difference in the condition of the neat sand section and the
adjacent cement-stabilized sections of the experimental section. This suggests that it is not
necessary to go to the expense of stabilization under these conditions – a significant cost saving
in the construction of low volume sealed roads using sand of appropriate quality. This evidence
is also exemplified by a similar section of neat sand base used in the construction of an
experimental neat sand base section of road in Botswana as illustrated below.

81
Serowe-Orapa Experimental Section, Botswana. Constructed in 1989.
January 2013 AADT = ± 0.5 MESA