guidelines for air emission regulation - miljøstyrelseneng.mst.dk/media/mst/69141/guidelines for...
TRANSCRIPT
Environmental Guidelines Nr. 1 2002Vejledning fra Miljøstyrelsen
Guidelines for Air EmissionRegulation
Limitation of air pollution from installations


3
The Guidelines for Air EmissionRegulation
Limitation of air pollution from installations
- These Guidelines include:- The BAT principle- Application of BAT- Mass-flow limits- Emission limit values- Calculation of outlet height using the OML model- Drawing up terms and inspection rules- Methods of sampling and analysis- Emission limit values for energy plants- Requirements for the design of tanks and silos- Recommended emission limit values etc. for thermal and catalytic
oxidation installations for the destruction of organic solvents

4

5
Contents
FOREWORD 11
1 THE GENERAL PRINCIPLES OF THE ENVIRONMENTALPROTECTION ACT 13
1.1 INTRODUCTION TO THE BAT PRINCIPLE 131.2 WHAT ARE THE BEST AVAILABLE TECHNIQUES (BAT)? 131.3 WHERE CAN YOU FIND INFORMATION ON BAT? 141.4 HOW TO APPLY THE BAT PRINCIPLE WHEN PROCESSING A CASE 16
1.4.1 Approvals for new Listed Installations 171.4.2 Reassessment of environmental approvals for existing ListedInstallations 171.4.3 Regulation of non-Listed Installations 18
2 CONTENTS AND APPLICATION OF THE GUIDELINES 19
2.1 THE CONTENTS OF THE GUIDELINES 192.2 HOW TO APPLY THE GUIDELINES 20
2.2.1 Application for approvals for new Listed Installations 212.2.2 Application for expansion or changes to Listed Installations 212.2.3 Regulation of existing Listed Installations 23
2.2.3.1 Listed Installations without an approval 232.2.3.2 Reassessment of Listed Installations with an approval 23
2.2.3.2.1 Before expiry of the legal protection period 232.2.3.2.2 After expiry of the legal protection period 23
2.2.4 Regulation of non-Listed Installations 24
3 RECOMMENDED MASS FLOW LIMITS, EMISSION LIMITVALUES, AND C-VALUES 25
3.1 TERMS, DEFINITIONS, AND EXPLANATIONS 253.1.1 Mass flow 263.1.2 Emission and reference condition 273.1.3 Ground-level concentration 293.1.4 The C-value 293.1.5 Relationship between mass flow limits, emission limit values, and C-values 31
3.1.5.1 Mass flow limits 313.1.5.1.1 Mass flow is smaller than the mass flow limit 313.1.5.1.2 Small emissions 313.1.5.1.3 Mass flow is greater than the mass flow limit 32
3.1.6 Classification of types of substance 323.1.7 Simultaneous emission of several substances. Average value Cr 333.1.8 C-value by intermittent operation 34
3.2 MASS FLOW LIMITS AND EMISSION LIMIT VALUES 353.2.1 Introduction 353.2.2 Group 1 substances 353.2.3 Limiting emissions, Group 1 substances 36
3.2.3.1 Emissions of dust, Group 1 substances 363.2.3.2 Emissions of flammable substances, Group 1 substances 363.2.3.3 If neither absolute filtering nor combustion can be used 373.2.3.4 PCB 37
6
3.2.3.5 Dioxins 373.2.3.5.1 The CEN method 373.2.3.5.2 Incineration of non-hazardous waste 373.2.3.5.3 Incineration of dangerous waste 373.2.3.5.4 Industrial installations 37
3.2.3.6 Asbestos 383.2.3.7 Formaldehyde 383.2.3.8 Polyaromatic hydrocarbons, PAH 38
3.2.4 Examples of Group 1 substances 393.2.5 Group 2 40
3.2.5.1 Dangerous types of inorganic dust 403.2.5.2 NOx 413.2.5.3 SO2 423.2.5.4 Other vaporous or gaseous inorganic substances 433.2.5.5 Organic substances 43
3.2.5.5.1 Thinner mixes 443.2.5.6 The VOC Statutory Order 45
3.2.5.6.1 Phenol 463.2.5.7 Other dusts 46
3.2.5.7.1 Dry dusts 473.2.5.7.2 Wet dust 47
4 CALCULATION OF OUTLET HEIGHTS 49
4.1 INTRODUCTION 494.1.1 Information about the OML model 49
4.2 THE OML MODEL 504.2.1 Results from the model compared with C-values 504.2.2 Data basis for OML calculations 50
4.3 SOURCE STRENGTH AND DISPERSION COEFFICIENT 504.3.1 Source strength “G” 504.3.2 Dispersion coefficient “D” 51
4.4 CALCULATION USING OML 524.4.1 One or more outlets and one or more substances 524.4.2 Substances with identical effects 53
4.4.2.1 The Cr method 534.4.2.2 The C1 method 53
4.5 APPLICATION OF THE OML MODEL FOR ODOUR EMISSIONS 544.6 EXCEPTIONS 55
4.6.1 Heavy gases 554.6.2 Wet flue gases 55
5 TERMS AND INSPECTION RULES 57
5.1 INTRODUCTION 575.1.1 Definition of self-inspection 57
5.2 TERMS 585.2.1 General issues 585.2.2 Types of terms 585.2.3 Operating terms 585.2.4 Emission and inspection terms 59
5.2.4.1 The pollutant 605.2.4.2 The emission limit value 615.2.4.3 The inspection period 615.2.4.4 Measurement period 615.2.4.5 Number of individual measurements 625.2.4.6 Operating terms 625.2.4.7 Method of measurement 625.2.4.8 Detection limit 63
5.2.5 Terms for outlet heights 635.3 TYPE AND SCOPE OF INSPECTION 63
5.3.1 Inspections of operation 635.3.2 Inspection of emissions 63

7
5.3.3 Type and scope of inspection of emissions 645.3.3.1 Installations with less significant air pollution 645.3.3.2 Installations with significant air pollution 655.3.3.3 Installations with very significant air pollution 65
5.3.3.3.1 AMS inspection limits for gaseous substances 655.3.3.3.2 AMS inspection limits for particles, etc. 65
5.4 WHEN ARE THE TERMS COMPLIED WITH? 665.4.1 Performance inspection 665.4.2 AMS inspection 66
5.4.2.1 Inspection rules for individual measurements 665.4.3 Random testing 66
5.4.3.1 Inspection rule for random testing 665.4.3.2 The limit value rule 675.4.3.3 The random sample rule 675.4.3.4 Inspection rules for individual measurements 68
5.4.4 Inspection of outlet height 685.4.5 Inspection of absolute filters 68
5.5 EXAMPLES OF TERMS 695.5.1 Example A. Installation with less significant air pollution 695.5.2 Example B. Installation with significant air pollution 705.5.3 Example C. Installation with very significant air pollution 71
6 ENERGY PLANTS 75
6.1 INTRODUCTION 756.2 NATURAL GAS, LPG, AND BIOGAS 76
6.2.1 General information 766.2.2 Gas motors and gas turbines using natural gas 766.2.3 Combustion plants with an input effect of less than 120 kW 776.2.4 Combustion plants with a total input effect of 120 kW or more, but lessthan 5 MW 776.2.5 Combustion plants with a total input effect of 5 MW or more, but lessthan 50 MW 776.2.6 Combustion plants with an input effect of 50 MW or more 786.2.7 Inspection 78
6.3 LIGHT FUEL OIL 786.3.1 General information 786.3.2 Input effect less than 120 kW 796.3.3 Total input effect of 120 kW or more, but less than 5 MW 796.3.4 Total input effect of 5 MW or more, but less than 50 MW 806.3.5 Total input effect of 50 MW or more 806.3.6 Inspection 80
6.4 HEAVY FUEL OIL 806.4.1 General information about heavy fuel oil 806.4.2 Total input effect of 2 MW or more, but less than 50 MW 816.4.3 Total input effect of 50 MW or more 826.4.4 Inspection 82
6.5 WASTE OIL 836.5.1 Inspection 83
6.6 COAL 836.6.1 General information 836.6.2 Total input effect of 5 MW or more, but less than 50 MW 846.6.3 Input effect of 50 MW or more 856.6.4 Inspection 85
6.7 WOOD 866.7.1 General information 866.7.2 Wood-fired stoves 866.7.3 Input effect of 120 kW or more, but less than 1 MW 876.7.4 Total input effect of 1 MW or more, but less than 50 MW 87

8
6.7.5 Input effect of 50 MW or more 876.7.6 Inspection 87
6.8 STRAW 886.8.1 General information 886.8.2 Total input effect of 1 MW or more, but less than 50 MW 886.8.3 Input effect of 50 MW or more 896.8.4 Inspection 89
6.9 BIOMASS WASTE 896.9.1 General information 896.9.2 Input effect of 120 kW or more but less than 1 MW 906.9.3 Total input effect of 1 MW or more, but less than 50 MW 906.9.4 Input effect of 50 MW or more 906.9.5 Inspection 90
6.10 WASTE INCINERATION PLANTS 916.10.1 Inspection 91
6.11 CALORIFIC VALUE, CONVERSION FACTORS, NOX, METHODS OFMEASUREMENT, ETC. 91
6.11.1 Calorific value 916.11.2 Conversion from ppm to mg/normal m2 926.11.3 NOX 926.11.4 Measurements and methods of measurement 92
7 DESIGN AND OPERATION OF TANKS AND SILOS 93
7.1 INTRODUCTION 937.2 TANKS 93
7.2.1 Storage tanks for principal group 1 substances and very noxioussubstances 93
7.2.1.1 Design of tanks 937.2.1.2 Existing tanks with external floating roofs 937.2.1.3 New tanks 937.2.1.4 Existing tanks with fixed roofs 947.2.1.5 Filling tanks 94
7.2.2 Storage tanks for principal group 2 substances, including diesel oil andother substances not mentioned under 7.1.1 94
7.2.2.1 Storage 947.2.2.2 Painting tanks 947.2.2.3 Filling tanks 94
7.3 SILOS 95
8 MEASUREMENT OF EMISSIONS FROM INSTALLATIONSCAUSING AIR-POLLUTING 97
8.1 INTRODUCTION 978.2 LIST OF RECOMMENDED METHODS FROM THE DANISHENVIRONMENTAL PROTECTION AGENCY 97
8.2.1 List of recommended methods, performance monitoring, and randomtesting 978.2.2 List of recommended methods from the Danish EnvironmentalProtection Agency 97
8.2.2.1 Performance monitoring and random testing 978.2.3 List of methods, AMS 102
8.2.3.1 Measurement of installation 1028.2.3.2 Design of sampling site 1048.2.3.3 Design of sampling location 104
8.2.3.3.1 Particle measurements and volume-flow measurements 1048.2.3.4 Location of sampling location 1058.2.3.5 Number and design of sampling ports 1058.2.3.6 Number of sampling points 1068.2.3.7 Sampling gaseous air pollutants 1098.2.3.8 Ducts less than 300 mm in diameter 109

9
8.2.4 Performance monitoring and random testing 1098.2.4.1 Measurement report 109
9 CONVERSIONS REGARDING SURPLUS AIR AND MOISTURECONTENT 111
9.1 CONVERSION TO CO2% 1119.2 CONVERSION TO REFERENCE O2% 1119.3 CONVERSION BETWEEN CO2% AND O2% 1129.4 CONVERSION BETWEEN O2% AND CO2% 1129.5 CONVERSION FROM DRY TO MOIST VOLUME FLOW 1129.6 CONVERSION FROM DRY TO MOIST CONCENTRATION 1139.7 CONVERSION FROM PPM TO MG/NORMAL M
3 1139.8 UNITS OF ENERGY AND OUTPUT 1139.9 PREFIXES 113
10 RECOMMENDED LIMIT VALUES FOR EMISSIONS ANDINSPECTION RULES FOR THERMAL AND CATALYTICOXIDATION INSTALLATIONS FOR THE DESTRUCTION OFORGANIC SOLVENTS 115
10.1 INTRODUCTION 11510.2 OPERATING CONDITIONS 11510.3 LIMIT VALUES FOR EMISSIONS 115
10.3.1 Limit value for emissions of TOC (Total Organic Carbon gases) 11510.3.2 Limit value for emissions of CO 11510.3.3 Limit value for odours 11510.3.4 Limit value for emissions of NOX 115
10.4 CALCULATION OF THE HEIGHT OF OUTLETS 11610.4.1 Unburned specific organic compounds 11610.4.2 TOC (Total Organic Carbon gases) 11610.4.3 CO 11610.4.4 NOX 11610.4.5 Odours 116
10.5 MONITORING 11610.5.1 AMS 11610.5.2 Performance measurements 116
11 GLOSSARY 117

10

11
Foreword
In 1990 the Danish Environmental Protection Agency issued Guidelines No.6/1990 on the limitation of air pollution from installations (published inEnglish as Vejledning fra Miljøstyrelsen 9/1992: “Industrial Air PollutionControl Guidelines). The guidelines were based on observation of the variousharmful effects of air pollution over many years as it became apparent that itwas not sufficient simply to dilute substances harmful to the environment inthe atmosphere.
The 1990 guidelines have subsequently been applied in the administration ofthe Environmental Protection Act through environment approvals and orders.The central terms are mass flow limits, emission limit values, and contributionvalues (C-values). Mass-flow values and emission limit values form the basisfor determining whether it is necessary to clean the air emitted. Limit valuesfor emissions stipulate maximum concentrations after purification orabatement. The C-value is a limit value for how much each installation maycontribute to air pollution.
In view of the amendment to the approval scheme implementing CouncilDirective 96/61/EC on Integrated Pollution Prevention and Control (theIPPC Directive) into Danish legislation1, the Danish EPA has found itappropriate to revise and clarify these guidelines.
The most important amendments are:1. Limit values have been simplified so as to facilitate the processing of
applications etc. For example, a number of emission limit values werelisted as intervals in the previous guidelines. These intervals have nowbeen changed to single values.
2. The definition of thinner mixes in the old guidelines led to slowprocessing of applications, and therefore the definition has beenimproved.
3. The terms in Chapter 3 (on recommended limit values) have beenclarified, making the guidelines easier to use.
4. The 1990 guidelines contained an outlet-height calculation methodwhich was applied to substances having the same effect. This methodis correct when substances are emitted from the same outlet, but it isunnecessarily restrictive when emissions are from several differentoutlets varying in height, or at some distance from each other. Chapter4 therefore contains a new and improved method of calculation.
5. Chapter 5, which deals with terms in the approvals and check rules,has been made more accessible and thus easier to use. There are nowcheck rules for when and how measurements should be made.
6. Chapter 5 on terms in the approvals and check rules has beensupplemented by Chapter 8 on measuring emissions from air-polluting installations, including lists of methods describing methodsfor sampling and analysis.
1 See Act No. 369 of 2 June 1999, Amending the Environmental Protection Act and Statutory OrderNo. 646 of 29 June 2001 on approbation of Listed Activities.

12
7. In order to facilitate administration, the Danish EPA has preparedChapter 6 on energy plants, stipulating guidelines for limit values foreach type of energy plant. Today, for example, there are emissionlimit values of NOx for almost all types of energy plants.
8. A new section on emissions from tanks and silos has been included inChapter 7 and a section on thermal and catalytic oxidationinstallations has been included in Chapter 10.
9. The Danish EPA has stipulated new recommended emission limitvalues for PAH substances and lower emission values for dioxins andgeneral dust, amongst other substances.
10. Examples of terms with emission limit values, outlet heights, andinspection requirements and rules have been included in the last partof Chapter 5. The objective of including these examples is to facilitatethe processing of applications, etc.
11. Examples have been included to illustrate various problems with aview to facilitating the use of the guidelines.
Please note that these guidelines do not include many C-values, and that thoseincluded are only examples. In future, C-values will be published in a separateset of guidelines on C-values from the Danish EPA. The Danish EPA expectsto revise these guidelines every two or three years.
The guidelines are not binding but are intended to offer advice to theauthorities on how to process cases concerning the limitation of air pollution.The authorities should always base their actions on the guidelines whenplacing demands on emissions of substances from an installation.
In addition to these guidelines, the following guidelines also deal with airpollution (unfortunately they are not available in English):
• guidelines on limiting odour nuisance from installations2,• guidelines for the surface treatment of ships3 ,• guidelines for the seeds and fertilisers sector4,• guidelines for limiting pollution from combustion plants5, and• guidelines for limiting air pollution from installations emitting welding
smoke6.
All these guidelines still apply.
The odour guidelines regulate odour emissions from installations emittingmixtures of odorous substances where it is not possible to state theconcentration in weight units of each substance.
The Danish EPA hopes that these guidelines will provide a clearer and moreinformative tool for preparing terms and reassessments of environmentalapprovals and for issuing orders.
These guidelines replace guidelines No. 6/1990 on limiting air pollution frominstallations.
2 The Danish EPA Guidelines No. 4/1985. Limiting odour nuisances from installations. A revision isplanned for 2001-2002.3 The Danish EPA Guidelines No. 3/1991. Surface treatment of ships.4 The Danish EPA Guidelines No. 4/1991. Guidelines for the seeds and fertilisers sector.5 The Danish EPA Guidelines No. 2/1993. Limiting pollution from combustion plants.6 The Danish EPA Guidelines No. 13/1997. Limiting air pollution from installations that emit weldingsmoke.

13
1 The general principles of theEnvironmental Protection Act
1.1 Introduction to the BAT principle
The Environmental Protection Act7 is based on the basic principle that thetotal pollution of the environment should be prevented or limited as far aspossible. On the basis of this integrated idea, overall assessment of pollutionfrom an installation is carried out, including air, wastewater and noisepollution. In addition, assessments should take account of the waste createdby the installation, and the need to reduce consumption of natural resourcesand energy. The idea is that environmental problems should not be solved bytransferring pollution from the air to water or soil, or vice-versa.
On the basis of this principle, the Environmental Protection Act requires theindividual installation to apply the best available techniques (BAT) so that itstotal pollution becomes as little as possible.
Assessment of the best available techniques should primarily emphasisepreventing pollution through the use of cleaner technology. In addition to this,unavoidable pollution should be limited as far as possible through pollution-reducing measures, including the best possible abatement technique.
These principles appear in Part 1 of the Environmental Protection Act and theyprovide the basis for decisions by the authorities under the Act.
1.2 What are the Best Available Techniques (BAT)?
The expression ”best available techniques” means the most advancedactivities, processes, and operating methods, and the methods most effectivein preventing or limiting pollution from a given sector at the time ofassessment.
When installations and authorities decide what the best available techniquesare for a specific sector, they do not just think of “technology” in the narrowsense of the word, but also
• how the installation is constructed, maintained, operated, andeventually shut down,
• up-to-date methods of production,• possibilities for substituting dangerous substances with less dangerous
substances,• technologies that create the least possible waste,• recycling and recovery,• exploitation of raw materials, and• energy efficiency.
7 See Section 3 (1) of the Environmental Protection Act.
14
The technique should have been tested – in Denmark or abroad – at a levelappropriate for the relevant sector. Furthermore, there is a requirement thatthe technique should be technically and financially feasible for the relevantsector.
1.3 Where can you find information on BAT?
The best available techniques are under constant development. This is thewhole philosophy behind the concept. When investigating the possibilities forusing BAT, considerations should be based on material published by theDanish Environmental Protection Agency.
This may be• sector-specific statutory orders• sector guidelines• sector-specific information documents.
The Danish Environmental Protection Agency has prepared sector-information documents (in Danish) for a number of sectors8, which take astheir point of departure the pollution problems of specific sectors, as well asthe opportunities for using cleaner technology at installations and forauthorities in processing applications under Part 5 of the EnvironmentalProtection Act. The Danish EPA in association with the sector hasdetermined the form and content of the individual sector-specific informationdocuments.
A sector information document will typically contain a general description ofthe sector and its pollution situation, as well as a review of the technology andmethods available to reduce pollution. In some cases the sector informationdocument will contain actual recommendations according to agreements withthe sector.
For some sectors, final sector guidelines9 (in Danish) have been prepared.These are systematic reviews of the entire sector stating limit values, etc.which should form the basis for how the authorities process specificinstallations within the sector.
8 Orientering fra Miljøstyrelsen nr. 3/1993. Brancheorientering for varmforzinkningsindustrien (hot-galvanizing sector).Orientering fra Miljøstyrelsen nr. 5/1993. Brancheorientering for autoophugningsbranchen (carbreakers).Orientering fra Miljøstyrelsen nr. 6/1993. Brancheorientering for galvanoindustrien (galvano sector).Orientering fra Miljøstyrelsen nr. 4/1995. Brancheorientering for asfaltindustrien (asphalt sector).Orientering fra Miljøstyrelsen nr. 6/1995. Brancheorientering for jern- og metalgenvindingsvirksomheder (iron and metal recovery sector).Orientering fra Miljøstyrelsen nr. 5/1996. Brancheorientering for lak- og farve industrien (enamel andpaint sector).Orientering fra Miljøstyrelsen nr. 13/2000. Brancheorientering for autoværksteder (vehicle repairshops).9 Vejledning fra Miljøstyrelsen nr. 3/1991. Overfladebehandling af skibe (surface treatment of ships).Vejledning fra Miljøstyrelsen nr. 4/1991. Retningslinjer for grovvarebranchen (seeds and fertilserssector).Vejledning fra Miljøstyrelsen nr. 2/1993 om begrænsning af forurening fra forbrændingsanlæg(limiting pollution from incineration plants).Vejledning fra Miljøstyrelsen nr. 1/1995 om skydebaner (shooting ranges).

15
The Danish EPA has also issued a reference list10 (in Danish) which includesinformation about reports on cleaner technology that can supplement thematerial mentioned above.
The European Commission regularly issues ”BAT reference documents” forinstallations marked with an (i)11 in the list of installations requiring anapproval to operate. These documents are referred to as “BREFs” below andcontain
• general information about the sector,• general information about the industrial processes in the relevant
sector,• data and information about current emission and consumption levels
for the relevant sector, obtained from existing installations,• the most obvious measures to limit emissions, including the
consumption and emission levels which can be obtained throughapplying these measures,
• the costs of these measures,• cross-media considerations,• assessment of the applicability of the measures to new and old, as well
as large and small installations,• an assessment of the techniques and consumption and emission levels
(BAT emission levels) which can generally be considered as BAT soas to provide a reference level to help determine BAT at the individualinstallation.
It is important to emphasise that the BREFs do not contain emission limitvalues, but only emission levels. The Danish EPA will issue information on aregular basis about the application of BREFs by the approving authorities.This information should be the basis for approving and supervisoryauthorities when laying down requirements for reductions on air pollutionfrom installations marked with an (i). The sections in these Guidelines for AirEmission Regulation on outlet heights, terms for self-inspection, etc. would,however, always apply, even for this type of installation.
Full versions of the BREFs are published on the European IPPC Bureauwebsite at
http://eippcb.jrc.es/
A short extract (executive summary) is published by the EuropeanCommission on its website section regarding the IPPC Directive.
http://europa.eu.int/comm/environment/ippc/index.htm
A total of 32 BREFs are planned up to 2003. At the end of 2000, thefollowing eight BREFs were available:
- Reference Document on Best Available Techniques in the Cement andLime Manufacturing Industries,
10 Orientering fra Miljøstyrelsen nr. 8/2000. Referencer til renere teknologivurderinger vedmiljøgodkendelser (References to cleaner technology assessments for environmental approvals).11 I.e. installations covered by the IPPC Directive and therefore marked with an (i) on the list inAnnex 1 of Statutory Order No. 646/2001. In addition, items J 1, K 1d and K 2e, which are notcovered by the IPPC Directive have been marked for this procedure.

16
- Reference Document on Best Available Techniques on the Production ofIron and Steel,- Reference Document on Best Available Techniques in the Non FerrousMetals Industries,- Reference Document on Best Available Techniques in the Pulp and PaperIndustry,- Reference Document on Best Available Techniques in the GlassManufacturing Industry,- Reference Document on Best Available Techniques in the Ferrous MetalsProcessing Industry,- Reference Document on Best Available Techniques in the Chloro-AlkaliManufacturing Industries,- Reference Document on Best Available Techniques to Industrial CoolingSystems.
1.4 How to apply the BAT principle when processing a case
The BAT principle should form the basis for all cases under theEnvironmental Protection Act, i.e. both for issuing approvals and reassessingListed Installations, and for assessing non-Listed Installations.
When requirements are set for an installation, a specific assessment must be carriedout on the basis of the current information on the best available techniques for therelevant sector, taking into account the vulnerability of the surroundings.
As mentioned above, emphasis should primarily be on preventing pollution byusing cleaner technology, i.e. first assessments should be of whether:
• the opportunities for efficient use of energy and raw materials havebeen fully exploited,
• the opportunities for substituting harmful or suspect substances withless harmful or suspect substances have been fully exploited12,
• the opportunities for optimising production processes have been fullyexploited, e.g. by using closed processes or similar13,
• generation of waste can be avoided or, where this is not possible,whether opportunities for recycling or recirculation have been fullyexploited.
After this, the extent of necessary purification or abatement measures thatshould be applied may be assessed, such as
• filters,• scrubbers,• waste-water treatment,• thermic combustion,• precipitation equipment.
Finally, the extent other measures can contribute to limiting pollution may beassessed, such as
12 Examples of substitution: 1.Use of vegetable oils instead of organic solvents to clean printingrollers. 2. Use of water-based ink in mould cores instead of isopropyl-based ink. 3. Use of UVcolourings instead of organic solvent colourings at print shops has reduced consumption of organicsolvents by approx. 80%.13 Example of reorganising operationsAn enamel and paint factory reorganised production. Manufacture of paints and enamels is now in aclosed system where vapours from organic solvents are returned to the mixing vats. Emissions oforganic solvents to the outside air have thus been reduced significantly.

17
• process monitoring,• operation journals,• layout of tank sites,• requirements for collecting spillage,• dilution, e.g. stacks or other air outlets, and marine outfalls,• sound-absorbing barriers.
Requirements put on installations by the environmental authorities forpollution limits on the basis of the BAT principle should not normally be setas requirements to use a specific technology, but rather as requirementscorresponding to a pollution level which can be achieved only by applying thebest available techniques. In principle the installation can decide howrequirements are to be met. However, this does not exclude the possibility ofsetting up very specific requirements for layout and operation when the goalcannot be expressed by limit values.
1.4.1 Approvals for new Listed Installations
When the authority issues an approval to a new installation, the authorityshould ensure that the installation is laid out and operated in accordance withwhat is considered best available techniques for the relevant type ofinstallation. This means that, as a principle, new installations cannot use theexcuse that the required technology is too expensive for the individualinstallation. The issue of cost has already been taken into account by decidingwhat the best available techniques are for the entire sector.
Furthermore, an independent assessment should be carried out of whether theestablishment of an installation at a specific site is consistent with thevulnerability of the surroundings. The approving authority can thereforeimpose particularly stringent requirements when necessary to comply withany environmental quality norms14 for the area. If it is not possible to complywith these requirements, the application will not be granted.
1.4.2 Reassessment of environmental approvals for existing Listed Installations
Reassessment15 of existing Listed Installations should aim at the long-termoperation of the installation based on what is considered BAT for the relevanttype of installation. Realisable and realistic time limits should be given to theinstallation to carry out new investment and operational changes in order tobring the installation up to modern standards. It may also be relevant toimpose new requirements on the installation, if these are necessary to complywith any environmental quality norms.
If there is both a cleaner-technology solution and end-of-line purificationtechnology, both of which lead to the same environmental result, all else beingequal, the cleaner technology solution should be selected. If the time horizonsare not the same, for example in cases where end-of-line technology isimmediately accessible while cleaner technology will take time to implement,
14 Examples of environmental quality norms: Statutory Order No. 119 of 12 March 1987 on limitvalues for the atmospheric content of nitrogen and Statutory Order No. 836 of 10 December 1986 onlimit values for the atmospheric content of sulphur dioxide and suspended particulates. See alsoStatutory Order No. 921 of 8 October 1996 on quality requirements for aquatic areas andrequirements on discharges of certain substances into water courses, lakes or the sea.15 See section 2.2.3.2.
18
the type and scope of the pollution may be decisive for whether to wait for thecleaner-technology solution.
1.4.3 Regulation of non-Listed Installations
Non-Listed Installations should also be laid out and operated on the basis ofbest available techniques. When the authority is to assess pollution from anon-Listed Installation, see Section 42 of the Environmental Protection Act,the point of departure should be the same principles as mentioned above insections 1.4.1 and 1.4.2.

19
2 Contents and application of theguidelines
2.1 The contents of the guidelines
The Guidelines for Air Emission Regulation contain a complete description ofhow air pollution from installations should be regulated.
Central to these regulations is the use of mass flow limits, emission limitvalues, and contribution values (C-values). The mass flow limit determineswhether it is necessary to clean the air emitted from an outlet, and theemission limit values determine the maximum concentration allowed afterpurification or abatement. These limits are described in Chapter 3 in theseGuidelines.
The Danish EPA regularly sets up new contribution values for substances.The most recent information on C-values can be found in Sector InformationDocument (Orientering) No. 15/1996 published by the Danish EPA (inDanish). These C-values are based on the knowledge the Danish EPApossessed about the substances in question at the time of publication.
The Danish EPA will publish a new set of guidelines on C-values in August-September 2001. The Guidelines for Air Emission Regulation only includeexamples of C-values, and as these can be amended, the Danish EPA’sInformation Document and new set of guidelines on C-values should alwaysform the basis for using the values.
Chapter 4 includes calculation methods for outlet heights in order to complywith C-values. A computer-based model, the OML model, is used for thesecalculations.
When requirements for air pollution from an installation have beendetermined on the basis of Chapters 3 and 4, terms should be stipulated.Chapter 5 deals with designing terms, which type of terms can be applied andhow to check compliance with these terms.
With regard to energy plants, the Danish EPA has chosen to prepare aseparate chapter, Chapter 6, which includes a more detailed description ofrequirements for the different types of energy plant.
Furthermore, a special chapter, Chapter 7, has been prepared on requirementsfor the design and operation of tanks and silos.
Chapter 8 deals with measuring emissions from air-polluting installations. Thischapter also establishes methods for sampling and analysis.
Chapter 9 includes conversion tables for surplus air and moisture content.
20
Chapter 10 on recommended emission limit values and inspection rulesincludes emission limit values, etc., for thermal and catalytic oxidationinstallations for the destruction of gaseous organic solvents.
2.2 How to apply the guidelines
The Guidelines for Air Emission Regulation basically apply to all installationsemitting substances to the air.
However, if emission limit values for a certain type of plant, installation orsector have been determined in a Statutory Order, the limit values stipulatedin this Order should be complied with, regardless of whether the Guidelinesfor Air Emission Regulation contain stricter or more lenient emission limitvalues of the substance in question. This is because, when it was issued, theStatutory Order took into account the technical and financial possibilities oflowering emissions of the relevant substances for the sector in question.
If sector guidelines have been prepared, they must form the basis of therequirements for the installation in connection with issuing an approval for theinstallation.
With regard to installations marked with an (i) and included in a BREF16, theDanish EPA will provide information on which requirements should beimposed on the installations described in the BREF.
Please note that the sections on outlet height, self-inspection, terms, etc., inthe Guidelines for Air Emission Regulation are general and apply to all typesof installations.
The Guidelines include minimum limits for emissions that requirepurification or abatement measures in order not to spend resources onlimiting, monitoring, and controlling pollution of little significance to theenvironment.
A few small air outlets which cannot be integrated naturally into the overalldischarge from an installation may be exempt from purification or abatementrequirements, provided each outlet comprises less than 10 per cent of themass flow limit for the substance(s) in question.
Diffused emissions, for example emissions from stock kept outdoors are notregulated by the guidelines. Instead, these emissions should be regulatedthrough requirements for the operation and design of the installation.
These Guidelines do not regulate diffused pollution from installationsaffecting the indoor climate in adjacent residential housing in the samebuilding.
The method of applying these guidelines when handling specific cases inpursuance of the Environmental Protection Act is explained in the following.
16 See footnote 11 in section 1.3.

21
2.2.1 Application for approvals for new Listed Installations
As mentioned in Chapter 1, the approving authority must ensure that theestablishment and operation of the installation in question is based on theBAT principle.
This means that the approving authority must first assess the possibility oflimiting pollution by using cleaner technology.
Based on the information included in the application on the nature ofsubstances emitted and the volume of these emissions, the approvingauthority will then assess whether purification or abatement measures shouldbe implemented.
Purification or abatement measures are required if the mass flow limit isexceeded and if the current emission limit values cannot be complied with. Insuch instances the approval should contain terms including emission limitvalues and the maximum volume of air.
Mass-flow limits and emission limit values can be found in Chapter 3 of theseGuidelines.
Required outlet heights are calculated on the basis of C-values for thesubstances in question. The calculation method is described in more detail inChapter 4. C-values should always be complied with under normal operatingconditions. Moreover, the approving authority should set up instructions foroperation in extraordinary situations, including starting up, closing down, by-pass, etc.
2.2.2 Application for expansion or changes to Listed Installations
If a Listed Installation intends to expand or change its operations in a way thatentails increased pollution, the expansion or changes must be approved inadvance17. The terms of the expansion or change as regards air pollution mustbe determined in accordance with the same principles as described in theabove for approvals for new installations.
In practice, determining the terms of an expansion or change that entailsincreased air pollution often causes difficulties. In particular, there has beensome uncertainty as to whether requirements can only be made for theexpansion or changes, or whether air pollution conditions for the entireinstallation should be included, when stipulating requirements.
Requirements for purification or abatement and outlet heights in connectionwith typical extensions and changes will be explained in the following. Seealso the definitions in Chapter 3.1. It is a requirement that all possibilities forintroducing cleaner technology have been assessed prior to the extension orchange, including whether
• opportunities for efficient use of energy and raw materials have beenfully exploited,
• opportunities for substituting harmful or suspect substances with lessharmful or suspect substances have been fully exploited,
• opportunities for optimising production processes have been fullyexploited, e.g. by using closed processes or similar,
17 See Section 33 of the Environmental Protection Act.
22
• production of waste can be avoided or, where this is not possible,whether opportunities for recycling or recirculation have been fullyexploited.
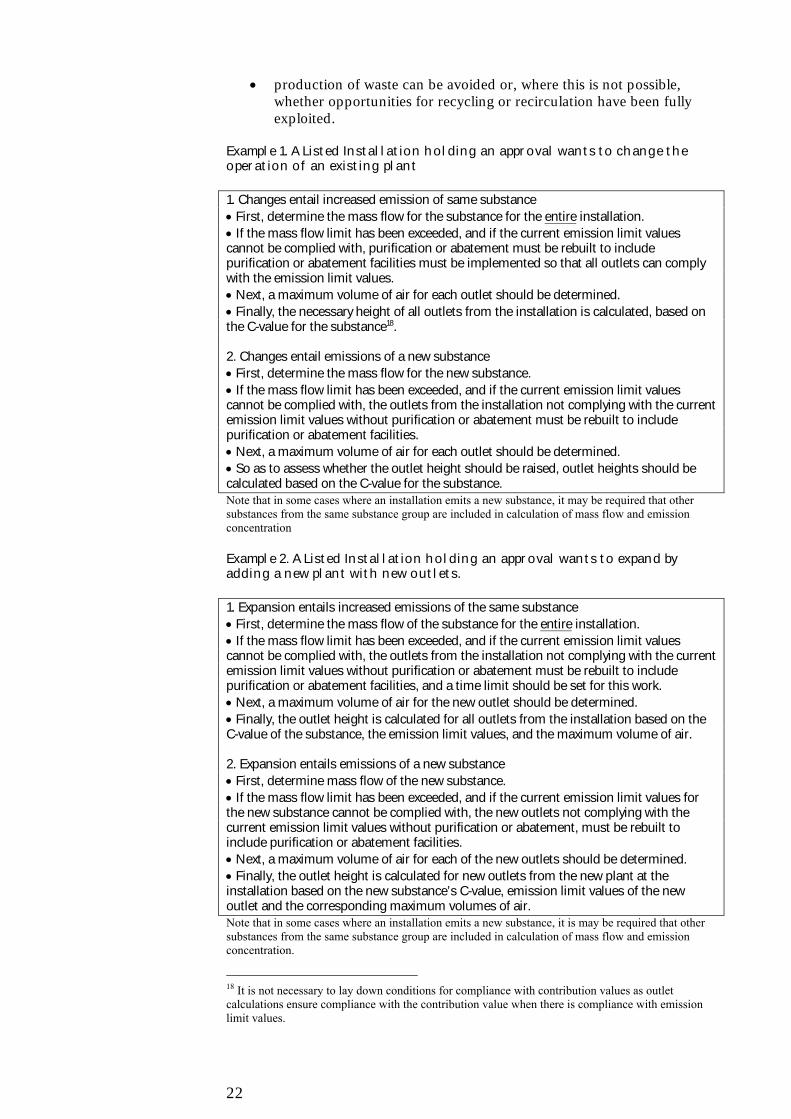
Example 1. A Listed Installation holding an approval wants to change theoperation of an existing plant
1. Changes entail increased emission of same substance• First, determine the mass flow for the substance for the entire installation.• If the mass flow limit has been exceeded, and if the current emission limit valuescannot be complied with, purification or abatement must be rebuilt to includepurification or abatement facilities must be implemented so that all outlets can complywith the emission limit values.• Next, a maximum volume of air for each outlet should be determined.• Finally, the necessary height of all outlets from the installation is calculated, based onthe C-value for the substance18.
2. Changes entail emissions of a new substance• First, determine the mass flow for the new substance.• If the mass flow limit has been exceeded, and if the current emission limit valuescannot be complied with, the outlets from the installation not complying with the currentemission limit values without purification or abatement must be rebuilt to includepurification or abatement facilities.• Next, a maximum volume of air for each outlet should be determined.• So as to assess whether the outlet height should be raised, outlet heights should becalculated based on the C-value for the substance.Note that in some cases where an installation emits a new substance, it may be required that othersubstances from the same substance group are included in calculation of mass flow and emissionconcentration
Example 2. A Listed Installation holding an approval wants to expand byadding a new plant with new outlets.
1. Expansion entails increased emissions of the same substance• First, determine the mass flow of the substance for the entire installation.• If the mass flow limit has been exceeded, and if the current emission limit valuescannot be complied with, the outlets from the installation not complying with the currentemission limit values without purification or abatement must be rebuilt to includepurification or abatement facilities, and a time limit should be set for this work.• Next, a maximum volume of air for the new outlet should be determined.• Finally, the outlet height is calculated for all outlets from the installation based on theC-value of the substance, the emission limit values, and the maximum volume of air.
2. Expansion entails emissions of a new substance• First, determine mass flow of the new substance.• If the mass flow limit has been exceeded, and if the current emission limit values forthe new substance cannot be complied with, the new outlets not complying with thecurrent emission limit values without purification or abatement, must be rebuilt toinclude purification or abatement facilities.• Next, a maximum volume of air for each of the new outlets should be determined.• Finally, the outlet height is calculated for new outlets from the new plant at theinstallation based on the new substance’s C-value, emission limit values of the newoutlet and the corresponding maximum volumes of air.Note that in some cases where an installation emits a new substance, it is may be required that othersubstances from the same substance group are included in calculation of mass flow and emissionconcentration.
18 It is not necessary to lay down conditions for compliance with contribution values as outletcalculations ensure compliance with the contribution value when there is compliance with emissionlimit values.
23
2.2.3 Regulation of existing Listed Installations
Application of the Guidelines to existing Listed Installations is explained inthe following.
2.2.3.1 Listed Installations without an approvalProcessing applications for approvals from existing Listed Installations isbased on the same principles as processing applications from newinstallations. Depending on the scope and nature of pollution, a reasonabletime limit for the implementation of any requirements for measures limitingpollution should be determined. In some cases a gradual reduction ofpollution may be appropriate.
2.2.3.2 Reassessment of Listed Installations with an approval
2.2.3.2.1 Before expiry of the legal protection periodWithin the first eight years19 of issuing an approval, new requirements mayonly be made to the installations, if20
• new information has emerged about the harmful effects of pollution,• pollution is harmful to the environment in a manner that could not be
anticipated at the time of issuing the approval,• pollution is greater than reported at the time of issuing the approval,• significant changes to BAT enable considerable reduction of emissions
without disproportionately raising costs,• operation safety in connection with the process or activity requires that
other techniques are applied, or• new information on safety at risk installations21 has emerged.
The result is that, under certain circumstances, the authorities can serveorders to installations within the first eight years following the issue of anapproval.
However, the publication of new guidelines, information on BREFs andsector-specific information documents, as well as stricter C-values do not inthemselves give authorities the right to make new requirements within thelegal protection period. This also applies to limit values, which have beentightened in these Guidelines compared to previous guidelines.
Please note also that terms for self-inspection in current guidelines can bereassessed at any time with a view to improving self-inspection at theinstallation, even though the legal protection period22 has not yet expired.
2.2.3.2.2 After expiry of the legal protection periodRegular reassessment of Listed Installations marked with an (i)The supervising authority should reassess the entire installation on a regularbasis and at least once every ten years. The terms of the approval should bechanged as necessary to ensure that the operation of the installation remainsbased on the BAT principle23. The first reassessment should take place when
19 For some types of installation, this period has been reduced to 4 years.20 See Section 41a (2) of the Environmental Protection Act.21 See Statutory Order No. 106 of 1 February, 2000 on monitoring of risks for more serious accidentswith dangerous substances.22 See Section 72 (2) of the Environmental Protection Act.23 See Section 41b of the Environmental Protection Act and Section 17 of the Statutory Order No. 807of 25 October, 1999 on approvals for listed activities and installations.

24
the legal protection period for the installation’s first approval expires. Notethat installations must continue to limit pollution on the basis of developmentsin technology.
Reassessment of all other Listed Installations that are not marked with an (i)Even though the Environmental Protection Act does not include an obligationto reassess approvals for Listed Installations not marked with an (i), there isclear authorisation to do so24 and existing approvals should be reassessed on aregular basis. These installations should also live up to the BAT principle.
2.2.4 Regulation of non-Listed Installations
If an installation not requiring an approval causes significant pollution, theauthorities can order it to implement measures to relieve the pollution25.
The supervising authority should provide evidence that an installation is thecause of such high levels of pollution that measures to relieve pollution mustbe implemented. Such pollution levels may be:
• if mass flow limits and emission limit values have been exceededsimultaneously, or
• if the C-value has been exceeded considerably, or• if limitation of emissions for Group 1 substances has not been
implemented as stated in Chapter 3.
The supervising authority should collect information from the installationitself regarding
• which substances are emitted from the installation,• the size of mass flow for each substance/substance group,• concentration of each relevant substance, and• whether the installation can comply with the current C-values.
If the mass flow limit is exceeded and if the current emission limit value is notcomplied with, there should be a requirement that emissions are reduced so asto ensure compliance with the current emission limit value.
If the C-values have been exceeded considerably, there should berequirements that they be complied with before a set date.
If limitation of emissions has not been implemented for Group 1 substancesas stated in Chapter 3, requirements should be made for this.
Reasonable and realistic time limits should be set for implementation ofpossible purification or abatement measures.
24 See Section 41b of the Environmental Protection Act.25 See Section 42 of the Environmental Protection Act.

25
3 Recommended mass flow limits,emission limit values, and C-values
3.1 Terms, definitions, and explanations
The following is a description of the various types of limit values used in theseGuidelines.
1. The mass flow limit is a limit used to determine when an emissionmust be limited. The mass flow is the measure of air pollution frominstallations prior to purification or abatement. Where the mass flow isgreater than the mass flow limit and where the emission concentrationis greater than the emission limit value, purification or abatementshould be carried out, or production adjusted to comply with theemission limit value. Note that the mass flow limit is used as acriterion for when it may be relevant to limit emissions frominstallations. It does not in itself constitute a limit value that must becomplied with.
2. The emission limit value is a limit value for the concentration of agiven substance in the air emitted by installations through an outlet.Measurement is carried out for a period of time for control purposes,and only when the installation is in operation.
3. The AMS inspection limit is a limit for when an Automatic MeasuringSystem must be installed, or when random testing must be carried out,as specified in chapter 5.
4. The C-value26 is the total maximum permissible contribution from a
single installation of one pollutant to the surrounding air, i.e. theground-level concentration. The C-value must always be compliedwith when calculating according to the rules in these Guidelines.
26 See the forthcoming guidelines on contribution values (The C-value Guidelines). In Danish, C-values are referred to as “B-værdier” (for “bidragsværdier”)

26
Detailed explanation
Where the mass flow (prior to purification or abatement) is greater than therecommended mass flow limit, but the emission concentration is smaller thanthe recommended emission limit value, emissions need not be limited underthese Guidelines.
Where the mass flow is less than the recommended mass flow limit, but theemission concentration is greater than the recommended emission limit value,emissions need not be limited under these Guidelines.
Where, for some or all outlets, the emission concentration is greater than therecommended emission limit value, and the mass flow is greater than therecommended mass flow limit, emissions must be limited for those outletswhere the emission exceeds the recommended emission limit value.
The AMS inspection limit is a limit that determines when an AutomaticMeasuring System must be installed. Where automatic monitoring is notfeasible, random testing should be carried out.
The AMS inspection limit is specified in Chapter 5.
3.1.1 Mass flow
The mass flow is the substance amount per time unit that would constitute thetotal emission of a given substance or substance class from an installation if nolimitation of emissions were carried out. This means that the mass flow mustbe determined before the actual purification or abatement plant, but after theprocessing plant. The mass flow is measured as a mean value on the basis of asingle working shift (7 hours).
If a mass flow limit is exceeded and if the emission concentration is greaterthan the emission limit value, emissions should be limited so that the specifiedemission limit value is complied with from each outlet.
No requirements regarding limitation of emissions should be made forinstallations that are only operated for relatively few hours per year, even ifsuch installations exceed the mass flow limit and emission limit value.
Mass flow
From plant
Figure 1 shows how mass flow is determined.

27
Example of calculation of mass flow
An installation is operated for seven hours per day. The installation emits acetone, whichis an organic class III substance.
The operation of the installation varies. During the first two hours, the mass flow is 4kg/hr, during the next three hours it is 10 kg/hr, and during the final two hours it is 0kg/hr.
During a period of 7 hours, the mass flow is:
2 hours at 4 kg each = 8 kg3 hours at 10 kg each = 30 kg2 hours at 0 kg each = 0 kgTotal mass flow during the 7 hours = 38 kg
This is to say that the average mass flow during a period of 7 hours is 38 kg / 7 hr = 5.4kg/hr.
3.1.2 Emission and reference condition
Emission means the emission into the atmosphere of polluting substances insolid, fluid, or gaseous form. The limit values also apply to aerosols, which areclassified as dust within this context.
Filter
From plant
This is where emissionoccurs
Figure 2 shows where emission to the atmosphere occurs from a single plantwith a single outlet. See, however, figure 3.

28
Examples of other reference conditions
1. The reference condition for brick yards should be the relevant O2 content at thereference condition (0°C, 101.3 kPa, dry flue gas), up to a maximum O2 content of 18 percent.2. The reference condition for plants incinerating gaseous, organic substances should bethe relevant O2 content at the reference condition (0°C, 101.3 kPa, dry flue gas).3. The reference condition for asphalt works should be the relevant O2 content at thereference condition (0°C, 101.3 kPa, dry flue gas), up to a maximum O2 content of 17 percent.4. The reference condition for installations manufacturing expanding clay aggregate, aswell as for moler works, should be the relevant O2 content for the installation in questionat the reference condition (0°C, 101.3 kPa, dry flue gas), up to a maximum O2 content of16 per cent.5. The Guidelines for crematoria27 do not specify whether dry or wet flue gas should beused as a reference condition. As is the case with other combustion processes, dry fluegas should be used for reference purposes.
The reference condition should always be stated in the approval in connectionwith the emission requirements.
Usually, the polluted air is led from the plant to the stack through a flue ductas shown in Figure 3. The emission limit values apply to the polluted air in theflue duct.
27 Danish EPA Guidelines No. 2/1993: Begrænsning af forurening fra forbrændingsanlæg, Part 3,Krav i forbindelse med fastsættelse af vilkår for godkendelse af krematorieanlæg eftermiljøbeskyttelsesloven [’Limitation of pollution from combustion plants, Part 3, requirementsrelating to the setting of conditions for approval of crematoria under the Environmental ProtectionAct”]

29
Figure 3 Example of an installation with emissions from different plants,showing where emission inspection is carried out.
Individual installations should not be allowed to comply with the emissionlimit values by means of ”dilution”, i.e. by using inordinately large quantitiesor air, e.g. through dilutions using indoor air or outlet air from other processeswithin the installation.
3.1.3 Ground-level concentration
This means the presence in outdoor air of solid, liquid, or gaseous pollutants –usually at a height of approximately 1.5 m above ground level. Where peoplelive or stay in taller buildings (multi-storey homes, office buildings, factorypremises, etc.), the ground-level concentration should be calculated at aheight relevant to the building in question.
3.1.4 The C-value
The total maximum approved contribution from an installation to theconcentration of a pollutant in the air at ground level is the ”C-value”. The C-value must be complied with everywhere outside the boundaries of theinstallation, regardless of the quantities emitted and the location of theinstallation.
The C-value must be compared to the results of an OML-model calculation.Such a calculation should be conducted for any outlet emitting pollutants into
Sprayzone
Flash-offzone
Dryingkiln
Intermedsander
Degre-asing
Powderpaint
Hardening
Filter Filter +cyklone
1. Here, the emission from the total wet-process paint shopis inspected.2. Here, the emission from the sanding plant is inspected.3. Here, the emission from the degreasing plant is inspected.4. Here, the emission from the powder paint plant isinspected.5. Here, the total emission from the hardening zone isinspected.
51
2 3
Wet-process paint shop Sanding Degrea-singplant
Powder paint plant
The total emission
4

30
the air. The C-value must be complied with when taking the total emissionfrom the installation into account, cf. chapter 4.
In these OML calculations, hourly average concentrations are computed.They may not exceed the C-value for more than 1 per cent of the time, ie. formore than 7 hours during a single month.
Ground-level concentration
1.5 m
Figure 4 Drawing illustrating a ground-level concentration contribution
The size of the C-value, measured as mg/m3 air for each substance isdetermined by the Danish EPA in accordance with procedures and principlesfor determining limit values for chemical substances.
The C-values apply regardless of the background concentration.
The C-value must not be confused with air quality requirements as specifiedin section 14 of the Danish Environmental Protection Act or in the method tomeasure such values. Air quality requirements are currently specified in:
• Statutory Order No. 836 of 10 December 1986 on limit values for theatmospheric content of sulphur dioxide and suspended particulates.
• Statutory Order No. 119 0f 12 March 1987 on limit values for theatmospheric content of nitrogen dioxides.
Also of note in this connection are Council Directive 1999/30/EC of 22 April1999 relating to limit values for sulphur dioxide, nitrogen dioxide and oxidesof nitrogen, particulate matter and lead in ambient air, and EuropeanParliament and Council Directive 2000/69/EC of 16 November 2000 relatingto limit values for benzene and carbon monoxide in ambient air. Thesedirectives must be implemented in Denmark no later than 19 July 2001 and13 December 2002, respectively.
The Danish EPA will assist the authorities by determining C-values forsubstances where no C-value has previously been set. For more information,please contact the Danish EPA.
The C-values stipulated are based upon the Danish EPA’s knowledge of therelevant substances at the time of publication.
31
The C-values for dust apply only to particles with a diameter of less than 10µm.For wood dust, however, the C-value applies to all particle sizes.
3.1.5 Relationship between mass flow limits, emission limit values, and C-values
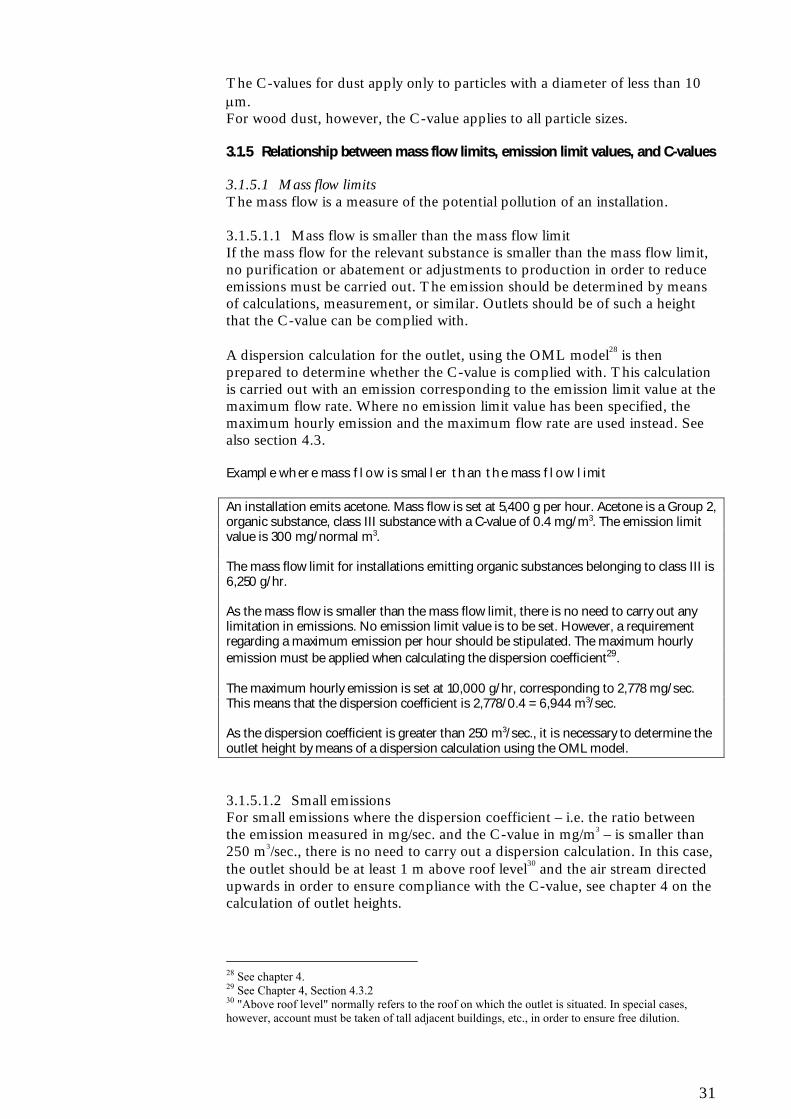
3.1.5.1 Mass flow limitsThe mass flow is a measure of the potential pollution of an installation.
3.1.5.1.1 Mass flow is smaller than the mass flow limitIf the mass flow for the relevant substance is smaller than the mass flow limit,no purification or abatement or adjustments to production in order to reduceemissions must be carried out. The emission should be determined by meansof calculations, measurement, or similar. Outlets should be of such a heightthat the C-value can be complied with.
A dispersion calculation for the outlet, using the OML model28 is thenprepared to determine whether the C-value is complied with. This calculationis carried out with an emission corresponding to the emission limit value at themaximum flow rate. Where no emission limit value has been specified, themaximum hourly emission and the maximum flow rate are used instead. Seealso section 4.3.
Example where mass flow is smaller than the mass flow limit
An installation emits acetone. Mass flow is set at 5,400 g per hour. Acetone is a Group 2,organic substance, class III substance with a C-value of 0.4 mg/m3. The emission limitvalue is 300 mg/normal m3.
The mass flow limit for installations emitting organic substances belonging to class III is6,250 g/hr.
As the mass flow is smaller than the mass flow limit, there is no need to carry out anylimitation in emissions. No emission limit value is to be set. However, a requirementregarding a maximum emission per hour should be stipulated. The maximum hourlyemission must be applied when calculating the dispersion coefficient29.
The maximum hourly emission is set at 10,000 g/hr, corresponding to 2,778 mg/sec.This means that the dispersion coefficient is 2,778/0.4 = 6,944 m3/sec.
As the dispersion coefficient is greater than 250 m3/sec., it is necessary to determine theoutlet height by means of a dispersion calculation using the OML model.
3.1.5.1.2 Small emissionsFor small emissions where the dispersion coefficient – i.e. the ratio betweenthe emission measured in mg/sec. and the C-value in mg/m3 – is smaller than250 m3/sec., there is no need to carry out a dispersion calculation. In this case,the outlet should be at least 1 m above roof level30 and the air stream directedupwards in order to ensure compliance with the C-value, see chapter 4 on thecalculation of outlet heights.
28 See chapter 4.29 See Chapter 4, Section 4.3.230 "Above roof level" normally refers to the roof on which the outlet is situated. In special cases,however, account must be taken of tall adjacent buildings, etc., in order to ensure free dilution.

32
3.1.5.1.3 Mass flow is greater than the mass flow limitIf the mass flow is greater than the mass flow limit for a given substance, theemission limit value must be complied with. This means that where theemission concentration is greater than the emission limit value, purification orabatement should be carried out, or production at the installation should beadjusted to achieve compliance with the emission limit value. The outlet mustbe established in such a manner and with sufficient height to ensure that theC-value is complied with.
In order to determine whether the C-value is complied with, a dispersioncalculation using the OML model must be carried out for the outlet. Theemission limit value and maximum flow rate must be used in this calculation.
Example where the mass flow is greater than the mass flow limit
An installation emits acetone. The mass flow is set at 8,200 g/hr. Acetone is a Group 2,organic substance, class III substance with a C-value of 0.4 mg/m3. The emission limitvalue is 300 mg/normal m3, see table 7.
The mass flow limit for installations emitting organic substances belonging to class III is6,250 g/hr. This means that the mass flow is greater than the mass flow limit.Consequently, steps should be taken to ensure that the 300 mg/normal m3 emissionlimit value is complied with.
The maximum emission of acetone measured over an hour is set at 9.0 kg/hr withoutany emission reduction. The air quantity from the outlet is 9,000 normal m3/hr. Thiscorresponds to a maximum hourly emission of 9,000,000/9,000 = 1,000 mg/normalm3. This means that the emission of acetone must be reduced to 300 mg/normal m3 orless.
The installation chooses to install a condensing plant, where a large proportion of theacetone condenses upon cooling, thus facilitating reuse. The condensing plant isequipped with an active carbon filter, which makes it possible to keep emissions below300 mg/normal m3.
On the basis of this information, the environmental authorities set an emission limitvalue of 300 mg acetone/normal m3. As the dispersion coefficient, calculated in thesame manner as in the previous example, is greater than 250 m3/sec., the outlet heightmust be determined on the basis of this emission limit value by means of a dispersioncalculation using the OML model. The emission value of 300 mg acetone/normal m3
forms the basis for these calculations.An example where mass flow is greater than the AMS limit can be found in chapter 5.
3.1.6 Classification of types of substance
For the purpose of these Guidelines, the pollutants are divided into twogroups. These groups are in turn divided into substance groups and classes.
For more detailed information on groups, substance groups, and classes,please see the C-value Guidelines.
33
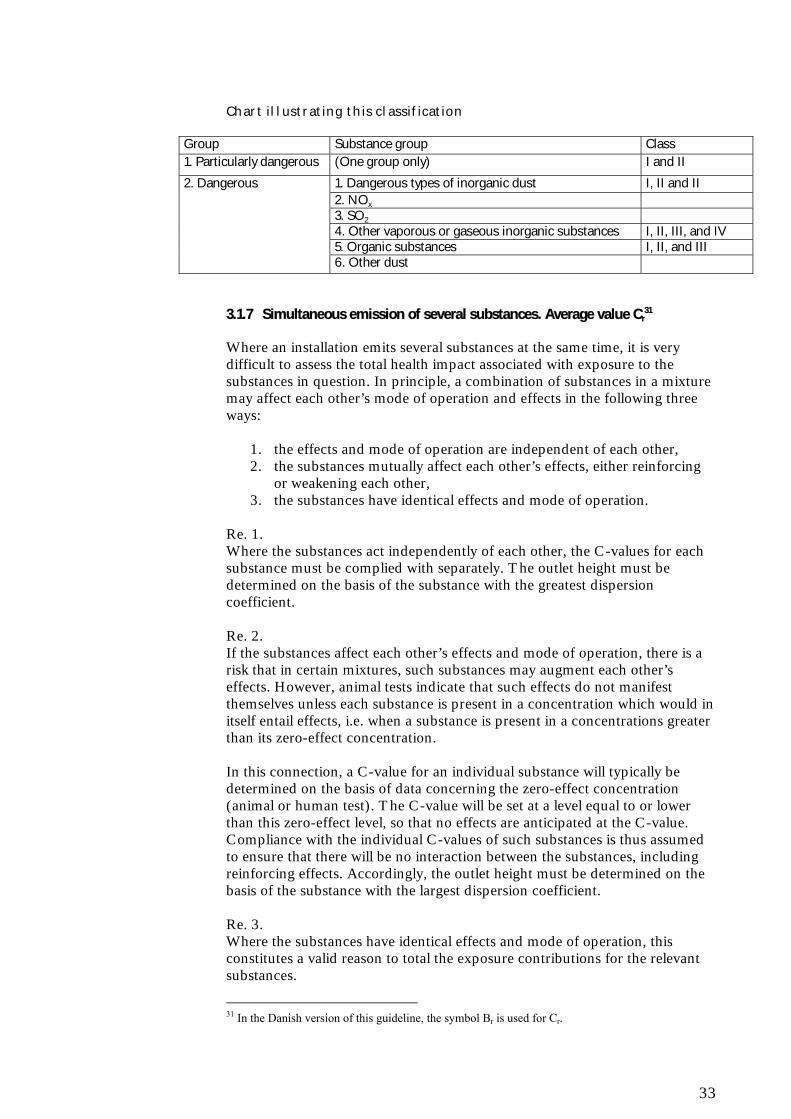
Chart illustrating this classification
Group Substance group Class1. Particularly dangerous (One group only) I and II
1. Dangerous types of inorganic dust I, II and II2. NOx
3. SO2
4. Other vaporous or gaseous inorganic substances I, II, III, and IV5. Organic substances I, II, and III
2. Dangerous
6. Other dust
3.1.7 Simultaneous emission of several substances. Average value Cr31
Where an installation emits several substances at the same time, it is verydifficult to assess the total health impact associated with exposure to thesubstances in question. In principle, a combination of substances in a mixturemay affect each other’s mode of operation and effects in the following threeways:
1. the effects and mode of operation are independent of each other,2. the substances mutually affect each other’s effects, either reinforcing
or weakening each other,3. the substances have identical effects and mode of operation.
Re. 1.Where the substances act independently of each other, the C-values for eachsubstance must be complied with separately. The outlet height must bedetermined on the basis of the substance with the greatest dispersioncoefficient.
Re. 2.If the substances affect each other’s effects and mode of operation, there is arisk that in certain mixtures, such substances may augment each other’seffects. However, animal tests indicate that such effects do not manifestthemselves unless each substance is present in a concentration which would initself entail effects, i.e. when a substance is present in a concentrations greaterthan its zero-effect concentration.
In this connection, a C-value for an individual substance will typically bedetermined on the basis of data concerning the zero-effect concentration(animal or human test). The C-value will be set at a level equal to or lowerthan this zero-effect level, so that no effects are anticipated at the C-value.Compliance with the individual C-values of such substances is thus assumedto ensure that there will be no interaction between the substances, includingreinforcing effects. Accordingly, the outlet height must be determined on thebasis of the substance with the largest dispersion coefficient.
Re. 3.Where the substances have identical effects and mode of operation, thisconstitutes a valid reason to total the exposure contributions for the relevantsubstances.
31 In the Danish version of this guideline, the symbol Br is used for Cr.

34
In practice, C-values for substances with identical effects should be added upwhen:
• such substances are homologous (i.e. substances from the samechemical substance group, e.g. alcohols, ketones, ethers, etc.), and
• such substances belong to the same substance group within theseGuidelines (Section 3.1.6), and
• such substances have health-related C-values (i.e. they are not markedL).
If all three of the above points are complied with, the outlet calculation shouldbe made on the basis of the total substance emission. This may be done bydetermining the resulting Cr value (Equation 1). This Cr value represents atotal C-value for the mixture, calculated on the basis of the source strengthand C-values of the individual substances.
The procedure involving the use of a Cr value is correct when the substancesare emitted from the same outlet, but it is excessively conservative if emissionscome from several different outlets placed at some distance from each other,or of different heights. In such cases, an alternative method may be applied, asdescribed in Section 4.4.2.2.
Cr is determined by means of Equation 1:
Equation 1
GBr = ————————————
G1 + G2 + --- + GnC1 C2 Cn
whereCr is the resulting C-value in mg/m3 ,G is the sum of G1, G2...Gn,G1 is the source strength for substance 1 in mg/sec.,C1 is the C-value set for substance 1.
Please note that a C-value related to noxiousness, and therefore bearing an Llabel, cannot be converted into a health-related C-value.
3.1.8 C-value by intermittent32 operation
The C-value may be made less rigid for installations emitting Group 1substances and sawdust or α quartz from Group 2 if the emissions from suchinstallations are intermittent. If the intermittent operation is spread evenlythroughout day and night and the annual cycle, a C-value for the intermittentoperation, designated as Ci, may be used. This value is determined by meansof Equation 2:
32 Periodic operation, i.e. an installation that is operated on/off within reasonable periods of time –e.g. a degreasing plant.

35
Equation 2
C x 8760Ci = ————— Tiwhere C is the C-value, and Ti is the total time of intermittent operationper year, measured in hours.
If the operation is not evenly distributed, Equation 3 is used instead:
Equation 3
C x 8760Cic = ———— Ti x 2
where Cic is the intermittent corrected value, adjusted by dividing by 2.
If the C-value is relaxed in accordance with these regulations, the installation’sapproved operation time must be specified in the requirements applying tothe installation.
3.2 Mass flow limits and emission limit values
3.2.1 Introduction
Pollutants are divided into two groups (see section 3.1.6 on classification ofsubstances).
Examples of Group 1 substances are listed in table 2 and table 2a.
Group 2 is divided into several substance groups. Some substance groups aredivided into classes.
A recommended mass flow limit and a recommended emission limit value areindicated for each substance or substance class.
3.2.2 Group 1 substances
Group 1 includes chemical substances currently known to be especiallyharmful to health or the environment.
Various dangerous chemical substances are assigned to Group 1 on the basisof one of the following: their toxicity, their long-term impact on humanhealth, and/or their unacceptable impact on nature.
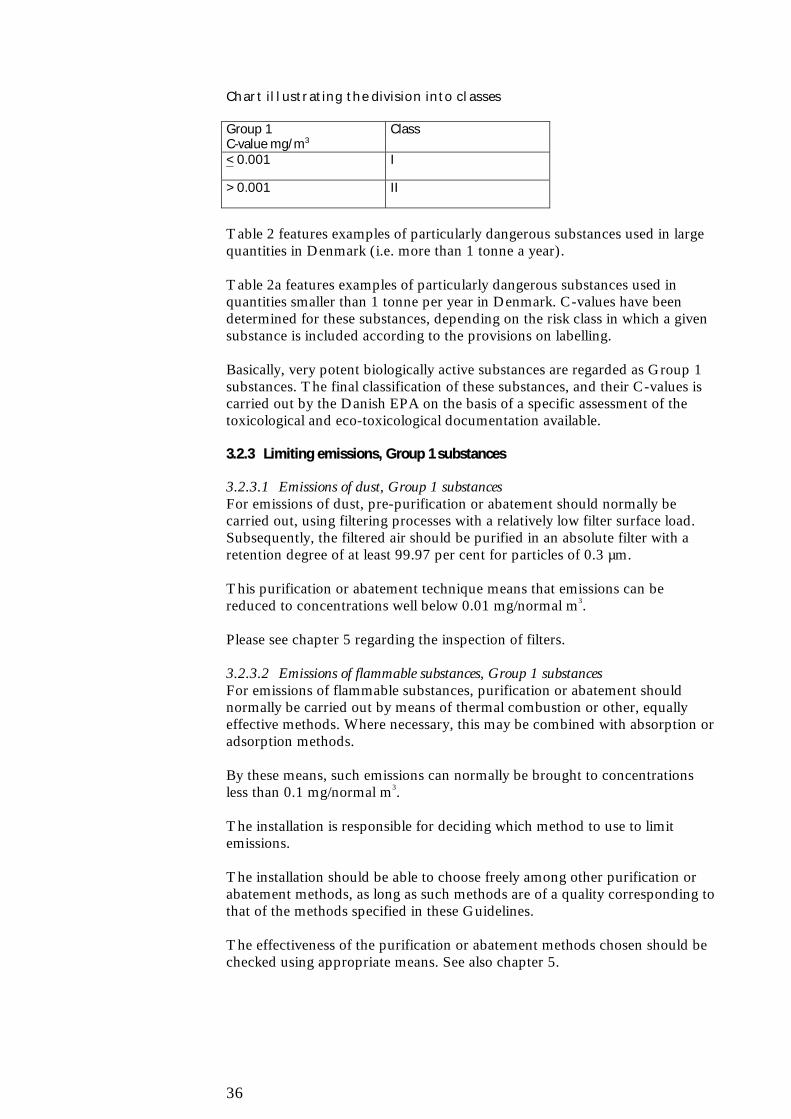
The substances within Group 1 are divided into 2 classes (I and II) on thebasis of the C-value.
36
Chart illustrating the division into classes
Group 1C-value mg/m3
Class
< 0.001 I
> 0.001 II
Table 2 features examples of particularly dangerous substances used in largequantities in Denmark (i.e. more than 1 tonne a year).
Table 2a features examples of particularly dangerous substances used inquantities smaller than 1 tonne per year in Denmark. C-values have beendetermined for these substances, depending on the risk class in which a givensubstance is included according to the provisions on labelling.
Basically, very potent biologically active substances are regarded as Group 1substances. The final classification of these substances, and their C-values iscarried out by the Danish EPA on the basis of a specific assessment of thetoxicological and eco-toxicological documentation available.
3.2.3 Limiting emissions, Group 1 substances
3.2.3.1 Emissions of dust, Group 1 substancesFor emissions of dust, pre-purification or abatement should normally becarried out, using filtering processes with a relatively low filter surface load.Subsequently, the filtered air should be purified in an absolute filter with aretention degree of at least 99.97 per cent for particles of 0.3 µm.
This purification or abatement technique means that emissions can bereduced to concentrations well below 0.01 mg/normal m3.
Please see chapter 5 regarding the inspection of filters.
3.2.3.2 Emissions of flammable substances, Group 1 substancesFor emissions of flammable substances, purification or abatement shouldnormally be carried out by means of thermal combustion or other, equallyeffective methods. Where necessary, this may be combined with absorption oradsorption methods.
By these means, such emissions can normally be brought to concentrationsless than 0.1 mg/normal m3.
The installation is responsible for deciding which method to use to limitemissions.
The installation should be able to choose freely among other purification orabatement methods, as long as such methods are of a quality corresponding tothat of the methods specified in these Guidelines.
The effectiveness of the purification or abatement methods chosen should bechecked using appropriate means. See also chapter 5.

37
3.2.3.3 If neither absolute filtering nor combustion can be usedIf neither absolute filtering nor combustion can be used, the mass flow limitsand emission limit values specified in table 1 should be used instead.
Table 1Mass flow limits and emission limit values for Group 1 substances whenemission limitation by means of absolute filtering or combustion isimpossible.
Group 1 C-valuemg/m3
Class Mass-flow limit g/hr.
Emission limit valuemg/normal m3
< 0.001 I 0.5 0.25> 0.001 II 25 2.5
Some substances are, however, so unsafe that particularly low emission limitvalues should be used.These substances are specified in sections 3.2.3.4 – 3.2.3.8 below.
3.2.3.4 PCBPCB is subject to an emission limit value33 of 0.0001 mg/normal m3.
3.2.3.5 DioxinsEmissions of dioxins (polychlorinated dibenzodioxins and polychlorinateddibenzofuranes) should be limited as much as possible.
3.2.3.5.1 The CEN methodEmission limit values of dioxins should apply to measurements carried outusing the CEN measurement method and the international toxicity factorsthat have now been implemented in Denmark. The CEN method is themeasurement method given in the EU Waste Incineration Directive. Pleaserefer to CEN standards EN 1948-1, EN 1948-2, and EN 1948-3.
3.2.3.5.2 Incineration of non-hazardous wasteExperience from waste-incineration plants shows that it is technically andfinancially feasible to limit emissions of dioxins to less than 0.1 ng I-TEQ/normal m3 air (11 per cent O2)
34. This limit value is included in theprotocol on limitation of persistent, organic compounds under the UNconvention on Long-Range Transboundary Air Pollution, as well as in thenew EU directive relating to waste incineration.
3.2.3.5.3 Incineration of dangerous wasteThe Statutory Order on incineration of hazardous waste35 sets an emissionlimit value for dioxins of 0.1 ng I-TEQ/normal m3(11% O2). The new EUdirective on waste incineration also extends in scope to incineration ofdangerous waste.
3.2.3.5.4 Industrial installationsSteps should be taken to limit dioxin emissions from industrial installations ifthe annual mass flow of dioxins is greater than 0.01 g I-TEQ.
The emission limit value should be set at 0.1 ng I-TEQ/normal m3. In somecases, technical and financial considerations may render it necessary to accept
33Methods of analysis and sampling for PCB will be published later.34 I-TEQ as defined in the Danish EPA Statutory Order No. 660 of 11 August 1997 on authorisationof plants incinerating hazardous waste. Appendix, item 9.35 Statutory Order No. 660 of 11 August 1997 (under revision).
38
an emission limit value of 0.2 ng I-TEQ/normal m3 for certain installationtypes.
3.2.3.6 AsbestosStatutory Order No. 792 of 15 December 1988 on limitations of emissions ofasbestos to air from industrial plants applies to emissions of asbestos36.
3.2.3.7 FormaldehydeAn emission limit value of 5 mg/normal m3 at a mass flow greater than 25 g/hrapplies to emissions of formaldehyde.
An emission limit value of 20 mg/normal m3 at a mass flow greater than 100g/hr applies to rockwool and glasswool factories, and wood/furniture factories.
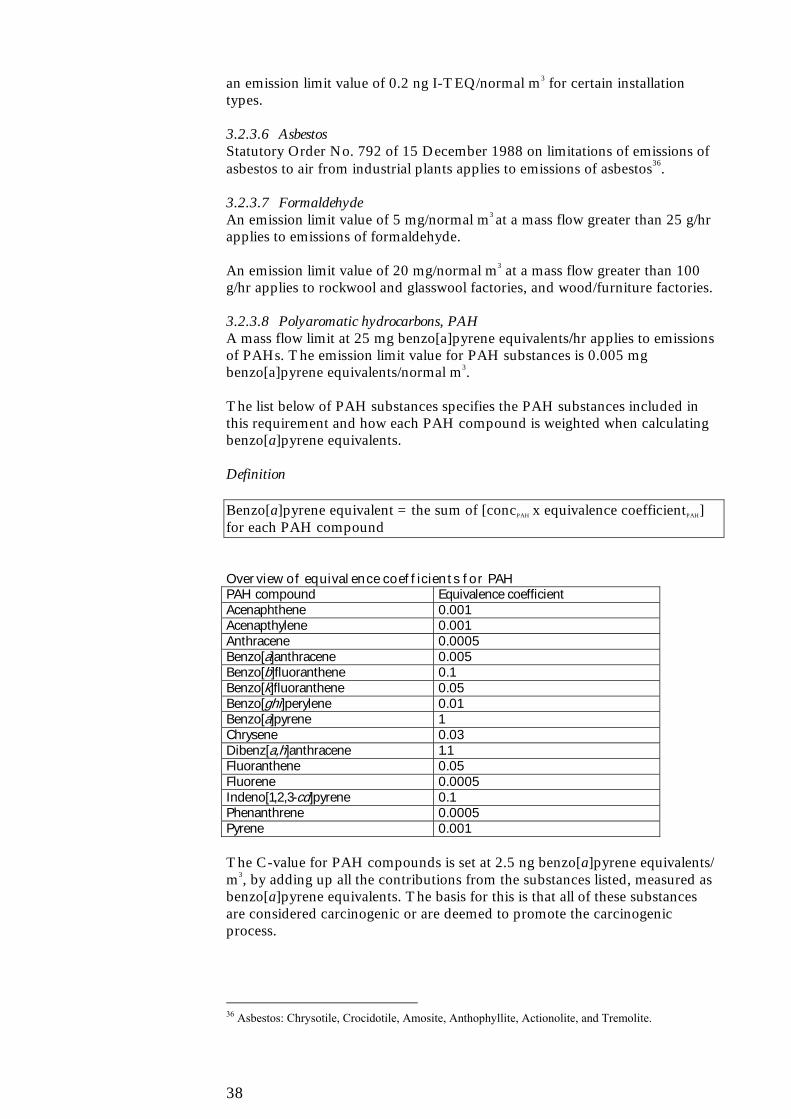
3.2.3.8 Polyaromatic hydrocarbons, PAHA mass flow limit at 25 mg benzo[a]pyrene equivalents/hr applies to emissionsof PAHs. The emission limit value for PAH substances is 0.005 mgbenzo[a]pyrene equivalents/normal m3.
The list below of PAH substances specifies the PAH substances included inthis requirement and how each PAH compound is weighted when calculatingbenzo[a]pyrene equivalents.
Definition
Benzo[a]pyrene equivalent = the sum of [concPAH x equivalence coefficientPAH]for each PAH compound
Overview of equivalence coefficients for PAHPAH compound Equivalence coefficientAcenaphthene 0.001Acenapthylene 0.001Anthracene 0.0005Benzo[a]anthracene 0.005Benzo[b]fluoranthene 0.1Benzo[k]fluoranthene 0.05Benzo[ghi]perylene 0.01Benzo[a]pyrene 1Chrysene 0.03Dibenz[a,h]anthracene 1.1Fluoranthene 0.05Fluorene 0.0005Indeno[1,2,3-cd]pyrene 0.1Phenanthrene 0.0005Pyrene 0.001
The C-value for PAH compounds is set at 2.5 ng benzo[a]pyrene equivalents/m3, by adding up all the contributions from the substances listed, measured asbenzo[a]pyrene equivalents. The basis for this is that all of these substancesare considered carcinogenic or are deemed to promote the carcinogenicprocess.
36 Asbestos: Chrysotile, Crocidotile, Amosite, Anthophyllite, Actionolite, and Tremolite.
39
The PAH substances listed here were originally selected by the US EPA andare now widely used internationally in connection with characterisation andassessment of PAH mixtures.
The Danish Veterinary and Food Administration, Institute for Food Safetyand Toxicology has prepared the equivalence coefficients in connection withefforts to update the existing equivalence systems developed for PAHsubstances.
For further information on the setting of emission limit values of PAH to air,please see the background document (June 2000) at the homepage of theDanish EPA reference laboratory.
http://www.dk-teknik.dk/ref-lab/Rapporter/tekniske-undersogelser.asp.
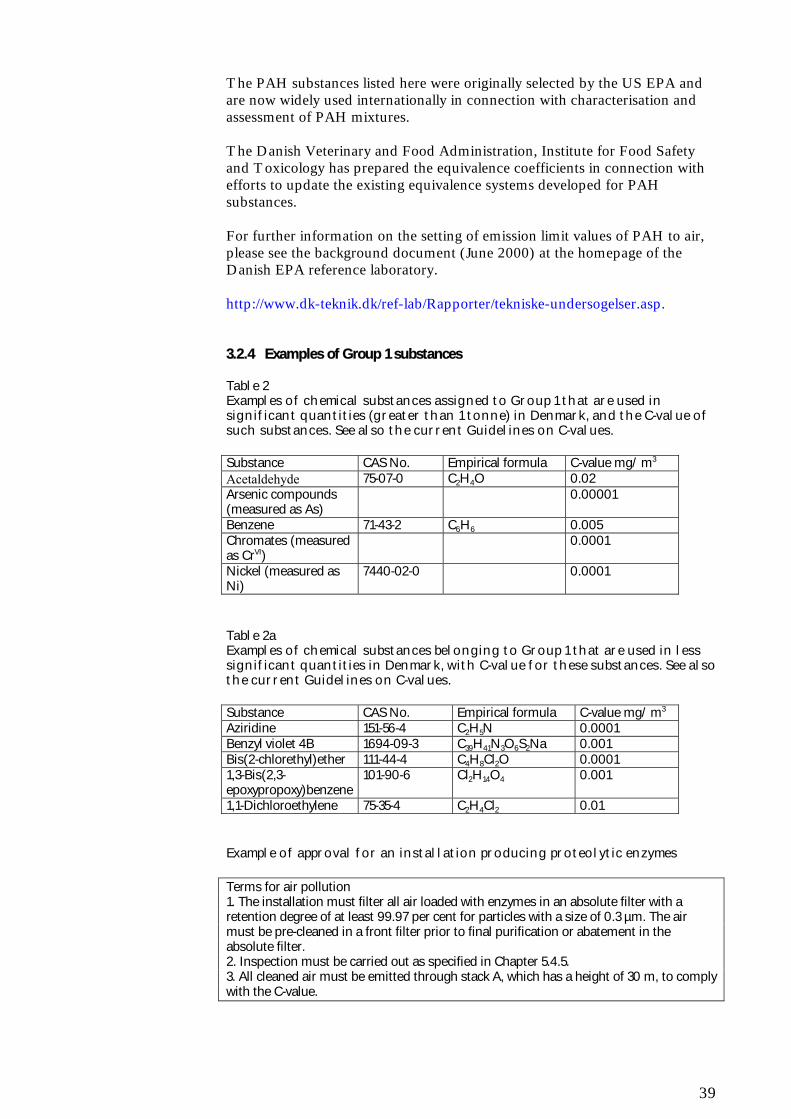
3.2.4 Examples of Group 1 substances
Table 2Examples of chemical substances assigned to Group 1 that are used insignificant quantities (greater than 1 tonne) in Denmark, and the C-value ofsuch substances. See also the current Guidelines on C-values.
Substance CAS No. Empirical formula C-value mg/ m3
Acetaldehyde 75-07-0 C2H4O 0.02Arsenic compounds(measured as As)
0.00001
Benzene 71-43-2 C6H6 0.005Chromates (measuredas CrVI)
0.0001
Nickel (measured asNi)
7440-02-0 0.0001
Table 2aExamples of chemical substances belonging to Group 1 that are used in lesssignificant quantities in Denmark, with C-value for these substances. See alsothe current Guidelines on C-values.
Substance CAS No. Empirical formula C-value mg/ m3
Aziridine 151-56-4 C2H5N 0.0001Benzyl violet 4B 1694-09-3 C39H41N3O6S2Na 0.001Bis(2-chlorethyl)ether 111-44-4 C4H8Cl2O 0.00011,3-Bis(2,3-epoxypropoxy)benzene
101-90-6 Cl2H14O4 0.001
1,1-Dichloroethylene 75-35-4 C2H4Cl2 0.01
Example of approval for an installation producing proteolytic enzymes
Terms for air pollution1. The installation must filter all air loaded with enzymes in an absolute filter with aretention degree of at least 99.97 per cent for particles with a size of 0.3 µm. The airmust be pre-cleaned in a front filter prior to final purification or abatement in theabsolute filter.2. Inspection must be carried out as specified in Chapter 5.4.5.3. All cleaned air must be emitted through stack A, which has a height of 30 m, to complywith the C-value.

40
3.2.5 Group 2
Group 2 encompasses substances that are harmful to human health or theenvironment other than those included in Group 1. Group 2 substances aredivided into 6 substance groups, and some substance groups are sub-dividedinto classes.
1. Dangerous types of inorganic dust (Classes I, II, and III)2. NOX
3. SO2
4. Vaporous or gaseous inorganic substances (Classes I, II, III, and IV)(except NOx and SO2)
5. Organic substances (Classes I, II, and III)6. Other dust
The division into classes is based partly on knowledge of the healthrisk/harmful impact on the environment associated with a given substance,and partly on the technical and financial feasibility of emission limitation.
The following tables specify examples of mass flow limits, emission limitvalues, and C-values.
3.2.5.1 Dangerous types of inorganic dustTable 3 includes examples of emission limit values, mass flow limits, and C-values for dangerous types of inorganic dust.
If a given outlet emits several substances within this substance group, andthese substances belong to the same class, the emission limit value of this classapplies to the sum of the concentrations of the substances emitted.
If a given outlet emits several substances that belong to several differentclasses, the emission limit value for each individual class should be compliedwith, and the total emission concentrations should not exceed 5 mg/normalm3.

41
Table 3Examples of mass flow limits, emission limit values, and C-values fordangerous types of inorganic dust. The C-values apply to dust with a diameterof less than 10 µm. See also the current Guidelines on C-values.
Substance Class Mass-flow limitg/hr
Emission limitmg/normal m3
C-valuemg/m3
Beryllium compoundsmeasured as Be
Mercury compoundsmeasured as Hg*)
I
I
1
1
0.1
0.1
0.00001
0.0001
Lead compoundsmeasured as Pb*)
Cobalt compoundsmeasured as Co
II 5
5
1
1
0.0004
0.0005
Antimony compoundsmeasured as Sb
Chromium compoundsother than CrVI measuredas Cr
α quartz, respirable
Cyanides measured as CN
Copper compoundsmeasured as Cu
Sodium hydroxide
III 25
25
25
25
25
25
5
5
5
5
5
5
0.001
0.001
0.005
0.06
0.01
0.005*) Small amounts of the emission of Hg, Pb, etc., may occur in gas phase, but are included as dust.
3.2.5.2 NOx
NOx is a designation for the total sum of the following nitrogen oxides:nitrogen oxide, NO, and nitrogen dioxide, NO2.
Table 4Mass-flow limit, limit value for emission, and C-value for installationsemitting NOX
37
Mass-flow limitg/hrcalculated as NO2
Emission limit valuemg/normal m3
calculated as NO2
C-valuemg/m3 for the proportionoccurring as NO2
5,000 400 0.125
The mass flow limit and the emission limit value apply to the emittedquantities of NOX, calculated as NO2.
The C-value applies to the part of the amount of NOX that is emitted as NO2.
The outlet height is calculated by counting all NOX as NO2 if no informationon the distribution of the NOx contents is available.
37 The mass flow limit and the emission limit value do not apply to energy plants. See Chapter 6.

42
If less than half of a given amount of NOX is NO2, calculations should alwaysbe made on the assumption that at least half of the NOX emitted is NO2.
Example of conversion of NOX to NO2
A chemical installation emits NOX, consisting of 20 per cent by weight NO and 80 percent by weight NO2. The installation emits 1,000 g NOX/hr.
The conversion to NO2 is carried out as follows:20 per cent by weight of the quantity emitted consists of NO, i.e. 20 per cent of 1,000 gNOX/hr = 200 g/hr.
NO is converted into NO2 for calculation purposes by multiplying the relevant figure by1.53 (1.53 is the relationship between the molecular weights of NO2 and NO).When converted to NO2, the emitted quantity of NO corresponds to 200g/hr x 1.53..………..306 g/hr80 per cent by weight of the quantity emitted is NO2, corresponding to.……………………...800 g/hrThe total emission of NOX converted into NO2 is…………..………………………… 1,106 g/hr
The emission limit value for NOX does not apply to cement kilns, rockwooland glasswool factories, moler works, leca works, tile works, or lime works.Emission limit values forNOX for such installations are set on the basis of BAT notes. Generallyspeaking, however, an emission limit value of 500 mg/normal m3 measuredas NO2 should be aimed for.
3.2.5.3 SO2
Table 5Mass-flow limit, emission limit value and C-value for installations emittingSO2 38
Mass-flow limit g/hr Emission limit value mg/normal m3
C-value mg/m3
5,000 400 0.25
The emission limit value for SO2 must not, however, be used for installationswith process plants using fuels and where there is direct contact between theflue gas and the product being manufactured if the relevant emission of SO2
does not exceed the emission from any fuel used legally, irrespective ofwhether this leads to emission concentrations greater than what correspondsto 400 mg/normal m3 at 10 per cent O2.
See also Statutory Order No. 901 of 31 October 1994 on the limitation ofsulphur content in fuels for heating and transport, and Statutory Order No.532 of 25 May 2001 on the limitation of sulphur content in certain liquid andsolid fuels.
Special conditions apply to lime works, moler works, leca works, rockwoolplants, and tile works, as the SO2 emitted comes largely from the raw materialsused. In these cases, a specific assessment must be carried out to determinethe emission limit.
38 The mass flow limit and the emission limit value do not apply to energy plants. See Chapter 6.

43
3.2.5.4 Other vaporous or gaseous inorganic substancesTable 6 presents examples of emission limit values, mass flow limits, and C-values for installations that emit vaporous or gaseous inorganic substancesother than NOX and SO2.
Table 6Examples of mass flow limits, emission limit values, and C-values forinstallations that emit vaporous or gaseous inorganic substances, except forNOX and SO2. See also the current guidelines on C-values for othersubstances.
Substance Class Mass-flow limitg/hr
Emission limit valuemg/normal m3
C-valuemg/m3
Phosgene I 10 1.0 0.001Chlorine
Hydrogencyanide
Hydrogenfluoride
Hydrogensulphide
II
II
II
II
50
50
50
50
5
5
5
5
0.01
0.06
0.002
0.001
Hydrogenchloride
Sulphurtrioxide
III
III
500
500
100
100
0.05
0.01
Ammonia IV 5,000 500 0.3
3.2.5.5 Organic substancesOrganic substances are divided into three classes, usually in accordance withthe criteria outlined below:
Outline of the classification of organic substances
Class C-valuemg/m3
I < 0.01II > 0.01 < 0.2III > 0.2
Mass-flow limits and emission limit values for organic substances can befound in table 7.
Table 8 features examples of C-values and classifications for organicsubstances.
If an installation emits substances that belong to several classes, and if themass flow for all substances is > 6,250 g/hr, the emission limit value for eachclass should be complied with, and the sum of the emission concentrationsshould not exceed 300 mg/normal m3.

44
Table 7Mass-flow limits and emission limit values for installations that emitorganic substances
Class Mass-flow limit g/hr Emission limit valuemg/normal m3
I 100 5II 2,000 100III 6,250 300
3.2.5.5.1 Thinner mixesThe definition of thinner mixes has been changed as a consequence of areview of the use and composition of thinner mixes.
A new C-value of 0.15 mg/m3 has been set for thinner mixes. Thinner mixesare still classified as belonging to Group 2, organic substances, class III.
Hereafter, “thinner mixes” include organic solvents in paint products used inpaint shops (iron, metal, plastic), at car paint shops, in furniture manufacture,etc.
Thinner mixes are defined as a mixture of at least three organic solvents – orat least two organic solvents for water-based paints – of which the relativeproportion of a single organic solvent does not exceed 80 per cent by weight.
If the mix contains three or more organic solvents, three of these organicsolvents must each account for more than 2 per cent by weight39. None of theorganic solvents included in the mix may be substances belonging to Group 1or Group 2, class I.
The C-value of 0.15 mg/m3 has been set on the basis of odour thresholds setfor a representative selection of the thinner mixes currently available. Foremissions of thinner mixes, requirements on outlet heights are basedexclusively on the C-value. This means that there is no need to supplementthis by requirements based on the concentration of substance odorants(LE/m3) in the surroundings of outlets emitting thinner mixes.
The C-value of 0.15 mg/m3 applies to new installations. This includes theestablishment of new paint shops at existing installations that have notpreviously included a paint shop. As a general rule, the 0.15 mg/m3 C-valueshould also be complied with in connection with extensions to existing paintshops.
For existing paint shops where the outlets have been dimensioned on the basisof a C-value of 0.3 mg/m3, orders to increase outlet heights, etc., with a viewto ensuring compliance with a 0.15 mg/m3 C-value should only be given ifthere are significant odour problems.
39 These figures apply in relation to the total organic solvent contents, which means that dry matter isnot included in calculations. If the conditions are not met, the product at hand is not a ”thinner mix”.
45
Detailed explanation
An installation wishes to know whether the organic solvents contained in thepaint products it uses can be regarded as thinner mixes in accordance with thenew definition specified above.
The installation uses several different types of paint. These paints include atwo-component paint where the hardening agent contains 0.5 per centhexamethylene-1,6 diisocyanate. According to the C-value list (OrienteringNo. 15/1996), hexamethylene-1,6 diisocyanate is a Group 2, class Isubstance.
According to the definition of thinner mixes, ”None of the organic solventsincluded in the mix may be Group 1 or Group 2, class I substances”.
The installation asks the following questions:1. Is hexamethylene-1,6 diisocyanate an organic solvent?2. When the paint used is a mixture of base, hardening agent, and possibly a
thinner, should the organic solvents in each of these elements comply withthe definition of a “thinner mix”, or is it the organic solvent compositionin the finished, ready-to-use mixture that must comply with thisdefinition?
The answers to these questions in relation to the definition of thinner mixesare as follows:
Question 1Hexamethylene-1,6 diisocyanate is not regarded as an organic solvent in thisconnection.
Question 2The organic solvent composition in the finished, ready-to-use mixture is theone that must comply with the definition of thinner mixes.
3.2.5.6 The VOC Statutory OrderOn 11 March 1999, the European Council adopted Directive 1999/13/EC onthe limitation of emissions of volatile organic compounds due to the use oforganic solvents in certain activities and installations – (The VOC Directive).In Denmark, the VOC Directive will be implemented by means of a StatutoryOrder on limitations of emissions of volatile organic compounds from the useof organic solvents in certain installations and activities (the VOC StatutoryOrder). This Statutory Order applies to installations where one or more of theindustrial processes and activities specified in appendix 1 are carried out andwhere the threshold values for use of organic solvents specified in appendix 2A are exceeded.
As a point of departure, the VOC Statutory Order is exhaustively regulatesemissions of volatile organic compounds from installations. It should,however, be observed whether an installation emits Group 1 substances whichdo not fall within the scope of the special provisions laid down in the VOCStatutory Order on substitution and limitation of emissions of certainsubstances that are particularly harmful to health, i.e. substances with the Rphrases R45, R46, R49, R60 and R61. It should also be observed whether any
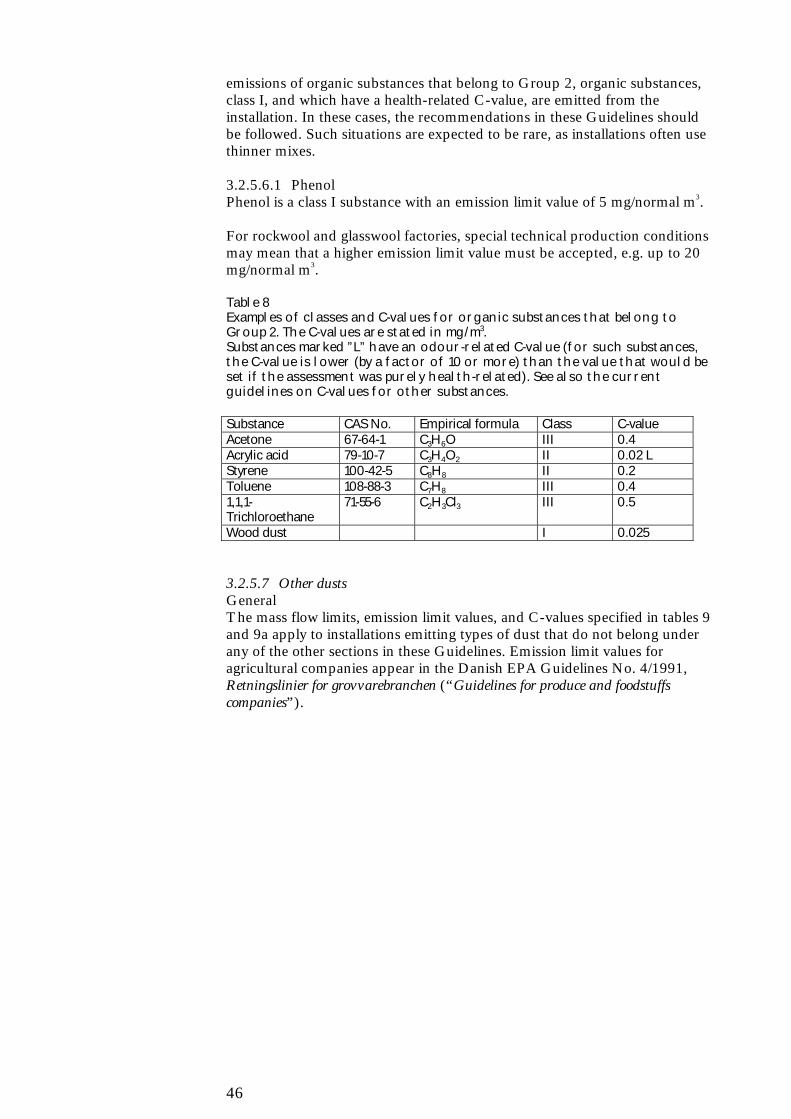
46
emissions of organic substances that belong to Group 2, organic substances,class I, and which have a health-related C-value, are emitted from theinstallation. In these cases, the recommendations in these Guidelines shouldbe followed. Such situations are expected to be rare, as installations often usethinner mixes.
3.2.5.6.1 PhenolPhenol is a class I substance with an emission limit value of 5 mg/normal m3.
For rockwool and glasswool factories, special technical production conditionsmay mean that a higher emission limit value must be accepted, e.g. up to 20mg/normal m3.
Table 8Examples of classes and C-values for organic substances that belong toGroup 2. The C-values are stated in mg/m3.Substances marked ”L” have an odour-related C-value (for such substances,the C-value is lower (by a factor of 10 or more) than the value that would beset if the assessment was purely health-related). See also the currentguidelines on C-values for other substances.
Substance CAS No. Empirical formula Class C-valueAcetone 67-64-1 C3H6O III 0.4Acrylic acid 79-10-7 C3H4O2 II 0.02 LStyrene 100-42-5 C8H8 II 0.2Toluene 108-88-3 C7H8 III 0.41,1,1-Trichloroethane
71-55-6 C2H3Cl3 III 0.5
Wood dust I 0.025
3.2.5.7 Other dustsGeneralThe mass flow limits, emission limit values, and C-values specified in tables 9and 9a apply to installations emitting types of dust that do not belong underany of the other sections in these Guidelines. Emission limit values foragricultural companies appear in the Danish EPA Guidelines No. 4/1991,Retningslinier for grovvarebranchen (“Guidelines for produce and foodstuffscompanies”).
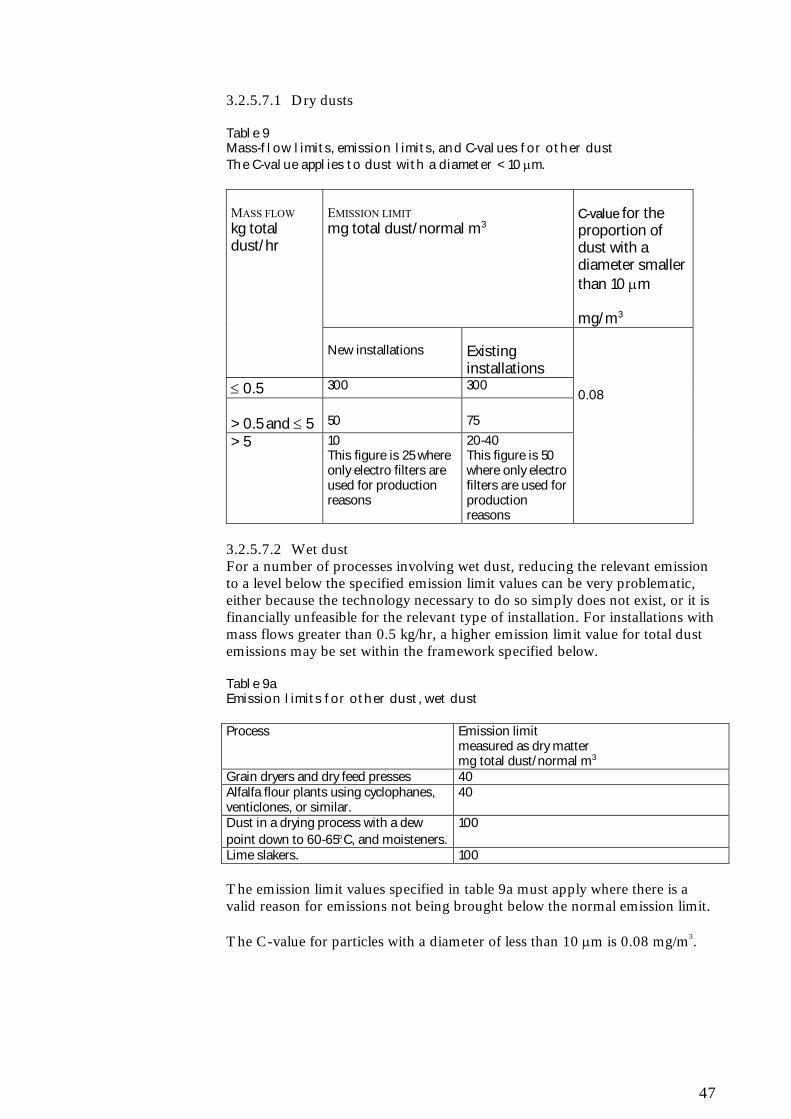
47
3.2.5.7.1 Dry dusts
Table 9Mass-flow limits, emission limits, and C-values for other dustThe C-value applies to dust with a diameter < 10 µm.
EMISSION LIMITmg total dust/normal m3
C-value for theproportion ofdust with adiameter smallerthan 10 µm
mg/m3
MASS FLOWkg totaldust/hr
New installations Existinginstallations
≤ 0.5 300 300
> 0.5 and ≤ 5 50 75
> 5 10This figure is 25 whereonly electro filters areused for productionreasons
20-40This figure is 50where only electrofilters are used forproductionreasons
0.08
3.2.5.7.2 Wet dustFor a number of processes involving wet dust, reducing the relevant emissionto a level below the specified emission limit values can be very problematic,either because the technology necessary to do so simply does not exist, or it isfinancially unfeasible for the relevant type of installation. For installations withmass flows greater than 0.5 kg/hr, a higher emission limit value for total dustemissions may be set within the framework specified below.
Table 9aEmission limits for other dust, wet dust
Process Emission limitmeasured as dry mattermg total dust/normal m3
Grain dryers and dry feed presses 40Alfalfa flour plants using cyclophanes,venticlones, or similar.
40
Dust in a drying process with a dewpoint down to 60-65°C, and moisteners.
100
Lime slakers. 100
The emission limit values specified in table 9a must apply where there is avalid reason for emissions not being brought below the normal emission limit.
The C-value for particles with a diameter of less than 10 µm is 0.08 mg/m3.

48

49
4 Calculation of outlet heights
4.1 Introduction
This chapter contains instructions on how to calculate stack or outlet heightsin order to ensure adequate dilution of emissions into the atmosphere tocomply with C-values.
In general, these calculations must be based on the OML model. This modeland its use is described in more detail in section 4.2. Section 4.3 explains theconcepts “source strength G” and “dispersion coefficient D” used in OMLcalculations. Section 4.4 provides instructions regarding calculations. Section4.5 describes the use of the model in connection with odour emissions, andsection 4.6 specifies some of the limitations applying to this model.
Calculations using the OML model may be carried out by the applicantinstallations themselves, or by consultants. The approving authority assesseswhether such calculations are adequate.
4.1.1 Information about the OML model
For information on the OML model, refer to the National EnvironmentalResearch Institute40 manuals and supporting materials regarding thisparticular model. The National Environmental Research Institute alsomaintains a website that features information of interest to OML modelusers41. Here, anyone interested can find information on current versions ofthe model and any problems reported, and they can download tips and helpfiles.
A PC version of OML-Point (the guidelines model) is available from theDanish Ministry for Environment and Energy Shop, Miljøbutikken42. Allother software is available from the National Environmental ResearchInstitute.
Inquiries regarding the normal application of these models should be made tothe Danish EPA. Other, more technical questions on the application andfunction of models should be directed to the National EnvironmentalResearch Institute43.
The previous version of these Guidelines included a description of a methodfor calculating outlet heights without using a PC, the so-called nomogrammethod. Due to subsequent developments in general PC usage, this method isnot included here.
40 National Environmental Research Institute of Denmark41 http://www.oml.dmu.dk42 Miljøbutikken, Læderstræde 1-3, DK-1201 Copenhagen K, Tel. (+45) 33 95 40 0043 The National Environmental Research Institute of Denmark, Department of AtmosphericEnvironment, Frederiksborgvej 399, PO Box 358, DK-4000 Roskilde. Tel. (+45) 46 30 12 00

50
4.2 The OML model
OML is an acronym for the Danish “Operationel MeteorologiskLuftkvalitetsmodel” (Operational Meteorological Air Quality Model), and isused to calculate required outlet heights by means of a computer softwarepackage. This package is available in two versions: OML-Point and OML-Multi.
OML-Point is used to carry out calculations for point sources that areassumed to be at one single geographical point, whereas OML-Multi can takeinto account the relative positions of many outlets. This means that OML-Multi is used in cases involving several outlets with some distance between theindividual outlets. Both versions are based on a Gaussian plume model. Theyinclude a division by a factor of 1 million in the sense that if emissions aresubmitted in g/sec, the resulting ground level concentration will be indicatedµg/m3.
4.2.1 Results from the model compared with C-values
The user must supply various information, such as a tentative outlet height.On this basis, the model calculates average concentrations for every hour of areference year at a number of user-defined points – the so-called receptorpoints. As a measure for the concentrations, 99-percent fractiles are tabulatedat all receptor points for each month of the reference year.
These calculated concentrations are compared to the C-values laid down inthe C-value Guidelines, and repeated calculations using various outlet heightsmake it possible to determine an outlet height on the basis of the criterion thatthe 99-percent fractiles calculated must be less than or equal to the relevantC-values.
The C-values must be complied with for each month, and calculations mustalways be carried out for all 12 months of the year, even if emissions occuronly for part of the year. C-values must be complied with everywhere outsideof installation boundaries.
4.2.2 Data basis for OML calculations
Calculations using the OML model require information on source strength,volume flow, flue-gas temperature, inner and outer diameter of stacks, outletheight, topography, buildings in the immediate vicinity of the source, as wellas time series meteorological data. Meteorological data for a reference year(Copenhagen Airport 1976) are supplied with the model. Section 4.3 featuresa more detailed description of the concepts of “source strength” and“dispersion coefficient”, which can be used for preliminary estimates.
4.3 Source strength and dispersion coefficient
4.3.1 Source strength “G”
Basically, the source strength G is the maximum permissible emission of agiven substance during one hour of operation, measured as mg/sec. G shouldbe determined by means of one of the following approaches:

51
1. G may be determined on the basis of the limit value for emissions laiddown in the terms of the relevant approval for the outlet in question,and on the basis of the maximum hourly flow rate during operation. Gis calculated by multiplying the limit value for emissions, mg/normalm3, set in the approval with the maximum flow rate in the outletmeasured in normal m3/sec.
2. In cases where no limit value for emissions has been set, the maximumhourly emission during normal operation is used instead. In severalcases, for example, G may be determined on the basis of the amountof paint used at a surface-treatment plant, where all organic solventsare normally emitted into the atmosphere. The maximum hourlyconsumption will then form the basis for calculations of sourcestrength.
Where devices intended to reduce pollution have been installed, and thesedevices mean that emissions from the installation in question are significantlylower than the limit values for emissions laid down in these Guidelines, theactual emissions may be used when calculating outlet heights, if a maximumhourly emission can be determined on the basis of the figures available onactual emissions. The approving authority and the relevant installation shouldconsider whether the emission limits should be reduced instead.
4.3.2 Dispersion coefficient “D”
The dispersion coefficient D is a concept that may be useful in connection withpreliminary estimates.
The dispersion coefficient is defined as the source strength, G, measured asmg/sec of the relevant substance, divided by the C-value in mg/m3 for thesame substance.
Equation 4
G [mg/sec]D [m3/sec] = C-value [mg/m3]
D is measured in m3/sec and expresses the quantity of air that the dischargedsubstance must be evenly mixed with every second in order to comply withthe C-value.
If the dispersion coefficient is less than 250 m3/sec, the only requirement tothe outlet is that it should be at least 1 m above roof level and directedupwards to ensure free dilution44.
This rule may only be applied to a limited number of outlets within a singleinstallation; the exact number depends on the size of the relevant installation.
44 “Above roof level" usually refers to the roof on which the outlet is situated, but in special cases,account should be taken of tall adjacent buildings, etc., in order to ensure free dilution.

52
Example:
The point of departure is the example in section 3.1.5 with a maximum hourly emissionof acetone of 10 kg/hr, corresponding to 2,778 mg/sec.
D [m3/sec] = G [mg/sec] = 2,778 = 6,945 m3/secC-value [mg/m3] 0.4
As the dispersion coefficient D = 6,945 m3/sec > 250 m3/sec in the example above, anOML calculation must be carried out in order to determine the height of the outlet aboveground level. The taller the outlet, the greater the dilution.
4.4 Calculation using OML
4.4.1 One or more outlets and one or more substances
Table 10Which method should be used?
Single substance Several substancesSingle outlet: Carry out calculations using OML-
Point or OML-Multi until a suitableoutlet height – one where thecontribution complies with therelevant C-value – can bedetermined. OML-Multi willprovide the same results as OML-Point.
Determine the dispersioncoefficient for each substance.Use the C-value applying to thesubstance that gives thegreatest dispersion coefficient.Carry out calculations usingOML-Point or OML-Multi until asuitable outlet height – onewhere the contribution complieswith the relevant C-value – canbe determined. OMLcalculations may also be carriedout for all substances involved.OML-Multi may be used, butwill provide the same results asOML-Point.
Several outlets: Carry out calculations using OML-Point or OML-Multi, until asatisfactory set of outlet heights isdetermined. The total contributionfrom outlets must comply with therelevant C-value. OML-Point willprovide conservative results.
Carry out calculations for allsubstances using OML-Point orOML-Multi, until a satisfactoryset of outlet heights isdetermined for the relevantsubstances. The totalcontribution from outlets mustcomply with the relevant C-valuefor each substance. OML-Pointwill provide conservative results.
Note the following regarding this model:The OML model calculates concentrations in the surroundings – not outlet heights. When OMLcalculations are carried out, these calculations must be repeated using a different outlet height eachtime until a height (or set of outlet heights) in compliance with the C-value has been successfullydetermined.OML-Point is best suited for simple outlet conditions with only one point source. OML-Point may beused in situations involving several outlets, but it will provide results that err on the conservative side,whereas OML-Multi will give more realistic results. This is because OML-Point treats outlets asthough they were situated at one single geographical location, whereas OML-Multi is capable ofsuperimposing concentrations from different sources. As a rule of thumb, use of OML-Multi shouldbe considered in situations where two separate outlets are located at a distance of more than twooutlet heights from each other.In cases involving outlets from comfort ventilation with concentrations less than the recommendedlimit values for indoor climate issued by the Working Environment Authority, and with dispersioncoefficients (as defined in section 4.3) less than 250 m3/sec, the only requirement to the outlet is that
53
it should be at least 1 m above roof level45 and directed upwards or designed in some otherenvironmentally friendly manner, so that the air emitted from the outlet can disperse freely.In those special cases where an installation emits substances with identical toxicological properties,these substances must be considered one single substance in these calculations. Section 4.4.2 specifieshow calculations are carried out in such cases.
The supporting material accompanying the OML model may provide helpfulinformation and guidance when specifying input data for model simulations.This material is also available on the Internet46.
These Guidelines do not include detailed instructions on how to calculateenvironmental contributions from sources other than point sources. It should,however, be noted that OML-Multi includes methods to perform calculationsfor the so-called area sources, i.e. sources where emissions may be assumed tobe evenly distributed within a rectangular area.
4.4.2 Substances with identical effects
In special cases, where an installation emits different substances within thesame substance group with identical toxicological effects and health-relatedC-values (see section 3.1.7), outlet calculations must be carried out on thebasis of the total substance emission involved.
When substances have different C-values you may choose either an approach(‘the Cr method”) where the corresponding C-value is calculated as aweighted average value, Cr, or a more technical method (“the C1 method”),where source strengths are normalised in a manner which makes it possible toapply a C-value of 1 mg/m3.
4.4.2.1 The Cr methodThe Cr method is exact when substances are emitted from one single outlet, butit is unnecessarily conservative in scenarios where emissions occur fromseveral different outlets situated at some distance from each other or of varyingheights. The Cr method is also exact in cases where substances have identicalC-values.
The Cr method with a weighted average value requires the calculation of a Cr
value in accordance with the definition in section 3.1.7. This is followed by anOML calculation. In this OML calculation, emissions of all the substanceswith identical toxicological properties are included as if only one substancewere involved.
4.4.2.2 The C1 methodThe C1 method will always be exact, but the ground level concentrationconcentrations calculated will be fictitious and must be compared with a C-value of 1 mg/m3.
According to the C1 method, the source strength of each substance must benormalised according to its relevant C-value prior to the outlet calculation.This is done as follows:
45 ”Above roof level" usually refers to the roof on which the relevant outlet is situated, but in specialcases account should be taken of tall adjacent buildings, etc., in order to ensure free dilution.46http://www.dmu.dk/AtmosphericEnvironment/oml_info.htm

54
Equation 5
GiGn, i = ——
Ciwhere Gn, i is the normalised source strength for substance i, G i is the source strengthfor substance i, and Ci is the numerical value of the C-value, in mg/m3, forsubstance i.
The OML calculation using OML-Multi is carried out taking into account alloutlets and all substances with identical toxicological effects. If more than onesubstance is emitted from a single outlet, a total normalised source strengthmust be calculated for this outlet, as specified below in Equation 6. The resultof the entire OML calculation must be compared to a C-value of 1 mg/m3.
Equation 6
Gi
Gn, outlet = ∑ Ci i
The normalised source strength for the outlet is computed by addingcontributions from all the substances with identical effects.
Example of application of the C1 method for two substances with identicaleffects, A and B
From a given outlet, an installation emits substance A with a C-value of 1 mg/m3, whilealso emitting, from a different outlet, substance B with a C-value of 0.1 mg/m3. Thesource strength for substance A is 1 g/sec and for substance B 1 g/sec. Substances Aand B have identical effects.
The normalised47 source strength to be used in connection with the B1 method is:
For substance A:
GnA = 1 g/sec 1 = 1 g/sec
and for substance B
GnB = 1 g/sec 0.1 = 10 g/sec
This means that OML-Multi must be used to carry out an OML calculation, in which thetwo outlets have source strengths of 1 g/sec and 10 g/sec, respectively, as calculatedabove. The resulting concentration must be compared to the C-value 1 mg/m3.
4.5 Application of the OML model for odour emissions
The OML model can also be used to calculate outlet heights in connectionwith odour emissions. The source strength is the product of the odour-
47No change in unit is made to the source strength, as normalisation is carried out using the numericalvalue of the contribution value.
55
emission concentration48 stated as odour units/normal m3 and the maximumpermissible air quantity (normal m3/sec). This concentration must bedetermined in accordance with current methods applying to odour-emissionmeasurement. In order to take into account the fact that assessments of odourground level concentrations are normally based on an averaging period of 1minute rather than the 1 hour used in the OML model, the source strengthmust be corrected using a factor of 7.8. In practice, this means that theemission must be multiplied by a factor of 7.8 and divided by a factor of1,000,000 in the model. The result is the odour ground level concentrationstated directly in odour units/m3.
4.6 Exceptions
4.6.1 Heavy gases
Note that the OML model cannot be applied to gases that are significantlyheavier than the surrounding air. In calculations of plume rise, the relevantparameter is the bulk density of the gas mixture, not the molecular weight ofindividual pollution components. Consequently, the model should not be usedin cases involving flue gas at low temperatures (in practice, the limit may beset at -5°C).
4.6.2 Wet flue gases
The OML model cannot be expected to produce reliable results when appliedto flue gases with excessively high moisture contents (e.g. in connection withforage drying plants or certain types of flue gas scrubbers). There may be anabsence of lift in the plume, and the plume may also shed drops.
It is difficult to quantify problems involving wet smoke plumes, and suchproblems are not addressed in the OML model. The National EnvironmentalResearch Institute is currently establishing a knowledge bank for methods tocounteract problems with very wet flue gases. Further information is availablefrom the National Environmental Research Institute and on the Internet49.
48 See the definition in the Odour Guidelines.49 http://www.dmu.dk/AtmosphericEnvironment/vaadroeg.htm

56
57
5 Terms and inspection rules
5.1 Introduction
In this chapter, section 5.2 describes the various types of terms and how theyshould be set up. The terms addressed are operating terms, emission terms,and inspection terms.
Three different types of terms require inspection of emissions:• Emission terms, where inspection is carried out as performance
inspection.• Emission terms, where inspection is carried out by means of an
Automatic Measurement System (AMS).• Emission terms, where inspection is carried out as random testing.
For the purposes of these Guidelines, “performance inspection” meansemission measurement carried out at intervals, e.g. once a year, where 3samples are taken, each with a duration of one hour (or a different period oftime, depending on the measurements or operating circumstances).
“AMS inspection” means continual emission measurement carried out over arelatively long period of time, typically throughout the plant’s life cycle.
“Random tests” means emission measurement carried out at intervals, such as6 times a year.
Section 5.3 addresses inspection rules for inspection of operation andemissions. Section 5.3.3 describes the scope of emission inspection, both inthe main text and in a diagram.
Section 5.4 describes when the emission limit values are complied with.
Section 5.5 shows examples of formulated terms.
This chapter may be used when deciding on terms and when settinginspection rules in an environmental approval or order. It may also be usefulwith regard to plans to change the terms or inspection provisions laid down inan environmental approval or order.
5.1.1 Definition of self-inspection
Self-inspection is defined as inspection paid for by the installation and eithercarried out by external laboratories or by in-house staff. This providesinstallations with the opportunity to take faster action to remedy excessiveemissions. Such inspection may be combined successfully with anenvironmental management system. Measurements carried out by externallaboratories should be carried out as accredited measurements. It isrecommended that major installations which carry out self-inspectionthemselves on a regular basis consider applying for accreditation to carry outemission measurement whenever legislation allows for such accreditation.

58
The Danish EPA advocates inspection of air pollution from installations to becarried out via self-inspection.
5.2 Terms
5.2.1 General issues
Terms in approvals and orders should be clear and unambiguous, and itshould be possible to carry out inspections to determine compliance with suchterms without expending unreasonable resources.
Terms should be followed up by inspection in order to confirm compliance.The scope of such inspection should be adjusted to reflect the potentialenvironmental impact.
5.2.2 Types of terms
The objective of terms for air pollution is to ensure that such pollution is keptbelow a specific limit.
These terms may be presented in various ways:
Operating termsOperating terms are requirements that affect the design and operation ofinstallations and have an impact on air pollution from such installations. Suchrequirements might involve the maximum capacity of the power plant or theuse of specific raw materials.
Emission termsEmission terms are requirements for air quantities and the concentration ofsubstances emitted by installations, or requirements regarding maximumhourly emissions.
Terms for outlet heightsThe objective of terms specifying outlet heights is to ensure compliance withthe C-values.
The final part of this chapter features draft terms.
5.2.3 Operating terms
The objective of operating terms is to limit emissions of pollutants, e.g. byensuring that purification or abatement equipment at installations is alwaysworking optimally.
As regards purification or abatement equipment, these terms might entailregular inspection and the setting of acceptable limits for e.g.:
• Visual inspection of bag filters.• Measuring flow and pH at scrubbers and wet filters.• Operating temperatures in connection with thermal or catalytic
combustion.• Deposits in cyclones.• Leaks and corrosion.

59
Such inspection should be followed up, so that all faults are corrected andrepaired as soon as the acceptable limits are exceeded.
Naturally, such monitoring requires instruments, indicators, inspectionhatches, sampling ports, etc., necessary for inspection. If necessary, theapproval must stipulate appropriate terms to ensure that such equipment isavailable and that all indicators and instrument displays are easily accessibleand easy to read. These terms may stipulate that such displays must besituated in a control room or at the operating staff’s usual place of work.
As a rule, purification or abatement plants should not be bypassed50. In somesituations, however, purification or abatement plants may be bypassed fortechnical reasons.
For example,• bypassing bag filters may be necessary when the flue gas temperature
is too low during start-up (below the dew point), or• in connection with accidents involving thermal or catalytic combustion
plant.
The bypass period should be as short as possible and must not lead tounacceptable environmental impacts. The terms should state the acceptableextent of such bypass periods and how they should be registered.
Operating terms may be requirements regarding the preparation of anoperating log, detailing e.g. the raw materials used, operating temperatures,operating failures and breakdowns, etc. There should also be termsdemanding that logs are kept of faults, errors, or accidents on the installationitself (both process and purification or abatement equipment) or duringoperation.
The operating log and any operation instructions must be available to thesupervising authorities upon request. The operating log must be stored at theinstallation for a specific period of time, for example three years.
5.2.4 Emission and inspection terms
The objective of emission terms is to establish limits for concentrations of thepollution and air quantity emitted. The emission limit value is set:
• as specified in chapter 3, and• on the basis of an assessment of the potential performance of an
effective and affordable purification or abatement installation of therelevant type.
Along with terms on maximum air quantities per time unit and outlet height,the emission terms will ensure that concentrations in the surroundings do notexceed the C-value.
As a minimum, emission terms should meet the following requirements:• They should establish relevant limit values for pollutants.• They should establish clear limits and inspection methods.• It must be possible to check compliance with such terms without the
need for using excessive resources.
50”Bypass” means that the polluted air is led around the purification or abatement installation.

60
There are three different types of inspection procedures:
Performance inspectionPerformance inspection is used at installations with significant pollution (i.e.where the mass flow limit has been exceeded, but where the AMS inspectionlimit has not).
AMS51 inspectionAMS inspection is used at installations with very significant air pollution (i.e.where the AMS inspection limit has been exceeded), see section 5.3.3.3.
Random testingRandom testing is used at installations with very significant air pollution,where it is not technically or financially feasible to use AMS inspection.
The following issues should always be taken into consideration when settingup emission terms:
• the pollutant (see section 5.2.4.1),• the emission limit value (see section 5.2.4.2),• the inspection period (see section 5.2.4.3 and section 5.3),• the measurement period (see section 5.2.4.4 and section 5.3),• the number of individual measurements (see section 5.2.4.5),• the operating circumstances during measurement (see section
5.2.4.6),• the method of measurement (see section 5.2.4.7),• the detection limit (see section 5.2.4.8).
For AMS inspections, steps should also be taken to ensure:• that sufficient information on the quality of instruments is available
(through tests on sensitivity, zero-point operation, measurementuncertainty, time constant), or that the instrument is approved by thesupervisory authority before use,
• that instruments are installed correctly at the measuring point,• that the instrument is serviced and maintained on a regular basis by
qualified personnel in accordance with the manufacturer’srecommendations,
• that the instrument is calibrated regularly, either by the installationitself or by an accredited laboratory, e.g. by means of parallelmeasurements once a year,
• that measurement data are stored on a suitable medium and processedfor subsequent use by the supervisory authorities. All measurementdata should be stored for at least three years,
• that measurement data are available, in a suitable form, to theoperating personnel at their usual workplace via online systems.
5.2.4.1 The pollutantThe pollutant may be a chemical substance or a substance group, or pollutionmay be described in terms of a particular property (such as odour orbiological activity).
51 The letters AMS form an acronym for Automatic Measuring System. An AMS system uses fixedmeasuring equipment to measure and record emissions. A CEN standard establishing performancerequirements for AMS systems is currently being prepared. See also section 5.3.3.3.
61
The term used should state whether there are one or several states (e.g. bothgas and particle phase), whether one or more elements are included incalculations for all compounds, etc., and whether the limit values apply, forexample, to the sum of specific compounds.
5.2.4.2 The emission limit valueThe emission limit value is a limit value for the maximum pollution. Thispollution may be stated as mg pollutant/normal m3 from a specific outletmeasured at a maximum air flux. The emission limit value must be statedclearly and unambiguously and must include a specific measurement unit andreference condition. For more information on reference conditions, seesection 3.1.2.
5.2.4.3 The inspection periodThe inspection period is the period in which emissions are inspected. Thelength of these inspection periods is usually:
• three hours for performance inspections,• one month for AMS inspections, and• one year for random tests.
The inspection period should be sufficiently long to facilitate assessment of arepresentative part of the emission; i.e. long enough to ensure that randomshort-term high or low values do not influence the assessment significantly. Atthe same time, the inspection period should be short enough to make itpossible to decide whether the term is complied with within a reasonableperiod of time.
5.2.4.4 Measurement periodThe measurement period is the period used for each measurement. Thisapplies to both manual and continual measurements. Terms should alwaysinclude a specification of the measurement period.
Performance inspections normally have a measurement period of one hour ormore, depending on what is being measured. If, for example, performanceinspection is carried out by means of instruments that register datacontinuously, the measurement period is usually set at one hour. As a point ofdeparture, performance inspection is carried out once a year, but the intervalsbetween inspections may be longer or shorter, depending on specificassessment of the relevant situation.
For AMS inspections, the shortest theoretical measurement period willdepend on the time constant of the instrument used. This time constant isusually less than one minute. In practice, the measurement period is set at onehour, which provides good time for a suitable statistical basis. AMSinspections are carried out on a continuous basis.
Random tests usually have a measurement period of one hour or more,depending on what is being measured. If, for example, random testing iscarried out by means of instruments that register data continuously, themeasurement period is usually set at one hour. Random tests are carried outregularly each year, but the number of samples taken varies, as specified insection 5.4.3.
It is recommended that the same one-hour measurement period is used forperformance, AMS, and random tests alike. Any deviations from this
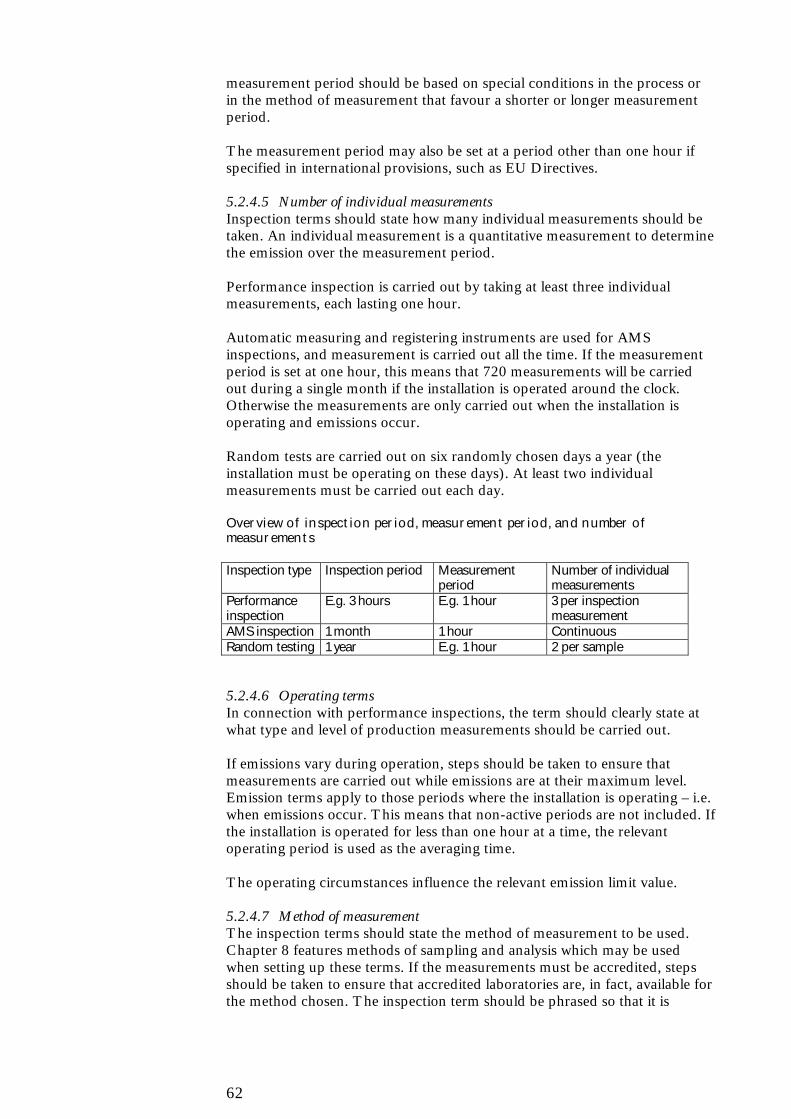
62
measurement period should be based on special conditions in the process orin the method of measurement that favour a shorter or longer measurementperiod.
The measurement period may also be set at a period other than one hour ifspecified in international provisions, such as EU Directives.
5.2.4.5 Number of individual measurementsInspection terms should state how many individual measurements should betaken. An individual measurement is a quantitative measurement to determinethe emission over the measurement period.
Performance inspection is carried out by taking at least three individualmeasurements, each lasting one hour.
Automatic measuring and registering instruments are used for AMSinspections, and measurement is carried out all the time. If the measurementperiod is set at one hour, this means that 720 measurements will be carriedout during a single month if the installation is operated around the clock.Otherwise the measurements are only carried out when the installation isoperating and emissions occur.
Random tests are carried out on six randomly chosen days a year (theinstallation must be operating on these days). At least two individualmeasurements must be carried out each day.
Overview of inspection period, measurement period, and number ofmeasurements
Inspection type Inspection period Measurementperiod
Number of individualmeasurements
Performanceinspection
E.g. 3 hours E.g. 1 hour 3 per inspectionmeasurement
AMS inspection 1 month 1 hour ContinuousRandom testing 1 year E.g. 1 hour 2 per sample
5.2.4.6 Operating termsIn connection with performance inspections, the term should clearly state atwhat type and level of production measurements should be carried out.
If emissions vary during operation, steps should be taken to ensure thatmeasurements are carried out while emissions are at their maximum level.Emission terms apply to those periods where the installation is operating – i.e.when emissions occur. This means that non-active periods are not included. Ifthe installation is operated for less than one hour at a time, the relevantoperating period is used as the averaging time.
The operating circumstances influence the relevant emission limit value.
5.2.4.7 Method of measurementThe inspection terms should state the method of measurement to be used.Chapter 8 features methods of sampling and analysis which may be usedwhen setting up these terms. If the measurements must be accredited, stepsshould be taken to ensure that accredited laboratories are, in fact, available forthe method chosen. The inspection term should be phrased so that it is
63
possible to use other measurement methods of a similar quality, if theinstallation can justify it.
5.2.4.8 Detection limitThe detection limit should normally be less than 10% of the emission limitvalue inspected. If the emission limit value applies to the sum of severalsubstances, measurement results below the detection limit are not included incalculations.
5.2.5 Terms for outlet heights
The objective of the terms for outlet heights is to ensure compliance with theC-values. Outlet heights are calculated by means of the OML model.
At installations with few outlets, the terms will usually require specific outletheights in order to ensure that the C-value is complied with when the emissionlimit value is met.
At installations with many outlets, it may be fair to impose terms regardingcompliance with C-values as such a procedure will enable the installation tomake its own decisions on distribution of outlet heights and purification orabatement, if applicable. Emission limit values must still be set in such cases.
5.3 Type and scope of inspection
Inspections of compliance with terms imposed on plants require inspectionterms that specify when it can be said that a given term is complied with orexceeded.
Three different types of inspection are used:• inspections of operation, see section 5.3.1,• inspections of emissions, see sections 5.3.2 and 5.4,• inspections of outlet heights, see section 5.4.4.
Inspections of operation are carried out by monitoring the relevant process orplant. Inspections of emissions are carried out by measuring or calculating therelevant emission.
5.3.1 Inspections of operation
The installation must carry out inspections of operation by monitoring therelevant processes and plants in accordance with the terms set. The operatingterms are deemed to be complied with when the operating log has beencorrectly kept and the terms set up for the operation observed.
5.3.2 Inspection of emissions
Inspection of emissions may be carried out by measuring – if necessary bycalculating – the relevant emission. All measurements must be carried out inaccordance with the relevant emission terms.
Who carries out inspection of emissions?• The installation may let an accredited laboratory carry out
performance inspections or random tests.

64
• The installation may carry out performance inspections, AMSmeasurements or random tests itself.
• The emission may be calculated by means of mass balances,production data, or similar data.
Large-scale installations carrying out self-inspection on a regular basis shouldconsider applying for accreditation to carry out emission measurements ifcurrent legislation allows for this. Measurements should be carried out asspecified in chapter 8.
5.3.3 Type and scope of inspection of emissions
H a s th eAMSAMS in spect ion lim it
been exceeded ?
In st a lla t ion s withver y sign ifika n t
a ir pollu t ion
exceeded ?m a ss flow lim it been
H a s th e
been exceeded?Th e em ission lim it
H a s
H a sth e em ission lim itbeen exceeded??
In st a lla t ion s withsign ifik an t a ir
ll i bpollu t ion
E m ission r edu k t iocis n ecessa r y.
N o em ission
sign ifika n t a ir poll.i d i
n ecessa r y.r edu ct ion is
See sect ion 5.3.3.2
In st a lla t ion s with
N o em ission
less sign ifica n tb t d i
n ecessa r y..r edu ct ion is
a ir pollu t ion .
In st a lla t ion s with -it h ft f i
possible?AMS
Is
Ra n dom t est in g
AMS-in spek t ion
Yes
Yes
N o
N o
Yes
N o
Yes
N o
Yes
N o
See sect ion 5.3.3.3
See sect ion 5.4.3
See sect ion 5.4.2
Figure 5 shows the scope of inspection of emissions.
The use of the various types of terms depends on the significance of theemissions. The installations are divided into the following categories:
5.3.3.1 Installations with less significant air pollutionInstallations with less significant air pollution are installations where the massflow (substance quantities prior to purification or abatement) is less than themass flow limit. In such cases, emission measurements are usually notrequired, and inspection can be limited to an effective inspection of operation.However, emission measurements may also be required in order to documentthat the mass flow remains below the mass flow limit, as well as to determinethe maximum hourly emission where this cannot be done by means ofcalculations.

65
5.3.3.2 Installations with significant air pollutionInstallations with significant air pollution are installations where the mass flow(substance quantities prior to purification or abatement) exceeds the massflow limit, but remains below the AMS inspection limit specified in section5.3.3.3.
When issuing approvals to such installations, requirements should be madethat inspections of compliance with the operating provisions that aresignificant to limiting air pollution should be carried out daily, or even moreregularly. This must also apply to inspections to verify that all significantmeasures designed to limit pollution function correctly. There should also berequirements stipulating that emission measurements, usually in the form ofperformance inspection, must be carried out once a year if an emission limithas been specified. However, if the result of a performance inspection shows avalue of less than 60 per cent of the emission limit value, such measurementsneed only be carried out every second year.
Performance inspection for dioxins and furans should be carried out for alloutlets with a mass flow (substance quantity prior to purification orabatement) greater than 0.1 mg dioxins and furan/hr, measured as mg I-TEQ.
At normal operating circumstances, at least two (parallel or serial) individualsamples must be taken for dioxin analysis twice a year for new installationsand once a year hereafter, if the emission limit value is complied with. If theemission complies with the relevant requirements over a period of two years,measurements may be carried out at even greater intervals. The measurementperiod for individual samples must be 6-8 hours in order to ensure asufficiently low detection limit.
5.3.3.3 Installations with very significant air pollutionInstallations with very significant air pollution are defined as installationswhere the mass flow (substance quantities prior to purification or abatement)for each outlet exceeds the AMS inspection limits, as specified below. AMSfor measurement of the relevant emissions should be mandatory for suchinstallations.
5.3.3.3.1 AMS inspection limits for gaseous substancesAny outlet (individual outlet) with a mass flow (substance quantity prior topurification or abatement) greater than
• 200 kg/hr SO2,• 25 kg/hr organic substances, measured as TOC,• 200 kg/hr NOX, measured as NO2,• 2 kg/hr group 1 substance,
should be fitted with AMS for measurement of the relevant substances.
5.3.3.3.2 AMS inspection limits for particles, etc.Any outlet (individual outlet) with a mass flow (substance quantity prior topurification or abatement) greater than 2 kg/hr of the substances specifiedbelow52 should be fitted with AMS for measurement of the installation’semissions of:
• group 1 substances,• lead and lead compounds, measured as lead,
52 Both in particle form and gaseous form

66
• copper and copper compounds, measured as copper,• mercury and mercury compounds, measured as mercury,• tellurium and tellurium compounds, measured as tellurium,• thallium and thallium compounds, measured as thallium,• vanadium and vanadium compounds, measured as vanadium.
Any outlet (individual outlet) with a mass flow (substance quantity prior topurification or abatement) greater than 200 kg particles/hr (other than thosespecified above) should be fitted with AMS for measurement of theinstallation’s particle emissions.
Random tests are used in situations where use of AMS is impossible.
5.4 When are the terms complied with?
What follows are descriptions of when terms are complied with. Suchinformation should be included directly in terms in approvals and orders,as this will help avoid problems regarding the burden of proof in anysubsequent legal action.
5.4.1 Performance inspection
The emission terms are complied with when the arithmetical average value ofall individual measurements carried out during the performance inspection isless than or equal to the required value.
5.4.2 AMS inspection
The emission terms are complied with when the arithmetical average value ofall individual measurements carried out during the inspection period (onecalendar month) is less than or equal to the required value.
5.4.2.1 Inspection rules for individual measurementsIf an individual measurement exceeds the emission limit value by a factor ofthree or more, the supervisory authority must be notified. At the same time,an account must be given of the reason behind this breach and of themeasures taken, or about to be taken, in order to prevent future problems. Inaddition to this, intensified monitoring of the equipment designed to limitpollution must be carried out. This must be done in consultation with thesupervising authority.
5.4.3 Random testing
In random testing, a number of samples are taken at intervals during theinspection period. In principle, these samples must be taken on six randomlyselected operating days during a single year. A single sample comprises twoindividual measurements, each lasting one hour. The result of such a sampleis the average value of these two measurements.
5.4.3.1 Inspection rule for random testingThe assessment of whether the required value is complied with is carried outin accordance with the following principles:
• K is the required value,• M1 is the inspection-limit value for the emission measured,• M2 is the inspection-limit value for the number of samples,

67
• M is the average value of all samples taken during the inspectionperiod, and
• N is the number of samples taken.
On this basis, it is possible to establish the following two rules for whether therequired value is complied with, and whether the number of samples taken isadequate:
5.4.3.2 The limit value ruleThe limit value (K) is complied with if M (the measured value) is less thanthe inspection limit value for the emission measured. The inspection limitvalue (M1) is calculated as follows:
Equation 7
M1 = K x 37
where q (the geometric dispersion) is calculated as follows:
whereN N
M SUM N
M SUM q
ii
, ) 1 (
) log ( 1 log 22
−
− =
Mi is the result of the individual samples.log is the common logarithm.
5.4.3.3 The random sample ruleThe number of samples taken is sufficiently large if M is less than theinspection limit value for the number of samples (M2), which is calculated asfollows:
Equation 8
M2 = 2 x K x 19-q
If this is not the case, the number of samples taken during the next inspectionperiod must be increased by three.
The terms of both rules must be met in order to comply with the requiredvalue.
If the terms of the rule on limit values are not met, but the sample rule iscomplied with, the limit value is considered exceeded.
If neither the limit value rule nor the sample rule are met, the number ofsamples taken during the next inspection period should be increased, andmeasures should be taken to reduce emissions of the relevant parameter.
If the limit value rule is met, while the sample rule is not, this should lead toan increase in the number of samples taken during the next inspection periodas well as increased inspection (inspection of operation) of the equipmentdesigned to limit pollution.
If the results of at least two inspection periods show that the emissionsmeasured amount to less than 50 per cent of the required values, the number

68
of samples taken per inspection period may be reduced from six to four. Ifthis pattern is repeated, the number of samples taken may be reduced further,from four to two, and finally to a single annual performance inspection. If therequired value is exceeded, the number of samples to be taken each year willreturn to six.
5.4.3.4 Inspection rules for individual measurementsIf an individual measurement exceeds the emission limit value by a factor ofthree or more, the supervisory authority must be notified. At the same time,an account must be given of the reason behind this breach and of themeasures taken, or about to be taken, in order to prevent future problems. Inaddition to this, intensified monitoring of the equipment designed to limitpollution must be carried out. This must be done in consultation with thesupervising authority.
Example of the application of this inspection rule
Terms:The emission of cadmium from the installation outlet, measured as an annual meanvalue determined by means of random testing, must not exceed 100 µg/normal m³.
Data:Sample No. Emission m. (M1) log Mi log² Mi1 238 2.377 5.6482 87 1.940 3.7623 171 2.233 4.9864 74 1.869 3.4945 99 1.996 3.9836 123 2.090 4.368Sum 792 (A) 12.505 (B) 26.241 (C)
Exponent:
5 6
6)/ 502 , 12 241 , (26) 1 (
)/ 22
x N N
N B (C q − = −
− =
q = 0.077
Inspection limits:M1 = 100 x 370.077 = 132.1 µg/normal m³
M2 = 2 x 100 x 190-0.077 = 159 µg/normal m³
Mean value:M = A/N = 792/6 = 132 µg/normal m³
Conclusion:M less than M1? Yes, 132 is less than 132.1: the emission is approved.M less than M2? Yes, 132 is less than 159.4: the number of samples taken is adequate.
5.4.4 Inspection of outlet height
The authority may request documentation for the height of the outlet.
5.4.5 Inspection of absolute filters
Absolute filters should always be checked for leaks after installation andrepairs.
69
Absolute filters should not be inspected during normal operation. Inspectionsare carried out on demand, and must always be carried out when the filter hasbeen removed, adjusted, or repaired. The filter must always, however, beinspected at least once a year.
The most widely used test method is a leak test (e.g. ASME N510 andDS/EN1822/4 and 5). The leak should not exceed 0.03 per cent for particles with asize of 0.3 µm.
The separation efficiency of 99.97 per cent for 0.3 µm particles is tested bythe manufacturer after production. For example, such a test may be carriedout in accordance with DS/EN 1822/1-3.
5.5 Examples of terms
5.5.1 Example A. Installation with less significant air pollution
An installation uses paint that contains toluene. The surface treatment processused at this installation leads to the following emission of toluene: Toluene isemitted from outlet A, and the installation states that the mass flow of tolueneover a single shift is approximately 2,000 g/hr. The air quantity in the outlet isestimated at approximately 4,000 normal m³/hr on the basis of informationabout the ventilation system. This means that the emission concentration,without purification or abatement, is approximately 500 mg/normal m³.
According to chapter 3, the mass flow limit for toluene is 6,250 g/hr.
As the mass flow is below the mass flow limit, the installation does not have tocarry out any purification or abatement, and inspection can be carried out onthe basis of operating terms.
The outlet height is determined on the basis of the maximum emissionconcentration of toluene over an hour. This value has been set at 1,000mg/normal m³ on the basis of the consumption pattern for toluene during asingle shift and the C-value for toluene, which is set at 0.4 mg/m³.
As the dispersion coefficient is 2,775 m³/s and this figure is greater than 250m³/s, the installation has carried out an OML calculation to determine that theoutlet must be at least 10 m above ground level.
Terms for air pollution from the installation and the inspection hereof areas follows:
Outlet height and operating terms• The outlet must be at least 10 m above ground level.• The installation must keep a log of day-to-day consumption of toluene. This may bedone on the basis of the available information on paint consumption and paint contentof toluene. On each day of operation, the following must be recorded as necessary: Date,toluene consumption, plant operating period, and signature of the person keeping thelog.• The supervising authority must have access to the log, which must be stored at theinstallation for at least three years.

70
5.5.2 Example B. Installation with significant air pollution
An iron foundry emits sand dust from two outlets due to sand mixing andknocking-out castings: outlet 1(sand mixing) emits an air quantity of 40,000normal m3/hr, and outlet 2 (knocking out) emits an air quantity of 17,000normal m3/hr.
The emission concentration of the air prior to purification or abatement in thetwo outlets is between 300 and 1,000 mg dust/normal m3.
Calculations show that the total mass flow of the installation from the twooutlets is approximately 50 kg/hr on average over 7 hours.
The dust in the outlets is considered to be total dust, i.e. dust that containsparticles larger and smaller than 10 µm.
The dust belongs under table 9 of these Guidelines, “Other dust”, with amass flow limit of 5 kg/hr and an emission limit value of 10 mg/normal m3.
As the installation’s mass flow of sand is greater than the mass flow limit forother dust (5 kg/hr), and as the emission concentration in the two outlets forother dust is greater than the emission limit value for other dust, purificationor abatement is necessary. This may be carried out by means of bag filters,etc.
The AMS inspection limit for dust is 200 kg/hr.
As the AMS inspection limit for dust has not been exceeded, there is no needto use AMS.
The terms for air pollution from the installation and inspection hereof areas follows:
Outlet No. Pollutant Air quantity
normal m3/hr
Emission limit value
mg/normal m3
Outlet height,calculated using OML-Point or OML-Multi.
metres
No. 1 Sand dust 40,000 10 XNo. 2 Sand dust 17,000 10 Y
The emission limit values apply to both outlets (1 and 2).Outlet No. 1 must be at least X m above ground level.Outlet No. 2 must be at least Y m above ground level.
The sampling points in the outlets must be designed in accordance with guidelines inchapter 8 of the Danish EPA Guidelines for Air Emission Regulation.Documentation hereof must be submitted to the approving authority.
Inspection
Operating instructions for the filters must be available in the immediate vicinity ofthe filters. Operation and inspection of the bag filters must be carried out inaccordance with the manufacturer’s operating instructions. A weekly log must bekept of the inspection of filters to check that the bag filters are not worn out. Any

71
operating disruptions, breakdowns, and other relevant information must be recordedin the log, stating the date, year, and possibly time.
The log must be available for inspection by the supervising authority and must bestored at the installation for at least three years.
Not later than three months after the receipt of this approval, the installation mustcarry out an accredited performance inspection of outlets 1 and 2 in order todocument compliance with the emission limit value. Each performance measurementmust include at least three individual measurements, each lasting approximatelyone hour. This measurement must include measurement of the relevant air quantity.
When this has been completed, performance measurements must be carried out atleast once a year. However, if the result of a performance measurement is less than60 per cent of the emission limit value, such measurements need only be carried outevery second year.
The following method of measurement53 must be used:
Substance Method of measurementDust VDI 2066/7
Deviations from this method of measurement must be duly justified and approvedby the approving authority.
Inspection rules for performance inspection
The emission limit value is complied with when the arithmetic average of the three(or the relevant number) measurements carried out during the inspection period isless than or equal to the limit value. The inspection period is the total measurementperiod.
Operating terms must also be set.
5.5.3 Example C. Installation with very significant air pollution
An installation manufactures a number of organic coarse chemicals andorganic intermediates for other chemical industries. These products are usedas raw materials and intermediates by manufacturers in the pharmaceuticalssector.
Sulphur dioxide (SO2) is emitted through the installation outlet P. Theinstallation states that the mass flow of sulphur dioxide is approximately 300kg/hr, and that the air quantity in the outlet is approximately 1,000 normal m³/hr. The concentration prior to purification or abatement is approximately300 g/normal m³.
According to chapter 3 of these Guidelines, the mass flow limit for SO2 is5,000 g/hr. The emission limit value for SO2 is 400 mg/normal m³.
According to section 5.3.3.3, the AMS inspection limit for SO2 is 200 kg/hr.
As the installation’s mass flow of SO2 is greater than the mass flow limit forSO2, and as the emission of SO2 is greater than the emission limit value,
53 This method is recommended in the list of methods in chapter 8.

72
purification or abatement must be carried out in order to ensure compliancewith the emission limit value for SO2.
As the installation’s mass flow of SO2 is greater than the AMS inspection limit,the emissions must be inspected by means of AMS.
The outlet height has been determined by means of an OML calculation onthe basis of the relevant limit value for emissions and the maximum airquantity, and has been set at Z m above ground level.
The terms for air pollution from the installation and the inspection hereofare as follows:Emission limit value applying to outlet P:
Parameter Emission limit valuemg/normal m³
Outlet height, calculated usingOML-Point or OML-Multi. metres
SO2 400 Z
• The discharges from outlet P must be at least Z m above ground level.• The air quantity in outlet P must never exceed 1,200 normal m³/hr.• The purification or abatement plant must always be operating during production.
Inspection
Instruments and software (methods of analysis) intended for use in AMSmeasurements for SO2 must be approved by the supervisory authority before use.The instruments must be installed correctly at the point of measurement, and mustbe serviced and maintained regularly by qualified staff in accordance with themanufacturer’s directions. The procedures for operation and maintenance ofequipment must be available in a manual.
The air quantity must be checked when the plant is established.
The operating instructions must be available in the immediate vicinity of theequipment.
The measurement instruments must be calibrated in accordance with themanufacturer’s directions. In addition to this, parallel measurements must becarried out in the form of performance inspection. The first of these measurementsmust be carried out no later than two months after the installation begins operation,and once every year after that. These inspections must be carried out by anaccredited laboratory.
The following method of measurement must be used54:
Substance Method of measurement for AMSSO2 DS/ISO 7935
Deviations from this method of measurement must be duly justified and approvedby the approving authority.
The sampling points in the outlets must be designed in accordance with theguidelines featured in chapter 8.
54 See the list of methods in chapter 8.
73
All measurement data from the AMS measurements in outlet P must be continuallydisplayed on-screen and recorded. It must also be possible to have hourly and dailyvalues displayed on-screen. All measurement data must be stored for at least threeyears and must be presented to the supervising authority upon request.
Inspection rules for AMS measurements
The emission limit value is complied with when the arithmetic average of all one-hour measurements taken during the inspection period is less than or equal to thelimit value. The inspection period is one calendar month. Periods without anyemission of the relevant substance must not be included in the inspection period.
If a single one-hour measurement exceeds the emission limit value by a factor of 3 ormore, the supervising authority must be notified. At the same time, an account mustbe given of the reason behind this breach and of the measures taken, or about to betaken, in order to prevent future problems. In addition to this, intensifiedmonitoring of the equipment designed to limit pollution must be carried out. Thismust be done in consultation with the supervising authority.
Furthermore, operating terms must be set.

74
75
6 Energy plants
6.1 Introduction
The emission limit values featured in this section apply to all plants thatproduce power and heat. For example, a plant in which a substance is dried orconcentrated by using flue gas as the source of energy, but where there is nocontact between the gas and the substance/material being dried/concentrated,is considered an energy plant.
The main fuels used at energy plants in Denmark are natural gas, light fueloil, coal, and heavy fuel oil. Renewable fuels such as biogas, straw, and woodare also used. Dust is emitted from these plants in the form of soot, oil coke,NOX, etc., and polluting components arising from impurities in the fuel.Examples of such impurities are sulphur, chlorine, and fluorine, as well asashes containing heavy metals such as nickel, vanadium, etc.
Rules regarding the maximum sulphur content of fuels have been stipulated inorder to limit emissions of SO2. These rules can be found in the StatutoryOrder on limitation of sulphur content in fuel for heating and transport55 andthe Statutory Order on limitation of sulphur content in certain liquid fuels56.
Emissions of sulphur dioxide are normally proportional to the sulphur contentof the relevant fuel. In such cases, 0.02 kg SO2 is emitted per kilo fuel used perpercentage point sulphur.
Except in cases where special plants have been established to clean flue gas,emissions correspond to the content of the relevant substances in the fuelconcerned. Please note, however, that some of the substances emitted into theatmosphere are also bound in cinders and ashes to a lesser extent.
It is important that all energy plants are constructed, maintained and adjustedso that the inevitable pollution of the air is reduced to a minimum. The factthat there is some correlation between the concepts of minimum pollution andmaximum energy efficiency provides a double incentive to reduce pollutionfrom energy plants.
If a energy plant has equipment for flue-gas purification or abatement, suchequipment should be sufficiently effective to ensure that terms regardingemission limit values included in an approval can be met throughout theenergy plant’s entire life cycle and under all normal operating conditions. Thismeans that purification or abatement equipment at energy plants should bedesigned for emissions that are significantly lower than the limit values.
This section features special emission limit values from energy plants. Themass flow limits and emission limit values laid down in these Guidelines applyto all substances that are not expressly specified in connection with each item(energy plant). The C-values apply to all substances. Only in exceptional 55 Statutory Order No. 901 of 31 October 1994.56 Statutory Order No. 580 of 22 June 2000

76
cases will it be necessary to stipulate emission limit values other than thosespecified for each fuel type below.
The emission limit values for NOX in this chapter apply to all NOX convertedinto NO2.
For combustion plants with two-channel burners and modulating burners,outlet heights are calculated at various loads. The load resulting in the highestoutlet must be chosen.
Please note that the physical conditions mentioned below, e.g. calorific values,may change if the chemical composition of the fuel is changed.
6.2 Natural gas, LPG, and biogas
6.2.1 General information
Calorific value for natural gas:
Lower calorific value: approximately 48.6 MJ/kg orapproximately 39.3 MJ/normal m3.
Upper calorific value: approximately 56 MJ/kg.
When natural gas is burned, approximately 57 g CO2 /MJ is formed. WhenLPG is burned, approximately 65 g CO2/MJ is formed.
When 1 kg natural gas57 is burned, the following approximate quantity of fluegas is formed:
Equations 9 and 10
203 normal m3 dry flue gas21 - % O2
or
2.57 + 205 normal m3 wet flue gas 21-%O2
where % O2 denotes O2 content in the flue gas, expressed as a percentage by volume.
6.2.2 Gas motors and gas turbines using natural gas
Emissions from such plants are regulated in accordance with Statutory OrderNo. 720 of 5 October 1998 on the limitation of emissions of nitrogen oxides,unburned carbon hydrides and carbon monoxide from gas motors and gasturbines.
From 1 July 2003, an emission limit for formaldehyde of 10 mg/normal m3 at5 % O2 at an efficiency (in electricity production) of 30 per cent also appliesto gas motors with a total input effect of 5 MW or more. This limit value isadjusted upwards or downwards in equal proportion to the electricityefficiency.
57 Natural gas has a bulk density of approximately 0.8 kg/normal m3.

77
The emission of formaldehyde from gas turbines is significantly below thislimit value, and so there is no need to set an emission limit value for gasturbines.
The outlet height is determined by means of an OML calculation.
6.2.3 Combustion plants with an input effect of less than 120 kW
An input effect of 120 kW corresponds to consumption of approximately 8.6kg natural gas per hour.
The stack must be constructed in accordance with current regulations on gasand building construction.
6.2.4 Combustion plants with a total input effect of 120 kW or more, but lessthan 5 MW
Before purchasing new equipment, the installation should make sure that suchequipment complies with the following emission limit values:
NOX measured58 as NO2= 65 mg/normal m3 dry flue gas at 10 per cent O2.
CO = 75 mg/normal m3 dry flue gas at 10 per cent O2.
For existing plants, up to 125 mg NOX/normal m3 dry flue gas at 10 per centO2, measured as NO2, is acceptable.
Outlet heights are determined in accordance with current regulations on gasand construction or by means of an OML calculation.
An input effect of 5 MW corresponds to the consumption of approximately360 kg natural gas per hour.
6.2.5 Combustion plants with a total input effect of 5 MW or more, but less than50 MW
These plants should comply with the following emission limit values:
NOX measured as NO2 = 65 mg/normal m3 dry flue gas at 10 per cent O2.
CO = 75 mg/normal m3 dry flue gas at 10 per cent O2.
For existing plants, the environmental authorities may accept up to 125 mgNOX/normal m3 dry flue gas at 10 per cent O2 measured as NO2, if it turns outthat the emission limit value must be relaxed.
The outlet height is determined by means of an OML calculation.
An input effect of 50 MW corresponds to the consumption of approximately3.6 tonnes natural gas per hour.
58 See the example in section 3.2.5.2 on conversion of NOX into NO2

78
Example: Determining the emission limit value and outlet height for gas-fired plants with an input effect of 5 MW or more, but less than 50 MW
A plant states that the emission of NOX from their boiler plant, which uses natural gas,will be less than 50 mg/normal m3. It is stated that 90 per cent of the emitted quantity ofNOX is NO by weight. The rest is NO2. The approving authority approves the plant andsets a emission limit value of 65 mg NOX measured as NO2 pr. normal m3, which is theemission limit for NOX. The outlet height is determined on the basis of the assumptionthat half of the 65 mg NOX per normal m3 consists of NO2, see section 3.2.5.2.
6.2.6 Combustion plants with an input effect of 50 MW or more
More detailed provisions on plants with an input effect of 50 MW or more aregiven in Statutory Order No. 689 of 15 October 1990 on the limitation ofemissions of sulphur dioxide, nitrogen oxides and dust from large combustionplants, as amended by Statutory Order No. 518 of 20 June 1995.
For older plants, which do not fall within the scope of this Statutory Order,the various emission limits, inspection measures, etc., are set according to theBAT principle on the basis of a specific assessment, see chapter 1.
The outlet height is determined by means of an OML calculation.
6.2.7 Inspection
For gas-fired plants with an input effect of 5-30 MW, performanceinspections should be used to verify compliance with the limit values for NOX
and CO.
Gas-fired plants with an input effect of more than 30 MW should be fittedwith measurement and regulation equipment for oxygen (O2) to control theburning process. Such plants should also be fitted with AMS equipment forNOX. In addition to this, performance inspections should be used to verifycompliance with the limit value for CO.
If an emission limit value of formaldehyde is set, performance inspectionsshould be used to verify compliance with this limit value.
For plants with an input effect of 50 MW or more, refer to Statutory OrderNo. 689 of 15 October1990 on the limitation of emissions of sulphur dioxide, nitrogen oxides, anddust from large combustion plants, as amended by Statutory Order No. 518of 20 June 1995.
6.3 Light fuel oil
6.3.1 General information
Calorific value:Lower calorific value: approximately 43 MJ/kg.Upper calorific value: approximately 45 MJ/kg.
When light fuel oil is burned, approximately 74 g CO2 /MJ is formed.
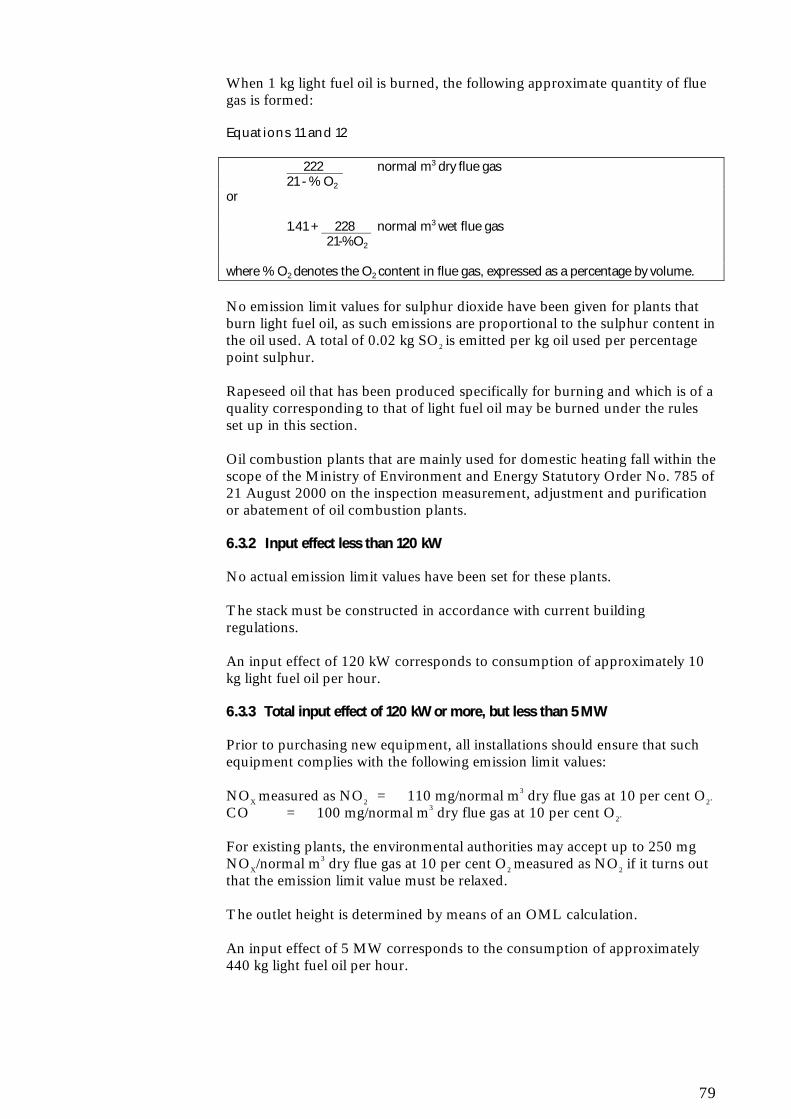
79
When 1 kg light fuel oil is burned, the following approximate quantity of fluegas is formed:
Equations 11 and 12
222 normal m3 dry flue gas21 - % O2
or
1.41 + 228 normal m3 wet flue gas 21-%O2
where % O2 denotes the O2 content in flue gas, expressed as a percentage by volume.
No emission limit values for sulphur dioxide have been given for plants thatburn light fuel oil, as such emissions are proportional to the sulphur content inthe oil used. A total of 0.02 kg SO2 is emitted per kg oil used per percentagepoint sulphur.
Rapeseed oil that has been produced specifically for burning and which is of aquality corresponding to that of light fuel oil may be burned under the rulesset up in this section.
Oil combustion plants that are mainly used for domestic heating fall within thescope of the Ministry of Environment and Energy Statutory Order No. 785 of21 August 2000 on the inspection measurement, adjustment and purificationor abatement of oil combustion plants.
6.3.2 Input effect less than 120 kW
No actual emission limit values have been set for these plants.
The stack must be constructed in accordance with current buildingregulations.
An input effect of 120 kW corresponds to consumption of approximately 10kg light fuel oil per hour.
6.3.3 Total input effect of 120 kW or more, but less than 5 MW
Prior to purchasing new equipment, all installations should ensure that suchequipment complies with the following emission limit values:
NOX measured as NO2 = 110 mg/normal m3 dry flue gas at 10 per cent O2.
CO = 100 mg/normal m3 dry flue gas at 10 per cent O2.
For existing plants, the environmental authorities may accept up to 250 mgNOX/normal m3 dry flue gas at 10 per cent O2 measured as NO2 if it turns outthat the emission limit value must be relaxed.
The outlet height is determined by means of an OML calculation.
An input effect of 5 MW corresponds to the consumption of approximately440 kg light fuel oil per hour.

80
6.3.4 Total input effect of 5 MW or more, but less than 50 MW
These plants should comply with the following emission limit values:
Dust = 30 mg/normal m3 dry flue gas at 10 per cent O2.
NOX measured as NO2 = 110 mg/normal m3 dry flue gas at 10 per cent O2.
CO = 100 mg/normal m3 dry flue gas at 10 per cent O2.
For existing plants, the environmental authorities may accept up to 250 mgNOX/normal m3 dry flue gas at 10 per cent O2, measured as NO2, if it turns outthat it is necessary to relax the emission limit value.
The outlet height is determined by means of an OML calculation.
An input effect of 50 MW corresponds to the consumption of approximately4.2 tonnes light fuel oil per hour.
6.3.5 Total input effect of 50 MW or more
More detailed provisions on light fuel oil fired plants with an input effect of 50MW or more are given in Statutory Order No. 689 of 15 October 1990 on thelimitation of emissions of sulphur dioxide, nitrogen oxides and dust from largecombustion plants, as amended by Statutory Order No. 518 of 20 June 1995.
For older plants, which do not fall within the scope of this Statutory Order,the various emission limits, inspection measures, etc., are set according to theBAT principle on the basis of a specific assessment, see chapter 1.
The outlet height is determined by means of an OML calculation.
6.3.6 Inspection
For light fuel oil fired plants with an input effect of 5-30 MW, compliancewith the limit values for NOX and CO should be checked by means ofperformance inspection.
Light fuel oil fired plants with an input effect of more than 30 MW should befitted with measurement and regulation equipment for oxygen (O2) to controlthe combustion process, and with AMS equipment for NOX. In addition tothis, performance inspections should be used to verify compliance with thelimit value for CO.
For plants with an input effect of 50 MW or more, refer to Statutory OrderNo. 689 of 15 October 1990 on the limitation of emissions of sulphur dioxide,nitrogen oxides and dust from large combustion plants, as amended byStatutory Order No. 518 of 20 June 1995.
6.4 Heavy fuel oil
This section applies to plants that burn heavy fuel oil, orimulsion, and fuels ofsimilar quality.
6.4.1 General information about heavy fuel oil
Calorific value:Lower calorific value: approximately 41 MJ/kg.
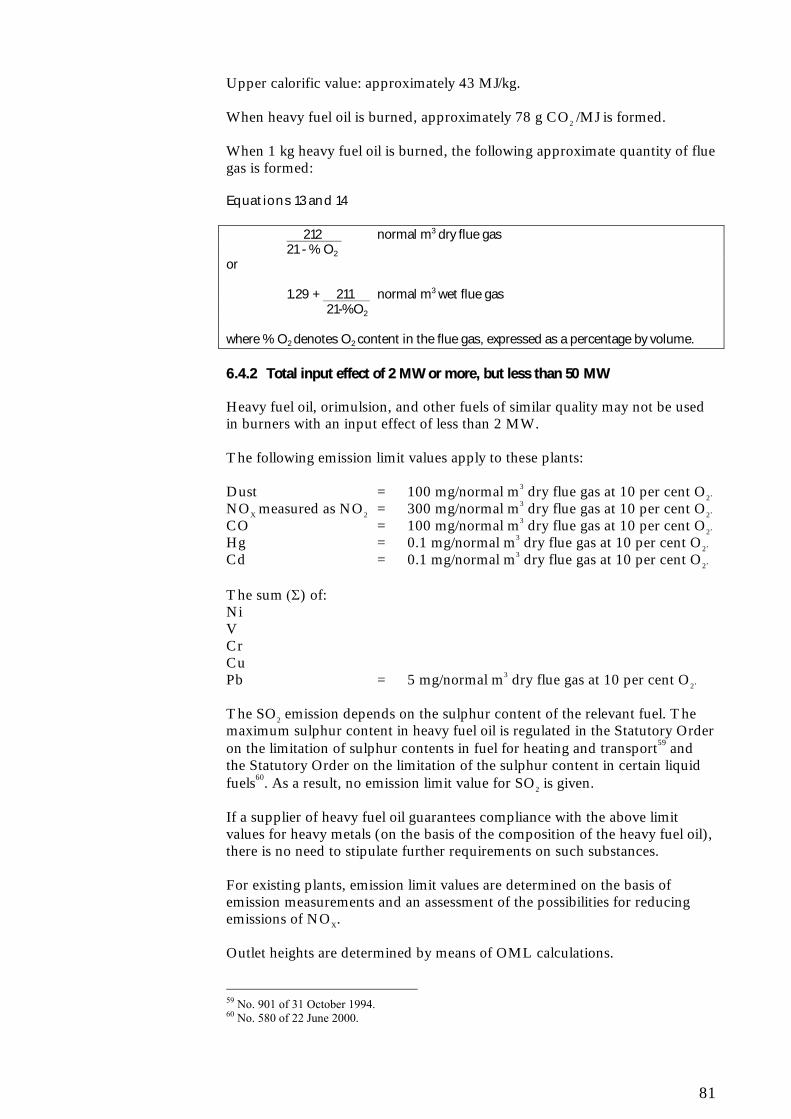
81
Upper calorific value: approximately 43 MJ/kg.
When heavy fuel oil is burned, approximately 78 g CO2 /MJ is formed.
When 1 kg heavy fuel oil is burned, the following approximate quantity of fluegas is formed:
Equations 13 and 14
212 normal m3 dry flue gas21 - % O2
or
1.29 + 211 normal m3 wet flue gas 21-%O2
where % O2 denotes O2 content in the flue gas, expressed as a percentage by volume.
6.4.2 Total input effect of 2 MW or more, but less than 50 MW
Heavy fuel oil, orimulsion, and other fuels of similar quality may not be usedin burners with an input effect of less than 2 MW.
The following emission limit values apply to these plants:
Dust = 100 mg/normal m3 dry flue gas at 10 per cent O2.
NOX measured as NO2 = 300 mg/normal m3 dry flue gas at 10 per cent O2.
CO = 100 mg/normal m3 dry flue gas at 10 per cent O2.
Hg = 0.1 mg/normal m3 dry flue gas at 10 per cent O2.
Cd = 0.1 mg/normal m3 dry flue gas at 10 per cent O2.
The sum (Σ) of:NiVCrCuPb = 5 mg/normal m3 dry flue gas at 10 per cent O2.
The SO2 emission depends on the sulphur content of the relevant fuel. Themaximum sulphur content in heavy fuel oil is regulated in the Statutory Orderon the limitation of sulphur contents in fuel for heating and transport59 andthe Statutory Order on the limitation of the sulphur content in certain liquidfuels60. As a result, no emission limit value for SO2 is given.
If a supplier of heavy fuel oil guarantees compliance with the above limitvalues for heavy metals (on the basis of the composition of the heavy fuel oil),there is no need to stipulate further requirements on such substances.
For existing plants, emission limit values are determined on the basis ofemission measurements and an assessment of the possibilities for reducingemissions of NOX.
Outlet heights are determined by means of OML calculations.
59 No. 901 of 31 October 1994.60 No. 580 of 22 June 2000.

82
6.4.3 Total input effect of 50 MW or more
An input effect of 50 MW corresponds to a consumption of 4.4 tonnes heavyfuel oil per hour.
For more detailed provisions on plants with an input effect of 50 MW ormore, refer to Statutory Order No. 689 of 15 October 1990 on the limitationof emissions of sulphur dioxide, nitrogen oxides and dust from largecombustion plants, as amended by Statutory Order No. 518 of 20 June 1995.
In addition to these requirements, all plants should comply with the followingemission limit values:
Hg = 0.1 mg/normal m3 dry flue gas at 10 per cent O2.
Cd = 0.1 mg/normal m3 dry flue gas at 10 per cent O2.
The sum (Σ) of:NiVCrCuPb = 5 mg/normal m3 dry flue gas at 10 per cent O2.
If a supplier of heavy fuel oil guarantees compliance with the above limitvalues for heavy metals (on the basis of the composition of the heavy fuel oil),there is no need to stipulate further requirements on such substances.
For older plants, which do not fall within the scope of this Statutory Order,the various emission limits, inspection measures, etc., are set according to theBAT principle on the basis of a specific assessment, see chapter 1.
The outlet height is determined by means of an OML calculation.
6.4.4 Inspection
For heavy fuel oil fired plants with an input effect of 5-30 MW, compliancewith the limit values for NOX and CO should be checked by means ofperformance inspection.
Fuel-oil-fired plants with an input effect of more than 30 MW should be fittedwith measurement and regulation equipment for oxygen (O2) to control thecombustion process. Such plants should also be fitted with AMS equipmentfor NOX. In addition to this, performance inspections should be used to verifycompliance with the limit value for CO.
Heavy fuel oil fired plants with an input effect of over 50 MW should be fittedwith AMS sampling apparatus for dust, SO2, NOX, and O2. Compliance withthe emission limit values for the heavy metals specified here should bechecked by means of performance inspection at least twice a year.
For more detailed provisions on plants with an input effect of 50 MW ormore, refer to Statutory Order No. 689 of 15 October 1990 on the limitationof emissions of sulphur dioxide, nitrogen oxides and dust from largecombustion plants, as amended by Statutory Order No. 518 of 20 June 1995.

83
Emissions of metals may often be calculated on the basis of the metal contentin the relevant fuel. In many cases, such calculations are sufficiently accurateto replace emission measurement.
6.5 Waste oil
Waste oil or oil waste is hazardous waste, but falls outside the scope of theregulations on incineration of hazardous waste, as specified in the Ministry ofEnvironment and Energy Statutory Order No. 660 on the approval, etc., ofplants incinerating hazardous waste, see Section 1 (5), 1st clause of this Order.Incineration of oil waste falls within the scope of special provisions; seeSection 57 and Appendix 11 of the Ministry of Environment and EnergyStatutory Order No. 619 of 27 June 2000 on Waste (the Waste Order). Wasteoil may only be incinerated at plants with a thermal output of more than 1MW.
Outlet heights are determined by means of an OML calculation.
6.5.1 Inspection
Appendix 11 of the Statutory Order on Waste states that it should be possibleto provide documentation of compliance with the emission limit values, eitherby means of calculations or emission measurements.
Measurements of emissions should be carried out by means of performanceinspection.
Waste oil fired plants with an input effect of more than 5 MW should be fittedwith measurement and regulation equipment for oxygen (O2) to control theincineration process. In addition to this, plants with an input effect of morethan 30 MW should also be fitted with AMS equipment for NOX.
Waste oil fired plants with an input effect of more than 50 MW should befitted with AMS equipment for dust, SO2, NOX, and O2. As regards thesubstances specified in Appendix 11 of the Statutory Order on Waste, theemission limit values should be checked by means of performance inspection.
6.6 Coal
This section includes plants that burn coal, pet-coke, and lignite or other fuelsof similar quality.
6.6.1 General information
Calorific value for coal:Lower calorific value: approximately 25 MJ/kg.Upper calorific value: approximately 26 MJ/kg.
When coal is burned, approximately 95 g CO2 /MJ is formed.
When 1 kg coal is burned, the following approximate quantity of flue gas isformed:
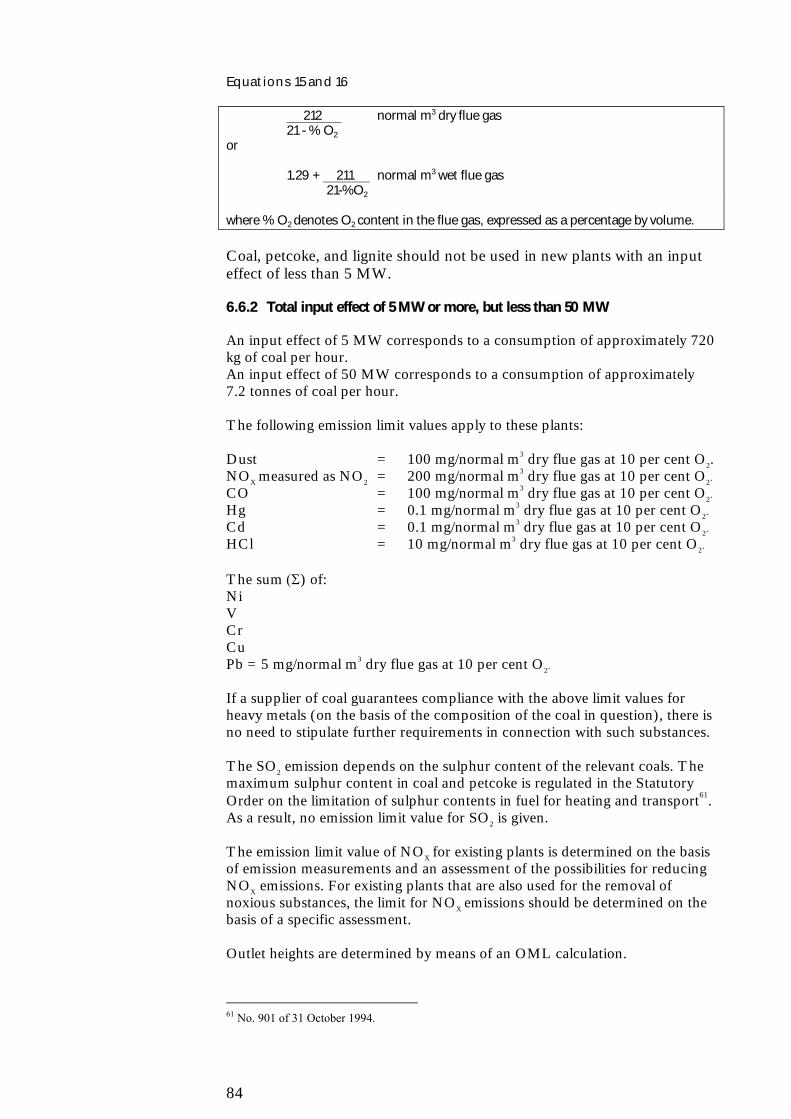
84
Equations 15 and 16
212 normal m3 dry flue gas21 - % O2
or
1.29 + 211 normal m3 wet flue gas 21-%O2
where % O2 denotes O2 content in the flue gas, expressed as a percentage by volume.
Coal, petcoke, and lignite should not be used in new plants with an inputeffect of less than 5 MW.
6.6.2 Total input effect of 5 MW or more, but less than 50 MW
An input effect of 5 MW corresponds to a consumption of approximately 720kg of coal per hour.An input effect of 50 MW corresponds to a consumption of approximately7.2 tonnes of coal per hour.
The following emission limit values apply to these plants:
Dust = 100 mg/normal m3 dry flue gas at 10 per cent O2.NOX measured as NO2 = 200 mg/normal m3 dry flue gas at 10 per cent O2.
CO = 100 mg/normal m3 dry flue gas at 10 per cent O2.
Hg = 0.1 mg/normal m3 dry flue gas at 10 per cent O2.
Cd = 0.1 mg/normal m3 dry flue gas at 10 per cent O2.
HCl = 10 mg/normal m3 dry flue gas at 10 per cent O2.
The sum (Σ) of:NiVCrCuPb = 5 mg/normal m3 dry flue gas at 10 per cent O2.
If a supplier of coal guarantees compliance with the above limit values forheavy metals (on the basis of the composition of the coal in question), there isno need to stipulate further requirements in connection with such substances.
The SO2 emission depends on the sulphur content of the relevant coals. Themaximum sulphur content in coal and petcoke is regulated in the StatutoryOrder on the limitation of sulphur contents in fuel for heating and transport61.As a result, no emission limit value for SO2 is given.
The emission limit value of NOX for existing plants is determined on the basisof emission measurements and an assessment of the possibilities for reducingNOX emissions. For existing plants that are also used for the removal ofnoxious substances, the limit for NOX emissions should be determined on thebasis of a specific assessment.
Outlet heights are determined by means of an OML calculation.
61 No. 901 of 31 October 1994.

85
6.6.3 Input effect of 50 MW or more
For more detailed provisions on plants with an input effect of 50 MW ormore, refer to Statutory Order No. 689 of 15 October 1990 on the limitationof emissions of sulphur dioxide, nitrogen oxides and dust from largecombustion plants, as amended by Statutory Order No. 518 of 20 June 1995.
In addition to these requirements, all plants should comply with the followingemission limit values:
HCl = 10 mg/normal m3 dry flue gas at 10 per cent O2.HF = 1.0 mg/normal m3 dry flue gas at 10 per cent O2.Hg = 0.1 mg/normal m3 dry flue gas at 10 per cent O2.
Cd = 0.1 mg/normal m3 dry flue gas at 10 per cent O2.
The sum (Σ) of:NiVCrCuPb = 5 mg/normal m3 dry flue gas at 10 per cent O2.
If a supplier of coal guarantees compliance with the above limit values forheavy metals (on the basis of the composition of the coal in question), there isno need to stipulate further requirements on such substances.
For older plants, which do not fall within the scope of the Statutory Order,emission limits, inspection, etc., is determined on the basis of specificassessment by means of the BAT principle. See chapter 1.
Outlet height is determined by means of an OML calculation.
6.6.4 Inspection
If limit values for heavy metals have been set for installations using coal-firedplants, performance inspections should be carried out to check compliancewith the emission limit value for the heavy metals specified.
Coal-fired plants with an input effect of more than 5 MW should be fittedwith automatic measuring equipment for measurement and registration ofdust emissions in accordance with the principle of opacity or methods ofsimilar quality. They should also be fitted with sampling apparatus andregulation equipment for O2 in order to control the burning process.
Coal-fired plants with an input effect of 5-30 MW should be monitored bymeans of performance inspections in order to verify compliance with the limitvalue for NOX. Plants with an input effect greater than 30 MW should also befitted with AMS equipment for measurement of NOX.
Coal-fired plants with an input effect of over 50 MW should be fitted withAMS equipment for dust, SO2, NOX, and O2. The emission limit value forheavy metals specified should be monitored by means of performanceinspection.
For plants with an input effect of 50 MW or more, please see Statutory OrderNo. 689 of 15 October 1990 on the limitation of emissions of sulphur dioxide,
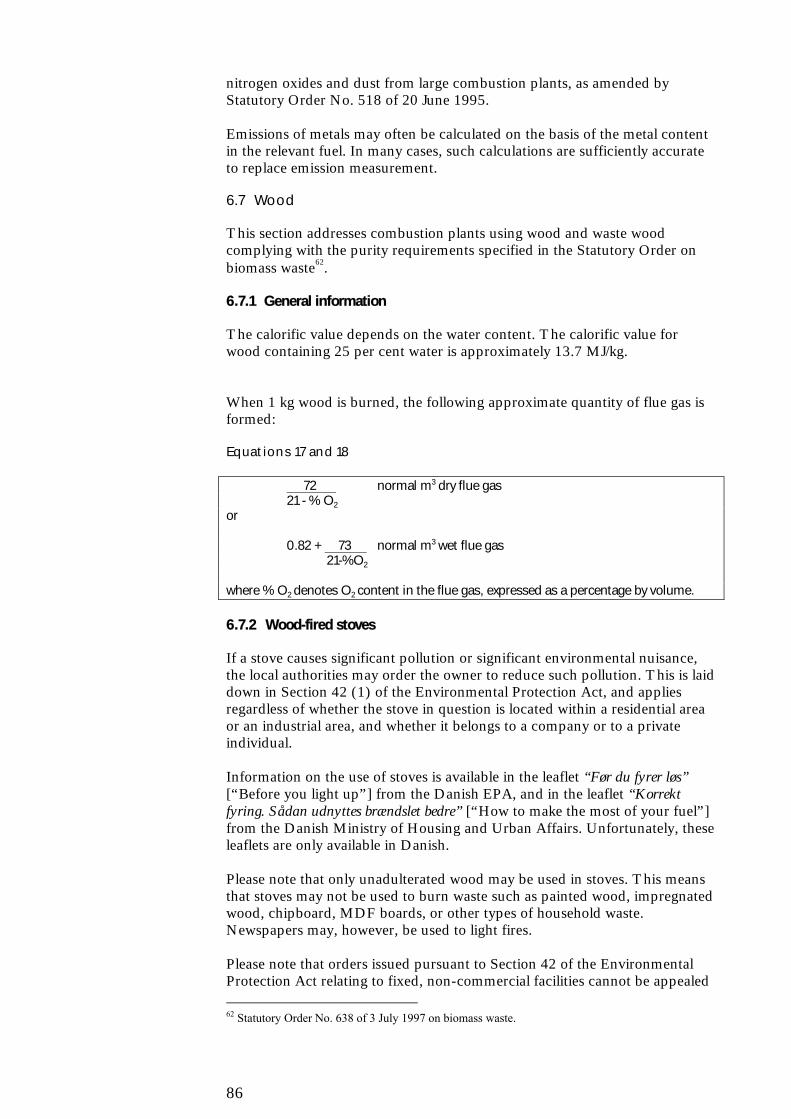
86
nitrogen oxides and dust from large combustion plants, as amended byStatutory Order No. 518 of 20 June 1995.
Emissions of metals may often be calculated on the basis of the metal contentin the relevant fuel. In many cases, such calculations are sufficiently accurateto replace emission measurement.
6.7 Wood
This section addresses combustion plants using wood and waste woodcomplying with the purity requirements specified in the Statutory Order onbiomass waste62.
6.7.1 General information
The calorific value depends on the water content. The calorific value forwood containing 25 per cent water is approximately 13.7 MJ/kg.
When 1 kg wood is burned, the following approximate quantity of flue gas isformed:
Equations 17 and 18
72 normal m3 dry flue gas21 - % O2
or
0.82 + 73 normal m3 wet flue gas 21-%O2
where % O2 denotes O2 content in the flue gas, expressed as a percentage by volume.
6.7.2 Wood-fired stoves
If a stove causes significant pollution or significant environmental nuisance,the local authorities may order the owner to reduce such pollution. This is laiddown in Section 42 (1) of the Environmental Protection Act, and appliesregardless of whether the stove in question is located within a residential areaor an industrial area, and whether it belongs to a company or to a privateindividual.
Information on the use of stoves is available in the leaflet “Før du fyrer løs”[“Before you light up”] from the Danish EPA, and in the leaflet “Korrektfyring. Sådan udnyttes brændslet bedre” [“How to make the most of your fuel”]from the Danish Ministry of Housing and Urban Affairs. Unfortunately, theseleaflets are only available in Danish.
Please note that only unadulterated wood may be used in stoves. This meansthat stoves may not be used to burn waste such as painted wood, impregnatedwood, chipboard, MDF boards, or other types of household waste.Newspapers may, however, be used to light fires.
Please note that orders issued pursuant to Section 42 of the EnvironmentalProtection Act relating to fixed, non-commercial facilities cannot be appealed
62 Statutory Order No. 638 of 3 July 1997 on biomass waste.
87
to any other administrative authority. This is specified in Section 19 ofStatutory Order No. 366 of 10 May 1992 on non-commercial animalhusbandry, unhygienic conditions, etc.
6.7.3 Input effect of 120 kW or more, but less than 1 MW
Before purchasing new plants of this type, all installations should make surethat they comply with the following emission limit values:
Dust = 300 mg/normal m3 dry flue gas at 10 per cent O2.CO = 500 mg/normal m3 dry flue gas at 10 per cent O2.
Outlet heights are determined by means of an OML calculation.
6.7.4 Total input effect of 1 MW or more, but less than 50 MW
The following emission limit values apply to these plants:
Dust = 40 mg/normal m3 dry flue gas at 10 per cent O2.63
NOX measured as NO2 = 300 mg/normal m3 dry flue gas at 10 per centO2
64.
CO = 625 mg/normal m3 dry flue gas at 10 per cent O2.
If, for example, condensing equipment is used, the emission limit value fordust may be relaxed to 100 mg/normal m3 dry flue gas at 10 per cent O2.
Outlet heights are determined by means of an OML calculation.
6.7.5 Input effect of 50 MW or more
Plants using wood and with an input effect of 50 MW or more fall within thescope of Statutory Order No. 689 of 15 October 1990 on the limitation ofemissions of sulphur dioxide, nitrogen oxides and dust from large combustionplants, as amended by Statutory Order No. 518 of 20 June 1995.
For older plants, which do not fall within the scope of this Statutory Order,the various emission limits, inspection measures, etc., must be set according tothe BAT principle on the basis of a specific assessment, see chapter 1.
Outlet heights are determined by means of an OML calculation.
6.7.6 Inspection
For wood-fired plants with an input effect greater than 1 MW but less than 5MW, performance inspection should be carried out to verify compliance withthe emission limit values.
Wood-fired plants with an input effect of 5 MW or more should be fitted withautomatic measuring equipment for measurement and registration of:
• Dust emissions in accordance with the principle of opacity or methodsof a corresponding quality, and
63 As a point of departure, this also applies to condensing wood-fired plants and plants without dustfilters.64 This only applies to plants with an input effect of 5 MW or more. When firing with wood chipswith high bark content and a large proportion of needles, the emission limit value may be raised to400 mg/normal m3
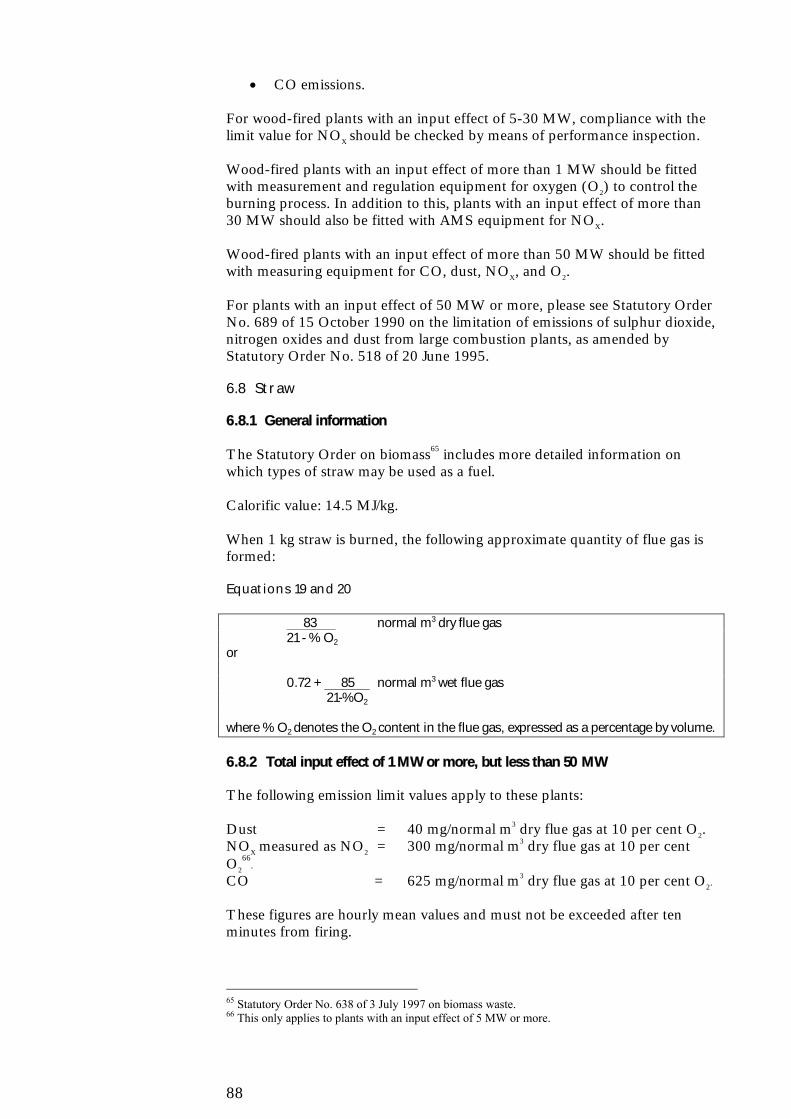
88
• CO emissions.
For wood-fired plants with an input effect of 5-30 MW, compliance with thelimit value for NOX should be checked by means of performance inspection.
Wood-fired plants with an input effect of more than 1 MW should be fittedwith measurement and regulation equipment for oxygen (O2) to control theburning process. In addition to this, plants with an input effect of more than30 MW should also be fitted with AMS equipment for NOX.
Wood-fired plants with an input effect of more than 50 MW should be fittedwith measuring equipment for CO, dust, NOX, and O2.
For plants with an input effect of 50 MW or more, please see Statutory OrderNo. 689 of 15 October 1990 on the limitation of emissions of sulphur dioxide,nitrogen oxides and dust from large combustion plants, as amended byStatutory Order No. 518 of 20 June 1995.
6.8 Straw
6.8.1 General information
The Statutory Order on biomass65 includes more detailed information onwhich types of straw may be used as a fuel.
Calorific value: 14.5 MJ/kg.
When 1 kg straw is burned, the following approximate quantity of flue gas isformed:
Equations 19 and 20
83 normal m3 dry flue gas21 - % O2
or
0.72 + 85 normal m3 wet flue gas 21-%O2
where % O2 denotes the O2 content in the flue gas, expressed as a percentage by volume.
6.8.2 Total input effect of 1 MW or more, but less than 50 MW
The following emission limit values apply to these plants:
Dust = 40 mg/normal m3 dry flue gas at 10 per cent O2.NOX measured as NO2 = 300 mg/normal m3 dry flue gas at 10 per centO2
66.
CO = 625 mg/normal m3 dry flue gas at 10 per cent O2.
These figures are hourly mean values and must not be exceeded after tenminutes from firing.
65 Statutory Order No. 638 of 3 July 1997 on biomass waste.66 This only applies to plants with an input effect of 5 MW or more.
89
Due to the risk of nuisance caused by smoke, it is recommended that newplants should be 200 m or more from the nearest dwelling.
The outlet height is determined by means of an OML calculation.
6.8.3 Input effect of 50 MW or more
Straw-fired plants with an input effect of 50 MW or more fall within thescope of Statutory Order No. 689 of 15 October 1990 on the limitation ofemissions of sulphur dioxide, nitrogen oxides and dust from large combustionplants, as amended by Statutory Order No. 518 of 20 June 1995.
For older plants, which do not fall within the scope of this Statutory Order,the various emission limits, inspection measures, etc., are set according to theBAT principle on the basis of a specific assessment, see chapter 1.
The outlet height is determined by means of an OML calculation.
6.8.4 Inspection
For straw-fired plants with an input effect greater than 1 MW but less than 5MW, performance inspection should be carried out to verify compliance withthe emission limit values.
Straw-fired plants with an input effect of 5 MW or more should be fitted withautomatic measuring equipment for measurement and registration of:
• Dust emissions in accordance with the principle of opacity or methodsof a corresponding quality, and
• CO emissions.
For straw-fired plants with an input effect of 5-30 MW, compliance with thelimit value for NOX should be checked by means of performance inspection.
Straw-fired plants with an input effect of more than 1 MW should be fittedwith measurement and regulation equipment for oxygen (O2) to control thecombustion process. In addition to this, plants with an input effect of morethan 30 MW should also be fitted with AMS equipment for NOX.
Straw-fired plants with an input effect greater than 50 MW should be fittedwith measuring equipment for CO, dust, NOX, and O2.
For plants with an input effect of 50 MW or more, refer to Statutory OrderNo. 689 of 15 October 1990 on the limitation of emissions of sulphur dioxide,nitrogen oxides and dust from large combustion plants, as amended byStatutory Order No. 518 of 20 June 1995.
6.9 Biomass waste
6.9.1 General information
Statutory Order No. 638 of 3 July 1997 on biomass waste and its Annexprovide more detail on the types of biomass waste accepted for use as fuel.

90
6.9.2 Input effect of 120 kW or more but less than 1 MW
Before purchasing new plants, all installations should make sure that suchplants comply with the following emission limit values:
Dust = 300 mg/normal m3 dry flue gas at 10 per cent O2.CO = 500 mg/normal m3 dry flue gas at 10 per cent O2.
The outlet height is determined by means of an OML calculation.
6.9.3 Total input effect of 1 MW or more, but less than 50 MW
The following emission limit values apply to these plants:
Dust = 40 mg/normal m3 dry flue gas at 10 per cent O2.NOX measured as NO2 = 300 mg/normal m3 dry flue gas at 10 per centO2
67.
CO = 625 mg/normal m3 dry flue gas at 10 per cent O2.
The outlet height is determined by means of an OML calculation.
6.9.4 Input effect of 50 MW or more
Plants with an input effect of 50 MW or more fall within the scope ofStatutory Order No. 689 of 15 October 1990 on the limitation of emissions ofsulphur dioxide, nitrogen oxides and dust from large combustion plants, asamended by Statutory Order No. 518 of 20 June 1995.
For older plants, which do not fall within the scope of this Statutory Order,the various emission limits, inspection measures, etc., must be set according tothe BAT principle on the basis of a specific assessment, see chapter 1.
Outlet heights are determined by means of an OML calculation.
6.9.5 Inspection
For biomass-fired plants with an input effect greater than 1 MW, but less than5 MW, performance inspection should be carried out to verify compliancewith the emission limit values.
Biomass-fired plants with an input effect of 5 MW or more should be fittedwith automatic measuring equipment for measurement and registration of:
• Dust emissions in accordance with the principle of opacity or methodsof a corresponding quality, and
• CO emissions.
For biomass-fired plants with an input effect of 5-30 MW, compliance withthe limit value for NOX should be checked by means of performanceinspection.
Biomass-fired plants with an input effect of more than 1 MW should be fittedwith measurement and regulation equipment for oxygen (O2) to control the
67 This only applies to plants with an input effect of 5 MW or more. When firing with wood chipswith high bark content and a large proportion of needles, the emission limit value may be raised to400 mg/normal m3

91
combustion process. In addition to this, plants with an input effect of morethan 30 MW should also be fitted with AMS equipment for NOX.
Biomass-fired plants with an input effect greater than 50 MW should be fittedwith measuring equipment for CO, dust, NOX, and O2.
For plants with an input effect of 50 MW or more, refer to Statutory OrderNo. 689 of 15 October 1990 on the limitation of emissions of sulphur dioxide,nitrogen oxides and dust from large combustion plants, as amended byStatutory Order No. 518 of 20 June 1995.
6.10 Waste incineration plants
As regards waste incineration plants, a distinction is made between plantsburning hazardous waste, and plants that burn household waste, commercialwaste, etc.
Plants burning hazardous waste are regulated in Statutory Order No. 660 of 11August 1997 on the approval, etc., of plants burning hazardous waste.
However, incineration of oil waste, which is also a hazardous waste, does notfall within the scope of Statutory Order No. 660/1997. Instead, suchincineration falls within the scope of special provisions, see Appendix 11 inStatutory Order No. 619 of 27 June 2000 on waste. Oil waste may only beincinerated at plants with a thermal output of more than 1 MW. See alsosection 6.5.
More detailed rules on plants incinerating non-hazardous waste are laid downin Statutory Order No. 41 of 14 January 1997 on waste incineration plants68
and in the Danish EPA Guidelines No. 2/1993 on the limitation of pollutionfrom incineration plants.
Outlet heights are determined by means of an OML calculation.
6.10.1 Inspection
The Statutory Orders specified above feature inspection regulations for theincineration of waste.
6.11 Calorific value, conversion factors, NOX, methods ofmeasurement, etc.
6.11.1 Calorific value
The calorific value is a measure for the amount of heat released uponcombustion. A distinction is made between the concepts “lower” and “upper”calorific value. The lower (effective) calorific value describes the quantity ofheat which is usually utilised by an energy plant. The upper (calorimetric)calorific value includes the heat that is released from condensation of flue-gascontent of steam (water vapour).
68 See Directive 2000/76/EC on waste incineration. This Directive addresses both hazardous and non-hazardous waste. There will be consultation on a Statutory Order.

92
The calorific value for each type of fuel is specified under the heading”General information” in each section.
6.11.2 Conversion from ppm to mg/normal m2
• 1 ppm SO2 = 2.93 mg/normal m3 SO2 at 0°C and 101.3 kPa.• 1 ppm NO = 1.34 mg/normal m3 NO at 0°C and 101.3 kPa.• 1 ppm NO2 = 2.05 mg/normal m3 NO2 at 0°C and 101.3 kPa.• 1 ppm CO = 1.25 mg/normal m3 CO at 0°C and 101.3 kPa.• 1 ppm CO2 = 1.98 mg/normal m3 CO2 at 0°C and 101.3 kPa.
6.11.3 NOX
NOX is the name used for the sum of the following nitrogen oxides: nitrogenmonoxide (NO) and nitrogen dioxide (NO2).
When determining emissions of NOX, all NOX must be converted into NO2. Inpractice, emissions of NO and NOX are measured in ppm. The resultantvalues are totalled, and the sum is converted into mg/normal m3 NO2 bymeans of the conversion factor for NO2.
See also the example of a conversion from NOX to NO2 in section 3.2.5.2.
When standard fuels are burned, the resultant NOX comprises approximately10 per cent NO2 and 90 per cent NO.
This does not apply to gas motors69, which generate significantly more NO2.
6.11.4 Measurements and methods of measurement
Measurements should generally be carried out by installations or persons withthe appropriate accreditation; see section 5.3.2 for more details. Chapter 8describes methods of measurement and sample extraction.
69 For gas motors, please contact the Danish Gas Technology Centre (DGC), Dr. Neergaards Vej 5A,2970Hørsholm. Tel.: (+45) 45 76 60 44. www.dgc.dk.
93
7 Design and operation of tanks andsilos
7.1 Introduction
Tanks are normally used to store liquid substances, whereas silos are used tostore solid substances. For the purposes of these Guidelines, “Very noxioussubstances” means substances that are present in the gaseous phase inconcentrations corresponding to more than 100,000 LE/m3 at the storagetemperature.
Tanks to be used for gaseous substances are not included.
There is no need to carry out OML calculations for tanks and silos.
7.2 Tanks
7.2.1 Storage tanks for principal group 1 substances and very noxioussubstances70
7.2.1.1 Design of tanksThe exterior walls and roofs of tanks situated above ground should be paintedin a colour with a total reflection coefficient for radiant heat of at least 70 percent. For existing tanks, this can be carried out as part of standard regularmaintenance work. This requirement regarding paint does not, however,apply to tanks linked to a condensation plant or other air-cleaning plants.
7.2.1.2 Existing tanks with external floating roofsTanks with external floating roofs and intended for storage of principal group1 substances and very noxious substances should be fitted with a primary seal,covering the ring-shaped gap between the tank walls and the outercircumference of the floating roof. They should also be fitted with a secondaryseal above the primary seal. These seals should be designed so that at least 95per cent of the vapours are retained when compared to corresponding tankswith fixed roofs which are not fitted with equipment designed to retainvapours (i.e. tanks with fixed roofs, fitted with a pressure/vacuum safety valveonly).
7.2.1.3 New tanksAll new tanks should be constructed either as tanks with fixed roofs linked to acondensation plant (air-cleaning plant) or designed with an external orinternal floating vapour barrier with a primary and secondary seal that meetsthe requirements stipulated in section 7.1.1.2.
70 Storage of petrol must be in accordance with Statutory Order from the Ministry of Energy andEnvironment No. 852 of 11 November 1995 on the limitation of emissions of vapours from storageand distribution of petrol. Appendix 2 of this Statutory Order includes a number of provisions onstorage plants at terminals.
94
7.2.1.4 Existing tanks with fixed roofsExisting tanks with fixed roofs should either be linked to a condensation plantin accordance with the provisions laid down in Appendix 3 of Statutory OrderNo. 852 of 11 November 1995, or be fitted with an internal floating vapourbarrier with a primary seal, constructed in a way that a total of at least 90 percent of the vapours are retained when compared with corresponding tankswith fixed roofs and not fitted with equipment designed to retain vapours.
7.2.1.5 Filling tanksTanks should be filled by injecting liquid below the surface level inside thetank.
Example of storage in a closed system
In 1998, a Danish refinery built a new three-cut splitter for distillation of benzene. Thefractionation column distils 250 tonnes of benzene from petrol every 24 hours, thusensuring that the Danish requirements for a maximum benzene content in petrol of 1 percent are complied with. In this connection, the installation constructed a new closedsystem, encompassing the fractionating column, storage, and distribution of benzene.
7.2.2 Storage tanks for principal group 2 substances, including diesel oil andother substances not mentioned under 7.1.1
The guidelines specified below apply to tanks larger than 50 m3.
7.2.2.1 StorageProducts with a vapour pressure greater than 1.3 kPa71
should be stored intanks with fixed roofs. These tanks should be linked to a condensation plant inaccordance with the provisions laid down in Appendix 3 of the StatutoryOrder on the limitation of emissions of vapours from storage and distributionof petrol. They may also, however, be fitted with an internal float with aprimary seal, which should be constructed in a way that a total of at least 90per cent of the vapours are retained when compared to corresponding tankswith fixed roofs and not fitted with equipment designed to retain vapours.
Products with vapour pressures less than 1.3 kPa (diesel oil, heavy fuel oil,and other substances with similar vapour pressures) should be stored in tankswith fixed roofs and a pressure/vacuum valve. Pressure/vacuum valves may beomitted on existing tanks not constructed for varying pressures correspondingto the range of the pressure/vacuum valve.
7.2.2.2 Painting tanksThe exterior walls and roofs of tanks situated above ground level should bepainted in a colour with a total reflection coefficient for radiant heat of at least70 per cent. For existing tanks, this can be carried out as part of standardregular maintenance work.
7.2.2.3 Filling tanksTanks should be filled by injecting all liquids below the surface level withinthe tank.
71 In this context, “vapour pressure” means the vapour pressure of the substance within the tank at therelevant storage temperature.

95
7.3 Silos
Silos for storage of solid substances should be fitted with suitable filters (V-pocket filters or filter cartridges), so that the limit values for emissions set upin these Guidelines for Air Emission Regulation can be complied with inconnection with filling the silo.
Example of air terms for a silo filter
An installation using hydrated lime in its production stores the lime in asilo. This silo must be equipped with an effective silo filter capable ofretaining emissions of hydrated lime during injection into the silo. Thisfilter must be able to reduce emissions to less than 10 mg/normal m3.

96
97
8 Measurement of emissions frominstallations causing air-polluting
8.1 Introduction
The objective of this chapter is to provide guidelines on how to carry outmeasurements of emissions into air. It will describe methods of sampling andanalysis, and set up guidelines on the design of sample-extraction sites, and onthe measurement report.
8.2 List of recommended methods from the Danish EnvironmentalProtection Agency
The Danish EPA reference laboratory for measurement of emissions into air[hereafter referred to as “the reference laboratory”] has published (at the endof 2000) a list of recommended methods regarding performance monitoring,AMS, and random testing. The list also includes method sheets with standardoperating procedures for a number of common emission parameters(substances), as well as a method sheet for planning and reporting emissionmeasurements.
The list of recommended methods is available on the reference laboratorywebsite72, where the full text in the method sheets can be seen anddownloaded.
8.2.1 List of recommended methods, performance monitoring, and randomtesting
The recommended methods are listed in table 11. It is recommended to usethese methods for performance monitoring and random testing. In specialcases, it may be appropriate to apply modifications to these methods, or to useother methods of measurement than those recommended. In such cases, thechoice of method should be justifiable and approved by the supervisoryauthority before measurement is carried out. If in doubt, please contact thereference laboratory.
8.2.2 List of recommended methods from the Danish Environmental ProtectionAgency
8.2.2.1 Performance monitoring and random testingTable 11 features a list of recommended methods for parameters73, based onthe national and international standards available. 72 http://www.dk-teknik.dk/ref-lab/ref-lab.asp Address: Gladsaxe Møllevej 15, DK-2860 Søborg. Tel.(+45) 39 55 59 99

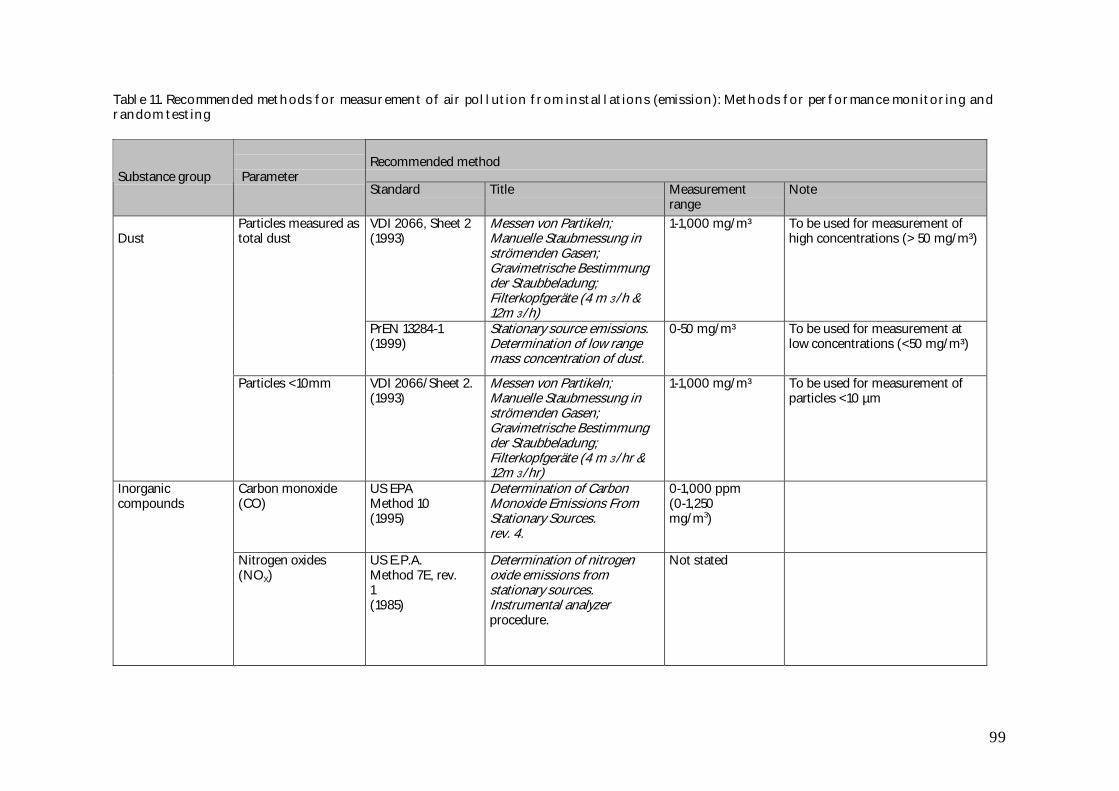
99
Table 11. Recommended methods for measurement of air pollution from installations (emission): Methods for performance monitoring andrandom testing
Recommended methodSubstance group Parameter
Standard Title Measurementrange
Note
VDI 2066, Sheet 2(1993)
Messen von Partikeln;Manuelle Staubmessung inströmenden Gasen;Gravimetrische Bestimmungder Staubbeladung;Filterkopfgeräte (4 m 3 /h &12m 3 /h)
1-1,000 mg/m³ To be used for measurement ofhigh concentrations (> 50 mg/m³)
Particles measured astotal dust
PrEN 13284-1(1999)
Stationary source emissions.Determination of low rangemass concentration of dust.
0-50 mg/m³ To be used for measurement atlow concentrations (<50 mg/m³)
Dust
Particles <10mm VDI 2066/Sheet 2.(1993)
Messen von Partikeln;Manuelle Staubmessung inströmenden Gasen;Gravimetrische Bestimmungder Staubbeladung;Filterkopfgeräte (4 m 3 /hr &12m 3 /hr)
1-1,000 mg/m³ To be used for measurement ofparticles <10 µm
Carbon monoxide(CO)
US EPAMethod 10(1995)
Determination of CarbonMonoxide Emissions FromStationary Sources.rev. 4.
0-1,000 ppm(0-1,250mg/m3)
Inorganiccompounds
Nitrogen oxides(NOX)
US E.P.A.Method 7E, rev.1(1985)
Determination of nitrogenoxide emissions fromstationary sources.Instrumental analyzerprocedure.
Not stated
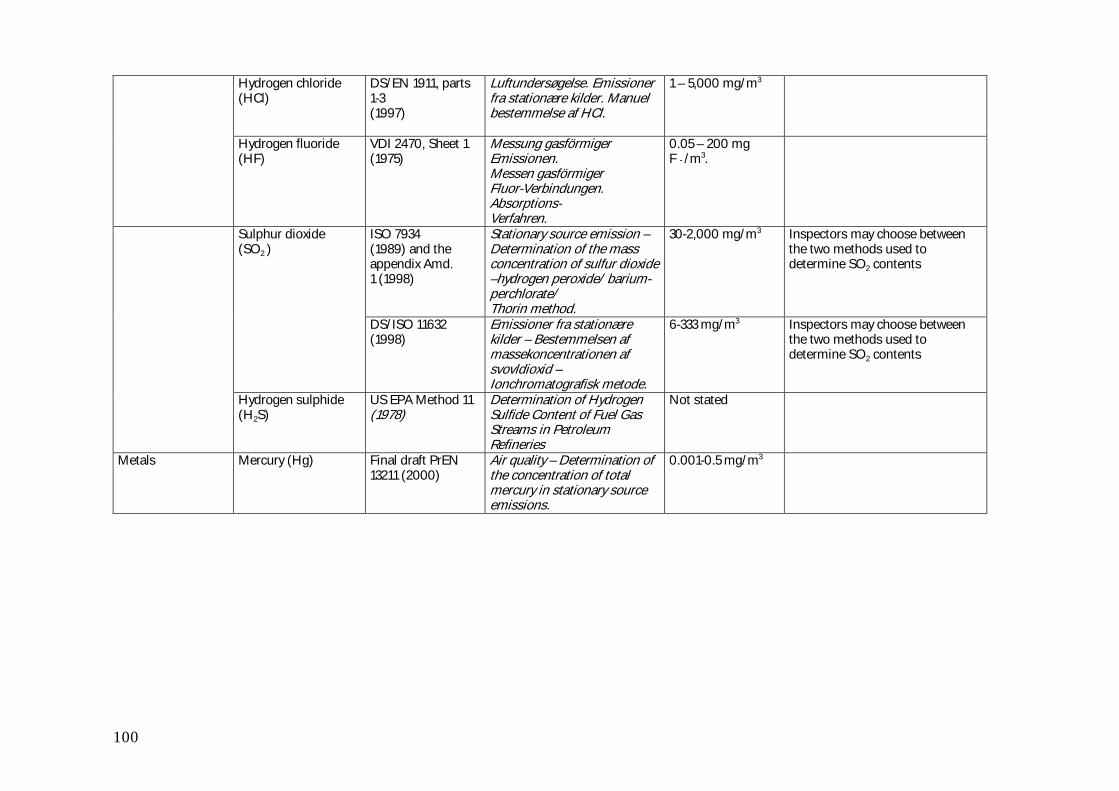
100
Hydrogen chloride(HCl)
DS/EN 1911, parts1-3(1997)
Luftundersøgelse. Emissionerfra stationære kilder. Manuelbestemmelse af HCl.
1 – 5,000 mg/m3
Hydrogen fluoride(HF)
VDI 2470, Sheet 1(1975)
Messung gasförmigerEmissionen.Messen gasförmigerFluor-Verbindungen.Absorptions-Verfahren.
0.05 – 200 mgF - /m3.
ISO 7934(1989) and theappendix Amd.1 (1998)
Stationary source emission –Determination of the massconcentration of sulfur dioxide–hydrogen peroxide/ barium-perchlorate/Thorin method.
30-2,000 mg/m3 Inspectors may choose betweenthe two methods used todetermine SO2 contents
Sulphur dioxide(SO2 )
DS/ISO 11632(1998)
Emissioner fra stationærekilder – Bestemmelsen afmassekoncentrationen afsvovldioxid –Ionchromatografisk metode.
6-333 mg/m3 Inspectors may choose betweenthe two methods used todetermine SO2 contents
Hydrogen sulphide(H2S)
US EPA Method 11(1978)
Determination of HydrogenSulfide Content of Fuel GasStreams in PetroleumRefineries
Not stated
Metals Mercury (Hg) Final draft PrEN13211 (2000)
Air quality – Determination ofthe concentration of totalmercury in stationary sourceemissions.
0.001-0.5 mg/m3

101
Metals (continued) Arsenic (As),Cadmium(Cd), Cobalt (Co),Chromium (Cr),Copper (Cu),Manganese (Mn),Nickel (Ni), Lead Pb),Antimony (Sb),Thallium (Tl), andVanadium (V).
CEN/TC 264 N404(WI 00264013)(2000)
Determination of TotalEmission of Specific Elements.
No final range Not yet adopted by the CEN, butsufficiently far advanced to berecommended as a method.Until this standard is formallyadopted, US EPA Method 29, VDI3868 Bl.1 and VDI 2268 may beused. Particles should bemeasured according to US EPAMethod 29 (plan filter), Gaseousmetals should be measuredaccording to VDI 3868 Bl. 1, anddigestion of filter and analysesshould be carried out according toVDI 2268.
Volatile organiccompounds(VOC)
Total organic carbon(TOC)
EN 12619:1999 Stationary source emissionsDetermination of the massconcentration of total gaseousorganic carbon at lowconcentrations in flue gasses –continuous flame ionisationdetector method
0-20mg C/m³(n) Used for measurement of fluegases.The measurement range may beextended until a new standardbecomes available formeasurement of flue gases at highlevels, (prEN 13526) is available.
VDI 3481 sheet 3(1995)
Determination of volatileorganic compounds, especiallysolvents – FID
From 1-2 mg C/m³ Used for measurement in outletswithout combustion.
Volume flow ISO 10780 (1994) Stationary Source Emissions –Measurement of velocity andvolume flow-rate of gasstreams in ducts
5- 50 m/s
Carbon dioxide (CO2)Oxygen (O2)
US EPA Method 3A(1989)
Determination of Oxygen andCarbon DioxideConcentrations in EmissionsFrom Stationary Sources
Not stated
Water (H2O) US EPA Method 4(1977) (Rev. 3,5/94)
Determination of MoistureContent in Stack Gases
Not stated
Secondaryparameters
Secondaryparameters(continued)
Temperature IEC Publication584-2 (1989)
Thermocouples Down to -40 °C, upto 1,600 °C(depending ontype) (toleranceclass 2).
102
8.2.3 List of methods, AMS
Use of the methods of measurement listed in table 12 below is recommended in connection with AMS. In special cases, it may be appropriateto apply modifications to these methods, or to use other methods of measurement than those recommended here. In such cases, the choice ofmethod should be well founded and approved by the supervisory authority before measurement is carried out.
8.2.3.1 Measurement of installationGenerally speaking, these standards do not include measurement ranges. Instead, the requirements are related to measurement ranges and/orconcentrations measured.

103
Table 12. Recommended methods for measurement of air pollution from installations (emission): Methods for installation measurementusing Automatic Measuring Systems (AMS)
Recommended methodSubstance group Parameter
Standard Title Note
Dust Particles measured astotal dust
DS/ISO 10155(1995)
Emissioner fra stationære kilder.Automatisk overvågning af partikel-mængder.Præstationskrav, prøvningsmetoder ogspecifikationer.
(Translation)Emissions from stationarysources.Automated monitoring of particlequantity.Performance requirements,sampling methods andspecifications.
Carbon monoxide(CO)Carbon dioxide (CO2)Oxygen (O2)
ISO/CD 12039.2(1995)
Stationary source emissions –Determination of the volumetric concentration ofCO, CO2 and oxygen. Performance characteristicsand calibration of an automated measuring system
Nitrogen oxides(NOX)
DS/ISO 10849(1996)
Emissioner fra stationære kilder.Bestemmelse af nitrogenoxid-koncentrationen.Funktionsdata for automatisk måleudstyr.
(Translation)Emissions from stationarysources.Determination of concentration ofnitrogen oxide.Performance characteristics andcalibration of an automatedmeasuring system
Inorganiccompounds
Sulphur dioxide(SO2)
DS/ISO 7935(1996)
Emissioner fra stationære kilder –Bestemmelse af svovldioxin- koncentrationer –Præstationskrav for automatiske målemetoder.
(Translation)Emissions from stationarysources.Determination of sulphur dioxideconcentrations.Performance requirements forautomated measuring methods.
104
8.2.3.2 Design of sampling siteFor the purposes of these Guidelines, ”sampling site” means the area of spacerequired for a sampling location, i.e. the area where sampling equipment isplaced, and from where sampling technicians are able to handle and operatesuch equipment.
Note that all access to sampling sites must be entirely safe and in accordancewith current regulations issued by the Danish Working EnvironmentAuthority.
It is necessary to distinguish between designs of sampling sites at large-scaleinstallations, where measurement is carried out regularly, and smallinstallations, such as outlets, where only very few measurements may be calledfor. This makes it unfeasible to establish definite guidelines. The following,however, gives some recommendations which should be observed at large-scale installations where repeated measurements are called for, and wheremeasurement is carried out at heights greater than 6 m above ground level:
Sampling sites should• be 3-5 m² in size (the exact size of the sampling platform depends on
the type of measuring equipment used),• be able to support a point load of at least 400 kg,• have handrails built with kickboard approximately 0.25 m in height
and two rails at heights of approximately 0.5 m and 1.2 m,• be situated in a manner ensuring that the railings do not obstruct
access to sampling apparatus,• include stairs or a fixed ladder leading to the sampling site. Where the
stairs or ladder meet the sampling site, the railings must have gatesthat close automatically or a similar safety device,
• feature 230V electric connections,• have a pulley or similar device to lift equipment,• have good lighting and ventilation,• include protection against severe weather,• have a non-skid surface.
The conditions regarding safety at sampling sites are regulated by the DanishWorking Environment Authority. This means that no terms should beincluded in environmental approvals for these facilities.
8.2.3.3 Design of sampling locationFor the purposes of these Guidelines, “sampling location” means the pointwhere emission measurement is carried out within a given duct. Samplinglocations in stacks or ventilation ducts are typically made accessible by meansof nozzles for securing exhaust probes
The location of such sampling locations and the number of sampling ports ina certain duct are very significant for the quality of the measurement results.
8.2.3.3.1 Particle measurements and volume-flow measurementsAs gas velocities, particle concentrations, and distributions of particle sizesmay vary within a given duct cross-section, sampling locations should bedesigned to facilitate extraction of representative samples in the gas flow. Thisis ensured by creating opportunities for traversing across the entire duct crosssection, by inducing good gas mixture (i.e. avoiding layering), and by creatinguniform flow conditions throughout the entire cross section.
105
8.2.3.4 Location of sampling location• Cross sections for measurement should be placed at a right angle to
the gas flow.• Where possible, sampling locations should be located in vertical ducts.• Horizontal ducts should be rectangular.• There should be a straight section M1 without obstacles before the
sampling location. For circular ducts, the length of M1 should be atleast 5 x D, and for rectangular ducts, M1 should be at least 2.5 x (H +W). At existing installations, a shorter straight section is acceptable ifthe number of sampling points is increased, see section 8.2.3.6.• D = inside diameter of a circular duct.• H = inside height of a rectangular duct.• W = inside width of a rectangular duct.
• There should be a straight section M2 without obstacles after thesampling location. For circular ducts, the length of M2 should be atleast 1 x D, and for rectangular ducts, M2 should be at least 0.5 x (H +W). (At existing installations, a shorter straight section is acceptable ifthe number of sampling points is increased, see section 8.2.3.6.
• There should be a straight section M2 after the sampling location andbefore the opening of the outlet of at least 5 x D or 2.5 x (H + W) inlength.
• If the gases in a duct rotate, a flow straightening device should befitted before the entrance of the straight section of the duct.
• Sampling locations should be located in a manner ensuring that theydo not interfere with AMS measurements or reference measurements.
If the measurement technician considers that a given sampling location hasnot been designed in accordance with current regulations, and that this factentails greater uncertainty as to measurement results, the relevant installationand supervisory authorities should be notified before measurementcommences.
8.2.3.5 Number and design of sampling portsGeneral instructions:
• The sockets used must be 4" BSP sockets with an internal thread.Deviations may be made from the 4" dimension, if duct dimensions orduct parameters so dictate. Such deviations should always bediscussed with an accredited laboratory.
• Socket depth should be between 30 and 70 mm.• There should be at least 1.5 m of open space in front of each sampling
port to facilitate insertion and removal of sampling apparatus (probes,etc.) from the duct. If the diameter of a given duct (height/width) isgreater than 1 metre, the area of free space in front of each samplingport should extend to a distance equal to the duct diameter + 0.5metres outside each sampling port.
• Where measurement must be carried out for several parameters at thesame time, extra sampling ports should be fitted, particularly if theparameters to be measured include particles or metals.
• All sampling ports are fitted with plugs. It must be possible to removesuch plugs without difficulty.
• Ducts with thick walls (e.g. insulation) should be fitted with anopening to the outside of the duct itself (where the sampling ports arelocated). Such an opening should be rectangular, with inside

106
measurements of 100 x 500 mm, or should be dimensioned inconsultation with an accredited laboratory.
Circular ducts:• Two sampling ports should be placed 90° apart.• Where D + P is greater than 3 m, a total of 4 sampling ports should be
placed at relative angles of 90° to each other. D = internal diameterand P = port depth.
See also figure 7.
Rectangular ducts:• The sampling ports should be fitted on one of the vertical sides of the
duct, so that the required number of sampling points can bedistributed evenly across the cross section.
• Thus the number of sampling ports depends on the number ofsampling points and the dimensions of the duct. See section 8.2.3.6for details concerning the number of sampling points.
See also figure 8.
8.2.3.6 Number of sampling pointsThe number of sampling points in a cross section is based on the area of thecross section, as well as on the length of the straight duct sections before andafter sampling locations.
The required number of sampling points in both circular and rectangularcross sections must be calculated as illustrated in the following diagram:

107
D = internal diameter in mm for circular measurement cross sections
D = 0.5 (H+B) mm for rectangular measurement cross sections
H = internal height in mm
B = internal width in mm
M1 = length of straight duct without interruptions before the measuremen
M2 = length of straight duct without interruptions after the measurement
Number ofsamplingpoints inmeasurement crosssection
Figure 6 Number of sampling points in cross sections
In circular cross sections, the number of sampling points should bedivisible by four. The sampling points should be distributed symmetricallyalong two diameters placed at right angles to each other.For short, straight duct sections, the number of sampling points should beregistered for both M1 and M2. The highest number of sampling points shouldthen be selected.
Example 1
A circular cross section has a D = 1,000 mm. M1 is greater than or equals 5 x D and M2 isgreater than or equals 1 x D. According to the diagram, there should be 11 samplingpoints. The number of sampling points should, however, be divisible by four. This meansthat a total of 12 sampling points should be chosen instead.

108
Table 13. Location of sampling points in a circular cross section
Number of sample points in a circular cross sectionSampling pointalong crosssection 2 4 6 8 10 12 14
1 85 93 96 97 97 98 982 15 75 85 90 92 93 943 25 70 81 85 88 904 7 30 68 77 82 855 15 32 66 75 806 4 19 34 64 737 10 23 36 638 3 15 25 379 8 18 2710 3 12 2011 7 1512 2 1013 614 2
This table illustrates the position of sampling points within a circular crosssection. The table indicates the distances from the inside duct wall to thevarious sampling points. These distances are given as percentages of theduct diameter D.
456 3 2 1
4
56
1
3
2
D
0,7 x D
Figure 7 Example of sampling point location in a circular cross section
Example 2In a rectangular cross section at an existing installation, H = 1,100 mm and W = 700mm. The straight sections without any disruptions of flow are short, M1 = 2.5 x D and M2= 0.6 x D. The theoretical diameter D = 0.5 x (1,100 + 700) = 900. According to thediagram, there should be 17 sampling points. A total of 3 x 6 = 18 sampling pointsshould then be selected. The rule for circular ducts and rectangular ducts is that figuresshould then be rounded up.

109
w
Figure 8 Example of the distribution of 12 sampling points in a rectangularcross section
8.2.3.7 Sampling gaseous air pollutantsWhen sampling gaseous air pollution, in principle the samples should be takenat a sufficient number of points within the cross section to arrive at arepresentative volume of the average concentration. Under good flowconditions, where it is estimated that concentrations are not layered in thecross section, sampling may be carried out from a single point.
In general, the requirements on measurement-position design outlined insection 8.2.3.5 also apply to measurements of gas. In certain situations, suchas when measuring in circular ventilation ducts, it may be sufficient to haveaccess to the duct via two 1” BSP sockets placed 90° apart. If an installationwishes to deviate from the requirements on the design of sampling locations,as specified in section 8.2.3.5, this should be approved by the supervisoryauthorities and an accredited laboratory.
8.2.3.8 Ducts less than 300 mm in diameterSpecial rules on the measurement of particles and volume flow apply tocircular ducts with a diameter of less than 300 mm (0.5 x (H + W) <300 mmfor rectangular ducts). If the requirements concerning distance, as specified insection 8.2.3.6, are complied with, particle measurements may be carried outisokinectically at a single point in the middle of the duct. Measurements ofvolume flow are traversed as usual. However, no measurements should becarried out at points situated less than 30 mm from the duct walls.
It may be helpful to select smaller sockets for smaller ducts. If an installationwishes to deviate from the requirements on socket dimensions, etc., asspecified in section 8.2.3.5, this should first be approved by the supervisoryauthorities and an accredited laboratory.
8.2.4 Performance monitoring and random testing
8.2.4.1 Measurement reportPerformance monitoring or random testing should be reported in the form ofan accredited measurement report. Such reports must, as a minimum, meetthe requirements laid down in DS/EN 45 001 or EN/ISO 17025, as stipulatedin each accreditation.
The following points should be included in a measurement report:
• the name and address of the test laboratory, the site tested, and theperson or enterprise requesting the test,
• unambiguous identification of the report (e.g. through a serialnumber) and each page therein, and indication of the total number ofpages,
• a description and identification of the test subject (outlet or stack),

110
• date and time of sampling,• identification of test/sample specification (reference) or a description
of the sample method or procedure used,• a description of the sample-extraction procedures,• any deviation from, addition to, or omissions regarding test
specifications, as well as any other information of importanceregarding a specific sample/test,
• identification of any non-standard test/sample method used, includingdeviations from recommended methods,
• measurements, surveys, and results, supported as necessary by tables,diagrams, drawings and photographs, and by records of all errorsidentified,
• a statement regarding measurement uncertainties,• signature and job title or similar identification of the person(s)
assuming technical responsibility for the test report, as well as the dateof issue of the report,
• a statement that the sample results apply only to the sample subjects,• a statement that the report may not be reproduced, except in its
entirety, without written permission from the test laboratory.
All quantitative results must include statements regarding calculated orestimated uncertainty. This means that the total uncertainty for a givenmeasurement must be calculated or estimated and included in the report. Inaddition to the uncertainty associated with the measurement method used,other factors include the design of sampling locations, the measurementprocess, and the composition of the gas may affect the total uncertaintyinvolved.
A measurement report must include a description (sketch) of the design of therelevant sampling location, including information on duct dimensioning andorientation, the length of straight sections before and after the samplinglocation, and the number of sampling ports and their relative positions. Allmatters that influence measurement uncertainty must be described.
The measurement report must include a measure for the level and type ofproduction during the control period. For example, this may concern“energy” and the type of coal involved, or the number of objects painted,their surface, and the type of coating used. For certain types of productionplants, it may be sufficient to state whether production is rated as “normal” or“maximum”.

111
9 Conversions regarding surplus airand moisture content
In the following, all percentages are volume % dry gas.
9.1 Conversion to CO2%
CO2%(ref.)
Cref. = ________________ . Cmeasured, whereCO2%(measured)
Cref. = concentration at reference CO2% [mg / normal m3
(ref.)]Cmeasured = measured concentration [mg / normal m3
(measured)]CO2%(ref.) = reference CO2%[Vol%]CO2%(measured) = measured CO2%[Vol%]
If the substance is measured at a concentration of 150 mg/normal m3 at 5%CO2, at 10% CO2 this will correspond to:
10%______ . 150 mg / normal m3 = 300 mg / normal m3
(ref.)
5%
9.2 Conversion to reference O2%
21 - O2%(ref.)
Cref. = __________________ . Cmeasured, where21 - O2%(measured)
Cref. = concentration at reference O2% [mg/normal m3
(ref.)]Cmeasured = measured concentration [mg/normal m3
(measured)]O2%(ref.) = reference O2%[Vol%]O2%(measured) = measured O2%[Vol%]
If the substance is measured at a concentration of 150 mg/normal m3 at 15%O2, at 10% O2 this will correspond to:
21 - 10%___________ . 150 mg / normal m3 = 275 mg / normal m3
(ref.)
21 - 15%
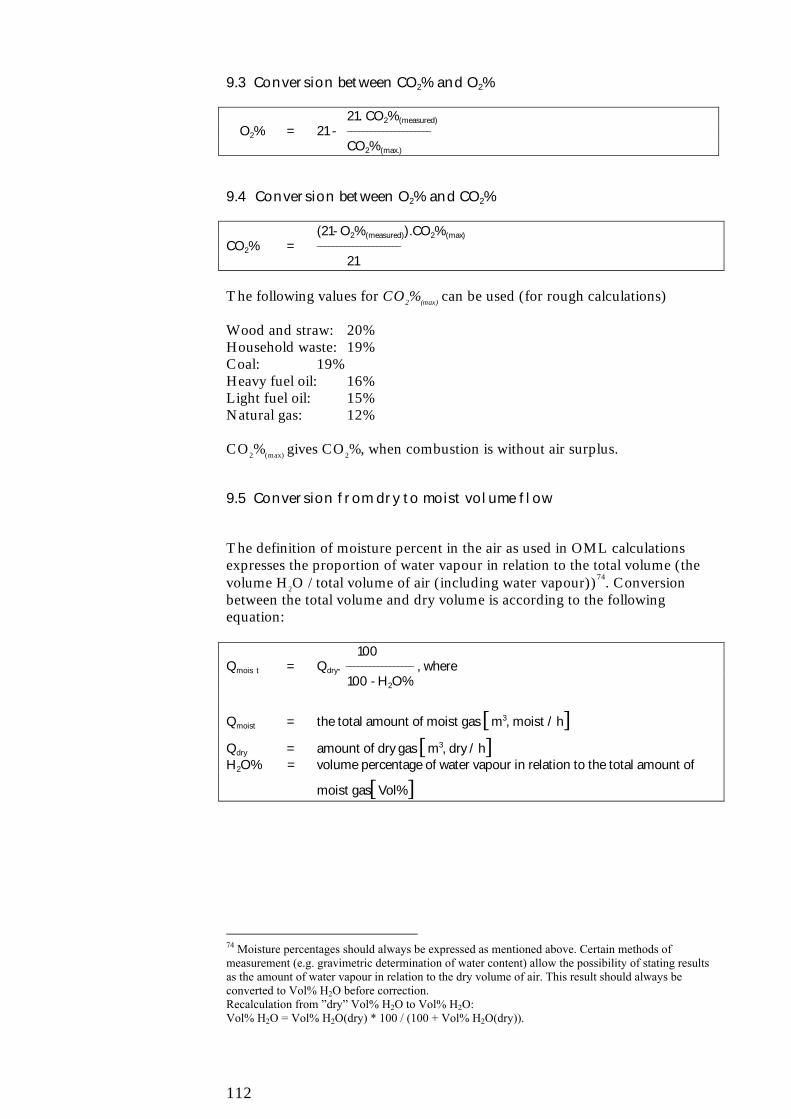
112
9.3 Conversion between CO2% and O2%
21. CO2%(measured) O2% = 21 - _____________________
CO2%(max.)
9.4 Conversion between O2% and CO2%
(21- O2%(measured)).CO2%(max)CO2% = _____________________
21
The following values for CO2%(max) can be used (for rough calculations)
Wood and straw: 20%Household waste: 19%Coal: 19%Heavy fuel oil: 16%Light fuel oil: 15%Natural gas: 12%
CO2%(max) gives CO2%, when combustion is without air surplus.
9.5 Conversion from dry to moist volume flow
The definition of moisture percent in the air as used in OML calculationsexpresses the proportion of water vapour in relation to the total volume (thevolume H2O / total volume of air (including water vapour))74. Conversionbetween the total volume and dry volume is according to the followingequation:
100Qmois t = Qdry. _________________ , where
100 - H2O%
Qmoist = the total amount of moist gas [m3, moist / h]Qdry = amount of dry gas [m3, dry / h]H2O% = volume percentage of water vapour in relation to the total amount of
moist gas[Vol%]
74 Moisture percentages should always be expressed as mentioned above. Certain methods ofmeasurement (e.g. gravimetric determination of water content) allow the possibility of stating resultsas the amount of water vapour in relation to the dry volume of air. This result should always beconverted to Vol% H2O before correction.Recalculation from ”dry” Vol% H2O to Vol% H2O:Vol% H2O = Vol% H2O(dry) * 100 / (100 + Vol% H2O(dry)).
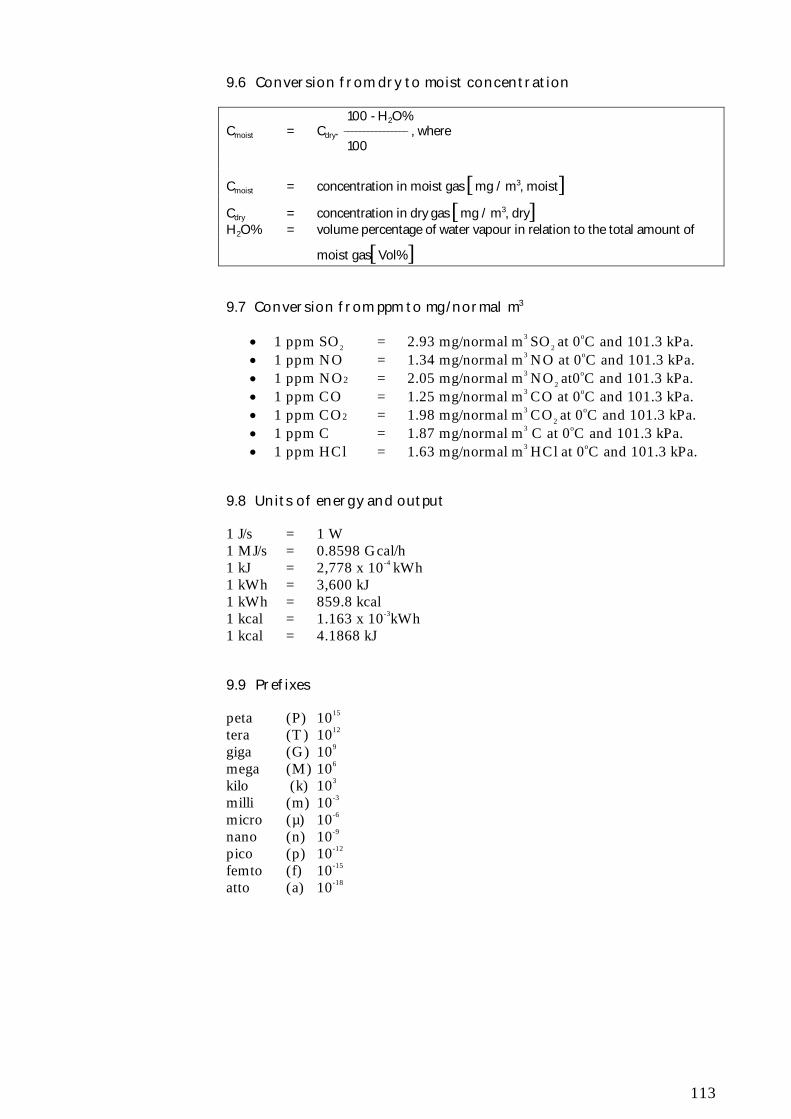
113
9.6 Conversion from dry to moist concentration
100 - H2O%Cmoist = Cdry. ________________ , where
100
Cmoist = concentration in moist gas [mg / m3, moist]Cdry = concentration in dry gas [mg / m3, dry]H2O% = volume percentage of water vapour in relation to the total amount of
moist gas[Vol%]
9.7 Conversion from ppm to mg/normal m3
• 1 ppm SO2 = 2.93 mg/normal m3 SO2 at 0oC and 101.3 kPa.
• 1 ppm NO = 1.34 mg/normal m3 NO at 0oC and 101.3 kPa.
• 1 ppm NO2 = 2.05 mg/normal m3 NO2 at0oC and 101.3 kPa.
• 1 ppm CO = 1.25 mg/normal m3 CO at 0oC and 101.3 kPa.
• 1 ppm CO2 = 1.98 mg/normal m3 CO2 at 0oC and 101.3 kPa.
• 1 ppm C = 1.87 mg/normal m3 C at 0oC and 101.3 kPa.• 1 ppm HCl = 1.63 mg/normal m3
HCl at 0oC and 101.3 kPa.
9.8 Units of energy and output
1 J/s = 1 W1 MJ/s = 0.8598 Gcal/h1 kJ = 2,778 x 10-4
kWh1 kWh = 3,600 kJ1 kWh = 859.8 kcal1 kcal = 1.163 x 10⁻³kWh1 kcal = 4.1868 kJ
9.9 Prefixes
peta (P) 1015
tera (T) 1012
giga (G) 109
mega (M) 106
kilo (k) 103
milli (m) 10-3
micro (µ) 10-6
nano (n) 10-9
pico (p) 10-12
femto (f) 10-15
atto (a) 10-18

114
115
10 Recommended limit values foremissions and inspection rules forthermal and catalytic oxidationinstallations for the destruction oforganic solvents
10.1 Introduction
This chapter deals with thermal and catalytic oxidation installations used fordestruction of organic solvents containing carbon, oxygen and hydrogen.Where other elements such as halogens and nitrogen are involved, please referto the rules in chapter 3.
10.2 Operating conditions
Destruction of organic compounds should not commence before theinstallation reaches its optimal operating conditions (e.g. temperatures at theset points).
10.3 Limit values for emissions
10.3.1 Limit value for emissions of TOC (Total Organic Carbon gases)
The limit value for emissions of TOC is set at 1 % by weight of the expectedmaximum concentration in g TOC/normal m3 added to the installation(averaged over 1 hour), but normally up to a maximum of 100 mgTOC/normal m3
and down to a minimum of 20 mg TOC/normal m3.
Reference condition is the actual concentration of oxygen.
10.3.2 Limit value for emissions of CO
100 mg/normal m3 at actual concentration of oxygen.
10.3.3 Limit value for odours
At first, the limit value for emissions of odours can be set at 4,000 LE/normalm3
at the actual concentration of oxygen. However, in some cases, fortechnical or financial reasons, it may be necessary to set a high limit value. (Insuch cases more than 95 % purification or abatement should be required.)
10.3.4 Limit value for emissions of NOX
200 mg/normal m3 calculated as NO2 at actual concentration of oxygen.

116
10.4 Calculation of the height of outlets
The source strength which has the greatest dispersion coefficient found insections 10.4.1 – 10.4.5, should be used to calculate the height of stacks andother outlets, see chapter 4.
10.4.1 Unburned specific organic compounds
Source strength is equal to the unburned part of the specific organiccompounds measured or calculated after purification or abatement.
10.4.2 TOC (Total Organic Carbon gases)
As a basis, calculations of dispersion coefficients should use a C-value of 0.1mg TOC/m3. This C-value should take into account the fact that unknown,harmful substances such as aldehydes are formed during combustion.However, at effective combustion plants, most of the substances emitted willbe light hydrocarbons such as methane, ethane, and propane. If it is possibleto confirm that most of the TOCs emitted comprise these light hydrocarbons,the C-value can be increased to 1 mg/m3
10.4.3 CO
The source strength for CO is calculated on the basis of the limit value foremissions of CO.
10.4.4 NOX
The source strength for NOX is calculated on the basis of the limit value foremissions of NOX.
10.4.5 Odours
The source strength for odours is calculated as described in section 4.5.
10.5 Monitoring
10.5.1 AMS
1. If the mass flow exceeds 25 kg TOC/hour, the installation should beequipped with automatic measuring and registration devices tomonitor emissions of TOCs from the installation.
2. The installation should establish continuous monitoring andregistration of temperature. The measuring point and set point fortemperature measurements should be approved by the supervisingauthority. Normally, measurement of the highest temperatureoccurring at the installation will be relevant.
Refer also to section 5.2.4.
10.5.2 Performance measurements
Performance measurements for TOC should be carried out with a flameionisation detector (FID).
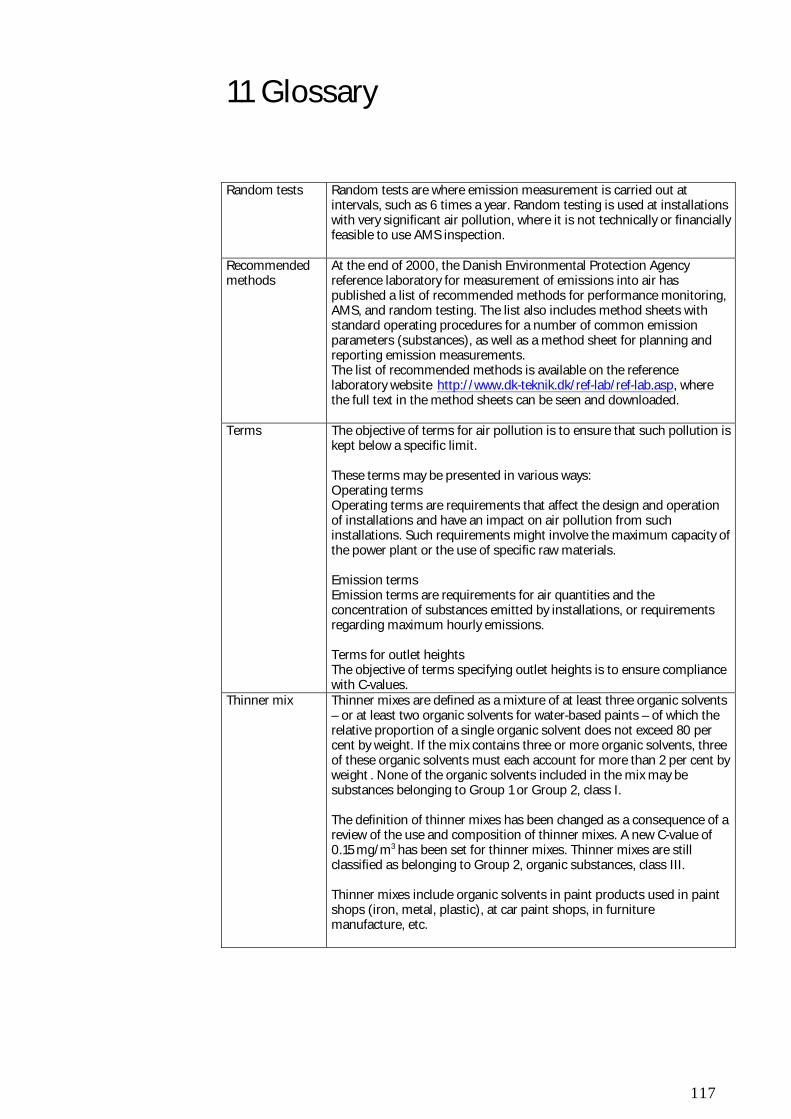
117
11 Glossary
Random tests Random tests are where emission measurement is carried out atintervals, such as 6 times a year. Random testing is used at installationswith very significant air pollution, where it is not technically or financiallyfeasible to use AMS inspection.
Recommendedmethods
At the end of 2000, the Danish Environmental Protection Agencyreference laboratory for measurement of emissions into air haspublished a list of recommended methods for performance monitoring,AMS, and random testing. The list also includes method sheets withstandard operating procedures for a number of common emissionparameters (substances), as well as a method sheet for planning andreporting emission measurements.The list of recommended methods is available on the referencelaboratory website http://www.dk-teknik.dk/ref-lab/ref-lab.asp, wherethe full text in the method sheets can be seen and downloaded.
Terms The objective of terms for air pollution is to ensure that such pollution iskept below a specific limit.
These terms may be presented in various ways:Operating termsOperating terms are requirements that affect the design and operationof installations and have an impact on air pollution from suchinstallations. Such requirements might involve the maximum capacity ofthe power plant or the use of specific raw materials.
Emission termsEmission terms are requirements for air quantities and theconcentration of substances emitted by installations, or requirementsregarding maximum hourly emissions.
Terms for outlet heightsThe objective of terms specifying outlet heights is to ensure compliancewith C-values.
Thinner mix Thinner mixes are defined as a mixture of at least three organic solvents– or at least two organic solvents for water-based paints – of which therelative proportion of a single organic solvent does not exceed 80 percent by weight. If the mix contains three or more organic solvents, threeof these organic solvents must each account for more than 2 per cent byweight . None of the organic solvents included in the mix may besubstances belonging to Group 1 or Group 2, class I.
The definition of thinner mixes has been changed as a consequence of areview of the use and composition of thinner mixes. A new C-value of0.15 mg/m3 has been set for thinner mixes. Thinner mixes are stillclassified as belonging to Group 2, organic substances, class III.
Thinner mixes include organic solvents in paint products used in paintshops (iron, metal, plastic), at car paint shops, in furnituremanufacture, etc.