guidelines for designing web maps - an academic experience · guidelines for designing web maps. an...
TRANSCRIPT

TS 03 – GIS Applications Luz Angela Rocha Guidelines for Designing WEB Maps. An Academic Experience Coastal Areas and Land Administration – Building the Capacity 6th FIG Regional Conference San José, Costa Rica 12–15 November 2007
1/11
Guidelines for Designing Web Maps - An Academic Experience
Luz Angela ROCHA SALAMANCA, Colombia
Key words: web map, map production, GIS on line, visualization, web cartography SUMMARY Nowadays Internet has been one of the most important tools for the dissemination and visualization of spatial data. However it is significant to improve the visualization techniques and increment the role of the organizations that produces spatial data. The process of the web map production and design, involves a series of activities starting for the definition of the type of web map to be created (dynamic or static) including the implementation of on line Geographic Information System (GIS), which allows the interaction between the user and the map. The methodology and model created to web map design by the research group is an academic product that could be an applicable tool that supports the producers of web maps, without experiences on this topic, in creating dynamic maps according technical specifications in order to have a good product with high quality visualization techniques and graphical representation. This paper presents one of the second phase results of a research project called ”Web tourist atlas of San Andrés” which main goal was to create a model for web map production, based on international standards and applying concepts of GIS on line. RESUMEN Internet es actualmente uno de los medios más importante para la difusión y visualización de datos espaciales. Sin embargo uno de los aspectos relevantes a mejorar son las técnicas de visualización y el aumento del número de organizaciones que se animen a producir datos geográficos en la red. El proceso para la producción de mapas en la red incluye las actividades desde la definición del tipo de mapa a publicar (dinámico o estático) hasta la implementación de un Sistema de Información en línea el cual permitirá el acceso y la interacción del usuario con el mapa. El modelo y la metodología desarrollados por el grupo de investigación es un producto académico que se convierte en una herramienta de ayuda para los productores de datos espaciales sin experiencia en la elaboración de mapas en la red, utilizando especificaciones técnicas para la generación de productos cartográficos de alta calidad y buenas técnicas de visualización y de representación gráfica.

TS 03 – GIS Applications Luz Angela Rocha Guidelines for Designing WEB Maps. An Academic Experience Coastal Areas and Land Administration – Building the Capacity 6th FIG Regional Conference San José, Costa Rica 12–15 November 2007
2/11
Este artículo presenta uno de los principales resultados de la segunda fase del proyecto de investigación ¨Diseño de un Atlas en línea para un sector turístico de Colombia. Caso de estudio San Andres¨, cuyo objetivo se basó en la generación de una línea de producción de mapas en la red, utilizando los conceptos de los SIG en línea.

TS 03 – GIS Applications Luz Angela Rocha Guidelines for Designing WEB Maps. An Academic Experience Coastal Areas and Land Administration – Building the Capacity 6th FIG Regional Conference San José, Costa Rica 12–15 November 2007
3/11
Guidelines for Designing Web Maps - An Academic Experience
Luz Angela ROCHA SALAMANCA, Colombia 1. INTRODUCTION Internet is today the most important way for the dissemination of spatial data especially for thematic maps. In this project we assume the classification of the web maps on two categories: static and dynamic maps1. These types of maps could subdivide also into view-only and interactive maps. The most simple web map is the static map view-only. These maps are derived from existing maps on raster format which give only some information such as a geographical location. The dynamic maps works with the concept of animation, that is concerning basically with changes on map representation. The dynamic maps can be interactive or not as well. Interactive maps allow the user to interact with the map in order to analyze, visualize and produce new spatial data. (See figure No.1).
Figure No.1: Dynamic web maps classification 2. GENERATION OF WEB MAPS MODEL From the academic point of view a proposal model for the generation of web maps defined by the research group was a result of the learning lessons on production of the different maps included in the web Atlas of San Andres. The model shows the activities and the basic
1 kraak, M.; Brown. Web cartography: developments and prospects. Taylor & Francis. 2000

TS 03 – GIS Applications Luz Angela Rocha Guidelines for Designing WEB Maps. An Academic Experience Coastal Areas and Land Administration – Building the Capacity 6th FIG Regional Conference San José, Costa Rica 12–15 November 2007
4/11
cartographic elements based on technical specifications according the scale of the map. The model is shown on figure 2:
Figure No. 2: Generation of web maps model
3. CREATING AND DESIGNING A WEB MAP The research group defined the procedure for creation and designing dynamic web maps as a series of primary activities related each others as follows: (See figure No. 3).
– Definition of user requirements – Definition of technical specifications – Definition of Hardware and Software – Web map Creation – Checking and evaluation

TS 03 – GIS Applications Luz Angela Rocha Guidelines for Designing WEB Maps. An Academic Experience Coastal Areas and Land Administration – Building the Capacity 6th FIG Regional Conference San José, Costa Rica 12–15 November 2007
5/11
Figure No. 3: Activities for creation a web maps
3.1. Web Map creation The first stage is based on the type of map to publish. For dynamic maps, it is necessary to define the type of animation to apply and the interactivity of the map. The general characteristics of an interactive map are the following:
– Change of scale of visualization (zoom) – Consulting to a Spatial Data Base – Data Analysis – Change of contents by switching layers (off or on) – Creation of a new data sets or maps
The animation consists on changes on position, attributes and time (Kraak, 1999). The most common types of animation are temporal series, process of presentation and change of presentation.
TS 03 – GIS Applications Luz Angela Rocha Guidelines for Designing WEB Maps. An Academic Experience Coastal Areas and Land Administration – Building the Capacity 6th FIG Regional Conference San José, Costa Rica 12–15 November 2007
6/11
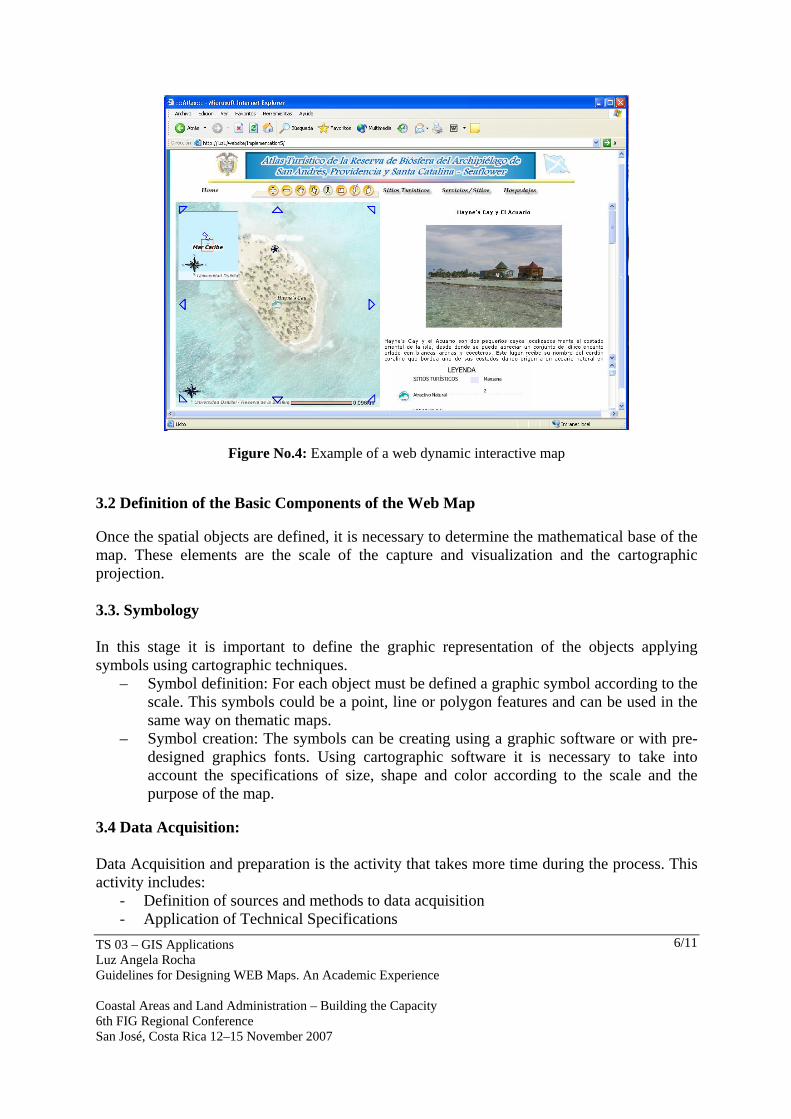
Figure No.4: Example of a web dynamic interactive map
3.2 Definition of the Basic Components of the Web Map Once the spatial objects are defined, it is necessary to determine the mathematical base of the map. These elements are the scale of the capture and visualization and the cartographic projection. 3.3. Symbology In this stage it is important to define the graphic representation of the objects applying symbols using cartographic techniques.
– Symbol definition: For each object must be defined a graphic symbol according to the scale. This symbols could be a point, line or polygon features and can be used in the same way on thematic maps.
– Symbol creation: The symbols can be creating using a graphic software or with pre-designed graphics fonts. Using cartographic software it is necessary to take into account the specifications of size, shape and color according to the scale and the purpose of the map.
3.4 Data Acquisition: Data Acquisition and preparation is the activity that takes more time during the process. This activity includes:
- Definition of sources and methods to data acquisition - Application of Technical Specifications

TS 03 – GIS Applications Luz Angela Rocha Guidelines for Designing WEB Maps. An Academic Experience Coastal Areas and Land Administration – Building the Capacity 6th FIG Regional Conference San José, Costa Rica 12–15 November 2007
7/11
- Capturing and editing of spatial data - Attribute introduction
3.5 Web Map Design The web map design includes many operations, but the more relevant are the following:
- Creation of graphics codes of the symbols - Definition and design of the map frame - Applying symbols - Text positioning
The graphic quality of the web map depends on: Fonts (type of text), size and position of the text. The text position is a very important because of the following aspects:
– Text must give relevant information avoiding redundant information – Text needs to harmonize with the complete data set. – Text has to heighten the communication and the visualization
3.6. Web interface creation The web interface allows the publication and accessing the web map trough the net and the interaction with the users. This stage includes the following activities:
– Web site design – Designing a visor – Map publication
3.6.1 Web Site Design The web site could be creating on different platforms such as Macromedia Fireworks or HTML. In order to create a capable web site it is important to take into account the following components:
– Home page: It is the page of site entrance. It could be very informative, easy for navigation, and attractive in its design. (See Figure No.4)
– Menus and submenus: Each page must have menus and submenus which guide the user to others pages related with the home page
– Main page: This page must have the basic information regarding the web map such as: map title, links to other pages of the web site, and further elements necessaries for the visualization of the web map
– Pages of contents: Gives complementary information of the map, as a result of queries and questions making by the users to the web map. These pages are optional.

TS 03 – GIS Applications Luz Angela Rocha Guidelines for Designing WEB Maps. An Academic Experience Coastal Areas and Land Administration – Building the Capacity 6th FIG Regional Conference San José, Costa Rica 12–15 November 2007
8/11
Figure No. 5: Example of a web site 3.6.2 Visor The visor allows the visualization of the web map. The visor is composed by frames. Each frame has their own function: tools frame (tools for zooming, panning and links), legend frame (map legend), text frame (text of the map), map frame (visualization of spatial data) and ending frame (additional information related with the map).
Figure No. 6: Visor’s frames

TS 03 – GIS Applications Luz Angela Rocha Guidelines for Designing WEB Maps. An Academic Experience Coastal Areas and Land Administration – Building the Capacity 6th FIG Regional Conference San José, Costa Rica 12–15 November 2007
9/11
3.6.3 Map Publication To publish the web map it is necessary to have map server software, with tools that allow the visualization and use an internet navigator. 3.7 Checking and Adjustment The final stage of the process is to check and adjust the application, verifying the interativity, the interoperability, and the performance of the web map. 3.8 CONCLUSIONS The implementation of the web maps need to take into account the Hardware and the software even it is commercial or free software. The procedure could be implementing in the same way for the both type of software. It is important to adopt international standards such as the standards of the Open Geospatial Consortium, which guarantee the access to the web map for multiple users on the net. The guidelines for production and design web maps from the academic point of view, is a very interesting tool, which help and support the producers of web maps. These guidelines are useful because inside the country there is not any tool available for this proposal, so it will be very helpful to the academic and scientific community.

TS 03 – GIS Applications Luz Angela Rocha Guidelines for Designing WEB Maps. An Academic Experience Coastal Areas and Land Administration – Building the Capacity 6th FIG Regional Conference San José, Costa Rica 12–15 November 2007
10/11
REFERENCES GIS online. 1997. Information, retrieval, mapping, and the internet. Brandon Plewe. Onword
press. Harder Christian, 1998. Serving Maps on the Internet-geographic information on the world
wide web, ESRI. Kraak, M. J.; Ormeling, F. 1996. Cartography visualization of spatial data; Addison Wesley
Longman. Kraak, M.; Brown. 2000. Web cartography: developments and prospects. Taylor & Francis. Madero Andrea y Madrid Julian. 2006. Guía Metodológica para la publicación y
Visualización de Mapas Dinámicos en Internet. Rincón Riaño Luis Ricardo y Gutiérrez Medellín Roland. 2004 Conceptualización e
Implementación del Mapa Dinámico en Línea del Departamento Archipiélago de San Andrés Providencia y Santa Catalina.
Rocha Salamanca Luz Angela y Cárdenas Contreras Andrés. 2006. Informe Final del Proyecto de investigación Diseño de un Atlas en línea para un sector turístico de Colombia. Caso de estudio San Andrés.
Rocha Salamanca Luz Angela. 2006. La línea de producción de mapas en la red (www), una herramienta útil para la difusión de datos espaciales. Memorias XII Simposio de Percepción Remota y SIG. SELPER.
BIOGRAPHICAL NOTES Education: Cadastral And Geodesist Engineer. Postgradute Course In Geoinformation Systems (for Cadastral Applications). Master of Sciences in Geoinformation Systems (for Cadastral Applications) Current position: Assistant professor - Geomatics area (GIS; Cartography and Cadastre) Distrital University of Bogota. 2001 Work Experience: Chief of the research project ¨ Diseño de un Atlas en línea para un sector turístico de Colombia Caso de Estudio San Andrés¨ Chief of the research Project: ¨Las Tecnologías de la Información: una herramienta indispensable para el aprendizaje de la Geomática¨. Leader of the research group: SDI- UD The Spatial Data Infrastructures Chief of the Geo-spatial data acquisition group of the cartography department IGAC. (from march/1999 to July 2000) Chief of the System Administration group. IGAC. (from november/1992 until June/ 1996) Associations: Asociación Latinoamericana en percepción Remota y Sistemas de Información Geográfica SELPER. Secretary Asociación Latinoamericana en percepción Remota y Sistemas de Información Geográfica SELPER, capítulo Colombia. Secretary

TS 03 – GIS Applications Luz Angela Rocha Guidelines for Designing WEB Maps. An Academic Experience Coastal Areas and Land Administration – Building the Capacity 6th FIG Regional Conference San José, Costa Rica 12–15 November 2007
11/11
FIG, Commission 7 Universidad Distrital F.J.C Faculty of Engineering. delegate 2001- FIG, Commission 3 Universidad Distrital F.J.C Faculty of Engineering. delegate 2001- CONTACT Luz Angela Rocha Salamanca Universidad Distrital F.J.C. Carrera 7 N. 40-53 Piso 5 Bogotá, D.C., Colombia Tel: 571-2864027 Fax: 571-2864027 e-mail: [email protected]