guidelines for noninvasive vascular laboratory...
TRANSCRIPT

Guidelines for Noninvasive VascularLaboratory Testing: A Report from the
American Society of Echocardiography andthe Society of Vascular Medicine and Biology
Represented by Marie Gerhard-Herman, MD, MMSc, Julius M. Gardin, MD, FASE,Michael Jaff, DO, Emile Mohler, MD, Mary Roman, MD, and
Tasneem Z. Naqvi, MD, FASE, RVT
EXECUTIVE SUMMARY
Accompanying the rapid growth of interest inpercutaneous vascular interventions, there hasbeen increasing interest among cardiologists inperforming noninvasive vascular testing using ul-trasound. In an attempt to provide recommenda-tions on the best practices in vascular laboratorytesting, this report has been prepared by a writinggroup from the American Society of Echocardiog-raphy (ASE) and the Society of Vascular Medicineand Biology. The document summarizes principlesintegral to vascular duplex ultrasound–includingcolor Doppler, spectral Doppler waveform analy-sis, power Doppler, and the use of contrast.Appropriate indications and interpretation of ca-rotid artery, renal artery, abdominal aorta, andperipheral artery ultrasound imaging are de-scribed. A dedicated section summarizes noninva-sive techniques for physiologic vascular testing ofthe lower extremity arteries–including measure-ment of segmental pressures and pulse volumeplethysmography. The use of exercise testing inthe evaluation of peripheral artery disease, ultra-sound evaluation of the lower extremities afterpercutaneous revascularization, and the diagnosisand management of iatrogenic pseudoaneurysm(PSA) is also discussed. A section on the important
From Brigham and Women’s Hospital, Boston, MA (M.G-H.); St.John Hospital and Medical Center, Detroit, MI (J.M.G.); Massa-chusetts General Hospital, Boston, MA (M.J.); University ofPennsylvania Health System, Philadelphia, PA (E.M.); Weill Med-ical College of Cornell University, New York, NY (M.R.); CedarsSinai Medical Center, Los Angeles, CA (T.Z.N.).©Copyright 2005 American Society of Echocardiography (ASE).Property of the ASE. Reprint of these documents, beyond singleuse, is prohibited without prior written authorization of the ASE.Reprint requests: The American Society of Echocardiography,1500 Sunday Dr, Suite 102, Raleigh, NC 27607. (919) 864-7754.J Am Soc Echocardiogr 2006;19:955-972.0894-7317/$32.00Copyright 2006 by the American Society of Echocardiography.
doi:10.1016/j.echo.2006.04.019topic of vascular laboratory accreditation is in-cluded. Finally, additional details regarding propertechnique for performance of the various vasculartests and procedures are included in the Appen-dix.
BACKGROUND
There has been increasing demand for vascularultrasound training among cardiologists in practiceand in training. For example, the recent documenton training for cardiology fellows, COCATS-2, hasrecommended 2 months of dedicated or aggregate“instruction in the noninvasive laboratory” for Level1 training in vascular ultrasound.1 This article willreview general principles, indications, and interpre-tation of noninvasive vascular testing of the carotidarteries, renal arteries, abdominal aorta, and periph-eral arteries. Additional details regarding the tech-niques of performing vascular ultrasound are pro-vided in the Appendix. Another article by thisworking group, “Clinical Application of NoninvasiveVascular Ultrasound in Cardiovascular Risk Stratifi-cation,” will review the application of carotid artery(intimal-medial thickness) and brachial artery (flow-mediated dilatation) measurements for cardiovascu-lar risk stratification.
INSTRUMENTATION: GENERALCONSIDERATIONS
Vascular testing includes duplex ultrasound andphysiologic evaluation. Vascular ultrasound testsrequire a machine equipped with 5- to 12-MHzlinear-array transducers (for the neck and extrem-ities) and 2.25- to 3.5-MHz curved linear- orphased-array transducers (for the abdomen). Avascular software package is required in additionto the appropriate transducers. Duplex scanningrefers to an ultrasound scanning procedure re-
cording both gray scale and Doppler information.955

Journal of the American Society of Echocardiography956 Gerhard-Herman et al August 2006
This includes 2-dimensional structure and motion,Doppler spectrum analysis, and color flow veloc-ity mapping. Carotid arteries, renal arteries, ab-dominal aorta, and peripheral arteries can beappropriately evaluated using this equipment.Physiologic testing includes segmental pulse vol-ume recording and segmental pressure measure-ments with cuffs appropriately sized for the lowerextremities and a plethysmographic recording de-vice.
DUPLEX: PRINCIPLES APPLICABLE TO ALLVASCULAR TESTING
The ultrasound beam is directed perpendicular tothe surface of interest to obtain the brightest echowith gray-scale imaging and optimal imaging ofthe artery wall. The perpendicular angle is oftenreadily obtained, as arteries generally are parallelto the surface of the transducer (Figure 1). For theDoppler component of duplex imaging, an angleof 60 degrees between the Doppler insonationbeam and the vessel wall should be maintained.This Doppler angle becomes an important consid-eration when the velocity data are used to classifydisease.2 Angles above 60 degrees can result insignificant overestimation of the velocity andshould be avoided. Angles that are not relevant tothe vessel wall may misrepresent the true peak
Figure 1 Vessel of interest should be perpendicumost distinct echoes. Left, Carotid B-mode imagewall (arrow) demonstrates trilaminar structure of anonperpendicular angle (arrow).
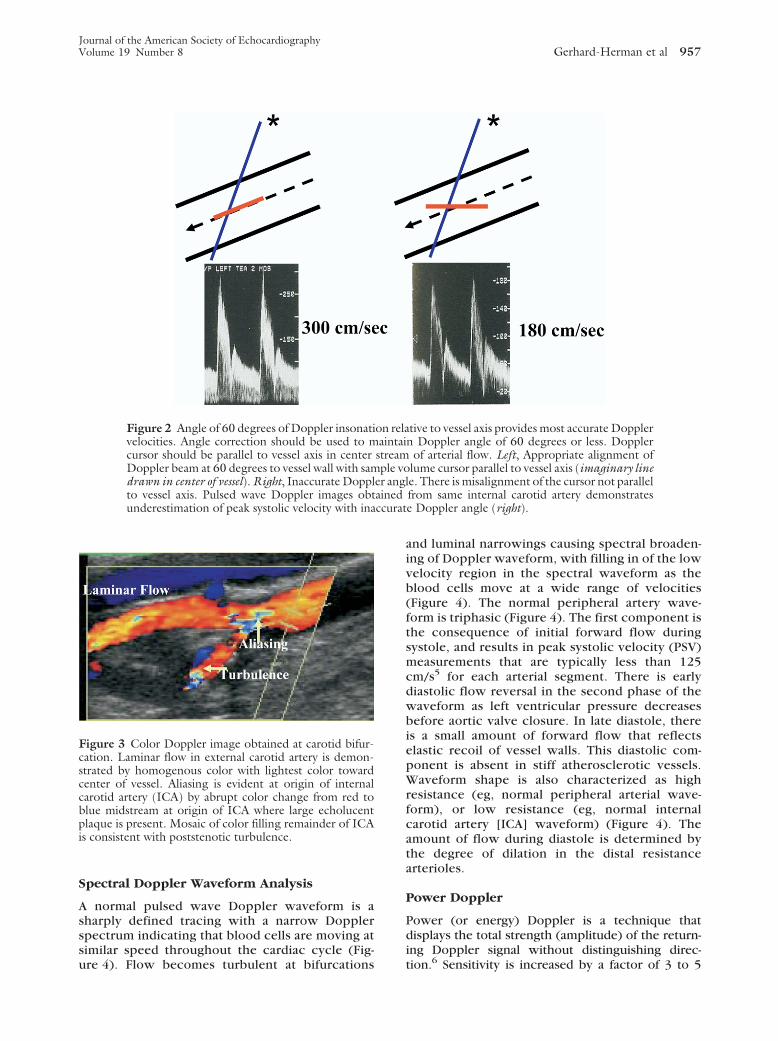
velocity3 (Figure 2).
Color Doppler
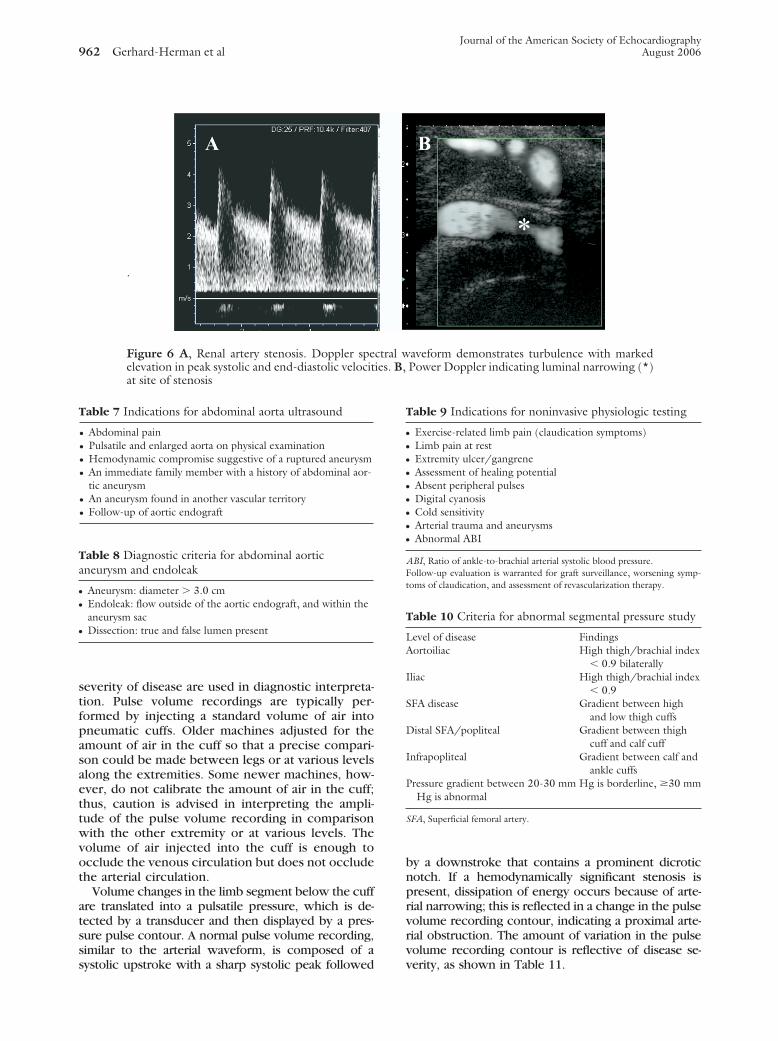
The pulse repetition frequency scale determinesthe degree of color saturation and is adjusted sothat normal laminar flow appears as a region ofhomogeneous color. Stenosis results in the pro-duction of a high velocity jet and an abruptchange in the color flow pattern. This is identifiedas either aliasing or desaturation (whitening) ofthe color display at the site of luminal narrowing.Aliasing occurs when the flow velocity exceedsthe Nyquist limit and results in color display of thereverse flow direction (wrap around). The post-stenotic region demonstrates a mosaic patternindicating turbulent flow (Figure 3). Gray-scalesettings are adjusted to optimize visualization ofintraluminal plaque or thrombus at these sites ofabnormal flow. Color Doppler provides additionalinformation used to detect a significant stenosis.Color aliasing, persistence, and bruit all indicateflow disturbance. Color persistence is a continu-ous flow signal that is color of the forwarddirection only, in contrast to the alternating colorin normal arteries.4 Color persistence correspondsto the monophasic spectral Doppler waveform ofsevere stenosis. A color bruit in the surroundingsoft tissue also indicates flow disturbance. Thiscolor artifact is attributed to vibration in thesurrounding soft tissue in the presence of a highvelocity jet. Abnormalities of color flow indicatepossible stenosis that is then characterized using
ultrasound beam for B-mode imaging to obtained with ultrasound beam perpendicular to vesselwall. Right, Wall structure is poorly defined with
lar toobtainrterial
pulsed wave Doppler determination of velocities.
ccurat
Journal of the American Society of EchocardiographyVolume 19 Number 8 Gerhard-Herman et al 957
Spectral Doppler Waveform Analysis
A normal pulsed wave Doppler waveform is asharply defined tracing with a narrow Dopplerspectrum indicating that blood cells are moving atsimilar speed throughout the cardiac cycle (Fig-
Figure 2 Angle of 60 degrees of Doppler insonativelocities. Angle correction should be used to mcursor should be parallel to vessel axis in centerDoppler beam at 60 degrees to vessel wall with samdrawn in center of vessel). Right, Inaccurate Dopplto vessel axis. Pulsed wave Doppler images obtunderestimation of peak systolic velocity with ina
Figure 3 Color Doppler image obtained at carotid bifur-cation. Laminar flow in external carotid artery is demon-strated by homogenous color with lightest color towardcenter of vessel. Aliasing is evident at origin of internalcarotid artery (ICA) by abrupt color change from red toblue midstream at origin of ICA where large echolucentplaque is present. Mosaic of color filling remainder of ICAis consistent with poststenotic turbulence.
ure 4). Flow becomes turbulent at bifurcations
and luminal narrowings causing spectral broaden-ing of Doppler waveform, with filling in of the lowvelocity region in the spectral waveform as theblood cells move at a wide range of velocities(Figure 4). The normal peripheral artery wave-form is triphasic (Figure 4). The first component isthe consequence of initial forward flow duringsystole, and results in peak systolic velocity (PSV)measurements that are typically less than 125cm/s5 for each arterial segment. There is earlydiastolic flow reversal in the second phase of thewaveform as left ventricular pressure decreasesbefore aortic valve closure. In late diastole, thereis a small amount of forward flow that reflectselastic recoil of vessel walls. This diastolic com-ponent is absent in stiff atherosclerotic vessels.Waveform shape is also characterized as highresistance (eg, normal peripheral arterial wave-form), or low resistance (eg, normal internalcarotid artery [ICA] waveform) (Figure 4). Theamount of flow during diastole is determined bythe degree of dilation in the distal resistancearterioles.
Power Doppler
Power (or energy) Doppler is a technique thatdisplays the total strength (amplitude) of the return-ing Doppler signal without distinguishing direc-
tive to vessel axis provides most accurate Dopplern Doppler angle of 60 degrees or less. Doppler
of arterial flow. Left, Appropriate alignment oflume cursor parallel to vessel axis (imaginary linee. There is misalignment of the cursor not parallelfrom same internal carotid artery demonstratese Doppler angle (right).
on relaaintaistreample vo
er anglained
tion.6 Sensitivity is increased by a factor of 3 to 5

Journal of the American Society of Echocardiography958 Gerhard-Herman et al August 2006
times6 with power Doppler compared with colorflow Doppler. Power Doppler can, therefore, iden-tify very slow flow that may not be detected by colorflow Doppler. Power Doppler is less angle depen-dent than is color Doppler and it improves delinea-tion of the lumen.7 Power Doppler is used todifferentiate high-grade stenosis from occlusion, todetect collateral vessels, and to identify small vesseldisease.
Assessment of Arterial Stenosis
Doppler velocity is the main tool used to evaluatestenosis severity. Characteristic duplex ultrasound
Figure 4 Spectral Doppler waveforms. A, Normal laminarflow with narrow range of velocities throughout cardiaccycle. Cross is placed above clear spectral window (or enve-lope). B, Biphasic Doppler waveform with loss of reversediastolic flow and mild widening of spectral envelope (spec-tral broadening). C, Turbulent flow with filling in of spec-tral window (spectral broadening) and low peak systolicvelocities.
features of stenosis include elevated velocities, color
disturbance, spectral broadening, and poststenoticwaveforms (Table 1). If no poststenotic turbulencecan be identified, inappropriate angle alignment or atortuous vessel should be suggested as a cause ofartifactually high velocities.
USE OF CONTRAST IN VASCULAR IMAGING
Ultrasonographic assessment of peripheral vascu-lar disease is largely dependent on the functioningof the equipment and the skill of the operator.8
The addition of duplex color Doppler techniqueshas allowed for improved identification of theanatomy of peripheral vascular disorders, includ-ing the location, length, and presence of stenosisor occlusion; development of collateral vessels;and areas of reconstitution. Ultrasound contrastagents also appear useful in enhancing suboptimalimages and improving arterial diagnosis in areaswhere calcification in the vessel wall obscures theview of the lumen and the ability to determinevelocity.3 Contrast agents have been shown inves-tigationally to better outline the lumen of thecarotid arteries and facilitate measurement of in-timal-medial thickness, and to help in outliningplaque morphology, and in differentiating be-tween occlusion and high-grade stenosis. Contrastenhancement of the renal vasculature has beenreported to be useful in cases where multiplemain renal arteries are present.3,9 Several large-scale studies have found improvement in periph-eral artery diagnosis using contrast after subopti-mal baseline ultrasound scans.10 Contrast appearsto have use in improving images of vessels diffi-cult to adequately capture using traditional ultra-sound techniques, such as the iliac arteries, thesuperficial artery in the adductor canal, the trifur-cation vessels, and the plantar arteries. Contrastenhancement may also be useful in differentiatingbetween patent and nonpatent vessels in patientswith conditions that interfere with ultrasoundscanning (ie, obesity, edema, dense calcifica-tion).11 Nonetheless, it should be emphasized thatdespite these reports documenting the efficacy ofcontrast agents in enhancing vascular ultrasoundimaging, they have not received US Food and DrugAdministration approval for all these indicationsand, hence, this application should still be, atpresent, considered experimental.
CAROTID ARTERY ULTRASOUND
The goal of noninvasive ultrasound testing forcarotid disease is to distinguish normal from dis-eased vessels, to classify a wide range of disease
states, to assess the cerebral collateral circulation,
Journal of the American Society of EchocardiographyVolume 19 Number 8 Gerhard-Herman et al 959
and to do so in a safe and cost-effective manner.The primary aim is to identify patients who are atrisk for stroke and who may require specifictreatment. A secondary aim is to document pro-gressive or recurrent disease in patients alreadyknown to be at risk. Appropriate indications forcarotid artery testing are listed in Table 2.12-15
Interpretation
Duplex imaging should include, at a minimum,common carotid artery (CCA), ICA, external ca-rotid artery, and vertebral artery. The interpreta-tion of the spectral waveforms is based on param-eters such as PSV, end-diastolic velocity, and theextent of spectral broadening (Figure 5). Individ-ual vascular laboratories must validate their ownresults against a suitable gold standard (eg, arte-riography). Several velocity criteria used to detectpresence and severity of carotid artery diseasehave been published.16 Table 3 summarizes usefulabsolute velocities and velocity ratios to diagnosesignificant ICA stenosis.16 When all categories ofcarotid disease are considered, criteria distin-guishing between normal and diseased ICA have aspecificity of 84% and a sensitivity of 99% whencompared with angiography.17 The accuracy fordetecting 50% to 99% diameter stenosis is 93%.
Table 1 Duplex evidence of arterial stenosis
● Elevated velocities: diagnostic criteria use peak systolic velocityvelocities (eg, 2:1), and elevated end-diastolic velocity, supporti
● Diameter reduction: transverse or longitudinal measurements in● Spectral broadening or color mosaic pattern: the presence of tu
tal to significant stenosis● Color bruit, color persistence: color bruit, providing evidence o
not diagnostic; continuous forward flow, or persistence, is supp
Table 2 Indications for carotid artery ultrasound
● Cervical bruits● Amaurosis fugax● Hemispheric stroke● Focal cerebral or ocular transient ischemic attacks (which dem-
onstrate localizing symptoms, such as weakness of one side ofthe face, slurred speech, weakness of a limb, retinal or hemi-spheric visual field deficits)
● Drop attacks or syncope (rare indications primarily seen in ver-tebrovascular insufficiency or bilateral carotid artery disease)
● Vasculitis involving extracranial arteries● Pulsatile mass in the neck● Trauma to neck● Follow-up of carotid artery atherosclerosis not requiring revas-
cularization● Follow-up surveillance after carotid revascularization, a base-
line ultrasound is recommended within 30 days after carotidstenting
The agreement with angiography is excellent for
classification of lesions that result in greater than50% diameter reduction.18 Experience with du-plex scanning in patients undergoing carotid end-arterectomy indicates that the results of arteriog-raphy rarely altered the clinical treatment planwhen a technically adequate duplex scan showedan 80% to 99% stenosis in an asymptomatic pa-tient, or ipsilateral 50% to 99% stenosis in a patientwith hemispheric neurologic symptoms.19,20
Absolute velocity criteria by duplex ultrasoundmay be less reliable than change in velocity crite-ria over time to diagnose recurrent stenosis aftercarotid artery stenting. A thumping sound may beencountered at the origin of the occluded ICA asa result of flow striking the occlusion followed byflow reversal. Stenosis proximal to the imagedsegment is suggested by parvus et tardus wave-forms. Diagnosis criteria for stenosis in the CCAare less extensively described. A doubling of PSVfrom proximal to distal sample indicates greater
Figure 5 Duplex evidence of internal carotid artery (ICA)stenosis. Duplex image, sample volume cursor parallel toartery wall, at site of color aliasing and luminal narrowing.Spectral Doppler, high peak systolic velocity (670 cm/s),high end-diastolic velocity (185 cm/s), and spectral broad-ening (turbulence). These findings indicate severe (80%-99%) ICA stenosis.
25 cm/s), ratios of distal to proximal sequential peak systolicria include aliasing of color Doppler signalg reduction in luminal diameter are supportive, not diagnosticflow is supportive, not diagnostic; it is most prominent just dis-
ion in the tissue surrounding arterial narrowing, is supportive,vidence of arterial stenosis
(eg, �1ve critedicatin
rbulent
f vibratortive e
than 50% stenosis. A parvus et tardus waveform in

arotid a
Journal of the American Society of Echocardiography960 Gerhard-Herman et al August 2006
the CCA again suggests there is stenosis proximalto the imaged region. Interpretation should com-ment on the direction of vertebral artery flow,forward (toward the brain) or reverse (away fromthe brain). In addition, the vertebral artery wave-form should be described as normal (low resis-tance) or abnormal (biphasic or high resistance).Correct determination of ICA versus external ca-rotid artery is essential for interpretation of studyresults (Table 4).
Limitations and Pitfalls of CarotidDuplex Ultrasound
Disease may be underestimated in the presence oflong smooth plaque that does not have the acceler-ated turbulent flow patterns associated with hemo-dynamically significant lesions. High and low cardiacoutput can affect PSV. In the setting of markedlyabnormal cardiac output, the ICA/CCA PSV ratioshould be the primary diagnostic criteria for ICAstenosis. Contralateral ICA occlusion may result inoverestimation of stenosis in the ipsilateral carotidartery,8 due to compensatory increase in peak sys-tolic velocity.
RENAL ARTERY DUPLEX ULTRASOUND
Atherosclerotic renal artery stenosis has becomeincreasingly recognized as a contributing factor toresistant hypertension,21 and may promote deteri-
Table 3 Criteria for classification of internal carotid arterypulsed Doppler signals
Degree of stenosis, % ICA/PSV, cm/s Plaq
Normal �125 0�50 �125 �5050-69 125-230 �50�70 �230 �50Subtotal occlusion Variable �50Total occlusion 0 �50
CCA, Common carotid artery; EDV, end-diastolic velocity; ICA, internal c
Table 4 Differentiation of internal and external carotidarteries
Internal carotid artery External carotid artery● Usually larger● Usually lateral and posterior● Usually incorporates carotid
bulb● No branches in the neck● Low resistance spectral
waveform● Usually no oscillations in
Doppler on temporal taptest
● Usually smaller● Usually medial and anterior● Usually does not incorporate
bulb● Eight branches in the neck● High resistance spectral wave-
form at rest● Visible and audible oscillations
on Doppler signal waveformon temporal tap test
oration in renal function. Patients with severe
bilateral renal artery stenosis, or stenosis to asolitary functioning kidney, are at risk for thedevelopment of end-stage renal disease.22 Long-term survival of patients with atherosclerotic re-nal artery stenosis requiring dialysis support isdismal.23 Although a number of noninvasive meth-ods of diagnosis in renal artery stenosis have beenproposed, none have obviated the role of the goldstandard, renal arteriography. Each screening testhas significant limitations that prevent widespreadacceptance.
Indications, Performance, and Interpretation
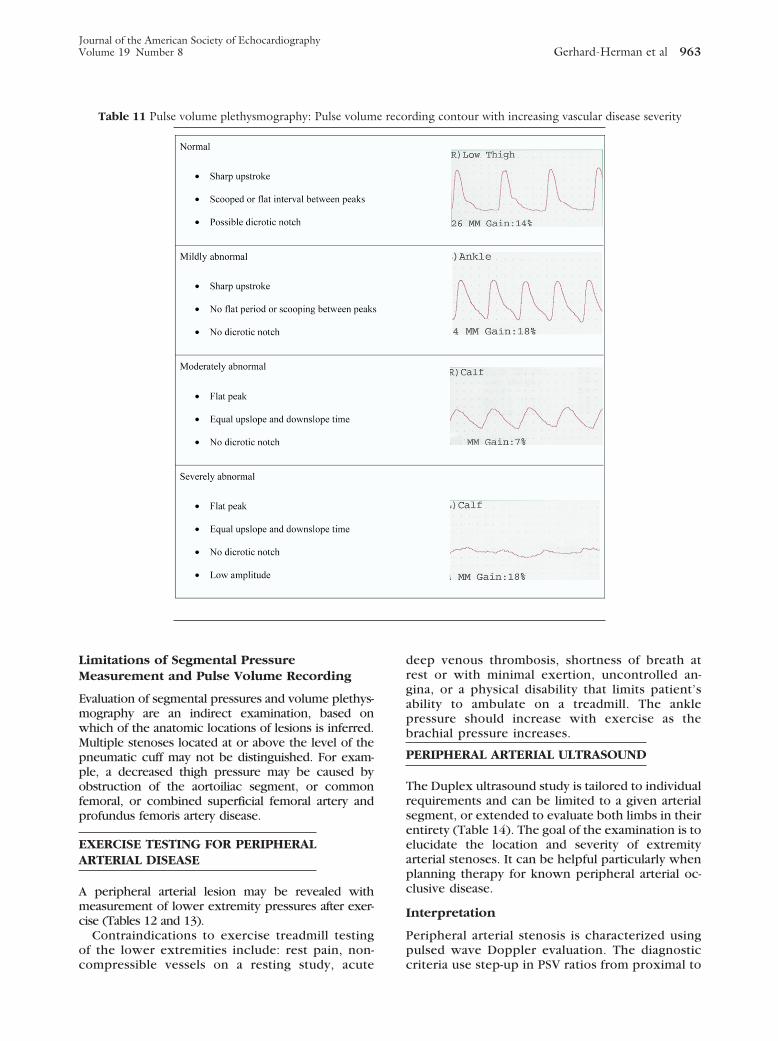
Duplex ultrasonography is the ideal method ofdetermining the adequacy of renal artery revascular-ization (Table 5).25 Duplex ultrasonography is help-ful in detecting important areas of restenosis afterendovascular therapy (percutaneous angioplastywith stent deployment).26 The renal duplex exami-nation includes spectral Doppler velocities from therenal arteries, renal parenchyma, and abdominalaorta. PSV and peak end-diastolic velocities obtainedin branches of the renal artery at the level of themedulla are used to calculate the renal resistiveindex, a value reflecting the health of the renalparenchyma itself (Table 6). In addition, the exami-nation should define the pole-to-pole length of eachkidney. Figure 6 illustrates duplex findings of renalartery stenosis.
ULTRASOUND IMAGING FOR ABDOMINALAORTIC ANEURYSM
Indications
Ultrasound imaging is highly sensitive for assessingand following up abdominal aneurysms.27,28 A fam-ily history of an abdominal aneurysm has beenreported to increase the risk of developing thiscondition 4-fold. In addition, if an aneurysm is foundin one vascular territory, such as the popliteal artery,there is an increased risk of an aneurysm in theaorta. Major indications for assessment of abdominalaortic aneurysm with ultrasound imaging are in-
e by duplex scanning with spectral waveform analysis of
ate, % ICA EDV, cm/s ICA CCA PSV ratio
�40 �2�40 �240-100 2-4�100 �4
lumen �0 Variable0 �1
rtery; PSV, peak systolic velocity.
diseas
ue estim
Narrow
cluded in Table 7.

Journal of the American Society of EchocardiographyVolume 19 Number 8 Gerhard-Herman et al 961
Interpretation
A normal diameter of the abdominal aorta isapproximately 2.0 cm (range: 1.4-3.0 cm) in mostindividuals (Table 8). A mildly dilated abdominalaorta is described as ectatic, whereas it is reportedas aneurysmal when the diameter is greater than3.0 cm.28,29 Abdominal aortic aneurysms are de-scribed as saccular (ie, having a baglike structureprotruding asymmetrically from the aorta); fusi-form (ie, spindle-shaped and tapering from themiddle toward each end); or cylindric. The major-ity of abdominal aortic aneurysms are fusiform inshape, located below the renal arteries, and theymay involve one or both of the iliac arteries.Atherosclerotic changes and/or mural thrombuscan line the aneurysmal sac. Dissection has beenreported with abdominal aortic aneurysm, but isnot common. The typical growth rate reported inthe literature of abdominal aortic aneurysms mea-suring 3 to 5.9 cm is approximately 0.3 to 0.4 cmper year.30 However, larger aneurysms mayprogress more quickly than others. Aneurysmsrepaired by endografts and endovascular stentshave unique ultrasound characteristics. Thrombusdevelops in the aneurysm outside of the en-dograft. Over time, the maximal diameter of theaneurysm sac surrounding an endograft is ex-pected to decrease.
NONINVASIVE PHYSIOLOGIC VASCULAR TESTINGOF THE LOWER EXTREMITY ARTERIES
The goals of noninvasive testing for peripheral arte-rial disease are to confirm a clinical diagnosis andfurther define the level and extent of obstruction. Avariety of algorithms are used to noninvasively diag-nose peripheral arterial disease in the vascular labo-ratory. Some of these include segmental limb pres-sures with pulse volume plethysmography, exercise
Table 5 Indications for renal duplex ultrasound24
● Sudden exacerbation of previously well-controlled hyperten-sion
● New onset hypertension at a young age● Malignant hypertension● Unexplained azotemia● Hypertension and aortoiliac or infrainguinal atherosclerosis● Azotemia after administration of an angiotensin-converting
enzyme inhibitor● An atrophic kidney● Recurrent flash pulmonary edema without cardiac explanation● Evaluation of adequacy of renal artery revascularization● Detection of restenosis after endovascular therapy
treadmill testing, and arterial ultrasonography.
The major indications for assessment of periph-eral arterial disease with noninvasive testing aresummarized in Table 9.
Segmental Limb Pressure Interpretation
Systolic intravascular pressures increase slightlyfrom the femoral to the tibial level so that intra-arterial measurement of pressures would typicallydemonstrate a higher pressure in the tibial arterythan in the femoral artery. When the 4-cuffmethod is used with relatively narrow cuffs, apressure artifact is introduced into the measure-ment, accounting for the gradual increase in mea-sured pressure in ascending levels of the leg. Inhealthy individuals, the high thigh pressure typi-cally exceeds the ankle pressure.31 Thus, a thigh/brachial index of 1.1 or greater is indicative ofnormal hemodynamics and an index of less than0.9 is an indicator of peripheral arterial disease(Table 10). Of note, when the high thigh pressureis low compared with the brachial artery pressure,the level of obstruction may be proximal to thecuff or beneath the cuff. Thus, the site of obstruc-tion could be in the aorta, iliac artery, commonfemoral artery, or proximal superficial femoralartery. When the inflow hemodynamics are abnor-mal bilaterally, the site of obstruction may be theaortoiliac region. However, if the low pressuresare unilateral, then only an ipsilateral iliac orcommon femoral stenosis is inferred and an ab-normality of the aortic segment should not beincluded in the interpretation. Segmental limbpressures are compared with adjacent ipsilateralsegments, contralateral-paired segment, andgreater of the two brachial systolic pressures. Areduction of 20 mm Hg or greater in pressures isconsidered significant if such a gradient is presenteither between segments along the same leg orwhen compared with the same level of the oppo-site leg.32
Pulse Volume Plethysmography Interpretation
Segmental limb plethysmographic waveform analy-sis is based on evaluation of waveform shape andsignal amplitude. Standardized criteria relating wave-
Table 6 Diagnostic criteria for significant renal arterystenosis
Renal artery to aorta peak systolic velocity ratio is �3.5PSV � 200 cm/s with evidence of poststenotic turbulenceEDV � 150 cm/s (�80% renal artery stenosis)RI � 0.8 (used to predict response of blood pressure, renal
function, to renal revascularization)An occluded renal artery demonstrates no flow in the affected
vessel
EDV, End-diastolic velocity; PSV, peak systolic velocity; RI, resistive index(1 � [EDV/maximum systolic velocity] � 100).
form changes to anatomic site and hemodynamic
Journal of the American Society of Echocardiography962 Gerhard-Herman et al August 2006
severity of disease are used in diagnostic interpreta-tion. Pulse volume recordings are typically per-formed by injecting a standard volume of air intopneumatic cuffs. Older machines adjusted for theamount of air in the cuff so that a precise compari-son could be made between legs or at various levelsalong the extremities. Some newer machines, how-ever, do not calibrate the amount of air in the cuff;thus, caution is advised in interpreting the ampli-tude of the pulse volume recording in comparisonwith the other extremity or at various levels. Thevolume of air injected into the cuff is enough toocclude the venous circulation but does not occludethe arterial circulation.
Volume changes in the limb segment below the cuffare translated into a pulsatile pressure, which is de-tected by a transducer and then displayed by a pres-sure pulse contour. A normal pulse volume recording,similar to the arterial waveform, is composed of a
Figure 6 A, Renal artery stenosis. Doppler speelevation in peak systolic and end-diastolic velocitat site of stenosis
.
Table 7 Indications for abdominal aorta ultrasound
● Abdominal pain● Pulsatile and enlarged aorta on physical examination● Hemodynamic compromise suggestive of a ruptured aneurysm● An immediate family member with a history of abdominal aor-
tic aneurysm● An aneurysm found in another vascular territory● Follow-up of aortic endograft
Table 8 Diagnostic criteria for abdominal aorticaneurysm and endoleak
● Aneurysm: diameter � 3.0 cm● Endoleak: flow outside of the aortic endograft, and within the
aneurysm sac● Dissection: true and false lumen present
systolic upstroke with a sharp systolic peak followed
by a downstroke that contains a prominent dicroticnotch. If a hemodynamically significant stenosis ispresent, dissipation of energy occurs because of arte-rial narrowing; this is reflected in a change in the pulsevolume recording contour, indicating a proximal arte-rial obstruction. The amount of variation in the pulsevolume recording contour is reflective of disease se-
aveform demonstrates turbulence with markedPower Doppler indicating luminal narrowing (*)
Table 9 Indications for noninvasive physiologic testing
● Exercise-related limb pain (claudication symptoms)● Limb pain at rest● Extremity ulcer/gangrene● Assessment of healing potential● Absent peripheral pulses● Digital cyanosis● Cold sensitivity● Arterial trauma and aneurysms● Abnormal ABI
ABI, Ratio of ankle-to-brachial arterial systolic blood pressure.Follow-up evaluation is warranted for graft surveillance, worsening symp-toms of claudication, and assessment of revascularization therapy.
Table 10 Criteria for abnormal segmental pressure study
Level of disease FindingsAortoiliac High thigh/brachial index
� 0.9 bilaterallyIliac High thigh/brachial index
� 0.9SFA disease Gradient between high
and low thigh cuffsDistal SFA/popliteal Gradient between thigh
cuff and calf cuffInfrapopliteal Gradient between calf and
ankle cuffsPressure gradient between 20-30 mm Hg is borderline, �30 mm
Hg is abnormal
SFA, Superficial femoral artery.
ctral wies. B,
verity, as shown in Table 11.
Journal of the American Society of EchocardiographyVolume 19 Number 8 Gerhard-Herman et al 963
Limitations of Segmental PressureMeasurement and Pulse Volume Recording
Evaluation of segmental pressures and volume plethys-mography are an indirect examination, based onwhich of the anatomic locations of lesions is inferred.Multiple stenoses located at or above the level of thepneumatic cuff may not be distinguished. For exam-ple, a decreased thigh pressure may be caused byobstruction of the aortoiliac segment, or commonfemoral, or combined superficial femoral artery andprofundus femoris artery disease.
EXERCISE TESTING FOR PERIPHERALARTERIAL DISEASE
A peripheral arterial lesion may be revealed withmeasurement of lower extremity pressures after exer-cise (Tables 12 and 13).
Contraindications to exercise treadmill testingof the lower extremities include: rest pain, non-
Table 11 Pulse volume plethysmography: Pulse volum
compressible vessels on a resting study, acute
deep venous thrombosis, shortness of breath atrest or with minimal exertion, uncontrolled an-gina, or a physical disability that limits patient’sability to ambulate on a treadmill. The anklepressure should increase with exercise as thebrachial pressure increases.
PERIPHERAL ARTERIAL ULTRASOUND
The Duplex ultrasound study is tailored to individualrequirements and can be limited to a given arterialsegment, or extended to evaluate both limbs in theirentirety (Table 14). The goal of the examination is toelucidate the location and severity of extremityarterial stenoses. It can be helpful particularly whenplanning therapy for known peripheral arterial oc-clusive disease.
Interpretation
Peripheral arterial stenosis is characterized usingpulsed wave Doppler evaluation. The diagnostic
rding contour with increasing vascular disease severity
e recocriteria use step-up in PSV ratios from proximal to

Journal of the American Society of Echocardiography964 Gerhard-Herman et al August 2006
distal artery and careful waveform analysis (Table15). Pulsed Doppler interrogation at the level of astenosis reveals a PSV double that of the velocityin the proximal segment. There is spectral broad-ening and forward flow throughout the cardiaccycle in severe stenosis. An occlusion is presentwhen there is no flow within an arterial segment.High-resistance waveforms are present in the ar-tery proximal to the occlusion if there are nocollateral vessels. Continuous forward diastolicflow is present in the proximal artery if dilatedhigh capacitance collaterals are present. The ar-tery that reconstitutes distal to a high-grade steno-sis will have a characteristic poststenotic parvus ettardus waveform.
Doppler examination can accurately diagnoseperipheral arterial disease.35,36 Compared withthe gold standard of arteriography, duplex Dopp-ler evaluation used to detect significant stenosesin patients with proximal lower extremity arterialdisease demonstrates a high sensitivity (82%) andspecificity (92%). Use of color and pulsed waveDoppler36,37 increases the sensitivity (87%-88%)and specificity (95%-99%) of stenosis identifica-tion. The PSV ratio between the stenosis and theimmediately proximal artery segment classifiesperipheral arterial stenoses better than absolutePSV measurements. For example, PSV ratios of 2and 7 correspond to stenoses greater than 50%and greater than 90%, respectively.38 There is awide range of PSV measurements obtained in thelower extremities of normal and abnormal cases.There is a greater correlation between PSV ratioand stenosis than between absolute PSV and ste-nosis.
PERIPHERAL ARTERIAL BYPASSGRAFT ULTRASOUND
Graft surveillance has proven quite useful in ef-forts to preserve the patency of bypass grafts.Infrainguinal bypass graft 5-year primary patency
Table 12 Indications for stress testing of the lower extrem
● Normal resting lower extremity arterial segmental limb pressuretermittent claudication
● Resting lower extremity segmental limb pressures and pulse volu� 0.96) in a patient with a history of intermittent claudication
ABI, Ankle-brachial index.
Table 13 Interpretation of postexercise ankle-brachialindex
● ABI � 0.90 at 1 minute after exercise indicates hemodynami-cally significant PAD
ABI, Ankle-brachial index; PAD, peripheral arterial disease.
rate ranges from 60% to 85%.39 Surgical revision of
the stenoses identified with ultrasound increasesthe 5-year patency rate up to 93%.40,41 Segmentalpressure measurement has not been useful topredict graft failure or the need for revision.42
Doppler examination is useful to identify flow-reducing lesions before graft failure occurs. Stan-dard surveillance protocols recommend ultra-sound evaluation of the graft twice during the firstpostoperative year, and annually thereafter (Table16). Early intervention improves long-term pa-tency by 15% to 20%. Technical failure oftencauses graft failure in the first month. Intimalhyperplasia and progression of atheroscleroticdisease cause graft failure over the ensuring years.
Interpretation
PSV ratios are determined for grafts in a manneridentical to their use in native arteries (Table17).43,44 Exceptions to using distal-to-proximal PSVratio include cases with a diameter mismatch in thegraft or proximal tandem lesions. In these cases adistal PSV can be used instead of the PSV ratio.44
Doubling of the velocity PSV ratio indicates signifi-cant graft stenosis of greater than 50%, with sensi-tivity of 95% and specificity 100%.45
Severe or high-grade lesions warrant intervention.Low velocities indicate poor arterial inflow, proxi-mal stenosis, or large graft diameter. The presenceof a parvus et tardus waveform indicates inflowdisease or proximal stenosis. In addition,46 a PSVless than 45 cm/s within a graft indicates thatsubsequent graft failure is likely to occur. Thefundamental criteria of ultrasound evaluation ofbypass grafts include: PSV greater than 180 cm/s orPSV ratios greater than 2 indicate up to 50% stenosis;low-flow states (�45 cm/s) indicate increased pro-pensity for graft failure; and changes in waveformshape and velocity measurements on serial examina-
, 34
ulse volume recordings at rest, in the context of a history of in-
ording amplitudes mildly abnormal at rest (ie, ABI � 0.80 but
Table 14 Indications for peripheral arterial ultrasound
ClaudicationLeg painUlcersLower extremity revascularization
ities33
s and p
me rec
tions warrant close follow-up/possible revision.

Journal of the American Society of EchocardiographyVolume 19 Number 8 Gerhard-Herman et al 965
LOWER EXTREMITY ARTERY ULTRASOUNDAFTER PERCUTANEOUS REVASCULARIZATION
The long-term patency of percutaneous angioplastyand stenting in the lower extremity ranges from 50%to 85%.47-50 Duplex evaluation is being performedafter percutaneous revascularization to detect evi-dence of stenoses at intervention sites. The conceptis that early detection of lesions may assist inidentifying individuals who need reintervention. Du-plex ultrasound is currently performed after inter-vention, at recurrence of symptoms, and often an-nually thereafter. The color and pulsed waveDoppler examination focus on the vessel proximalto the intervention site, at the site, and distal to thesite51 (Figure 7). Stenosis is evaluated in a mannersimilar to that used in native arteries, discussedpreviously (Table 18). A PSV ratio of 2 indicates astenosis greater than 50%.44
DIAGNOSIS AND MANAGEMENT OFIATROGENIC PSEUDOANEURYSM USINGULTRASOUND
Increasing interest in endovascular therapy as aprimary option for patients with cardiovascular dis-ease has resulted in a greater frequency of vascularcomplications. Despite the efficacy of these endo-vascular procedures, complications of vascular ac-cess do occur, including hematoma formation, arte-riovenous fistulae, infection, atheroemboli,retroperitoneal hemorrhage, native arterial throm-bosis, and pseudoaneurysm (PSA). PSA is among themost common iatrogenic vascular complication, andis associated with significant risk of expansion,extrinsic compression on native arteries, rupture,embolization, and infection. A PSA represents apersistent defect throughout all 3 layers of thearterial wall, resulting in extravasation of bloodoutside of the artery. This extravascular blood is
Table 15 Diagnostic criteria for peripheral arterial diamete
Diameter reduction Waveform
Normal 0 TriphasicMild 1%-19% TriphasicModerate 20%-49% BiphasicSevere 50%-99% Monophas
PSV, Peak systolic velocity.*�4:1 Suggests �75% stenosis, �7:1 suggests � 90% stenosis.
Table 16 Indications for arterial bypass graft ultrasound
● At 3 and 6 mo in the first year after revascularization● At annual intervals after revascularization after the first year
supported by the surrounding soft tissues.
The key to the diagnosis of PSA remains a highindex of suspicion (Table 19). Clinically, any patientwho undergoes an arterial puncture for arteriogra-phy or endovascular intervention and experiencespain at the access site after the procedure should beconsidered to be at risk for PSA formation. A pulsa-tile mass on physical examination and/or the pres-ence of an audible bruit on auscultation over theaccess site are helpful physical findings. However,many PSAs will not have these findings. Extensiveecchymosis at the access site may also be a clue tothe potential presence of a PSA.
PSAs are identified when flow into an extravascu-lar sac is detected (Table 20). In addition to theto-and-fro signal in the neck, the proximal nativeartery of origin may have a lower resistance spectralwaveform when compared with the distal artery(Figure 8).
Treatment Options
Although serious complications may occur withPSAs, not all PSAs require treatment. There areseveral options for treatment of PSAs, includingobservation, surgical repair, and ultrasound-guidedcompression or thrombin injection (Appendix).
VASCULAR LABORATORY ACCREDITATION
The laboratory accreditation process provides stan-dards for laboratory procedures, staff experience,and quality assurance. The Intersocietal Commissionfor the Accreditation of Vascular Laboratories(ICAVL) is one such accrediting agency.19 The Amer-ican College of Radiology also provides laboratory
ction
Spectral broadening PSV distal/PSV proximal
Absent ��� No changePresent � 2:1Present � 2:1Present � 2:1*
Table 17 Diagnostic criteria for vein graft lesions usingpeak systolic velocity
● Minimal stenosis �20% with PSV ratio � 1.4 and � 125 cm/s● Moderate stenosis of 20% to 50% with PSV ratio 1.5 to 2.4
and a PSV �180 cm/s● Severe stenosis 50% to 75% with PSV ratio 2.5 to 4 and a PSV
�180 cm/s● High-grade stenosis � 75% with PSV ratio � 4 and PSV �
300 cm/s
PSV, Peak systolic velocity.
r redu
ic
certification (www.acr.org). According to ICAVL, “A

Journal of the American Society of Echocardiography966 Gerhard-Herman et al August 2006
vascular laboratory is a unit performing noninvasivevascular diagnostic testing under the overall direc-tion of a Medical Director.” Their published stan-dards give minimum criteria for physical facilities,ancillary support, and organization of staff. Thefollowing areas are highlighted as examples of therequirements for accreditation by this body.
Examination Interpretation, Reports,and Records
The medical director or a medical staff member–both of whom must be physicians–should interpretand report on all noninvasive vascular examinations.All reporting must be standardized and include thename of the technologist (sonographer) performingthe examination, the date of the examination, clini-cal indications, description of the test performed,results–including localization and quantification ofabnormal findings and comparison with availableprevious studies, and a signature. The final reportmust be completed within 2 working days of theexamination, except when outstanding clinical in-
Figure 7 Duplex ultrasound of superficial femoral arterypostintervention. A, Color Doppler with laminar flow,followed by loss of color signal at site of stent fracture andcomplex calcific atherosclerotic plaque, with aliasing distalto stent fracture. B, Spectral Doppler proximal to site offracture with turbulent flow. C, Peak systolic velocity in-creases distal to fracture within area of stenosis, suggestiveof 50% to 99% stenosis.
formation is needed for completion. Critical findings
must be reported to the referring physician on thesame day as found.
Qualifications of Medical andTechnical Personnel
Medical directors of vascular ultrasound laborato-ries, either through completion of a formal resi-dency or fellowship or less formal (ContinuingMedical Education) training program, must haveinterpreted, under the supervision of an experi-enced mentor, 100 cases in each of the areas forwhich they will be interpreting studies: carotidduplex ultrasound, transcranial Doppler, peripheralarterial physiologic tests, peripheral arterial duplexultrasound, and venous duplex ultrasound, and 75visceral vascular duplex ultrasound cases to inter-pret the latter studies.19 Medical directors with atleast 3 years of experience in an established prac-tice, but no formal or informal training per se, musthave interpreted 300 cases, under the supervision ofan experienced mentor, in each of the followingareas (for which they will be interpreting cases):carotid duplex ultrasound, transcranial Doppler, pe-ripheral arterial physiologic tests, peripheral arterialduplex ultrasound, and venous duplex ultrasound,and 225 visceral vascular duplex ultrasound cases.19
Medical staff must be licensed physicians with sim-ilar experience allowing them to participate asinterpreters. Beginning in 2006, the American Reg-istry of Diagnostic Medical Sonographers (ARDMS)will be offering certification in vascular laboratoryinterpretation for physicians, known as the Regis-tered Physician in Vascular Interpretation certifica-
Table 18 Interpretation criteria for arterial stenosis afterpercutaneous revascularization
● PSV �180 cm/s● PSV ratios �2 indicate significant stenosis● Changes in waveform shape and velocity measurements on
serial examinations warrant close interval follow-up
PSV, Peak systolic velocity.
Table 19 Indications for duplex study forpseudoaneurysm
● Pulsatile mass at arterial access site● Sudden pain at arterial access site● Bruit at arterial access site
Table 20 Criteria for diagnosis of pseudoaneurysm sac
● Extravascular arterial sac with flow● Communication between sac and artery● Native artery with forward and reverse flow, ie, to and fro
tion.

nostic
Journal of the American Society of EchocardiographyVolume 19 Number 8 Gerhard-Herman et al 967
Technical directors must have experience in per-forming and interpreting vascular laboratory tests. Inaddition, technical directors should have had 3 yearsof vascular testing experience, with the perfor-mance of at least 1800 noninvasive vascular exami-nations with appropriate distribution in testing areasbeing performed by the laboratory. Since January2003, all technical directors have been required tohave an appropriate credential in vascular testing.Technical staff (sonographers) must have performed100 cases in each applicable area.
Specific recommendations from ICAVL regardingvascular laboratory operations are available for ex-tracranial cerebrovascular, intracranial cerebrovas-cular, peripheral arterial, peripheral venous testing,and visceral vascular testing.20-23,25 Each moduleincludes information on standards for instrumenta-tion, indications, techniques and components ofexamination performance, diagnostic criteria, pro-cedure volumes, and quality assurance.
Training of Sonographers
The ASE has recommended that all sonographersenter and complete training in a program recog-nized and supported by the ASE, such as thoseaccredited by the Commission on Accreditation ofAllied Health Programs, the Joint Review Commit-tee for Cardiovascular Technology, and the JointReview Committee for Diagnostic Medical Sonog-raphy.26 Sonographers and physicians can becomeRegistered Vascular Technologists, credentialedby the ARDMS, by successfully completing boththe Vascular Physical Principles and Instrumenta-tion and Vascular Technology examinations. Pre-requisites to taking the ARDMS examinations varyaccording to education level and are available onthe ARDMS Web site (www.ardms.org/applicants/prechart.html). Credentialing as a Registered Vas-cular Specialist is also offered by CardiovascularCredentialing International (CCI). For details, see
Figure 8 Duplex evidence of pseudoaneurysm (strating thrombus (*) lining cavity. Color flow isspectral Doppler recording in neck of PSA is diag
the CCI World Wide Web site (www.cci-onlin-
e.org). The training qualifications and experiencefor the sonographers (including the technicaldirector) in a vascular ultrasound laboratory arelisted above under “Vascular Laboratory Accredi-tation.”
REIMBURSEMENT: MEDICARE GUIDELINES
For studies performed in the hospital, Medicare PartA usually covers the technical components of thestudy, whereas the interpretation is billed underMedicare Part B. The majority of reimbursement fallsunder Medicare Part B, especially for studies per-formed in private offices and clinics. The require-ment that a vascular laboratory be accredited and/orstaff registered and certified to receive Medicarereimbursement for vascular studies is determined byeach state’s medical carrier. ICAVL provides linksto requirements for each state on their Web site(www.icavl.org). Medicare payment policies areenforced through postpayment audits. Laboratoryrecords are reviewed to assure compliance, andproviders who violate billing regulations mustrepay the carrier for past erroneous claims.
REFERENCES
1. Beller GA, Bonow RO, Fuster V. ACC revised recommendationsfor training in adult cardiovascular medicine: core cardiologytraining II (COCATS 2) (revision of the 1995 COCATS trainingstatement). J Am Coll Cardiol 2002;39:1242-6.
2. Philips D, Beach K, Primozich J. Should results of ultrasoundDoppler criteria be reported in units of frequency or velocity?Ultrasound Med Biol 1989;15:205-12.
3. Logason K, Barlin T, Jonsson ML, et al. The importance ofDoppler angle of insonation on differentiation between50-69% and 70-99% carotid artery stenosis. Eur J Endovasc
Left panel, Color Doppler of PSA sac demon-t within cavity. Right panel, Unique to-and-froof PSA.
PSA).eviden
Surg 2001;21:311-3.

Journal of the American Society of Echocardiography968 Gerhard-Herman et al August 2006
4. Pellerito J. Color persistence: indicator of hemodynamicallysignificant peripheral arterial stenosis. Radiology 1991;181:89.
5. Jager K. Non-invasive mapping of lower limb arterial lesions.Ultrasound Med Biol 1985;11:515-21.
6. Rubin J. Power Doppler US: a potentially useful alternative tomean frequency-based color Doppler US. Radiology 1994;190:853-6.
7. Griewing B, Doherty C, Kessler C. Power Doppler ultrasoundexamination of the intracerebral and extracerebral vasculature.J Neuroimaging 1996;6:32-5.
8. Beckett WW Jr, Davis PC, Hoffman JC Jr. Duplex Dopplersonography of the carotid artery: false-positive results in anartery contralateral to an artery with marked stenosis. AJNRAm J Neuroradiol 1990;11:1049-53.
9. Ringer AJ, et al. Follow-up of stented carotid arteries byDoppler ultrasound. Neurosurgery 2002;51:639-43.
10. Yadav JS, et al. Protected carotid-artery stenting versus end-arterectomy in high-risk patients. N Engl J Med 2004;351:1493-501.
11. Medicare services of Missouri draft policy for non-invasivevascular studies. AC-PN 2003-01, pg. 29, March 2003.
12. Fell G, Breslau P, Knox R. Importance of non-invasive ultra-sonic Doppler testing in the evaluation of patients/asymp-tomatic carotid bruits. Am Heart J 1981;102:221-6.
13. Zwiebel WJ. Duplex sonography of the cerebral arteries:efficacy, limitations, and indications [comment]. AJR Am JRoentgenol 1992;158:29-36.
14. Ackerstaff RG, et al. Ultrasonic duplex scanning of the prever-tebral segment of the vertebral artery in patients with cerebralatherosclerosis. Eur J Vasc Surg 1988;2:387-93.
15. Transamerica Occidental Life Insurance Company paymentsafeguard administrator proposal local medical review policyfor the state of California for noninvasive vascular studies.
16. Grant EG, et al. Carotid artery stenosis: gray-scale and Dopp-ler US diagnosis–Society of Radiologists in Ultrasound con-sensus conference. Radiology 2003;229:340-6.
17. Langlois Y, Roederer G, Strandness DJ. Ultrasonic evaluationof carotid bifurcation. Echocardiography 1987;4:141-59.
18. Roederer G, Langlois Y, Jager K. A simple spectral parameterfor accurate classification of severe carotid artery disease. Bruit1989;3:174-8.
19. Mattos MA, Hodgson KJ, Faught W. Carotid endarterectomywithout angiography: is color-flow duplex scanning sufficient?Surgery 1994;116:776-83.
20. Dawson D, Zierler R, Strandess DJ. The role of duplexscanning and arteriography before endarterectomy: a prospec-tive study. J Vasc Surg 1993;18:673-83.
21. Hollenberg NK. Medical therapy for renovascular hyperten-sion: a review. Am J Hypertens 1988;1:338-43S.
22. Mailloux LU, et al. Renal vascular disease causing end-stagerenal disease, incidence, clinical correlates, and outcomes: a20-year clinical experience. Am J Kidney Dis 1994;24:622-9.
23. Scoble JE, et al. Atherosclerotic renovascular disease causingrenal impairment–a case for treatment. Clin Nephrol 1989;31:119-22.
24. Gray BH, et al. Clinical benefit of renal artery angioplasty withstenting for the control of recurrent and refractory congestiveheart failure. Vasc Med 2002;7:275-9.
25. Eidt J, Fry R, Clagett G. Postoperative follow-up of renalartery reconstruction with duplex ultrasound. J Vasc Surg
1988;8:667-73.26. Dorros G, Jaff M, Mathiak L. Four-year follow-up of Palmaz-Schatz stent revascularization as treatment for atheroscleroticrenal artery stenosis. Circulation 1998;98:642-7.
27. Harter LP, et al. Ultrasonic evaluation of abdominal aorticthrombus. J Ultrasound Med 1982;1:315-8.
28. Steiner E, et al. Sonographic examination of the abdominalaorta through the left flank: a prospective study. J UltrasoundMed 1986;5:499-502.
29. Yucel EK, et al. Sonographic measurement of abdominalaortic diameter: interobserver variability. J Ultrasound Med1991;10:681-3.
30. Scott RA, Ashton HA, Kay DN. Abdominal aortic aneurysmin 4237 screened patients: prevalence, development and man-agement over 6 years [comment]. Br J Surg 1991;78:1122-5.
31. Yao ST. Hemodynamic studies in peripheral arterial disease.Br J Surg 1970;57:761-6.
32. Marinelli MR, et al. Noninvasive testing vs clinical evaluationof arterial disease: a prospective study. JAMA 1979;241:2031-4.
33. Pascarelli EF, Bertrand CA. Comparison of blood pressures inthe arms and legs. N Engl J Med 1964;270:693-8.
34. Yao ST, Hobbs JT, Irvine WT. Ankle systolic pressure mea-surements in arterial disease affecting the lower extremities.Br J Surg 1969;56:676-9.
35. Kohler T. Duplex scanning for diagnosis of aotroiliac andfemoropopliteal disease: a prospective study. Circulation 1987;76:1074-80.
36. Polak J. Determinations of the extent of lower extremityperipheral arterial disease with color-assisted duplex sonogra-phy: comparison with angiography. AJR Am J Roentgenol1990;155:1085-9.
37. Cossman D. Comparison of dye arteriography to arterialmapping with color-flow duplex imaging in the lower extrem-ities. J Vasc Surg 1989;10:522-9.
38. Ranke C, Creutzig A, Alexander K. Duplex scanning of theperipheral arteries: correlation of the peak velocity ratio withangiographic diameter reduction. Ultrasound Med Biol 1992;18:433-40.
39. Strandness DE Jr, Van Breda A. Surgical management offemoropoliteal occlusive disease. In: Breda SAA, editor. Vas-cular diseases: Surgical and interventional therapy. New York:Churchill Livingstone; 1994. p. 493-9.
40. Donaldson M, Mannick J, Whittemore A. Causes of primarygraft failure after in situ saphenous vein bypass grafting. J VascSurg 1992;15:113-20.
41. Bergamini T. Experience with in situ saphenous vein bypassesduring 1981 to 1989: determinant factors of long-term pa-tency. J Vasc Surg 1991;13:137-49.
42. Bandyk D. Essentials of graft surveillance. Semin Vasc Surg1993;6:92-102.
43. Griggs M, Nicolaides A, Wolfe J. Detection and grading offemorodistal vein graft stenosis: duplex velocity measurementscompared with angiography. J Vasc Surg 1988;170:661-6.
44. Polak J. Early detection of saphenous vein arterial bypass graftstenosis by color assisted duplex songraphy: a prospectivestudy. AJR Am J Roentgenol 1990;154:857-61.
45. Bandyk D. Nature and management of duplex abnormalitiesencountered during infrainguinal vein bypass grafting. J VascSurg 1996;24:430-8.
46. Bandyk D, Cato R, Towne J. A low velocity predicts failure offemoropoliteal and femorotibial bypass grafts. Surgery 1985;
98:799-809.
Journal of the American Society of EchocardiographyVolume 19 Number 8 Gerhard-Herman et al 969
47. Matsi P. Femoropoliteal angioplasty in patients with claudica-tion: primary and secondary patency in 140 limbs with 1-3year follow-up. Radiology 1994;191:727-33.
48. Murray J, Apthorp L, Wilkins R. Long-segment (� or � 10cm) femoropoliteal angioplasty: improved technical successand long-term patency. Radiology 1995;195:158-62.
49. Cejna M. PTA versus Palmaz stent placement in femoropoli-teal artery obstructions: a multicenter prospective randomizedstudy. J Vasc Interv Radiol 2001;12:23-31.
50. Soder H. Failure of prolonged dilation to improve long-termpatency of femoropoliteal artery angioplasty: results of a pro-spective trial. J Vasc Interv Radiol 2001;13:361-9.
51. Ahn S. Reporting standards for lower extremity arterial endo-vascular procedures. J Vasc Surg 1993;17:1103-7.
APPENDIXTECHNIQUE OF CAROTIDARTERY ULTRASOUND
The first segment of carotid duplex ultrasound exam-ination involves a complete survey of the extracranialcarotid arteries in transverse and longitudinal views, anassessment of the anatomy, and the presence or ab-sence of disease and its location. Beginning at the baseof either side of the neck, first from the anterolateraland then the posterolateral view, the operator shouldmove the transducer slowly from the level of theclavicle to the level of the jaw. The right CCA is locatedlateral to the thyroid gland and medial to the internaljugular vein. The ICA is typically located lateral andposterior in the neck, whereas the external carotidartery (ECA) is medial and slightly more anterior. Theinternal jugular vein is easily compressible in mostpatients, whereas the CCA is not. In most patients, theorigin of the right CCA and the right subclavian arteryare easily accessible to the scan head, with slightcaudal angulation of the transducer, as they branchfrom the brachiocephalic artery. Left CCA as proximalas possible at the base of the neck. The origin of theleft CCA cannot be identified from this view. Followingthe CCA to the origin of the ICA and the ECA, thebifurcation is usually found at the level of the cricoidcartilage (level of C3 or C4, but may vary from C1-C6).ICA and ECA should be followed as far in the neck aspossible. For assessment of the plaque character andlocation, the entire CCA, ICA, and ECA should bescanned in B-mode (gray scale) without color.
The longitudinal view is used to correctly placethe Doppler sample volume for velocity measure-ment and for assessment with color Doppler. TheCCA is visualized and its entire length is assessedwith spectral Doppler from the level of its origin onthe right and as low in the neck as possible on theleft. Stenosis can be focal and flow patterns cannormalize within a short distance beyond the steno-sis. For this reason, the sample volume should not beplaced in discrete spots but, rather, methodically
advanced throughout the length of the vessel usingcolor Doppler for guidance. Representative velocitymeasurements should be recorded from the mostproximal CCA, the mid-CCA, and the distal CCA. TheCCA spectral waveform signature normally hasgreater diastolic flow than the ECA, but less than theICA. The ICA should be followed as far distally aspossible, at least 3 cm to an area well beyond thedisease. Using spectral Doppler, sample volumeshould be walked throughout the entire ICA, record-ing velocity samples–PSV and end-diastolic velocityfrom the proximal, mid, and distal ICA segments.The distal ICA sample should be obtained at least 3cm distal to the bifurcation.
CAROTID ARTERY ULTRASOUND:PRACTICAL TIPS
● ICA and ECA are usually differentiated based onseveral criteria, as no one criterion by itself isdefinitive (Table 2). A direct comparison of thewaveforms from the two vessels is critical be-fore using the resistance characteristics for iden-tification.
● Physical limitations such as recent neck surgery,radical neck dissection, prior radiation, skin sta-ples, sutures, or dressings require extra ultrasonicgel or standoff to facilitate imaging.
● Use posterior approach for patients who cannotextend the neck because of fixed cervical spinedisease, cervical collar, or muscle contractures.
● For patients unable to lay flat, imaging in theseated or standing position can be performed. Alow-frequency transducer should be used in pa-tients with a deep artery or thick neck.
● Stenosis may be overestimated in the presence oftortuosity if the sample volume is placed in theouter curvature.
● ICA/CCA ratio may still apply and should be usedfor identifying the degree of stenosis. In thepresence of decreased cardiac output or severeaortic stenosis absolute velocity criteria will notbe directly applicable.
● It is important to obtain sample velocities in themaximum area of stenosis, and just proximal anddistal to any narrowing to avoid pitfalls in assess-ment of stenosis.
TECHNIQUE OF RENAL ARTERYDUPLEX ULTRASOUND
Renal artery duplex ultrasonography requires a vas-cular technologist who has demonstrated dedicationto perfecting the procedure, and state-of-the-art ul-trasound equipment. Patients are instructed to fastfrom midnight before the examination. Each study
must be performed in the early morning, and pa-
Journal of the American Society of Echocardiography970 Gerhard-Herman et al August 2006
tients are instructed to take their morning medica-tions with small sips of liquid. If significant bowelgas is identified, the study is terminated, the patientgiven simethicone, and the patient is rescheduledfor another morning. A low-frequency 2.25- to 3.5-MHz pulsed Doppler transducer is required foradequate deep abdominal imaging. The addition ofcolor imaging will increase the ease with which therenal arteries are identified. The examination isstarted with the patient supine and in reverse Tren-delenburg’s position. The aorta is scanned in thelongitudinal view from the diaphragm to the aorticbifurcation. The presence of atherosclerotic plaqueand aneurysmal dilation is noted. The origin of theceliac, superior, and inferior mesenteric arteries isdefined. A Doppler velocity is obtained at the levelof the superior mesenteric artery, in the centerstream of arterial flow, at a 60-degree angle. Thisvelocity is recorded, and will be used as the denom-inator for renal-to-aortic velocity ratio calculations.
The transducer is then reoriented into the trans-verse plane, and the celiac and superior mesentericarteries are noted arising from the anterior aspect ofthe aorta. In 75% of patients, the left renal veincrosses anterior to the abdominal aorta, as it entersthe inferior vena cava. These two ultrasound land-marks (origin of the superior mesenteric artery andleft renal vein crossing anterior to the aorta) areimportant for the identification of the right renalartery. The right renal artery arises in an anteriorapproach, and then courses in posterior fashion as itenters the hilum of the kidney. The left renal arterygenerally arises inferior to the right, and takes aposterior course. The Doppler cursor, at a 60-degreeangle (or less), is placed within the aorta, and thenwalked into the ostium of the right renal artery. PSVand peak end-diastolic velocities are obtained in theorigin, proximal, mid, and, if possible from thisorientation, distal renal artery. The renal arteryDoppler waveform has a characteristic low-resistantsignal, with significant forward diastolic flow. Simi-lar measurements are obtained from the left renalartery. It is critical that the entire renal artery isvisualized, so that a focal stenosis or web (in thecase of fibromuscular dysplasia) is not overlooked.Both renal veins are noted to be patent or occluded.
The patient is then placed in the left lateraldecubitus position, and the right kidney is visual-ized from the flank. Three discrete measurementsof the pole-to-pole length of the kidney are re-corded, in centimeters. Doppler velocities in thecortex, medulla, and hilum of the kidney arerecorded at a 0-degree angle, with a large samplevolume, as discrete parenchymal vessels are diffi-cult to identify. The Doppler transducer is thenmoved slightly anteriorly, and attempts are madeto visualize the entire right renal artery from the
aorta to the hilum of the right kidney. Thisbanana-peel technique can be particularly helpfulin imaging and analyzing the entire renal artery. Alimitation of the banana-peel approach on theright is the presence of the overlying inferior venacava, a problem that does not occur on thecontralateral side. This process is then repeatedwith the patient in the right lateral decubitusposition in an effort to interrogate the left kidneyand entire left renal artery.
TECHNIQUE OF ABDOMINALAORTIC ULTRASOUND
The patient is required to fast before the study. Toevaluate an aortoiliac segment, an ultrasound ma-chine with a low-frequency transducer (2.4 MHz) isneeded. A midrange transducer (4-8 MHz) is typi-cally used for femoral or popliteal aneurysms. Theexamination of an aneurysm should be focused ondetermining the aneurysmal size, shape, location(infrarenal or suprarenal), and distance from otherarterial segments.
Ultrasound scanning begins in the supine posi-tion. To facilitate accurate measure of its size, 3sonographic views of the abdominal aorta are usu-ally obtained: transverse plane (A-P diameter andtransverse diameters), the sagittal plane (A-P diame-ter), and coronal plane (longitudinal and transversediameters). Of note, the transducer should be ori-ented so that the maximal length of the segment isvisualized. The transducer is then rotated 90 degreesto achieve a transverse view. If overlying bowel gasobstructs the aorta from view, patients are placed inthe decubitus position and the aorta is visualized bythe coronal plane through either flank. The celiacartery may emerge from the aorta and branchi intothe common hepatic and splenic arteries. In addi-tion, the right renal artery may be seen emergingfrom the aorta and traveling under the inferior venacava.
The most reliable view for measurement of theabdominal aorta is the anterior-posterior image. Thelateral view is often the least accurate view becauseof specular reflection artifact from the vessel wall.Hindrances to an adequate examination includeoverlying bowel gas and obesity, especially in theregion of the proximal neck.30
TECHNIQUE OF SEGMENTAL LIMBPRESSURE MEASUREMENT
Segmental limb pressures are typically measured inconjunction with segmental limb plethysmography(pulse volume recordings). Both procedures areperformed using pneumatic cuffs that are appropri-
ately sized to the diameter of the limb segment
Journal of the American Society of EchocardiographyVolume 19 Number 8 Gerhard-Herman et al 971
under study and are properly positioned. It is com-mon practice to evaluate the presence of arterialblood flow in the limb distal to the cuff with anappropriate sensor before measuring pulse volumerecordings. The patient is initially placed in thesupine position for at least 10 minutes before mea-suring limb pressures. There are several commer-cially available devices that have pneumatic cuffswith automatic inflation capability. A continuouswave Doppler instrument with a transducer frequencyof 4 to 8 MHz is the preferred instrumentation todetect Doppler arterial signals. The pneumatic cuff isinitially inflated quickly to a supersystolic value. Thecuff is then slowly deflated until a flow signalreturns. The cuff pressure at which the flow signalresumes is taken to be the systolic pressure in thearterial segment beneath the cuff. For example, ifthe cuff is on the high thigh and the sensor is in thepopliteal fossa, the measured pressure is reflectiveof the proximal superficial femoral and profundafemoris arteries, and any collateral arteries, not thepopliteal artery. Although published studies indicatethat the measured pressure is slightly more accuratewhen the flow sensor is positioned in close proxim-ity to the cuff, most laboratories for convenience usethe Doppler signal from an artery at the ankle for alllimb measurements.
Many laboratories use a 4-cuff method wherecuffs are positioned as follows: at the high thighwith the upper edge of the cuff positioned at thetop most portion of the inner thigh, at the lowthigh above the patella, at the calf below the tibialtubercle, and at the ankle above the malleoli. Analternative method involves using only 3 cuffswith a single, relatively wide cuff at the midthigh.Typically, the foot pressure is measured by in-sonating the posterior tibial and anterior tibialarteries at the ankle level, thus, generating twonumbers. Single pressure measurements are madefor the calf and the high- and low-thigh levelsregardless of the tibial signal selected as the flowindicator. The ankle pressures are used to calcu-late the ankle-brachial index for each extremity.Each of the ankle pressures is divided by thehighest brachial artery pressure.
The lower extremity pressure evaluation beginsat the ankle level with a systematic search forarterial signals at ascending levels. Patients whoare found to have a normal ankle-brachial indexare unlikely to have more proximal disease and anexercise treadmill test or reactive hyperemia testwould be necessary to uncover subcritical steno-sis. In addition, if the ankle-brachial index isnormal and the symptoms are present in the digitsof the feet, the toes should be evaluated for thepresence of pedal or digital artery obstruction
using appropriately sized cuffs.TECHNIQUE OF PULSE VOLUMEPLETHYSMOGRAPHY
Plethysmography, derived from the Greek “plethys-mos,” meaning “increase,” is used to describe thechange in the volume of a limb occurring in re-sponse to blood flow into and/or out of that limb.This assessment is made in conjunction with thesegmental Doppler pressure measurements. Thepulse volume curve is analogous to the arterialpressure pulse. An advantage of using pulse volumerecording amplitudes is that they are valid whenexamining calcified vessels, because the test doesnot rely on occlusion of the calcified artery as isnecessary for segmental pressure measurement. Seg-mental limb plethysmography (pulse volume record-ings) is done using pneumatic cuffs, which areappropriately sized to the diameter of the limbsegment under study and are properly positioned.Each cuff is sequentially inflated to a predeterminedreference pressure. A cuff pressure of 65 mm Hg hasbeen found to achieve surface contact of the cuff tothe skin and at the same time impart a reproduciblecontour characteristic of plethysmography. Plethys-mographic waveforms are recorded for each limbsegment. Of note, cuff placement may need to bereadjusted to ensure that the selected cuff pressurecan be achieved within a narrow range of cuffinflation volume. Bilateral testing is considered anintegral part of each examination.
TECHNIQUE OF EXERCISE TESTING
Patients fast for 12 hours before the treadmill test.Before walking on the treadmill, patients are in-structed to alert the technician regarding develop-ment of any pain. The standard treadmill test isperformed at a speed of 2 mile/h and a grade of 12%.The exercise treadmill study is stopped immediatelyif the patient develops chest pain, or if shortness ofbreath and dizziness impair the patient’s ability tocontinue. The test is continued otherwise for 5minutes or until the patient stops secondary toclaudication.
After the treadmill is stopped, the patient isimmediately brought to a table and placed in thesupine position. The ankle pressures are obtainedinitially, starting with the symptomatic leg. Theankle pressures are repeated every 30 seconds forthe first 4 minutes and then every minute for up to10 minutes. The pressure measurement routine isstopped earlier if the pressure returns to baseline. Ofnote, the brachial systolic pressure should be re-corded immediately at the first set of ankle pressuresand at the end of the postexercise ankle pressures. If
available, a second technologist should take the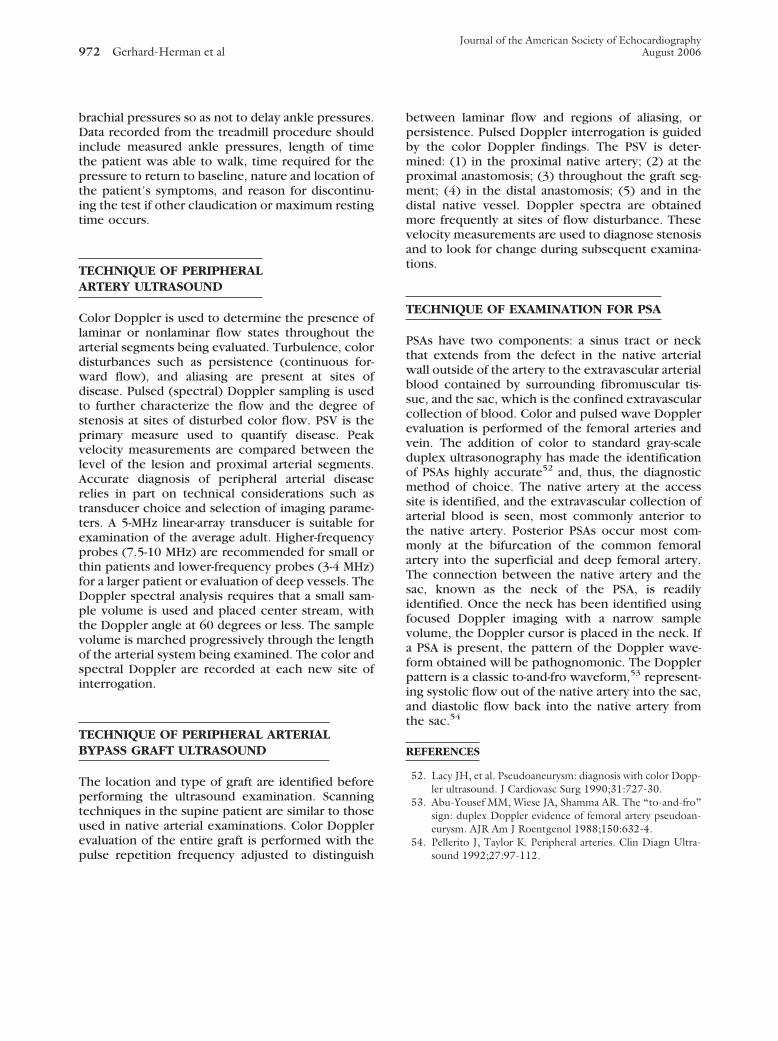
Journal of the American Society of Echocardiography972 Gerhard-Herman et al August 2006
brachial pressures so as not to delay ankle pressures.Data recorded from the treadmill procedure shouldinclude measured ankle pressures, length of timethe patient was able to walk, time required for thepressure to return to baseline, nature and location ofthe patient’s symptoms, and reason for discontinu-ing the test if other claudication or maximum restingtime occurs.
TECHNIQUE OF PERIPHERALARTERY ULTRASOUND
Color Doppler is used to determine the presence oflaminar or nonlaminar flow states throughout thearterial segments being evaluated. Turbulence, colordisturbances such as persistence (continuous for-ward flow), and aliasing are present at sites ofdisease. Pulsed (spectral) Doppler sampling is usedto further characterize the flow and the degree ofstenosis at sites of disturbed color flow. PSV is theprimary measure used to quantify disease. Peakvelocity measurements are compared between thelevel of the lesion and proximal arterial segments.Accurate diagnosis of peripheral arterial diseaserelies in part on technical considerations such astransducer choice and selection of imaging parame-ters. A 5-MHz linear-array transducer is suitable forexamination of the average adult. Higher-frequencyprobes (7.5-10 MHz) are recommended for small orthin patients and lower-frequency probes (3-4 MHz)for a larger patient or evaluation of deep vessels. TheDoppler spectral analysis requires that a small sam-ple volume is used and placed center stream, withthe Doppler angle at 60 degrees or less. The samplevolume is marched progressively through the lengthof the arterial system being examined. The color andspectral Doppler are recorded at each new site ofinterrogation.
TECHNIQUE OF PERIPHERAL ARTERIALBYPASS GRAFT ULTRASOUND
The location and type of graft are identified beforeperforming the ultrasound examination. Scanningtechniques in the supine patient are similar to thoseused in native arterial examinations. Color Dopplerevaluation of the entire graft is performed with the
pulse repetition frequency adjusted to distinguishbetween laminar flow and regions of aliasing, orpersistence. Pulsed Doppler interrogation is guidedby the color Doppler findings. The PSV is deter-mined: (1) in the proximal native artery; (2) at theproximal anastomosis; (3) throughout the graft seg-ment; (4) in the distal anastomosis; (5) and in thedistal native vessel. Doppler spectra are obtainedmore frequently at sites of flow disturbance. Thesevelocity measurements are used to diagnose stenosisand to look for change during subsequent examina-tions.
TECHNIQUE OF EXAMINATION FOR PSA
PSAs have two components: a sinus tract or neckthat extends from the defect in the native arterialwall outside of the artery to the extravascular arterialblood contained by surrounding fibromuscular tis-sue, and the sac, which is the confined extravascularcollection of blood. Color and pulsed wave Dopplerevaluation is performed of the femoral arteries andvein. The addition of color to standard gray-scaleduplex ultrasonography has made the identificationof PSAs highly accurate52 and, thus, the diagnosticmethod of choice. The native artery at the accesssite is identified, and the extravascular collection ofarterial blood is seen, most commonly anterior tothe native artery. Posterior PSAs occur most com-monly at the bifurcation of the common femoralartery into the superficial and deep femoral artery.The connection between the native artery and thesac, known as the neck of the PSA, is readilyidentified. Once the neck has been identified usingfocused Doppler imaging with a narrow samplevolume, the Doppler cursor is placed in the neck. Ifa PSA is present, the pattern of the Doppler wave-form obtained will be pathognomonic. The Dopplerpattern is a classic to-and-fro waveform,53 represent-ing systolic flow out of the native artery into the sac,and diastolic flow back into the native artery fromthe sac.54
REFERENCES
52. Lacy JH, et al. Pseudoaneurysm: diagnosis with color Dopp-ler ultrasound. J Cardiovasc Surg 1990;31:727-30.
53. Abu-Yousef MM, Wiese JA, Shamma AR. The “to-and-fro”sign: duplex Doppler evidence of femoral artery pseudoan-eurysm. AJR Am J Roentgenol 1988;150:632-4.
54. Pellerito J, Taylor K. Peripheral arteries. Clin Diagn Ultra-
sound 1992;27:97-112.