guidelines for preparing quality assurance project plans ... · guidelines for preparing . quality...
TRANSCRIPT
Guidelines for Preparing Quality Assurance Project Plans
for Environmental Studies
July 2004 (Revised December 2016)
Publication No. 04-03-030 Revision of Publication No. 01-03-003
Publication Information This publication is available on the Department of Ecology’s website at http://www.ecy.wa.gov/biblio/0403030.html
This document is a revision of the Ecology Publication No. 01-03-003, Guidelines for Preparing Quality Assurance Project Plans for Environmental Studies, February 2001.
Authors, 2004 Stewart M. Lombard, PhD, Quality Assurance Coordinator, Environmental Assessment Program, Washington State Department of Ecology Cliff J. Kirchmer, PhD, Quality Assurance Officer, Washington State Department of Ecology Contact Information, 2016 William R. Kammin Quality Assurance Officer Washington State Department of Ecology Email: [email protected] Phone: 360-407-6964 Communication Consultant: 360-407-6764 Quality Assurance Website, 2016 Ecology’s Quality Assurance website: http://www.ecy.wa.gov/programs/eap/quality.html
Any use of product or firm names in this publication is for descriptive purposes only and does not imply endorsement by the author or the Department of Ecology.
Accommodation Requests: To request ADA accommodation including materials
in a format for the visually impaired, call Ecology at 360-407-6764. Persons with impaired hearing may call Washington Relay Service at 711.
Persons with speech disability may call TTY at 877-833-6341.
Guidelines for Preparing Quality Assurance Project Plans
for Environmental Studies
by Stewart M. Lombard
and Cliff J. Kirchmer
Environmental Assessment Program
P.O. Box 488 Manchester, WA 98353-0488
July 2004 (Revised December 2016)
Publication No. 04-03-030 Revision of Publication No. 01-03-003

This page is purposely left blank
Page i
Table of Contents
Page
Abstract .............................................................................................................................. iii Introduction ..........................................................................................................................1
Overview of Quality Assurance and the Planning Process .................................................3 Purpose of a QA Project Plan ........................................................................................4 Preparing a QA Project Plan ..........................................................................................4 Responsibility for Preparing QA Project Plans .............................................................5 Responsibility for Reviewing and Approving QA Project Plans...................................6 Role of the Laboratory in a Project ................................................................................6
Elements of a QA Project Plan ............................................................................................7 1. Title Page with Approvals ........................................................................................9 2. Table of Contents and Distribution List..................................................................10 3. Background .............................................................................................................11 4. Project Description..................................................................................................12 5. Organization and Schedule .....................................................................................14 6. Quality Objectives ..................................................................................................15 7. Sampling Process Design (Experimental Design) ..................................................23 8. Sampling Procedures ..............................................................................................26 9. Measurement Procedures ........................................................................................29 10. Quality Control .....................................................................................................32 11. Data Management Procedures ..............................................................................38 12. Audits and Reports ................................................................................................39 13. Data Verification and Validation ..........................................................................40 14. Data Quality (Usability) Assessment ....................................................................41
Cited References ................................................................................................................43
EPA Quality System Documents .......................................................................................44
Additional Readings...........................................................................................................45
Appendices A. Glossary B. Systematic Planning C. QA Project Plan Review Checklist D. Comparison of QA Project Plan Elements for EPA and Ecology E. Effects of Errors on Decision-making F. Approach to Analytical Quality Control of the Water Research Centre G. Statistical Calculations Related to Data Quality H. Examples of Tables I. Calibration J. Web Sites K. QA Project Plan Template (December 2016) L. QA Project Plan Peer Reviewer Checklist and Router (December 2016)

Page ii
This page is purposely left blank
Page iii
Abstract Each environmental study conducted by or for the Washington State Department of Ecology must have an approved Quality Assurance (QA) Project Plan. The QA Project Plan describes the objectives of the study and the procedures to be followed to achieve those objectives. The QA Project Plan is a product of a systematic planning process. The preparation of a QA Project Plan helps focus and guide the planning process and promotes communication among those who contribute to the study. The completed plan provides direction to those who carry out the study and forms the basis for written reports on the outcome. This document presents detailed guidance on preparing a QA Project Plan. It describes 14 elements to be addressed in the plan and provides supporting information relevant to the content of each element. This document is a revision of the Ecology publication No. 01-03-003, Guidelines for Preparing Quality Assurance Project Plans for Environmental Studies, February 2001.

Page iv
This page is purposely left blank
Page 1
Introduction Washington State Department of Ecology (Ecology) Policy 1-21 requires the preparation of a Quality Assurance (QA) Project Plan for each study that acquires new environmental measurement data or uses existing data. This document describes the content of a QA Project Plan for studies conducted by or for Ecology. The QA Project Plan integrates the contributions of everyone involved in the study into a statement of exactly what needs to be accomplished, when and how it will be done, and by whom. It is a guide for those who implement the study as well as a basis for preparing reports on the outcome. Planners should use a “graded approach” in which the content and level of detail in a QA Project Plan depends on the type of project and the intended use of the data. Preparing a QA Project Plan should be a team effort coordinated by the project manager. The team includes (where applicable) the client, representatives of the analytical laboratory (or laboratories), field staff, and anyone else who will contribute to the study. The team might also include specialists to provide advice on QA, information management, and statistics. A small project may not require a formal team, but rather one person interacting with people, as needed, one-on-one or in small groups. While not usually part of the planning team, decision-makers and others with an interest in the project should be informed and consulted during planning. Once the goals of the study have been formulated, a meeting of the project team should be held to develop specific objectives for the project and to decide on the best methods to achieve them. Field work must not begin until the plan has been approved and distributed for implementation by the appropriate personnel. Once a QA Project Plan has been approved for a study, it may be used as a template for planning similar studies. Information specific to a new study can be inserted into the original plan. For emergency response activities, a QA Project Plan template can be prepared in advance based on available knowledge and experience, and updated as needs evolve. In this case, the plan becomes a valuable training aid for emergency response staff. Some programs require preparation of Sampling and Analysis Plans (SAPs) that generally cover information on sampling and analysis similar to that required in a QA Project Plan. Within Ecology, the Toxics Cleanup Program requires the preparation of SAPs to comply with the Model Toxics Control Act Cleanup Regulation, Chapter 173-340 WAC. These QA Project Plan guidelines are identified by the Toxics Cleanup Program as one of the guidance documents to be used in preparing SAPs. Preparing a QA Project Plan requires an understanding of basic concepts related to sampling, field and laboratory measurements, and assessment of data quality.
Page 2
Appendices provide information, starting with a Glossary in Appendix A, to supplement the topics covered in these guidelines. References are listed at the end of this document, followed by lists of QA requirements and guidance documents published by EPA’s Quality Staff as well as additional readings on selected topics. The requirements documents provide information on satisfying the federal regulations for organizations receiving financial assistance from EPA through extramural agreements (e.g., contracts, grants, cooperative agreements, and interagency agreements). The guidance documents are intended to assist in developing and implementing a suitable Quality System, including the preparation of QA Project Plans. This document is a revision of Ecology Publication No. 01-03-003, Guidelines for Preparing Quality Assurance Project Plans for Environmental Studies, February 2001.
Page 3
Overview of Quality Assurance and the Planning Process
In this document, Quality Assurance (QA) means a process for assuring the reliability of measurement data. QA principles and practices enable you to acquire data of the type and quality you need. The quality of the data must be documented in order to be scientifically and legally defensible. In addition to the preparation of QA Project Plans, the following quality system components help ensure that data quality needs are met:
• Ecology’s QA Policy (Executive Policy 1-21) and Quality Management Plan (Ecology, 2000)
• Manchester Environmental Laboratory QA Manual (Ecology, 2003a) • Manchester Environmental Laboratory Lab Users Manual (Ecology, 2003b) • Staff training in the principles and practices of QA • Systematic planning • Preparation and use of standard operating procedures (SOPs) • Use of appropriate quality control (QC) procedures • Verification and validation of data • Assessment to determine whether the data support the project objectives • Quality improvement through audits of systems and performance • Accreditation of environmental laboratories providing data to Ecology Ecology makes important decisions on strategies for protecting the environment and dealing with pollution. Physical, chemical, and biological data often form the basis for these decisions. QA helps ensure that data acquired by and for Ecology support correct decisions. The potential consequences of inadequate data quality include:
• Faulty decisions • Wasted resources • Legal liability • Increased risk to human health and the environment • Inadequate understanding of the state of the environment • Loss of credibility • Unnecessary regulation • Failure to regulate when necessary
Page 4
Systematic Planning Systematic planning is a process in which you identify the problem to be studied and/or the decision to be made, and then define the project’s objectives, the type, quantity, and quality of information needed, the technical and QC activities, and the level of oversight that will ensure project criteria are satisfied. This information is documented in a logical sequence in the QA Project Plan. There are two main approaches to systematic planning mentioned in these guidelines: (1) the Data Quality Objectives (DQO) Process; and (2) the Performance and Acceptance Criteria (PAC) Process. A summary explanation of systematic planning, including the DQO and PAC approaches, is given in Appendix B, and a detailed explanation of the DQO Process is provided in EPA QA/G-4. Purpose of a QA Project Plan The purpose of preparing a QA Project Plan is to ensure that all necessary steps are taken to acquire data of the type and quality needed. A project or study is a logical sequence of activities grouped into three categories:
Planning → Implementation → Assessment A QA Project Plan documents the planning phase and guides implementation and assessment. A QA Project Plan
• Lists the goals and objectives of a study • Identifies the type and quality of data needed • Describes the sampling and measurement procedures needed to acquire those data • Describes the QC and assessment procedures needed to ensure that the study
objectives are met Preparing a QA Project Plan A systematic or step-wise planning process is essential to the successful acquisition of useful environmental data. Once you begin field work, your options are limited by what you know and what you have with you. Ecology Policy 1-21, Establishing Quality Assurance, applies to environmental data collection studies/activities conducted or funded by Ecology. The policy states that a QA Project Plan “is prepared for each environmental study/activity that acquires or uses environmental measurement data.”
Page 5
The levels of effort and detail in preparing a QA Project Plan should be commensurate with the scope of the study and available resources. The planning process generates performance and acceptance criteria for the quality of data as well as objectives for the quality of decisions made on the basis of those data. Preparation of a QA Project Plan serves three important functions:
• Focuses the project team on issues affecting data quality while they can still be effectively addressed (i.e., before data are acquired).
• Promotes and facilitates communication among those involved in the project.
• Compiles information needed for project implementation and assessment. The credibility of your data may be compromised if the procedures used to acquire them are not adequately documented. The QA Project Plan provides important initial documentation of your study and identifies other necessary documentation such as:
• Standard operating procedures (SOPs) • Field logs • Outputs from field instruments • Chain-of-custody records • Lab records and reports • Photos and drawings • Project reports
Responsibility for Preparing QA Project Plans Those with responsibility for QA Project Plans include: • Ecology staff with overall responsibility for conducting a project (project managers)
prepare QA Project Plans with input from their project teams.
• Ecology staff who administer grants or contracts for projects which acquire environmental data ensure that satisfactory QA Project Plans are prepared by the grantees or contractors.
• Ecology staff with oversight responsibility for projects conducted to comply with regulations or agreements ensure that satisfactory QA Project Plans are prepared by or for the responsible parties.
• Organizations funded by Ecology for environmental data collection studies and activities that acquire and use environmental measurement data are required to prepare QA Project Plans.
Page 6
Responsibility for Reviewing and Approving QA Project Plans At Ecology, QA Project Plans are generally reviewed by the project manager’s supervisor, the client, laboratory QA staff (if laboratory services are required), the program QA Coordinator or agency QA Officer, and other key staff as appropriate. Allow at least two weeks for review. Some Ecology programs have standard procedures governing review and approval of QA Project Plans. Ecology staff with specialized expertise may be available to review your plan. Appendix C is a checklist to aid in the review of QA Project Plans. The project manager makes any necessary changes to the plan based on reviewers’ comments and submits the revised plan for approval signatures. Plans prepared by Ecology should be approved by all reviewers. The agency QA Officer must approve all project plans submitted to EPA. Copies of the approved QA Project Plan are distributed to the signatories and to everyone responsible for implementing the study. QA Project Plans prepared by Ecology’s Environmental Assessment Program are available as publications on Ecology’s internet web site at http://www.ecy.wa.gov/biblio/eap.html. The QA Project Plan must be approved and distributed before field work is started. Conditional approval for implementation may be given when only non-critical deficiencies remain to be resolved. The plan is then resubmitted for final approval when the information is finalized. The plan is a living document that should be updated during the course of a study whenever it is appropriate to do so. Role of the Laboratory in a Project The management and staff of the laboratory contribute to the success of the project by:
• Advising on selection of analytical methods that meet measurement quality objectives (MQOs)
• Advising on acceptance criteria for data drawn from existing sources (i.e., secondary sources)
• Reviewing and approving the QA Project Plan • Providing containers and other sampling supplies (e.g., labels, forms) • Analyzing samples using the methods selected for the project • Carrying out appropriate QC procedures to confirm that MQOs have been met • Reporting results for samples and QC procedures • Documenting performance characteristics for methods used • Providing information on how QC limits are set and how they are used for lab QC • Reviewing data and verifying results
Page 7
Elements of a QA Project Plan The following elements comprise a complete QA Project Plan:
1. Title Page with Approvals 2. Table of Contents and Distribution List 3. Background 4. Project Description 5. Organization and Schedule 6. Quality Objectives 7. Sampling Process Design (Experimental Design) 8. Sampling Procedures 9. Measurement Procedures 10. Quality Control 11. Data Management Procedures 12. Audits and Reports 13. Data Verification and Validation 14. Data Quality (Usability) Assessment The project manager may decide that some elements can be omitted or merged into other elements. Factors which influence these decisions include the scope and complexity of the project, the number of staff involved and their level of expertise, and past problems which could be avoided by clearly stating expectations in the plan. Criteria to help the project manager make these decisions are provided in the discussions of the individual elements that follow. If you omit an element because it is not applicable, state why it was omitted. The level of detail in a QA Project Plan depends on the type and complexity of the project and the intended use of the data. The information in the QA Project Plan must be sufficiently detailed to allow those responsible for review, approval, and implementation of the plan to understand what is to be done and the reasons for doing so. Documents containing information relevant to the study are referenced in, or appended to, the QA Project Plan. Project plans prepared to meet EPA requirements must address the elements described in the most recent versions of EPA Documents QA/R-5, EPA Requirements for Quality Assurance Project Plans, and QA/G-5, Guidance for Quality Assurance Project Plans. See Appendix D for a list of the elements included in these documents.

Page 8
For hazardous waste programs, especially those that are Superfund related, you may need to follow the Uniform Federal Policy for Quality Assurance Project Plans prepared by the Intergovernmental Data Quality Task Force (IDQTF, 2003). The following pages provide guidelines for the information to be included in each of the 14 elements of a QA Project Plan. Key information to be included in each element is highlighted in bold type.
Page 9
1. Title Page with Approvals The following information is presented on the title pages of the plan:
• Title
• Author
• Author’s organization
• Date the plan was prepared or revised
• Other information useful in identifying the study (e.g., a document, grant, geographic location, or contract identifier)
• Spaces for approval signatures and dates Plans prepared by Ecology usually include an additional cover page without the signatures. Signatures indicate both approval of the plan and commitment to support implementation of the procedures specified. Plans prepared by Ecology should be approved by: • The project manager • The project manager’s supervisor • The client • A representative of the laboratory, if a lab is involved in the project • The program QA Coordinator or agency QA Officer • Other key staff as appropriate At Ecology, the agency QA Officer must approve all project plans submitted to EPA. For projects conducted under a grant or contract, the Ecology grant or contract administrator may approve the plan after comments from technical reviewers have been addressed.
Page 10
2. Table of Contents and Distribution List Include a Table of Contents. The table should be included if it would be helpful to those using the plan, as is the case for longer plans. It directs the user to the project plan elements and to tables, figures, references, and appendices. Those who will receive copies of the approved plan may be listed after the Table of Contents. Provide names of individuals, along with their affiliation, address, phone number, and e-mail address.
Page 11
3. Background One of the first steps in a systematic planning process is to give an overview of why the project is needed. This element and the next describe why the project will be done and what needs to be done; these may be combined into a single element if that would improve clarity. Provide enough background information so that the reasons for conducting the study are clear. Give the reader a perspective of the present situation and the events leading up to it. For projects in which new data are to be collected, it may be necessary to make a reconnaissance visit to gather information on conditions, accessibility, and activity in the area, before completing your plan. Where applicable, provide the following: Describe the study area and surroundings. Include sufficient detail that reviewers can determine whether the study design and field procedures are appropriate. Include maps, photos, or drawings of the site or area. Mention any logistical problems with the study area. Note items such as limited access or the presence of hazardous substances which require unusual procedures. Relate the history of the study area. Use drawings or photographs to support the narrative. Identify parameters or contaminants of concern, and state why they are of concern. Include information on the sources, forms, quantities, and fates of known or suspected contaminants. Summarize the results and conclusions of previous studies. Provide all information relevant to the study being planned. This should include existing data, using tables and charts if necessary. State how these data are relevant to the objectives of your new study. Reference the reports that are the sources of these data. Identify important related criteria or standards.
Page 12
4. Project Description From the information in Element 3 and outputs from your systematic planning process, provide the following: State your goals. The goals are your reasons for conducting the project.
Describe the nature of the problems that will be studied, the questions to be answered, the decisions to be made, and the actions that might result from the decisions.
State your objectives. The objectives are what you want to accomplish. It is essential to document your overall project objectives because they form the basis for the rest of the plan. Clear objectives preclude unrealistic expectations and facilitate planning and communication. More specific objectives for the quality of the decisions and measurements will be included in Element 6.
Identify the information, including data, needed to meet your objectives.
Provide just a summary here. Details will be covered in the subsequent elements of the plan. Indicate which information is already available from previous studies and which will require new environmental measurements. Identify which parameters or contaminants of concern need to be identified and measured.
Identify the target population. The target population might be one of the strata in a lake in the springtime, contaminated soil at an abandoned industrial facility, or tissue from the shellfish in a particular estuary. The population is characterized by its boundaries in time and space as well as its relationship to its surroundings. Define the study boundaries. This will help ensure that data will be representative of that population. Use existing information and professional judgment to stratify or segregate the population into categories with homogenous characteristics.
Identify any practical constraints on the study design. Include items such as seasonal or meteorological conditions, limited access, or availability of personnel or equipment.
Page 13
Summarize the tasks that will be required to collect the data. Describe any decisions that will be made using the project data. An objective of some environmental studies is to acquire data for comparison to specific regulatory criteria or to existing data. The comparison then forms the basis for a decision on whether some action is required. Decisions are rarely made on the basis of a single result. Appendix E provides a discussion of the effects of errors on decisions. Decision quality is addressed in Element 6, Quality Objectives.
Page 14
5. Organization and Schedule Identify members of the project planning team, decision-makers, and interested parties. Study participants need a clear understanding of their roles and their relationship to the overall effort. A planning team meeting is recommended to discuss individual roles and responsibilities and the schedule for implementing the plan. For a small project, it may be sufficient to have one person interacting with others, as needed, one-on-one or in small groups, rather than in formal meetings. Identify everyone involved in implementing the study and assessing the data. Include names, organizations, phone numbers, and responsibilities of key personnel. For large studies, include an organization chart showing the lines of communication among participants. Include a schedule for the project. Provide proposed dates for • Reconnaissance visits • Preparation and approval of the QA Project Plan • Field activities • Delivery of samples to the laboratory • Reporting measurement results • Verification and validation of data • Data entry to Ecology’s Environmental Information Management System (EIM) or
other database • Progress, draft, and final reports, as needed • Disposal of samples The final preparation of the schedule may be one of the last steps in the preparing the project plan. Describe limitations imposed on the schedule. Discuss factors such as weather, seasonal conditions, equipment availability, etc. Plan to keep the laboratory informed of your schedule for delivery of samples. Plan to obtain all necessary collection permits and permissions to access property and take samples before scheduling reconnaissance visits or field activities. Include budget information for the project, if required.
Page 15
6. Quality Objectives There are several factors that affect the quality and usefulness of data, and therefore impact the decisions made on the basis of those data. The overall quality of your data will be determined by a combination of those factors. Data may be affected by systematic errors (i.e., bias) and are always subject to random errors. It is often necessary to report results at very low concentrations, where random error is generally large relative to concentration. Quality objectives need to be specified at two levels when critical decisions must be made and at only one level when decision-making is not the purpose of data collection. There are several approaches to systematic planning. Summary descriptions of these are given in Appendix B. The approach used for systematic planning will depend on whether or not decision-making is a primary purpose of data collection. Precision, bias, and sensitivity are data quality indicators used in establishing quality objectives. Other data quality indicators are representativeness, comparability, and completeness; these are discussed in Element 7, Sampling Process Design. Before reading the following guidelines for the quality objectives that need to be specified in your plan, it is recommended that you read the addendum to this element, which includes background information on the concepts of precision, bias, and sensitivity. Decision Quality Objectives When data will be used to select between two clear alternative conditions or to determine compliance with a standard, such as in some hazardous-waste site cleanups, quality objectives at the level of the decision are required. They specify how good a decision must be, but do not directly set criteria for the quality of the data or express data quality characteristics. The outputs of a Decision (or Data) Quality Objectives (DQO) Process are needed to determine the number of samples that must be taken and analyzed. A brief explanation of the DQO Process is provided in Appendix B, and detailed explanations are given in EPA QA/G-4, Guidance for the Data Quality Objectives Process and EPA QA/G-4HW, Data Quality Objective Process for Hazardous Waste Site Investigations. Appendix E explains the statistical basis for decision-making. Measurement Quality Objectives Measurement quality objectives (MQOs) specify how good the data must be in order to meet the objectives of the project. MQOs are the performance or acceptance thresholds or goals for the project’s data, based primarily on the data quality indicators precision, bias, and sensitivity. Another name for MQOs is measurement performance criteria (MPC). For existing data, these correspond to acceptance criteria.
Page 16
MQOs are included in all QA Project Plans. In the DQO Process, the tolerable limits on decision errors are the basis for specifying the MQOs. In other projects when data are being used to support estimation, modeling, or research and are not directly linked to a decision, the required accuracy of measurement results is the basis for establishing MQOs. MQOs are used to select procedures for sampling, analysis, and quality control (QC). A simple approach to specifying MQOs is recommended for most projects. In this approach, MQOs are expressed in the same units used for reporting QC sample results. This facilitates data validation, since the results for QC sample analyses can be compared directly to determine whether the MQOs have been met. Although the MQOs are expressed in the same units as QC sample results, they do not specify the analytical method or technology to be used. The MQOs selected should be compatible with the requirements for accuracy (precision and bias), as defined in the addendum to this element. The following examples are stated in the same units used by the laboratory for reporting their QC results. Examples of MQOs for a project analyzing metals in water samples are:
• Check Standards/Lab Control Samples – 85 to 115% Recovery • Duplicate Sample Analyses – ≤ 20% Relative Percent Difference (RPD) • Matrix Spike Recoveries – 75 to 125% • Duplicate Matrix Spikes – ≤ 20% RPD Examples of MQOs for a project analyzing orthophosphate and nitrate in water samples are: • Check Standards/Lab Control Samples – 80 to 120% Recovery • Duplicate Sample Analyses – ≤ 20% RPD • Matrix Spike Recoveries – 75 to 125% • Duplicate Matrix Spikes – ≤ 20% RPD Examples of MQOs for a project analyzing organochlorine pesticides in water samples by EPA method 8081 are:
• Check Standards/Lab Control Samples – 30 to 150% Recovery • Surrogate Compounds – 30 to 150% Recovery • Duplicate Sample Analyses – ≤ 50% RPD • Matrix Spike Recoveries – 30 to 150% • Duplicate Matrix Spikes – ≤ 50% RPD
Page 17
See Element 10, Quality Control, and Appendix G for explanations of the QC terms used above. Some parameters, such as Biochemical Oxygen Demand (BOD), and bacteriological determinations are defined operationally by the procedures used in their determination. There are no standard solutions that can be used to check overall accuracy, although it may be possible to check precision. For those parameters, it is important to ensure that the written procedures are followed exactly, and MQOs may be limited to the precision for replicate analyses of samples and standards. For some field measurements, such as pH, temperature, and electrical conductivity, fewer MQOs can be specified, since not as many QC checks can be done in the field as in the controlled environment of the laboratory. In those cases, it is important to operationally ensure that instruments are calibrated regularly and the calibration is checked frequently. MQOs can sometimes be expressed in terms of the maximum deviations allowed for calibration checks. MQOs for sensitivity should be expressed as the lowest concentrations of interest. A rule of thumb used to determine the lowest concentration of interest is that it be ten times lower than the reference level used for decision-making (i.e., the standard, criterion, or regulatory limit). For example, if you are determining a substance subject to a water quality standard of 100 μg/L, the smallest concentration of interest should be specified as 10 μg/L. This helps ensure that the method selected for use will be precise enough for reliable decision-making when results are at or near the 100 μg/L water quality standard. For some parameters, such as pH, it may not be meaningful to specify a lowest concentration of interest. Prepare a table summarizing your MQOs for both lab and field measurements. An example of a table of MQOs is given in Appendix H. You can also specify acceptance criteria for data collected previously that will be used during the project. MQOs also may be specified for total random error due to sampling and analysis. However, since there can be many variables affecting sampling error, it is best to set MQOs based on historical data for the parameter in a similar matrix. The most frequently stated MQO for total random error is the precision of duplicate (collocated) field samples in terms of the RPD. An example of another way to express an MQO that includes both sampling and analysis is: “The overall precision of lead measurements taken on the soil in the bins must be less than 50% relative standard deviation when at least 10 samples are taken from each bin.” This and other examples for specifying MQOs in hazardous site characterization and cleanup projects are included in an article by Crumbling (2001).
Page 18
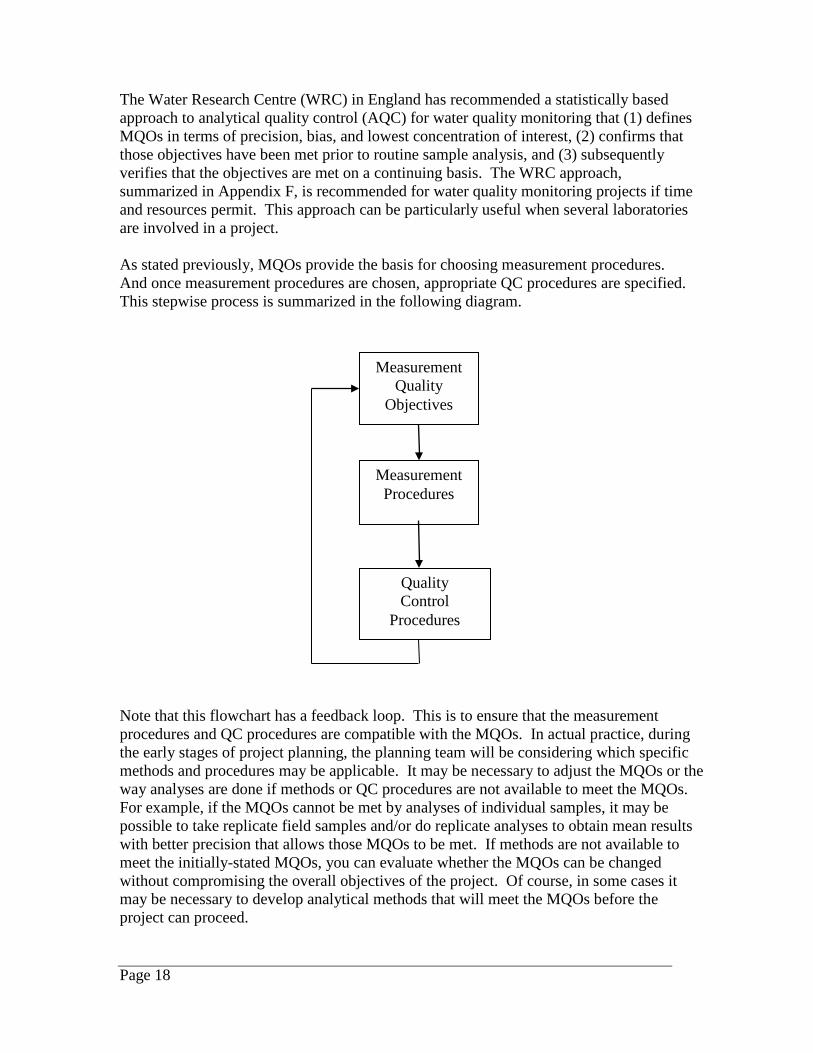
The Water Research Centre (WRC) in England has recommended a statistically based approach to analytical quality control (AQC) for water quality monitoring that (1) defines MQOs in terms of precision, bias, and lowest concentration of interest, (2) confirms that those objectives have been met prior to routine sample analysis, and (3) subsequently verifies that the objectives are met on a continuing basis. The WRC approach, summarized in Appendix F, is recommended for water quality monitoring projects if time and resources permit. This approach can be particularly useful when several laboratories are involved in a project. As stated previously, MQOs provide the basis for choosing measurement procedures. And once measurement procedures are chosen, appropriate QC procedures are specified. This stepwise process is summarized in the following diagram.
Note that this flowchart has a feedback loop. This is to ensure that the measurement procedures and QC procedures are compatible with the MQOs. In actual practice, during the early stages of project planning, the planning team will be considering which specific methods and procedures may be applicable. It may be necessary to adjust the MQOs or the way analyses are done if methods or QC procedures are not available to meet the MQOs. For example, if the MQOs cannot be met by analyses of individual samples, it may be possible to take replicate field samples and/or do replicate analyses to obtain mean results with better precision that allows those MQOs to be met. If methods are not available to meet the initially-stated MQOs, you can evaluate whether the MQOs can be changed without compromising the overall objectives of the project. Of course, in some cases it may be necessary to develop analytical methods that will meet the MQOs before the project can proceed.
Measurement Quality
Objectives
Measurement Procedures
Quality Control
Procedures
Page 19
It may not be possible to meet your MQOs for precision at very low concentrations because relative error increases rapidly near the detection limit. Also, for matrix spikes, the ratio of the amount spiked to the amount present before spiking will affect the percent recoveries. These factors must be taken into account when setting MQOs and interpreting results. See Element 10, Quality Control, for more detail. While emphasis has been placed on defining analytical or measurement MQOs rather than sampling MQOs, it does not imply that measurement error is always greater or more important than sampling error. For many projects, in particular the investigation and restoration of contaminated sites, sampling error rather than analytical error has been found to be the largest source of uncertainty in environmental data. When this is the case, little is gained by minimizing analytical uncertainty if sampling uncertainty is not also addressed. One way to minimize sampling uncertainty is to collect more samples. As cost is often a concern in analyzing samples, one solution may be to use low-cost field analytical methods when available. In this way, many more samples can be analyzed to get a more accurate appraisal of contamination than is possible using conventional laboratory analyses. The next element, Element 7, considers the importance of sampling process design in achieving MQOs.
Page 20
Addendum – Background Information on Precision, Bias, and Sensitivity Precision Precision is a measure of the variability in the results of replicate measurements due to random error. Random errors are always present because of normal variability in the many factors that affect measurement results. Precision can also be affected by the variations of the actual concentrations in the media being sampled. Potential sources of random errors include:
• Field sampling procedures • Handling, transporting, and preparing samples for shipment to the laboratory • Obtaining a subsample from the field sample for analysis • Preparing the sample for analysis at the laboratory • Analysis of the sample (including data handling errors) The magnitude of these errors can be expected to vary during the measurement process and make it more difficult to determine the natural variability of contaminants in the environment. The dispersion (width) of the familiar bell-shaped curve, or normal distribution, provides an estimate of precision. See Appendix G for a discussion of the normal distribution and equations for estimating standard deviation and other measures of precision. Note that any estimate of a population parameter can be improved by increasing the number of results used in the calculation. Historical data may offer an indication of the precision you can expect for the data you plan to acquire. It may be more efficient to use less precise and less expensive screening techniques or measurement procedures if they can meet your MQOs. The standard error (i.e., precision) of the mean is given by s/√n, where s is the estimated standard deviation for the population of individual analytical results. Therefore, if you use the mean of n values as your result, the precision of that result is improved by a factor of 1/√n over that of an individual result (see Appendix G). Thus, a result obtained by averaging the values from several replicate measurements may be as precise as a single value obtained by a procedure with better precision. Composite sampling (i.e., physically combining and homogenizing environmental samples or sub-samples to form a new sample) can also lower the cost of improving precision. Averaging the analytical results of a few composites can produce an estimated mean that is as precise as one based on many more individual sample results.
Page 21
Bias If a physical or chemical measurement is repeated many times using sufficiently sensitive procedures, the results will be distributed symmetrically about their mean value. Conceptually, the analyst could make an infinite number of analyses; this is termed the population. Bias is the difference between the population mean and the true value of the parameter being measured. Unlike random error, bias is generally not reduced by making more measurements. Potential sources of bias include:
• Sampling procedures (including faults in sampling design) • Instability of samples during transportation, storage, or processing • Interference and matrix effects • Inability to measure all forms of the parameter of interest • Calibration of the measurement system • Contamination of equipment, reagents, or containers Bias due to sample collection, transportation, and storage must usually be inferred through careful observation and professional judgment. These errors can be avoided or minimized through use of standardized procedures by properly trained staff. Bias affecting measurement procedures can be inferred from the results of QC procedures involving the use of blanks, check standards, and spiked samples described in Element 10. Generally, it is not possible to directly estimate the total bias of analytical results. Instead, each of the potential sources of bias is evaluated separately. For example, where interference or matrix effects are found, additional cleanup steps may help correct for this source of bias in some analyses. When a measurement result is used to decide whether the true value exceeds a criterion or standard, the possibility of bias must be considered since unidentified bias can lead to an erroneous conclusion. Keep in mind that the most effective way to deal with bias is to select sampling and measurement procedures that are not likely to introduce systematic error in the first place. Note that if a decision will be based on the difference between two results that are equally biased, that difference may not be biased. An example might be the comparison of measurement results from the same laboratory for samples taken upstream and downstream of an outfall. Sensitivity For some projects, an important consideration is selection of a method capable of producing accurate results at or near the reference level(s) for decision-making (i.e., the standard, criterion, or regulatory limit). It is important that the method used for analysis
Page 22
has a detection limit well below the reference level, since precision is poor near the detection limit and decisions should not be based on imprecise data. Sensitivity in analytical chemistry reflects the ability to discern the difference between very small amounts of a substance. In general, sensitivity denotes the rate at which the analytical response (e.g., absorbance, volume, meter reading) varies with the concentration of the parameter being determined. However, as a data quality indicator in this document, sensitivity is also defined in a specialized sense as the lowest concentration of a substance that can be detected or the lower limit of detection described by Morrison (1965). The MQO for sensitivity is the smallest concentration of interest for a project. A rule of thumb is that the smallest concentration of interest be specified as one-tenth the concentration at the reference level for decision-making. The laboratory must be capable of reporting results down to that level. Element 9, Measurement Procedures, discusses how the MQO of smallest concentration of interest is used when choosing an appropriate analytical method. MQOs and Accuracy When MQOs are expressed in the same units as QC sample results, their implications for the accuracy (precision and bias) of sample results may not be apparent. It is important to understand these relationships in order to choose MQOs consistent with the fundamental accuracy requirements for your data. For example, a check standard (lab control sample) recovery range of 85 to 115% indicates that the maximum acceptable percent relative standard deviation (%RSD) for those QC results is 5% or less, assuming that the range corresponds to action limits of ± 3 standard deviations from the mean. Because the recovery limits are symmetrical around 100%, it also indicates that calibration is not a source of bias for these analyses. The only source of bias for analyses of check standards prepared in pure water is calibration, since there should be no interference or matrix effects. A value of 20% RPD for analytical duplicate results corresponds to approximately 14% RSD, using the equation in Appendix G. Matrix spike recoveries that exceed QC limits may indicate the presence of bias due to interference or matrix effects, but there are many variables that can make it difficult to interpret the results of spike recoveries. In general, spike recovery results are most reliable when the ratio of the amount spiked to the concentration before spiking is approximately equal to one. When the ratio is too low, random error makes it more difficult to identify the presence of bias. When the ratio is too high, interference effects at lower concentrations may not be apparent.
Page 23
7. Sampling Process Design (Experimental Design) Prepare your design using the information developed in Elements 3, 4, and 6. It may be helpful to evaluate alternatives and select the most efficient design that will satisfy your objectives. Some regulatory programs have specific requirements for sampling design, and these should be described or referenced in this element. Describe the sampling process design for your study. Include: • Samples to be collected • Chemical, physical, and biological parameters to be determined • Measurements to be done in the field • Measurements to be done in the laboratory • Locations and schedule for sampling and measurements Provide maps or diagrams. Show the physical boundaries of the study area as well as proposed measurement and sampling locations. Some studies may need to include reconnaissance sampling to aid in the selection of sampling locations. Simple conceptual models may be helpful in sampling process design. From a look at the hydrograph, you might conclude there is little difference in dissolved solids from mid-summer through fall because stream discharge remains fairly constant. Therefore minimal sampling during this time should describe the discharge-dissolved solids relationship. Or you might construct a simple diagram of the visitor or population curve as a function of season for a study to determine the influence of domestic waste discharged from a resort area to a river, and sample accordingly. Discuss any assumptions that underlie the design. Indicate how the design relates to the study objectives and to characteristics of the site/area described in the background information. Explain how the proposed sampling frequency and locations relate to the expected temporal and spatial variability of the parameters of interest. A measurement result is an estimate of the amount or concentration of the parameter being determined. The validity of that estimate is affected by the location, timing, and procedures selected for field measurements, sampling, and laboratory analyses.
Page 24
Sometimes sampling locations are defined by the project objectives (e.g., characterize a specific effluent). In other cases, a sampling strategy must be developed. Sampling may be based on probability or professional judgment. Remember that statistical methods are tools to be used in support of common sense and professional judgment, not as a substitute for either. When decisions on sampling will be made in the field, describe the process for making those decisions. Representativeness Obtaining representative measurements or samples requires a good sampling design as well as good execution of that design. A result is representative of a population when it reflects accurately the desired characteristic of that population. A set of representative samples is said to be valid if it provides a true representation of the temporal and spatial variations of the population characteristic. These seem like simple concepts, but obtaining representative and valid data requires careful planning. The target population must be clearly identified in Element 4, Project Description. The sample must be taken, or measurement made, at the appropriate time and place using appropriate equipment and procedures. Finally, the sample must be handled in such a way that it remains unchanged until it is analyzed. Procedures for obtaining representative results are described in Element 8, Sampling Procedures. The sampler must consider how a pollutant is transported through a medium and the fate of the pollutant. For example, pollutants may be entrained in different parts of an aquatic ecosystem (e.g., water, sediment, and biota). The sampler needs to identify the dynamics of the pollutant in the river, stream, or lake and focus on sampling where the pollutant is most concentrated. Designing a monitoring program that focuses on degraded portions of an aquatic environment provides a more accurate description of current conditions and a more effective cleanup. If the order of sampling is important, it should be described here. For example, it is usually important to collect the samples in order of suspected increasing concentration to minimize cross-contamination from the sampling equipment. When wading streams, it is important to sample downstream first to avoid contaminating the samples with re-suspended sediment from upstream. However, for time-of-travel sampling, it is necessary to sample from upstream to downstream since the objective is to sample the same block of water as it moves downstream. Sample collection should be scheduled to best characterize the problem. For example, nonpoint impacts on water quality often are related to certain land-use activities and weather conditions. If samples are not collected when those activities are going on or during typical weather patterns, the results may not be representative of their impact on water quality. Another example is that dissolved oxygen concentrations are generally
Page 25
lowest at night; therefore, samples taken in late afternoon will probably not be representative of the lowest oxygen conditions. Be aware of ancillary parameters that are necessary to evaluate a contaminant of interest against a criterion or standard. For example, hardness is a factor in calculating the water quality standard for several metals, and pH is needed to assess toxicity. Information on representative sampling designs is available in several references. EPA Document QA/G-5S, Guidance for Choosing a Sampling Design for Environmental Data Collection, provides information on environmental study design. Ecology’s Technical Guidance for Assessing the Quality of Aquatic Environments (Ecology, 1994) includes chapters on planning and study design, water quality assessment, TMDL analysis, and biological surveys. Guidance on Sampling and Data Analysis Methods (Ecology, 1995) provides information for cleanup actions conducted under the Model Toxics Control Act Cleanup Regulation. Specialists in Ecology’s Environmental Assessment Program have extensive experience in sampling environmental media and can be consulted for advice. Comparability If you want to compare your data with other data sets, and combine those data for the decision to be made, the issue of comparability will need to be addressed in the project plan. Comparability is ensured by selecting and documenting standardized procedures for sampling and analysis, and by clearly stating any non-standard requirements. Describe the quality objectives for comparability of data. Then select procedures that will ensure your project data will match those objectives. These might include a requirement that the same standard operating procedures be used for all sampling and analysis. All laboratories involved in the project might be required to meet the same MQOs and use the same QC acceptance criteria. Some critical characteristics might involve the type of sampler used, the analytical or measurement method selected, holding times, and QC procedures. Completeness EPA has defined completeness as a measure of the amount of valid data needed to be obtained from a measurement system. You may define an MQO for completeness in terms of the number or percentage of valid measurements needed to meet the project’s objectives.
Page 26
8. Sampling Procedures The procedures selected for sampling affect the accuracy, representativeness, and comparability of your results. Sampling may account for more variability in your results than the measurement process. A field survey may be needed in order to identify any logistical problems and hazards that can affect sampling. Sampling procedures and equipment proposed for use may also need to be tested before they are included in the project plan. You do not want to find out that the procedure or equipment does not work when you go out to collect samples for the first time. Sample collection activities must not significantly disturb the environment being sampled. For instance, sediments in streams, lakes, and estuaries are easily resuspended; the surface microlayer concentrates some contaminants in quiet waters; and exhaust or fluids from a vehicle can contaminate your samples. These kinds of potential problems must be addressed in the planning process in order to obtain representative samples. After collection, samples must remain stable during transport and storage. Careful adherence to documented procedures for sample collection, preservation, and storage will minimize errors due to sampling and sample instability. Describe in detail or reference the procedures for collecting samples. Referenced SOPs or published procedures must be up-to-date and readily available. If a referenced method offers various options, specify the particular option to be used in this study. It may be useful to include SOPs as appendices to the plan to facilitate project implementation. Stream Sampling Protocols for the Environmental Monitoring and Trends Section (Ecology, 2001) provides guidance on field sampling. The Puget Sound Water Quality Action Team publishes Puget Sound Protocols and Guidelines covering procedures for environmental sampling and analysis. These documents are available at the web sites listed in Appendix J. Include a table listing containers, sample size, preservation, and holding times for each parameter. Requirements for containers, sample size, preservation, and holding times should be discussed with the laboratory. A table with this information for different parameters and matrices is included on Ecology’s website and also in the Manchester Environmental Laboratory Lab Users Manual (Ecology, 2003b) When planning the number of containers that are needed, be sure to include QA field samples as well as environmental samples. An example of a completed table is found in Appendix H.
Page 27
Describe the procedures for decontaminating sampling equipment and disposing of waste from field operations. Decontamination waste must be disposed of according to federal, state, and local regulations. Describe the sample identification scheme. List the information to be recorded on the sample labels and tags, such as:
• identifying number • location • date & time • sampler’s initials • parameters • preservatives
Plan to prepare labels, tags, and forms before you leave for the field. Duplicate labeling with sample labels and tags is recommended, since labels can smudge or detach from the container. To avoid smudging, use waterproof ink to fill out the labels and tags. Describe the procedures and assign responsibility for transporting samples to the lab. Make sure the samples will arrive in time for analysis before the holding times expire. Include in the plan a copy of the form, with examples of required entries, which will accompany the samples to the laboratory. Describe or reference chain-of-custody procedures. If your data may be needed for regulatory purposes, follow formal chain-of-custody procedures, such as those described in the Manchester Environmental Laboratory Lab Users Manual (Ecology, 2003b). You have custody of a sample if it is in your possession, under your control, or in a secure area with access restricted to authorized personnel. It is recommended that detailed notes on field activities be kept in a bound notebook with consecutively numbered pages. Notebooks with waterproof paper are available for field notes. Entries should be made in permanent, waterproof ink and initialed and dated. Corrections are made by drawing a single line through the error so it remains legible, writing the corrections adjacent to the errors, and initialing the correction. These practices ensure that data are legally defensible, since all changes in the data are part of the record. Notes on the collection and handling of samples should be sufficiently detailed to allow the data user to understand and evaluate the procedures.
Page 28
Include a list of the required field log entries such as: • Name of the project and the location
• Identity of field personnel
• Sequence of events
• Changes to the plan
• Site and atmospheric conditions
• Number of samples collected
• Date, time, location, identification, and description for each sample
• Instrument calibration procedures
• Field measurement results
• Identity of QC samples
• Unusual circumstances which affect interpretation of the data Describe plans for taking pictures of key features of the site or of the sampling process. Require documentation of the exact locations where the pictures were taken. This information will be particularly useful if there is a need to return and take pictures to document changes over time. You may want to describe other activities such as: • Briefings and training for field staff
• Periodic preventive maintenance (PM) of measurement and test equipment
• Procedures and equipment for homogenizing non-aqueous matrices
• Procedures for notifying the lab about sample shipments
Page 29
9. Measurement Procedures Measurements can be made in the laboratory or the field, and written procedures or methods need to be specified for both, preferably in the form of standard operating procedures (SOPs). A method is the set of written instructions completely defining the procedure to be used. Before submitting samples to the laboratory, coordinate with lab staff for their services. The first contact might be a phone call or e-mail indicating what you are planning to do. If you hold a planning team meeting, include a representative from the lab. Lab staff can help select analytical methods with documented performance characteristics that meet the measurement quality objectives (MQOs) stipulated in Element 6, Quality Objectives. The method(s) selected should have performance characteristics that meet the MQOs for precision, bias, and sensitivity. An important consideration is the potential bias for the analytes in the matrices of interest. Additional considerations in choosing a method include:
• Definition of the parameter and the form or forms to be measured (e.g., dissolved and total metals)
• Concentration range of interest • Frequency of analysis and the number of samples to be analyzed per batch • Size of sample available • Sample preservation and holding time requirements • Cost of analysis For some parameters, MQOs for the lowest concentrations of interest may have been specified in Element 6. In selecting a method, the lowest concentration of interest is usually equated with the limit of detection. Consult with the laboratory to choose a method with a limit of detection at or below the specified lowest concentration of interest. There are some differences in the way laboratories determine their limit of detection. Many laboratories calculate a method detection limit (MDL) as defined by EPA. Regardless of how the laboratory has determined its limit of detection, the important consideration is that the laboratory can routinely report results at or below your lowest concentration of interest. Recall that the lowest concentration of interest was chosen to be 10 times lower than the reference level (standard or criteria) of concern, in order to ensure precise results at the reference level. If occasionally the laboratory fails to report down to the lowest concentration of concern (due to matrix effects, for example), you may still be able to obtain usable data at or near the reference level. Sometimes the selection of analytical methods is restricted. For example, some federal and state programs require the use of specific methods. If you plan to compare your
Page 30
results with those from another study, or to conduct a trend analysis, select procedures comparable to those used previously. Another consideration in selecting an appropriate method is turnaround time (i.e., the total time necessary to analyze a sample and report the result). Some methods may not be able to meet your required turnaround time. The method must be fully documented either in a publication or in an SOP and validated by the lab before it is used. The Manchester Environmental Laboratory uses a Pre-Sampling Notification form and Sample Container Request form to aid in coordinating analytical services. The lab also requires that a completed copy of their Laboratory Analyses Required form (which also serves as the chain-of-custody form) accompany the samples. Much of the information on these forms is included in this element of the QA Project Plan. Prepare a table with the following information:
• Analyte • Sample Matrix • Number of Samples and Arrival Date • Reporting Limit • Expected Range of Results (if known) • Schedule of Delivery • Analytical Method(s) (including sample preparation procedures) An example of a completed table is found in Appendix H. Specify sample preparation procedures if they are not included in the analytical method or when multiple options are offered in the method. Describe or reference any specialized procedures or modifications to established methods. A separate table is recommended for measurements that will be done in the field. For field measurements, some of the information in the table may not apply. Reference an SOP or other written description of the field measurement procedure. The SOP should include the procedures for calibration and analysis. If an instrument is used, specify the manufacturer and model. Describe QC procedures that will be used to check the accuracy of measurement, along with the frequency of the checks. Some projects require rapid turnaround on-site measurements. If many measurements at low cost can be done, the method selected may not need to be as precise as a more costly laboratory method. The rationale for this approach is explained under the precision heading in the Addendum to Element 6, Quality Objectives.
Page 31
Ecology Policy 1-22 requires that data from analyses of “water, sediment, sludge, air, soil, plant and animal tissue, and hazardous waste” come from laboratories accredited for the parameters and methods used. Contact Ecology’s Environmental Assessment Program Lab Accreditation Section for information on accredited labs. A list of accredited labs is available at the web site listed in Appendix J. Keep in mind that accreditation means that the lab has the capability to provide accurate data. However, MQOs must be specified to ensure that the laboratory uses methods and QC procedures appropriate to meet the needs of your project. The specification of MQOs and the use of QC procedures are always required to ensure the quality of your data. A list of available methods at the Manchester Laboratory can be found at the intranet site listed in Appendix J and also in the Lab Users Manual (Ecology, 2003b). Standard operating procedures corresponding to these methods are maintained by the laboratory. Other methods may be available by special request. In addition, analyses by other methods may be contracted by the laboratory. The project manager should contact the laboratory with any questions related to analytical methods and sample shipment. Ecology QA staff (agency QA Officer as well as program and lab QA Coordinators) may be able to advise you on method selection and applicability. If analytical services are contracted to private laboratories, be sure that all state and agency requirements for purchasing products or services are followed. In some cases, competitive bidding requirements for contracts mean that the QA Project Plan is prepared before it is known which laboratory will perform the work. In those cases, a consultant with expertise in environmental analyses may be engaged, the plan may be revised, or a lab addendum may be prepared after the laboratory becomes part of the project team.
Page 32
10. Quality Control Quantitative measurement quality objectives (MQOs) are established in Element 6, Quality Objectives. The results for quality control (QC) samples are used to evaluate whether the measurement system is functioning properly and whether the MQOs have been met. QC requirements should be specified for both laboratory and field measurements, although more QC can generally be implemented for analyses done in a controlled laboratory environment. Recent versions of most analytical methods specify that control limits be based on historical lab performance, while some specify fixed values for QC limits. An important consideration stated by Crumbling (2001) is that “QC acceptance criteria should be very specific and should be designed such that if the QC acceptance criteria are consistently met, the project MQOs will be achieved.” Prepare a table listing the types and frequency of field and laboratory QC samples required for the study. An example of a completed table is given in Appendix H.
The following discussion is intended to assist you in preparing the table and understanding the different types of QC samples that can be specified. Analytical QC Many analytical methods include a section on QC procedures. The project manager should be familiar with the terminology and theory of analytical QC so as to be able to discuss them with lab staff. The Ecology QA Officer and program and lab QA Coordinators may be able to help with this communication. Analytical QC procedures involve the use of four basic types of QC samples. QC samples are analyzed within a batch of client samples to provide an indication of the performance of the entire analytical system. Therefore, QC samples go through all sample preparation, clean up, measurement, and data reduction steps in the procedure. In some cases, the laboratory may perform additional tests that check only one part of the analytical system. Note that the analysis of calibration standards is not considered part of QC, since all methods must include calibration whether or not QC samples are analyzed. A discussion of calibration is included in Appendix I. Check standards Check standards are QC samples of known concentration prepared independently of the calibration standards. They are sometimes called laboratory control samples (LCS) or spiked blanks. Results are used to verify that analytical precision is in control and that the level of bias due to calibration is acceptable. If the results for the check standards do not fall within established control limits, the measurement system should be re-calibrated.
Page 33
In some analytical methods, sample results may be qualified when associated check standard results are not within acceptable limits. Check standards are usually prepared in deionized water, though any uncontaminated medium can be used. Their concentration should be in the range of interest for the samples, and at least one check standard should be analyzed with each batch of 20 samples or fewer. Reference materials that more closely match the matrix of environmental samples may be used as check standards for your project. Some proficiency testing (PT) samples from commercial vendors can be stored and used as check standards once the true values are known. The acceptance limits for the results of analyses of these commercial samples should not be those set by the vendor but should be established in the lab by replicate analyses of the PT sample. An exception is when reference materials are sent to the laboratory for analysis as blinds. Ecology’s Laboratory Accreditation Section can help identify suppliers of PT samples and certified reference materials. Analytical duplicates The laboratory analyzes duplicate aliquots of one or more samples within each batch. Results are used to estimate analytical precision for that matrix at that concentration. The project manager may specify which samples are to be analyzed in duplicate. If the samples selected for duplicate analyses do not contain measurable amounts of the analyte of interest, the results provide no information on precision. Also, if the lab selects samples from another study with significantly different levels of the analyte or different matrices, the estimate of precision may not be applicable to your samples. One of the field duplicates is a good choice for an analytical duplicate since you may then estimate total and analytical variability from results for the same sample. There is no advantage to “randomly” selecting samples for duplicate analysis. Matrix spikes A matrix spike is an aliquot of a sample to which a known amount of analyte is added at the start of the procedure. Matrix spike recoveries may provide an indication of bias due to interference from components of the sample matrix. Since the percent recovery is calculated from the difference between the analytical results for the spiked and unspiked samples, its precision may be relatively poor. If the spike is too high relative to the sample concentration, any interference effect at the sample concentration level could be masked. And if too low, random error would make it difficult to accurately estimate the recovery. The aim should be to spike at a concentration approximately equal to the concentration in the sample before spiking.
Page 34
The project manager may indicate to the laboratory which samples might be most appropriate for use as matrix spikes and, if necessary, provide larger samples for this purpose. In some cases, many replicate spikes would need to be analyzed in order to distinguish bias from the effects of random error on the recoveries. Thus, matrix spike results are not used to correct sample results and should only be used in conjunction with other QC data to qualify them. While the primary use of matrix spikes is to indicate the presence of bias, duplicate spike results can be used to estimate analytical precision at the concentration of the spiked samples. The project manager may instruct the laboratory to spike certain samples since matrix spikes are not automatically included in all analytical methods. If the laboratory does not receive instructions, they may choose not to do any analyses of spiked samples or may select samples from other projects for spiking. Matrix spikes prepared from other types of samples or matrices provide no information on bias due to the matrices in your samples. Some methods for organics analyses specify that all samples, including QC samples, be spiked with surrogate compounds at the start of the procedure. Because surrogate compounds are not expected to be present in the samples, they give analytical responses that can be distinguished from those of the analytes of interest. Surrogate recoveries provide an estimate of accuracy for the entire analytical procedure. The standard deviations of surrogate results provide an estimate of analytical precision, while the mean percent recoveries indicate whether or not the sample results are biased. Laboratory blanks Blanks are prepared and analyzed in the laboratory to document the response of the measurement system to a sample containing effectively none of the analyte of interest. They should not be confused with field blanks that are analyzed to determine if there is contamination during sampling. Depending on the analytical method, the analyst will analyze one or more blanks with each batch of samples and compare the results to established acceptance limits. A positive blank response can be due to a variety of factors related to the procedure, equipment, or reagents. Unusually high blank responses indicate laboratory contamination. The blank response becomes very important when the analyte concentration is near the detection limit. Blank responses are sometimes used to correct the sample responses and to determine the limit of detection.
Page 35
Field QC The project manager is responsible for selecting QC procedures to be used in the field. Field QC samples may be sent to the laboratory as blinds (i.e., identified the same way as normal samples) to ensure that they are not treated differently during analysis. Replicates Replicates are two (duplicates) or more samples collected, or measurements made, at the same time and place. Replicate results provide a way to estimate the total random variability (precision) of individual results. If conditions in the medium being measured or sampled are changing faster than the procedure can be repeated, then the precision calculated from replicate results will include that variability as well. Appendix G describes the calculation of precision from replicate results. Replicate results that are “non-detects” cannot be used to estimate precision. Since there is no advantage to randomly selecting samples for replication, use all available information and professional judgment to select samples or measurements likely to yield positive results. Samples are sometimes split in the field and sent to separate laboratories for analysis. This has been common practice in compliance situations. However, you should be aware of the limitations of this practice, since there is no way to determine which result is correct when they do not agree. No laboratory, however good their reputation, can be considered correct by definition. If the project manager doubts the lab’s ability to meet the MQOs, those concerns should be resolved through analyses of representative samples and reference materials or proficiency testing samples before any commitment is made for analysis of study samples. Field blanks Field blanks are samples of “clean” material which are exposed to conditions in the field. They should be analyzed like any other sample. The results for field blanks may indicate the presence of contamination due to sample collection and handling procedures (in the field or during transport to the laboratory) or to conditions in the field, such as boat or vehicle exhaust. Plan to clearly identify field blanks so that they are not selected for analytical duplicates or matrix spikes. Field blanks are used when there is reason to expect problems with contamination or to meet programmatic or contractual requirements to demonstrate absence of contamination. The use of good operational procedures in the field and thorough training of field staff reduces the risk of contamination.
Page 36
Several types of field blanks are described below. The pure water or other “clean” material used to prepare them must be obtained from the laboratory or other reliable supplier. • A transport blank is a container of pure water, which is prepared at the lab and
carried unopened to the field and back with the other sample containers to check for possible contamination in the containers or for cross-contamination during transportation and storage of the samples.
• A transfer blank is prepared by filling a sample container with pure water during
routine sample collection to check for possible contamination from the surroundings. The transfer blank will also detect contamination from the containers or from cross-contamination during transportation and storage of the samples.
• A rinsate (equipment) blank is prepared by exposing clean material to the sampling
equipment after the equipment has been used in the field and cleaned. The results provide a check on the effectiveness of the cleaning procedures. The rinsate blank may also detect contamination from the surroundings, from containers, or from cross-contamination during transportation and storage of the samples and is therefore the most comprehensive type of field blank.
• A filter blank is a special case of a rinsate blank prepared by filtering pure water
through the filtration apparatus after routine cleaning. The filter blank may detect contamination from the filter or other part of the filtration apparatus.
Ideally, the results for your field blanks will be “not detected.” If the results are positives, you will need to take them into account when reporting sample results and determining whether your MQOs have been met. Check standards Check standards and spiked samples usually are not prepared in the field due to the hazards of working with concentrated solutions of contaminants under field conditions. In some projects, it may be useful to acquire check standards to be sent to the laboratory for analysis along with the environmental samples. These can be PT samples or certified reference materials, and the laboratory results are compared with the acceptance limits of the provider. Describe the field QC procedures to be used for the study. Specify the number of each type of QC sample to be included in the study. For field blanks, specify also the source of “clean” material (e.g., pure water) that will be used.
Page 37
Corrective Actions QC results may indicate problems with data during the course of the project. The lab will follow prescribed procedures to resolve the problems. Options for corrective action might include:
• Retrieving missing information • Re-calibrating the measurement system • Re-analyzing samples (must be done within holding time requirements) • Modifying the analytical procedures • Collecting additional samples or taking additional field measurements • Qualifying results
Describe in your project plan any additional procedures to be followed to correct or compensate for QC problems if they occur.
Page 38
11. Data Management Procedures Data management addresses the path of data from recording in the field or laboratory to final use and archiving. Experience has shown that roughly half of the errors in results reported for proficiency testing (PT) samples have been due to mistakes in recording results, calculations, or transcription. Describe the procedures for recording and reporting data acquired in the field. Include procedures for detecting and correcting errors and for compiling and analyzing the data, including software requirements. Describe requirements for the data package from the laboratory. Documentation should always include a case narrative discussing any problems with the analyses, corrective actions taken, changes to the referenced method, and an explanation of data qualifiers. The lab data package should also include all QC results associated with your data. This information is needed to evaluate the accuracy of the data and to determine whether the MQOs were met. This should include results for all blanks, surrogate compounds, and check standards included in the sample batch, as well as results for analytical duplicates and matrix spikes prepared from your samples. List requirements for electronic transfer of data from the field or lab to your database. Provide or reference information necessary to enter the data in your information management system. The Environmental Information Management (EIM) system is the major environmental data repository for Ecology. Information on the EIM system is available on Ecology’s internet web site listed in Appendix J. Describe procedures for obtaining data from existing databases and literature files. List acceptance criteria for these data in terms of precision, bias, sensitivity, representativeness, comparability, and completeness. Discuss any qualifiers associated with the data.
Page 39
12. Audits and Reports A process is needed to ensure that the QA Project Plan is implemented correctly, that the quality of the data is acceptable, and that corrective actions are implemented in a timely manner. Audits
Two types of useful audits are:
• Technical Systems Audit – a qualitative audit of conformance to the QA Project Plan. The audit is conducted soon after work has commenced, so that corrective actions can be implemented early in the project.
• Proficiency Testing – the quantitative determination of an analyte in a blind standard to evaluate the proficiency of the analyst or laboratory.
Describe any audits that will be conducted during the project. Discuss the purpose and scope of each audit and identify the auditors. Provide the schedule and describe how the results will be reported. Reports Project plans for large or repetitive projects should describe a mechanism for periodic reports to management on the performance of measurement systems and on data quality. These reports may include:
• Assessment of data accuracy and completeness • Results of proficiency testing and/or technical systems audits • Significant QA problems and corrective actions taken • Any other information requested by management List the reports required for the project and identify staff responsible for preparing them. The final report for each project should include a QA section that describes data quality. The final report should undergo peer review, a scientific review of the report by staff with appropriate expertise who are not directly connected with the project. Peer reviews ensure that project activities were technically sound and properly documented. Guidelines for technical document review are provided on the Ecology intranet site listed in Appendix J.
Page 40
13. Data Verification and Validation Assessment is the process by which data are examined and evaluated to varying levels of detail and specificity. It includes verification, validation, and data quality assessment. This element covers the steps of data verification and validation. The data quality assessment step, covered in Element 14, is done on data that have been verified and validated (i.e., data of known and documented quality). Data verification involves examining the data for errors or omissions as well as examining the results for compliance with QC acceptance criteria. Laboratory results are reviewed and verified by qualified and experienced lab staff. Their findings are documented in the case narrative. Field results should also be verified, preferably before leaving the site where the measurements were made. Once the measurement results have been recorded, they are verified to ensure that:
• Data are consistent, correct, and complete, with no errors or omissions • Results for QC samples described in Element 10, Quality Control, accompany the
sample results • Established criteria for QC results were met • Data qualifiers are properly assigned where necessary • Data specified in Element 7, Sampling Process Design, were obtained • Methods and protocols specified in the QA Project Plan were followed Describe the procedures for verifying results for measurements done in the laboratory and in the field, and assign responsibility for verification. Data validation is an analyte-specific and sample-specific process that extends the evaluation of data beyond data verification to determine the analytical quality of a specific data set. It involves a detailed examination of the data package using professional judgment to determine whether the MQOs for precision, bias, and sensitivity have been met. Validation is the responsibility of the project manager, who may wish to arrange for a qualified specialist to conduct the validation and document it in a technical report. Sometimes validation can be streamlined by validating only a specific percentage of all data sets unless a problem is identified; this may include a caveat that all critical samples identified will undergo full data validation. The results of QC sample analyses can often be compared directly to the MQOs to determine whether they have been met. For projects that follow the WRC approach described in Appendix F, an experimental design for preliminary estimation of precision and bias, and the use of control charts, provide an excellent way to determine if MQOs have been met. Describe the procedures to be used for data validation.
Page 41
14. Data Quality (Usability) Assessment After the data have been verified and validated, Data Quality Assessment (DQA) or Usability Assessment is done. If the MQOs have been met, the quality of the data should be useable for meeting project objectives. If the MQOs have not been met for data (i.e., data have been qualified), you need to determine if they are still useable. You also need to determine if the quantity of data is sufficient to meet project objectives. This includes an assessment of whether the requirements for representativeness and comparability have been met. If you set an MQO for completeness, compare the number of valid measurements completed with those established by the MQO. And you need to evaluate whether the implementation of the sampling design gave the information expected for meeting project objectives. DQA is built on a fundamental premise: data quality is meaningful only when it relates to the intended use of the data. DQA determines whether the study questions can be answered and the necessary decisions made with the desired confidence. While it may not be possible during the planning phase to anticipate everything you will need to do when analyzing the data, it pays to include in your project plan as much detail as possible about how you will assess the usability of the data and what graphical and statistical tools you will use to determine if the project objectives have been met. State how you will assess the data to determine if they are of the right type, quality, and quantity to support the project objectives. Summarize the methods you will use in the analysis and presentation of the data. Describe any statistical calculations and graphical representations you plan on doing. This may involve statistical tests and verification of the assumptions of the statistical tests (e.g., tests of hypotheses, tests for outliers, tests for trends), as well as scientific evaluation of the information. Describe how the data will be presented (e.g., tables or charts) to illustrate trends, relationships and anomalies, and how you will handle data below the lower reporting limit or detection limit. State how you will evaluate the data to determine if the sampling design has been adequate and if it needs any modification for future use. It is important to evaluate whether the sampling design can be used over a wide range of possible outcomes. Finally, indicate who will be responsible for analyzing the data and how the results of the data analysis will be documented.
Page 42
If you have used either the DQO Process or PAC Process for systematic planning, you can use the DQA Process to determine whether the objectives of the project have been met. While the DQA Process was developed to evaluate data from the DQO Process, it can be adapted to the PAC Process or other systematic planning process. The DQA Process involves the following steps: 1. Review the project objectives and sampling design 2. Conduct a preliminary data review 3. Select the statistical method 4. Verify the assumptions of the statistical method 5. Draw conclusions from the data EPA document QA/G-9, Guidance for Data Quality Assessment, provides background information and statistical tools for performing each of the steps in the DQA Process. EPA has plans to split this document into a statistical guidance document and a guide for managers. In the DQO Process, quality objectives are specified at both the level of the decision and the level of the measurements needed to support the decision or study question, while in the PAC Process, quality objectives are only specified at the level of the measurements. Thus, data analysis is generally more involved for the DQO Process.
Page 43
Cited References Crumbling, D.M., 2001. Clarifying DQO Terminology Usage to Support Modernization of Site Cleanup Practice. U.S. Environmental Protection Agency, Technology Innovation Office. www.clu-in.org Ecology, 1994. Technical Guidance for Assessing the Quality of Aquatic Environments. Washington State Department of Ecology, Olympia, WA. Publication No. 91-78. www.ecy.wa.gov/biblio/9178.html Ecology, 1995. Guidance on Sampling and Data Analysis Methods. Washington State Department of Ecology, Olympia, WA. Publication No. 94-49. www.ecy.wa.gov/biblio/9449.html Ecology, 2000. Quality Management Plan. Washington State Department of Ecology, Olympia, WA. Publication No. 00-03-012. www.ecy.wa.gov/biblio/0003012.html Ecology, 2001. Stream Sampling Protocols for the Environmental Monitoring and Trends Section. Ward, W. J., ed. Washington State Department of Ecology, Olympia, WA. Publication No. 01-03-036. www.ecy.wa.gov/biblio/0103036.html Ecology, 2003a. Quality Assurance Manual. Version 2.1. Manchester Environmental Laboratory. Washington State Department of Ecology, Olympia, WA. Ecology, 2003b. Lab Users Manual. 7th Edition. Manchester Environmental Laboratory. Washington State Department of Ecology, Olympia, WA. IDQTF, 2003. Uniform Federal Policy for Quality Assurance Project Plans. Part 1. Version 1. Intergovernmental Data Quality Task Force. http://www.epa.gov/swerffrr/pdf/ufp_qapp_manual_aug_2003.pdf Morrison, George H., 1965. Trace Analysis: Physical Methods. Interscience Publishers.
Page 44
EPA Quality System Documents www.epa.gov/quality/qa_docs.html
EPA QA/G-1 Guidance for Developing Quality Systems for Environmental Programs EPA QA/R-2 EPA Requirements for Quality Management Plans EPA QA/G-3 Guidance on Assessing Quality Systems EPA QA/G-4 Guidance for the Data Quality Objectives Process EPA QA/G-4D Decision Error Feasibility Trials (DEFT) Software EPA QA/G-4HW Data Quality Objectives Process for Hazardous Waste Site Investigations EPA QA/R-5 EPA Requirements for Quality Assurance Project Plans EPA QA/G-5 Guidance for Quality Assurance Project Plans EPA QA/G-5G Guidance for Geospatial Data Quality Assurance Project Plans EPA QA/G-5M Guidance for Quality Assurance Project Plans for Modeling EPA QA/G-5S Guidance on Choosing a Sampling Design for Environmental Data Collection EPA QA/G-6 Guidance for Preparation of Standard Operating Procedures EPA QA/G-7 Guidance on Technical Audits and Related Assessments for Environmental Data Operations EPA QA/G-8 Guidance on Environmental Data Verification and Data Validation EPA QA/G-9 Guidance for Data Quality Assessment: Practical Methods for Data Analysis EPA QA/G-10 Guidance for Developing a Training Program for Quality Systems
Page 45
Additional Readings Quality Assurance ACE, 2001. Requirements for the Preparation of Sampling and Analysis Plans. U.S. Army Corps of Engineers, Engineering and Design Manual M 200-1-3. http://www.usace.army.mil/inet/usace-docs/eng-manuals/em200-1-3/basdoc.pdf Cheeseman, R.V. and A.L. Wilson, 1989. (Revised by M.J. Gardner) A Manual on Analytical Quality Control for the Water Industry. NS 30. Water Research Centre, Medmenham, UK. DOE, 1997. Environmental Measurements Laboratory Procedures Manual. HASL-300, Environmental Measurements Laboratory, U.S. Department of Energy, Washington, DC, 28th Ed. www.eml.doe.gov/publications Ecology, 2002. Procedural Manual for the Environmental Laboratory Accreditation Program. Washington State Department of Ecology, Olympia, WA. Publication No. 02-03-055. www.ecy.wa.gov/biblio/0203055.html Helsel, D., 2004. Nondetects and Data Analysis. Wiley. 270 pp. Air Quality EPA, 1984. Quality Assurance Handbook for Air Pollution Measurement Systems, Volume I – Principles, EPA-600/9-76-005, U.S. Environmental Protection Agency, Washington, DC. www.epa.gov/clariton/clhtml/pubtitle.html EPA, 1994. Quality Assurance Handbook for Air Pollution Measurement Systems, Volume III - Stationary Source Specific Methods, EPA-600/R-94/038C, U.S. Environmental Protection Agency, Washington, DC. www.epa.gov/clariton/clhtml/pubtitle.html EPA, 1998. Quality Assurance Handbook for Air Pollution Measurement Systems. Volume II - Ambient Air Specific Methods (Interim Edition), EPA-600/R-94/038B, U.S. Environmental Protection Agency, Washington, DC. www.epa.gov/clariton/clhtml/pubtitle.html FR, 40CFR58, Subpart G, Appendix A - Quality Assurance Requirements for State and Local Air Monitoring Stations (SLAMS). Federal Register. FR, 40CFR58, Subpart G, Appendix B - Quality Assurance Requirements for Prevention of Significant Deterioration (PSD) Air Monitoring. Federal Register.
Page 46
FR, 40CFR60. Appendix E - Quality Assurance Requirements for Continuous Emission Monitoring Systems (CEMS), to be submitted as a proposed regulation to amend 40 CFR 60. Federal Register. Water Quality Barcelona, M.J., J.P. Gibb, and R.A. Miller, 1983. A Guide to the Selection of Materials for Monitoring Well Construction and Ground Water Sampling, Illinois State Water Survey, Champaign, IL. www.sws.uiuc.edu EPA, 1979. Handbook for Analytical Quality Control in Water and Wastewater Laboratories, EPA-600/4/79-019, U.S. Environmental Protection Agency, Washington, DC. www.epa.gov/clariton/clhtml/pubtitle.html Hunt, D.T.E. and A.L. Wilson, 1986. The Chemical Analysis of Water, 2nd Ed., The Royal Society of Chemistry, Cambridge, UK. www.rsc.org SM, 1998. Standard Methods for the Examination of Water and Wastewater, 20th Ed., American Public Health Association, Washington, DC. USGS, 2004. Techniques of Water Resources Investigations Reports. U.S. Geological Survey, U.S. Government Printing Office. http://water.usgs.gov/pubs/twri/ Hazardous Waste EPA, 1998a. Test Methods for Evaluating Solid Waste - Physical/Chemical Methods, EPA SW-846, 3rd Ed, Third Update, OSWER, U.S. Environmental Protection Agency, Washington, DC. www.epa.gov./epaoswer/hazwaste/test/sw846.htm Sampling Barcelona, M.J. et al., 1985. Practical Guide for Ground-Water Sampling, Illinois State Water Survey, Department of Energy and Natural Resources, Springfield, IL. www.sws.uiuc.edu Ecology, 1990. Ground Water Monitoring Guidance for Solid Waste Facilities. Washington State Department of Ecology, Olympia, WA. Publication No. 90-004. www.ecy.wa.gov/biblio/90004.html Ecology, 1993. Field Sampling and Measurement Protocols for the Watershed Assessments Section. Washington State Department of Ecology, Olympia, WA. Publication No. 93-e04. www.ecy.wa.gov/biblio/93e04.html EPA, 1980. Samplers and Sampling Procedures for Hazardous Waste Streams. U.S. Environmental Protection Agency, Washington, DC. Document EPA 600/2-80-018. www.epa.gov/clariton/clhtml/pubtitle.html
Page 47
EPA, 1982. Handbook for Sampling and Sample Preservation of Water and Wastewater. U.S. Environmental Protection Agency, Washington, DC. Document EPA-600/4-82-029, www.epa.gov/clariton/clhtml/pubtitle.html EPA, 1985. Practical Guide for Ground-Water Sampling. U.S. Environmental Protection Agency, Washington, DC. Document EPA 600/2-85/104. www.epa.gov/clariton/clhtml/pubtitle.html EPA, 1996. Sampling Ambient Water for Determination of Trace Metals at EPA Water Quality Criteria Levels (Method 1669). U.S. Environmental Protection Agency, Washington, DC. Document EPA 821/R-96-008. www.epa.gov/clariton/clhtml/pubtitle.html EPA, 2004. Sampling for Contaminants in Sediments and Sediment Pore Water. Technology Innovation Program. U.S. Environmental Protection Agency, Washington, D.C. http://clu-in.org/programs/21m2/sediment/ Gilbert, R.O., 1987. Statistical Methods for Environmental Pollution Monitoring. Van Nostrand Reinhold Company, New York, NY. Ecology Library. NJDEP, 1988. Field Sampling Procedures Manual. Hazardous Waste Programs, New Jersey Department of Environmental Protection, Trenton, NJ. Ecology Library. Stack, K.V., R.C. Averett, P.E. Greeson, and R.G. Lipscomb, 1973. Methods for the Collection and Analysis of Aquatic Biological and Microbiological Samples, Techniques of Water Resource Investigations. Book 5. Chapter A4. U. S. Geological Survey. Microbiology and Biomonitoring EPA, 1978. Microbiological Methods for Monitoring the Environment, Water and Wastes. U.S. Environmental Protection Agency, Washington, DC. Document EPA-600/8-78-017. www.epa.gov/clariton/clhtml/pubtitle.html EPA, 1985a. Methods for Measuring the Acute Toxicity of Effluents to Freshwater and Marine Organisms. 3rd Edition. U.S. Environmental Protection Agency, Washington, DC. Document EPA/600/4-85/013. EPA, 1989. Short-Term Methods for Estimating the Chronic Toxicity of Effluents and Receiving Waters to Freshwater Organisms. 2nd Ed. U.S. Environmental Protection Agency, Washington, DC. Document EPA/600/4-89/001. EPA, 2000. Methods for Measuring the Toxicity and Bioaccumulation of Sediment-Associated Contaminants with Freshwater Invertebrates. U.S. Environmental Protection Agency, Washington, DC. Document EPA/600/R-99/064. www.epa.gov/clariton/clhtml/pubtitle.html

Page 48
This page is purposely left blank

Appendices

This page is purposely left blank for duplex printing.
Page A-1
Appendix A
Glossary
Accreditation - “Formal recognition by (Ecology)…that an environmental laboratory is capable of producing accurate analytical data…(Ecology) does not, by certifying or accrediting any laboratory…vouch for or warrant the accuracy of any particular work done or report issued by the laboratory.” [WAC 173-50-040] Accuracy - An estimate of the closeness of a measurement result to the true value. Bias - The difference between the population mean and the true value. Blank - A sample prepared to contain none of the analyte of interest. For example, in water analysis, pure water is used for the blank. In chemical analysis, a blank is used to estimate the analytical response to all factors other than the analyte in the sample. Calibration - The process of establishing the relationship between the response of a measurement system and the value of the parameter being measured. Check standard - A QC sample prepared independently of calibration standards and analyzed along with the samples to check the precision of the measurement system. A check standard can also be used to check for bias due to the way calibration is done. It is sometimes called a lab control sample (LCS) or spiked blank. Control chart - A graphical representation of the precision of QC results showing whether the measurement system is in statistical control. Control limits - Statistical warning and action limits calculated for control charts. Data Quality Objectives Process – EPA’s recommended systematic planning process when environmental data are used to decide between two opposing conditions (e.g., compliance or non-compliance with a standard). Data validation - An analyte-specific and sample-specific process that extends the evaluation of data beyond data verification to determine the analytical quality of a specific data set. It involves a detailed examination of the data package using professional judgment to determine whether the MQOs for precision, bias, and sensitivity have been met. Data verification - Examination of the data for errors or omissions and of the QC results for compliance with acceptance criteria. Detection limit (limit of detection) - The concentration or amount of an analyte which, on an “a priori” basis, can be determined to a specified level of certainty to be greater than zero.
Page A-2
Duplicates - Two samples collected or measurements made at the same time and location, or two aliquots of the same sample prepared and analyzed in the same batch. Field blank - A blank used to obtain information on contamination introduced during sample collection, storage, and transport. Laboratory control sample (LCS) - See “Check standard.” Matrix spike - A QC sample prepared by adding a known amount of the target analyte(s) to an aliquot of a sample to check for bias due to interference or matrix effects. Measurement quality objectives (MQOs) - The performance or acceptance criteria for individual data quality indicators, including precision, bias, and sensitivity. Measurement result - A value obtained by carrying out once the procedure described in a method. Method - A set of written instructions completely defining the procedure to be used. Method blank - A blank prepared to represent the sample matrix and analyzed in a batch of samples. PAC Process - The recommended systematic planning process when decision-making is not the primary focus of the data collection activity. Parameter - A specified characteristic of a population or sample. Population - The hypothetical set of all possible observations of the type which is being investigated. Precision - A measure of the variability in the results of replicate measurements due to random error. Quality assurance (QA) - Adherence to a system for assuring the reliability of measurement data. Quality assurance project plan (QA Project Plan) - A document that describes the objectives of a project and the procedures necessary to acquire data that will serve those objectives. Quality control (QC) - The routine application of statistical procedures to evaluate and control the accuracy of measurement data. Relative percent difference (RPD) - The difference between two values divided by their mean and multiplied by 100. Replicates - Two or more samples collected or measurements made at the same time and place.
Page A-3
Sensitivity - In general, denotes the rate at which the analytical response (e.g., absorbance, volume, meter reading) varies with the concentration of the parameter being determined. In a specialized sense, it has the same meaning as the detection limit. Standard operating procedure (SOP) - A document that describes in detail the approved way for performing a routine procedure. Systematic planning - A step-wise process of clearly describing the goals and objectives of a project, and deciding on the types and amounts of data that will be needed to meet those goals and objectives.

Page A-4
This page is purposely left blank for duplex printing.
Page B-1
Appendix B
Systematic Planning Systematic planning is a step-wise process of clearly describing the goals and objectives of a project, and deciding on the types and amounts of data that will be needed. Characteristics of systematic planning include involvement of all interested parties, definition of the quality of data appropriate for their intended use, and use of the scientific method (observation, hypothesis, and testing). EPA describes the elements of a systematic planning process as:
1. Establishment of a team (identification of the project manager, sponsoring organization, staff, interested parties, and experts)
2. Description of the project goal, objectives, and questions and issues to be addressed
3. Identification of project schedule, resources (including budget), milestones, and any applicable requirements (e.g., regulatory requirements, contractual requirements)
4. Description of the type of data needed to meet the project objectives
5. Description of the data collection and analysis requirements
6. Description of the process for the generation, evaluation, and assessment of collected data The systematic planning process is the foundation of the planning stage; outputs of the process are documented in the QA Project Plan. Those outputs include performance and acceptance criteria for the quality of the data collected and objectives for the quality of the decision, as described in EPA QA/G-5. Performance criteria address the adequacy of new data collected specifically for the project. Acceptance criteria address the adequacy of existing data proposed for inclusion in the project. The Data Quality Objectives Process EPA has developed a seven-step systematic planning process called the Data Quality Objectives (DQO) Process for use when data are being used to select between two clear alternative conditions or to determine compliance with a standard. As such, a better name would be the Decision Quality Objectives Process. It is EPA’s recommended systematic planning tool, and they have provided guidance for its use (Guidance for the Data Quality Objectives Process, EPA QA/G-4 and Data Quality Objectives Process for Hazardous Waste Site Investigations, EPA QA/G-4HW). Since the DQO Process is used to facilitate decision-making, an alternative name is the Decision Quality Objectives Process.
Page B-2
The DQO Process consists of the following steps:
1. State the problem 2. Identify the decision 3. Identify the inputs to the decision 4. Define the boundaries of the study 5. Develop a decision rule 6. Specify tolerable limits on decision errors 7. Optimize the design for obtaining data One important application is to decide whether a site is contaminated and needs to be cleaned up. When critical environmental decisions need to be made, consider using the DQO Process. In the DQO Process, quality objectives need to be specified at two levels:
1. At the level of the decision 2. At the level of the measurements used to support the decision or study question
At the level of the decision, there is a need to specify tolerable limits of making decision errors. These tolerable limits are required, along with other information, to determine the numbers and locations of samples from the site that must be collected and analyzed. At the level of measurements used to support the decision or study question, quality objectives are expressed as measurement quality objectives or MQOs. The MQOs are performance or acceptance criteria for the data quality indicators precision, bias, and sensitivity. The phrase data quality objectives was originally used by EPA to represent generic quality criteria for environmental data. In 1998, data quality objectives was replaced with acceptance and performance criteria, and the phrase data quality objectives was redefined to solely represent the outputs of the DQO Process. To avoid confusion, the expression Decision Quality Objectives has been used in the main text of this document to represent the outputs of the DQO Process. This is consistent with the fact that the DQOs themselves should not attempt to directly define the specifics of the data quality, as explained in the article by Crumbling (2001).
Two software tools are available to facilitate use of the DQO Process. The EPA has PC-based software for determining the feasibility of data quality objectives defined using the DQO Process. The software and the user’s guide are available through the Quality System website listed in Appendix J. Visual Sample Plan (VSP) software is available free through the Pacific Northwest National Laboratory website. It is intended to help you determine the number of samples needed and where they should be taken.
Other systematic planning processes that are used to decide between two opposing conditions have been adopted by other federal agencies, and differ somewhat from EPA’s DQO Process. For example, the U.S. Army Corps of Engineers adopted a four-step Technical Planning Process to implement systematic planning for contaminated site cleanup activities.
Page B-3
The Performance and Acceptance Criteria Process Sometimes decision-making is not the primary focus or intended outcome of data collection, and instead data are used for descriptive purposes, to generate estimates, or to support inferences. Examples are surveys or exploratory investigations, monitoring, research studies, risk assessment studies, and modeling. In those instances, the Performance and Acceptance Criteria (PAC) Process, which uses performance and acceptance criteria as quality objectives, can be used as an alternative systematic planning process. In the PAC process, quality objectives need to be specified only at the level of the measurements used to support the study question, and are similar to the 2nd level of quality objectives for the DQO Process. These quality objectives are expressed as measurement quality objectives or MQOs. There are seven steps in the PAC Process:
1. State the problem 2. Identify the study question 3. Identify types of information needed 4. Establish study design constraints 5. Specify information quality 6. Develop a strategy for information synthesis 7. Optimize the design for collecting information EPA is in the process of editing the QA/G-4 document, Guidance on the Data Quality Objectives Process, to incorporate performance and acceptance criteria as applied to simple estimation problems, as another way of looking at the DQO Process. This modified DQO Process will likely be the same as the PAC Process described here. The Triad Approach The Triad Approach has been developed by the EPA’s Office of Solid Waste and Emergency Response to plan and implement data collection and technical decision-making at hazardous waste sites. It is a three-pronged approach that includes systematic project planning, a dynamic work strategy, and real-time measurements. The cornerstone of the Triad is the explicit identification and management of decision uncertainties to improve the cost-effectiveness of hazardous waste site cleanups. Detailed information on the Triad Approach can be found at the EPA web address listed in Appendix J. The SAFER Approach The U.S. Department of Energy (DOE) developed the Streamlined Approach for Environmental Restoration (SAFER) as a methodology tailored to the challenges of conducting environmental restoration efforts under conditions of significant uncertainty. It combines the DQO Process with an Observational Approach (OA). The basis of the OA is the observational method, a technique originally developed to manage uncertainty in the design and construction of subsurface facilities such as tunnels, and allows remedial action to be initiated without full characterization of the nature and extent of the contamination.

Page B-4
This page is purposely left blank for duplex printing.
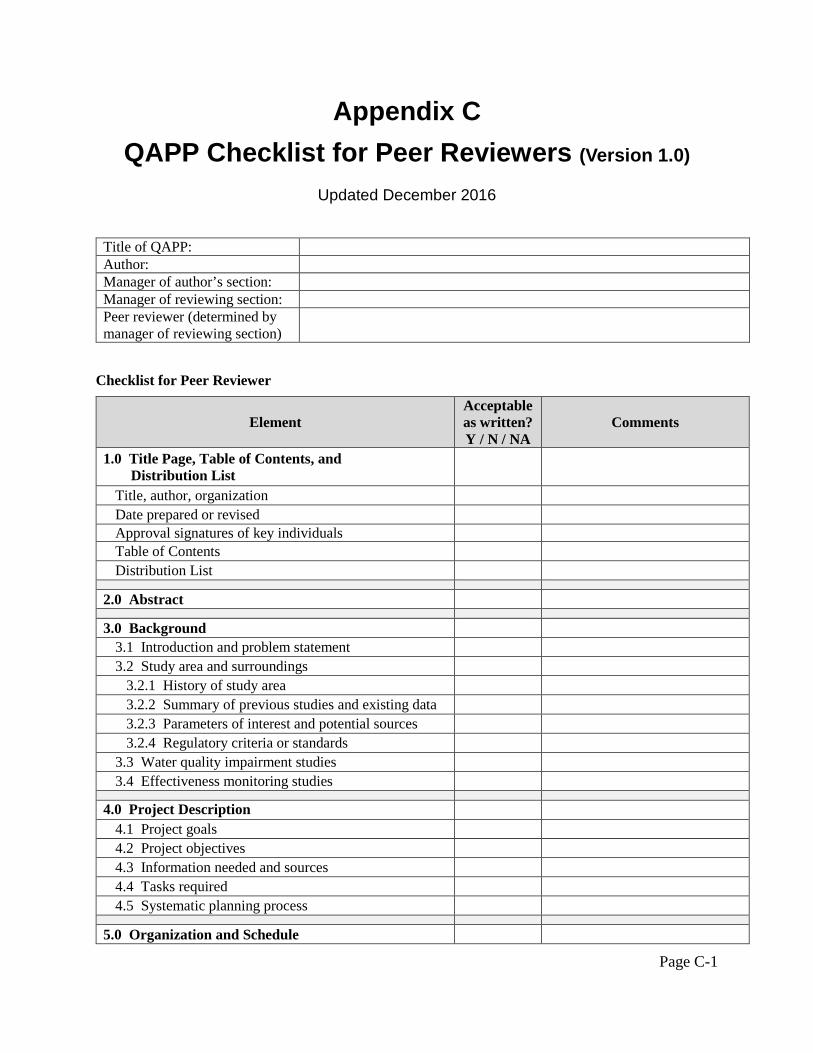
Page C-1
Appendix C QAPP Checklist for Peer Reviewers (Version 1.0)
Updated December 2016
Title of QAPP: Author: Manager of author’s section: Manager of reviewing section: Peer reviewer (determined by manager of reviewing section)
Checklist for Peer Reviewer
Element Acceptable as written? Y / N / NA
Comments
1.0 Title Page, Table of Contents, and Distribution List
Title, author, organization Date prepared or revised Approval signatures of key individuals Table of Contents Distribution List
2.0 Abstract 3.0 Background
3.1 Introduction and problem statement 3.2 Study area and surroundings 3.2.1 History of study area 3.2.2 Summary of previous studies and existing data 3.2.3 Parameters of interest and potential sources 3.2.4 Regulatory criteria or standards 3.3 Water quality impairment studies 3.4 Effectiveness monitoring studies
4.0 Project Description
4.1 Project goals 4.2 Project objectives 4.3 Information needed and sources 4.4 Tasks required 4.5 Systematic planning process
5.0 Organization and Schedule
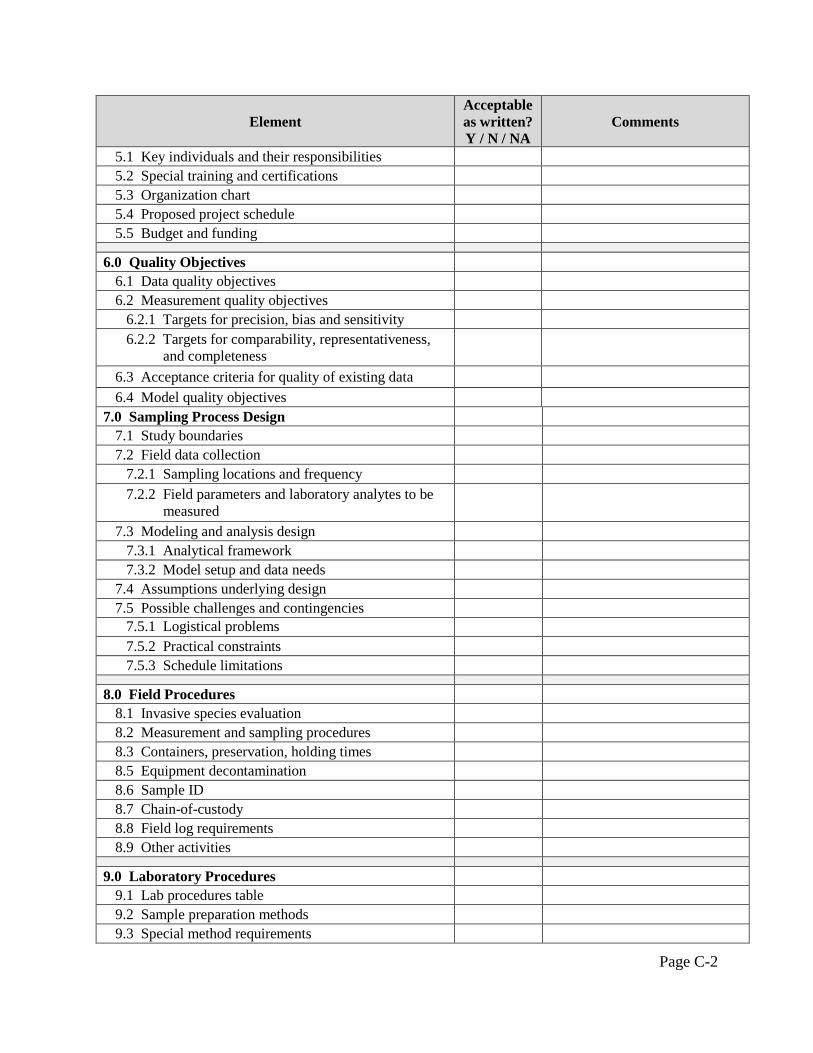
Page C-2
Element Acceptable as written? Y / N / NA
Comments
5.1 Key individuals and their responsibilities 5.2 Special training and certifications 5.3 Organization chart 5.4 Proposed project schedule 5.5 Budget and funding
6.0 Quality Objectives
6.1 Data quality objectives 6.2 Measurement quality objectives 6.2.1 Targets for precision, bias and sensitivity 6.2.2 Targets for comparability, representativeness,
and completeness
6.3 Acceptance criteria for quality of existing data 6.4 Model quality objectives
7.0 Sampling Process Design 7.1 Study boundaries 7.2 Field data collection 7.2.1 Sampling locations and frequency 7.2.2 Field parameters and laboratory analytes to be
measured
7.3 Modeling and analysis design 7.3.1 Analytical framework 7.3.2 Model setup and data needs 7.4 Assumptions underlying design 7.5 Possible challenges and contingencies 7.5.1 Logistical problems
7.5.2 Practical constraints 7.5.3 Schedule limitations
8.0 Field Procedures
8.1 Invasive species evaluation 8.2 Measurement and sampling procedures 8.3 Containers, preservation, holding times 8.5 Equipment decontamination 8.6 Sample ID 8.7 Chain-of-custody 8.8 Field log requirements 8.9 Other activities
9.0 Laboratory Procedures 9.1 Lab procedures table 9.2 Sample preparation methods 9.3 Special method requirements
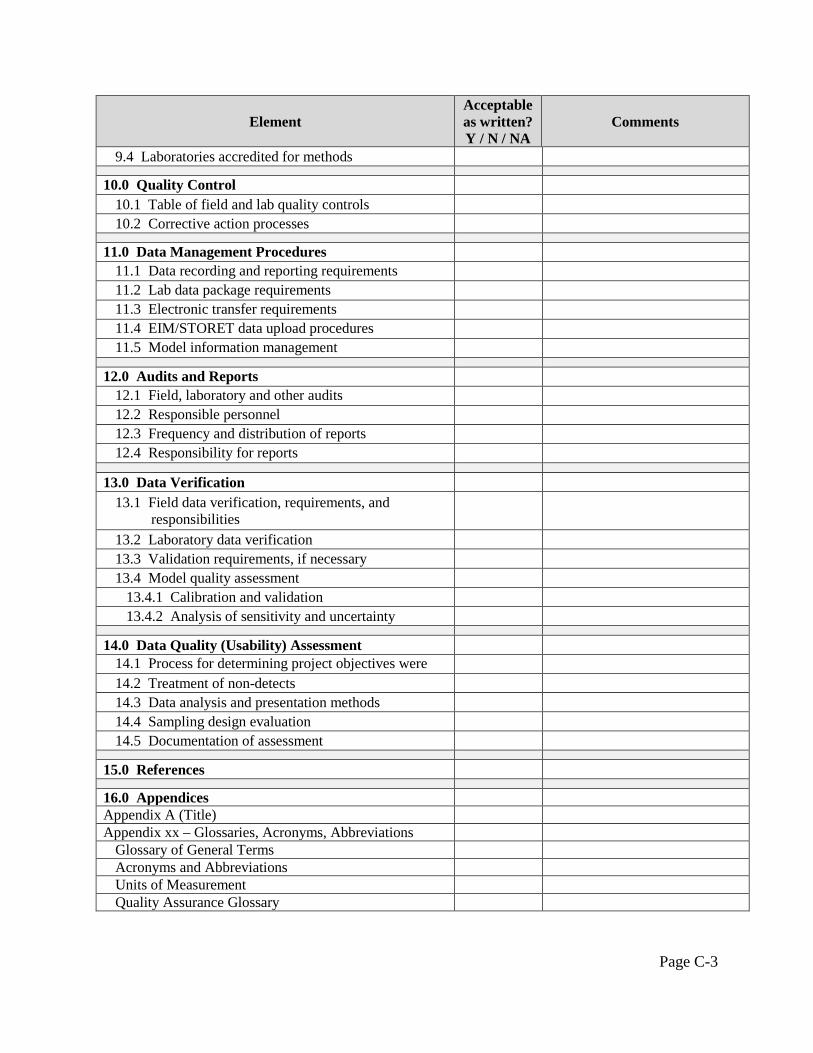
Page C-3
Element Acceptable as written? Y / N / NA
Comments
9.4 Laboratories accredited for methods 10.0 Quality Control
10.1 Table of field and lab quality controls 10.2 Corrective action processes
11.0 Data Management Procedures
11.1 Data recording and reporting requirements 11.2 Lab data package requirements 11.3 Electronic transfer requirements 11.4 EIM/STORET data upload procedures 11.5 Model information management
12.0 Audits and Reports
12.1 Field, laboratory and other audits 12.2 Responsible personnel 12.3 Frequency and distribution of reports 12.4 Responsibility for reports
13.0 Data Verification
13.1 Field data verification, requirements, and responsibilities
13.2 Laboratory data verification 13.3 Validation requirements, if necessary 13.4 Model quality assessment 13.4.1 Calibration and validation 13.4.2 Analysis of sensitivity and uncertainty
14.0 Data Quality (Usability) Assessment
14.1 Process for determining project objectives were
14.2 Treatment of non-detects 14.3 Data analysis and presentation methods 14.4 Sampling design evaluation 14.5 Documentation of assessment
15.0 References
16.0 Appendices Appendix A (Title) Appendix xx – Glossaries, Acronyms, Abbreviations
Glossary of General Terms Acronyms and Abbreviations Units of Measurement Quality Assurance Glossary
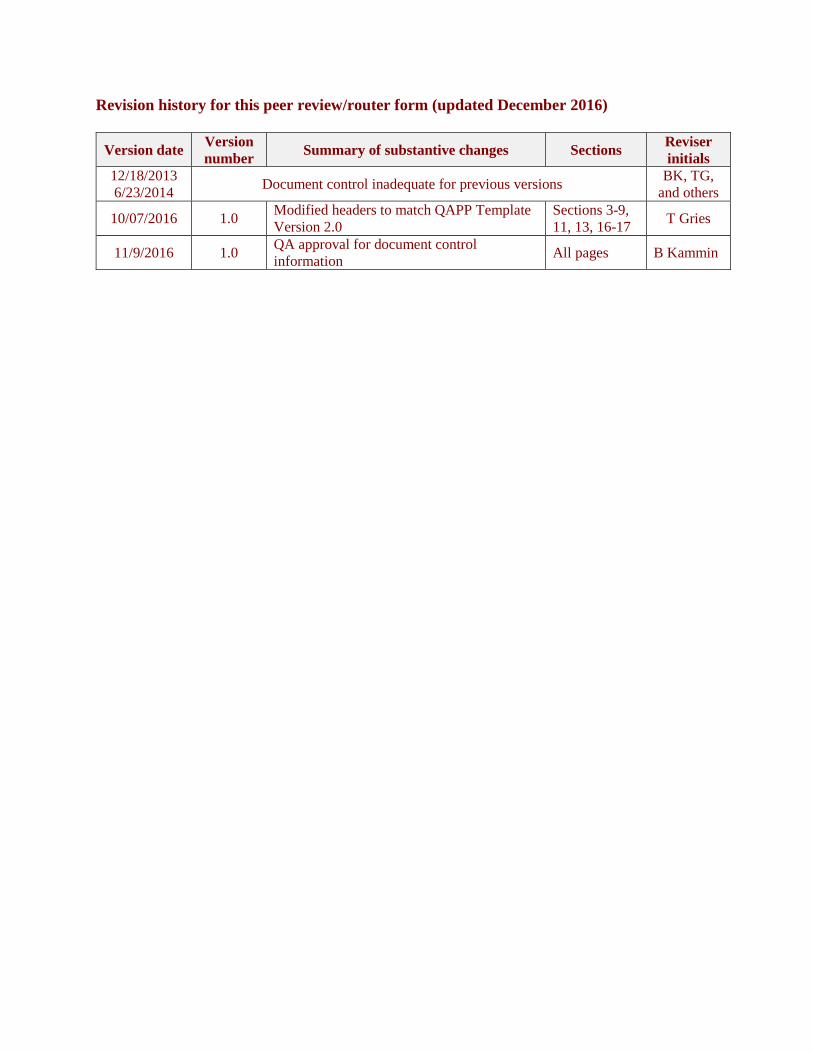
Revision history for this peer review/router form (updated December 2016)
Version date Version number Summary of substantive changes Sections Reviser
initials 12/18/2013 6/23/2014 Document control inadequate for previous versions BK, TG,
and others
10/07/2016 1.0 Modified headers to match QAPP Template Version 2.0
Sections 3-9, 11, 13, 16-17 T Gries
11/9/2016 1.0 QA approval for document control information All pages B Kammin
Page D-1
Appendix D
Comparison of QA Project Plan Elements for EPA and Ecology
This appendix lists the elements required for QA Project Plans prepared for EPA projects and then compares the elements in this document to these EPA requirements. EPA Document QA/G-5 A. Project Management A1 Title and Approval Sheet A2 Table of Contents A3 Distribution List A4 Project/Task Organization A5 Problem Definition/Background A6 Project/Task Description A7 Quality Objectives and Criteria for Measurement Data A8 Special Training Needs/Certification A9 Documents and Records B. Data Generation and Acquisition B1 Sampling Process Design (Experimental Design) B2 Sampling Methods B3 Sample Handling and Custody B4 Analytical Methods B5 Quality Control B6 Instrument/Equipment Testing, Inspection, and Maintenance B7 Instrument/Equipment Calibration and Frequency B8 Inspection/Acceptance of Supplies and Consumables B9 Non-Direct Measurements B10 Data Management C. Assessment/Oversight C1 Assessments and Response Actions C2 Reports to Management D. Data Validation and Usability D1 Data Review, Verification, and Validation D2 Verification and Validation Methods D3 Reconciliation with User Requirements
Page D-2
Ecology Guidelines
In this document, most of EPA’s 24 elements have been incorporated into the 14 elements as shown below. EPA elements A8 and B8 are omitted since they are not relevant to projects of the scale conducted by or for Ecology. The contents of EPA elements A9 and B9 are incorporated into various elements of this document. Ecology Elements EPA Elements 1. Title Page with Approvals A1 2. Table of Contents and Distribution List A2, A3 3. Background A5 4. Project Description A6 5. Organization and Schedule A4 6. Quality Objectives A7 7. Sampling Process Design (Experimental Design) B1 8. Sampling Procedures B2, B3, B6, B7 9. Measurement Procedures B4 10. Quality Control B5 11. Data Management Procedures B10 12. Audits and Reports C1, C2 13. Data Verification and Validation D1, D2 14. Data Quality (Usability) Assessment D3
Page E-1
Appendix E
Effects of Errors on Decision-making
A decision error occurs when the sample data lead to an incorrect decision. Decision errors occur because the data are incomplete and imperfect. The combination of all the errors affecting your decision is called the total study error or total variability. Total study error consists of statistical sampling error and measurement error. Statistical sampling error occurs when the sampling design is not able to characterize fully the variability of the population over space and time, including any inherent variability (e.g., stratification) in the media being sampled. Measurement error occurs during the process of collecting, handling, and analyzing samples. The following discussion is focused primarily on measurement error, but reference is also made on how to improve sampling design by increasing the number of samples taken and analyzed. In keeping with the purpose of this guidance document, emphasis is placed on how planning should take into account the effects of errors on decision-making Comparison of a Result with a Fixed Numerical Value It is often necessary in environmental decision-making to compare a result with a fixed numerical value or action level. Examples of this are determining compliance with a water quality standard or determining whether a hazardous waste site cleanup standard has been exceeded. Projects done by or for Ecology often involve use of the data for these types of decisions. The Data Quality Objectives Process described in EPA document QA/G-4 is EPA's recommended systematic planning process when data will be used to select between two alternative conditions or to determine compliance with a standard. Step 6 of the DQO Process is to specify tolerable limits on decision errors. EPA QA/G-4 provides practical guidance, but does not give a complete explanation of the statistical basis for decision-making or how the assessment decision relates to the planning process. The following provides additional information on the statistics behind EPA's process for specifying tolerable limits on decision errors. Decisions are often made without taking into account the effect of error on those decisions. Obviously, if the results are biased (high or low), our decisions may be incorrect. Random error also needs to be taken into account when decisions are made based on environmental data.
Page E-2
Effect of Random Error To begin with, assume that there is no bias in the results, only random error. This is the approach taken in the EPA QA/G-4 document. In this approach, one must take operational steps to ensure that bias in sampling and analysis is negligible. While this may not always be possible, it can provide an initial framework for the planning process. Assume also that the results are normally distributed around a mean value, which also corresponds to the regulatory limit. Referring to Figure 1, if the action level (AL) (i.e., the maximum acceptable concentration) is set equal to that regulatory threshold (C), then when the true value equals the action level, the probability of deciding that the limit has been exceeded is 50% and equals the probability of failing to decide that the limit has been exceeded, the equivalent of flipping a coin to make a decision.
Figure 1. Effect of Random Error when the Action Level (A.L.) is Set Equal to the Regulatory Limit (C)
C=A.L.
Probabilityof a FalsePositive =50%
Probabilityof a FalseNegative =50%
R
p(R)
Page E-3
Often decisions are made without taking into account the probabilities of decision errors, which are referred to as Type I and Type II errors. • Type I error is deciding that C has been exceeded when it has not. The probability of the
Type I error is denoted by α. • Type II error is the error of failing to decide that C has been exceeded when in fact it has
been. The probability of the Type II error is denoted by β, and hence (1-β) is called the power of the test (i.e., in this example, the power to determine that a standard has been exceeded).
In EPA document QA/G-4, Type I and Type II errors are defined in terms of the null hypothesis. A false rejection (Type I) decision error occurs if the decision-maker rejects the null hypothesis when it is really true, and a false acceptance (Type II) decision error occurs if the decision-maker fails to reject the null hypothesis when it is really false. To further clarify this, consider the following cases. Figure 2(a) shows that when the true concentration of a parameter, T, is slightly less than the standard or regulatory threshold, C, random errors will frequently lead to a result, R, that is greater than C. Similarly, Figure 2(b) shows that when T is a little greater than C, there is a substantial probability that a result less than C will be obtained. Suppose the decision rule is to take corrective action whenever R>C. When T is close to C, there are significant probabilities that action will be taken when it is not necessary (when R>C but T<C) or that action will not be taken when it is required (when R<C but T>C). Suppose that we want to reduce the probabilities of these two undesirable decisions so that neither of them occurs at a frequency greater than 5%. To do that, a new action limit C' must be defined and action taken whenever R>C'. (See Figure 2(c).) The value of C' is chosen so that, when T=C, the probability of obtaining a result less than C' is no greater than 0.05. From the properties of the normal distribution, C'=C-1.64σC, where σC is the standard deviation of measurement results at the level C. However when T=C', action will be called for needlessly 50% of the time. Thus, to ensure that action is not needlessly taken too frequently, the aim must be to make the decision at or below a control limit C'', where C'' is chosen so that, when T=C'', the probability of obtaining a result greater than C' is no more than 0.05. (See Figure 2(d).)
Page E-4
Again, from the properties of the normal distribution, C''=C'-1.64σC'', where σC'' is the standard deviation of measurement results at the concentration C''. It follows that C''=C-1.64(σC+σC''). If it is assumed that σ is independent of the concentration of the parameter in the range between C'' and C, the previous equation can be solved to give σ=(C-C'')/3.28. Figure 2(e) combines the two curves presented in Figures 2(c) and 2(d) to show the relationships between the control and action limits.
(a) T<C but high probability that R>C (b) T>C but high probability that R<C
(c) Definition of action limit, C’
↑p(R) ↑
p(R)
↑p(R) ↑
p(R)Shaded arearepresents5% of resultswhen T=C
Shaded arearepresents5% of resultswhen T = C’’
R→ R→
R→ R→
T C C T
T=C T=C’’
Figure 2(a)-(d). Effect of Random Errors on Decision-Making
(d) Definition of control limit, C’’C’ CC’
Page E-5
Note that C' is the action limit or critical level for decision-making. Decisions are made at the action limit and not at the regulatory limit, in order to reduce Type I errors. C'' is called the control limit because in some environmental situations, such as the operation of a treatment plant or when it is possible to change the inputs of pollution to the environment, one can take measures to control the concentration below C''. In other environmental situations such as cleanup of a hazardous waste site, there is no control of the concentration, but C'' can be established in order to determine how many samples need to be taken to reduce the effect of Type II errors on decision-making. The above considerations provide the basis for EPA's procedure for specifying tolerable limits on decision errors, as described in EPA documents (QA/G-4 and QA/G-4HW) and software (QA/G-4D). While the normal distribution curves in Figures 2(a) through 2(e) are not shown in these EPA documents, they provide the theoretical basis for the construction and use of the Decision Performance Curve and Decision Performance Goal Diagrams used by EPA for decision-making. Figure 3 is an example of a Decision Performance Curve taken from EPA QA/G-4. This curve illustrates how the probability of deciding that the parameter exceeds the standard or regulatory level changes as the true value of the parameter changes. For an ideal decision performance curve where random error is considered to be negligible, the probability is zero until the standard or regulatory level is reached. But for a realistic decision performance curve representing a real-world situation with random error, the probability gradually increases and does not reach 100% until the standard or regulatory level is exceeded. In statistical terms, the realistic decision performance curve is a plot showing how β changes as the true value of the parameter changes. EPA refers to this as a power curve, although usually a power curve is a plot of 1-β against the true value.
Figure 2(e). Statistical Approach to Decision-Making
CC’C’’
/// The probability of calling for action when it is not needed\\\ The probability of not calling for action when it is needed
Action Limit
Control Limit
Regulatory Limit
p(R)
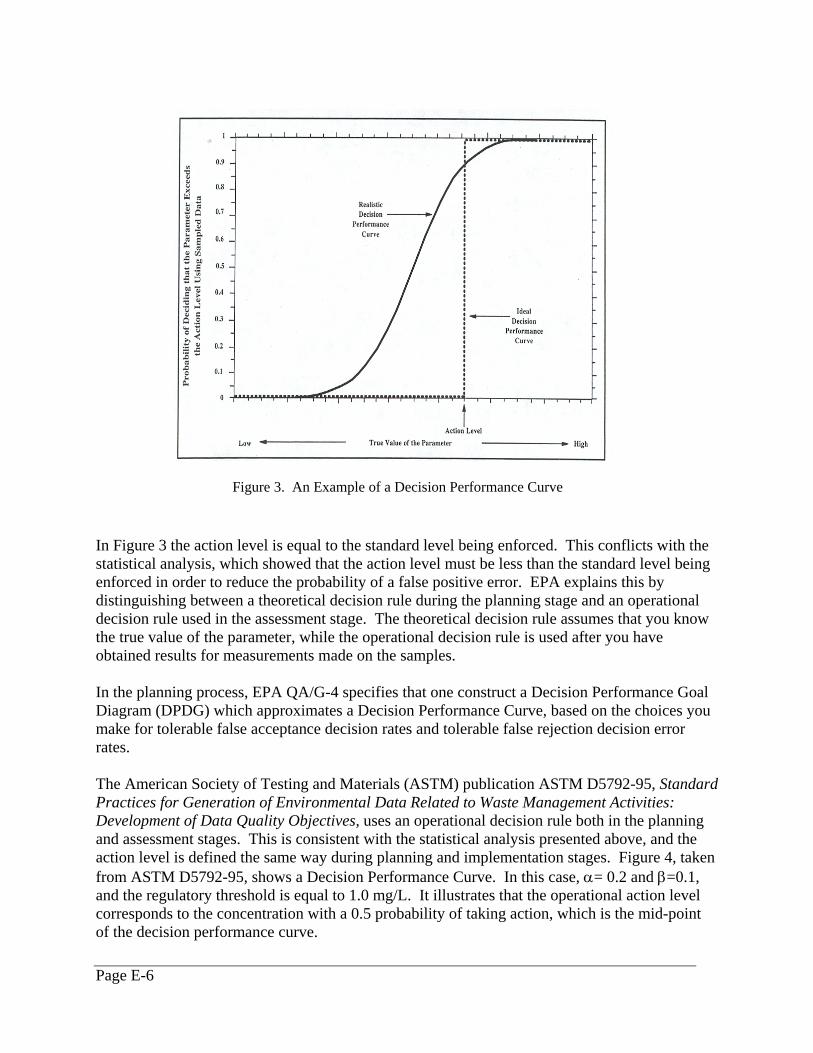
Page E-6
In Figure 3 the action level is equal to the standard level being enforced. This conflicts with the statistical analysis, which showed that the action level must be less than the standard level being enforced in order to reduce the probability of a false positive error. EPA explains this by distinguishing between a theoretical decision rule during the planning stage and an operational decision rule used in the assessment stage. The theoretical decision rule assumes that you know the true value of the parameter, while the operational decision rule is used after you have obtained results for measurements made on the samples. In the planning process, EPA QA/G-4 specifies that one construct a Decision Performance Goal Diagram (DPDG) which approximates a Decision Performance Curve, based on the choices you make for tolerable false acceptance decision rates and tolerable false rejection decision error rates. The American Society of Testing and Materials (ASTM) publication ASTM D5792-95, Standard Practices for Generation of Environmental Data Related to Waste Management Activities: Development of Data Quality Objectives, uses an operational decision rule both in the planning and assessment stages. This is consistent with the statistical analysis presented above, and the action level is defined the same way during planning and implementation stages. Figure 4, taken from ASTM D5792-95, shows a Decision Performance Curve. In this case, α= 0.2 and β=0.1, and the regulatory threshold is equal to 1.0 mg/L. It illustrates that the operational action level corresponds to the concentration with a 0.5 probability of taking action, which is the mid-point of the decision performance curve.
Figure 3. An Example of a Decision Performance Curve
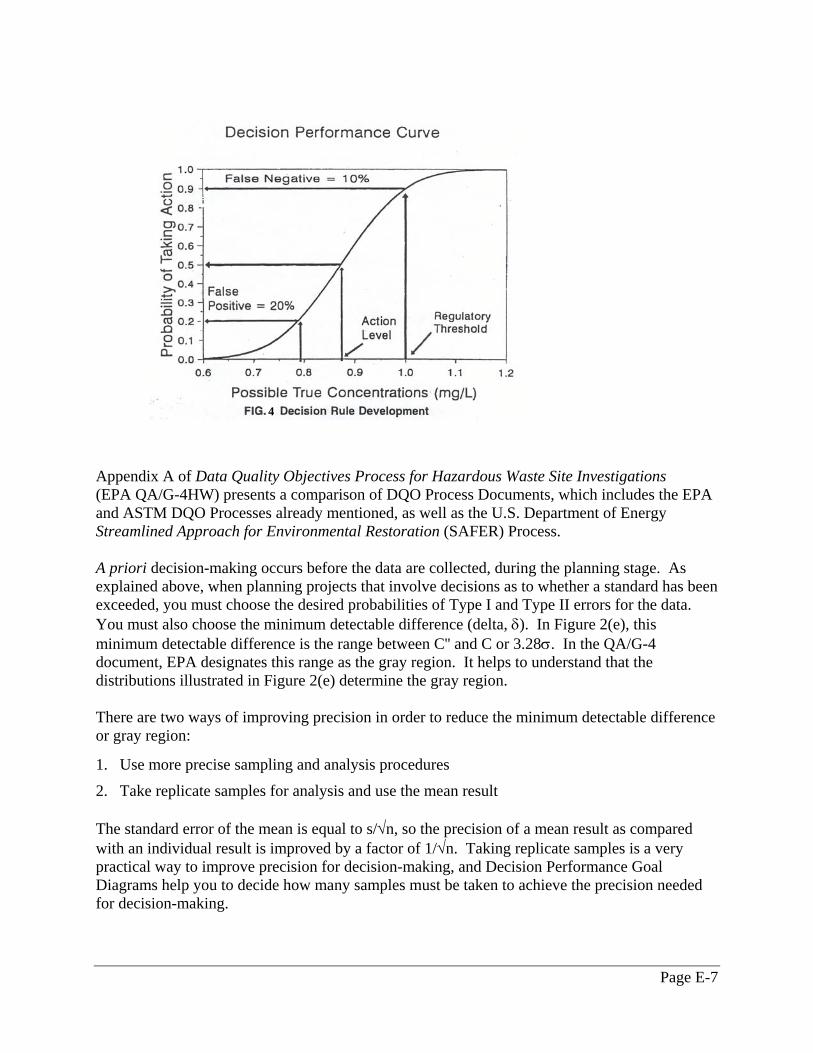
Page E-7
4
Appendix A of Data Quality Objectives Process for Hazardous Waste Site Investigations (EPA QA/G-4HW) presents a comparison of DQO Process Documents, which includes the EPA and ASTM DQO Processes already mentioned, as well as the U.S. Department of Energy Streamlined Approach for Environmental Restoration (SAFER) Process. A priori decision-making occurs before the data are collected, during the planning stage. As explained above, when planning projects that involve decisions as to whether a standard has been exceeded, you must choose the desired probabilities of Type I and Type II errors for the data. You must also choose the minimum detectable difference (delta, δ). In Figure 2(e), this minimum detectable difference is the range between C'' and C or 3.28σ. In the QA/G-4 document, EPA designates this range as the gray region. It helps to understand that the distributions illustrated in Figure 2(e) determine the gray region.
There are two ways of improving precision in order to reduce the minimum detectable difference or gray region:
1. Use more precise sampling and analysis procedures
2. Take replicate samples for analysis and use the mean result The standard error of the mean is equal to s/√n, so the precision of a mean result as compared with an individual result is improved by a factor of 1/√n. Taking replicate samples is a very practical way to improve precision for decision-making, and Decision Performance Goal Diagrams help you to decide how many samples must be taken to achieve the precision needed for decision-making.
Page E-8
The number of samples that must be analyzed is determined from the chosen values of α, β, and δ. These, along with the value for σ, will determine how many samples need to be included in each mean result. Ideally, the value assigned to σ will be based on an estimate from previous sample analyses at the site. If not, make a preliminary estimate using your best judgement. The bottom line is that you can choose the number of samples needed to ensure that, if the true value is equal to C'', the probability of deciding incorrectly that the standard has been exceeded should be equal to β. The formula for calculating the sample size, assuming simple random sampling, needed to meet the conditions specified for α, β, δ, and σ is given by:
2)( 2
12
112
αβα
δσ
−−− ++
=zzz
n
where zp=the pth percentile of the standard normal distribution. When α=β=0.05, this equation can be solved for the minimum detectable difference, δ,:
nσδ 28.3
=
Thus, for the example given in Figure 2(e), the value of n can be calculated by solving this equation for n, i.e., n≅10.8(σ/δ)2. This aspect of choosing n so that a test is capable of detecting a difference when the population mean differs from a fixed value (e.g., regulatory limit) by a specified amount is known as “ensuring adequate power of the test.”
EPA has provided software that will calculate n for the case described above, as well as for other sampling designs. The latest version of that software, Decision Error Feasibility Trials (DEFT), is available at the web site listed in Appendix J The U.S. Department of Energy also provides software called Visual Sample Plan (VSP) which provides statistical solutions to sampling design and answers two important questions in sample planning: (1) How many samples are needed? and (2) Where should the samples be taken? VSP is available at the web site listed in Appendix J. A posteriori decision-making occurs after the data are collected, during the data quality assessment stage, and is based solely on the probability of Type I error, α. The action level (critical level in statistical terminology) should be near the concentration C' established during the planning process. However, the actual decision level will be determined by performing a t-test. The t-test is done to test the null hypothesis that the mean is equal to or greater than the standard or regulatory threshold (C) against the alternative hypothesis that the mean is less than C.
Page E-9
The t-statistic is calculated as follows:
ns
Extcalc /
−=
where E = the expected or standard value (C) s = the estimated standard deviation of a single result and n results have been used in calculating the mean The value of tcalc is compared with a value of t found in a table (ttabl) based on the number of degrees of freedom used in estimating s and the value of α chosen previously. For this test, one rejects the null hypothesis if tcalc is less than ttabl. Note that this is a one-sided test in which the mean being tested is less than the expected or standard value. Effect of Bias As a general rule, it is preferable, and sometimes essential, to ensure that bias is negligible. EPA QA/G-4 assumes negligible bias in specifying tolerable limits on decision errors. Unfortunately, it is often the case that significant bias is present in sampling and analysis. Unrepresentative sampling contributes to biased results; therefore, it is important to have a good sampling plan and ensure that operational implementation of the plan gets representative samples. Results obtained from the use of many analytical methods, especially those involving extraction of organic compounds from environmental matrices, exhibit negative bias caused by differences in procedures for calibration and sample analyses. Bias may also be caused by interference or failure to allow for blank correction. The project manager should be aware of the bias inherent in the use of some methods, and coordinate with the laboratory to choose methods that are capable of meeting the targets for bias established in the MQOs. Since there are several possible causes for bias, and bias can vary with concentration as well as from sample to sample and from time to time, it is not generally possible to eliminate bias by measuring it and making a correction to the result for each sample. When random error is negligible, the only generally effective approach that can be used to account for bias is to change the action level to allow for it. For example, if the standard is C and negative bias is present, one could control at C-βc, where βc is the bias present at concentration C. When both bias and random errors are present, there is no simple and general approach that overcomes the problems involved in the interpretation of results. It is usually possible to obtain an estimate of the random error of a particular result, but much more difficult to estimate the bias. Therefore, emphasis should be placed on ensuring that the magnitude of bias is as small as possible. Finally, one can shift the action level to a lower or higher value, depending on whether
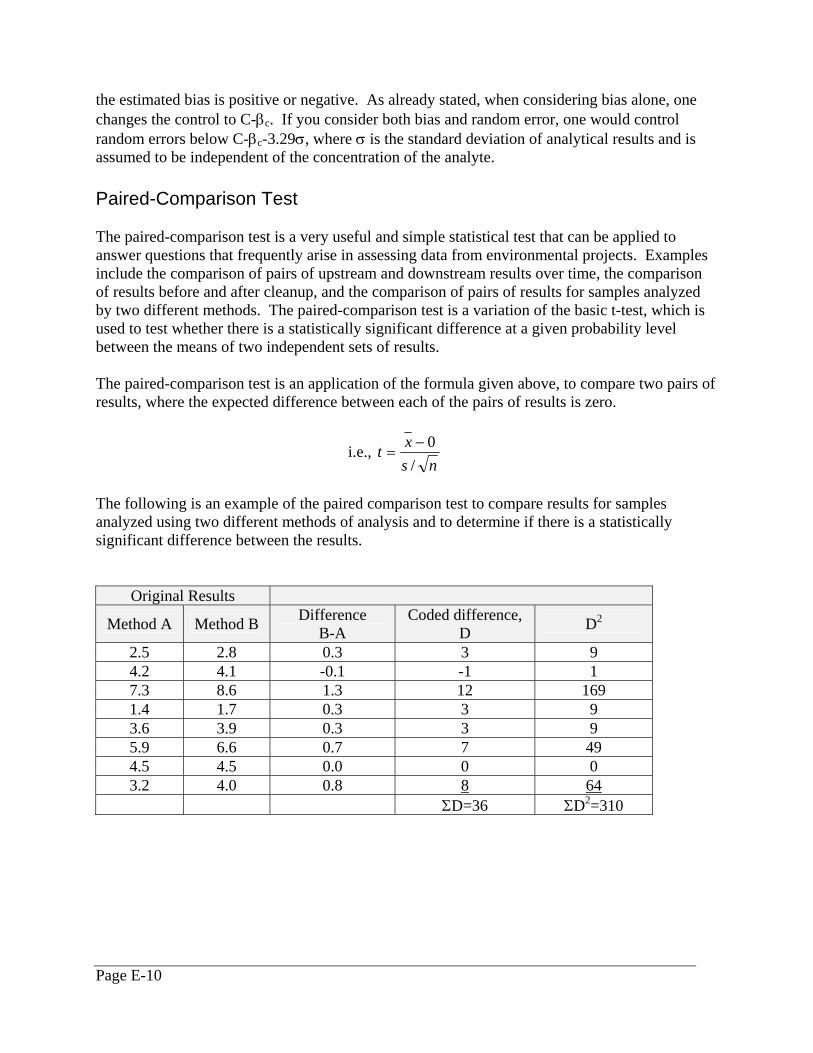
Page E-10
the estimated bias is positive or negative. As already stated, when considering bias alone, one changes the control to C-βc. If you consider both bias and random error, one would control random errors below C-βc-3.29σ, where σ is the standard deviation of analytical results and is assumed to be independent of the concentration of the analyte. Paired-Comparison Test The paired-comparison test is a very useful and simple statistical test that can be applied to answer questions that frequently arise in assessing data from environmental projects. Examples include the comparison of pairs of upstream and downstream results over time, the comparison of results before and after cleanup, and the comparison of pairs of results for samples analyzed by two different methods. The paired-comparison test is a variation of the basic t-test, which is used to test whether there is a statistically significant difference at a given probability level between the means of two independent sets of results.
The paired-comparison test is an application of the formula given above, to compare two pairs of results, where the expected difference between each of the pairs of results is zero.
i.e., ns
xt/
0−=
The following is an example of the paired comparison test to compare results for samples analyzed using two different methods of analysis and to determine if there is a statistically significant difference between the results.
Original Results
Method A Method B Difference B-A
Coded difference, D D2
2.5 2.8 0.3 3 9 4.2 4.1 -0.1 -1 1 7.3 8.6 1.3 12 169 1.4 1.7 0.3 3 9 3.6 3.9 0.3 3 9 5.9 6.6 0.7 7 49 4.5 4.5 0.0 0 0 3.2 4.0 0.8 8 64
ΣD=36 ΣD2=310
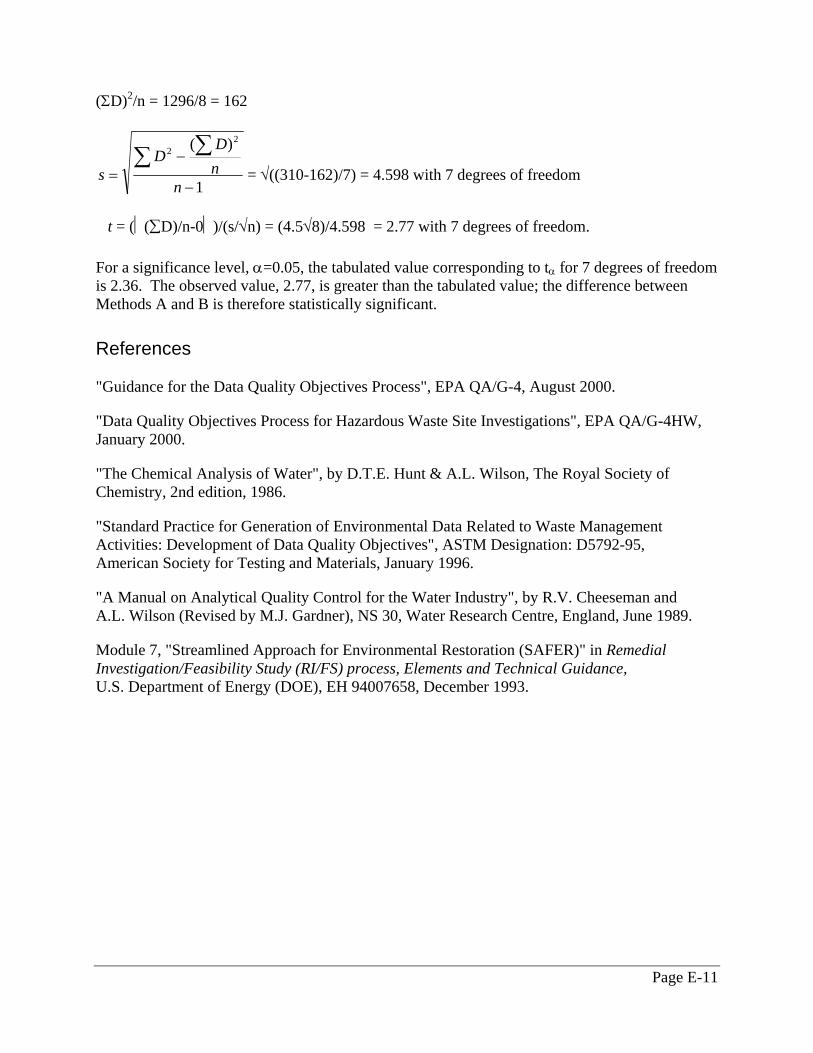
Page E-11
(ΣD)2/n = 1296/8 = 162
1
)( 22
−
−=∑ ∑
nnD
Ds = √((310-162)/7) = 4.598 with 7 degrees of freedom
t = (⏐(∑D)/n-0⏐)/(s/√n) = (4.5√8)/4.598 = 2.77 with 7 degrees of freedom.
For a significance level, α=0.05, the tabulated value corresponding to tα for 7 degrees of freedom is 2.36. The observed value, 2.77, is greater than the tabulated value; the difference between Methods A and B is therefore statistically significant. References
"Guidance for the Data Quality Objectives Process", EPA QA/G-4, August 2000.
"Data Quality Objectives Process for Hazardous Waste Site Investigations", EPA QA/G-4HW, January 2000.
"The Chemical Analysis of Water", by D.T.E. Hunt & A.L. Wilson, The Royal Society of Chemistry, 2nd edition, 1986.
"Standard Practice for Generation of Environmental Data Related to Waste Management Activities: Development of Data Quality Objectives", ASTM Designation: D5792-95, American Society for Testing and Materials, January 1996.
"A Manual on Analytical Quality Control for the Water Industry", by R.V. Cheeseman and A.L. Wilson (Revised by M.J. Gardner), NS 30, Water Research Centre, England, June 1989.
Module 7, "Streamlined Approach for Environmental Restoration (SAFER)" in Remedial Investigation/Feasibility Study (RI/FS) process, Elements and Technical Guidance, U.S. Department of Energy (DOE), EH 94007658, December 1993.

Page E-12
This page is purposely left blank for duplex printing.
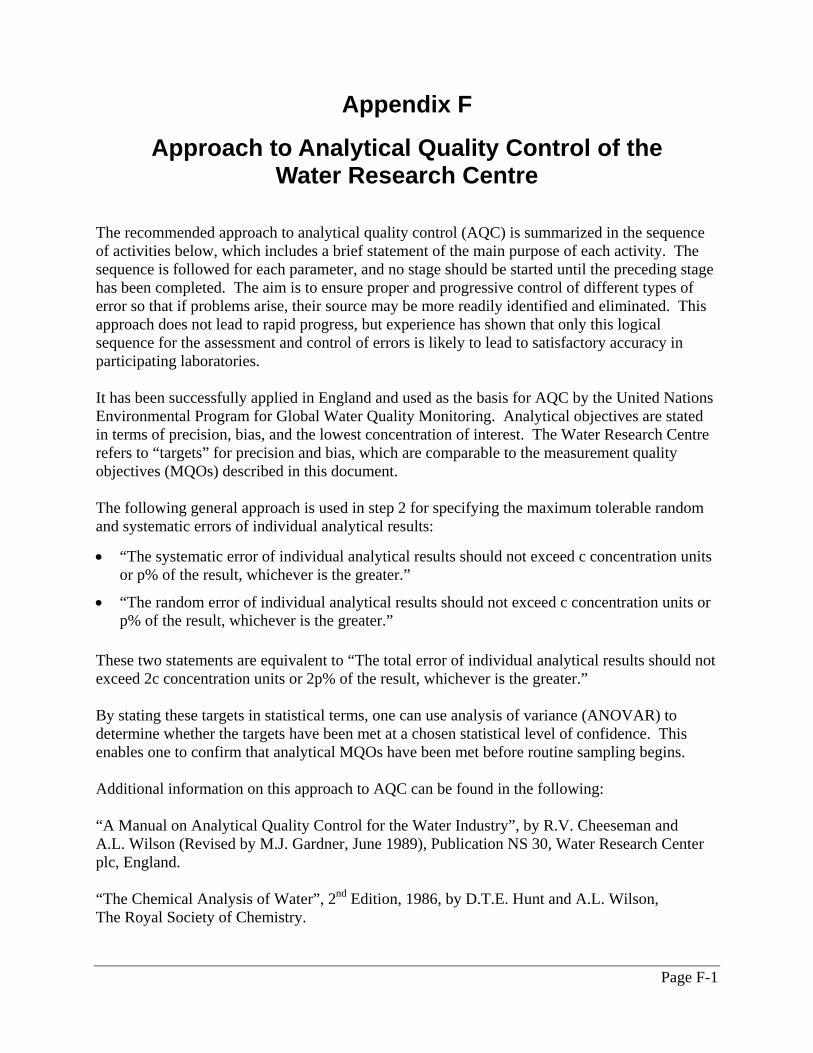
Page F-1
Appendix F
Approach to Analytical Quality Control of the Water Research Centre
The recommended approach to analytical quality control (AQC) is summarized in the sequence of activities below, which includes a brief statement of the main purpose of each activity. The sequence is followed for each parameter, and no stage should be started until the preceding stage has been completed. The aim is to ensure proper and progressive control of different types of error so that if problems arise, their source may be more readily identified and eliminated. This approach does not lead to rapid progress, but experience has shown that only this logical sequence for the assessment and control of errors is likely to lead to satisfactory accuracy in participating laboratories. It has been successfully applied in England and used as the basis for AQC by the United Nations Environmental Program for Global Water Quality Monitoring. Analytical objectives are stated in terms of precision, bias, and the lowest concentration of interest. The Water Research Centre refers to “targets” for precision and bias, which are comparable to the measurement quality objectives (MQOs) described in this document. The following general approach is used in step 2 for specifying the maximum tolerable random and systematic errors of individual analytical results:
• “The systematic error of individual analytical results should not exceed c concentration units or p% of the result, whichever is the greater.”
• “The random error of individual analytical results should not exceed c concentration units or p% of the result, whichever is the greater.”
These two statements are equivalent to “The total error of individual analytical results should not exceed 2c concentration units or 2p% of the result, whichever is the greater.” By stating these targets in statistical terms, one can use analysis of variance (ANOVAR) to determine whether the targets have been met at a chosen statistical level of confidence. This enables one to confirm that analytical MQOs have been met before routine sampling begins. Additional information on this approach to AQC can be found in the following: “A Manual on Analytical Quality Control for the Water Industry”, by R.V. Cheeseman and A.L. Wilson (Revised by M.J. Gardner, June 1989), Publication NS 30, Water Research Center plc, England. “The Chemical Analysis of Water”, 2nd Edition, 1986, by D.T.E. Hunt and A.L. Wilson, The Royal Society of Chemistry.
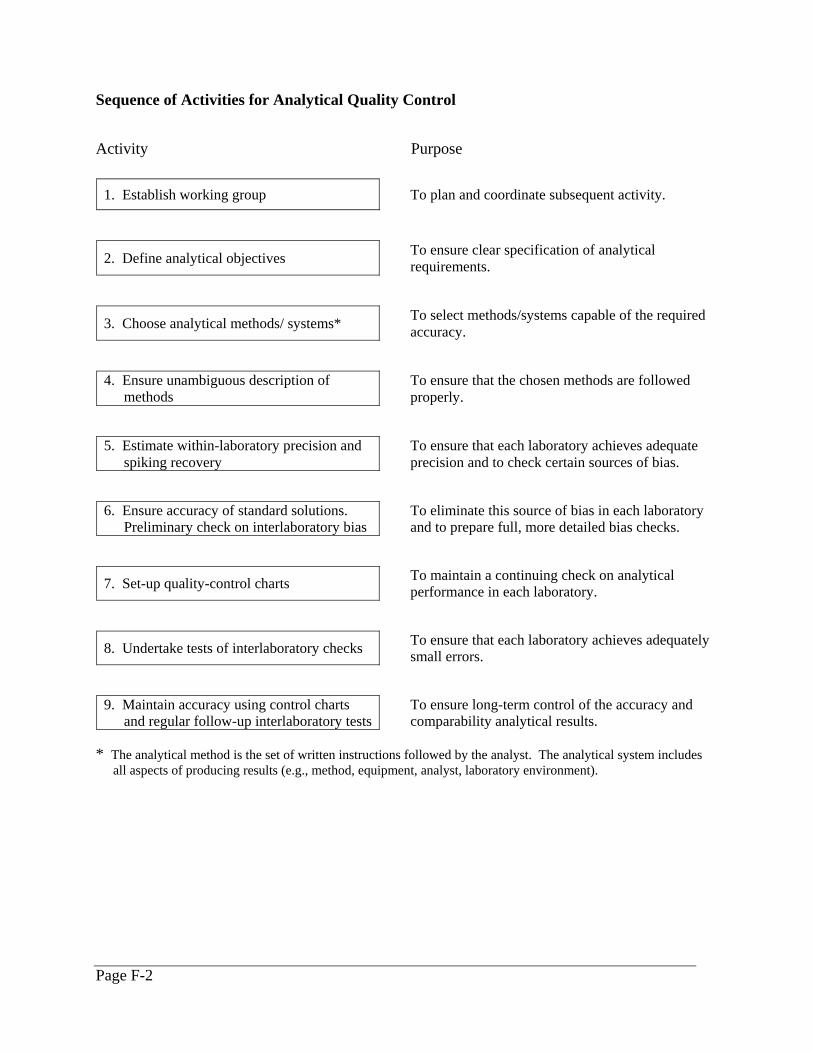
Page F-2
Sequence of Activities for Analytical Quality Control
Activity Purpose
* The analytical method is the set of written instructions followed by the analyst. The analytical system includes
all aspects of producing results (e.g., method, equipment, analyst, laboratory environment).
1. Establish working group To plan and coordinate subsequent activity.
2. Define analytical objectives To ensure clear specification of analytical requirements.
3. Choose analytical methods/ systems* To select methods/systems capable of the required accuracy.
4. Ensure unambiguous description of methods
To ensure that the chosen methods are followed properly.
5. Estimate within-laboratory precision and spiking recovery
To ensure that each laboratory achieves adequate precision and to check certain sources of bias.
6. Ensure accuracy of standard solutions. Preliminary check on interlaboratory bias
To eliminate this source of bias in each laboratory and to prepare full, more detailed bias checks.
7. Set-up quality-control charts To maintain a continuing check on analytical performance in each laboratory.
8. Undertake tests of interlaboratory checks To ensure that each laboratory achieves adequately small errors.
9. Maintain accuracy using control charts and regular follow-up interlaboratory tests
To ensure long-term control of the accuracy and comparability analytical results.
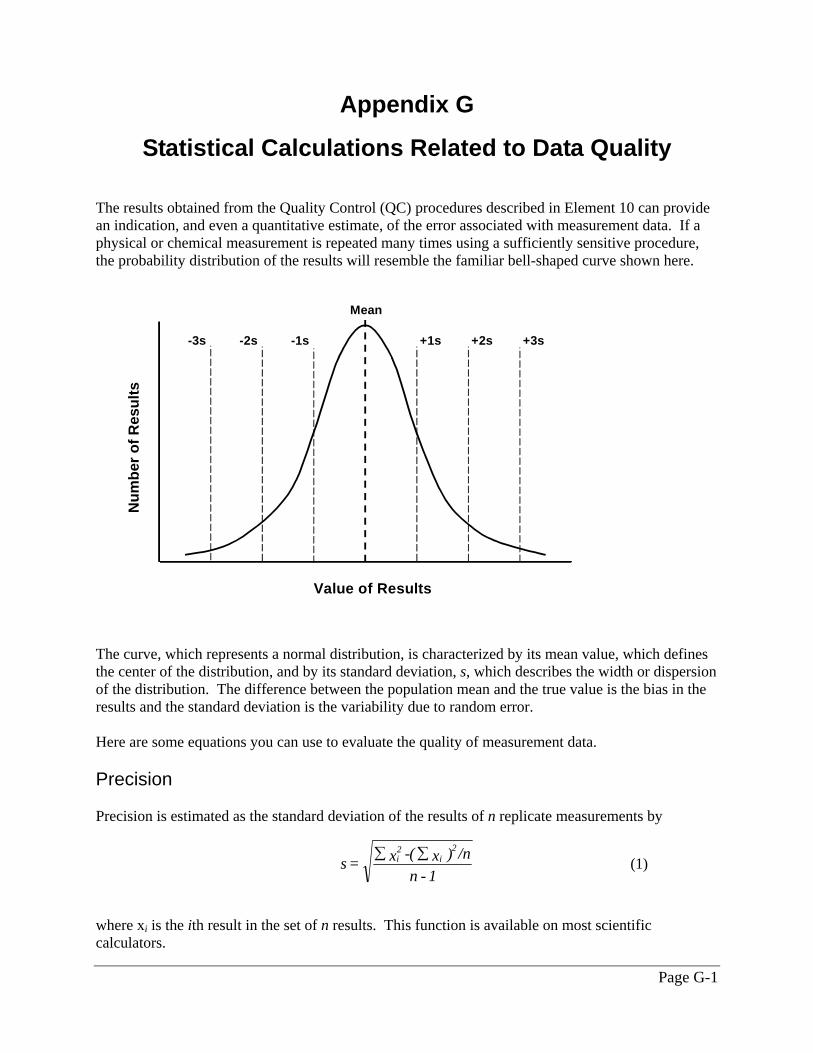
Page G-1
Appendix G
Statistical Calculations Related to Data Quality The results obtained from the Quality Control (QC) procedures described in Element 10 can provide an indication, and even a quantitative estimate, of the error associated with measurement data. If a physical or chemical measurement is repeated many times using a sufficiently sensitive procedure, the probability distribution of the results will resemble the familiar bell-shaped curve shown here.
-3s -2s -1s +1s +2s +3s
Mean
Num
ber o
f Res
ults
Value of Results
The curve, which represents a normal distribution, is characterized by its mean value, which defines the center of the distribution, and by its standard deviation, s, which describes the width or dispersion of the distribution. The difference between the population mean and the true value is the bias in the results and the standard deviation is the variability due to random error. Here are some equations you can use to evaluate the quality of measurement data. Precision Precision is estimated as the standard deviation of the results of n replicate measurements by
where xi is the ith result in the set of n results. This function is available on most scientific calculators.
1-n
/n)x(-x = s2
i2i ∑∑ (1)
Page G-2
For duplicate results, Equation 1 becomes
where D is the difference between the two results. If more than one estimate of the standard deviation of a population is available, a pooled estimate, sp, may be calculated from
where νi = ni – 1, the number of degrees of freedom associated with the estimate of si. For m pairs of duplicate results, Equation 3 reduces to
p
2
s = D2m∑
(4)
The estimate of standard deviation improves as the number of degrees of freedom increases. For a better estimate of s, plan to collect and/or analyze more replicates or more pairs of duplicates. The pooling equations assume that the standard deviations are all from the same population of results. Since the standard deviation varies with the magnitude of the results, the pooling equations should be used only for results of approximately the same magnitude. As a rule of thumb, use results that are within one order of magnitude for pooling standard deviations. If your study involves a wide range of results, it might be necessary to obtain separate estimates of standard deviation for several ranges of concentration. Precision is often reported as the Relative Standard Deviation (RSD) of the results of replicate measurements, which is calculated as a percentage of the mean by
where x is the mean of the replicate measurements. Sometimes the precision of differences between duplicate results is expressed as the Relative Percent Difference (RPD), which is calculated as
20021
21 ×⎟⎟⎠
⎞⎜⎜⎝
⎛
+
−=
RRRR
RPD
where R1=Result for the first measurement and R2=Result for the second measurement
2
D = s (2)
pi
2i
is = s∑
∑νν
(3)
100 xs = RSD ⋅ (5)
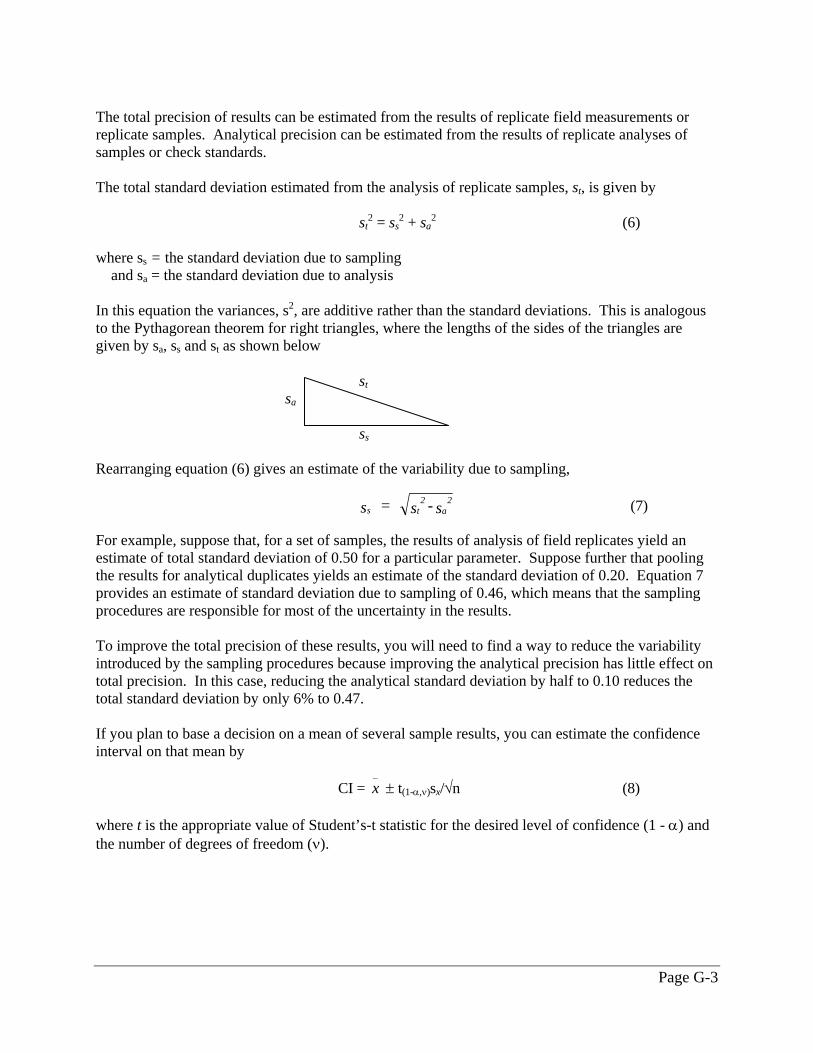
Page G-3
The total precision of results can be estimated from the results of replicate field measurements or replicate samples. Analytical precision can be estimated from the results of replicate analyses of samples or check standards. The total standard deviation estimated from the analysis of replicate samples, st, is given by st
2 = ss2 + sa
2 (6) where ss = the standard deviation due to sampling and sa = the standard deviation due to analysis In this equation the variances, s2, are additive rather than the standard deviations. This is analogous to the Pythagorean theorem for right triangles, where the lengths of the sides of the triangles are given by sa, ss and st as shown below st
sa
ss
Rearranging equation (6) gives an estimate of the variability due to sampling,
For example, suppose that, for a set of samples, the results of analysis of field replicates yield an estimate of total standard deviation of 0.50 for a particular parameter. Suppose further that pooling the results for analytical duplicates yields an estimate of the standard deviation of 0.20. Equation 7 provides an estimate of standard deviation due to sampling of 0.46, which means that the sampling procedures are responsible for most of the uncertainty in the results. To improve the total precision of these results, you will need to find a way to reduce the variability introduced by the sampling procedures because improving the analytical precision has little effect on total precision. In this case, reducing the analytical standard deviation by half to 0.10 reduces the total standard deviation by only 6% to 0.47. If you plan to base a decision on a mean of several sample results, you can estimate the confidence interval on that mean by
CI = _x ± t(1-α,ν)sx/√n (8)
where t is the appropriate value of Student’s-t statistic for the desired level of confidence (1 - α) and the number of degrees of freedom (ν).
s2
t2
as = s - s (7)
Page G-4
If the standard deviation has been estimated from a reasonable number of sample results (at least 10), confidence intervals can be assigned to individual results. The confidence interval for a result, x, is given by
Suppose that the mean of the results of 10 replicate determinations is 11.3 and the standard deviation is 1.0. To determine the 95% confidence interval on the mean, look up the value of the 5% point (double-sided test) of the Student’s t-statistic for 9 degrees of freedom, which happens to be 2.26. Using Equation 8,
95% CI on the Mean = 11.3 ± 2.26(1.0)/ √10
= 11.3 ± 0.7
Thus there is a 95% chance that the actual value of the mean lies between these values, assuming no bias in the results. On the other hand, suppose you need to estimate the confidence interval on just one of those 10 results, say x = 12.4. Then Equation 9 gives
95% CI on x = 12.4 ± 2.26(1.0)
= 12.4 ± 2.26
= 10.1 – 14.7
and there is a 95% chance that the actual value for that sample lies between these values. This example demonstrates that the mean of several results gives a much more precise estimate of the population mean than can be obtained with any single result, a consequence of the fact that the standard error of the mean is equal to s/√n. Precision must be considered when comparing results to other data or to fixed limits. For example, if the confidence interval for a result includes the regulatory limit, then no decision can be made as to whether the limit was exceeded, and an objective of the study may not be achieved. Also, if the confidence intervals for the results from two locations or time periods overlap, then the two sets of results are not statistically different at the probability level selected for the comparison. If replicate measurements are not greater than the reporting limit, precision cannot be estimated for that parameter. Thus, it is important to select samples to be analyzed in replicate which are likely to give results greater than the reporting limit. There is no need to randomly select measurements or samples for replication. The more information and professional judgement you can bring to the selection process, the more likely you are to obtain useful information from the results.
CI = x ± t(1-α,ν)sx (9)
Page G-5
Bias The determination of bias due to sampling procedures requires special studies designed to examine the various sources of error. Such studies have led to the recommended procedures for sample collection, preservation, etc. currently in use. Careful adherence to the procedures selected for the project should maintain bias within acceptable limits. Two potential sources of systematic error (bias) in a measurement are calibration and interferences due to the sample matrix. The results for analyses of check standards can be used to estimate bias due to calibration error. The results for analyses of matrix spikes can be used to detect interference effects due to the sample matrix. An estimate of bias due to calibration is given by
_ where x is the mean of the results of (at least 10) replicate analyses of the check standard, and T is the true concentration. If the confidence interval on the mean includes T, the difference is probably due to random error rather than bias. The analyst should monitor check standard results and recalibrate the instrument when the difference exceeds the laboratory's control limits. For matrix spikes, the percent recovery (%R) is given by
where xs is the result for the matrix spike, x is the result for the unspiked sample, and Cs is the concentration of the spike added to the sample. Bias is judged to be present when the %R falls outside the control limits established by the laboratory based on historical data. When this occurs, the analytical procedure should be modified to eliminate the interference effects if possible. Since the %R is a function of the difference between two results, its uncertainty is relatively large, and the power of the spike recovery test to detect bias is therefore low. For this reason, correction of the sample results based on matrix spike recovery is not recommended. If QC results exceed their criteria and no corrective action is taken by the laboratory, the sample results should be qualified as estimated or unusable. If data verification and validation reveal significant bias indicated by QC results, the project manager may need to conclude that the data cannot be used or that they should be qualified for the purpose of the project.
100 T
T-x = B(%) ⋅ (10)
100 C
xx = %R
s
s ⋅−
(11)

Page G-6
This page is purposely left blank for duplex printing.
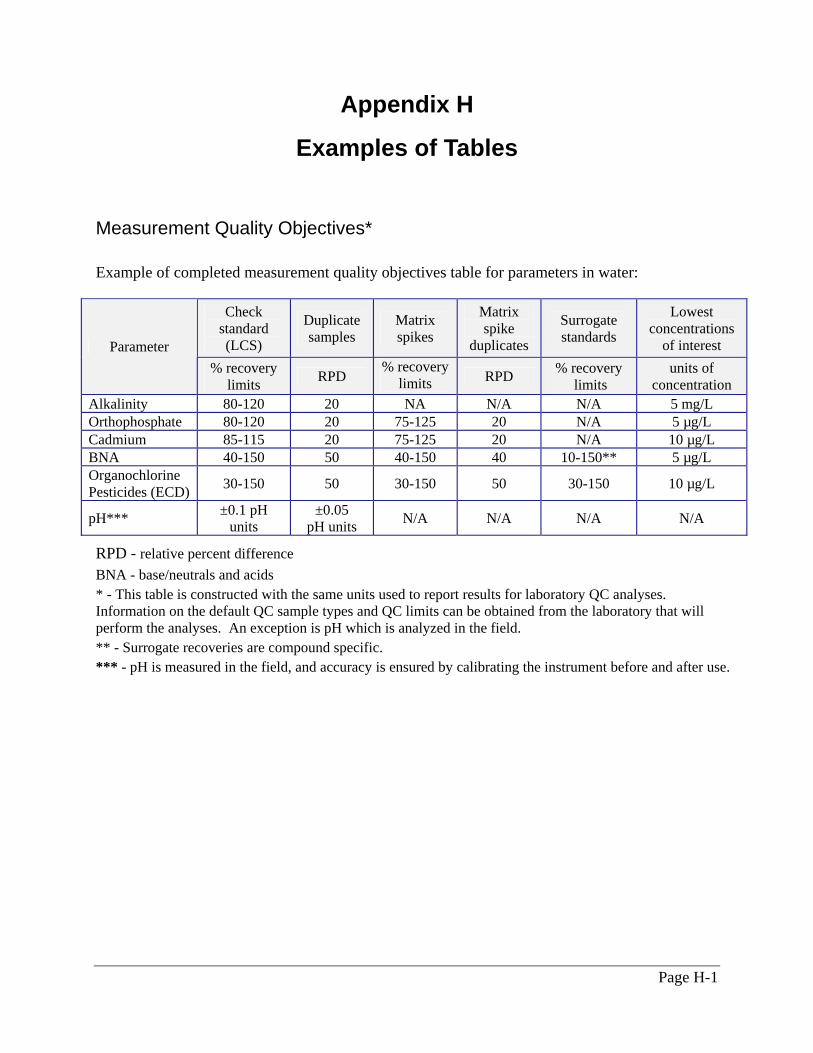
Page H-1
Appendix H
Examples of Tables Measurement Quality Objectives* Example of completed measurement quality objectives table for parameters in water:
RPD - relative percent difference BNA - base/neutrals and acids * - This table is constructed with the same units used to report results for laboratory QC analyses. Information on the default QC sample types and QC limits can be obtained from the laboratory that will perform the analyses. An exception is pH which is analyzed in the field. ** - Surrogate recoveries are compound specific. *** - pH is measured in the field, and accuracy is ensured by calibrating the instrument before and after use.
Check standard (LCS)
Duplicate samples
Matrix spikes
Matrix spike
duplicates
Surrogate standards
Lowest concentrations
of interest Parameter % recovery
limits RPD % recovery
limits RPD % recovery limits
units of concentration
Alkalinity 80-120 20 NA N/A N/A 5 mg/L Orthophosphate 80-120 20 75-125 20 N/A 5 µg/L Cadmium 85-115 20 75-125 20 N/A 10 µg/L BNA 40-150 50 40-150 40 10-150** 5 µg/L Organochlorine Pesticides (ECD) 30-150 50 30-150 50 30-150 10 µg/L
pH*** ±0.1 pH units
±0.05 pH units N/A N/A N/A N/A
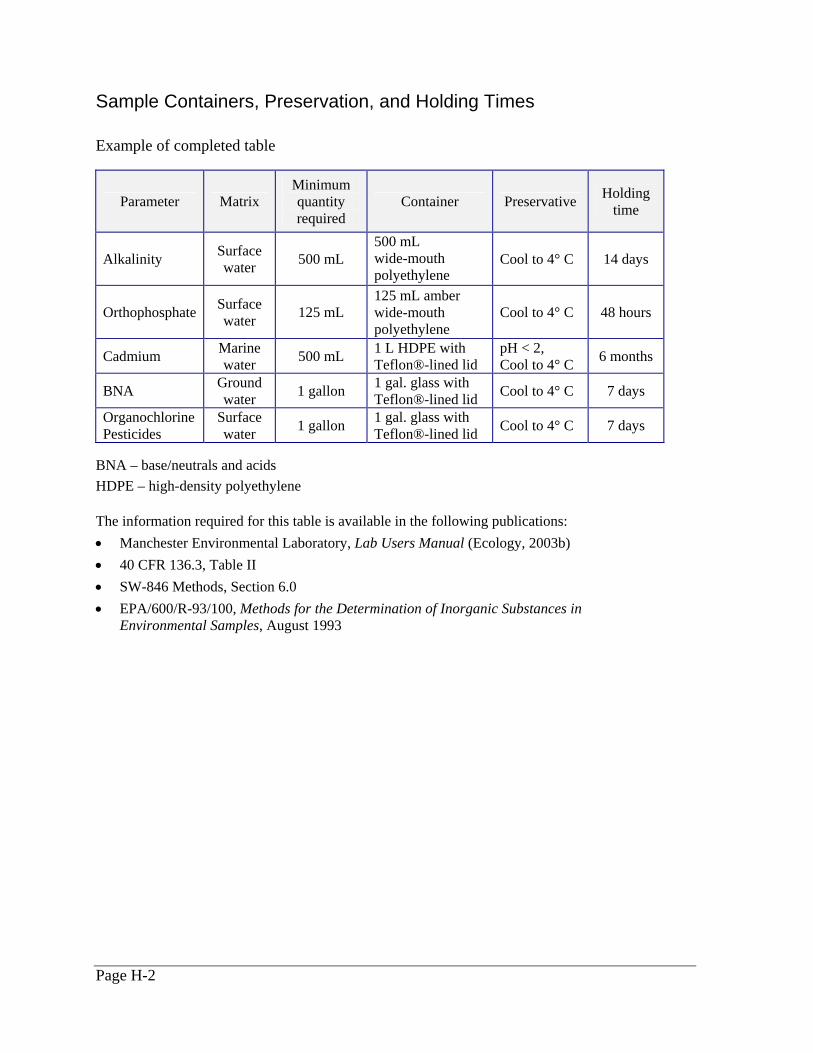
Page H-2
Sample Containers, Preservation, and Holding Times Example of completed table
Parameter Matrix Minimum quantity required
Container Preservative Holding time
Alkalinity Surface water 500 mL
500 mL wide-mouth polyethylene
Cool to 4° C 14 days
Orthophosphate Surface water 125 mL
125 mL amber wide-mouth polyethylene
Cool to 4° C 48 hours
Cadmium Marine water 500 mL 1 L HDPE with
Teflon®-lined lid pH < 2, Cool to 4° C 6 months
BNA Ground water 1 gallon 1 gal. glass with
Teflon®-lined lid Cool to 4° C 7 days
Organochlorine Pesticides
Surface water 1 gallon 1 gal. glass with
Teflon®-lined lid Cool to 4° C 7 days
BNA – base/neutrals and acids HDPE – high-density polyethylene The information required for this table is available in the following publications: • Manchester Environmental Laboratory, Lab Users Manual (Ecology, 2003b) • 40 CFR 136.3, Table II • SW-846 Methods, Section 6.0 • EPA/600/R-93/100, Methods for the Determination of Inorganic Substances in
Environmental Samples, August 1993
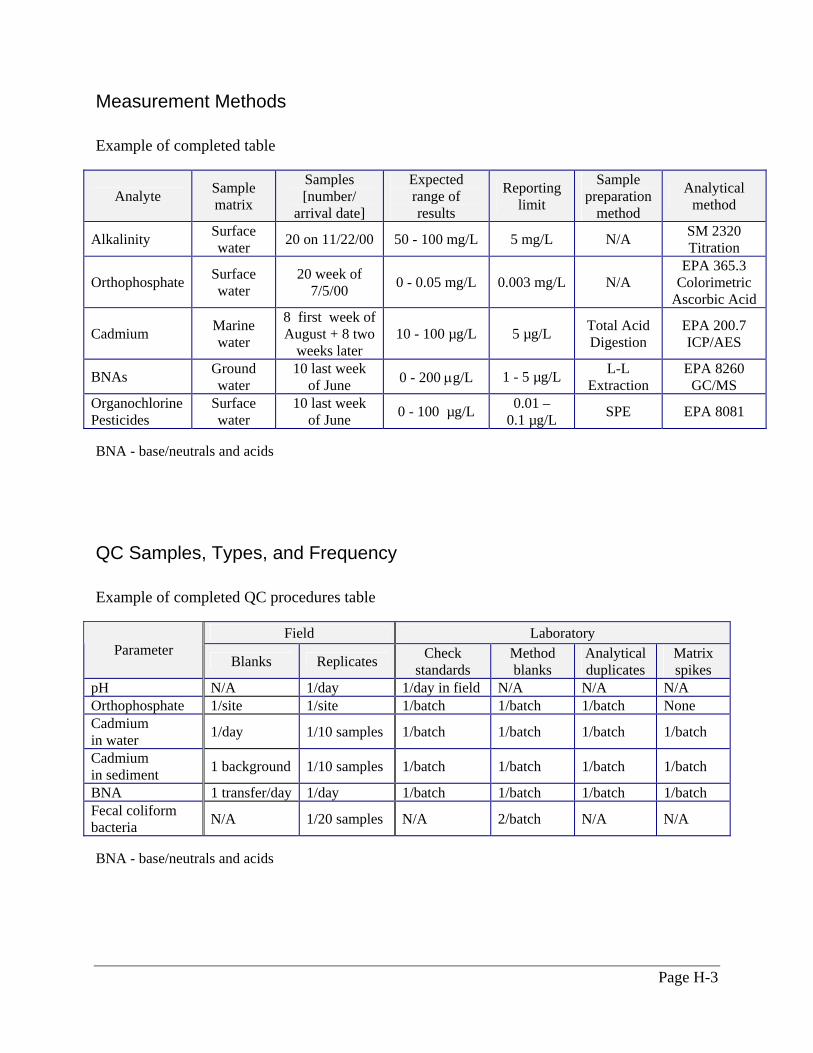
Page H-3
Measurement Methods Example of completed table
Analyte Sample matrix
Samples [number/
arrival date]
Expected range of results
Reporting limit
Sample preparation
method
Analytical method
Alkalinity Surface water 20 on 11/22/00 50 - 100 mg/L 5 mg/L N/A SM 2320
Titration
Orthophosphate Surface water
20 week of 7/5/00 0 - 0.05 mg/L 0.003 mg/L N/A
EPA 365.3 Colorimetric
Ascorbic Acid
Cadmium Marine water
8 first week of August + 8 two
weeks later 10 - 100 µg/L 5 µg/L Total Acid
Digestion EPA 200.7 ICP/AES
BNAs Ground water
10 last week of June 0 - 200 µg/L 1 - 5 µg/L L-L
Extraction EPA 8260
GC/MS Organochlorine Pesticides
Surface water
10 last week of June 0 - 100 µg/L 0.01 –
0.1 µg/L SPE EPA 8081
BNA - base/neutrals and acids QC Samples, Types, and Frequency Example of completed QC procedures table
Field Laboratory
Parameter Blanks Replicates Check
standards Method blanks
Analytical duplicates
Matrix spikes
pH N/A 1/day 1/day in field N/A N/A N/A Orthophosphate 1/site 1/site 1/batch 1/batch 1/batch None Cadmium in water 1/day 1/10 samples 1/batch 1/batch 1/batch 1/batch
Cadmium in sediment 1 background 1/10 samples 1/batch 1/batch 1/batch 1/batch
BNA 1 transfer/day 1/day 1/batch 1/batch 1/batch 1/batch Fecal coliform bacteria N/A 1/20 samples N/A 2/batch N/A N/A
BNA - base/neutrals and acids

Page H-4
This page is purposely left blank for duplex printing.
Page I-1
Appendix I
Calibration Calibration relates the response of the measurement system to the property of the sample being measured. It is an essential component of the measurement system itself, necessary before any quality control procedures can be performed. In general, calibration standards should be analyzed by the same procedure used to analyze the samples. Failure to do so can introduce bias in sample results. This principle is often not followed, and calibration bias is found in many methods, particularly for organics parameters. It shows up as low percent recoveries for check standards and surrogates.
In order to use the same calibration procedure to analyze samples of different matrices, the calibration procedures may be different from those used to analyze the samples. For most analytical procedures, calibration is required each day, shift, or sample batch. This is called within-batch calibration. For within-batch calibration, a blank and four standards are recommended for most systems. Some measurement systems (e.g., UV-VIS Spectrophotometers) are sufficiently stable that a calibration curve can be used for a long period of time. This is called fixed calibration. It is recommended that fixed calibrations be based on a blank and at least seven standards. The fixed calibration is not repeated until the results for the check standards indicate the need to do so. Most measurement systems are calibrated with external standards. The response of one or more standards is recorded and used to evaluate the response of the samples. Internal standards are used in some analytical methods such as gas chromatography/mass spectrometry (GC/MS). One or more internal standards are added to each sample or sample extract. In GC-MS the internal standards are isotopically-labeled compounds. Calibration and sample quantification are based on the ratio of the response of the compound of interest to that of the associated internal standard. The Method of Standard Additions (MSA) is used in some methods, such as metals analysis by Graphite Furnace Atomic Absorption Spectroscopy (GFAA) to correct for bias due to interference. The interference effects must be proportional to the concentration of the target analyte for MSA to provide accurate results. Standards at several concentrations are added to aliquots of the sample, and the resulting calibration curve is used for quantitation. Finally, sample responses must fall within the range of the calibration curve. This is why it is important to provide the lab with any available information on the expected levels of contaminants in your samples.

Page I-2
This page is purposely left blank for duplex printing.
Page J-1
Appendix J
Web Sites
Washington State Department of Ecology http://www.ecy.wa.gov
Environmental Assessment Program Publications http://www.ecy.wa.gov/programs/eap/quality.html
List of Accredited Laboratories, non-Drinking Water http://www.ecy.wa.gov/programs/eap/quality.html
List of Accredited Laboratories, Drinking Water http://www.ecy.wa.gov/programs/eap/quality.htm
Manchester Lab Methods http://www.ecy.wa.gov/programs/eap/quality.htm
Manchester Lab Users Manual
Guidelines for Technical Document Review*
http://aww.ecology/programs/eap/Policies/04-01%20Policy-Tech%20Guidance.pdf
*Available only to Ecology staff on SharePoint.
American Society for Testing and Materials (ASTM) http://www.astm.org
Federal Remediation Technologies Roundtable http://www.frtr.gov
Field Sampling and Analytical Technologies Matrix http://www.frtr.gov/site
Hanford Site http://www.ecy.wa.gov/programs/nwp
Data Quality Objectives
National Institute of Standards and Technology (NIST) http://ts.nist.gov
Standard Reference Materials (SRMs) http://ts.nist.gov/ts/htdocs/230/232/232.htm
Page J-2
Pacific Northwest Laboratory (Battelle) http://www.pnl.gov
Statistics
Data Quality Objectives
Visual Sample Plan
Puget Sound Action Team http://www.psat.wa.gov
PSEP Protocols
Synectics
Analytical Methods and other Technical Documents for Environmental Professionals http://synectics.net/resources
U.S. Environmental Protection Agency http://www.epa.gov/
Office of Environmental Information http://www.epa.gov/oei
Quality Staff http://www.epa.gov/quality/
Quality System Documents http://www.epa.gov/quality/qa_docs.html
Index to EPA Test Methods http://www.epa.gov/epa home/index (Includes links to sources of EPA methods)
Volunteer Stream Monitoring: A Methods Manual http://www.epa.gov/owow/monitoring/volunteer/stream
The Triad Approach http://www.epa.gov/tio/triad/index.htm
Biological Assessment of Streams and Rivers
Dynamic Field Activities http://www.epa.gov/superfund/programs/dfa/decsupp.htm
Systematic Planning http://www.epa.gov/superfund/programs/dfa/systplan.htm
Field Analytical Methods http://www.epa.gov/superfund/programs/dfa/fldmeth.htm
Decision Support Software http://www.epa.gov/superfund/programs/dfa/decsupp.htm
General instructions • Follow instructions in brown font then delete the brown text.• Complete areas highlighted in yellow.• If this is not an Ecology publication, change logo above.
DRAFT – (Today’s date)
Quality Assurance Project Plan
Title Type of ProjectExamples of “Type of Project” can be found in Sections 3.3 and 3.4
Insert photograph, if desired
Month Year Publication No. xx-03-1xx
Version 1.0, Revision date: 10-7-16
Appendix K -- added December 2016
Publication Information (If not an Ecology publication, modify as needed.) Each study conducted by the Washington State Department of Ecology (Ecology) must have an approved Quality Assurance Project Plan (QAPP). The plan describes the objectives of the study and the procedures to be followed to achieve those objectives. After completing the study, Ecology will post the final report of the study to the Internet. This Quality Assurance Project Plan is available on Ecology’s website at https://fortress.wa.gov/ecy/publications/SummaryPages/xx031xx.html (The QAPP publications coordinator will complete.) Data for this project will be available on Ecology’s Environmental Information Management (EIM) website: www.ecy.wa.gov/eim/index.htm. Search on Study ID xxxx. To create an EIM study, see http://www.ecy.wa.gov/eim/helpDocs/EIMHelp_EAP_HowToEnterEIMStudies.pdf or contact an EIM Data Coordinator for help. Ecology’s Activity Tracker Code for this study is xx-xxx. (Add before distributing draft QAPP.) For Water Quality Impairment Studies, insert: Federal Clean Water Act 1996 303(d) Listings Addressed in this Study. See Section 3.3.
Author and Contact Information (If not an Ecology publication, modify as needed.) Author names (List authors and co-authors appearing on the signature page – page 1.) P.O. Box 47600 Environmental Assessment Program Washington State Department of Ecology Olympia, WA 98504-7710 This plan was prepared by a licensed hydrogeologist. A signed and stamped copy of the report is available upon request. (Delete if no authors are hydrogeologists) Communications Consultant: phone 360-407-6764.
Washington State Department of Ecology – www.ecy.wa.gov o Headquarters, Lacey 360-407-6000 o Northwest Regional Office, Bellevue 425-649-7000 o Southwest Regional Office, Lacey 360-407-6300 o Central Regional Office, Union Gap 509-575-2490 o Eastern Regional Office, Spokane 509-329-3400 Cover photo: (Give location of photo and name of photographer.) xx
Any use of product or firm names in this publication is for descriptive purposes only and does not imply endorsement by the author or the Department of Ecology.

Accommodation Requests: To request ADA accommodation including materials in a format for the visually impaired, call Ecology at 360-407-6834. Persons with impaired hearing may call Washington Relay Service at 711. Persons with speech disability may call TTY at 877-833-6341.
More instructions for authors
• Include all 16 numbered sections. Where appropriate, write “Not applicable” and explain why.
• Use up and down arrow keys to move between numbered headings. Do not hit Enter after numbered headings because this can corrupt the outline format.
• Update the Table of Contents by clicking on any edge and pressing F9.
• Do not add the DRAFT watermark. The word “DRAFT” already appears on the cover and in the footer.
• Follow Plain Talk principles, required for all Ecology publications and highly recommended for non-Ecology publications. These are also highly recommended for other documents prepared and/or approved by Ecology, even though these won’t be Ecology publications:
• Limit paragraphs to 10 lines or less. • Avoid using long sentences. • Add sub-headings to sections of text longer than one page. • Use acronyms only as necessary and if defined. • Use active voice as much as possible, especially in the Abstract and Background.
Directions for the Title Page (next page) The format and content of the next page is intended for Ecology publications but can be adapted for use by external parties (e.g., grantees, principal investigators). The Title Page lists names of each party responsible for the project. These parties must signify approval of the final QAPP by signing and dating this page. QAPPs prepared for some programs may be approved by each party, with electronic approval to Ecology and this record retained by Ecology. Approval of the QAPP, or a separate Approval to Begin Work form, must occur before measuring environmental parameters in the field, collecting and analyzing environmental samples, analyzing existing environmental data, or modeling environmental conditions.
QAPP: Title (can be abbreviated) - DRAFT - Page 1 – Month Year
Template Version 1.0, 10/07/2016
Quality Assurance Project Plan
Title
Type of Project Copy both from cover page
Month Year
Approved by: (If not an Ecology publication, modify as needed) Signature: Date: Client’s Name, Client, xx Program, xx Regional Office Signature: Date: Name, Client’s Unit Supervisor, xx Program, xx Regional Office Signature: Date: Name, Client’s Section Manager, xx Program, xx Regional Office Signature: Date: Name, Author / Project Manager, EAP Signature: Date: Name, Author / Principal Investigator, EAP Signature: Date: Name, Author’s Unit Supervisor, EAP Signature: Date: Name, Author’s Section Manager, EAP Signature: (If same as author’s section manager, delete this row.) Date: Name, Section Manager for Project Study Area, EAP Signature: Date: Joel Bird, Director, Manchester Environmental Laboratory Signature: Date: Bill Kammin, Ecology Quality Assurance Officer
Signatures are not available on the Internet version. EAP: Environmental Assessment Program
QAPP: Title (can be abbreviated) - DRAFT - Page 2 – Month Year
Template Version 1.0, 10/07/2016
1.0 Table of Contents Page
2.0 Abstract ....................................................................................................................5
3.0 Background ..............................................................................................................5 3.1 Introduction and problem statement ............................................................5 3.2 Study area and surroundings ........................................................................5
3.2.1 History of study area .......................................................................5 3.2.2 Summary of previous studies and existing data ..............................5 3.2.3 Parameters of interest and potential sources ...................................5 3.2.4 Regulatory criteria or standards ......................................................6
3.3 Water quality impairment studies ................................................................6 3.4 Effectiveness monitoring studies .................................................................6
4.0 Project Description...................................................................................................7 4.1 Project goals .................................................................................................7 4.2 Project objectives .........................................................................................7 4.3 Information needed and sources ..................................................................7 4.4 Tasks required ..............................................................................................7 4.5 Systematic planning process used ................................................................8
5.0 Organization and Schedule ......................................................................................9 5.1 Key individuals and their responsibilities ....................................................9 5.2 Special training and certifications ..............................................................10 5.3 Organization chart ......................................................................................10 5.4 Proposed project schedule ..........................................................................10 5.5 Budget and funding ....................................................................................11
6.0 Quality Objectives .................................................................................................12 6.1 Data quality objectives ..............................................................................12 6.2 Measurement quality objectives ................................................................12
6.2.1 Targets for precision, bias, and sensitivity ....................................12 6.2.2 Targets for comparability, representativeness, and completeness 14
6.3 Acceptance criteria for quality of existing data .........................................14 6.4 Model quality objectives ............................................................................14
7.0 Study Design ..........................................................................................................16 7.1 Study boundaries ........................................................................................16 7.2 Field data collection ...................................................................................16
7.2.1 Sampling locations and frequency .................................................16 7.2.2 Field parameters and laboratory analytes to be measured..............16
7.3 Modeling and analysis design ....................................................................17 7.3.1 Analytical framework .....................................................................17 7.3.2 Model setup and data needs ...........................................................17
7.4 Assumptions in relation to objectives and study area ................................17 7.5 Possible challenges and contingencies .......................................................17
7.5.1 Logistical problems ...........................................................................18 7.5.2 Practical constraints ..........................................................................18 7.5.3 Schedule limitations ..........................................................................18
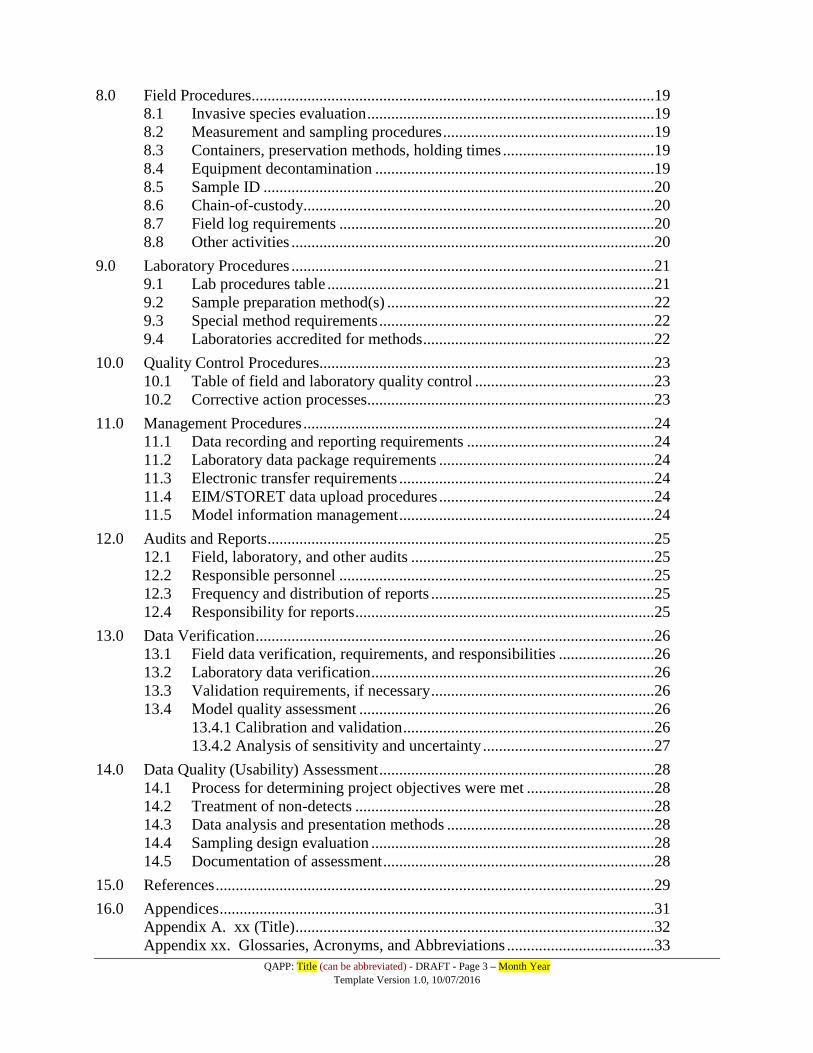
QAPP: Title (can be abbreviated) - DRAFT - Page 3 – Month Year
Template Version 1.0, 10/07/2016
8.0 Field Procedures.....................................................................................................19 8.1 Invasive species evaluation ........................................................................19 8.2 Measurement and sampling procedures .....................................................19 8.3 Containers, preservation methods, holding times ......................................19 8.4 Equipment decontamination ......................................................................19 8.5 Sample ID ..................................................................................................20 8.6 Chain-of-custody........................................................................................20 8.7 Field log requirements ...............................................................................20 8.8 Other activities ...........................................................................................20
9.0 Laboratory Procedures ...........................................................................................21 9.1 Lab procedures table ..................................................................................21 9.2 Sample preparation method(s) ...................................................................22 9.3 Special method requirements .....................................................................22 9.4 Laboratories accredited for methods ..........................................................22
10.0 Quality Control Procedures....................................................................................23 10.1 Table of field and laboratory quality control .............................................23 10.2 Corrective action processes ........................................................................23
11.0 Management Procedures ........................................................................................24 11.1 Data recording and reporting requirements ...............................................24 11.2 Laboratory data package requirements ......................................................24 11.3 Electronic transfer requirements ................................................................24 11.4 EIM/STORET data upload procedures ......................................................24 11.5 Model information management ................................................................24
12.0 Audits and Reports .................................................................................................25 12.1 Field, laboratory, and other audits .............................................................25 12.2 Responsible personnel ...............................................................................25 12.3 Frequency and distribution of reports ........................................................25 12.4 Responsibility for reports ...........................................................................25
13.0 Data Verification ....................................................................................................26 13.1 Field data verification, requirements, and responsibilities ........................26 13.2 Laboratory data verification .......................................................................26 13.3 Validation requirements, if necessary ........................................................26 13.4 Model quality assessment ..........................................................................26
13.4.1 Calibration and validation ...............................................................26 13.4.2 Analysis of sensitivity and uncertainty ...........................................27
14.0 Data Quality (Usability) Assessment .....................................................................28 14.1 Process for determining project objectives were met ................................28 14.2 Treatment of non-detects ...........................................................................28 14.3 Data analysis and presentation methods ....................................................28 14.4 Sampling design evaluation .......................................................................28 14.5 Documentation of assessment ....................................................................28
15.0 References ..............................................................................................................29
16.0 Appendices .............................................................................................................31 Appendix A. xx (Title) ..........................................................................................32 Appendix xx. Glossaries, Acronyms, and Abbreviations .....................................33
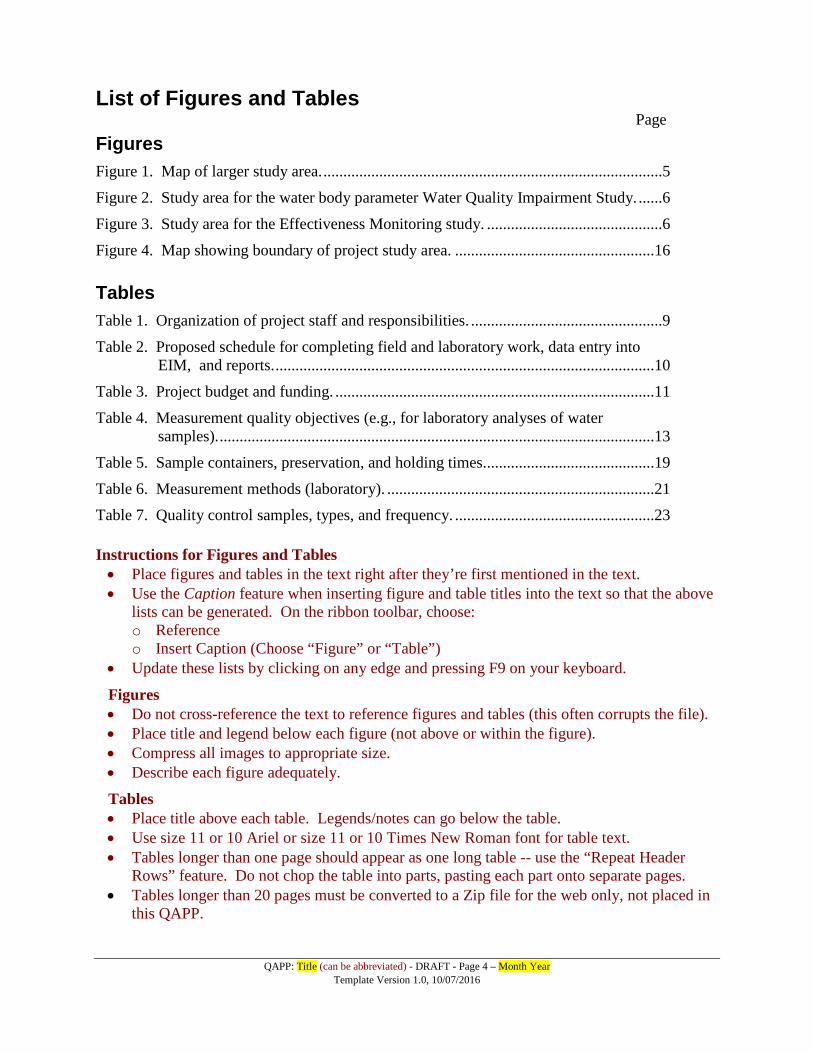
QAPP: Title (can be abbreviated) - DRAFT - Page 4 – Month Year
Template Version 1.0, 10/07/2016
List of Figures and Tables Page
Figures Figure 1. Map of larger study area. .....................................................................................5
Figure 2. Study area for the water body parameter Water Quality Impairment Study. ......6
Figure 3. Study area for the Effectiveness Monitoring study. ............................................6
Figure 4. Map showing boundary of project study area. ..................................................16 Tables Table 1. Organization of project staff and responsibilities. ................................................9
Table 2. Proposed schedule for completing field and laboratory work, data entry into EIM, and reports. ...............................................................................................10
Table 3. Project budget and funding. ................................................................................11
Table 4. Measurement quality objectives (e.g., for laboratory analyses of water samples). .............................................................................................................13
Table 5. Sample containers, preservation, and holding times. ..........................................19
Table 6. Measurement methods (laboratory). ...................................................................21
Table 7. Quality control samples, types, and frequency. ..................................................23 Instructions for Figures and Tables • Place figures and tables in the text right after they’re first mentioned in the text. • Use the Caption feature when inserting figure and table titles into the text so that the above
lists can be generated. On the ribbon toolbar, choose: o Reference o Insert Caption (Choose “Figure” or “Table”)
• Update these lists by clicking on any edge and pressing F9 on your keyboard.
Figures • Do not cross-reference the text to reference figures and tables (this often corrupts the file). • Place title and legend below each figure (not above or within the figure). • Compress all images to appropriate size. • Describe each figure adequately.
Tables • Place title above each table. Legends/notes can go below the table. • Use size 11 or 10 Ariel or size 11 or 10 Times New Roman font for table text. • Tables longer than one page should appear as one long table -- use the “Repeat Header
Rows” feature. Do not chop the table into parts, pasting each part onto separate pages. • Tables longer than 20 pages must be converted to a Zip file for the web only, not placed in
this QAPP.
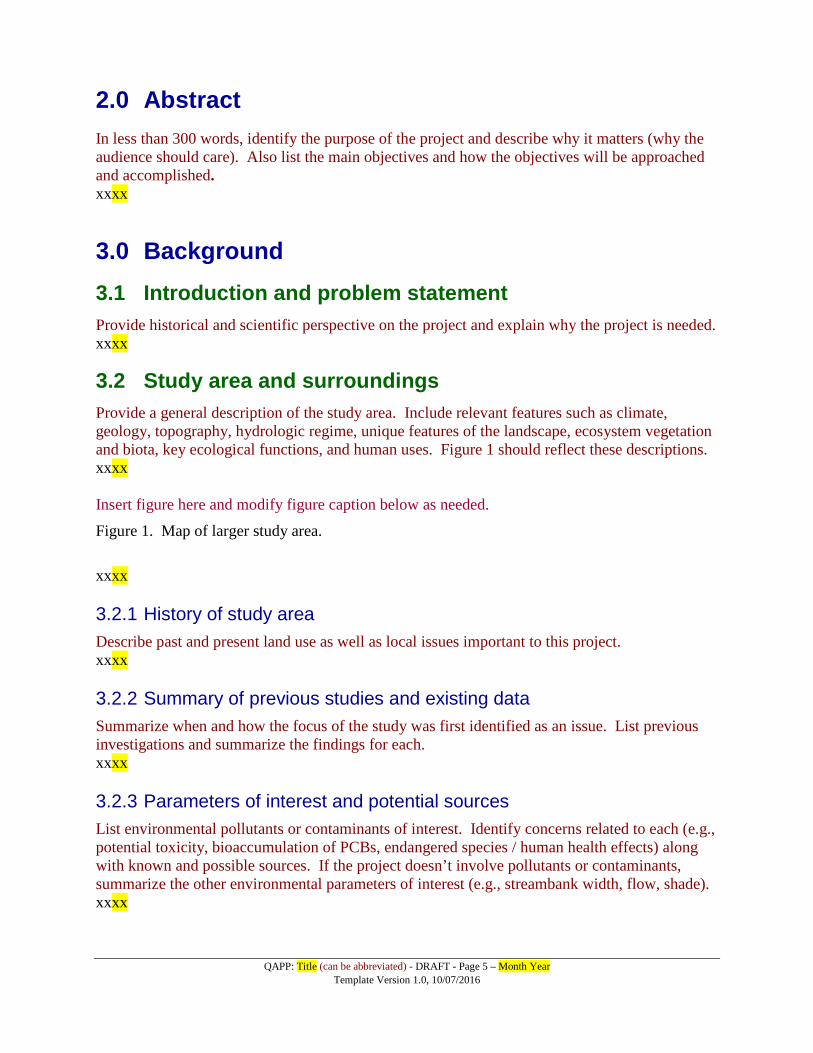
QAPP: Title (can be abbreviated) - DRAFT - Page 5 – Month Year
Template Version 1.0, 10/07/2016
2.0 Abstract In less than 300 words, identify the purpose of the project and describe why it matters (why the audience should care). Also list the main objectives and how the objectives will be approached and accomplished. xxxx
3.0 Background 3.1 Introduction and problem statement Provide historical and scientific perspective on the project and explain why the project is needed. xxxx
3.2 Study area and surroundings Provide a general description of the study area. Include relevant features such as climate, geology, topography, hydrologic regime, unique features of the landscape, ecosystem vegetation and biota, key ecological functions, and human uses. Figure 1 should reflect these descriptions. xxxx Insert figure here and modify figure caption below as needed.
Figure 1. Map of larger study area.
xxxx 3.2.1 History of study area Describe past and present land use as well as local issues important to this project. xxxx 3.2.2 Summary of previous studies and existing data Summarize when and how the focus of the study was first identified as an issue. List previous investigations and summarize the findings for each. xxxx 3.2.3 Parameters of interest and potential sources List environmental pollutants or contaminants of interest. Identify concerns related to each (e.g., potential toxicity, bioaccumulation of PCBs, endangered species / human health effects) along with known and possible sources. If the project doesn’t involve pollutants or contaminants, summarize the other environmental parameters of interest (e.g., streambank width, flow, shade). xxxx
QAPP: Title (can be abbreviated) - DRAFT - Page 6 – Month Year
Template Version 1.0, 10/07/2016
3.2.4 Regulatory criteria or standards If study objectives include assessing regulatory compliance status, identify all applicable governing regulations, list the relevant standards or criteria, and define how compliance will be determined. Assessing compliance status may indicate a need to set decision quality criteria for the data to be obtained (see section 6.1). xxxx
3.3 Water quality impairment studies If this QAPP does not describe some type of WQ impairment study, delete this section. If this is a WQ impairment study, import relevant boilerplate language from an active web link. Refer readers to Figure 2 or insert another figure to help readers visualize the study area. Insert figure here and modify caption below as needed. Figure 2. Study area for the water body parameter Water Quality Impairment Study. xxxx
3.4 Effectiveness monitoring studies If this is not an Effectiveness Monitoring (EM) study, delete this section. If this is an EM study, insert Effectiveness Monitoring Standard Language. Refer readers to Figure 3 or insert another figure to help readers visualize the study area. Insert figure here and modify caption below as needed. Figure 3. Study area for the Effectiveness Monitoring study. xxxx
QAPP: Title (can be abbreviated) - DRAFT - Page 7 – Month Year
Template Version 1.0, 10/07/2016
4.0 Project Description Tell the “story” of the project. Define the problem and summarize the anticipated study outcomes. Address the following five plan elements. xxxx
4.1 Project goals State the major reasons for conducting the project. Examples include: • To identify where fecal coliform or nutrient pollution is greatest in a given watershed • To characterize the level of toxic contaminants in a water body • To determine if annual discharge from Smith Creek has increased due to changing land use • To bring a water body into compliance with water quality standards by using a model and
historic data to predict the magnitude of pollution sources and the effects of source reduction xxxx
4.2 Project objectives Describe specific activities you want to accomplish. Examples include: • To collect ## water and ## sediment samples from a specific area of Puget Sound • To analyze PCBs in ## tissue samples of freshwater fish collected from Smith Creek • To analyze historic precipitation and stream-gage data to establish a flow-rating curve • To simulate effects of new construction (e.g., roadway, stormwater retention pond) on stream
flows and water quality xxxx
4.3 Information needed and sources Summarize the types and sources of existing data to be assembled, and all new data to be collected, that will address project objectives. Projects that involve analysis of existing environmental information, including many GIS layers, should summarize the data needed. For environmental modeling projects, data need can be described in overview here, with details provided in Section 7.3. xxxx
4.4 Tasks required List tasks, the specific activities planned to address each objective or obtain the needed information. For example, if one objective is to measure summer dissolved oxygen in Smith Creek, then a corresponding task might be to deploy continuous DO monitoring instrumentation at one site in Reach X and collect weekly grab samples from multiple depths at the same location. xxxx
QAPP: Title (can be abbreviated) - DRAFT - Page 8 – Month Year
Template Version 1.0, 10/07/2016
4.5 Systematic planning process used Preparing the QAPP is adequate systematic planning for most projects. However, for very complex or specialized projects, consider including description of a formalized systematic planning process. xxxx
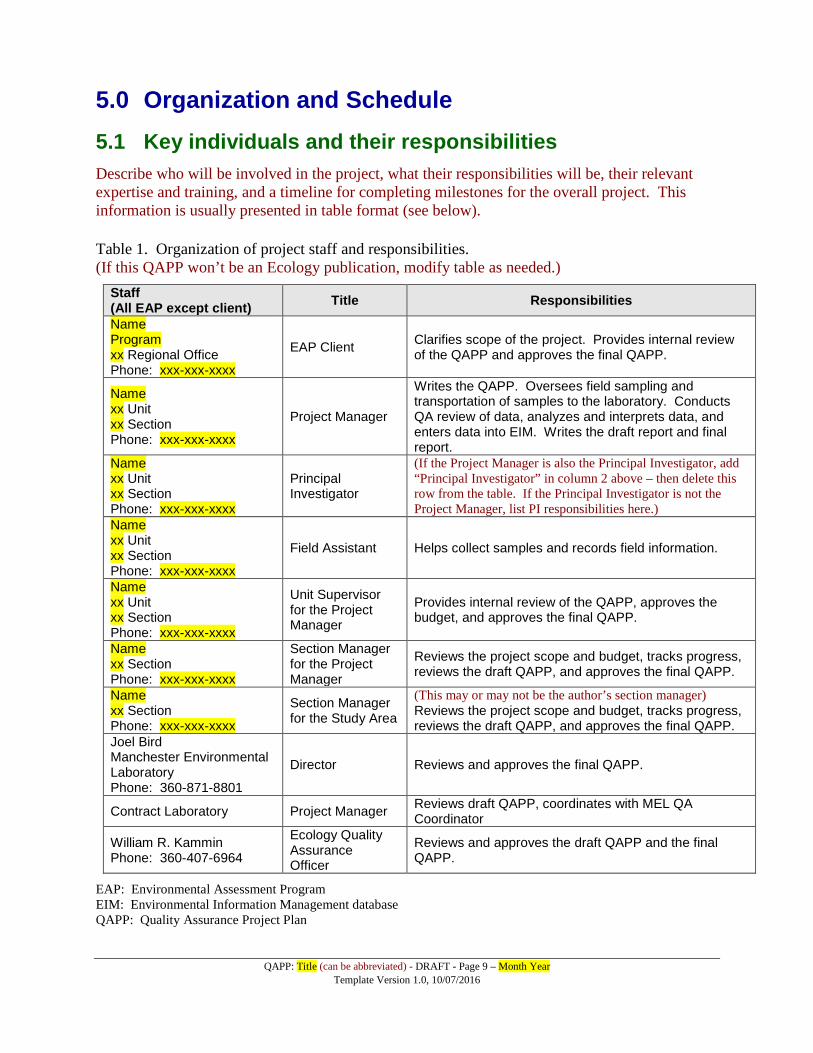
QAPP: Title (can be abbreviated) - DRAFT - Page 9 – Month Year
Template Version 1.0, 10/07/2016
5.0 Organization and Schedule 5.1 Key individuals and their responsibilities Describe who will be involved in the project, what their responsibilities will be, their relevant expertise and training, and a timeline for completing milestones for the overall project. This information is usually presented in table format (see below).
Table 1. Organization of project staff and responsibilities. (If this QAPP won’t be an Ecology publication, modify table as needed.)
Staff (All EAP except client) Title Responsibilities
Name Program xx Regional Office Phone: xxx-xxx-xxxx
EAP Client Clarifies scope of the project. Provides internal review of the QAPP and approves the final QAPP.
Name xx Unit xx Section Phone: xxx-xxx-xxxx
Project Manager
Writes the QAPP. Oversees field sampling and transportation of samples to the laboratory. Conducts QA review of data, analyzes and interprets data, and enters data into EIM. Writes the draft report and final report.
Name xx Unit xx Section Phone: xxx-xxx-xxxx
Principal Investigator
(If the Project Manager is also the Principal Investigator, add “Principal Investigator” in column 2 above – then delete this row from the table. If the Principal Investigator is not the Project Manager, list PI responsibilities here.)
Name xx Unit xx Section Phone: xxx-xxx-xxxx
Field Assistant Helps collect samples and records field information.
Name xx Unit xx Section Phone: xxx-xxx-xxxx
Unit Supervisor for the Project Manager
Provides internal review of the QAPP, approves the budget, and approves the final QAPP.
Name xx Section Phone: xxx-xxx-xxxx
Section Manager for the Project Manager
Reviews the project scope and budget, tracks progress, reviews the draft QAPP, and approves the final QAPP.
Name xx Section Phone: xxx-xxx-xxxx
Section Manager for the Study Area
(This may or may not be the author’s section manager) Reviews the project scope and budget, tracks progress, reviews the draft QAPP, and approves the final QAPP.
Joel Bird Manchester Environmental Laboratory Phone: 360-871-8801
Director Reviews and approves the final QAPP.
Contract Laboratory Project Manager Reviews draft QAPP, coordinates with MEL QA Coordinator
William R. Kammin Phone: 360-407-6964
Ecology Quality Assurance Officer
Reviews and approves the draft QAPP and the final QAPP.
EAP: Environmental Assessment Program EIM: Environmental Information Management database QAPP: Quality Assurance Project Plan
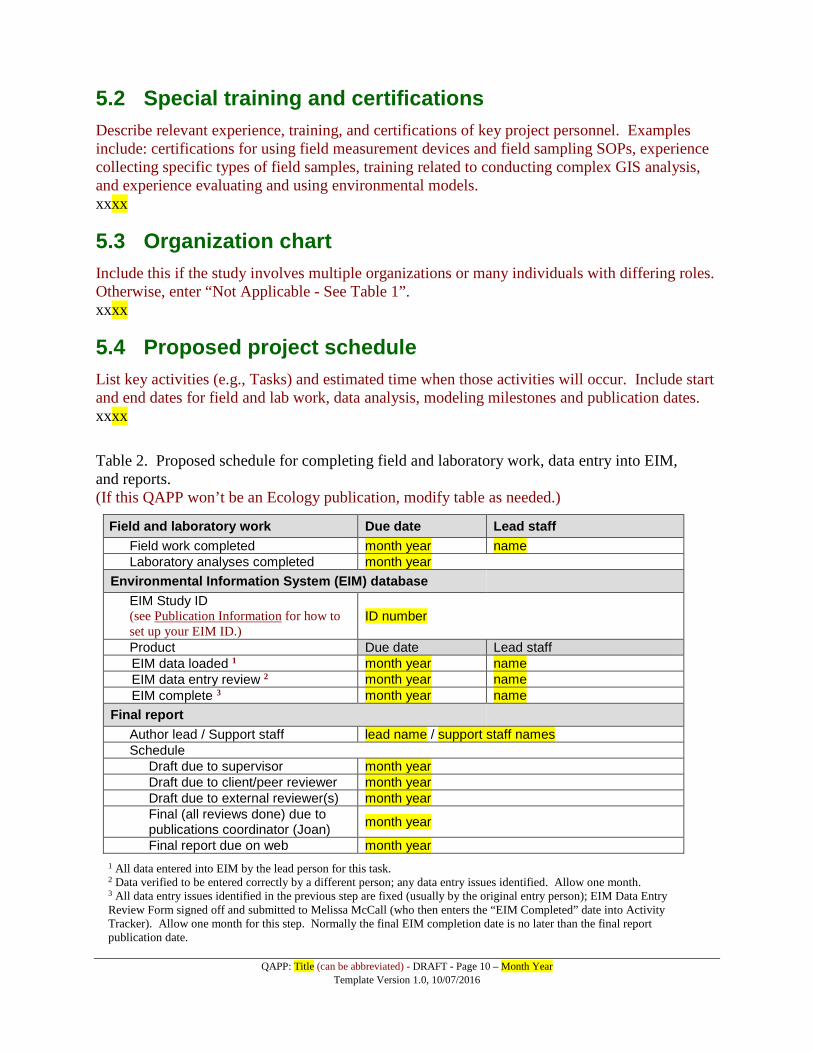
QAPP: Title (can be abbreviated) - DRAFT - Page 10 – Month Year
Template Version 1.0, 10/07/2016
5.2 Special training and certifications Describe relevant experience, training, and certifications of key project personnel. Examples include: certifications for using field measurement devices and field sampling SOPs, experience collecting specific types of field samples, training related to conducting complex GIS analysis, and experience evaluating and using environmental models. xxxx
5.3 Organization chart Include this if the study involves multiple organizations or many individuals with differing roles. Otherwise, enter “Not Applicable - See Table 1”. xxxx
5.4 Proposed project schedule List key activities (e.g., Tasks) and estimated time when those activities will occur. Include start and end dates for field and lab work, data analysis, modeling milestones and publication dates. xxxx
Table 2. Proposed schedule for completing field and laboratory work, data entry into EIM, and reports. (If this QAPP won’t be an Ecology publication, modify table as needed.)
Field and laboratory work Due date Lead staff Field work completed month year name Laboratory analyses completed month year
Environmental Information System (EIM) database EIM Study ID (see Publication Information for how to set up your EIM ID.)
ID number
Product Due date Lead staff EIM data loaded 1 month year name EIM data entry review 2 month year name EIM complete 3 month year name
Final report Author lead / Support staff lead name / support staff names Schedule
Draft due to supervisor month year Draft due to client/peer reviewer month year Draft due to external reviewer(s) month year Final (all reviews done) due to publications coordinator (Joan) month year
Final report due on web month year 1 All data entered into EIM by the lead person for this task. 2 Data verified to be entered correctly by a different person; any data entry issues identified. Allow one month. 3 All data entry issues identified in the previous step are fixed (usually by the original entry person); EIM Data Entry Review Form signed off and submitted to Melissa McCall (who then enters the “EIM Completed” date into Activity Tracker). Allow one month for this step. Normally the final EIM completion date is no later than the final report publication date.
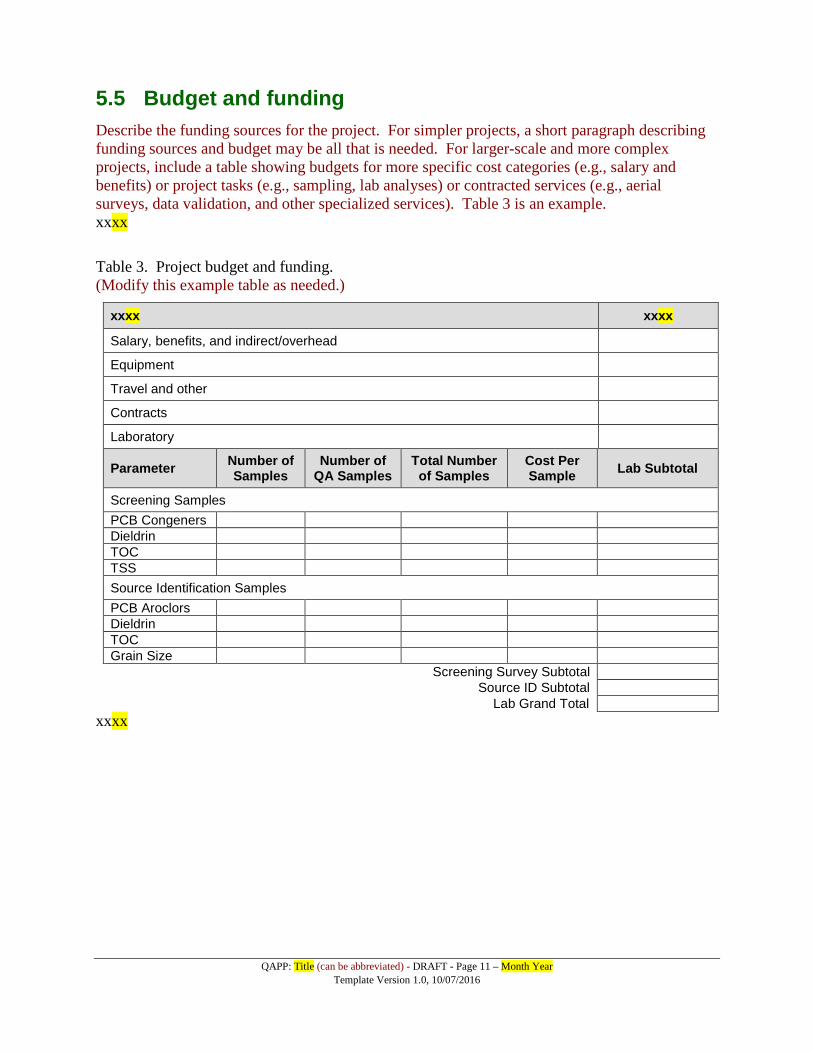
QAPP: Title (can be abbreviated) - DRAFT - Page 11 – Month Year
Template Version 1.0, 10/07/2016
5.5 Budget and funding Describe the funding sources for the project. For simpler projects, a short paragraph describing funding sources and budget may be all that is needed. For larger-scale and more complex projects, include a table showing budgets for more specific cost categories (e.g., salary and benefits) or project tasks (e.g., sampling, lab analyses) or contracted services (e.g., aerial surveys, data validation, and other specialized services). Table 3 is an example. xxxx
Table 3. Project budget and funding. (Modify this example table as needed.)
xxxx xxxx
Salary, benefits, and indirect/overhead
Equipment
Travel and other
Contracts
Laboratory
Parameter Number of Samples
Number of QA Samples
Total Number of Samples
Cost Per Sample Lab Subtotal
Screening Samples PCB Congeners Dieldrin TOC TSS Source Identification Samples PCB Aroclors Dieldrin TOC Grain Size
Screening Survey Subtotal Source ID Subtotal Lab Grand Total
xxxx
QAPP: Title (can be abbreviated) - DRAFT - Page 12 – Month Year
Template Version 1.0, 10/07/2016
6.0 Quality Objectives 6.1 Data quality objectives 1 EPA describes a seven-step Data Quality Objectives (DQO) process [EPA, 2006 (EPA QA/G-4, Publication EPA/240/B-06/001)]. Most of the steps are addressed by other sections of this QAPP template (e.g., defining the problem, identifying the type of data needed, describing the analytical approach, and designing data collection efforts). But the sixth step “establishes acceptable quantitative criteria on the quality and quantity of the data to be collected, relative to the ultimate use of the data. These criteria are known as performance or acceptance criteria, or DQOs.” Here is an example of the brief narrative that might appear in this section:
The main DQO for this project is to collect a minimum of 50 water samples representative of Smith Creek and have them analyzed, using standard methods, to obtain total copper concentration data that meet Measurement Quality Objectives that are described below and that are comparable to previous study results.
xxxx
6.2 Measurement quality objectives Identify measurement quality objectives (MQOs) for the data to be collected. MQOs usually take the form of data quality indicators: precision, bias, sensitivity, representativeness, comparability and completeness. Analytical method descriptions, standard operating procedures (SOPs), and participating laboratories can help fine-tune the target MQOs for these indicators. Projects not involving laboratory analyses, e.g., habitat assessments, will often still benefit from setting MQOs to help ensure that results can be used for their intended purpose. See Ecology QAPP Guidance for more detailed information. xxxx 6.2.1 Targets for precision, bias, and sensitivity For example:
The MQOs for project results, expressed in terms of acceptable precision, bias, and sensitivity, are described in this section and summarized in Table 4 below.
xxxx
1 DQO can also refer to Decision Quality Objectives. The need to identify Decision Quality Objectives during the planning phase of a project is less common. For projects that do lead to important decisions, DQOs are often expressed as tolerable limits on the probability or chance (risk) of the collected data leading to an erroneous decision. And for projects that intend to estimate present or future conditions, DQOs are often expressed in terms of acceptable uncertainty (e.g., width of an uncertainty band or interval) associated with a point estimate at a desired level of statistical confidence.
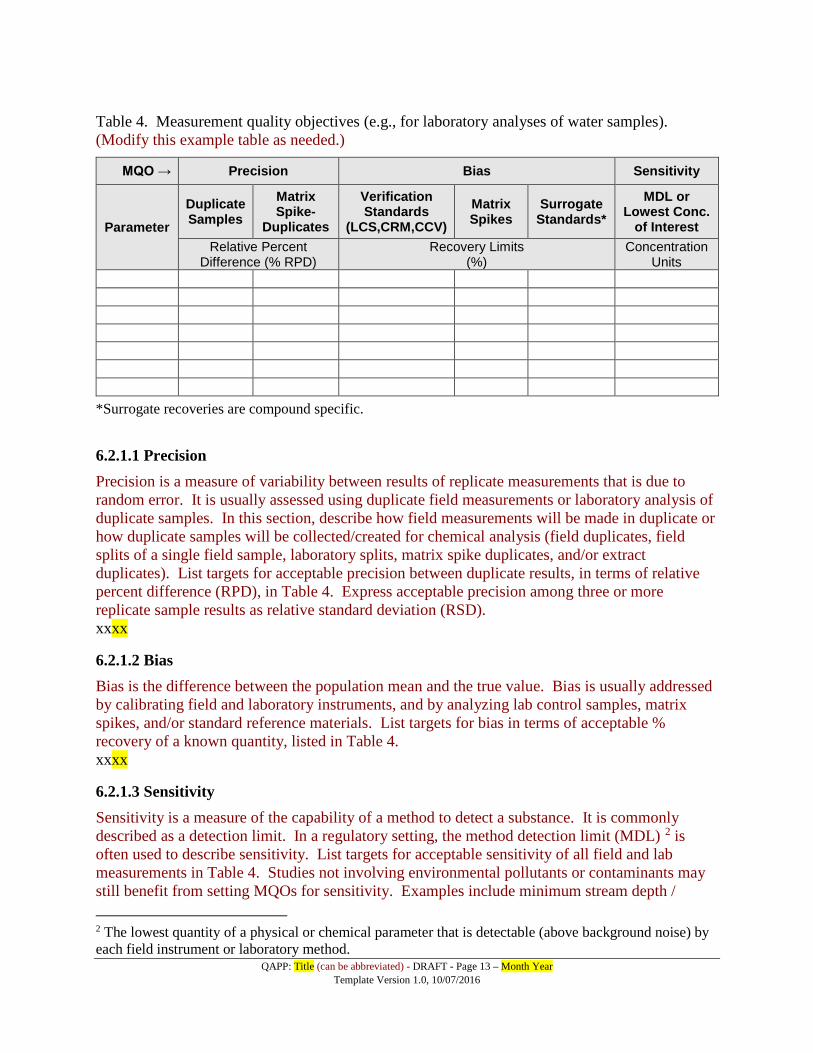
QAPP: Title (can be abbreviated) - DRAFT - Page 13 – Month Year
Template Version 1.0, 10/07/2016
Table 4. Measurement quality objectives (e.g., for laboratory analyses of water samples). (Modify this example table as needed.)
MQO → Precision Bias Sensitivity
Parameter
Duplicate Samples
Matrix Spike-
Duplicates
Verification Standards
(LCS,CRM,CCV) Matrix Spikes
Surrogate Standards*
MDL or Lowest Conc.
of Interest Relative Percent
Difference (% RPD) Recovery Limits
(%) Concentration
Units
*Surrogate recoveries are compound specific.
6.2.1.1 Precision Precision is a measure of variability between results of replicate measurements that is due to random error. It is usually assessed using duplicate field measurements or laboratory analysis of duplicate samples. In this section, describe how field measurements will be made in duplicate or how duplicate samples will be collected/created for chemical analysis (field duplicates, field splits of a single field sample, laboratory splits, matrix spike duplicates, and/or extract duplicates). List targets for acceptable precision between duplicate results, in terms of relative percent difference (RPD), in Table 4. Express acceptable precision among three or more replicate sample results as relative standard deviation (RSD). xxxx
6.2.1.2 Bias Bias is the difference between the population mean and the true value. Bias is usually addressed by calibrating field and laboratory instruments, and by analyzing lab control samples, matrix spikes, and/or standard reference materials. List targets for bias in terms of acceptable % recovery of a known quantity, listed in Table 4. xxxx
6.2.1.3 Sensitivity Sensitivity is a measure of the capability of a method to detect a substance. It is commonly described as a detection limit. In a regulatory setting, the method detection limit (MDL) 2 is often used to describe sensitivity. List targets for acceptable sensitivity of all field and lab measurements in Table 4. Studies not involving environmental pollutants or contaminants may still benefit from setting MQOs for sensitivity. Examples include minimum stream depth / 2 The lowest quantity of a physical or chemical parameter that is detectable (above background noise) by each field instrument or laboratory method.
QAPP: Title (can be abbreviated) - DRAFT - Page 14 – Month Year
Template Version 1.0, 10/07/2016
minimum measurable flow, minimum area of specific habitat definable using new aerial photographic survey images. xxxx 6.2.2 Targets for comparability, representativeness, and completeness
6.2.2.1 Comparability List the standardized operating procedures (SOPs) that will be followed for sampling, analysis, and data reduction and to ensure comparability between projects. Also, list standardized sampling techniques and methods to be used to ensure comparability. Project results may need to be comparable to those generated by other projects that took place in the same study area. The QAPP might need to provide detailed procedures for analyzing existing environmental data or for modeling environmental conditions that are comparable to other existing studies. xxxx
6.2.2.2 Representativeness Describe how environmental samples to be collected are representative of existing conditions. If they are not, the resulting data gathered will either be rejected or of limited use. Show how the sampling strategy and number of collected samples also contribute to representativeness. Show representativeness through consideration of factors such as seasonality, time of day, flow conditions, sampling location(s), and weather. Representativeness also influences the data used in environmental models. xxxx
6.2.2.3 Completeness Propose a percentage of observations, measurements, and samples (taken and analyzed acceptably) for your study to be a success. 95% is often used as a measure for this plan element. xxxx
6.3 Acceptance criteria for quality of existing data If known, describe the quality of existing data available for the study area. If not known, describe the criteria that will be used to assess quality and usability of the existing data, whether the project will also collect new environmental data, analyze the data (only), or use the data for modeling. It may be possible to cite a programmatic QAPP or other document that already contains this information. Identify data gaps and describe how the study may fill those gaps and improve the quality of available information. xxxx
6.4 Model quality objectives If the project does not involve environmental modeling, then Enter “NA”. Otherwise, describe the quality of modeling results desired to meet the objectives of the project. Quality objectives for modeling results may be a combination of quantitative and qualitative.
QAPP: Title (can be abbreviated) - DRAFT - Page 15 – Month Year
Template Version 1.0, 10/07/2016
Define the quantitative objectives needed for the project. Examples include target values for bias, error, goodness-of-fit, and other measures of uncertainty, that are comparable to ones achieved by similar modeling studies. For some projects, it may be critical to meet firm quantitative objectives. For other projects, quantitative objectives may be used as initial benchmarks in a broader evaluation of model quality. Ecology has summarized quantitative model quality results from various water quality modeling projects (Ecology, 2014). The process of evaluating whether these quality objectives are met, and the consequences of not meeting them, should be described in Section 13.1. Managers of modeling projects may also set qualitative or narrative quality objectives. Examples include: • Peak flows should match the timing and magnitude of those observed from 2010 to 2015. • Model outputs are not overly sensitive to uncertainty associated with input parameters or
values. Past modeling project plans also offer examples of narrative quality objectives. xxxx
QAPP: Title (can be abbreviated) - DRAFT - Page 16 – Month Year
Template Version 1.0, 10/07/2016
7.0 Study Design 7.1 Study boundaries Define the specific area of focus when the project involves measuring parameters in the field, collecting samples for analysis by a laboratory, or other field activities should. This might be something as simple as “WRIA 1” or a very complex area designated using a GPS coordinate system and GIS 3. Consider showing the study area in a figure that is more specific than what is presented in Figure 1a. Insert figure here and modify caption below as needed. Figure 4. Map showing boundary of project study area. or Refer to Figures 1 - 3, as appropriate. For projects involving analysis of historic data, GIS analysis, or modeling environmental conditions, descriptions of study design will be different. For these types of projects, describe study design including topics such as: how existing data will be chosen for analysis and the proposed statistical approach; how GIS data layers will be analyzed; the process for choosing the final model(s) from existing alternatives and examples of the model simulations that will be conducted. xxxx
7.2 Field data collection Show the proposed and perhaps alternate measurement and sampling locations. xxxx 7.2.1 Sampling locations and frequency Describe all sampling strategies chosen for the project and explain why they will be appropriate. Examples of sampling strategies include random, stratified random, subjective, before-after-control-impact (BACI), nested paired. List all target sampling locations and potential alternate locations as accurately as possible. If locations cannot be identified in advance of sampling, then describe the factors that will be used to choose locations when in the field. Also describe as accurately as possible how often and when samples will be collected, or how the timing of sample collection will be determined (e.g., within 4 hours of storm > 0.1” of precipitation). xxxx 7.2.2 Field parameters and laboratory analytes to be measured List all environmental parameters to be observed/counted, measured, or analyzed.
3 Water Resource Inventory Areas (WRIAs) for the study area can be found at:
WRIAs: www.ecy.wa.gov/services/gis/maps/state/ecyreg-a.pdf
QAPP: Title (can be abbreviated) - DRAFT - Page 17 – Month Year
Template Version 1.0, 10/07/2016
xxxx
7.3 Modeling and analysis design Enter “NA” if the project does not involve these activities. xxxx 7.3.1 Analytical framework Describe the conceptual framework of the model and the type of model needed. Examples include empirical vs. mechanistic, static vs. dynamic, simulation vs. optimization, deterministic vs. stochastic, and lumped vs. distributed. Project managers analyzing existing environmental data should describe the analytical tools they will use, such as GIS, statistics, and computational models, and how these tools support the project objectives. If developing a new model, describe key elements of its design. If the project will use a specific model or modeling software package that has already been chosen, briefly justify the choice. If an existing model will be used but has yet to be chosen, describe the criteria that will be used to choose from among the established alternatives. Describe in detail the hardware and software needed for the planned modeling. xxxx 7.3.2 Model setup and data needs Describe the temporal and geographic scale of the study. Include an initial estimate of the spatial and temporal resolution (geographic features that affect model reach/grid size and design of the data collection network; temporal features or needs affecting model output time-step) that supports project objectives at an appropriate level of certainty. Describe the level of model process complexity appropriate to meet project objectives. Identify, to the extent possible, the various simulations that will be run or the specific scenarios that will be tested using the model. Specify state variables required by the model framework that are significant and will require data. List the data and parameters needed as model inputs and the data needed for model quality assessment or refer to a previous section (Section 4.3 or 6.3). xxxx
7.4 Assumptions in relation to objectives and study area Discuss any assumptions that affect your study design. This is important for projects generating new environmental data, for projects analyzing existing data, and for environmental modeling. xxxx
7.5 Possible challenges and contingencies Ensure that the study design supports the objectives of the project. Assess the proposed design in light of any challenges the study location may present in terms of access, physical hazards, chemical hazards, and other environmental factors.
QAPP: Title (can be abbreviated) - DRAFT - Page 18 – Month Year
Template Version 1.0, 10/07/2016
xxxx 7.5.1 Logistical problems Describe potential problems associated with logistics. Examples might include: access to private property (uncertain access to safe sampling sites); timing field work for optimal tidal conditions; precipitation and high-flow/low-flow sampling issues (adequate flow and water depth, threshold defining storm event), and other seasonal considerations. Also describe contingencies or measures to be taken that may prevent or reduce the likelihood of such problems. xxxx 7.5.2 Practical constraints Describe issues such as availability of resources (human and budgetary), difficulties obtaining historic data for novel analyses, and access to hardware or software required to run preferred models. Also, summarize how investigators will prevent or minimize the impact of such problems. xxxx 7.5.3 Schedule limitations Describe how problems and constraints listed in the previous sections may impact the proposed study schedule. Include discussion of other things that may impact schedule, including the time required for QAPP review and approval and the preparedness of external parties involved in the project. xxxx
QAPP: Title (can be abbreviated) - DRAFT - Page 19 – Month Year
Template Version 1.0, 10/07/2016
8.0 Field Procedures 8.1 Invasive species evaluation Assess the possibility of invasive species contamination of both protective gear and sampling equipment, including boats, rafts, and other water-borne devices. Ecology’s SOP EAP070 addresses invasive species transport and contamination. This document is at Ecology QA Website. xxxx
8.2 Measurement and sampling procedures Standard Operating Procedures (SOPs) are required for field sampling and field analyses. Ecology’s QA Website contains over 80 SOPs that address specific sampling and field analytical techniques. Identify and reference SOPs that accurately reflect field, laboratory, and other procedural details of the project. Include relevant SOPs for projects that involve complex data analyses or modeling (to ensure repeatability of project outcomes). Develop a new SOP, if no existing one fits your particular situation. xxxx
8.3 Containers, preservation methods, holding times Refer to the example Table 5 and describe appropriate containers, preservation techniques, and holding times as per 40CFR 136. xxxx
Table 5. Sample containers, preservation, and holding times. (Modify this example table as needed)
Parameter Matrix Minimum Quantity Required Container Preservative Holding
Time
8.4 Equipment decontamination Explain your procedure for decontamination that may be necessary when sampling substances that contain high levels of contaminants, bacterial contamination, or organic materials that stick to the sampling devices. Refer to Ecology’s SOP EAP090, Decontamination of Sampling Equipment for Use in Collecting Toxic Chemical Samples. xxxx
QAPP: Title (can be abbreviated) - DRAFT - Page 20 – Month Year
Template Version 1.0, 10/07/2016
8.5 Sample ID Provide a specific protocol for establishing sample IDs. If such a protocol is lacking, adopt one (e.g., from an analytical laboratory) or develop and describe a new one. xxxx
8.6 Chain-of-custody Maintaining environmental samples under chain-of-custody is standard practice. If standard procedures and forms are not available, adopt them, for example, from an analytical laboratory or develop and describe new ones here. More details on chain-of-custody are available in the Ecology QAPP Guidance. xxxx
8.7 Field log requirements A field log is an important component of many projects. It is used to record irreplaceable information, such as: • Name and location of project • Field personnel • Sequence of events • Any changes or deviations from the QAPP • Environmental conditions • Date, time, location, ID, and description of each sample • Field instrument calibration procedures • Field measurement results • Identity of QC samples collected • Unusual circumstances that might affect interpretation of results Use field logs that are bound, waterproof notebooks with pre-numbered pages. Use permanent, waterproof ink for all entries. Make corrections with single line strikethroughs; initial and date corrections. Do not use correction fluid such as Wite-Out. Electronic field logs may be used if they demonstrate equivalent security to a waterproof, bound notebook. xxxx
8.8 Other activities These may include: • Briefings and trainings for field staff • Periodic maintenance for field instrumentation • Procedures and equipment for homogenizing non-aqueous matrices • Procedure for lab notification regarding sampling and other topics xxxx
QAPP: Title (can be abbreviated) - DRAFT - Page 21 – Month Year
Template Version 1.0, 10/07/2016
9.0 Laboratory Procedures 9.1 Lab procedures table Include Table 6 which contains the following information for each analysis to be performed: • Analyte or parameter name. The element, compound, physical property, chemical property,
or organism that is being analyzed or determined. Examples include temperature, pH, sodium, PCBs, or E. coli.
• Matrix. The type of substance being analyzed. Typical matrices include water, air, soil and sediment, hazardous waste, and tissues of biota.
• Number of samples. Use a table to list the number of samples, by matrix, that will be analyzed for each parameter.
• Expected range of results. List ranges derived based on results of previous studies, if available and relevant.
• Analytical method. List the analytical method that will be used for each analyte. Generally speaking, these must be EPA-approved methods.
• Sensitivity/Method Detection Limit (MDL). Identify the method that will be used to detect low levels of each analyte. Obtain MDL values from published methods or from the laboratory performing the analysis.
Information required for this table may be provided by the lab that will perform the analyses, and it is available in these publications: • 40 CFR 136.3, Table II • SW-846 Methods, Section 6.0 • EPA/600/R-93/100, Methods for the Determination of Inorganic Substances in
Environmental Samples, August, 1993
Table 6. Measurement methods (laboratory). (Modify this example table as needed)
Analyte Sample Matrix
Samples (Number/
Arrival Date)
Expected Range of Results
Detection or Reporting
Limit
Sample Prep
Method
Analytical (Instrumental)
Method
A similar table should be constructed for field testing that will occur in support of this project. xxxx
QAPP: Title (can be abbreviated) - DRAFT - Page 22 – Month Year
Template Version 1.0, 10/07/2016
9.2 Sample preparation method(s) It is rare to analyze samples without some form of preparation and extraction. List each preparation and extraction technique. It is especially important to provide details of any unusual or nonstandard technique. xxxx
9.3 Special method requirements Some analytical laboratories have special requirements. Record these in the QAPP to communicate them effectively to the laboratory. Typical causes for special method modifications include: analysis of very low or very high concentrations of analytes, analysis of analytes with high levels of interference, and use of non-standard methods. xxxx
9.4 Laboratories accredited for methods You must use an accredited laboratory to analyze your samples. That laboratory must also be accredited for the specific method that you are using for analysis. Ecology only accredits methods published by EPA, Standard Methods, or ASTM. This is an Ecology legal requirement, and exceptions for it are difficult to obtain. If your technical work involves the use of non-standard methods or analytes, a waiver process is available. Contact the Ecology Lab Accreditation Unit for more information. xxxx
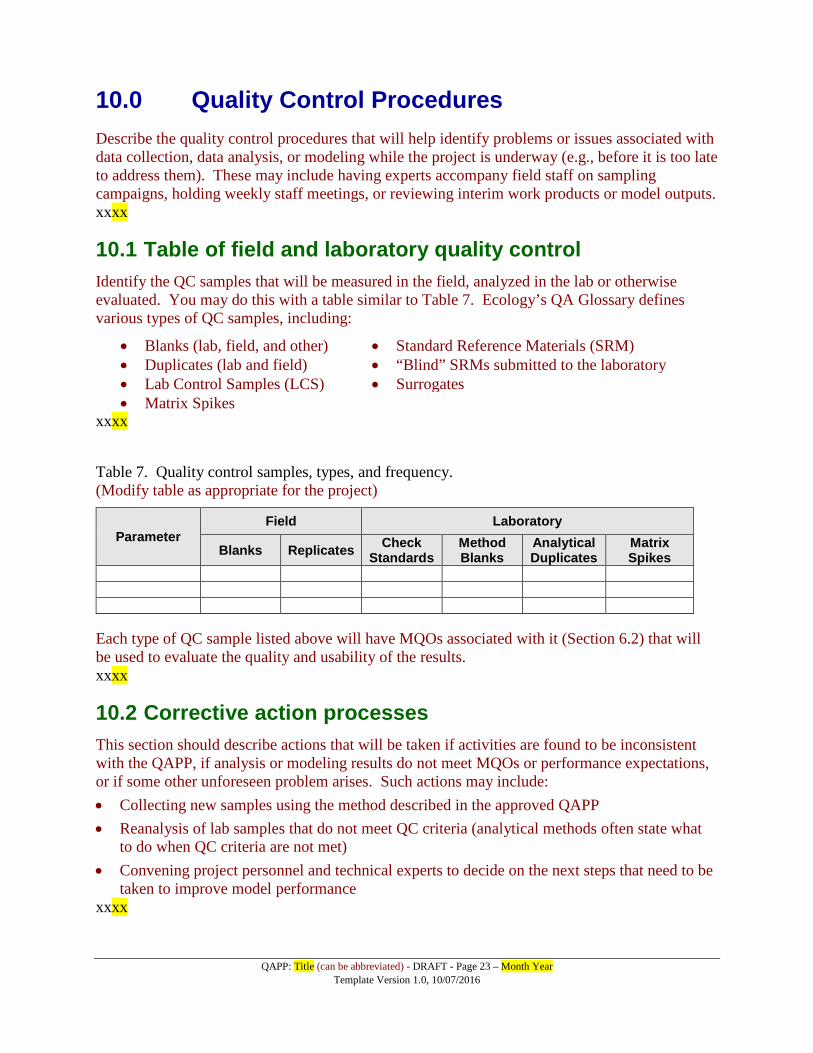
QAPP: Title (can be abbreviated) - DRAFT - Page 23 – Month Year
Template Version 1.0, 10/07/2016
10.0 Quality Control Procedures Describe the quality control procedures that will help identify problems or issues associated with data collection, data analysis, or modeling while the project is underway (e.g., before it is too late to address them). These may include having experts accompany field staff on sampling campaigns, holding weekly staff meetings, or reviewing interim work products or model outputs. xxxx
10.1 Table of field and laboratory quality control Identify the QC samples that will be measured in the field, analyzed in the lab or otherwise evaluated. You may do this with a table similar to Table 7. Ecology’s QA Glossary defines various types of QC samples, including:
• Blanks (lab, field, and other)
• Standard Reference Materials (SRM) • Duplicates (lab and field)
• “Blind” SRMs submitted to the laboratory • Lab Control Samples (LCS)
• Surrogates • Matrix Spikes
xxxx Table 7. Quality control samples, types, and frequency. (Modify table as appropriate for the project)
Parameter Field Laboratory
Blanks Replicates Check Standards
Method Blanks
Analytical Duplicates
Matrix Spikes
Each type of QC sample listed above will have MQOs associated with it (Section 6.2) that will be used to evaluate the quality and usability of the results. xxxx
10.2 Corrective action processes This section should describe actions that will be taken if activities are found to be inconsistent with the QAPP, if analysis or modeling results do not meet MQOs or performance expectations, or if some other unforeseen problem arises. Such actions may include: • Collecting new samples using the method described in the approved QAPP • Reanalysis of lab samples that do not meet QC criteria (analytical methods often state what
to do when QC criteria are not met) • Convening project personnel and technical experts to decide on the next steps that need to be
taken to improve model performance xxxx
QAPP: Title (can be abbreviated) - DRAFT - Page 24 – Month Year
Template Version 1.0, 10/07/2016
11.0 Management Procedures 11.1 Data recording and reporting requirements Describe field data that will be transferred to Ecology’s EIM database (sometimes EPA’s STORET or other acceptable database). Also describe procedures for recording lab results and transferring them to the same database. Summarize how data entry errors will be detected and corrected. xxxx
11.2 Laboratory data package requirements Describe how the analytical lab will provide results. Labs usually provide a cover narrative with attached detailed results presented in a standard package when work has been completed. Labs should be required to provide all relevant quality control data. xxxx
11.3 Electronic transfer requirements Require laboratories to submit data electronically, in a readily-usable format, to minimize data entry problems and facilitate data analysis. Most laboratories will comply, with the data at least available in Microsoft Excel and text formats. xxxx
11.4 EIM/STORET data upload procedures Projects funded by or submitting data to Ecology must submit the data formatted for entry into Ecology’s EIM data system. EPA-funded projects usually require data to be entered into that agency’s STORET data system. It may be possible to do this by transferring the data from EIM. xxxx
11.5 Model information management Describe how modeling information will be managed. This should include: the volume of input and output data expected; input and output data storage needs; version control and; mapping post-processed model outputs to the appropriate version of the model. Enter “NA” if this project does not involve modeling or analysis of existing data. xxxx
QAPP: Title (can be abbreviated) - DRAFT - Page 25 – Month Year
Template Version 1.0, 10/07/2016
12.0 Audits and Reports 12.1 Field, laboratory, and other audits Describe the number, frequency, type, and schedule for any audits that are planned. For projects that have controversial implications, or are large, complex, and costly, the QAPP should describe conducting one or more field, “bench”, or telephone audits before project completion. Audits can also be appropriate for projects that only involve complex data analysis and/or modeling. You may also describe audits in which the analytical laboratory routinely participates. Simpler projects may not warrant audits. xxxx
12.2 Responsible personnel Identify who will conduct the audits and what the auditors will examine. xxxx
12.3 Frequency and distribution of reports Determine and describe report frequencies. For a project extending over a long period of time, it may be useful to generate interim reports or report the data more frequently than just at the end of the project. Often some form of short technical communication is used for this reporting. An e-mail message or technical memo may be adequate to cover the required information transfer. Propose an outline for the final report. xxxx
12.4 Responsibility for reports Identify all authors of the final report. xxxx
QAPP: Title (can be abbreviated) - DRAFT - Page 26 – Month Year
Template Version 1.0, 10/07/2016
13.0 Data Verification EPA defines data verification as “the process of evaluating the completeness, correctness, and conformance/compliance of a specific data set against the method, procedural, or contractual requirements.”
13.1 Field data verification, requirements, and responsibilities Describe the process by which field data are verified (e.g., examined in detail to ensure that quality criteria such as MQOs have been met). Data verification should be performed by a qualified person different from the field staff who generated the data. xxxx
13.2 Laboratory data verification Describe the process for verifying quality of lab analytical data (see EPA definition above). xxxx
13.3 Validation requirements, if necessary Data validation defined as “an analyte-specific and sample-specific process that extends the evaluation of data beyond method, procedural, or contractual compliance (i.e., data verification) to determine the analytical quality of a specific data set”. Validation requires a qualified individual, independent of the data generation process, to use raw instrument records and bench sheets to assess the quality of the data. For the majority of projects that do not warrant this added difficulty and expense, this section is “Not Applicable”. xxxx
13.4 Model quality assessment Enter “NA” if this project does not involve modeling or analysis of existing data. xxxx 13.4.1 Calibration and validation Use subsections below to describe how the model will be calibrated and verified/validated. Detail the procedures that will be used to assess goodness-of-fit between model outputs (predictions) and field data. If an independent data set will be used to corroborate calibrated model results (often called “verification” or “validation”), describe that procedure also. Calibration and validation procedures usually involve estimating precision and bias. xxxx
13.4.1.1 Precision Model precision is usually assessed by comparing the “absolute distance” between modeled results and field measurements representing a similar time and location (positive and negative differences will be treated the same). Examples of metrics for precision include relative percent
QAPP: Title (can be abbreviated) - DRAFT - Page 27 – Month Year
Template Version 1.0, 10/07/2016
difference (RPD), relative standard deviation (RSD), and the root mean square error (RMSE) between paired modeled and observed results. xxxx
13.4.1.2 Bias Bias is also usually assessed by comparing modeled results to field measurements from a similar time and location. However, bias is indicated by the average shift between the two (positive and negative differences “cancel out”) which helps determine how much precision deviates from being equally balanced. Metrics for bias include the mean error (average of paired observed-modeled values) or the percent error (average of paired observed-modeled values divided by observed value), using actual values and not absolute values. xxxx
13.4.1.3 Representativeness Describe how model results will be assessed to determine how representative they are of the population of interest and the model-specified population boundaries. Describe how the model approach combined with input and calibration data collection methods contribute to representativeness. Show representativeness through consideration of factors such as seasonality, time of day, flow conditions, and weather. xxxx
13.4.1.4 Qualitative assessment Describe any qualitative methods that will be used for goodness-of-fit, such as graphical evaluation. Include the criteria used, e.g., important patterns such as diurnal variation or daily maximum values. xxxx 13.4.2 Analysis of sensitivity and uncertainty Describe the analytical procedures that will be used to assess sensitivity of the model to input values for different parameters. Also describe how uncertainty associated with the various modeled outputs will be calculated. xxxx
QAPP: Title (can be abbreviated) - DRAFT - Page 28 – Month Year
Template Version 1.0, 10/07/2016
14.0 Data Quality (Usability) Assessment 14.1 Process for determining project objectives were met Describe the process for evaluating whether the project outcomes have met the original objectives. In general, this will be the case if the data were collected consistent with the study design 4, methods, and procedures described in the final approved QAPP, and if enough of the data are deemed usable after verification (e.g., quality objectives detailed in the QAPP have been met). Also describe causes for rejecting data, as well as how data that do not meet MQOs will be qualified. A similar process should be described for projects involving modeling or analysis of existing data. For example, describe how investigators will evaluate overall model quality, e.g., by comparing RSD, RMSE, other goodness-of-fit statistics, and uncertainty values to the model quality objectives listed in Section 6.4. Also describe how the final assessment of model quality may affect usability or applicability of the model. xxxx
14.2 Treatment of non-detects Describe how non-detect project results will be handled. This is a complex topic. If uncertain about how to address non-detect data, determine whether there is available guidance. If not, consult a statistician. xxxx
14.3 Data analysis and presentation methods Include procedures for compiling and analyzing the data, including any software requirements. Discuss, in general terms, any statistical treatment or specialized statistics you plan to use for interpretation of data or determining trends. An important element of the project might be statistical analysis to detect relationships and trends in the data or to compare results with those of other projects. Use guidance for these techniques in Ecology QAPP Guidance. xxxx
14.4 Sampling design evaluation Evaluate the anticipated effectiveness of the sampling design to be used. For example, does the design yield enough statistical power to draw the desired conclusions? Revise as necessary. xxxx
14.5 Documentation of assessment Describe how the data usability assessment will be documented. xxxx 4 And there is no reason to question the study design assumptions xx
QAPP: Title (can be abbreviated) - DRAFT - Page 29 – Month Year
Template Version 1.0, 10/07/2016
15.0 References Almost every QAPP will refer to studies, reports, SOPs, and scientific literature. Include these references in this section. Spell out all journal names. Delete any of the following references that aren’t cited in this QAPP. APHA, AWWA, and WEF, 1998. Standard Methods for the Examination of Water and Wastewater 20th Edition. American Public Health Association, Washington, D.C. Aroner, E.R., 2003. WQHYDRO: Water Quality/Hydrology Graphics/Analysis System. Portland, OR. Ecology, 1993. Field Sampling and Measurement Protocols for the Watershed Assessments Section. Washington State Department of Ecology, Olympia, WA. Publication No. 93-e04. https://fortress.wa.gov/ecy/publications/SummaryPages/93e04.html Ecology, 2009a. Permits – Point Source Pollution. Water Quality Program, Washington State Department of Ecology, Olympia, WA. www.ecy.wa.gov/programs/wq/permits. Ecology, 2009b. River and Stream Water Quality Monitoring. Environmental Assessment Program, Washington State Department of Ecology, Olympia, WA. http://www.ecy.wa.gov/programs/eap/fw_riv/index.html Ecology, 2009c. Quality Assurance at Ecology. Environmental Assessment Program, Washington State Department of Ecology, Olympia, WA. www.ecy.wa.gov/programs/eap/quality.html Ecology, 2009d. Water Quality Data Quality Assessment. Water Quality Program, Washington State Department of Ecology, Olympia, WA. www.ecy.wa.gov/programs/wq/qa Ecology, 2012. 2012 Washington State Water Quality Assessment. Water Quality Program, Washington State Department of Ecology, Olympia, WA. http://www.ecy.wa.gov/programs/wq/303d/index.html Janisch, J., 2006. Standard Operating Procedure for Determining Global Position System Coordinates, Version 1.0. Washington State Department of Ecology, Olympia, WA. SOP Number EAP013. www.ecy.wa.gov/programs/eap/quality.html Joy, J., 2006. Standard Operating Procedure for Grab sampling – Fresh water, Version 1.0. Washington State Department of Ecology, Olympia, WA. SOP Number EAP015. www.ecy.wa.gov/programs/eap/quality.html Lombard, S. and C. Kirchmer, 2004. Guidelines for Preparing Quality Assurance Project Plans for Environmental Studies. Washington State Department of Ecology, Olympia, WA. Publication No. 04-03-030. https://fortress.wa.gov/ecy/publications/SummaryPages/0403030.html
QAPP: Title (can be abbreviated) - DRAFT - Page 30 – Month Year
Template Version 1.0, 10/07/2016
Mathieu, N., 2006. Replicate Precision for 12 Total Maximum Daily Load (TMDL) Studies and Recommendations for Precision Measurement Quality Objectives for Water Quality Parameters. Washington State Department of Ecology, Olympia, WA. Publication No. 06-03-044. https://fortress.wa.gov/ecy/publications/SummaryPages/0603044.html MEL, 2008. Manchester Environmental Laboratory Lab Users Manual, Ninth Edition. Manchester Environmental Laboratory, Washington State Department of Ecology, Manchester, WA. MEL, 2012. Manchester Environmental Laboratory Quality Assurance Manual. Manchester Environmental Laboratory, Washington State Department of Ecology, Manchester, WA. Microsoft, 2007. Microsoft Office XP Professional, Version 10.0. Microsoft Corporation. Ott, W., 1995. Environmental Statistics and Data Analysis. Lewis Publishers, New York, NY. Sullivan, L., 2007. Standard Operating Procedure for Estimating Streamflow, Version 1.0. Washington State Department of Ecology, Olympia, WA. SOP Number EAP024. www.ecy.wa.gov/programs/eap/quality.html Swanson, T., 2007. Standard Operating Procedure for Hydrolab® DataSonde® and MiniSonde® Multiprobes, Version 1.0. Washington State Department of Ecology, Olympia, WA. SOP Number EAP033. www.ecy.wa.gov/programs/eap/quality.html WAC 173-201A. Water Quality Standards for Surface Waters in the State of Washington Washington State Department of Ecology, Olympia, WA. www.ecy.wa.gov/laws-rules/ecywac.html Ward, W.J., 2007. Collection, Processing, and Analysis of Stream Samples, Version 1.3. Washington State Department of Ecology, Olympia, WA. SOP Number EAP034. www.ecy.wa.gov/programs/eap/quality.html
QAPP: Title (can be abbreviated) - DRAFT - Page 31 – Month Year
Template Version 1.0, 10/07/2016
16.0 Appendices In addition to Appendix A, appendices might include: • SOPs • MSDS and safety information • Historical data • Examples of forms to be used in the project
QAPP: Title (can be abbreviated) - DRAFT - Page 32 – Month Year
Template Version 1.0, 10/07/2016
Appendix A. xx (Title) In Appendix A, number figures and tables as: • Figure A-1, Figure A-2, etc. • Table A-1, Table A-2, etc. Don’t add captions to figures and tables in the appendices. Don’t delete the next appendix (Glossaries…), and be sure it’s your last appendix. xxxx
QAPP: Title (can be abbreviated) - DRAFT - Page 33 – Month Year
Template Version 1.0, 10/07/2016
Appendix xx. Glossaries, Acronyms, and Abbreviations
Glossary of General Terms Author, delete any terms that don’t apply to this QAPP and also add other terms, as needed. Don’t add any terms already included in the Quality Assurance Glossary that follows this Glossary of General Terms. Ambient: Background or away from point sources of contamination. Surrounding environmental condition.
Anthropogenic: Human-caused.
Bankfull stage: Formally defined as the stream level that “corresponds to the discharge at which channel maintenance is most effective, that is, the discharge at which moving sediment, forming or removing bars, forming or changing bends and meanders, and generally doing work that results in the average morphologic characteristics of channels (Dunne and Leopold, 1978).
Baseflow: The component of total streamflow that originates from direct groundwater discharges to a stream.
Char: Fish of genus Salvelinus distinguished from trout and salmon by the absence of teeth in the roof of the mouth, presence of light-colored spots on a dark background, absence of spots on the dorsal fin, small scales, and differences in the structure of their skeleton. (Trout and salmon have dark spots on a lighter background.)
Chronic critical effluent concentration: The maximum concentration of effluent during critical conditions at the boundary of the mixing zone assigned in accordance with WAC 173-201A-100. The boundary may be based on distance or a percentage of flow. Where no mixing zone is allowed, the chronic critical effluent concentration shall be 100% effluent.
Clean Water Act: A federal act passed in 1972 that contains provisions to restore and maintain the quality of the nation’s waters. Section 303(d) of the Clean Water Act establishes the TMDL program.
Conductivity: A measure of water’s ability to conduct an electrical current. Conductivity is related to the concentration and charge of dissolved ions in water.
Critical condition: When the physical, chemical, and biological characteristics of the receiving water environment interact with the effluent to produce the greatest potential adverse impact on aquatic biota and existing or designated water uses. For steady-state discharges to riverine systems, the critical condition may be assumed to be equal to the 7Q10 flow event unless determined otherwise by the department.
QAPP: Title (can be abbreviated) - DRAFT - Page 34 – Month Year
Template Version 1.0, 10/07/2016
Designated uses: Those uses specified in Chapter 173-201A WAC (Water Quality Standards for Surface Waters of the State of Washington) for each water body or segment, regardless of whether or not the uses are currently attained.
Diel: Of, or pertaining to, a 24-hour period.
Dissolved oxygen (DO): A measure of the amount of oxygen dissolved in water.
Dilution factor: The relative proportion of effluent to stream (receiving water) flows occurring at the edge of a mixing zone during critical discharge conditions as authorized in accordance with the state’s mixing zone regulations at WAC 173-201A-100. http://apps.leg.wa.gov/WAC/default.aspx?cite=173-201A-020
Diurnal: Of, or pertaining to, a day or each day; daily. (1) Occurring during the daytime only, as different from nocturnal or crepuscular, or (2) Daily; related to actions which are completed in the course of a calendar day, and which typically recur every calendar day (e.g., diurnal temperature rises during the day, and falls during the night).
Effective shade: The fraction of incoming solar shortwave radiation that is blocked from reaching the surface of a stream or other defined area.
Effluent: An outflowing of water from a natural body of water or from a human-made structure. For example, the treated outflow from a wastewater treatment plant.
Enterococci: A subgroup of the fecal streptococci that includes S. faecalis, S. faecium, S. gallinarum, and S. avium. The enterococci are differentiated from other streptococci by their ability to grow in 6.5% sodium chloride, at pH 9.6, and at 10 degrees C and 45 degrees C.
Eutrophic: Nutrient rich and high in productivity resulting from human activities such as fertilizer runoff and leaky septic systems.
Existing uses: Those uses actually attained in fresh and marine waters on or after November 28, 1975, whether or not they are designated uses. Introduced species that are not native to Washington, and put-and-take fisheries comprised of non-self-replicating introduced native species, do not need to receive full support as an existing use.
Extraordinary primary contact: Waters providing extraordinary protection against waterborne disease or that serve as tributaries to extraordinary quality shellfish harvesting areas.
Fecal coliform (FC): That portion of the coliform group of bacteria which is present in intestinal tracts and feces of warm-blooded animals as detected by the product of acid or gas from lactose in a suitable culture medium within 24 hours at 44.5 plus or minus 0.2 degrees Celsius. Fecal coliform bacteria are “indicator” organisms that suggest the possible presence of disease-causing organisms. Concentrations are measured in colony forming units per 100 milliliters of water (cfu/100 mL).
Fish Tissue Equivalent Concentration (FTEC): The FTEC is a tissue contaminant concentration used by Ecology to determine whether the designated uses of fishing and drinking from surface waters are being met. The FTEC is an interpretation of Washington’s water quality
QAPP: Title (can be abbreviated) - DRAFT - Page 35 – Month Year
Template Version 1.0, 10/07/2016
criterion for a specific chemical for the protection of human health: the National Toxics Rule (40 CFR 131.36). Fish tissue sample concentrations that are lower than the FTEC suggest that the uses of fishing and drinking from surface waters are being met for that specific contaminant. Where an FTEC is not met (i.e., concentration of a chemical in fish tissue is greater than the FTEC), that water body is then placed into Category 5 during Washington’s periodic Water Quality Assessment (http://www.ecy.wa.gov/programs/Wq/303d/index.html). Category 5 listings become part of Washington’s 303(d) list during the assessment process. The FTEC is calculated by multiplying the contaminant-specific Bio-Concentration Factor (BCF) times the contaminant-specific Water Quality Criterion found in the National Toxics Rule.
Geometric mean: A mathematical expression of the central tendency (an average) of multiple sample values. A geometric mean, unlike an arithmetic mean, tends to dampen the effect of very high or low values, which might bias the mean if a straight average (arithmetic mean) were calculated. This is helpful when analyzing bacteria concentrations, because levels may vary anywhere from 10 to 10,000 fold over a given period. The calculation is performed by either: (1) taking the nth root of a product of n factors, or (2) taking the antilogarithm of the arithmetic mean of the logarithms of the individual values.
Hyporheic: The area beneath and adjacent to a stream where surface water and groundwater intermix.
Load allocation: The portion of a receiving water’s loading capacity attributed to one or more of its existing or future sources of nonpoint pollution or to natural background sources.
Loading capacity: The greatest amount of a substance that a water body can receive and still meet water quality standards.
Margin of safety: Required component of TMDLs that accounts for uncertainty about the relationship between pollutant loads and quality of the receiving water body.
Municipal separate storm sewer systems (MS4): A conveyance or system of conveyances (including roads with drainage systems, municipal streets, catch basins, curbs, gutters, ditches, manmade channels, or storm drains): (1) owned or operated by a state, city, town, borough, county, parish, district, association, or other public body having jurisdiction over disposal of wastes, stormwater, or other wastes and (2) designed or used for collecting or conveying stormwater; (3) which is not a combined sewer; and (4) which is not part of a Publicly Owned Treatment Works (POTW) as defined in the Code of Federal Regulations at 40 CFR 122.2.
National Pollutant Discharge Elimination System (NPDES): National program for issuing, modifying, revoking and reissuing, terminating, monitoring, and enforcing permits, and imposing and enforcing pretreatment requirements under the Clean Water Act. The NPDES program regulates discharges from wastewater treatment plants, large factories, and other facilities that use, process, and discharge water back into lakes, streams, rivers, bays, and oceans.
Near-stream disturbance zone (NSDZ): The active channel area without riparian vegetation that includes features such as gravel bars.
QAPP: Title (can be abbreviated) - DRAFT - Page 36 – Month Year
Template Version 1.0, 10/07/2016
Nonpoint source: Pollution that enters any waters of the state from any dispersed land-based or water-based activities, including but not limited to atmospheric deposition, surface-water runoff from agricultural lands, urban areas, or forest lands, subsurface or underground sources, or discharges from boats or marine vessels not otherwise regulated under the NPDES program. Generally, any unconfined and diffuse source of contamination. Legally, any source of water pollution that does not meet the legal definition of “point source” in section 502(14) of the Clean Water Act.
Nutrient: Substance such as carbon, nitrogen, and phosphorus used by organisms to live and grow. Too many nutrients in the water can promote algal blooms and rob the water of oxygen vital to aquatic organisms.
Pathogen: Disease-causing microorganisms such as bacteria, protozoa, viruses.
pH: A measure of the acidity or alkalinity of water. A low pH value (0 to 7) indicates that an acidic condition is present, while a high pH (7 to 14) indicates a basic or alkaline condition. A pH of 7 is considered to be neutral. Since the pH scale is logarithmic, a water sample with a pH of 8 is ten times more basic than one with a pH of 7.
Phase I stormwater permit: The first phase of stormwater regulation required under the federal Clean Water Act. The permit is issued to medium and large municipal separate storm sewer systems (MS4s) and construction sites of five or more acres.
Phase II stormwater permit: The second phase of stormwater regulation required under the federal Clean Water Act. The permit is issued to smaller municipal separate storm sewer systems (MS4s) and construction sites over one acre.
Point source: Source of pollution that discharges at a specific location from pipes, outfalls, and conveyance channels to a surface water. Examples of point source discharges include municipal wastewater treatment plants, municipal stormwater systems, industrial waste treatment facilities, and construction sites where more than 5 acres of land have been cleared.
Pollution: Contamination or other alteration of the physical, chemical, or biological properties of any waters of the state. This includes change in temperature, taste, color, turbidity, or odor of the waters. It also includes discharge of any liquid, gaseous, solid, radioactive, or other substance into any waters of the state. This definition assumes that these changes will, or are likely to, create a nuisance or render such waters harmful, detrimental, or injurious to (1) public health, safety, or welfare, or (2) domestic, commercial, industrial, agricultural, recreational, or other legitimate beneficial uses, or (3) livestock, wild animals, birds, fish, or other aquatic life.
Primary contact recreation: Activities where a person would have direct contact with water to the point of complete submergence including, but not limited to, skin diving, swimming, and water skiing.
Reach: A specific portion or segment of a stream.
Riparian: Relating to the banks along a natural course of water.
QAPP: Title (can be abbreviated) - DRAFT - Page 37 – Month Year
Template Version 1.0, 10/07/2016
Salmonid: Fish that belong to the family Salmonidae. Any species of salmon, trout, or char.
Sediment: Soil and organic matter that is covered with water (for example, river or lake bottom).
Stormwater: The portion of precipitation that does not naturally percolate into the ground or evaporate but instead runs off roads, pavement, and roofs during rainfall or snow melt. Stormwater can also come from hard or saturated grass surfaces such as lawns, pastures, playfields, and from gravel roads and parking lots.
Streamflow: Discharge of water in a surface stream (river or creek).
Surface waters of the state: Lakes, rivers, ponds, streams, inland waters, salt waters, wetlands and all other surface waters and water courses within the jurisdiction of Washington State.
Synoptic survey: Data collected simultaneously or over a short period of time.
System potential: The design condition used for TMDL analysis.
System-potential channel morphology: The more stable configuration that would occur with less human disturbance.
System-potential mature riparian vegetation: Vegetation which can grow and reproduce on a site, given climate, elevation, soil properties, plant biology, and hydrologic processes.
System-potential riparian microclimate: The best estimate of air temperature reductions that are expected under mature riparian vegetation. System-potential riparian microclimate can also include expected changes to wind speed and relative humidity.
System-potential temperature: An approximation of the temperatures that would occur under natural conditions. System potential is our best understanding of natural conditions that can be supported by available analytical methods. The simulation of the system-potential condition uses best estimates of mature riparian vegetation, system-potential channel morphology, and system-potential riparian microclimate that would occur absent any human alteration.
Thalweg: The deepest and fastest moving portion of a stream.
Total Maximum Daily Load (TMDL): A distribution of a substance in a water body designed to protect it from not meeting (exceeding) water quality standards. A TMDL is equal to the sum of all of the following: (1) individual waste load allocations for point sources, (2) the load allocations for nonpoint sources, (3) the contribution of natural sources, and (4) a margin of safety to allow for uncertainty in the waste load determination. A reserve for future growth is also generally provided.
Total suspended solids (TSS): Portion of solids retained by a filter.
Turbidity: A measure of water clarity. High levels of turbidity can have a negative impact on aquatic life.
QAPP: Title (can be abbreviated) - DRAFT - Page 38 – Month Year
Template Version 1.0, 10/07/2016
Waste load allocation: The portion of a receiving water’s loading capacity allocated to existing or future point sources of pollution. Waste load allocations constitute one type of water quality-based effluent limitation.
Watershed: A drainage area or basin in which all land and water areas drain or flow toward a central collector such as a stream, river, or lake at a lower elevation.
1-DMax or 1-day maximum temperature: The highest water temperature reached on any given day. This measure can be obtained using calibrated maximum/minimum thermometers or continuous monitoring probes having sampling intervals of thirty minutes or less.
303(d) list: Section 303(d) of the federal Clean Water Act, requiring Washington State to periodically prepare a list of all surface waters in the state for which beneficial uses of the water – such as for drinking, recreation, aquatic habitat, and industrial use – are impaired by pollutants. These are water quality-limited estuaries, lakes, and streams that fall short of state surface water quality standards and are not expected to improve within the next two years.
7-DADMax or 7-day average of the daily maximum temperatures: The arithmetic average of seven consecutive measures of daily maximum temperatures. The 7-DADMax for any individual day is calculated by averaging that day's daily maximum temperature with the daily maximum temperatures of the three days before and the three days after that date.
7Q2 flow: A typical low-flow condition. The 7Q2 is a statistical estimate of the lowest 7-day average flow that can be expected to occur once every other year on average. The 7Q2 flow is commonly used to represent the average low-flow condition in a water body and is typically calculated from long-term flow data collected in each basin. For temperature TMDL work, the 7Q2 is usually calculated for the months of July and August as these typically represent the critical months for temperature in our state.
7Q10 flow: A critical low-flow condition. The 7Q10 is a statistical estimate of the lowest 7-day average flow that can be expected to occur once every ten years on average. The 7Q10 flow is commonly used to represent the critical flow condition in a water body and is typically calculated from long-term flow data collected in each basin. For temperature TMDL work, the 7Q10 is usually calculated for the months of July and August as these typically represent the critical months for temperature in our state.
90th percentile: An estimated portion of a sample population based on a statistical determination of distribution characteristics. The 90th percentile value is a statistically derived estimate of the division between 90% of samples, which should be less than the value, and 10% of samples, which are expected to exceed the value.
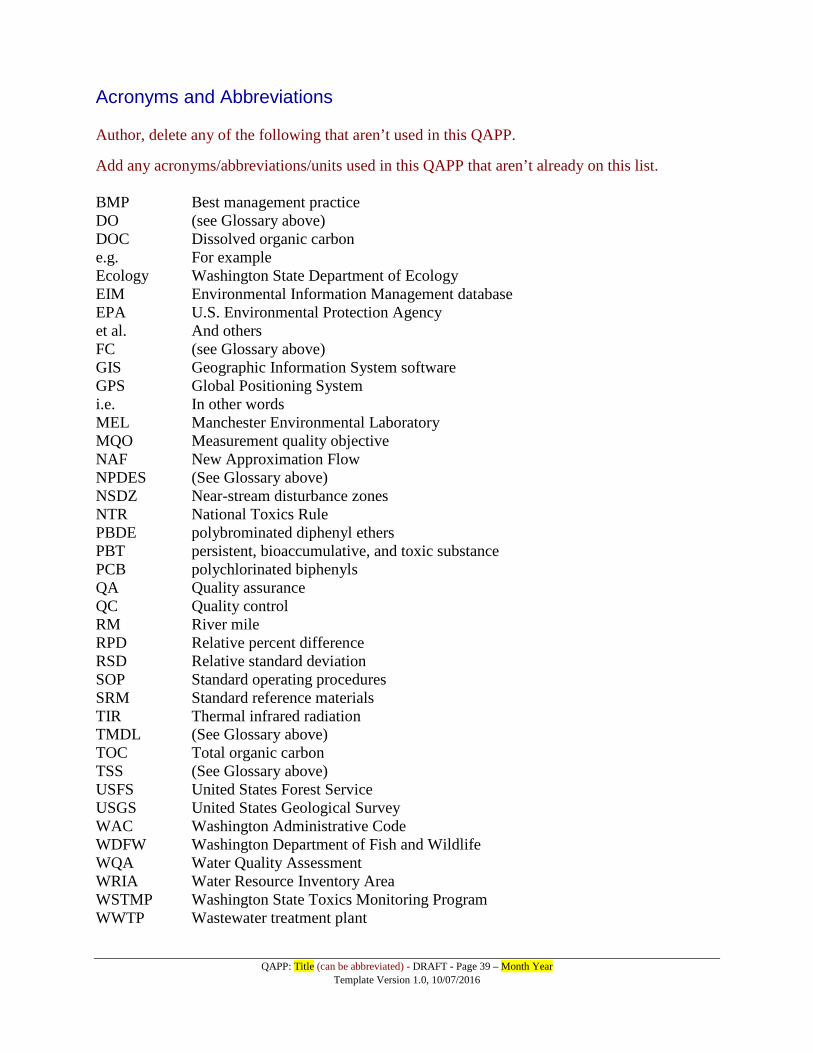
QAPP: Title (can be abbreviated) - DRAFT - Page 39 – Month Year
Template Version 1.0, 10/07/2016
Acronyms and Abbreviations Author, delete any of the following that aren’t used in this QAPP. Add any acronyms/abbreviations/units used in this QAPP that aren’t already on this list. BMP Best management practice DO (see Glossary above) DOC Dissolved organic carbon e.g. For example Ecology Washington State Department of Ecology EIM Environmental Information Management database EPA U.S. Environmental Protection Agency et al. And others FC (see Glossary above) GIS Geographic Information System software GPS Global Positioning System i.e. In other words MEL Manchester Environmental Laboratory MQO Measurement quality objective NAF New Approximation Flow NPDES (See Glossary above) NSDZ Near-stream disturbance zones NTR National Toxics Rule PBDE polybrominated diphenyl ethers PBT persistent, bioaccumulative, and toxic substance PCB polychlorinated biphenyls QA Quality assurance QC Quality control RM River mile RPD Relative percent difference RSD Relative standard deviation SOP Standard operating procedures SRM Standard reference materials TIR Thermal infrared radiation TMDL (See Glossary above) TOC Total organic carbon TSS (See Glossary above) USFS United States Forest Service USGS United States Geological Survey WAC Washington Administrative Code WDFW Washington Department of Fish and Wildlife WQA Water Quality Assessment WRIA Water Resource Inventory Area WSTMP Washington State Toxics Monitoring Program WWTP Wastewater treatment plant
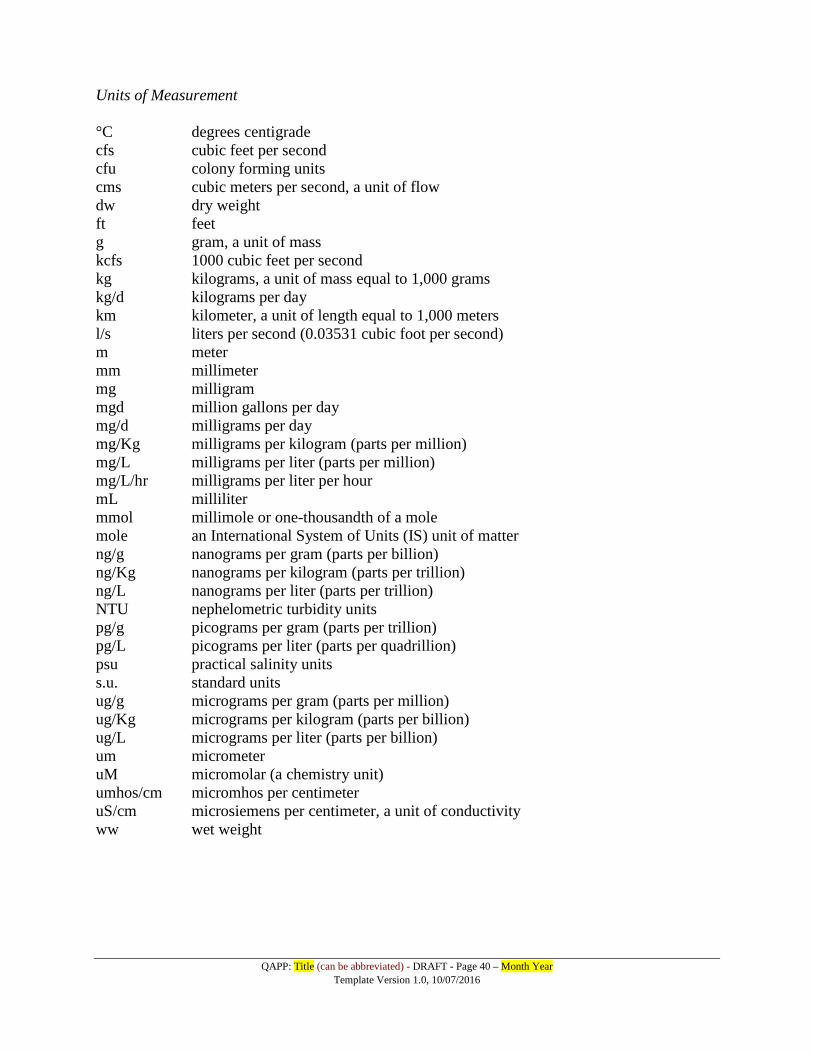
QAPP: Title (can be abbreviated) - DRAFT - Page 40 – Month Year
Template Version 1.0, 10/07/2016
Units of Measurement °C degrees centigrade cfs cubic feet per second cfu colony forming units cms cubic meters per second, a unit of flow dw dry weight ft feet g gram, a unit of mass kcfs 1000 cubic feet per second kg kilograms, a unit of mass equal to 1,000 grams kg/d kilograms per day km kilometer, a unit of length equal to 1,000 meters l/s liters per second (0.03531 cubic foot per second) m meter mm millimeter mg milligram mgd million gallons per day mg/d milligrams per day mg/Kg milligrams per kilogram (parts per million)
mg/L milligrams per liter (parts per million) mg/L/hr milligrams per liter per hour mL milliliter mmol millimole or one-thousandth of a mole mole an International System of Units (IS) unit of matter ng/g nanograms per gram (parts per billion) ng/Kg nanograms per kilogram (parts per trillion) ng/L nanograms per liter (parts per trillion) NTU nephelometric turbidity units pg/g picograms per gram (parts per trillion) pg/L picograms per liter (parts per quadrillion) psu practical salinity units s.u. standard units ug/g micrograms per gram (parts per million) ug/Kg micrograms per kilogram (parts per billion) ug/L micrograms per liter (parts per billion) um micrometer uM micromolar (a chemistry unit) umhos/cm micromhos per centimeter uS/cm microsiemens per centimeter, a unit of conductivity ww wet weight
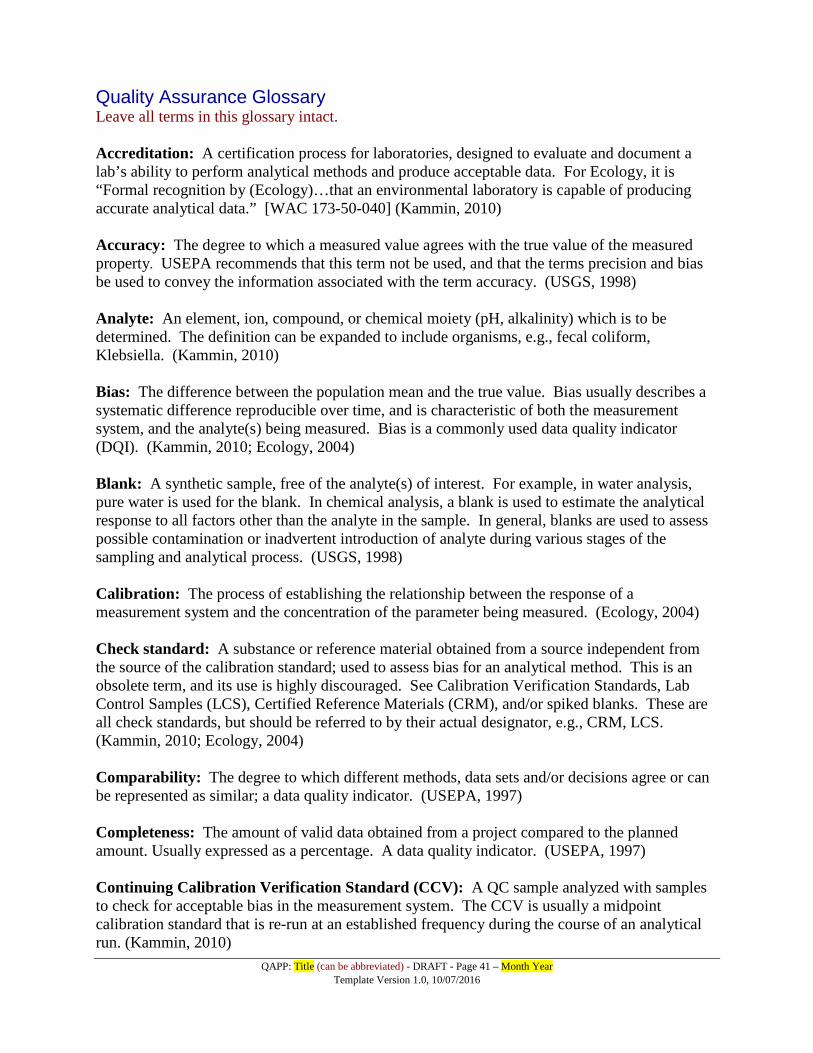
QAPP: Title (can be abbreviated) - DRAFT - Page 41 – Month Year
Template Version 1.0, 10/07/2016
Quality Assurance Glossary Leave all terms in this glossary intact. Accreditation: A certification process for laboratories, designed to evaluate and document a lab’s ability to perform analytical methods and produce acceptable data. For Ecology, it is “Formal recognition by (Ecology)…that an environmental laboratory is capable of producing accurate analytical data.” [WAC 173-50-040] (Kammin, 2010) Accuracy: The degree to which a measured value agrees with the true value of the measured property. USEPA recommends that this term not be used, and that the terms precision and bias be used to convey the information associated with the term accuracy. (USGS, 1998) Analyte: An element, ion, compound, or chemical moiety (pH, alkalinity) which is to be determined. The definition can be expanded to include organisms, e.g., fecal coliform, Klebsiella. (Kammin, 2010) Bias: The difference between the population mean and the true value. Bias usually describes a systematic difference reproducible over time, and is characteristic of both the measurement system, and the analyte(s) being measured. Bias is a commonly used data quality indicator (DQI). (Kammin, 2010; Ecology, 2004) Blank: A synthetic sample, free of the analyte(s) of interest. For example, in water analysis, pure water is used for the blank. In chemical analysis, a blank is used to estimate the analytical response to all factors other than the analyte in the sample. In general, blanks are used to assess possible contamination or inadvertent introduction of analyte during various stages of the sampling and analytical process. (USGS, 1998) Calibration: The process of establishing the relationship between the response of a measurement system and the concentration of the parameter being measured. (Ecology, 2004) Check standard: A substance or reference material obtained from a source independent from the source of the calibration standard; used to assess bias for an analytical method. This is an obsolete term, and its use is highly discouraged. See Calibration Verification Standards, Lab Control Samples (LCS), Certified Reference Materials (CRM), and/or spiked blanks. These are all check standards, but should be referred to by their actual designator, e.g., CRM, LCS. (Kammin, 2010; Ecology, 2004) Comparability: The degree to which different methods, data sets and/or decisions agree or can be represented as similar; a data quality indicator. (USEPA, 1997) Completeness: The amount of valid data obtained from a project compared to the planned amount. Usually expressed as a percentage. A data quality indicator. (USEPA, 1997) Continuing Calibration Verification Standard (CCV): A QC sample analyzed with samples to check for acceptable bias in the measurement system. The CCV is usually a midpoint calibration standard that is re-run at an established frequency during the course of an analytical run. (Kammin, 2010)
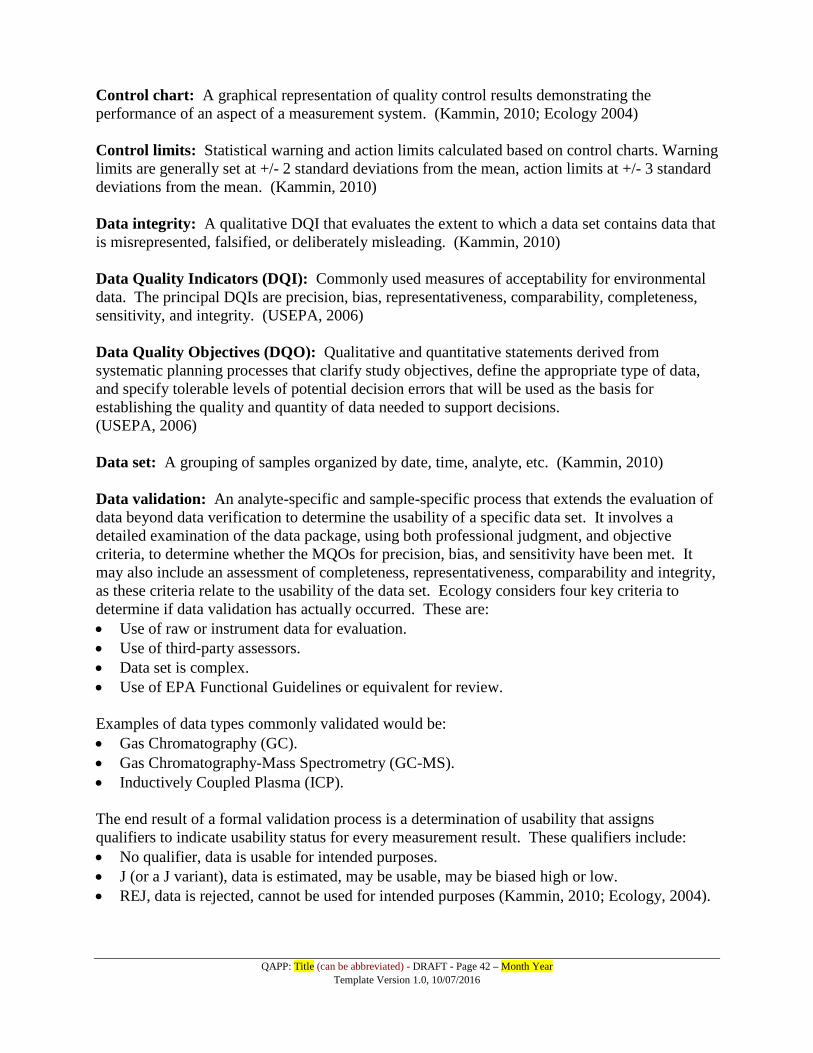
QAPP: Title (can be abbreviated) - DRAFT - Page 42 – Month Year
Template Version 1.0, 10/07/2016
Control chart: A graphical representation of quality control results demonstrating the performance of an aspect of a measurement system. (Kammin, 2010; Ecology 2004) Control limits: Statistical warning and action limits calculated based on control charts. Warning limits are generally set at +/- 2 standard deviations from the mean, action limits at +/- 3 standard deviations from the mean. (Kammin, 2010) Data integrity: A qualitative DQI that evaluates the extent to which a data set contains data that is misrepresented, falsified, or deliberately misleading. (Kammin, 2010) Data Quality Indicators (DQI): Commonly used measures of acceptability for environmental data. The principal DQIs are precision, bias, representativeness, comparability, completeness, sensitivity, and integrity. (USEPA, 2006) Data Quality Objectives (DQO): Qualitative and quantitative statements derived from systematic planning processes that clarify study objectives, define the appropriate type of data, and specify tolerable levels of potential decision errors that will be used as the basis for establishing the quality and quantity of data needed to support decisions. (USEPA, 2006) Data set: A grouping of samples organized by date, time, analyte, etc. (Kammin, 2010) Data validation: An analyte-specific and sample-specific process that extends the evaluation of data beyond data verification to determine the usability of a specific data set. It involves a detailed examination of the data package, using both professional judgment, and objective criteria, to determine whether the MQOs for precision, bias, and sensitivity have been met. It may also include an assessment of completeness, representativeness, comparability and integrity, as these criteria relate to the usability of the data set. Ecology considers four key criteria to determine if data validation has actually occurred. These are: • Use of raw or instrument data for evaluation. • Use of third-party assessors. • Data set is complex. • Use of EPA Functional Guidelines or equivalent for review. Examples of data types commonly validated would be: • Gas Chromatography (GC). • Gas Chromatography-Mass Spectrometry (GC-MS). • Inductively Coupled Plasma (ICP). The end result of a formal validation process is a determination of usability that assigns qualifiers to indicate usability status for every measurement result. These qualifiers include: • No qualifier, data is usable for intended purposes. • J (or a J variant), data is estimated, may be usable, may be biased high or low. • REJ, data is rejected, cannot be used for intended purposes (Kammin, 2010; Ecology, 2004).
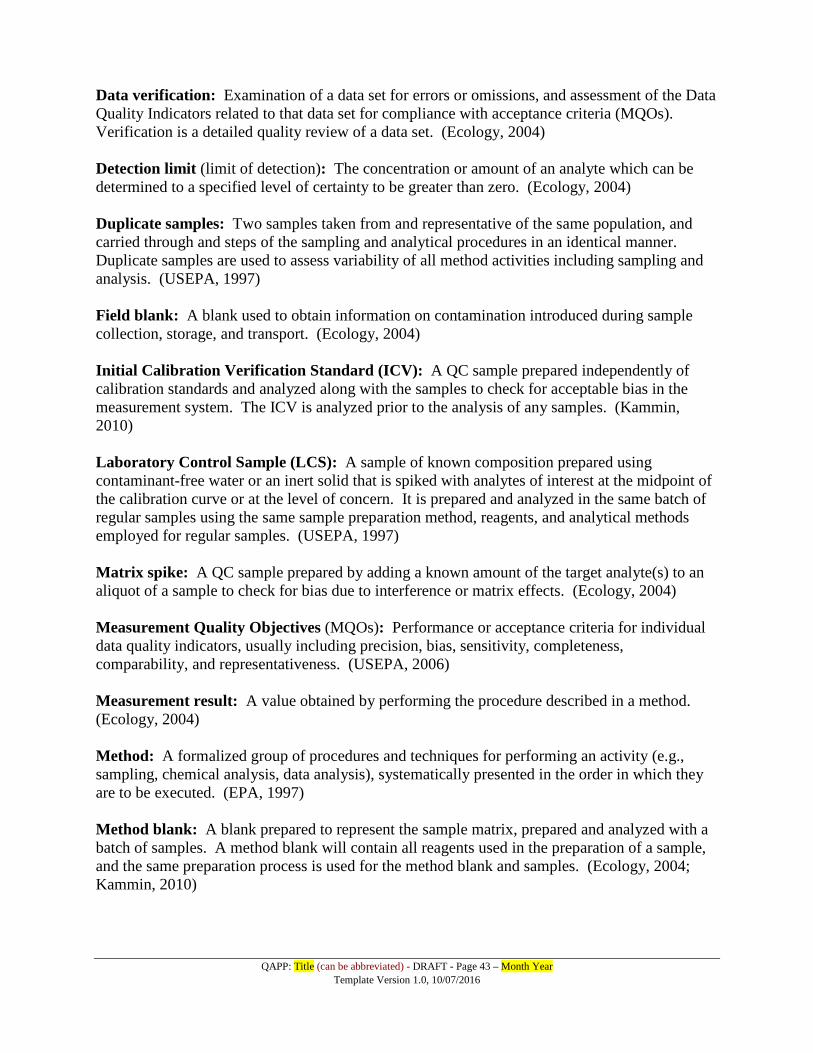
QAPP: Title (can be abbreviated) - DRAFT - Page 43 – Month Year
Template Version 1.0, 10/07/2016
Data verification: Examination of a data set for errors or omissions, and assessment of the Data Quality Indicators related to that data set for compliance with acceptance criteria (MQOs). Verification is a detailed quality review of a data set. (Ecology, 2004) Detection limit (limit of detection): The concentration or amount of an analyte which can be determined to a specified level of certainty to be greater than zero. (Ecology, 2004) Duplicate samples: Two samples taken from and representative of the same population, and carried through and steps of the sampling and analytical procedures in an identical manner. Duplicate samples are used to assess variability of all method activities including sampling and analysis. (USEPA, 1997) Field blank: A blank used to obtain information on contamination introduced during sample collection, storage, and transport. (Ecology, 2004) Initial Calibration Verification Standard (ICV): A QC sample prepared independently of calibration standards and analyzed along with the samples to check for acceptable bias in the measurement system. The ICV is analyzed prior to the analysis of any samples. (Kammin, 2010) Laboratory Control Sample (LCS): A sample of known composition prepared using contaminant-free water or an inert solid that is spiked with analytes of interest at the midpoint of the calibration curve or at the level of concern. It is prepared and analyzed in the same batch of regular samples using the same sample preparation method, reagents, and analytical methods employed for regular samples. (USEPA, 1997) Matrix spike: A QC sample prepared by adding a known amount of the target analyte(s) to an aliquot of a sample to check for bias due to interference or matrix effects. (Ecology, 2004) Measurement Quality Objectives (MQOs): Performance or acceptance criteria for individual data quality indicators, usually including precision, bias, sensitivity, completeness, comparability, and representativeness. (USEPA, 2006) Measurement result: A value obtained by performing the procedure described in a method. (Ecology, 2004) Method: A formalized group of procedures and techniques for performing an activity (e.g., sampling, chemical analysis, data analysis), systematically presented in the order in which they are to be executed. (EPA, 1997) Method blank: A blank prepared to represent the sample matrix, prepared and analyzed with a batch of samples. A method blank will contain all reagents used in the preparation of a sample, and the same preparation process is used for the method blank and samples. (Ecology, 2004; Kammin, 2010)
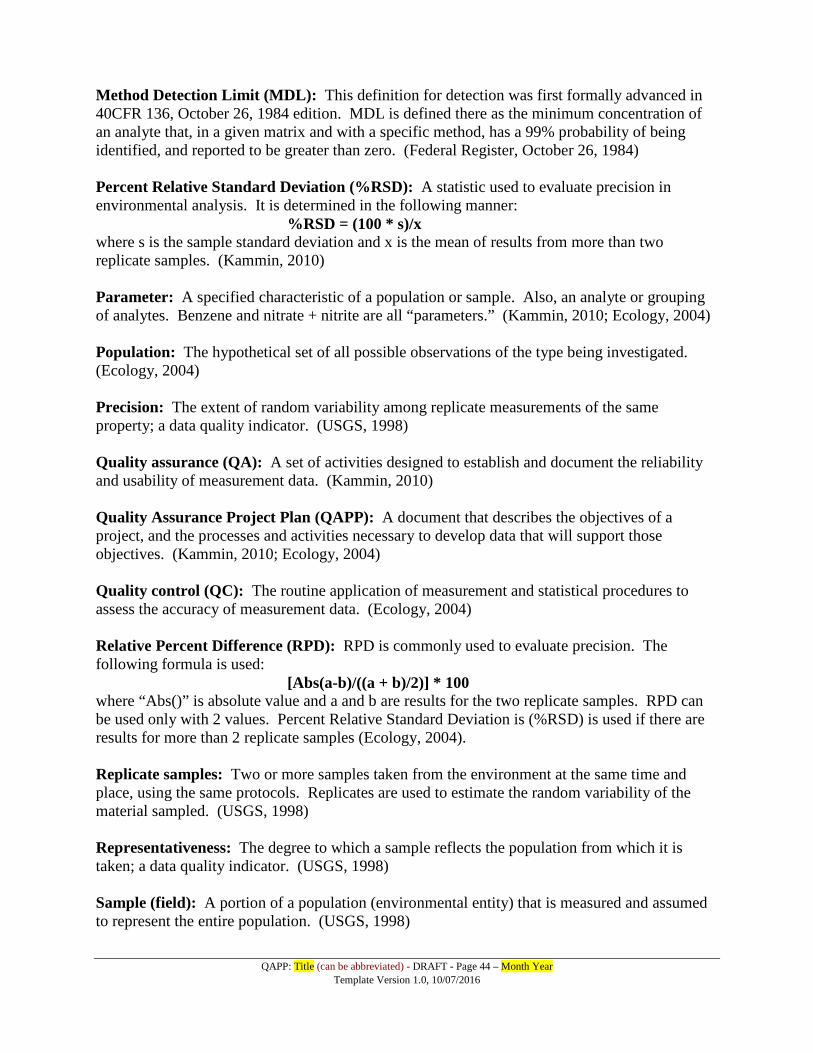
QAPP: Title (can be abbreviated) - DRAFT - Page 44 – Month Year
Template Version 1.0, 10/07/2016
Method Detection Limit (MDL): This definition for detection was first formally advanced in 40CFR 136, October 26, 1984 edition. MDL is defined there as the minimum concentration of an analyte that, in a given matrix and with a specific method, has a 99% probability of being identified, and reported to be greater than zero. (Federal Register, October 26, 1984) Percent Relative Standard Deviation (%RSD): A statistic used to evaluate precision in environmental analysis. It is determined in the following manner:
%RSD = (100 * s)/x where s is the sample standard deviation and x is the mean of results from more than two replicate samples. (Kammin, 2010) Parameter: A specified characteristic of a population or sample. Also, an analyte or grouping of analytes. Benzene and nitrate + nitrite are all “parameters.” (Kammin, 2010; Ecology, 2004) Population: The hypothetical set of all possible observations of the type being investigated. (Ecology, 2004) Precision: The extent of random variability among replicate measurements of the same property; a data quality indicator. (USGS, 1998) Quality assurance (QA): A set of activities designed to establish and document the reliability and usability of measurement data. (Kammin, 2010) Quality Assurance Project Plan (QAPP): A document that describes the objectives of a project, and the processes and activities necessary to develop data that will support those objectives. (Kammin, 2010; Ecology, 2004) Quality control (QC): The routine application of measurement and statistical procedures to assess the accuracy of measurement data. (Ecology, 2004) Relative Percent Difference (RPD): RPD is commonly used to evaluate precision. The following formula is used:
[Abs(a-b)/((a + b)/2)] * 100 where “Abs()” is absolute value and a and b are results for the two replicate samples. RPD can be used only with 2 values. Percent Relative Standard Deviation is (%RSD) is used if there are results for more than 2 replicate samples (Ecology, 2004). Replicate samples: Two or more samples taken from the environment at the same time and place, using the same protocols. Replicates are used to estimate the random variability of the material sampled. (USGS, 1998) Representativeness: The degree to which a sample reflects the population from which it is taken; a data quality indicator. (USGS, 1998) Sample (field): A portion of a population (environmental entity) that is measured and assumed to represent the entire population. (USGS, 1998)
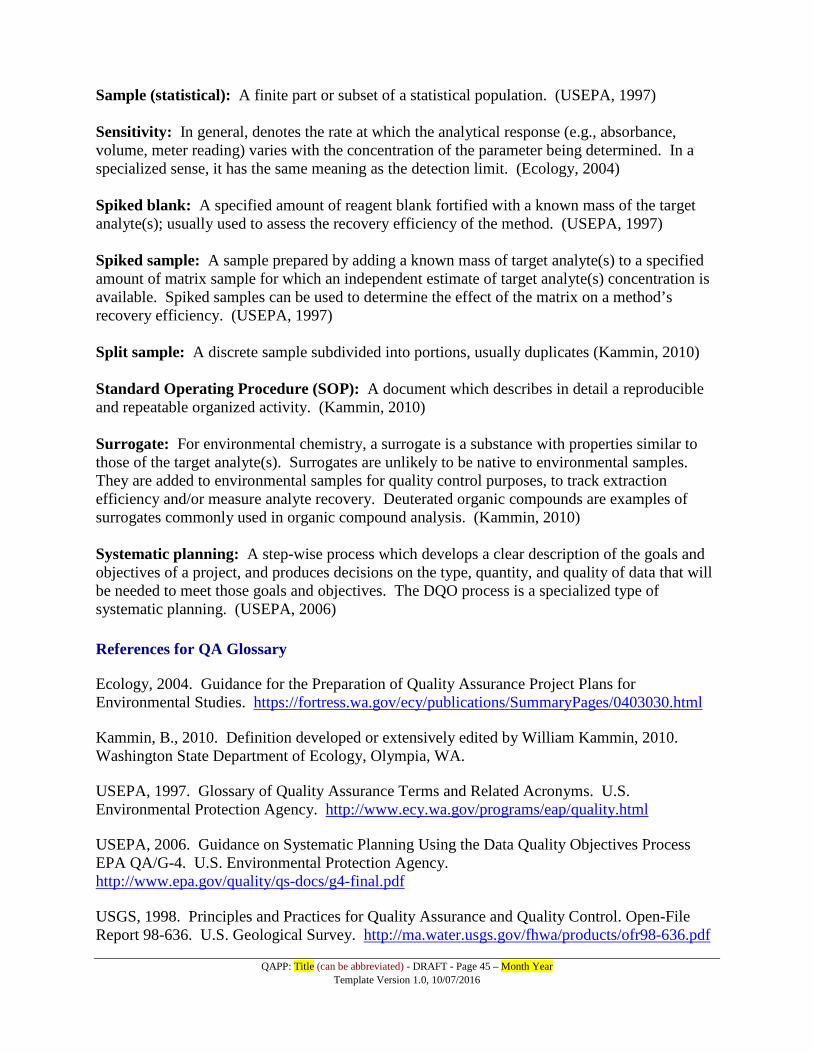
QAPP: Title (can be abbreviated) - DRAFT - Page 45 – Month Year
Template Version 1.0, 10/07/2016
Sample (statistical): A finite part or subset of a statistical population. (USEPA, 1997) Sensitivity: In general, denotes the rate at which the analytical response (e.g., absorbance, volume, meter reading) varies with the concentration of the parameter being determined. In a specialized sense, it has the same meaning as the detection limit. (Ecology, 2004) Spiked blank: A specified amount of reagent blank fortified with a known mass of the target analyte(s); usually used to assess the recovery efficiency of the method. (USEPA, 1997) Spiked sample: A sample prepared by adding a known mass of target analyte(s) to a specified amount of matrix sample for which an independent estimate of target analyte(s) concentration is available. Spiked samples can be used to determine the effect of the matrix on a method’s recovery efficiency. (USEPA, 1997) Split sample: A discrete sample subdivided into portions, usually duplicates (Kammin, 2010) Standard Operating Procedure (SOP): A document which describes in detail a reproducible and repeatable organized activity. (Kammin, 2010) Surrogate: For environmental chemistry, a surrogate is a substance with properties similar to those of the target analyte(s). Surrogates are unlikely to be native to environmental samples. They are added to environmental samples for quality control purposes, to track extraction efficiency and/or measure analyte recovery. Deuterated organic compounds are examples of surrogates commonly used in organic compound analysis. (Kammin, 2010) Systematic planning: A step-wise process which develops a clear description of the goals and objectives of a project, and produces decisions on the type, quantity, and quality of data that will be needed to meet those goals and objectives. The DQO process is a specialized type of systematic planning. (USEPA, 2006) References for QA Glossary Ecology, 2004. Guidance for the Preparation of Quality Assurance Project Plans for Environmental Studies. https://fortress.wa.gov/ecy/publications/SummaryPages/0403030.html Kammin, B., 2010. Definition developed or extensively edited by William Kammin, 2010. Washington State Department of Ecology, Olympia, WA. USEPA, 1997. Glossary of Quality Assurance Terms and Related Acronyms. U.S. Environmental Protection Agency. http://www.ecy.wa.gov/programs/eap/quality.html USEPA, 2006. Guidance on Systematic Planning Using the Data Quality Objectives Process EPA QA/G-4. U.S. Environmental Protection Agency. http://www.epa.gov/quality/qs-docs/g4-final.pdf USGS, 1998. Principles and Practices for Quality Assurance and Quality Control. Open-File Report 98-636. U.S. Geological Survey. http://ma.water.usgs.gov/fhwa/products/ofr98-636.pdf
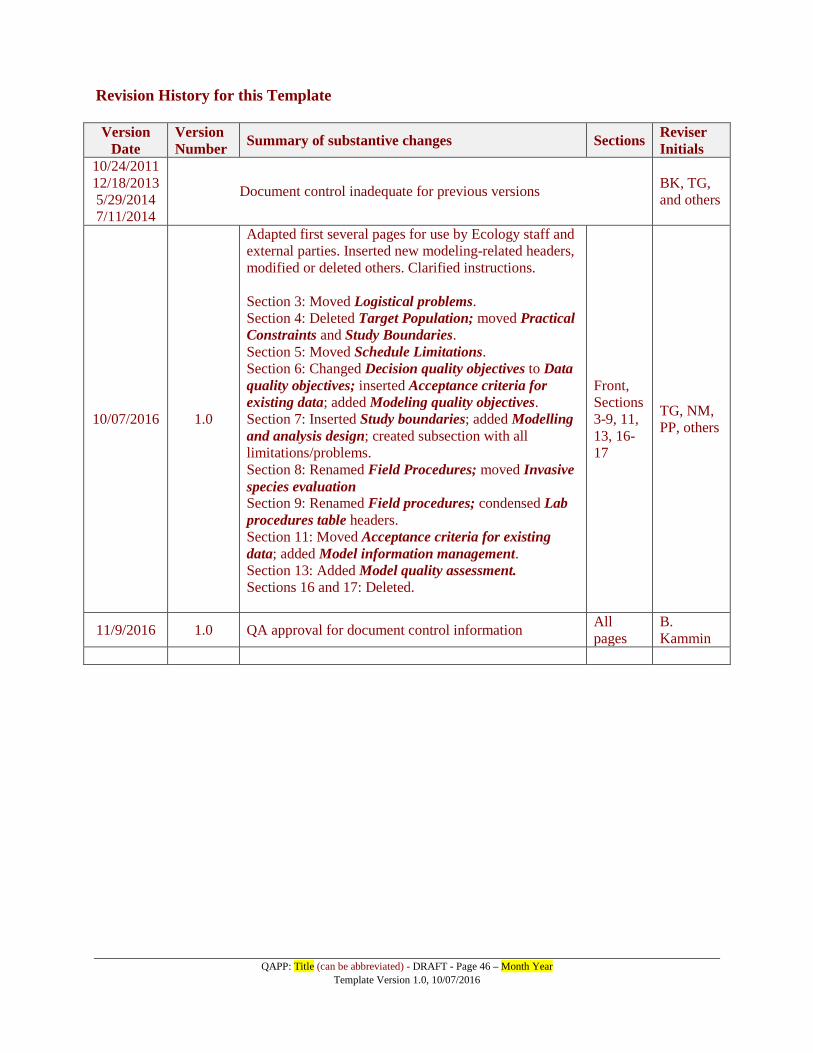
QAPP: Title (can be abbreviated) - DRAFT - Page 46 – Month Year
Template Version 1.0, 10/07/2016
Revision History for this Template Version
Date Version Number Summary of substantive changes Sections Reviser
Initials 10/24/2011 12/18/2013 5/29/2014 7/11/2014
Document control inadequate for previous versions BK, TG, and others
10/07/2016 1.0
Adapted first several pages for use by Ecology staff and external parties. Inserted new modeling-related headers, modified or deleted others. Clarified instructions. Section 3: Moved Logistical problems. Section 4: Deleted Target Population; moved Practical Constraints and Study Boundaries. Section 5: Moved Schedule Limitations. Section 6: Changed Decision quality objectives to Data quality objectives; inserted Acceptance criteria for existing data; added Modeling quality objectives. Section 7: Inserted Study boundaries; added Modelling and analysis design; created subsection with all limitations/problems. Section 8: Renamed Field Procedures; moved Invasive species evaluation Section 9: Renamed Field procedures; condensed Lab procedures table headers. Section 11: Moved Acceptance criteria for existing data; added Model information management. Section 13: Added Model quality assessment. Sections 16 and 17: Deleted.
Front, Sections 3-9, 11, 13, 16-17
TG, NM, PP, others
11/9/2016 1.0 QA approval for document control information All pages
B. Kammin
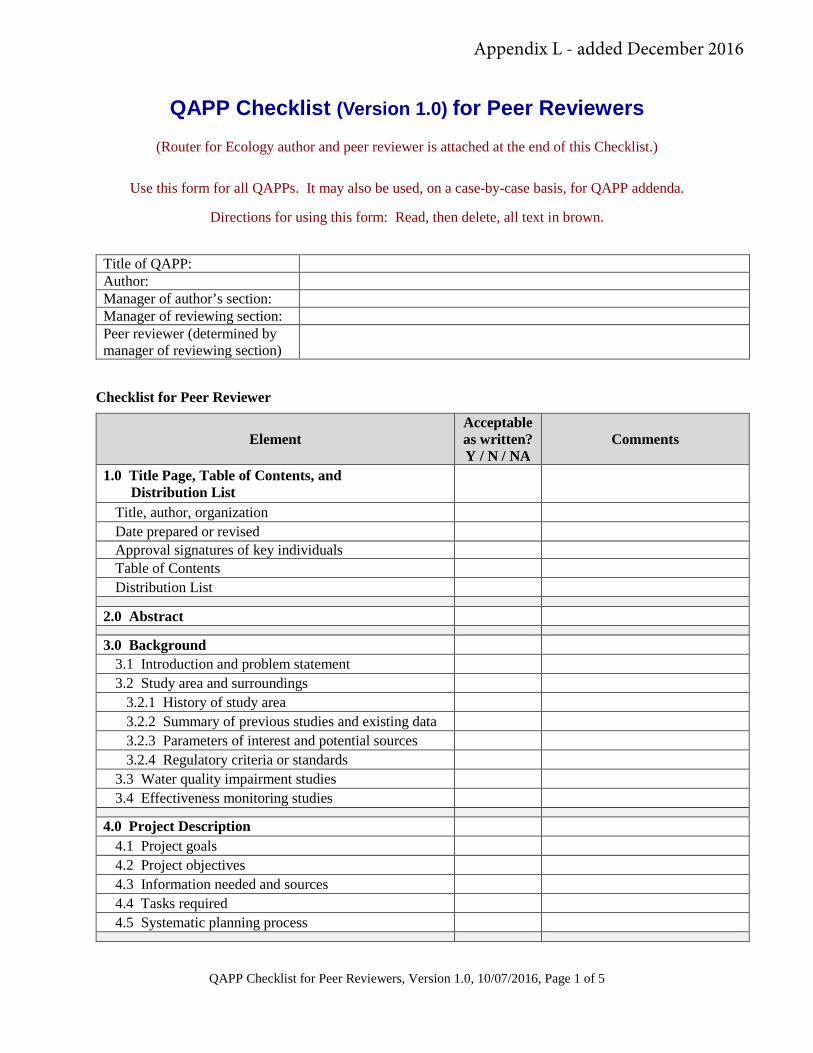
QAPP Checklist for Peer Reviewers, Version 1.0, 10/07/2016, Page 1 of 5
QAPP Checklist (Version 1.0) for Peer Reviewers (Router for Ecology author and peer reviewer is attached at the end of this Checklist.)
Use this form for all QAPPs. It may also be used, on a case-by-case basis, for QAPP addenda.
Directions for using this form: Read, then delete, all text in brown.
Title of QAPP: Author: Manager of author’s section: Manager of reviewing section: Peer reviewer (determined by manager of reviewing section)
Checklist for Peer Reviewer
Element Acceptable as written? Y / N / NA
Comments
1.0 Title Page, Table of Contents, and Distribution List
Title, author, organization Date prepared or revised Approval signatures of key individuals Table of Contents Distribution List
2.0 Abstract
3.0 Background 3.1 Introduction and problem statement 3.2 Study area and surroundings 3.2.1 History of study area 3.2.2 Summary of previous studies and existing data 3.2.3 Parameters of interest and potential sources 3.2.4 Regulatory criteria or standards 3.3 Water quality impairment studies 3.4 Effectiveness monitoring studies
4.0 Project Description 4.1 Project goals
4.2 Project objectives 4.3 Information needed and sources 4.4 Tasks required 4.5 Systematic planning process
Appendix L - added December 2016
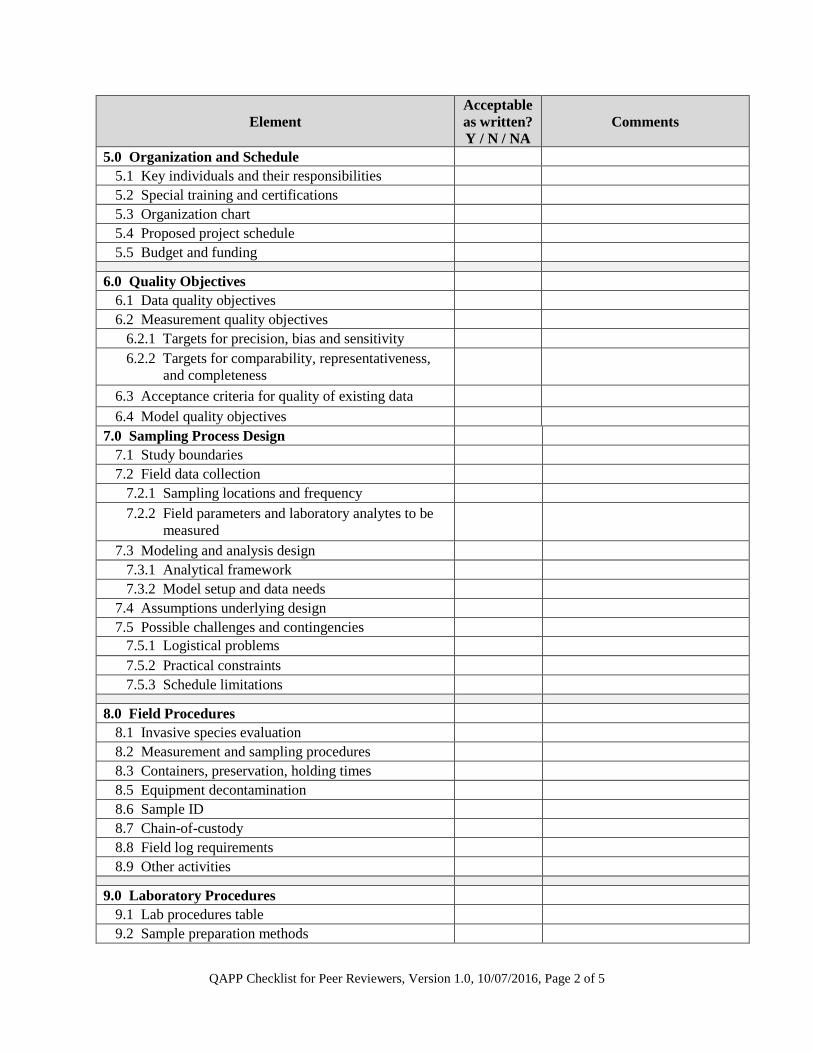
QAPP Checklist for Peer Reviewers, Version 1.0, 10/07/2016, Page 2 of 5
Element Acceptable as written? Y / N / NA
Comments
5.0 Organization and Schedule 5.1 Key individuals and their responsibilities 5.2 Special training and certifications 5.3 Organization chart 5.4 Proposed project schedule 5.5 Budget and funding
6.0 Quality Objectives
6.1 Data quality objectives 6.2 Measurement quality objectives 6.2.1 Targets for precision, bias and sensitivity 6.2.2 Targets for comparability, representativeness,
and completeness
6.3 Acceptance criteria for quality of existing data 6.4 Model quality objectives
7.0 Sampling Process Design 7.1 Study boundaries 7.2 Field data collection 7.2.1 Sampling locations and frequency 7.2.2 Field parameters and laboratory analytes to be
measured
7.3 Modeling and analysis design 7.3.1 Analytical framework 7.3.2 Model setup and data needs 7.4 Assumptions underlying design 7.5 Possible challenges and contingencies 7.5.1 Logistical problems
7.5.2 Practical constraints 7.5.3 Schedule limitations
8.0 Field Procedures
8.1 Invasive species evaluation 8.2 Measurement and sampling procedures 8.3 Containers, preservation, holding times 8.5 Equipment decontamination 8.6 Sample ID 8.7 Chain-of-custody 8.8 Field log requirements 8.9 Other activities
9.0 Laboratory Procedures 9.1 Lab procedures table 9.2 Sample preparation methods
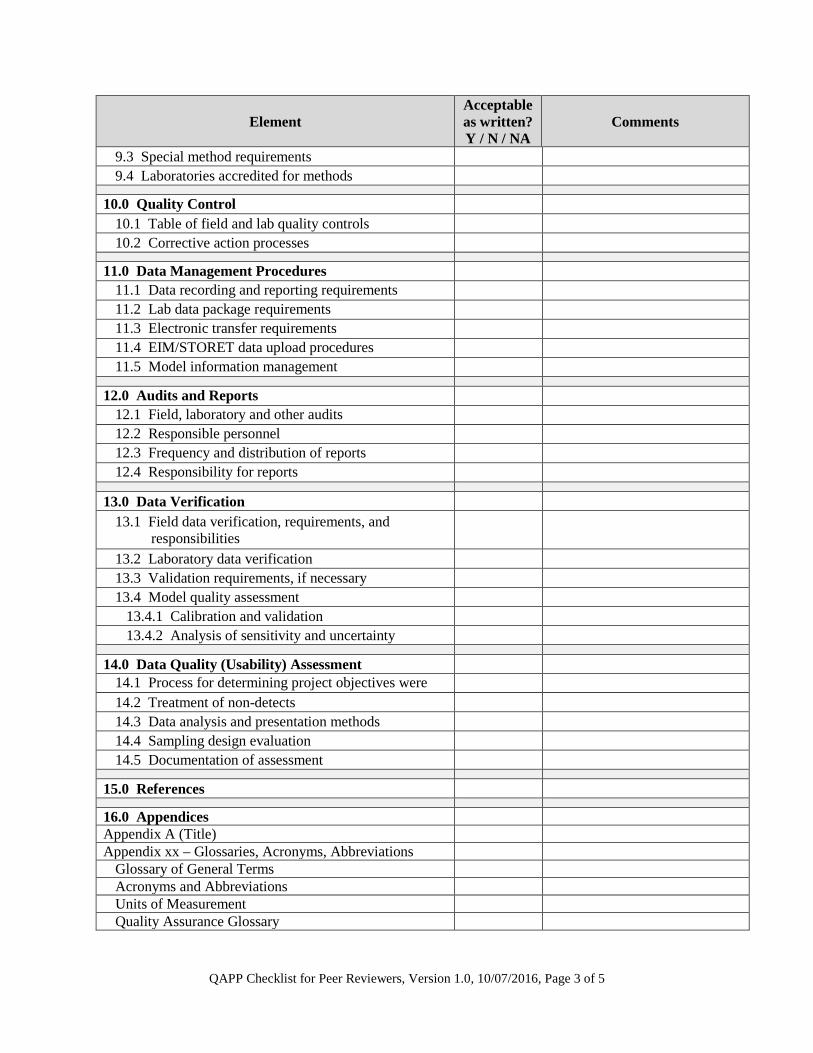
QAPP Checklist for Peer Reviewers, Version 1.0, 10/07/2016, Page 3 of 5
Element Acceptable as written? Y / N / NA
Comments
9.3 Special method requirements 9.4 Laboratories accredited for methods
10.0 Quality Control
10.1 Table of field and lab quality controls 10.2 Corrective action processes
11.0 Data Management Procedures
11.1 Data recording and reporting requirements 11.2 Lab data package requirements 11.3 Electronic transfer requirements 11.4 EIM/STORET data upload procedures 11.5 Model information management
12.0 Audits and Reports
12.1 Field, laboratory and other audits 12.2 Responsible personnel 12.3 Frequency and distribution of reports 12.4 Responsibility for reports
13.0 Data Verification
13.1 Field data verification, requirements, and responsibilities
13.2 Laboratory data verification 13.3 Validation requirements, if necessary 13.4 Model quality assessment 13.4.1 Calibration and validation 13.4.2 Analysis of sensitivity and uncertainty
14.0 Data Quality (Usability) Assessment
14.1 Process for determining project objectives were
14.2 Treatment of non-detects 14.3 Data analysis and presentation methods 14.4 Sampling design evaluation 14.5 Documentation of assessment
15.0 References
16.0 Appendices Appendix A (Title) Appendix xx – Glossaries, Acronyms, Abbreviations
Glossary of General Terms Acronyms and Abbreviations Units of Measurement Quality Assurance Glossary
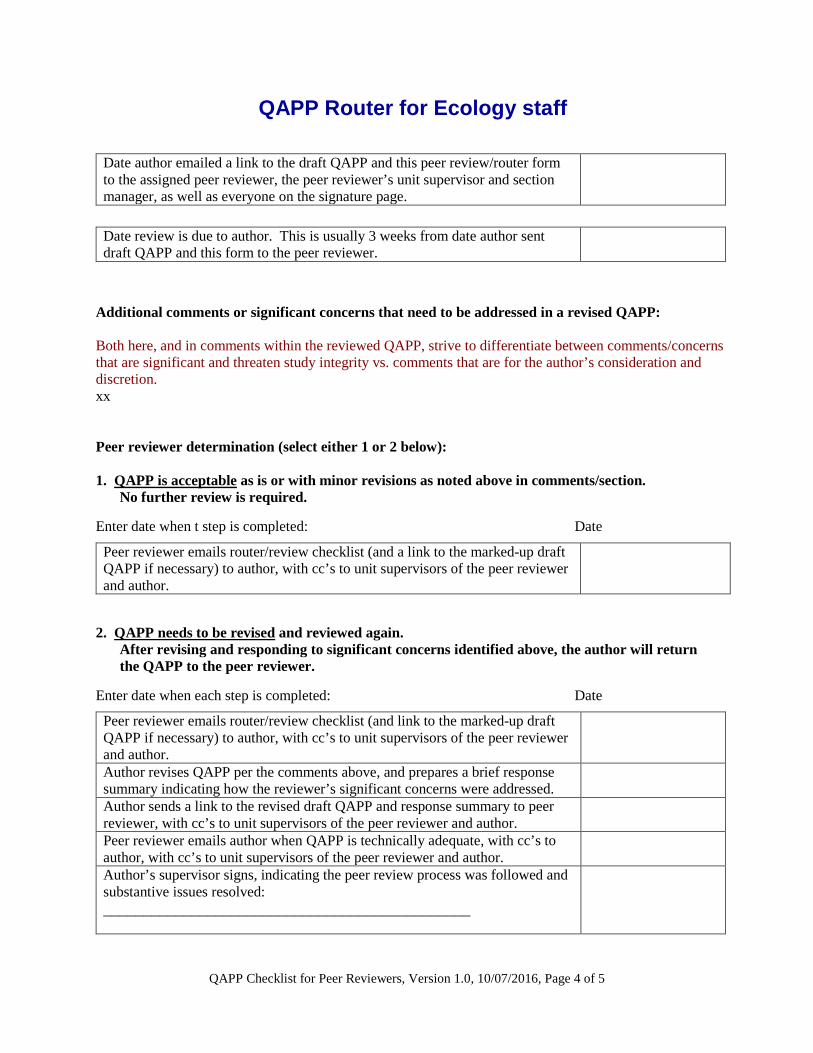
QAPP Checklist for Peer Reviewers, Version 1.0, 10/07/2016, Page 4 of 5
QAPP Router for Ecology staff
Date author emailed a link to the draft QAPP and this peer review/router form to the assigned peer reviewer, the peer reviewer’s unit supervisor and section manager, as well as everyone on the signature page.
Date review is due to author. This is usually 3 weeks from date author sent draft QAPP and this form to the peer reviewer.
Additional comments or significant concerns that need to be addressed in a revised QAPP: Both here, and in comments within the reviewed QAPP, strive to differentiate between comments/concerns that are significant and threaten study integrity vs. comments that are for the author’s consideration and discretion. xx Peer reviewer determination (select either 1 or 2 below): 1. QAPP is acceptable as is or with minor revisions as noted above in comments/section.
No further review is required.
Enter date when t step is completed: Date
Peer reviewer emails router/review checklist (and a link to the marked-up draft QAPP if necessary) to author, with cc’s to unit supervisors of the peer reviewer and author.
2. QAPP needs to be revised and reviewed again.
After revising and responding to significant concerns identified above, the author will return the QAPP to the peer reviewer.
Enter date when each step is completed: Date
Peer reviewer emails router/review checklist (and link to the marked-up draft QAPP if necessary) to author, with cc’s to unit supervisors of the peer reviewer and author.
Author revises QAPP per the comments above, and prepares a brief response summary indicating how the reviewer’s significant concerns were addressed.
Author sends a link to the revised draft QAPP and response summary to peer reviewer, with cc’s to unit supervisors of the peer reviewer and author.
Peer reviewer emails author when QAPP is technically adequate, with cc’s to author, with cc’s to unit supervisors of the peer reviewer and author.
Author’s supervisor signs, indicating the peer review process was followed and substantive issues resolved: ______________________________________________
Revision history for this peer review/router form
Version date Version number Summary of substantive changes Sections Reviser
initials 12/18/2013 6/23/2014 Document control inadequate for previous versions BK, TG,
and others
10/07/2016 1.0 Modified headers to match QAPP Template Version 2.0
Sections 3-9, 11, 13, 16-17 T Gries
11/9/2016 1.0 QA approval for document control information All pages B Kammin