guidelines for the collection of continuous stream … · guidelines for the collection of...
TRANSCRIPT
Prepared in cooperation with the U.S. Fish and Wildlife Service
Guidelines for the Collection of Continuous Stream Water-Temperature Data in Alaska
U.S. Department of the InteriorU.S. Geological Survey
Open-File Report 2014–1182

Guidelines for the Collection of Continuous Stream Water-Temperature Data in Alaska
By Ryan C. Toohey, Edward G. Neal, and Gary L. Solin
Prepared in cooperation with the U.S. Fish and Wildlife Service
Open-File Report 2014–1182
U.S. Department of the Interior U.S. Geological Survey

U.S. Department of the Interior SALLY JEWELL, Secretary
U.S. Geological Survey Suzette M. Kimball, Acting Director
U.S. Geological Survey, Reston, Virginia: 2014
For more information on the USGS—the Federal source for science about the Earth, its natural and living resources, natural hazards, and the environment—visit http://www.usgs.gov or call 1–888–ASK–USGS
For an overview of USGS information products, including maps, imagery, and publications, visit http://www.usgs.gov/pubprod
To order this and other USGS information products, visit http://store.usgs.gov
Suggested citation: Toohey, R.C., Neal, E.G., and Solin, G.L., 2014, Guidelines for the collection of continuous stream water-temperature data in Alaska: U.S. Geological Survey Open-File Report 2014-1182, 34 p., http://dx.doi.org/10.3133/ofr20141182. ISSN 2331-1258 (online)
Any use of trade, firm, or product names is for descriptive purposes only and does not imply endorsement by the U.S. Government.
Although this information product, for the most part, is in the public domain, it also may contain copyrighted materials as noted in the text. Permission to reproduce copyrighted items must be secured from the copyright owner.
iii
Contents Abstract ...................................................................................................................................................................... 1 Introduction ................................................................................................................................................................. 2 Purpose and Scope .................................................................................................................................................... 2 Preparation ................................................................................................................................................................. 3
Developing a Study Plan ......................................................................................................................................... 3 Site Selection .......................................................................................................................................................... 3 Equipment Selection and Deployment .................................................................................................................... 4
Recording Temperature Sensors ........................................................................................................................ 4 Programming Recording Intervals ....................................................................................................................... 5 Field Instruments ................................................................................................................................................. 5 Field Thermometer and Temperature Sensor Accuracy Check Procedures........................................................ 5
Training ................................................................................................................................................................... 6 Field Procedures ......................................................................................................................................................... 7
Site Selection and Installation Procedures for Continuous Measurement Sensors ................................................. 7 Site Visits and Field Measurements ........................................................................................................................ 9
Stream Temperature Cross Sections Using the Equal Width Increment Method .............................................. 13 Routine Site Visits ............................................................................................................................................. 13
Record Computation ................................................................................................................................................. 14 Data-Processing Procedures ................................................................................................................................ 14
Initial Data Evaluation ........................................................................................................................................ 15 Data Corrections ............................................................................................................................................... 22 Final Data Evaluation ........................................................................................................................................ 24
Reporting .............................................................................................................................................................. 24 Station Description ............................................................................................................................................ 25 Station Analysis ................................................................................................................................................. 25 Data Reporting .................................................................................................................................................. 26
Data Processing Packages and Database Management ...................................................................................... 26 Database Management ..................................................................................................................................... 28
Summary .................................................................................................................................................................. 28 References Cited ...................................................................................................................................................... 29 Appendix 1. Photograph showing Example of a Self-Contained Temperature Recording Devise and Protective Housing .................................................................................................................................................... 31 Appendix 2. Example of a Station Analysis for Water Temperature on Terror River near Kodiak, Alaska ................ 32
Figures Figure 1. Photograph of Mendenhall River, southeastern Alaska, showing poor mixing conditions during winter low-flow conditions because of groundwater inflow near the bank. ................................................................. 8 Figure 2. Example of a stream temperature cross section showing the location of vertical temperature measurements using the Equal Width Increment method........................................................................................ 10 Figure 3. Example field-inspection sheet for a continuous water-temperature monitoring site showing inspection and cross-section survey information ..................................................................................................... 11
iv
Figure 4. Example of smooth diurnal patters in water temperature as taken from a properly functioning water temperature recording sensor, Old Tom Creek near Kasaan, Alaska, June–July 2011. .......................................... 16 Figure 5. Water temperature and repeated burial of temperature sensor at Unuk River below Blue River near Wrangell, Alaska, July 16–August 29, 2003............................................................................................................. 17 Figure 6. Raw water temperature values, including erroneous data resulting from sensor dewatering, at Kadashan River above Hook Creek near Tenakee, Alaska, June-July 1998 ....................................................... 18 Figure 7. Raw water-temperature data, including erroneous record of sub-zero water temperatures resulting from a sensor frozen in ice, at Upper Earl West Creek near Wrangell, Alaska, December 23, 2004–January 21, 2005 ........................................................................................................................................... 20 Figure 8. Water-temperature data taken from a properly functioning temperature sensor on a stream with intermittent ice cover at the Situk River near Yakutat, Alaska, December 14, 2008–January 14, 2009 ................... 21 Figure 9. Two-point variable correction for calibration drift of a temperature sensor at Kenai River at Cooper Landing, Alaska, October 26–December 22, 2011...................................................................................... 23 Figure 10. Example of daily maximum, minimum, and mean water temperature taken from an annual thermograph for Staney Creek near Klawock, Alaska, water year 2006 ................................................................. 27
Table Table 1. Typical data problems with stream water temperature sensors. ................................................................ 15
Conversion Factors Inch/Pound to SI
Multiply By To obtain
Length
foot (ft) 0.3048 meter (m)
Volume gallon (gal) 3.785 liter (L)
gallon (gal) 0.003785 cubic meter (m3)
gallon (gal) 3.785 cubic decimeter (dm3) Temperature in degrees Celsius (°C) may be converted to degrees Fahrenheit (°F) as follows:
°F=(1.8×°C)+32.
1
Guidelines for the Collection of Continuous Stream Water-Temperature Data in Alaska
By Ryan C. Toohey, Edward G. Neal, and Gary L. Solin
Abstract Objectives of stream monitoring programs differ considerably among many of the academic,
Federal, state, tribal, and non-profit organizations in the state of Alaska. Broad inclusion of stream-temperature monitoring can provide an opportunity for collaboration in the development of a statewide stream-temperature database. Statewide and regional coordination could reduce overall monitoring cost, while providing better analyses at multiple spatial and temporal scales to improve resource decision-making. Increased adoption of standardized protocols and data-quality standards may allow for validation of historical modeling efforts with better projection calibration. For records of stream water temperature to be generally consistent, unbiased, and reproducible, data must be collected and analyzed according to documented protocols. Collection of water-temperature data requires definition of data-quality objectives, good site selection, proper selection of instrumentation, proper installation of sensors, periodic site visits to maintain sensors and download data, pre- and post-deployment verification against an NIST-certified thermometer, potential data corrections, and proper documentation, review, and approval. A study created to develop a quality-assurance project plan, data-quality objectives, and a database management plan that includes procedures for data archiving and dissemination could provide a means to standardize a statewide stream-temperature database in Alaska. Protocols can be modified depending on desired accuracy or specific needs of data collected. This document is intended to guide users in collecting time series water-temperature data in Alaskan streams and draws extensively on the broader protocols already published by the U.S. Geological Survey.
2
Introduction Water temperature is one of the most significant factors in the health of a stream ecosystem
(Stevens and others, 1975; U.S. Geological Survey, 2006a). Depending on the type of stream and its location, the natural flora and fauna establish themselves in ranges delineated by temperature. Stream temperature affects various fish species populations by influencing physical, chemical, and biological water properties (Kyle and Brabets, 2001; Alaska Department of Environmental Conservation, 2012). Water temperature also affects invertebrate and aquatic plant growth and can be subject to environmental regulation and monitoring by State, Federal, and local agencies. Accurate water temperature data are needed to document thermal alterations to the environment caused by natural phenomena and human activities (Kelleher and others, 2012). Anthropogenic or natural alterations may change timing, magnitude, frequency and (or) duration of water-temperature conditions. Additionally, determination of many other important water-quality parameters relies on accurate water temperature data. Temperature affects the density of water, the rate of chemical reactions, biological activity and the solubility of constituents (such as oxygen) in water, pH, and specific conductance (U.S. Geological Survey, 2006b).
In November 2012, the Western Alaska Landscape Conservation Cooperative, the Northwest Boreal Forest Landscape Conservation Cooperative, and the Alaska Climate Science Center hosted a stream and lake temperature-monitoring workshop in Anchorage, Alaska (Reynolds and others, 2013). Water-temperature data are collected by many of the academic, Federal, state, tribal and non-profit organizations in the State of Alaska at different spatial and temporal resolutions (http://aknhp.uaa.alaska.edu/aquatic-ecology/akoats/). Each one of these entities has its own procedures and instrumentation to measure water temperature in Alaskan streams. One of the primary goals of the workshop was to discuss the possibility of developing a statewide stream-temperature-monitoring program in Alaska with different data contributors. Because of these differences in resolution, procedures, and instrumentation, this report was produced o offer adaptable standardized protocols for continuous water-temperature monitoring in data measurement, collection, storage, and analysis. For Federal fiscal years 2014–15, the Western Alaska Landscape Conservation Cooperative has committed to facilitating advancements in water-temperature monitoring and its connections to temperature change, other physical and hydrological processes, and biological resources (Reynolds and others, 2013).
Purpose and Scope This report describes procedures to collect, process, and report continuous temperature data at
stream temperature monitoring stations located in various settings in Alaska, with a particular emphasis on temperature monitoring in cooler climates. Standardized procedures that could be used by organizations to collect and manage continuous temperature data at stream monitoring stations located in various settings are described. Many of the protocols in this document are derived from U.S. Geological Survey (USGS) National Field Manual, chapter 6.1 (U.S. Geological Survey, 2006a) and USGS Techniques and Methods, Book 1, chapter D3 (Wagner and others, 2006). These resources also should be referenced for additional data-quality standards and more details in documentation of protocols.
3
Preparation Developing a Study Plan
The primary factors to consider in selecting a water-temperature monitoring site are the purpose of monitoring and the objectives of data collection. Often, the objective of data collection is selecting a location that represents the average condition of a reach. However, another common purpose might be to collect water-temperature data at a specific location (that is, where fish spawn, and so on) rather than a location that simply represents the average condition of the reach. Data collection objectives can describe the data methodology, instruments, and type of records. In conjunction with the study purpose, data collection objectives should be developed for the amount or duration of data collection (that is, 1,000 records or 5 years) or the accuracy of the data to be collected (that is, temperature sensors that have an accuracy of ≤ 0.2 °C). The data collection objectives should be stated in a quality-assurance plan written at the initiation of the project. The preferred quality-assurance plan is one specifically written for the study. Quality-assurance plan templates are provided by many different agencies or groups (Alaska Department of Environmental Conservation, 2011, Zender, 2014). Alternatively, a generic plan that describes a region-wide water-temperature data-collection program also can be used. All other factors used in the site selection process should be balanced against the purpose and objectives of the study (U.S. Geological Survey, 2006a; Wagner and others, 2006).
Site Selection Site selection depends on the purpose of the study. The location of the temperature sensor in the
stream channel may be the most important factor in collecting representative water-temperature data. Sites are ideally located where good mixing characteristics assure an even temperature distribution. If possible, braided channel reaches, backwater or slough areas, and shallow riffles should be avoided. These areas often do not have homogeneous temperature cross-sections or can provide challenges for keeping temperature sensors submerged in the water year round. However, another common purpose of study includes determining the effect of certain points (that is, tributaries, facilities that discharge water, and so on) on stream temperature. For these purposes, the data-quality objective may be to understand how mixing of different water bodies occurs.
Obtaining recorded measurements representative of the water body typically is an important data-collection objective. To achieve this objective, the temperature sensor should be placed in a location that represents the water body being measured. The sensor should be installed in the stream or water body such that recorded water temperature is unaffected by the installation. Cross-section surveys of water temperature should be made to determine the most representative location for placement. A site should not be selected without first determining that the temperature distribution is uniform throughout the cross section. Sufficient measurements must be made at the cross section to determine the degree of mixing at the prospective site under different flow conditions and to verify that cross-sectional temperature variability does not exceed that needed to meet data collection objectives. Cross-sectional temperature variability should be as minimal as possible, but those requirements are ultimately determined by the study’s data-quality objectives. Finally, a survey for human, bear, or beaver (or other biotic influence) activity may be an additional consideration when locating a sensor.
4
Equipment Selection and Deployment The selection of a water-temperature monitoring instrument to collect water temperature
involves three major interrelated elements: (1) the purpose of the data collection, (2) the type of installation, and (3) the duration, accuracy, and precision requirements of the data-collection objectives (U.S. Geological Survey, 2006a; Wagner and others, 2006). Other factors to consider include sensor memory capacity, price, battery life, programming versatility, and durability. General calibration procedures for temperature sensors are described in this report. However, because of the large number of manufacturers and models, the manufacturers’ instructions and recommendations should be carefully followed. Finally, with each new instrument, it is good practice to record calibrations, maintenance, and history of use in a log book.
Recording Temperature Sensors There are many manufacturers and models of temperature sensors and data loggers. Many of
these configurations are self-contained units that both measure and record temperature data. In some cases, temperature may be measured using a temperature sensor attached to a shore based data logging device that can be used to record various environmental parameters. When selecting a temperature sensor it is important to consider how the device will be installed and if features of the temperature sensor will satisfy data collection objectives. Most manufacturers provide product specifications. However, the user should verify the accuracy claimed by the manufacturer for the range of application. At a minimum, the data-quality objectives of most temperature-monitoring efforts will likely be met if the instruments have an accuracy of ±0.2 °C or less.
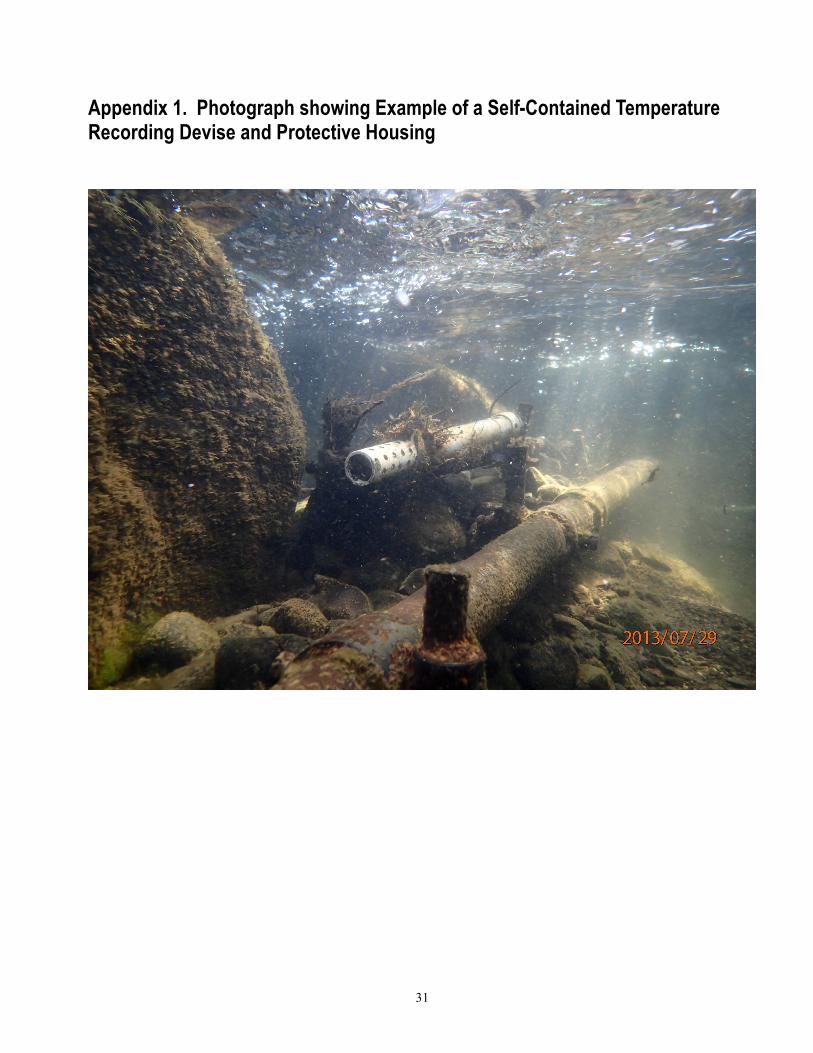
Even durable temperature sensors can be damaged or lost in the harsh environmental conditions encountered in most streams. Flood flows often transport large amounts of sediment and debris and are capable of scouring study reaches or burying sensors. Similarly, in Alaska’s cold climates, ice break-up events can damage or transport sensors that are not suitably secured and protected. Most temperature sensors should be in protective housing and have anchors at sites where there is the possibility of loss or damage. The type of protective housing will depend on the selected temperature sensor and installation method. An example of a typical recording temperature sensor and protective housing are provided in appendix 1. Because of their greater precision, submersible temperature sensors mounted in durable flow-through housings are preferred over non-submersible temperature sensors installed in sealed waterproof housings (Dunham and others (2005).
5
Programming Recording Intervals The recording time interval is determined by the data collection objectives, storage capacity of
the recorder, time between field visits, and the magnitude of diurnal (daily) temperature fluctuations. Desired recording intervals should be defined in the quality-assurance plan prior to temperature sensor installation. Longer recording intervals result in reduced temporal resolution that may fail to record the actual range of temperature variation at a site. This is particularly important if instantaneous measurements of temperature such as the daily maximum or minimum are critical data collection objectives. In most cases, a recording interval of 30 minutes should provide adequate resolution to determine actual daily maximum and minimum temperature values. A shorter interval of 15 minutes might be necessary to provide suitable resolution on smaller rivers and streams that are subject to large or rapid variations in temperature. Longer intervals of 60 minutes might be appropriate on larger rivers where temperature change could be somewhat slower due to the size of river. In Alaska, monitoring sites might be remote with limited site visits; therefore, memory capacity available between site visits needs to be sufficient for the data-recording interval.
Field Instruments Field temperature sensors are used during site visits to verify that recording sensors are operating
correctly, to provide an independent check of temperature changes during the site visit, and to make cross-sectional surveys to verify that the recording sensor is providing temperature data representative of the stream cross section. Digital readout thermistors are the most commonly used device for collecting field measurements of water temperature. A thermistor is a type of resistor whose resistance varies with temperature. Similar to recording sensors, there are many manufacturers and models of digital field thermistors. A suitable field thermistor should have an accuracy of ± 0.2 °C or less. Most manufacturers of digital thermistors provide detailed information on the accuracy of their instruments. Thermistors that are traceable to National Institute of Standards and Technology (NIST) standards are available and reliable. Users should verify the accuracy claimed by the manufacturer for the range of application. Regardless of the type of temperature sensor selected for field measurements it should be transported in a protective case designed to reduce shock and vibration.
Field Thermometer and Temperature Sensor Accuracy Check Procedures For temperature measurements, an accuracy check at specified temperatures is done using a
thermometer that is certified by the NIST, is manufacturer-certified as NIST traceable and carries a current NIST certification, or is NIST-traceable certified that is no more than 2 years old or still current according to the manufacturer. The desired accuracy for the NIST thermometer is ±0.1 °C or less. If a field instrument fails the accuracy check (typically agreement within ±0.2 °C of the reference instrument), it should not be used. Some thermistors can be calibrated following the manufacturer’s instructions and some may need to be returned to the manufacturer if they fail the accuracy check. Field instrument checks should be performed at least once every year. More frequent accuracy checks may be needed based on manufacturer’s recommendations or to meet data collection objectives. The actual time between instrument checks depends on manufacturer recommendations, frequency of thermometer use, and the conditions to which it has been subjected during field operations and storage, or if consistent differences are noted between a field thermistor and installed temperature sensors. Recording sensors should undergo a calibration check prior to and after installation.
6
Users can do the annual check of field thermistors an office or laboratory, or can have the checks done at an NIST-accredited commercial laboratory. To check a thermistor, test its readings across a range of temperatures as described in the instructions for water-bath calibration check procedures. Calibration checks should bracket the temperature range expected to be detected in the field. It is recommended that the thermistor be checked at five values (a minimum of three) between 0.0 and 40 °C, which is typically less than or greater than most flowing stream temperature minimums and maximums recorded in natural streams. Any digital thermistors checked that differ by more than 0.2 °C from the NIST laboratory thermometer should not be used (U.S. Geological Survey, 2006a).
Accuracy Check Procedures
• Fully submerge the thermistor into a refrigerated water bath. If a commercial refrigerated water bath is not available, an insulated 5 gal container may be used. A mixing device is required to circulate the water in the container. Fill the container with water near the desired temperature and allow the temperature of the bath to stabilize for several minutes. When checking recording temperature sensors, set the recording interval to 1 minute (or less) and keep the sensors submerged. Keep calibration and field temperature sensors submerged throughout the calibration process without contacting the sides or bottom of the insulated container.
• With the water circulating, the water temperature should stabilize. At this point, record the time, water temperature value measured from the NIST thermometer, and water temperature measured from the field thermistor. Compare the NIST thermometer value with each of the temperature measuring devices being checked. If a recording temperature sensor does not have a display, then complete the comparison after downloading the recorded data. Repeat this step for the three or more temperatures to be checked. Record all thermometer readings throughout the warming and cooling periods and while maintaining circulation of the water.
• Check meter batteries periodically for proper voltage when using a thermistor. • Record the calibration check data in the instrument log book for each thermometer, including
thermistor-containing field meters. Maintenance performed or repairs by the manufacturer should be noted in the instrument log book.
Training Training of field personnel is critical to ensure collection of high quality water-temperature data.
Training should include data collection methods, procedures, and equipment operation. There are a wide variety of temperature data recording devices and thermometers. Field personnel should be trained in the data collection activities including operation, programming, and data management tools for each type of temperature sensor used. Project leaders and experienced data collection personnel familiar with continuous water-temperature monitoring should design and conduct the training.
7
Field Procedures Site Selection and Installation Procedures for Continuous Measurement Sensors
Generally, the most important data collection objective for continuous water-temperature monitoring sites is that the temperature sensor records water-temperature data representative of the actual stream temperature. Prior to temperature sensor installation, surveys of the cross-sectional variability of water temperature are needed to determine if the site can readily provide a representative temperature record. Ideally, a number of cross-sectional surveys representing a range of flow and seasonal conditions would be collected to determine if discharges or seasonal changes affect spatial patterns of water temperature variability at the site prior to the installation of a temperature sensor. For reconnaissance purposes, this typically can be done quickly in a small stream by submersing a field thermistor in the stream and noting water temperature as the cross section is traversed. After a potentially suitable site is identified, detailed and systematic temperature measurements of the cross section will be required. Detailed instructions for recording cross-sectional temperature measurements are provided in the section, “Site Visits and Field Measurements.”
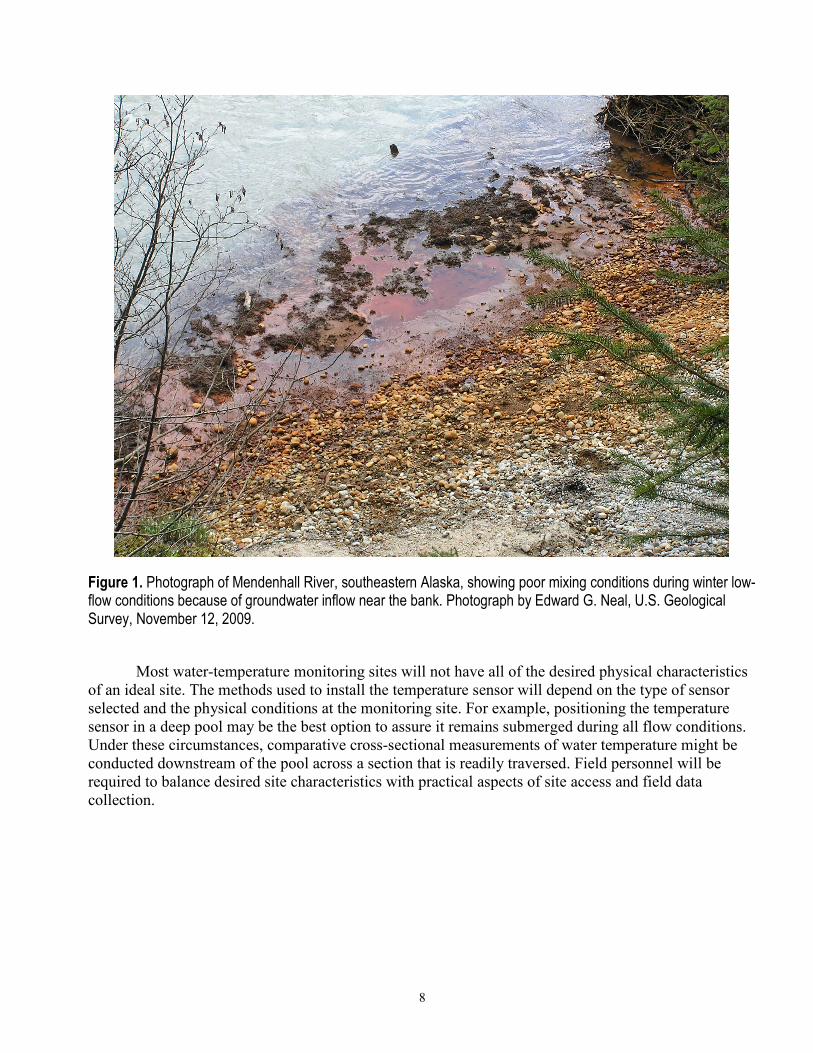
Stream cross sections that exhibit good mixing characteristics and even temperature distributions during high or moderate flows may have poor mixing and uneven temperature distributions during low-flow periods. For example, figure 1 shows a glacier stream that is laterally stratified during winter low-flow conditions because of warmer groundwater inflow near the bank. This same reach is well mixed and thermally homogeneous during the runoff season. Because of these types of conditions, site reconnaissance and installation should be conducted during low-flow conditions if possible.
In addition to having a homogeneous temperature distribution across the monitoring cross section, a good monitoring reach should be straight and have a uniformly shaped channel (Rantz and others, 1982). There should be no tributaries immediately upstream of the reach unless the purpose of the temperature measurements is to look at mixing from different sources. Mean cross-sectional stream velocities should be uniform temperature across the section. The water-temperature sensor should be located such that it remains submerged under low flow conditions. Ideally, the depth of water over the sensor should be at least 1 ft, although this may not always be practical under all flow conditions or in smaller streams. The sensor should not be located in a position where it could be frequently buried with streambed sediments or have direct exposure to sunlight. If possible, more than one sensor may be installed at each monitoring site to ensure redundancy, to minimize data loss resulting from malfunction or operator error, and to allow for data comparison.
8
Figure 1. Photograph of Mendenhall River, southeastern Alaska, showing poor mixing conditions during winter low-flow conditions because of groundwater inflow near the bank. Photograph by Edward G. Neal, U.S. Geological Survey, November 12, 2009.
Most water-temperature monitoring sites will not have all of the desired physical characteristics
of an ideal site. The methods used to install the temperature sensor will depend on the type of sensor selected and the physical conditions at the monitoring site. For example, positioning the temperature sensor in a deep pool may be the best option to assure it remains submerged during all flow conditions. Under these circumstances, comparative cross-sectional measurements of water temperature might be conducted downstream of the pool across a section that is readily traversed. Field personnel will be required to balance desired site characteristics with practical aspects of site access and field data collection.
9
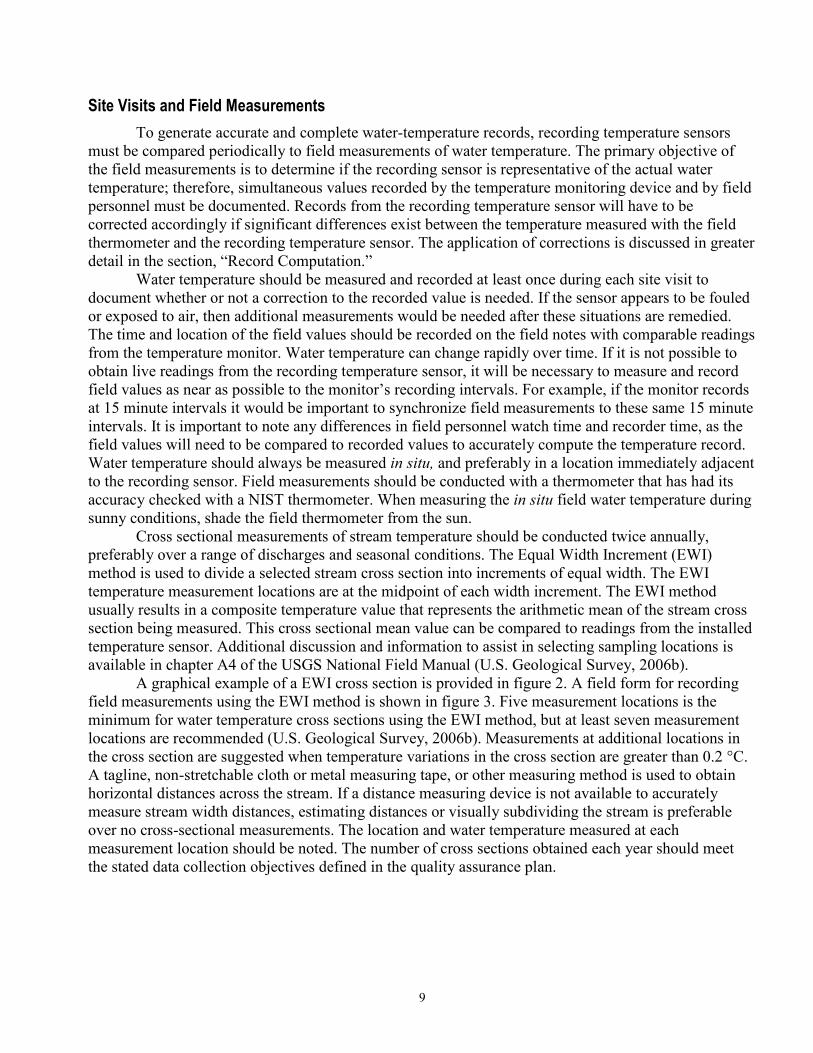
Site Visits and Field Measurements To generate accurate and complete water-temperature records, recording temperature sensors
must be compared periodically to field measurements of water temperature. The primary objective of the field measurements is to determine if the recording sensor is representative of the actual water temperature; therefore, simultaneous values recorded by the temperature monitoring device and by field personnel must be documented. Records from the recording temperature sensor will have to be corrected accordingly if significant differences exist between the temperature measured with the field thermometer and the recording temperature sensor. The application of corrections is discussed in greater detail in the section, “Record Computation.”
Water temperature should be measured and recorded at least once during each site visit to document whether or not a correction to the recorded value is needed. If the sensor appears to be fouled or exposed to air, then additional measurements would be needed after these situations are remedied. The time and location of the field values should be recorded on the field notes with comparable readings from the temperature monitor. Water temperature can change rapidly over time. If it is not possible to obtain live readings from the recording temperature sensor, it will be necessary to measure and record field values as near as possible to the monitor’s recording intervals. For example, if the monitor records at 15 minute intervals it would be important to synchronize field measurements to these same 15 minute intervals. It is important to note any differences in field personnel watch time and recorder time, as the field values will need to be compared to recorded values to accurately compute the temperature record. Water temperature should always be measured in situ, and preferably in a location immediately adjacent to the recording sensor. Field measurements should be conducted with a thermometer that has had its accuracy checked with a NIST thermometer. When measuring the in situ field water temperature during sunny conditions, shade the field thermometer from the sun.
Cross sectional measurements of stream temperature should be conducted twice annually, preferably over a range of discharges and seasonal conditions. The Equal Width Increment (EWI) method is used to divide a selected stream cross section into increments of equal width. The EWI temperature measurement locations are at the midpoint of each width increment. The EWI method usually results in a composite temperature value that represents the arithmetic mean of the stream cross section being measured. This cross sectional mean value can be compared to readings from the installed temperature sensor. Additional discussion and information to assist in selecting sampling locations is available in chapter A4 of the USGS National Field Manual (U.S. Geological Survey, 2006b).
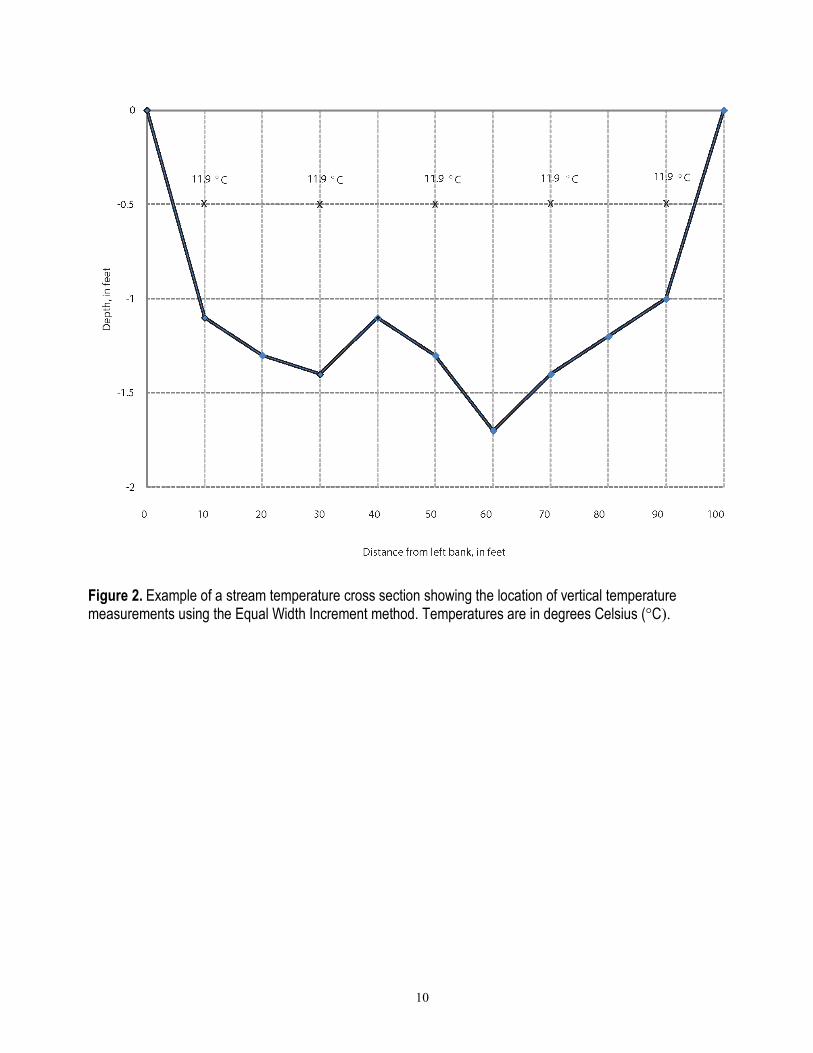
A graphical example of a EWI cross section is provided in figure 2. A field form for recording field measurements using the EWI method is shown in figure 3. Five measurement locations is the minimum for water temperature cross sections using the EWI method, but at least seven measurement locations are recommended (U.S. Geological Survey, 2006b). Measurements at additional locations in the cross section are suggested when temperature variations in the cross section are greater than 0.2 °C. A tagline, non-stretchable cloth or metal measuring tape, or other measuring method is used to obtain horizontal distances across the stream. If a distance measuring device is not available to accurately measure stream width distances, estimating distances or visually subdividing the stream is preferable over no cross-sectional measurements. The location and water temperature measured at each measurement location should be noted. The number of cross sections obtained each year should meet the stated data collection objectives defined in the quality assurance plan.
10
Figure 2. Example of a stream temperature cross section showing the location of vertical temperature measurements using the Equal Width Increment method. Temperatures are in degrees Celsius (°C).

11
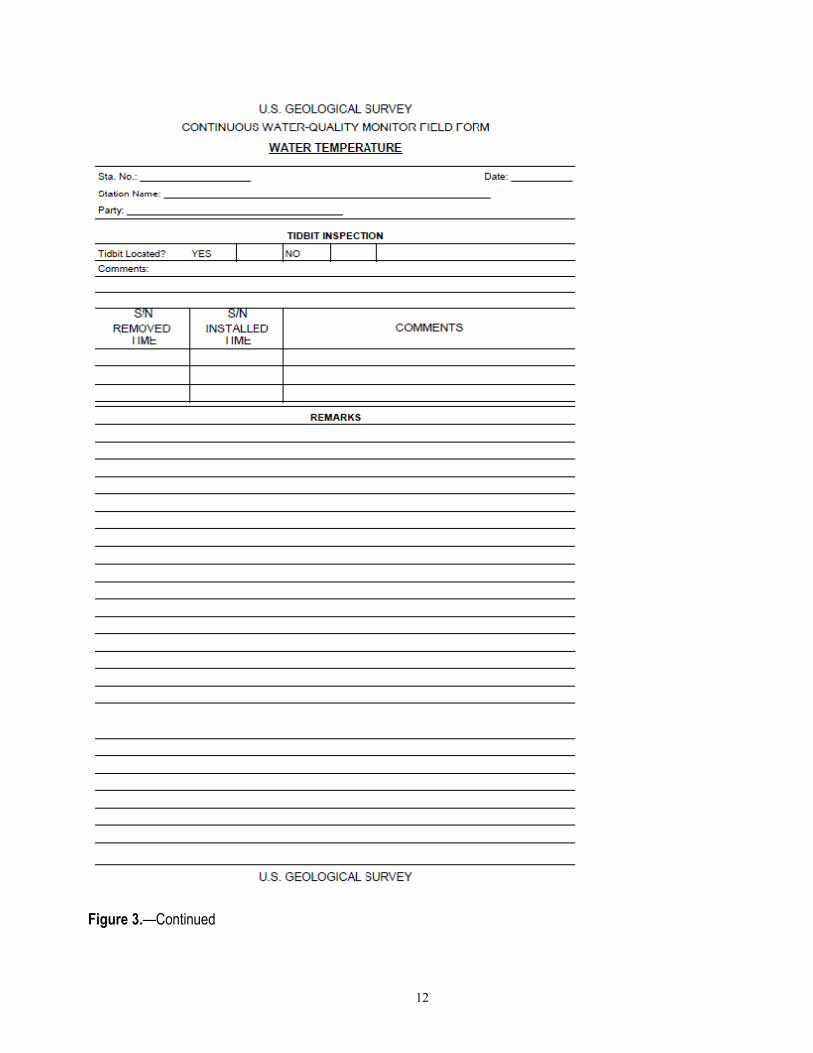
Figure 3. Example field-inspection sheet for a continuous water-temperature monitoring site showing inspection and cross-section survey information.
12
Figure 3.—Continued
13
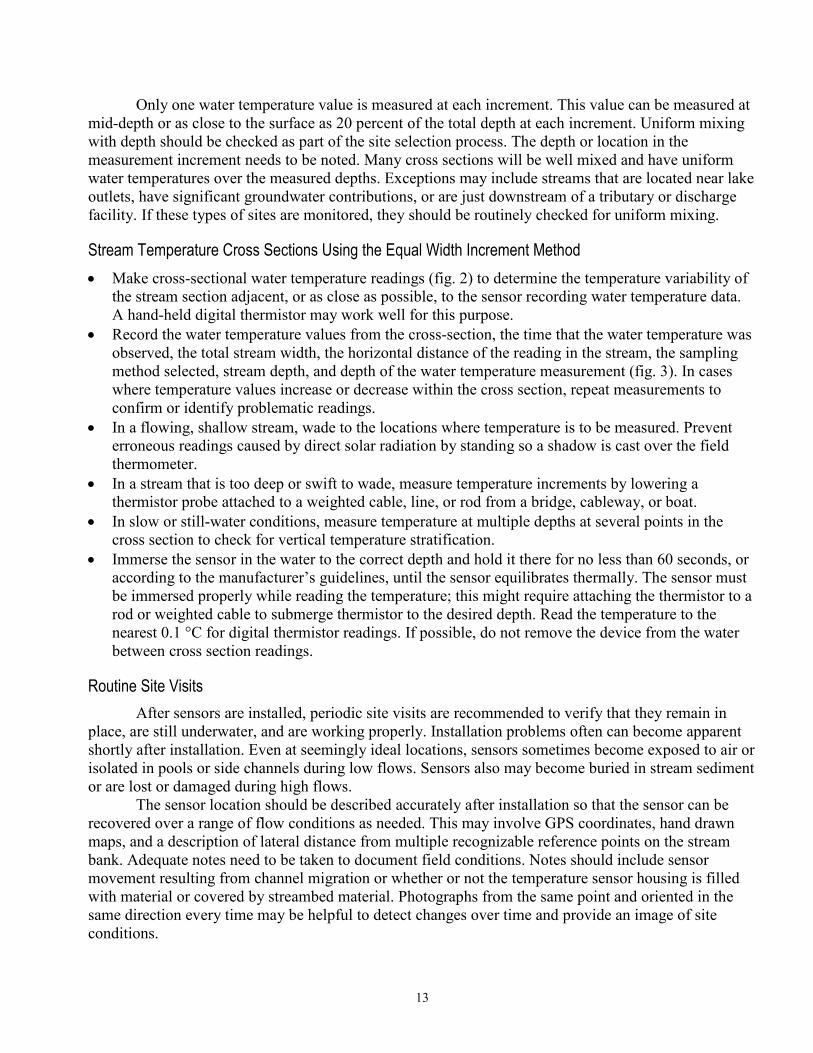
Only one water temperature value is measured at each increment. This value can be measured at mid-depth or as close to the surface as 20 percent of the total depth at each increment. Uniform mixing with depth should be checked as part of the site selection process. The depth or location in the measurement increment needs to be noted. Many cross sections will be well mixed and have uniform water temperatures over the measured depths. Exceptions may include streams that are located near lake outlets, have significant groundwater contributions, or are just downstream of a tributary or discharge facility. If these types of sites are monitored, they should be routinely checked for uniform mixing.
Stream Temperature Cross Sections Using the Equal Width Increment Method • Make cross-sectional water temperature readings (fig. 2) to determine the temperature variability of
the stream section adjacent, or as close as possible, to the sensor recording water temperature data. A hand-held digital thermistor may work well for this purpose.
• Record the water temperature values from the cross-section, the time that the water temperature was observed, the total stream width, the horizontal distance of the reading in the stream, the sampling method selected, stream depth, and depth of the water temperature measurement (fig. 3). In cases where temperature values increase or decrease within the cross section, repeat measurements to confirm or identify problematic readings.
• In a flowing, shallow stream, wade to the locations where temperature is to be measured. Prevent erroneous readings caused by direct solar radiation by standing so a shadow is cast over the field thermometer.
• In a stream that is too deep or swift to wade, measure temperature increments by lowering a thermistor probe attached to a weighted cable, line, or rod from a bridge, cableway, or boat.
• In slow or still-water conditions, measure temperature at multiple depths at several points in the cross section to check for vertical temperature stratification.
• Immerse the sensor in the water to the correct depth and hold it there for no less than 60 seconds, or according to the manufacturer’s guidelines, until the sensor equilibrates thermally. The sensor must be immersed properly while reading the temperature; this might require attaching the thermistor to a rod or weighted cable to submerge thermistor to the desired depth. Read the temperature to the nearest 0.1 °C for digital thermistor readings. If possible, do not remove the device from the water between cross section readings.
Routine Site Visits After sensors are installed, periodic site visits are recommended to verify that they remain in
place, are still underwater, and are working properly. Installation problems often can become apparent shortly after installation. Even at seemingly ideal locations, sensors sometimes become exposed to air or isolated in pools or side channels during low flows. Sensors also may become buried in stream sediment or are lost or damaged during high flows.
The sensor location should be described accurately after installation so that the sensor can be recovered over a range of flow conditions as needed. This may involve GPS coordinates, hand drawn maps, and a description of lateral distance from multiple recognizable reference points on the stream bank. Adequate notes need to be taken to document field conditions. Notes should include sensor movement resulting from channel migration or whether or not the temperature sensor housing is filled with material or covered by streambed material. Photographs from the same point and oriented in the same direction every time may be helpful to detect changes over time and provide an image of site conditions.
14
Data loggers should be downloaded frequently to avoid data loss with additional emphasis during autumn flow recessions while they remain easily accessible prior to development of ice cover. Frequent downloading, particularly soon after initial deployment, will minimize gaps in the temporal record and allow an estimation of any issues with the site or the logger before significant time has been wasted. When it is determined that logger is functioning properly and the site is deemed appropriate for the type of measurement being made, site visits may be less frequent, but not longer than 1 month between visits (except at extremely remote sites).
During field servicing the recorder and thermistor may need to be serviced and cleaned following manufacturer’s instructions. If self-contained temperature sensors are used, they should be inspected, data retrieved, and cleaned as needed, then returned to the installed location as found.
Record Computation The record-computation process verifies and validates the water-temperature data and
documents water quality. Accurate field notes and calibration logs are essential in processing the record. Ideally, the technician who services the water-temperature monitor computes the data record. The primary steps in processing water-temperature record are an initial data evaluation, removal of erroneous data, application of data corrections, and a final data evaluation (U.S. Geological Survey, 2006a; Wagner and others, 2006). The initial data evaluation should begin immediately upon completion of the field trip to ensure that all necessary information is available and to check for possible instrument malfunctions that may not have been evident in the field. Timely application of data corrections and initial computations are essential and can aid in determining if the sensor is functioning properly or needs to be replaced.
Data-Processing Procedures Water-temperature records should be processed in a timely manner according to the project’s
quality-assurance plan policies. Complete and accurate field notes are essential and reduce the amount of time required to process the data. Corrections to data should not be made unless the cause(s) of error(s) can be justified, validated, or explained in the field notes, by comparison with site data from a duplicate recorder and information from adjacent stations. Water-temperature data processing typically includes five procedures: (1) initial data evaluation, (2) application of data corrections, (3) final data evaluation, (4) record computation, and (5) final record review. Wagner and others (2006) suggest a sixth procedure that includes evaluation and corrections based on cross-section averaged measurements of temperature; however, they note that cross-section corrections may not be applicable for environments with poor mixing. In poorly mixed reaches, such as downstream from a tributary, it is exceedingly difficult to characterize temperature variability accurately. For the purposes intended for these guidelines, the measurements of cross-sectional water temperature should be used to verify that temperatures measured at the probe accurately reflect average conditions in the stream, or alternatively, to exclude or downgrade the rating of accuracy for a temperature record if persistent differences in temperature exist within the cross section.
15
Initial Data Evaluation Initial data evaluation is used to verify accurate transfer of raw field data to the database, to
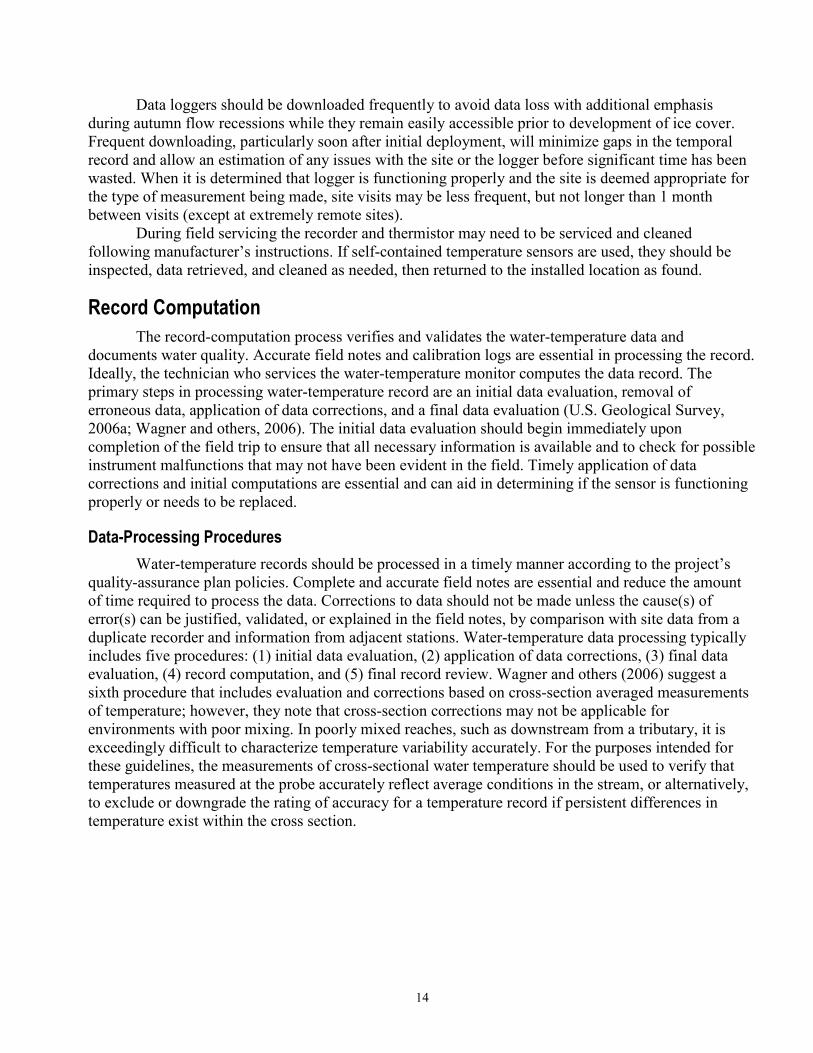
assess continuity and completion of the data record, and to identify and remove erroneous data. Standard time-series graphs (temperature/time) of the record should be plotted shortly after field visits to confirm accurate transfer of data and to detect any instrument recording or sensor errors. For example, the beginning or end of a data file may contain air temperature values that were recorded before and after field deployment of the sensor. These values should be deleted. Other values that need to be removed include any periods when the water level was below the sensor level. Erroneous data can result from various problems with sensors, recorders, and hydrologic or environmental conditions. Common sources and solutions for erroneous data are shown in table 1.
Table 1. Typical data problems with stream water temperature sensors.
Symptom Possible problem
Likely solution
Water temperature sensor Thermistor does not read accurately
Dirty sensor Clean sensor.
Erratic readings Poor connections at monitor or sensor
Tighten connections.
Monitor slow to stabilize
Dirty sensor Clean sensor.
Readings off scale
Failure in electronics
Replace sensor or monitor.
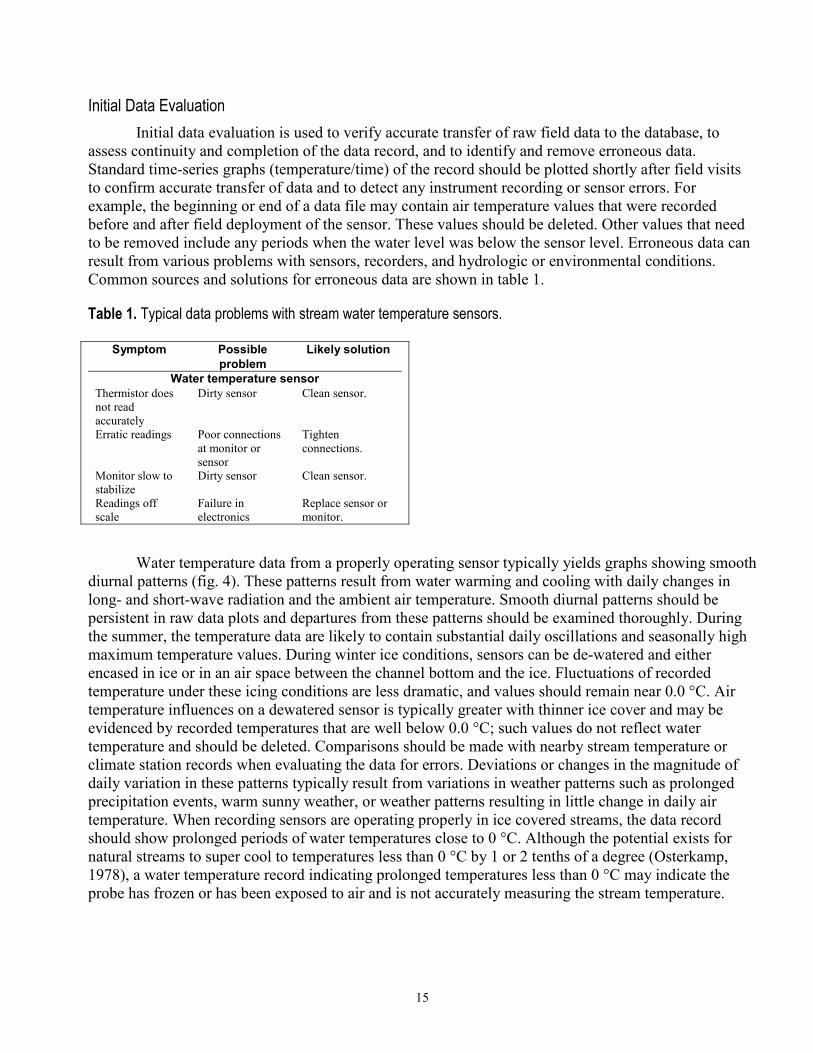
Water temperature data from a properly operating sensor typically yields graphs showing smooth diurnal patterns (fig. 4). These patterns result from water warming and cooling with daily changes in long- and short-wave radiation and the ambient air temperature. Smooth diurnal patterns should be persistent in raw data plots and departures from these patterns should be examined thoroughly. During the summer, the temperature data are likely to contain substantial daily oscillations and seasonally high maximum temperature values. During winter ice conditions, sensors can be de-watered and either encased in ice or in an air space between the channel bottom and the ice. Fluctuations of recorded temperature under these icing conditions are less dramatic, and values should remain near 0.0 °C. Air temperature influences on a dewatered sensor is typically greater with thinner ice cover and may be evidenced by recorded temperatures that are well below 0.0 °C; such values do not reflect water temperature and should be deleted. Comparisons should be made with nearby stream temperature or climate station records when evaluating the data for errors. Deviations or changes in the magnitude of daily variation in these patterns typically result from variations in weather patterns such as prolonged precipitation events, warm sunny weather, or weather patterns resulting in little change in daily air temperature. When recording sensors are operating properly in ice covered streams, the data record should show prolonged periods of water temperatures close to 0 °C. Although the potential exists for natural streams to super cool to temperatures less than 0 °C by 1 or 2 tenths of a degree (Osterkamp, 1978), a water temperature record indicating prolonged temperatures less than 0 °C may indicate the probe has frozen or has been exposed to air and is not accurately measuring the stream temperature.
16
Figure 4. Example of smooth diurnal patters in water temperature as taken from a properly functioning water temperature recording sensor, Old Tom Creek near Kasaan, Alaska, June–July 2011.
The following sections present selected examples of erroneous or problematic water temperature
data. These examples might be common when monitoring stream temperature. The examples are intended to illustrate authentic examples of continuous water-temperature data with periods or questionable or erroneous data. The examples also provide guidance on how to identify erroneous data for removal.
17
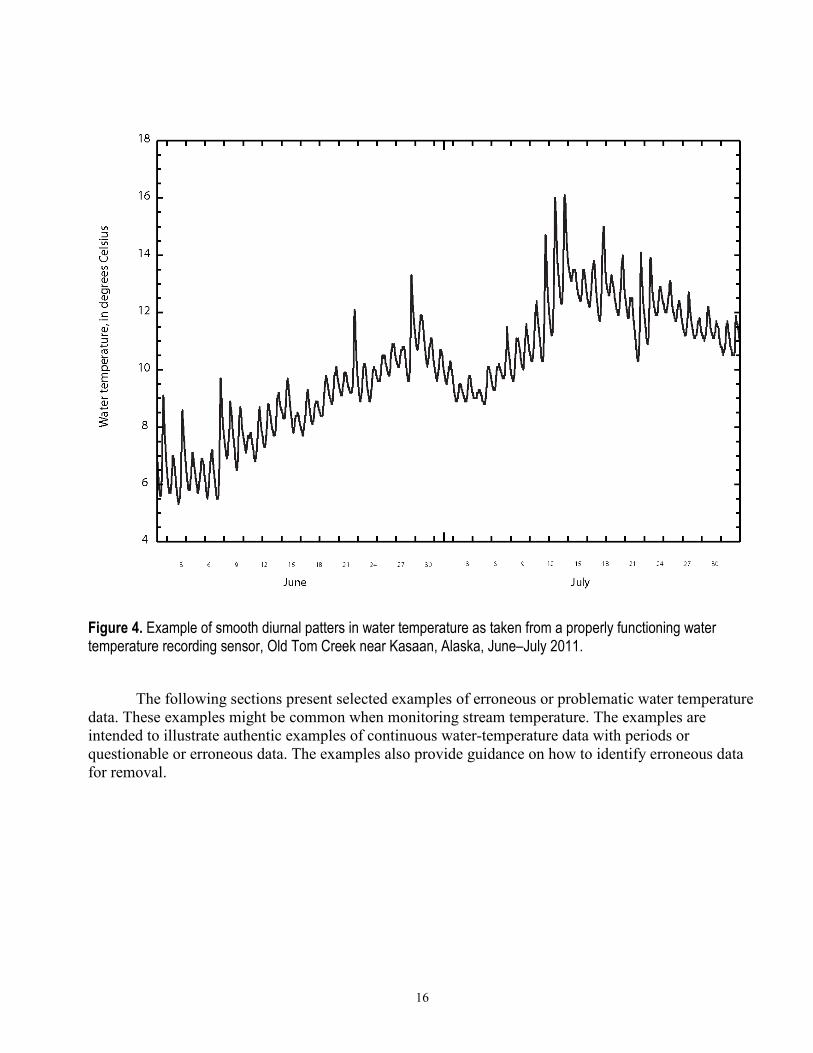
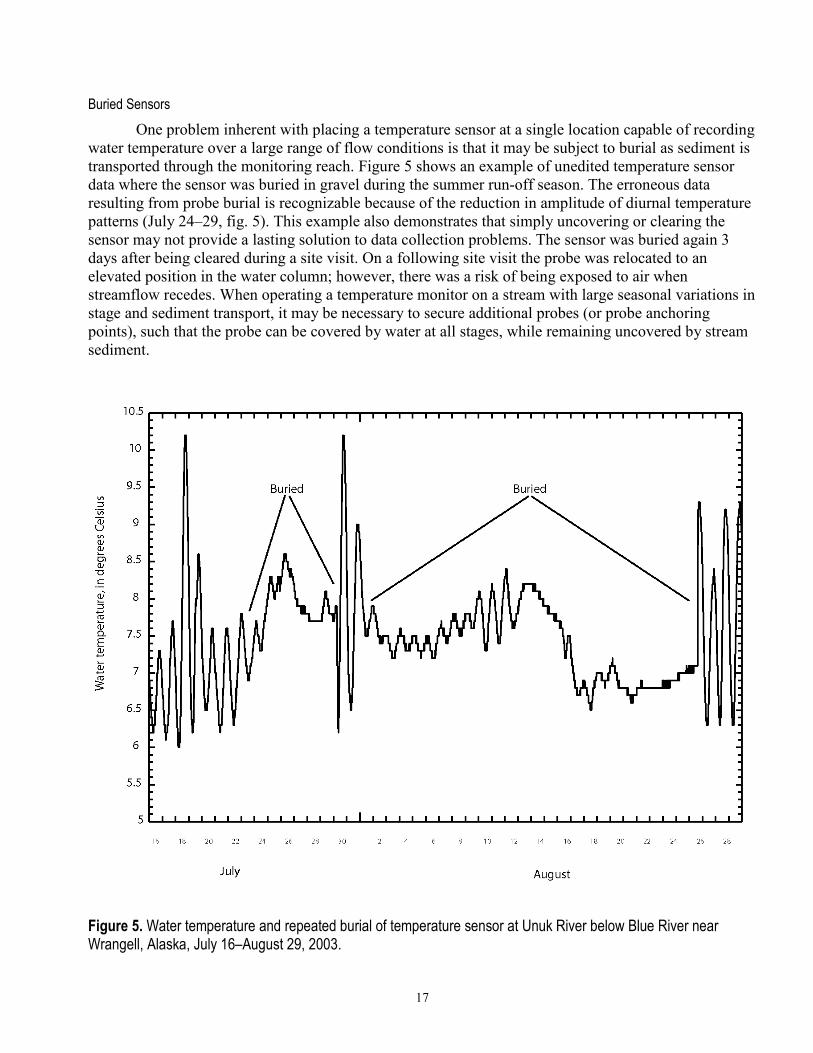
Buried Sensors One problem inherent with placing a temperature sensor at a single location capable of recording
water temperature over a large range of flow conditions is that it may be subject to burial as sediment is transported through the monitoring reach. Figure 5 shows an example of unedited temperature sensor data where the sensor was buried in gravel during the summer run-off season. The erroneous data resulting from probe burial is recognizable because of the reduction in amplitude of diurnal temperature patterns (July 24–29, fig. 5). This example also demonstrates that simply uncovering or clearing the sensor may not provide a lasting solution to data collection problems. The sensor was buried again 3 days after being cleared during a site visit. On a following site visit the probe was relocated to an elevated position in the water column; however, there was a risk of being exposed to air when streamflow recedes. When operating a temperature monitor on a stream with large seasonal variations in stage and sediment transport, it may be necessary to secure additional probes (or probe anchoring points), such that the probe can be covered by water at all stages, while remaining uncovered by stream sediment.
Figure 5. Water temperature and repeated burial of temperature sensor at Unuk River below Blue River near Wrangell, Alaska, July 16–August 29, 2003.
18
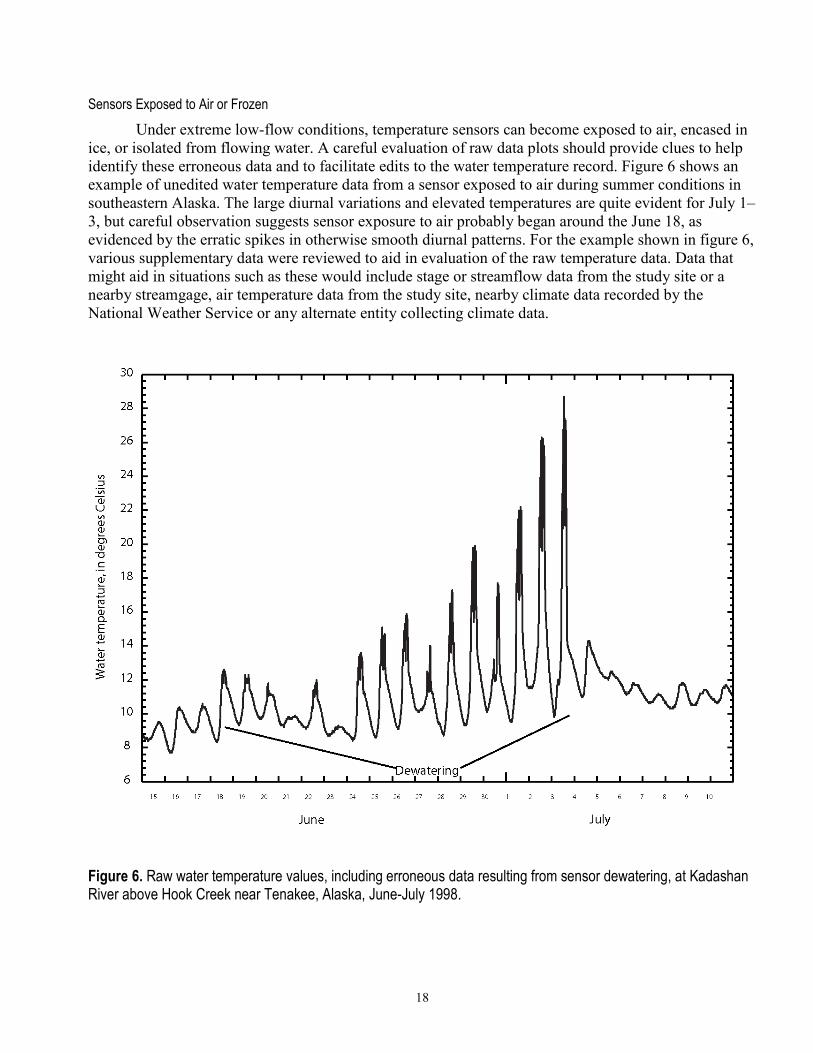
Sensors Exposed to Air or Frozen Under extreme low-flow conditions, temperature sensors can become exposed to air, encased in
ice, or isolated from flowing water. A careful evaluation of raw data plots should provide clues to help identify these erroneous data and to facilitate edits to the water temperature record. Figure 6 shows an example of unedited water temperature data from a sensor exposed to air during summer conditions in southeastern Alaska. The large diurnal variations and elevated temperatures are quite evident for July 1–3, but careful observation suggests sensor exposure to air probably began around the June 18, as evidenced by the erratic spikes in otherwise smooth diurnal patterns. For the example shown in figure 6, various supplementary data were reviewed to aid in evaluation of the raw temperature data. Data that might aid in situations such as these would include stage or streamflow data from the study site or a nearby streamgage, air temperature data from the study site, nearby climate data recorded by the National Weather Service or any alternate entity collecting climate data.
Figure 6. Raw water temperature values, including erroneous data resulting from sensor dewatering, at Kadashan River above Hook Creek near Tenakee, Alaska, June-July 1998.
19
Clues provided by a hydrograph showing stream stage at the study site could aid in determining the dates and times the sensor was exposed to air rather than submerged in water. Therefore, the elevation of the sensor relative to streamgage data can and should be recorded. In an example such as shown in figure 6, the hydrograph of the study site or that of a neighboring stream should indicate a receding hydrograph (declining water levels) prior to the erroneous data record.
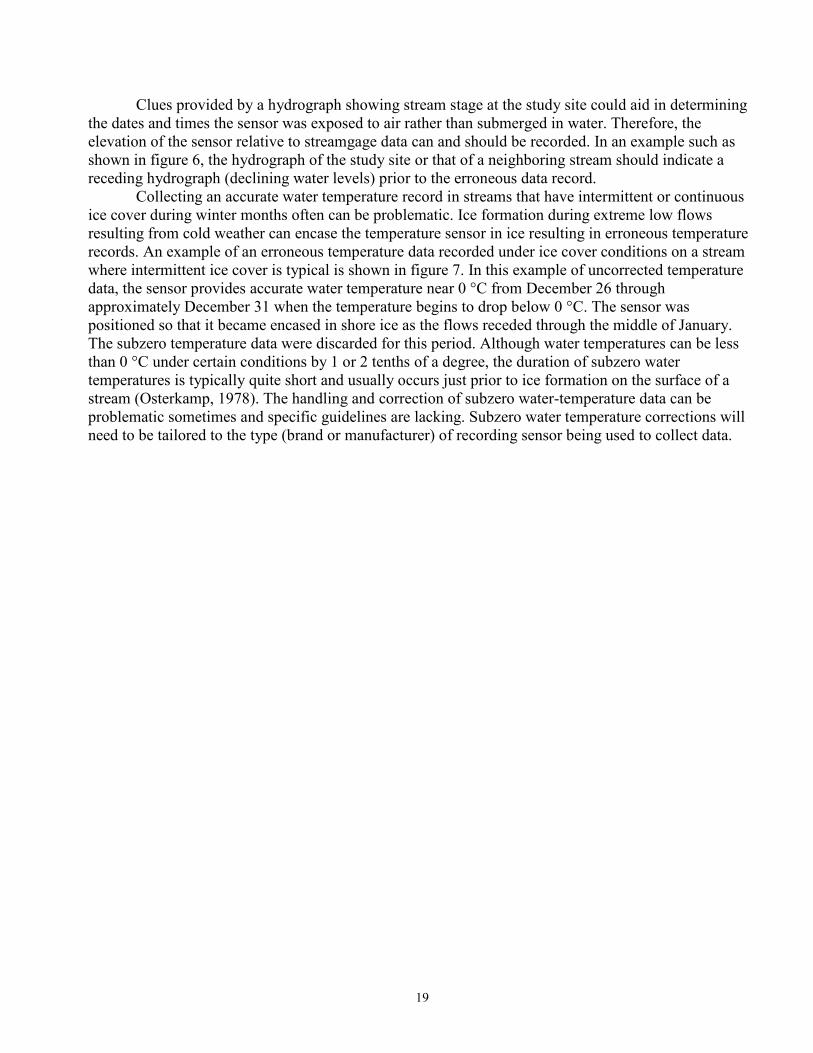
Collecting an accurate water temperature record in streams that have intermittent or continuous ice cover during winter months often can be problematic. Ice formation during extreme low flows resulting from cold weather can encase the temperature sensor in ice resulting in erroneous temperature records. An example of an erroneous temperature data recorded under ice cover conditions on a stream where intermittent ice cover is typical is shown in figure 7. In this example of uncorrected temperature data, the sensor provides accurate water temperature near 0 °C from December 26 through approximately December 31 when the temperature begins to drop below 0 °C. The sensor was positioned so that it became encased in shore ice as the flows receded through the middle of January. The subzero temperature data were discarded for this period. Although water temperatures can be less than 0 °C under certain conditions by 1 or 2 tenths of a degree, the duration of subzero water temperatures is typically quite short and usually occurs just prior to ice formation on the surface of a stream (Osterkamp, 1978). The handling and correction of subzero water-temperature data can be problematic sometimes and specific guidelines are lacking. Subzero water temperature corrections will need to be tailored to the type (brand or manufacturer) of recording sensor being used to collect data.
20
Figure 7. Raw water-temperature data, including erroneous record of sub-zero water temperatures resulting from a sensor frozen in ice, at Upper Earl West Creek near Wrangell, Alaska, December 23, 2004–January 21, 2005.
21
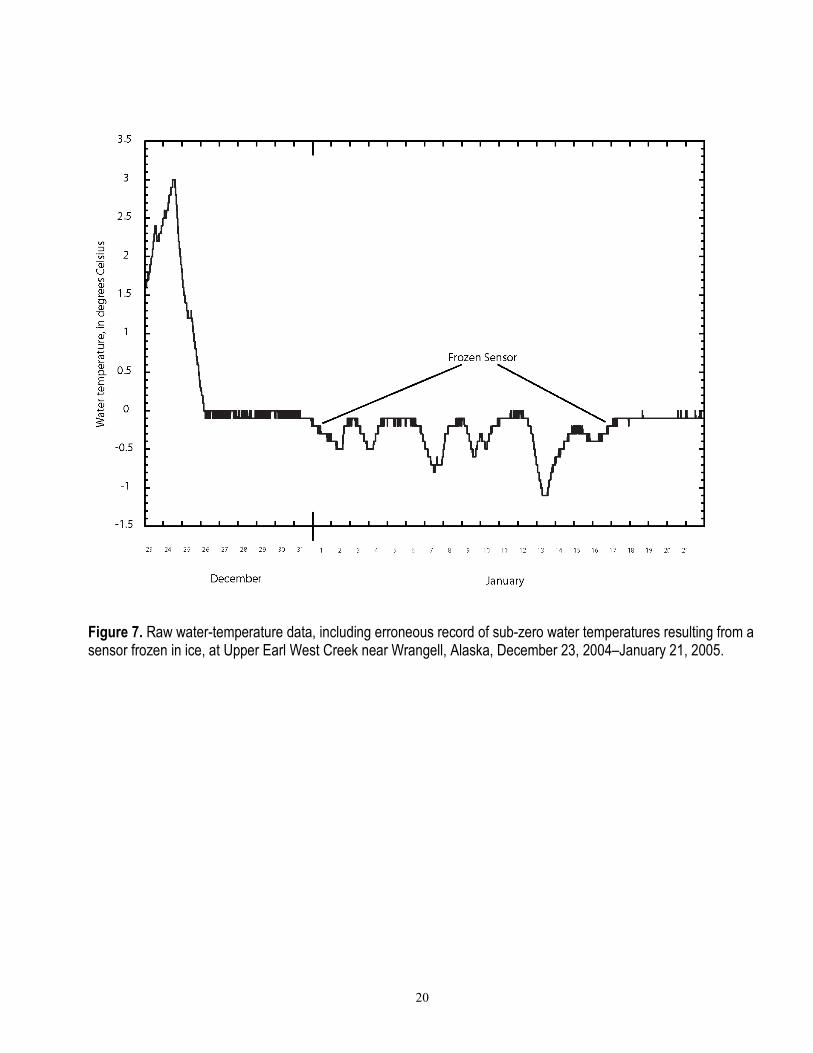
Figure 8 provides an example of a properly functioning temperature sensor in a stream that typically experiences intermittent ice cover during the winter. In this example, the water temperature sensor records temperatures at or near zero for extended periods, with temperatures intermittently greater than 0 °C. Streams under continuous ice cover typically exhibit little if any diurnal variation in water temperature. When a temperature sensor is functioning properly in an ice-covered stream, recorded temperatures are typically 0 ± 0.2 °C.
Figure 8. Water-temperature data taken from a properly functioning temperature sensor on a stream with intermittent ice cover at the Situk River near Yakutat, Alaska, December 14, 2008–January 14, 2009.
22
Data Corrections Data corrections adjust recorded water-temperature data for sensor calibration drift and sensor-
fouling errors that may occur during the interval between site visits because of environmental or instrumentation effects. Quality-control limits for correcting water-temperature data should be established in the study or program quality-assurance plan. Quality-control limits reduce the risk of retaining data from a faulty temperature sensor. The USGS uses a maximum allowable limit of 0.2 °C as the sum of the absolute values of all applied data corrections. If recorded values differ from the corrected values by more than the maximum allowable limit, then those data may be deemed unsuitable for use and are not reported or stored in the database. In some cases, a temperature sensor may be installed with a programming error, such as an improper slope, offset, or Fahrenheit versus Celsius units. If the data can be corrected by application of a constant correction for a known mistake or problem, the temperature data should be retained.
Temperature measurement errors occur primarily from sensor calibration drift and sensor fouling. A data correction is required when the sum of the absolute values for fouling and calibration drift corrections exceed a specified data-correction threshold. The USGS data-correction threshold for water-temperature data corrections is 0.2 °C (Wagner and others, 2006). The USGS data-correction thresholds are guidelines. More or less stringent criteria may be needed to meet project or program objectives. These guidelines should be stated in the quality-assurance plan for the study or program.
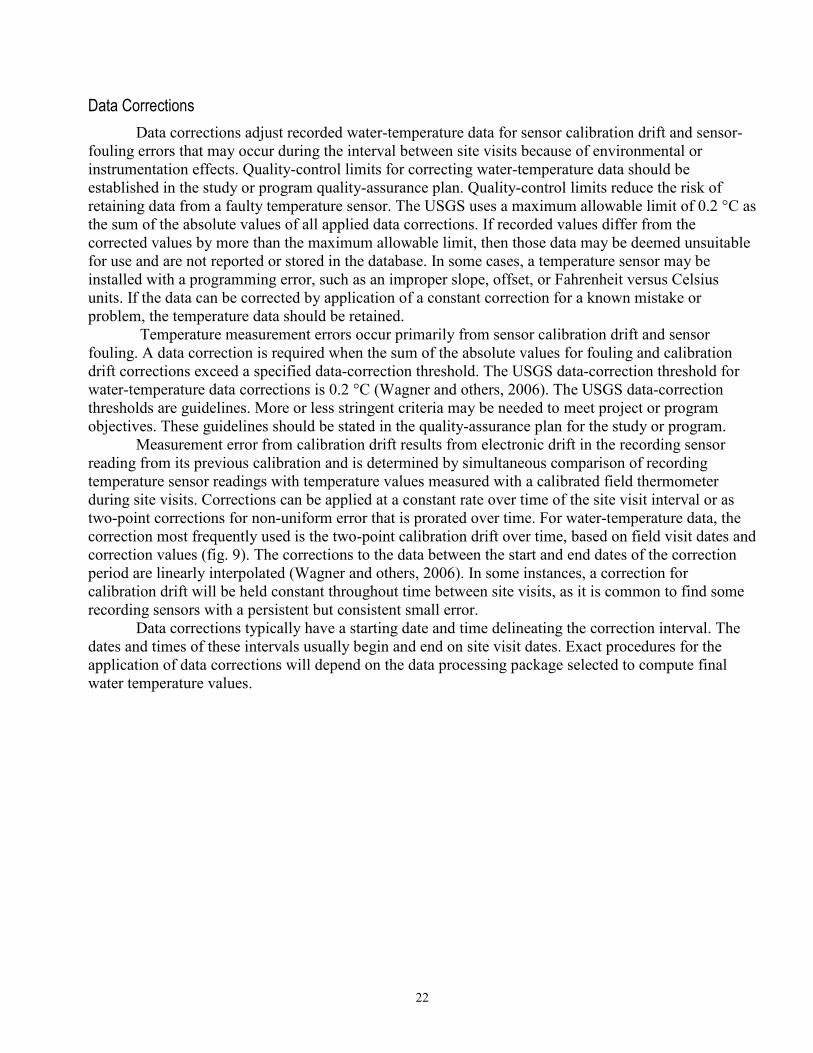
Measurement error from calibration drift results from electronic drift in the recording sensor reading from its previous calibration and is determined by simultaneous comparison of recording temperature sensor readings with temperature values measured with a calibrated field thermometer during site visits. Corrections can be applied at a constant rate over time of the site visit interval or as two-point corrections for non-uniform error that is prorated over time. For water-temperature data, the correction most frequently used is the two-point calibration drift over time, based on field visit dates and correction values (fig. 9). The corrections to the data between the start and end dates of the correction period are linearly interpolated (Wagner and others, 2006). In some instances, a correction for calibration drift will be held constant throughout time between site visits, as it is common to find some recording sensors with a persistent but consistent small error.
Data corrections typically have a starting date and time delineating the correction interval. The dates and times of these intervals usually begin and end on site visit dates. Exact procedures for the application of data corrections will depend on the data processing package selected to compute final water temperature values.
23
Figure 9. Two-point variable correction for calibration drift of a temperature sensor at Kenai River at Cooper Landing, Alaska, October 26–December 22, 2011.
24
Final Data Evaluation Following the application of data corrections, the technician providing quality control for the
water temperature record should review the data record, check data corrections, and apply any needed final corrections. Data used in producing the final water-temperature record should be checked thoroughly for completeness and accuracy before final review, approval, and release. Checking and reviewing of the water-temperature record should include examination from at least one additional technician familiar with the computation of water-temperature records. Two independent reviews should help to eliminate most computational errors from the record. To adequately check or review water-temperature records, all field data should be verified for accuracy of transcription from field sheets or missing electronic information; all data corrections must be checked to ensure that the correct values were used; and all dates and numbers in the report for the site should be checked for accuracy.
Accuracy Assessment An assessment of the overall accuracy of the water-temperature record can be made using certain
criteria used by USGS (Wagner and others, 2006). The accuracy rating is based on data values recorded before any data corrections are made after the record has been evaluated and data corrections applied. One of four accuracy classifications ranging from excellent to poor is applied to the record. Excellent record is deemed to be accurate within 0.2 °C; good is from 0.2 to 0.5 °C; fair is from 0.5 to 0.8 °C; and poor is more than 0.8 °C. This accuracy rating can be different for discrete periods of record based on the combined fouling and calibration drift corrections applied to the water-temperature record. A decision based on professional judgment should be made as to whether to approve and release poor records or when the data quality is not known.
Rating the accuracy of the record also can be based on an evaluation of the proportion of approved and final record, the amount of data corrected, frequency of site visits, and quality-control data used to make adjustments to the record. Record that has numerous and inconsistent data corrections may indicate the sensor has calibration stability issues that provide less reliable data. The quality rating of the record also may be lowered because of frequent gaps in the record. Missing data or data that do not meet the criteria for maximum allowable correction limits may have a varied range of effects on the accuracy rating of the final data, depending on the situation; the decision to approve and release the data is left to the professional judgment of the personnel computing and reviewing the record (U.S. Geological Survey, 2006a; Wagner and others, 2006).
Reporting Documentation of the data record typically includes a report and analysis with several
components, including descriptions of the site, the equipment installed, the data collected, and the corrections applied.
25
Station Description The station description contains information about the location, history, and operation of the
water-temperature monitoring site. A complete station description should facilitate finding the site and executing the tasks necessary for an effective site visit. Changes in location, instrumentation, operation, or land use should be recorded in the station description. The frequency of site visits should be recorded in the station description. A complete description should be prepared for each monitoring station and revised as needed. Contents of the station description may vary from station to station, but should include the following:
• Location of the station; • Station history; • Drainage area; • Channel characteristics; • Methods for making temperature measurements; • Historical extremes; • Cross-section surveys; • Purpose of monitoring; • Maps, photographs, and permits; • Safety hazards, detailed directions to the site, and access remarks.
Station Analysis The station analysis presents a concise and accurate summary of site conditions and includes
how the water-temperature data are compiled and computed. A station analysis should be written for each station providing water temperature record (appendix 2). Records of cross-section surveys and extreme values should be updated annually in the station analysis. The following compilation of station analysis attributes recommended by the USGS was modified from Wagner and others (2006):
• Measurement locations—Station identifier, year, parameters measured, and measurement and recording frequency;
• Equipment and instrumentation—Type of equipment used and dates sensor or equipment was moved or replaced;
• Site characteristics—Description of the study reach, location of recording sensor, and any features that may pertain to the quality of the record;
• Record—Record of how the raw data were manipulated to generate final record and note any missing record and reasons why it was missing. Include data collected but not retained. Include rating of accuracy for the period of record;
• Calibration—Provide documentation of calibration procedures or instrument checks; • Computations—Statement of how and why data corrections were applied to the data, list
extreme data correction values applied to data during the year, and list any abnormal data or data corrections;
• Cross-section surveys—How, where, and when the cross section was measured, the number of verticals, and variation (or lack of) of measurements across throughout the cross section;
• Remarks—Any additional relevant information that does not fit within the other sections; • Discussion—Description of patterns within the data and their relation to other datasets or
significant events; • Date and name—Identify preparer, checkers, and reviewers.
26
The station analysis should enable the reader to determine how the record was processed, corrections that were applied, and reasons for their application. Rationale used to determine the final accuracy ratings for the record also should be included in the station analysis.
Data Reporting The desired water-temperature data reporting accuracy should be described in the study purpose,
data-quality objectives, or program quality-assurance plan. The USGS databases typically report temperature measurements rounded to the nearest 0.1 °C (U.S. Geological Survey, 2006a). If finer resolution in the data is required, temperatures can be reported to the nearest 0.01 °C, provided that instruments are capable of the desired accuracies and the data are reproducible. Operation of continuous water-temperature sensors can produce large volumes of data. Instantaneous values throughout the day should be recorded, checked for quality control, approved, and released. Depending on the application, a graphical display of the data may allow for visual detection of errors and other patterns.
Criteria or protocols for finalizing and releasing periods of record with data gaps need to be defined in the quality-assurance plan. Estimating, interpolation methods and modeling techniques are not applied to data gaps. For example, in order for the USGS to compute daily water temperature statistics, the following minimum requirements apply (Wagner and others, 2006): • To compute a daily mean or median value on days when less than 100 percent of the discrete time
interval data are collected, both the expected daily maximum and minimum values must be present. Reporting daily mean values when less than 100 percent of the unit values are available is a decision based on professional judgment and generally is determined by the data capture interval, by data trends, knowledge of site characteristics, and the influence of hydrologic events. The station analysis should include a discussion of how the judgment was determined.
Data Processing Packages and Database Management Exact methods used to edit, process, and report water-temperature data will be largely
dependent on the data processing package selected for use. The data processing package may originate from the manufacturer of the temperature sensing equipment, commercially purchased software, open-source software, or be developed in-house. The selection of a data processing package will be a key factor in facilitating accurate and efficient computation of water temperature records. A good processing package will have the capacity to readily graph time series data on multiple scales, which allows for efficient screening, editing, and evaluation of the original data. The capacity to automate linear interpolation and proration of data corrections over time is another desired feature of a good data processing package. The frequent application of prorated data corrections between site visits is common in processing water temperature data and the automation of this process simplifies the computation, checking, and review of the final data record. The capacity to round recorded temperature values may be another desired attribute of a data processing package.
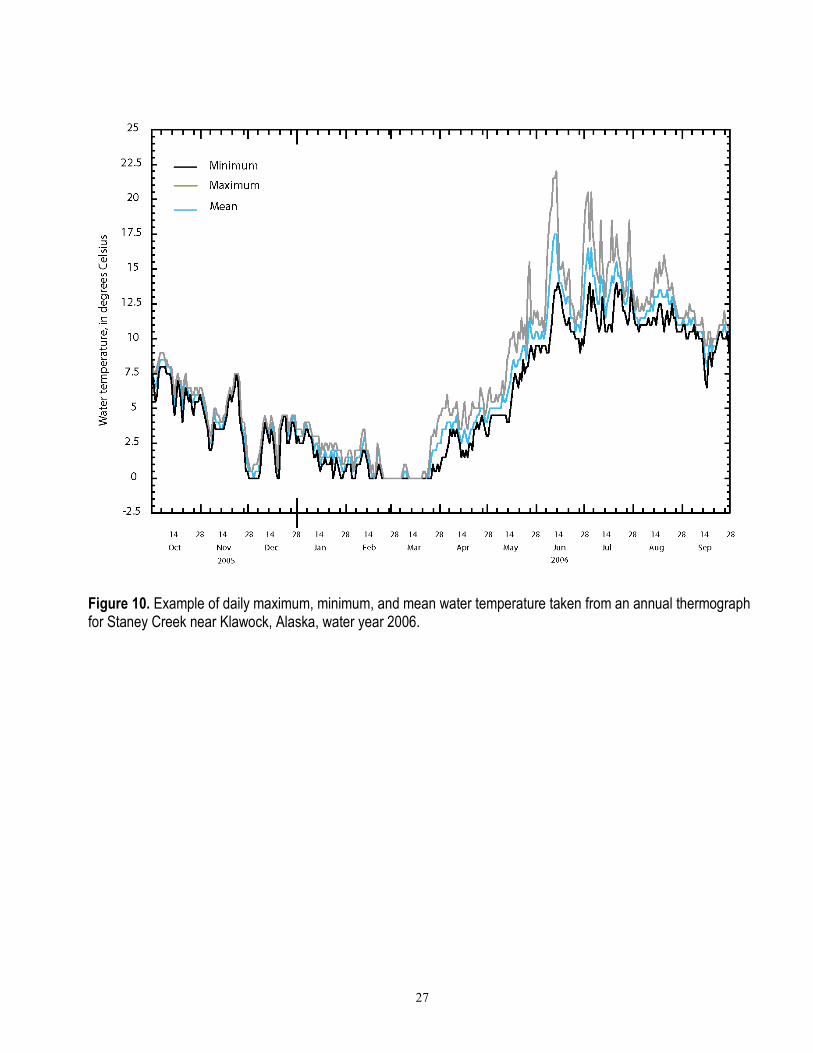
In addition to graphing and processing capabilities, it may be desirable to obtain a data processing package that readily generates tables of daily maximum, minimum, and mean temperature values, as well as monthly and annual mean values (fig. 10). Other desirable attributes of a data processing package might include data correction summaries, monthly data summaries, and annual data summaries. Although a typical spreadsheet package may have the capacity to generate many of these summaries and computations, the processes used to generate the desired output can become cumbersome and time consuming when computing, checking, and reviewing water temperature record for multiple sites.
27
Figure 10. Example of daily maximum, minimum, and mean water temperature taken from an annual thermograph for Staney Creek near Klawock, Alaska, water year 2006.
28
Database Management Effectively managing and archiving water temperature records will require a database
management plan. Development of the database management plan will be largely dependent on the study or program objectives as well as institutional procedures and requirements of the agency collecting the data. Although it is beyond the scope of this document to develop a database management plan, what follows are potential factors to consider in the development of a database management strategy:
• Data Format—A format for data storage will need to be selected (for example, html, ASCII, jpeg, or other formats);
• Data Access—Determine if the data will be posted on a website or public database or limited to specific requests on a case by case basis. How will the data be protected from inadvertent changes or loss?;
• Policies for Distribution—If data are provided for general access, disclaimers or conditions regarding the terms of use of the data may need to be provided;
• Archiving—Data and metadata need to be regularly backed-up, properly indexed, and plans are needed to transfer data and metadata to new storage media or devices as technological standards or practices change. If data are retained in an internal or external central warehouse for storage, the data in question must meet the format requirements of the warehouse.
Summary Producing records of stream water temperature that are generally consistent, comparable,
unbiased, and reproducible requires that the data are collected and analyzed according to documented protocols. This report provides guidelines for developing protocols for the operation of continuous water-temperature stations in streams under conditions most common in Alaska. These protocols include site and sensor selection considerations, sensor inspection and calibration techniques, field procedures, data screening, evaluation, correction, and computation. Additionally, this report provides guidelines for stream temperature data reporting, process documentation, and data storage and management considerations. The guidelines provided were largely derived from protocols used by the U.S. Geological Survey to generate and report continuous water-quality data, but have been targeted to suit conditions in Alaska’s cold-water streams and rivers.
29
References Cited Alaska Department of Environmental Conservation, 2012, 18 AAC 70 Water quality standards: Alaska
Department of Environmental Conservation, http://dec.alaska.gov/commish/regulations/pdfs/18%20AAC%2070.pdf.
Alaska Department of Environmental Conservation, 2011, Generic tier 2 quality assurance project plan for water quality monitoring sampling and analysis activities: Alaska Department of Environmental Conservation, http://dec.alaska.gov/water/wqapp/wqapp_index.htm.
Dunham, J., Chandler, G., Rieman, B., and Martin, D., 2005, Measuring stream temperature with digital data loggers—A user’s guide: U.S. Department of Agriculture Forest Service General Technical Report RMRS-GTR-150WWW, 15 p.
Kelleher, C., Wagener, T., McGuire, K., and Marshall, L., 2012, Investigating controls on the thermal sensitivity of Pennsylvania streams: Hydrological Processes, v. 26, p. 771–785, http://dx.doi.org/10.1002/hyp.8186.
Kyle, R.E., and Brabets, T.P., 2001, Water temperature of streams in the Cook Inlet Basin, Alaska and implications of climate change: U.S. Geological Survey Water-Resources Investigations Report 01-4109, 24 p.
Osterkamp, T.E., 1978, Frazil ice formation–A review: Journal of Hydraulic Engineering, v. 104, iss. 9, 1,239–1,256 p.
Rantz, S.E., and others, 1982, Measurement and computation of streamflow—Volume 1, Measurement of stage and discharge: U.S. Geological Survey Water-Supply Paper 2175.
Reynolds, J.H., Murphy, K., and Smith, C., 2013, Alaska stream and lake temperature monitoring workshop, Anchorage, Alaska, November 5–6, 2012: Western Alaska Landscape Conservation Cooperative, http://westernalaskalcc.org.
Stevens, H.H., Jr., Ficke, J.F., and Smoot, G.F., 1975, Water temperature—Influential factors, field measurement, and data presentation: U.S. Geological Survey Techniques of Water-Resources Investigations, book 1, chap. D1, 65 p.
Wagner, R.J., Boulger, R.W., Jr., Oblinger, C.J., and Smith, B.A., 2006, Guidelines and standard procedures for continuous water-quality monitors—Station operation, record computation, and data reporting: U.S. Geological Survey Techniques and Methods 1-D3, 94 p.
U.S. Geological Survey, 2006a, National field manual for the collection of water-quality data: U.S. Geological Survey Techniques of Water-Resources Investigations, book 9, chap. A6.1. [Also available at http://pubs.water.usgs.gov/twri9A.]
U.S. Geological Survey, 2006b, National field manual for the collection of water-quality data: U.S. Geological Survey Techniques of Water-Resources Investigations, book 9, chap. A4.1. [Also available at http://pubs.water.usgs.gov/twri9A.]
Zender Group, 2014, Blank QAPP Template: Zender Group, accessed January 2014 at http://www.zendergroup.org/docs/WQ-Tribal-Temp-QAPP-%202014.doc.

30
This page left intentionally blank
31
Appendix 1. Photograph showing Example of a Self-Contained Temperature Recording Devise and Protective Housing
32
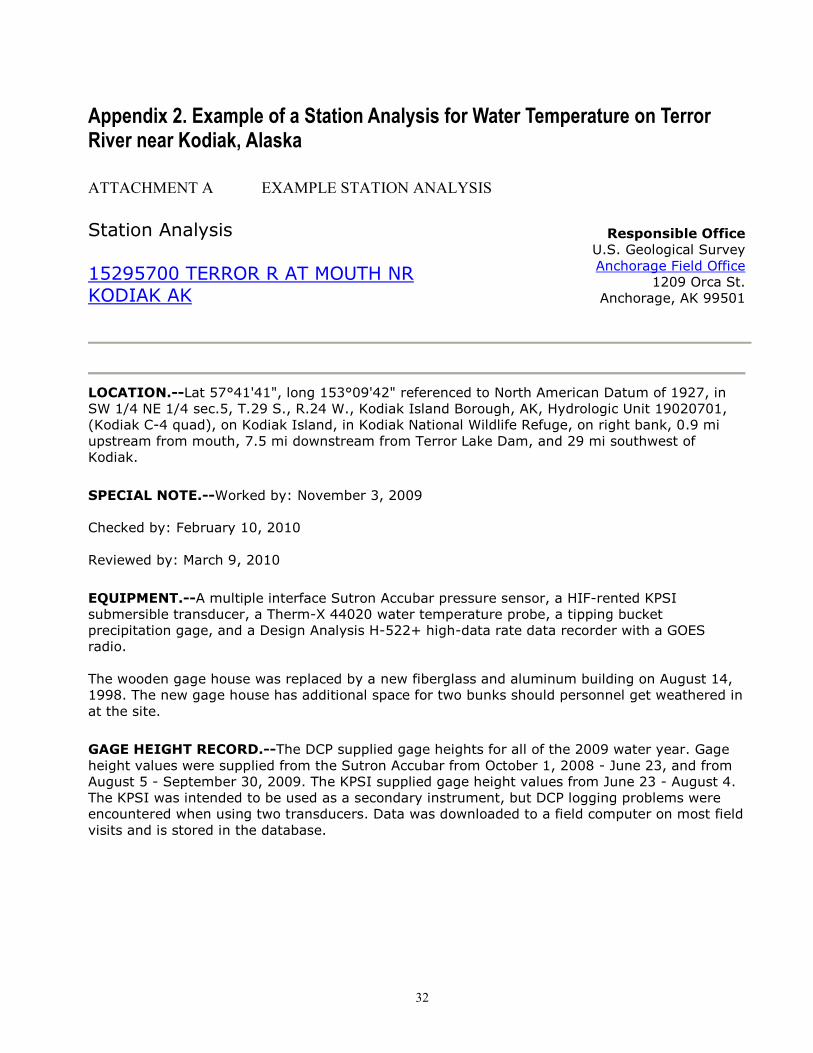
Appendix 2. Example of a Station Analysis for Water Temperature on Terror River near Kodiak, Alaska ATTACHMENT A EXAMPLE STATION ANALYSIS Station Analysis 15295700 TERROR R AT MOUTH NR KODIAK AK
Responsible Office U.S. Geological Survey Anchorage Field Office
1209 Orca St. Anchorage, AK 99501
LOCATION.--Lat 57°41'41", long 153°09'42" referenced to North American Datum of 1927, in SW 1/4 NE 1/4 sec.5, T.29 S., R.24 W., Kodiak Island Borough, AK, Hydrologic Unit 19020701, (Kodiak C-4 quad), on Kodiak Island, in Kodiak National Wildlife Refuge, on right bank, 0.9 mi upstream from mouth, 7.5 mi downstream from Terror Lake Dam, and 29 mi southwest of Kodiak.
SPECIAL NOTE.--Worked by: November 3, 2009 Checked by: February 10, 2010 Reviewed by: March 9, 2010
EQUIPMENT.--A multiple interface Sutron Accubar pressure sensor, a HIF-rented KPSI submersible transducer, a Therm-X 44020 water temperature probe, a tipping bucket precipitation gage, and a Design Analysis H-522+ high-data rate data recorder with a GOES radio. The wooden gage house was replaced by a new fiberglass and aluminum building on August 14, 1998. The new gage house has additional space for two bunks should personnel get weathered in at the site.
GAGE HEIGHT RECORD.--The DCP supplied gage heights for all of the 2009 water year. Gage height values were supplied from the Sutron Accubar from October 1, 2008 - June 23, and from August 5 - September 30, 2009. The KPSI supplied gage height values from June 23 - August 4. The KPSI was intended to be used as a secondary instrument, but DCP logging problems were encountered when using two transducers. Data was downloaded to a field computer on most field visits and is stored in the database.
33
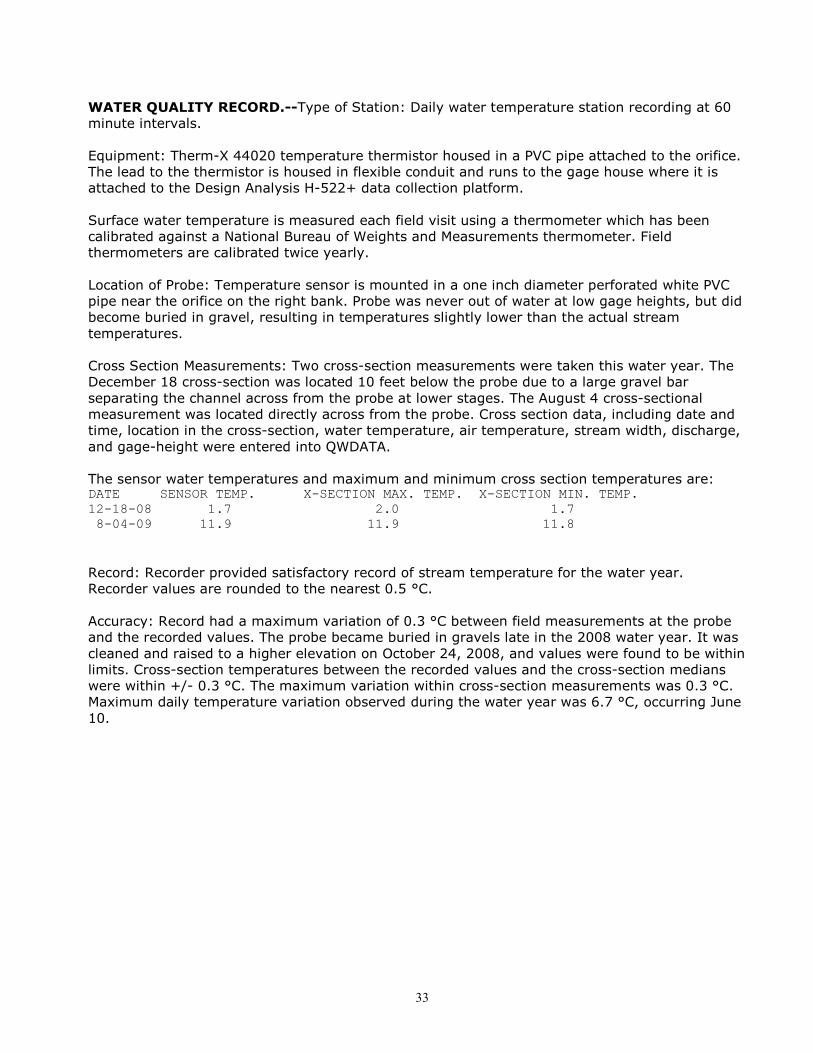
WATER QUALITY RECORD.--Type of Station: Daily water temperature station recording at 60 minute intervals. Equipment: Therm-X 44020 temperature thermistor housed in a PVC pipe attached to the orifice. The lead to the thermistor is housed in flexible conduit and runs to the gage house where it is attached to the Design Analysis H-522+ data collection platform. Surface water temperature is measured each field visit using a thermometer which has been calibrated against a National Bureau of Weights and Measurements thermometer. Field thermometers are calibrated twice yearly. Location of Probe: Temperature sensor is mounted in a one inch diameter perforated white PVC pipe near the orifice on the right bank. Probe was never out of water at low gage heights, but did become buried in gravel, resulting in temperatures slightly lower than the actual stream temperatures. Cross Section Measurements: Two cross-section measurements were taken this water year. The December 18 cross-section was located 10 feet below the probe due to a large gravel bar separating the channel across from the probe at lower stages. The August 4 cross-sectional measurement was located directly across from the probe. Cross section data, including date and time, location in the cross-section, water temperature, air temperature, stream width, discharge, and gage-height were entered into QWDATA. The sensor water temperatures and maximum and minimum cross section temperatures are: DATE SENSOR TEMP. X-SECTION MAX. TEMP. X-SECTION MIN. TEMP. 12-18-08 1.7 2.0 1.7 8-04-09 11.9 11.9 11.8 Record: Recorder provided satisfactory record of stream temperature for the water year. Recorder values are rounded to the nearest 0.5 °C. Accuracy: Record had a maximum variation of 0.3 °C between field measurements at the probe and the recorded values. The probe became buried in gravels late in the 2008 water year. It was cleaned and raised to a higher elevation on October 24, 2008, and values were found to be within limits. Cross-section temperatures between the recorded values and the cross-section medians were within +/- 0.3 °C. The maximum variation within cross-section measurements was 0.3 °C. Maximum daily temperature variation observed during the water year was 6.7 °C, occurring June 10.
34
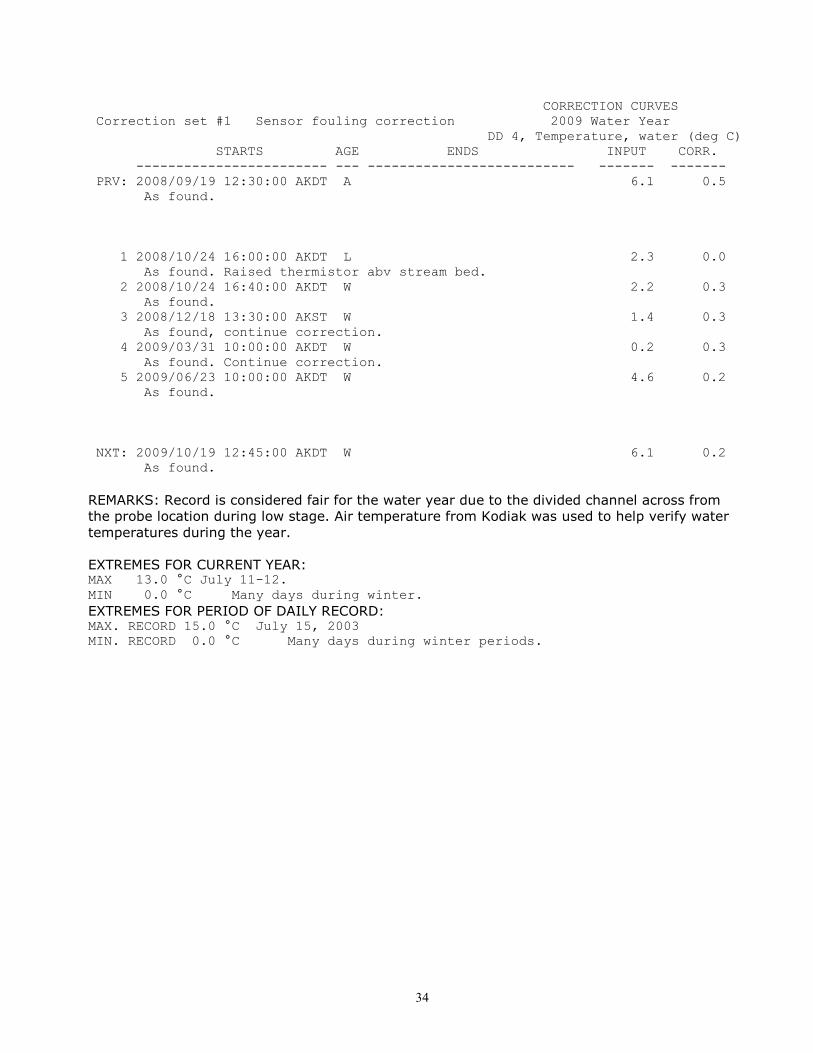
CORRECTION CURVES Correction set #1 Sensor fouling correction 2009 Water Year DD 4, Temperature, water (deg C) STARTS AGE ENDS INPUT CORR. ------------------------ --- -------------------------- ------- ------- PRV: 2008/09/19 12:30:00 AKDT A 6.1 0.5 As found. 1 2008/10/24 16:00:00 AKDT L 2.3 0.0 As found. Raised thermistor abv stream bed. 2 2008/10/24 16:40:00 AKDT W 2.2 0.3 As found. 3 2008/12/18 13:30:00 AKST W 1.4 0.3 As found, continue correction. 4 2009/03/31 10:00:00 AKDT W 0.2 0.3 As found. Continue correction. 5 2009/06/23 10:00:00 AKDT W 4.6 0.2 As found. NXT: 2009/10/19 12:45:00 AKDT W 6.1 0.2 As found. REMARKS: Record is considered fair for the water year due to the divided channel across from the probe location during low stage. Air temperature from Kodiak was used to help verify water temperatures during the year. EXTREMES FOR CURRENT YEAR: MAX 13.0 °C July 11-12. MIN 0.0 °C Many days during winter. EXTREMES FOR PERIOD OF DAILY RECORD: MAX. RECORD 15.0 °C July 15, 2003 MIN. RECORD 0.0 °C Many days during winter periods.
Publishing support provided by the U.S. Geological Survey Science Publishing Network, Tacoma Publishing Service Center
For more information concerning the research in this report, contact the Director, Alaska Science Center
U.S. Geological Survey 4210 University Dr Anchorage, Alaska 99508-4560 http://alaska.usgs.gov
Toohey and others—G
uidelines for the Collection of Continuous Stream W
ater-Temperature D
ata in Alaska—
Open-File Report 2014-1182
ISSN 2331-1258 (online)http://dx.doi.org/10.3133/ofr20141182