guidelines for the single laboratory validation of...
TRANSCRIPT

Ref code: QQC-VAL-002 - ANNEX
Issue No. 001
Page: 1 of 65
STANDING COMMITTEE FOR QUALITY AND COMPETENCE (QCC)
With the financial support from the Prevention of and Fight against Crime Programme of the European Union
European Commission – Directorate-General Home Affairs
Project Team Thierry De Baere (National Institute for criminalistics and criminology, Belgium), team-
leader
Wiktor Dmitruk (Central Police Forensic Laboratory, Poland)
Bertil Magnusson* (SP Technical Research Institute of Sweden, Sweden)
Didier Meuwly (Netherlands Forensic Institute, Netherlands)
Geraldine O’Donnell (Forensic Science Laboratory, Ireland) *Representing Eurachem, eurachem.org
5 Instrument-based examples
5.1 Primarily quantitative
5.1.1 Quantification of DNA using Real-Time PCR
SINGLE LABORATORY VALIDATION
OF
MEASUREMENT PROCEDURES (Quantification System)
Guidelines for the single laboratory
Validation of Instrumental and Human Based Methods
in Forensic Science
Examples
DOCUMENT TYPE:
GUIDANCE - ANNEX
REF. CODE:
QCC-VAL-002
ISSUE NO:
001
ISSUE DATE:
10/11/2014

Ref code: QQC-VAL-002 - ANNEX
Issue No. 001
Page: 2 of 65
Sample validation-Guideline purposes only
1. Specify the measurement procedure, analyte, measurand and units
The measurement procedure Quantitative analysis of DNA samples using (1) QuantifilerTM
Human DNA and (2) QuantifilerTM
Y Human DNA kits Analyte Quantifiler
TM Human DNA- Total human genomic DNA (male
and female)
QuantifilerTM
Y -Total male genomic DNA The measurand Concentration of human genomic DNA and concentration of
male genomic DNA in casework samples Unit ng/ul of human genomic DNA in extract
ng/ul of male genomic DNA in extract
2. Specify the Scope
Matrix Case samples
Measuring range 50ng/ul-0.023ng/ul (23pg)
3. Requirement on the measurement procedure
Intended use of the
results The Quantifiler
TM Human DNA assay is intended for general use as a
preliminary DNA quantification step to performing routine STR analysis
The Human Male kit assay is designed to be of use particularly
in samples with mixed male-female DNAs, such as sexual assault
evidence, where it may be useful to separately detect and quantify
male DNA from a background of female DNA.
Internal validation: To ensure kit performs as expected in the laboratory. Mark the
laboratory/customer requirements and
give their values Parameters to be validated Value requested
x Known and case samples % Difference from Quantifier
Human kit and QuantiBlot
(system Quantifiler replacing)
should not be significant.
Using quantification values of
40pg/ul to 2ng/ul for the
Quantifier kits, complete
profiles for all samples, with no
off-scale or drop-out allele
peaks should be obtained
This would not be achievable in
the case of inaccurate DNA
quantification.

Ref code: QQC-VAL-002 - ANNEX
Issue No. 001
Page: 3 of 65
x Precision
The mean CT FAM results for the
DNA standards should show the
normal inverse relationship with
sample DNA concentration,
going from the range of
approximately 23 to 25 for the
highest standard (50 ng/μL) to
33 to 36 for the lowest standard
(23 pg/μL). A linear relationship
between the CT FAM (template
DNA) and concentration should
be obtained.
Range of the CT Vic (IPC-internal
PCR control) in the range of
approximately 27 to 29 for all
standards and samples.
x Reproducibility
Reproducible CT Vic values for
the IPC and CT FAM values
should be obtained in replicates,
between operators and on using
two 7500 real time PCR
instruments
Reproducible DNA profile
quality as assessed by
determining average peak
heights should be obtained.
x Sensitivity /Stochastic
Quantification result obtained at
0.023ng/ul (23pg)
x Mixture Studies
Quantifier Human kit should
show the expected increase in
total human genomic DNA as a
result of adding increasing
concentrations of K562 (female
DNA)
Quantifier Y should remain
unaffected by the increase in
female DNA and detect only the
constant level of male DNA.
x False Positive rate
Quantifier kit assays prepared in
the absence of DNA give a
CT FAM>50
4. Origin of the Measurement Procedure
VALIDATION
New In-House Method X Full internal validation
Modified Validated Method Partial

Ref code: QQC-VAL-002 - ANNEX
Issue No. 001
Page: 4 of 65
Official Standard Method “Simple”

Ref code: QQC-VAL-002 - ANNEX
Issue No. 001
Page: 5 of 65
5. Performance Parameters
Parameter Description
Known and case
samples
QuantifilerTM
Human DNA and QuantifilerTM
Y Human DNA kits
must be evaluated and tested using known and case samples (actual
and mock) and compared to previous quantification method(s). Demand
% difference from Quantifier Human kit and QuantiBlot should not
be significant.
For SGM+ STR assays, set up with DNA input amounts
determined by the results of Quantifiler kit assays to provide
complete profiles for all samples, with no off-scale or drop-out
allele peaks that would have resulted from inaccurate DNA
quantification.
Experiment
Fifty reference samples (taken from laboratory staff- 25 male and
25 female) and thirty casework samples were quantitated with
Quantifier kits and QuantiBlot, amplified with SGM+ and analysed
on a 3100 Genetic Analyzer. It was deemed that the range of
quantification data would be covered with these samples.
SGM+ STR reactions were adjusted to give a more consistent
amount of 1ng/ul if the DNA concentration was high enough. The
samples with a low concentration were added to the SGM+
reactions at the maximum allowed volume of 20ul. SGM+ kit assay
results were then obtained by electrophoresis on the ABI PRISM
3100 genetic analyser, and assessed according to the criterion that
STR peaks should be within the range to generate successful
genotype results (i.e. no drop out or off scale peaks) Evaluation
% Differences were calculated as Quantifiler Human kit
results/QuantiBlot results
DNA profiles quantitated with Quantifier kits assessed over the
range of concentrations 10pg/ul and 2.0ng/ul.
Results:
% Differences between the Quantifier Human kit and QuantiBlot
systems exceeded 50%.
The difference can for the most part be explained because the
comparison in the QuantiBlot system is done by a visual
comparison against the DNA standards as against extrapolation
from a standard curve. A more accurate comparison of %
differences would be achievable if comparing two equivalent DNA
standard curve systems. As the Quantifier Human kit gave overall
higher quantification data it was deemed to be more fit for purpose
than the existing technique of QuantiBlot.
Concordant and successful genotypes with no drop out or off scale
peaks obtained for Quantifier systems over the range of
concentrations 40pg/ul and 2.0ng/ul. Profiles were also obtained for

Ref code: QQC-VAL-002 - ANNEX
Issue No. 001
Page: 6 of 65
20pg/ul (.2ng/ul in 20ul) but imbalance was observed in the peaks
Conclusions: Fit for purpose
Parameter Description
Precision
The tightness of the quantification results
Demand
The mean CT FAM results for the DNA standards going from the
range of approximately 23 to 25 for the highest standard (50 ng/μL)
to approximately 33 to 36 for the lowest standard (23 pg/μL).
Range of the CT Vic (IPC) in the range of approximately 27 to 29 for
all standards and samples.
Experiment
A set of 8 standard dilutions of Quantifiler DNA standards were
made ranging in concentrations of 50ng to 0.023ng. These were run
in 3 separate plates on 2 separate days.
Twenty single source samples were quantified on three different
days. Each of the twenty samples was also quantified in triplicate
on a single run.
Male: female mixtures were also prepared and quantified in
triplicate over several days
Evaluation
The CT FAM values were compiled, averaged and SD determined.
Average CT FAM values for 8 DNA standards were plotted against
concentration to ensure linearity
Also, the CT Vic values were compiled, averaged and SD determined
Ref code: QQC-VAL-002 - ANNEX
Issue No. 001
Page: 7 of 65
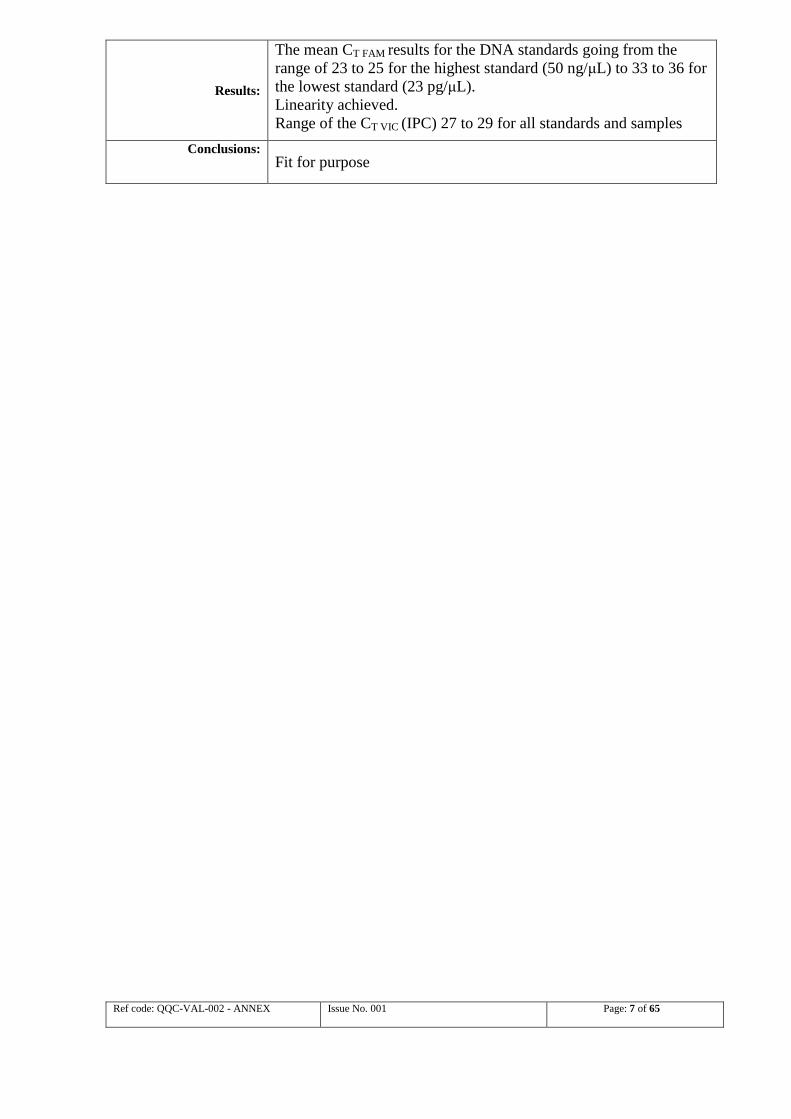
Results:
The mean CT FAM results for the DNA standards going from the
range of 23 to 25 for the highest standard (50 ng/μL) to 33 to 36 for
the lowest standard (23 pg/μL).
Linearity achieved.
Range of the CT VIC (IPC) 27 to 29 for all standards and samples
Conclusions: Fit for purpose
Ref code: QQC-VAL-002 - ANNEX
Issue No. 001
Page: 8 of 65
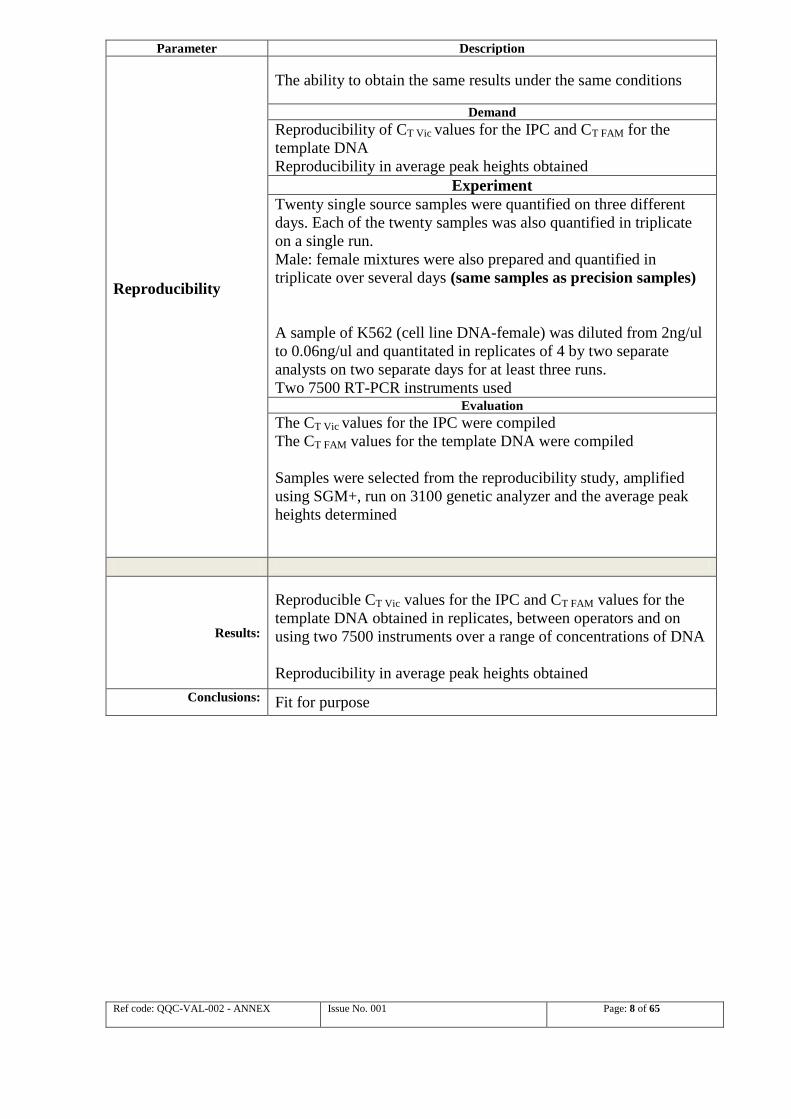
Parameter Description
Reproducibility
The ability to obtain the same results under the same conditions
Demand
Reproducibility of CT Vic values for the IPC and CT FAM for the
template DNA
Reproducibility in average peak heights obtained
Experiment
Twenty single source samples were quantified on three different
days. Each of the twenty samples was also quantified in triplicate
on a single run.
Male: female mixtures were also prepared and quantified in
triplicate over several days (same samples as precision samples)
A sample of K562 (cell line DNA-female) was diluted from 2ng/ul
to 0.06ng/ul and quantitated in replicates of 4 by two separate
analysts on two separate days for at least three runs.
Two 7500 RT-PCR instruments used
Evaluation
The CT Vic values for the IPC were compiled
The CT FAM values for the template DNA were compiled
Samples were selected from the reproducibility study, amplified
using SGM+, run on 3100 genetic analyzer and the average peak
heights determined
Results:
Reproducible CT Vic values for the IPC and CT FAM values for the
template DNA obtained in replicates, between operators and on
using two 7500 instruments over a range of concentrations of DNA
Reproducibility in average peak heights obtained
Conclusions: Fit for purpose

Ref code: QQC-VAL-002 - ANNEX
Issue No. 001
Page: 9 of 65
Parameter Description
Sensitivity
Studies to determine sensitivity
Demand
Quantification result obtained at 0.023ng/ul (23pg)
Experiment
Series of dilutions 1/10 to 1/1000 were made using a male DNA
control sample (5ng/ul) in Tris EDTA buffer. The dilutions were
run in triplicate on 3 different plates.
Evaluation
DNA quantification data obtained for the dilutions assessed
Results:
Quantifier kits could detect DNA in 1/1000 dilution (5pg/ul). While
DNA can be detected at these levels poor profile quality/no profile
was obtained at these low levels of DNA.
Conclusions: Fit for purpose

Ref code: QQC-VAL-002 - ANNEX
Issue No. 001
Page: 10 of 65
Parameter Description
Mixtures studies
Quantifier reaction should show the large range of concentrations
in the different mixture samples and distinguish different
contributors (male/female). Demand
Lowest amount of male DNA that can be still amplified and
detected in the presence of female DNA (total)
(0.05ng/ul male detected in presence of 50ng/ul of female DNA)
Experiment
A series of mixtures were made 1:1, 1:5, 1:25, 1:50, 1:100, 1:250,
1:500 and 1:1000 using a mixture of male and female DNA
samples in a final volume of 100ul.
Male DNA sample- Quantifier DNA standard in kit (200ng/ul)
Female DNA sample used –K562 DNA standard, 623ng/ul. The
male DNA was kept constant in all dilutions at a concentration of
50pg/ul (0.05ng/ul). The female DNA ranged from 50pg/ul in the
1:1 dilution to 50ng/ul in the1:1000 dilution. Each sample was
analysed in three replicates reactions each with the Quantifier
Human and Quantifier Y assays. Evaluation
Results from the three replicates reactions each with the Quantifier
Human and Quantifier Y assays were evaluated to determine if (1)
the Quantifier Human showed the expected increase in total human
genomic DNA as a result of the adding K562 and (2) the Quantifier
Y remained un affected by the increase in female DNA detecting
only the constant level of male DNA.
Results:
Quantifier Human showed the expected increase in total human
genomic DNA as a result of the adding K562
Quantifier Y remained un affected by the increase in female DNA
detecting only the constant level of male DNA.
Conclusions: Fit for purpose

Ref code: QQC-VAL-002 - ANNEX
Issue No. 001
Page: 11 of 65
Parameter Description
False positive rate
Assessment of false positive rate
Demand
Quantifier kit assays prepared in the absence of DNA give a
CT FAM>50
Experiment
A set of 50 reactions of each Quantifiler
kit assay (Human and Y) were prepared and dispensed as usual.
Each reaction received 2 μL of TE Buffer as its sample volume.
The assays were run as per the standard protocol except for one
change: thermal cycling was extended to 50 cycles. The samples
were analyzed with the SDS software after completion of the runs,
and those with a CT that was <50 would have been considered to be
false-positive results.
10 reagent blanks from previous proficiency trials were quantified
Evaluation
The samples were analyzed after completion of the runs, and those
with a CT that was <50 would have been considered to be false-
positive results.
Results:
All samples gave CT that was >50
Conclusions: Fit for purpose

Ref code: QQC-VAL-002 - ANNEX
Issue No. 001
Page: 12 of 65
6. Conclusions Summary All parameters tested deemed fit for purpose and no additional
work required.
Plan of internal quality
control: -Quality assurance parameters and reporting guidelines derived
from internal validation results
-For calibration curve
An R2 value ≥ 0.99 acceptable (closeness of fit between the
standard curve regression line and the individual CT FAM data
points of Quantification standard reactions)
-Slope indicates the PCR amplification efficiency.
For QuantifilerTM
Human DNA slope values required between –2.9
and –3.3
For QuantifilerTM
Y DNA slope values required between –3.0and –3.6
-CT FAM results for the DNA standards used to monitor the quality
of batch lots of quantification kits
Statement on fitness for
intended purpose X The method fulfils the demand □ The method does not fulfil the
demand
The following should be done….
Reference Documents
SWGDAM Validation guidelines for DNA Analysis Methods
Developmental Validation of the QuantifilerTM Real-Time PCR Kits for the Quantification
of Human Nuclear DNA Samples. J Forensic Sci, July 2005, Vol. 50, No. 4

Ref code: QQC-VAL-002 - ANNEX
Issue No. 001
Page: 13 of 65
5.1.2 Quantification of alcohol in blood
SINGLE-LABORATORY VALIDATION
OF
MEASUREMENT PROCEDURES
1. Specify the measurement procedure, analyte, measurand and units
The measurement procedure Quantitative analysis of ethanol in blood and urine using headspace GC-FID
Analyte Ethanol
The measurand Concentration of ethanol in liquid
Unit g/L
2. Specify the Scope
Sample type – matrix Human blood samples
Measuring range 0.1 – 3 g/L
Intended use of the results Court Reports and Intelligence reports to Police force
3. Requirement on the measurement procedure
Remark: the criteria set for precision and bias are the legal requirements in Belgium.
Parameters to be validated Value requested
Precision
Repeatability RSD <12% (0.2 g/L)
RSC <8% (>0.4 g/L)
Within-lab reproducibility RSD <12% (0.2 g/L)
RSD<8% (>0.4 g/L)
Trueness
Test for bias
Bias <15 % (0.1 0.4 g/L)
Bias < 5% (0.41 – 0.69 g/L) Bias <3%
(>0.7 g/L)
Selectivity
Test for possible interference
Distinguishability of compounds and
the internal control
Measurement range LOD
0.025 g/L
LOQ
0.1 g/L
Linearity
Residual < 3 % (> 0,4l)
Residual < 0,01 (0,4 g/l)
Ruggedness (Robustness)
Investigation towards influence of the
matrix
Stability Processed samples
Freeze-thaw
Longterm storage
stable
4. Origin of the Measurement Procedure
VALIDATION
New In-House Method
Full
Modified Validated Method Partial
Official Standard Method “Simple”

Ref code: QQC-VAL-002 - ANNEX
Issue No. 001
Page: 14 of 65
Parameter Description
Precision
Repeatability,
Within-Lab Reproducibility,
Demand
Repeatability/Within-Lab Reproducibility for low amounts (0.2 g/L) lower than 12%
Repeatability/Within-Lab Reproducibility for higher amounts (>0.4 g/L) lower than 8%
Experiment
9 control samples (6 in serum and 3 in full blood) were processed in duplo, and this at 8
different days.
Results of the measurements with serum control samples.

Ref code: QQC-VAL-002 - ANNEX
Issue No. 001
Page: 15 of 65
Serum
controles
Conc.
(g/L) Run1 Run2 Run3 Run4 Run5 Run6 Run7 Run8
0,2 0,212 0,199 0,206 0,206 0,206 0,213 0,210 0,206
0,209 0,198 0,203 0,204 0,199 0,207 0,214 0,209
0,5 0,499 0,516 0,499 0,513 0,506 0,548 0,516 0,520
0,497 0,514 0,508 0,510 0,495 0,505 0,506 0,526
0,8 0,796 0,782 0,793 0,793 0,794 0,800 0,795 0,802
0,788 0,783 0,790 0,798 0,791 0,794 0,806 0,797
1,1 1,128 1,124 1,120 1,146 1,119 1,108 1,129 1,135
1,122 1,135 1,162 1,125 1,111 1,128 1,133 1,146
1,5 1,475 1,489 1,520 1,503 1,513 1,502 1,468 1,550
1,490 1,493 1,506 1,524 1,494 1,472 1,481 1,482
3 3,048 3,039 3,132 3,050 3,119 2,989 2,988 3,048
2,955 3,020 3,145 3,109 3,132 3,168 3,081 3,072
Calculations demonstrated for serum control 0.2g/L
Anova: Single Factor
SUMMARY
Groups Count Sum Average Variance
Column 1 2 0,421049 0,2105245 2,98901E-06
Column 2 2 0,397517 0,1987585 1,00962E-06
Column 3 2 0,408793 0,2043965 5,89961E-06
Column 4 2 0,409996 0,204998 4,2108E-06
Column 5 2 0,405196 0,202598 2,47526E-05
Column 6 2 0,420174 0,210087 1,87762E-05
Column 7 2 0,424031 0,2120155 8,88311E-06
Column 8 2 0,41456 0,20728 4,15873E-06
ANOVA
Source of Variation SS df MS F P-value F crit
Between Groups 0,000283409 7 4,0487E-05 4,582581513 0,024177467 3,500463855
Within Groups 7,06797E-05 8 8,83497E-06
Total 0,000354088 15
Repeatability: Bias [%]: 3,68
sr2 = MSwithin =
8,83497E-
06
Average of all measurements = 0,206
So: RSDr [%] = 1,44
Time-different intermediate precision:
st2 = (MSbetween - MSwithin)/n
= 1,5826E-05
st2 + sr
2 = 2,4661E-05
So: RSD(t) [%] = 2,41
Results:
Control sample Repeatability (%) Within-lab reproducibility
(%)
0.2 g/L serum 1.44 2.41
0.5 g/L serum 2.3 2.59
0.8 g/L serum 0.52 0.82
1.1 g/L serum 1.21 1.21

Ref code: QQC-VAL-002 - ANNEX
Issue No. 001
Page: 16 of 65
1.5 g/L serum 1.39 1.45
3.0 g/L serum 1.89 2.04
0.5 g/L full blood 1.09 1.54
0.8 g/L full blood 1.58 1.73
1.1 g/L full blood 1.66 2.08
Conclusions: Fit for purpose
Parameter Description
Bias
Laboratory bias
Selectivity
Demand
Depending on the amount of alcohol in the sample:
<15% for low concentrations (0.1-0.4 g/L)
<5 % for moderate concentrations (0.41 – 0.69 g/L)
<3% for higher concentrations (<0.7 g/L)
Experiment
Bias calculation included in within-lab reproducibility analysis.
Selectivity:
Determination if the following compounds can be discriminated from ethanol:
methanol, acetone, isopropanol, n-propanol, t-butanol.
Results:
Control sample Bias (%)
0.2 g/L serum 3.68
0.5 g/L serum -0.35
0.8 g/L serum -1.98
1.1 g/L serum -1.61
1.5 g/L serum 0.04
3.0 g/L serum 0.80
0.5 g/L full blood 0.97
0.8 g/L full blood 0.64
1.1 g/L full blood 0.77
Selectivity:
All compounds can be separated except acetone and t-butanol.
Conclusions: Fit for purpose

Ref code: QQC-VAL-002 - ANNEX
Issue No. 001
Page: 17 of 65
Parameter Description
Measuring range
Linearity
Limit of Quantification (LOQ)
Limit of Detection (LOD)
Demand
Residual < 3% (<0.4 g/L)
Residual < 0.01 (0.4g/L)
Which is the lowest concentration still to be quantified
Which is the lowest concentration still to be detected in a reproducible
manner
Experiment
Linearity
Ethanol calibration curves were set up using standards for 6 times and
the Residual % was calculated
Limit of quantification:
a. By testing
A 0.1 g/L control sample in either serum or full blood was run during 8
days in duplo. The bias, repeatability and within-lab reproducibility was
calculated and verified if this is still within criteria.
b. By calculation.
Following the above experiment the LOQ can be calculated as 10sRw
Limit of detection. A dilution series was set up of a control sample in
serum and in full blood. The signal to noise ratio were determined for
each sample in a duplo analysis. S/N values above 5 were determined as
positive.
Evaluation
Linearity
Limit of Quantification:
a. Determination by testing (control sample as 0.1 g/L)
Matrix Bias (%) Repeatability
(%)
Within-lab
reproducibility
(%)
Serum 9.08 3.06 5.1
Full blood 9.31 1.63 3.12
b. determination by calculation (LOQ = 10s : sRw)
LOQ in serum: 0.05 g/L
LOQ in full blood: 0.03 g/L
Limit of detection
Dilution to
concentration
S/N ratio in serum S/N ratio in blood
0.05 13.5 10.2
0.025 5.65 5.4
0.01 2.55 2.3
0.005 1.25 1.25

Ref code: QQC-VAL-002 - ANNEX
Issue No. 001
Page: 18 of 65
Results:
Linearity:
Residual% <3% (>0.4g/L)
Residual <0.01 (0.4g/L)
The limit of quantification: the 0.1 g/L sample gave a reproducible and correct
result. The calculation following these measurements predicted the real LOQ at
0.05 g/L in serum and 0.03 g/L in full blood.
The limit of detection: the dilution sample to concentration of 0.025 %gave an
average S/N value of >5
Conclusions: Fit for purpose
Parameter Description
stability
Stability
Demand
Measure the stability of results1
I. Post-processed in the autosampler (room temperature 24h)
II. Freeze-thaw (3 cycli)
III. Long-term storage 4°C / -20°C
Experiment
I. QC samples (0.5 g/L and 1.1 g/L in full blood) were prepared, and
analyses freshly (set a) or after storage 24 hours in the autosamples (set
b)
II. QC samples (0.5 g/L and 1.1g/L in full blood) were prepared and
freeze-thawed three times. The stability samples (set b) were processed
and compared to QC samples prepared freshly at the day of the process
as control samples (set a)
III. QC samples (0.5 g/L and 1.1 g/L in full blood) were prepared and
stored for a longer period (2 months) at respectively 4°C or -20°C. The
stability samples (set b) were processed and compared to QC samples
prepared freshly at the day of the process as control samples (set a)
Comparison is done by comparing the average peak areas, the ratio (b/a), and the
determination of the 90% confidence interval and 80-120% acceptance interval.
Evaluation
1 Based on Wille et al. (2011)

Ref code: QQC-VAL-002 - ANNEX
Issue No. 001
Page: 19 of 65
A. Stability (24h) of processed samples in autosampler QC sample 0.5 g/L 1.1 g/L
Average area ratio (ethanol/n-propanol)
of the control samples (a)
0.322 0.716
Average area ratio (ethanol/n-propanol)
of the stability samples (b)
0.328 0.704
Ratio b/a*100% 101.8% 98.5
90% Confidence interval of the area ratio
of the stability samples
0.324-0.332 0.697-0.711
80-120% Acceptance interval of the area
ratio of the control samples
0.258-0.387 0.572-0.859
B.Stability (freeze-thaw) of processed samples
QC sample 0.5 g/L 1.1 g/L
Average area ratio (ethanol/n-
propanol) of the control samples (a)
0.319 0.722
Average area ratio (ethanol/n-
propanol) of the stability samples (b)
0.339 0.758
Ratio b/a*100% 106.2% 105.1%
90% Confidence interval of the area
ratio of the stability samples
0.333-0.345 0.752-0.764
80-120% Acceptance interval of the
area ratio of the control samples
0.255-0.383 0.577-0.866
Ca. long-term storage 4°C
QC sample 0.5 g/L 1.1 g/L
Average area ratio (ethanol/n-
propanol) of the control samples (a)
0.322 0.716
Average area ratio (ethanol/n-
propanol) of the stability samples (b)
0.312 0.720
Ratio b/a*100% 96.8% 100.6%
90% Confidence interval of the area
ratio of the stability samples
0.310-0.314 0.698-0.742
80-120% Acceptance interval of the
area ratio of the control samples
0.258-0.387 0.572-0.859
Cb. Long-term storage -20°C
QC sample 0.5 g/L 1.1 g/L
Average area ratio (ethanol/n-propanol)
of the control samples (a)
0.322 0.716
Average area ratio (ethanol/n-propanol)
of the stability samples (b)
0.310 0.714
Ratio b/a*100% 96.3% 99.8%
90% Confidence interval of the area
ratio of the stability samples
0.295-0.325 0.700-0.728
80-120% Acceptance interval of the
area ratio of the control samples
0.258-0.387 0.572-0.859
Results: No significant change in values is obtained by any kind of stability study
Conclusions: Fit for purpose

Ref code: QQC-VAL-002 - ANNEX
Issue No. 001
Page: 20 of 65
6. Conclusions
Summary Laboratory/customer demands met
Plan of internal quality
control:
Control charts put in place to ensure the system is operating within its
specifications.
Statement on fitness for
intended purpose The method fulfills
the demand
□ The method does not fulfill
the demand
The following should be done….
Reference Documents
1. Wille, S., F. Peters, V. Di Fazio & N. Samyn. Practical aspects concerning validation and quality
control for forensic and bioanalytical quantitative methods. 2011. Accred Qual Assur 16: 279-92.

Ref code: QQC-VAL-002 - ANNEX
Issue No. 001
Page: 21 of 65
5.1.3 Quantification of cocaine in powder
SINGLE-LABORATORY VALIDATION
OF
MEASUREMENT PROCEDURES
Sample validation-Guideline purposes only
1. Specify the measurement procedure, analyte, measurand and units
The measurement procedure Quantitative analysis of cocaine using GC-FID
Analyte Cocaine The measurand Concentration of cocaine in powder
Unit % (w/w)
2. Specify the Scope
Sample type – matrix Street drugs samples delivered to the laboratory
Measuring range 1 - 100 weight%
Intended use of the results Court Reports and Intelligence reports to Police Force
Note: Before any sample is submitted for quantitative analysis it
will already have been analysed qualitatively and identified by
GCMS.
This is a quantitative method with a low demand on uncertainity
3. Requirement on the measurement procedure
Parameters to be validated Value requested
Precision Repeatability RSDr 5 %
Within-lab
reproducibility
RSDRw 7%
Trueness Test for bias Bias < 10 % relative
Selectivity Test for possible interference
Measurement range LOD or LOQ LOQ 1 %
Linearity
Residual max deviation 2 %
relative
Ruggedness (Robustness)
Routine GC method – not
necessary
Measurement uncertainty
Expanded uncertainty
< 20 % relative
4. Origin of the Measurement Procedure
VALIDATION
New In-House Method
Full
Modified Validated Method Partial
Official Standard Method “Simple”

Ref code: QQC-VAL-002 - ANNEX
Issue No. 001
Page: 22 of 65

Ref code: QQC-VAL-002 - ANNEX
Issue No. 001
Page: 23 of 65
Parameter Description
Precision
Repeatability,
Within.Lab Reproducibility,
Demand
Repeatability <5% RSDr
Within-Lab Reproducibility <7% RSDRw
Experiment
RSDr-Same day, person and instrument- 10 separate analysis (in duplicate)
of check standard cocaine sample in one day
RSDRw- 3 Analysts, 3 analysis (in duplicate) per day on different days of
check standard cocaine sample
Evaluation
Using calculation of RSD and using ANOVA
sr- Results obtained
B C D
H1502005 13.48 3.626 24.02 23.91 Avg= 24.19 %
H1502014 13.48 3.594 23.81 SD= 0.28 %
H1502016 11.81 3.240 24.50 24.47 RSD= 1.1 % (relative)
H1502025 11.81 3.233 24.45
H1502027 13.15 3.571 24.25 24.28
H1502036 13.15 3.581 24.32
H1502038 14.96 4.036 24.09 24.05
H1502047 14.96 4.022 24.01
H1502049 11.12 2.984 23.96 24.01
H1502058 11.12 2.996 24.06
H1502060 11.69 3.103 23.70 23.70
H1502069 11.69 3.103 23.70
H1502071 12.06 3.277 24.27 24.28
H1502080 12.06 3.281 24.29
H1502082 10.26 2.821 24.55 24.60
H1502091 10.26 2.831 24.64
H1502093 11.36 3.105 24.41 24.40
H1502102 11.36 3.102 24.38
H1502104 12.50 3.384 24.18 24.21
H1502113 12.50 3.393 24.24
Column B- 10-15 mg of check standard in 5ml of methanol and internal standard
used to ensure results are on linear part of the standard curve
Column C- Wt of Cocaine (3-4mg)
Column D-purity of Cocaine

Ref code: QQC-VAL-002 - ANNEX
Issue No. 001
Page: 24 of 65
sRw- Results obtained
B C D
H1502006 13.48 3.601 23.86 Analyst 1 Analyst 2 Analyst 3
H1502008 13.48 3.579 23.71 23.78 Sample 1 23.78 24.54 24.42
H1502020 11.81 3.235 24.46 Sample 2 24.43 24.85 25.10
H1502021 11.81 3.227 24.40 24.43 Sample 3 24.23 24.18 24.84
H1502032 13.15 3.556 24.15
H1502036 13.15 3.581 24.32 24.23
dc190240 12.36 3.408 24.62
Anova:
Single
Factor
dc190243 12.36 3.385 24.46 24.54
dc190253 13.05 3.645 24.94 SUMMARY
dc190256 13.05 3.617 24.75 24.85 Groups Count Sum Average Variance
dc250237 12.74 3.456 24.22 Analyst 1 3 72.4465 24.14883 0.110458
dc250238 12.74 3.443 24.13 24.18 Analyst 2 3 73.56504 24.52168 0.111666
p2907017 11.81 3.228 24.41 Analyst 3 3 74.36278 24.78759 0.119366
p2907019 11.81 3.231 24.43 24.42
p2907030 10.89 3.059 25.08
p2907031 10.89 3.064 25.13 25.10
p2907036 10.57 2.937 24.81 ANOVA F crit
p2907039 10.57 2.943 24.86 24.84
Source of
Variation SS df MS F P-value 5.143249
Between
Groups 0.617737 2 0.308868 2.713424 0.144769
Within
Groups 0.682979 6 0.11383
P-value F crit P-value F crit
0.144769 5.143249 0.144769 5.143249
From ANOVA
Repeatability standard deviation is the root of MS (mean square) Within Groups
(w/w) or RSD 1,38 %
To calculate the within-lab reproducibility you first need to calculate the between group
standard deviation sx where n is the number of groups..
)/%(25.03
11383.0308869.0
n
MKvMKv groupsWithin upsBetweengrowwsx
RSDx =1,04 %
%72.104.138.1 2222 xRw RSDRSDRSDr
Results:
RSDr=1.12% and from ANOVA 1.4 %
RSDRw=1.72%
Conclusions: Fit for purpose
Ref code: QQC-VAL-002 - ANNEX
Issue No. 001
Page: 25 of 65
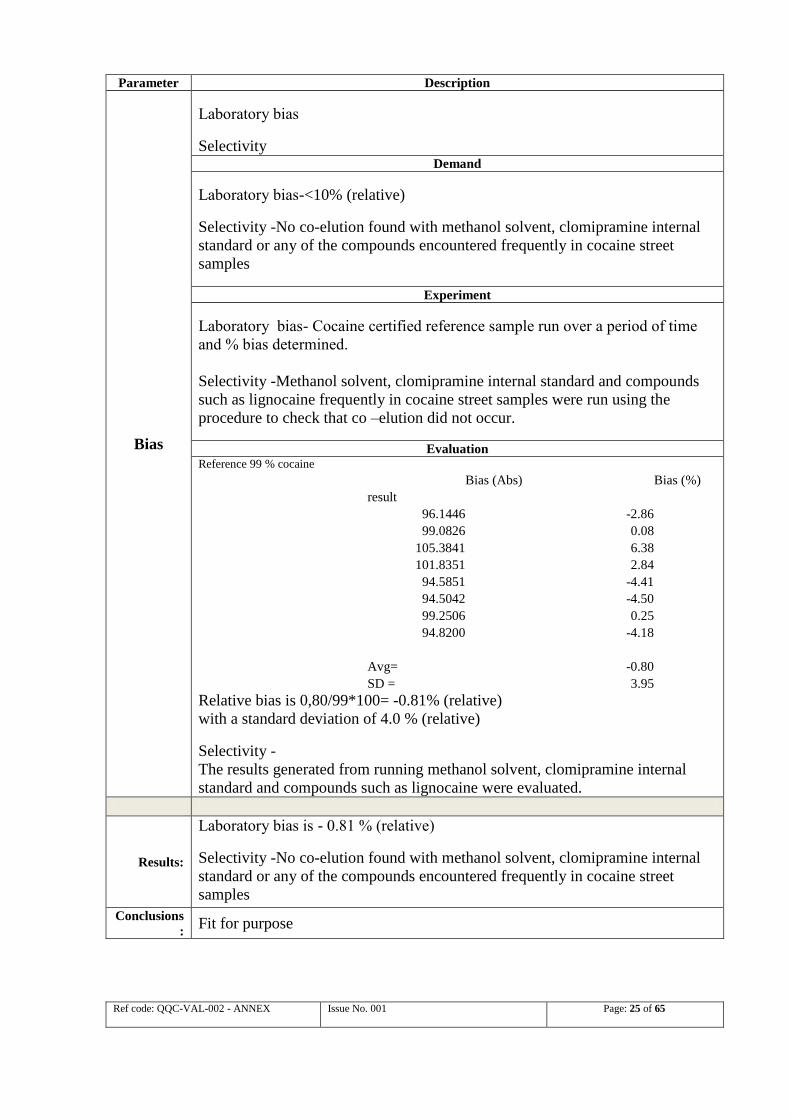
Parameter Description
Bias
Laboratory bias
Selectivity
Demand
Laboratory bias-<10% (relative)
Selectivity -No co-elution found with methanol solvent, clomipramine internal
standard or any of the compounds encountered frequently in cocaine street
samples
Experiment
Laboratory bias- Cocaine certified reference sample run over a period of time
and % bias determined.
Selectivity -Methanol solvent, clomipramine internal standard and compounds
such as lignocaine frequently in cocaine street samples were run using the
procedure to check that co –elution did not occur.
Evaluation
Reference 99 % cocaine
Bias (Abs) Bias (%)
result
96.1446 -2.86
99.0826 0.08
105.3841 6.38
101.8351 2.84
94.5851 -4.41
94.5042 -4.50
99.2506 0.25
94.8200 -4.18
Avg= -0.80
SD = 3.95
Relative bias is 0,80/99*100= -0.81% (relative)
with a standard deviation of 4.0 % (relative)
Selectivity -
The results generated from running methanol solvent, clomipramine internal
standard and compounds such as lignocaine were evaluated.
Results:
Laboratory bias is - 0.81 % (relative)
Selectivity -No co-elution found with methanol solvent, clomipramine internal
standard or any of the compounds encountered frequently in cocaine street
samples
Conclusions
: Fit for purpose

Ref code: QQC-VAL-002 - ANNEX
Issue No. 001
Page: 26 of 65
Parameter Description
Measuring
range
Linearity
Limit of Quantification (LOQ)
Demand
Linearity
Residual maximum deviation <2% relative in the higher range – over 10 %
cocaine
Limit of Quantification 1% with a signal to noise ratio >10
Experiment
Linearity
Cocaine calibration standards set up and run (done in triplicate initially and
augmented with further calibration curves generated for casework). When all
standards run each is added into the calibration curve using the data analysis
software.
% Residual = (predicted value for calibration standard- actual value) divided by
actual value times 100. Actual value is the actual amount of calibration
standard weighed out (and used as part of the calibration curve). Predicted
value is the result obtained when this standard’s result is recalculated using the
calibration curve.
Comment on the procedure. Samples of the check standard (used in
repeatability/reproducibility studies above) and the known certified reference
material (as used for system bias) are run to ensure that the curve is accurate
Limit of Quantification
Prepare a 1% w:w cocaine reference material : matrix mixture (Note the
composition of the matrix will be determined by factors such as which
constituents are normally present in street cocaine samples)
1% sample run a minimum of three times on GC-FID instrument to see if the
response is reproducible and the S/N ratio is > 10 Evaluation
Linearity
% Residual value calculated from results obtained. Less than 2 % relative for
calibrants over 10 % (w/w) cocaine
Limit of Quantification- 1% w:w cocaine reference material : matrix mixture
evaluated to ensure the response obtained was reproducible with S/N ratio > 10.
Baseline 1 % (w/w) cocaine Ratio
low high diff low High diff
DC03072 16.662 16.726 0.064 16.75 60.5 43.75 683
DC03074 16.56 16.665 0.105 16.6 62.3 45.7 435
DC03075 16.638 16.72 0.082 16.6 61.5 44.9 547

Ref code: QQC-VAL-002 - ANNEX
Issue No. 001
Page: 27 of 65
Results:
Linearity
For all calibration curves
Residual maximum deviation figure <2% relative obtained
Limit of Quantification
1% w:w cocaine reference material : matrix mixture gave a reproducible result
and S/N ratio > 10
Conclusions: Fit for purpose

Ref code: QQC-VAL-002 - ANNEX
Issue No. 001
Page: 28 of 65
Parameter Description
Measurement
Uncertainty
COMMENT: estimation of measurement uncertainty is outside the scope
of this guide. However from validation data it may be possible to estimate
uncertainty and here is presented one approach. Measurement
Uncertainty is here calculated from the validation data according to ISO
11352 Water quality — Estimation of measurement uncertainty based on
validation and quality control data. The approach is also given in
Nordtest 537www.nordtest.info
The data needed is
A Within-Lab reproducibility
B Bias measurements
The standard uncertainty cu can be calcuated
22 )()( biasuRuu wc
Where )( wRu in this case is RSDRw and
2
2
2 )Cref(un
sbiasbiasu bias
Where )Cref(u is the standard uncertainty for the reference value
The expanded uncertainty (U) is obtained by multiplying the combined
standard uncertainty, uc(y), by a chosen coverage factor, k. The expanded
uncertainty provides an interval which may be expected to include a large
proportion of the distribution of values which could be reasonably
attributed to the measurand. For most purposes a value of 2 should be
chosen for k.
U = uc(y)*2
Demand
Less than 20 % relative in the measurement range over 5 % (w/w) cocaine
Experiment
A: Within-laboratory reproducibility
See precision section
B. Bias
See Bias section
Evaluation

Ref code: QQC-VAL-002 - ANNEX
Issue No. 001
Page: 29 of 65
A: intermediate precision.
From the precisions experiment RSDRw=1.72%
B. Bias
The relative bias obtained with 9 measurement different days is -0,81%
(relative) with a standard deviation of 4.0 % (relative)
Purity assay: >98.5% (w/w)
The purity is taken to be 99.25 ± 0.75 % (w/w) with a rectangular
distribution (i.e. equal probability that the true value lies anywhere within
the ± range).
To obtain the relative standard uncertainty for purity, u(ref), with a
rectangular distribution the ± value is divided by √3.
u(ref) = 0.75/√3/99*100 =0.44 % (relative)
%6.144.09
0.481.0)Cref( 2
2
22
2
2
u
n
sbiasbiasu bias
=
Calculation of the Combined & Expanded Uncertainty
%7.46.172.1)()(2 2222 biasuRuuU wc
Results: Expanded Uncertainty -
Less than 15% relative in the measurement range over 5 %
Conclusions: Fit for purpose
6. Conclusions Summary Laboratory/customer demands met
Results from casework calibration curves casework can be added
to linearity studies
Plan of internal quality
control: Control charts put in place to ensure the system is operating
within its specifications. It involves regularly monitoring the
result obtained of the concentration of the control check standard
(used for repeatability and reproducibility studies above).
Statement on fitness for
intended purpose The method fulfils
the demand
□ The method does not fulfil
the demand
The following should be done….
Reference Documents
EURACHEM / CITAC Guide CG4, “Quantifying uncertainty in analytical measurement”,
second edition, 2000.
ENFSI QCC, “Guidance for uncertainty measurement in quantitative analysis or testing
(UM)”, QCC-UM-001, Nov 2006.

Ref code: QQC-VAL-002 - ANNEX
Issue No. 001
Page: 30 of 65

Ref code: QQC-VAL-002 - ANNEX
Issue No. 001
Page: 31 of 65
5.1b.Primarily Qualitative
5.1.4 Qualitative screening for gun shot residues
IN-HOUSE VALIDATION
OF
MEASUREMENT PROCEDURES
VALIDATION PLAN
1. Specify the measurement procedure, analyte, measurand and units
The measurement procedure Gunshot Residue Analysis by Scanning Electron Microscopy / Energy
Dispersive X-ray Spectrometry
The measurand
2. Specify the Scope
Matrix Surface of microscopic stub
Measuring range 0 ÷ 100 PbSbBa particles
Intended use of the results Courts, prosecutors’ and police intelligence reports
3. Requirement on the measurement procedure
Parameters to be validated Value requested Precision Repeatability
RSDr 10 %
Within-lab
reproducibility RSDRw 10 %
Trueness Test for bias Bias 15 %
Sensitivity Sensitivity ≥ 85%
Measurement range LOD Particle’s diameter ≥ 0.5 mm
4. Origin of the Measurement Procedure
VALIDATION
New In-House Method Full
Modified Validated/Standard Method
Partial, modified ASTM 1588 – 08 method
Official Standard Method “Simple”

Ref code: QQC-VAL-002 - ANNEX
Issue No. 001
Page: 32 of 65
VALIDATION PLAN AND RESULTS
The whole process relies on results achieved from examination of ENSFI GSR PT test sample. In the
example the test sample, coded as SPS-5P-1A, originates from GSR 2003 PT edition. It is the synthetic
stub with known quantity and localization of PbSbBa particles on its surface. The test sample plays a role
of a standard, however is treated as a regular sample.
Sample
code
Total
number of
PbSbBa
Number of PbSbBa with a diameter
of
10
2.4
1.2
0.8
0.5
SPS-5P-
1A
100 3*
27**
26**
25**
22**
* only for sample orientation and focusing ** assigned, known number of particles with given diameter
Parameter Description
Precision
Repeatability,
Within Lab Reproducibility,
Demand
Repeatability 10% RSDr
Within Lab Reproducibility 10 % RSDRw
Experiment
RSDr – The test sample was analysed automatically 6 times by the same operator and with
the help of the same instrument.
RSDRw – The test sample was examined once per month as the control sample. The same
instrument was used, however various operators were involved.
Evaluation

Ref code: QQC-VAL-002 - ANNEX
Issue No. 001
Page: 33 of 65
1. RSDr
Sample
Name
Total
number
of
PbSbBa
Number of PbSbBa with a
diameter of
2.4
1.2
0.8
0.5
Run nr
1 92 26 26 24 16
Run nr
2 89 27 23 21 18
Run nr
3 89 26 24 23 16
Run nr
4 91 27 23 23 18
Run nr
5 88 26 25 22 15
Run nr
6 92 25 22 25 20
AVG
SD
RSDr
90
1,7
2%
26
0,8
3%
24
1,5
6%
23
1,4
6%
17
1,8
11%
2. RSDRw
Sample
Nae
Total
number
of
PbSbBa
Number of PbSbBa with a
diameter of
2.4
1.2
0.8
0.5
January 87 25 25 22 15
February 86 27 25 20 14
March 87 27 24 19 17
April 94 27 25 24 18
May 86 26 24 21 15
June 89 27 22 24 16
July 87 26 24 20 17
August 2 27 26 22 17
Septembe
r 90 26 23 22 19
October 90 26 26 21 17
Novembe
r 88 25 25 22 16
Decembe
r 86 27 25 20 14
AVG
SD
RSDRw
89
2,6
3%
26
0,8
3%
25
1,2
5%
21
1,6
8%
16
1,5
9%
Conclusions: Fit for purpose

Ref code: QQC-VAL-002 - ANNEX
Issue No. 001
Page: 34 of 65
Parameter Description
Trueness
SENSITIVITY – it is method's ability for identifying positive results. In the example, a
positive result means correctly detected and classified PbSbBa particle. The sensitivity
parameter is defined as
SENSITIVITY=TP/(TP+FN) *100%.
where TP – means number of true positive results, FN – means number of false negative
results.
Number of true positive TP results was calculated from the equation:
TP = Total Number of PbSbBa – FP.
The false positive result FP mostly may happen when the same particle is counted at least
two times because of fields overlapping effect. False negative result FN encounters when
PbSbBa particle is assigned to Pb, Ba, Sb, PbSb, PbBa, SbBa, Unclassified class or it stays
undetected at all. Acquiring the true negative result TN is unlikely due to the fact that the
test stub is non-PbSbBa particle free.
The artificial ENFSI GSR test samples were used in ENFSI GSR PT since 1999 and could
be used for validation and quality control.
BIAS is defined as difference between lab's results and assigned value of particles on the
test stub and it is expressed in the relative form.
BIAS = (Total Number of PbSbBa – Assigned Number of PbSbBa)/ Assigned Number of
PbSbBa*100%
Demand SENSITIVITY ≥ 85%
BIAS 15%
Experiment
Sensitivity and bias was calculated from data acquired from within lab reproducibility data.
Evaluation
Ref code: QQC-VAL-002 - ANNEX
Issue No. 001
Page: 35 of 65
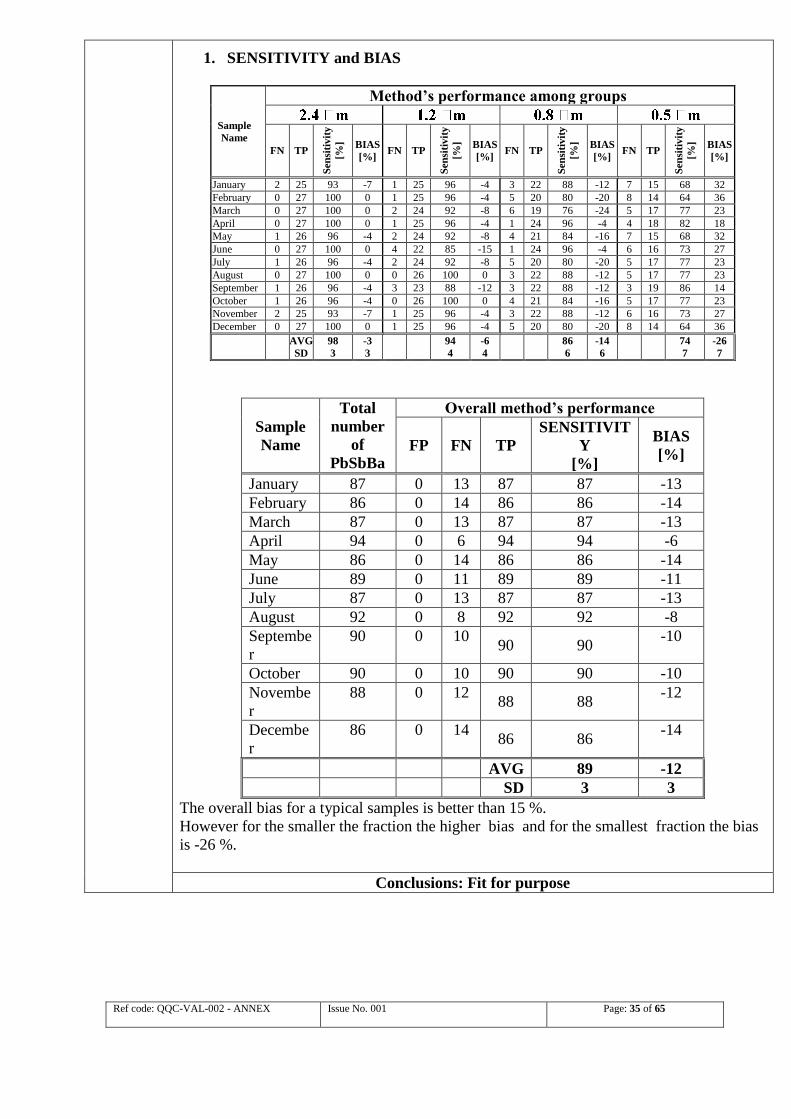
1. SENSITIVITY and BIAS
Sample
Name
Method’s performance among groups
FN TP
Sen
siti
vit
y
[%] BIAS
[%] FN TP
Sen
siti
vit
y
[%] BIAS
[%] FN TP
Sen
siti
vit
y
[%] BIAS
[%] FN TP
Sen
siti
vit
y
[%] BIAS
[%]
January 2 25 93 -7 1 25 96 -4 3 22 88 -12 7 15 68 32
February 0 27 100 0 1 25 96 -4 5 20 80 -20 8 14 64 36
March 0 27 100 0 2 24 92 -8 6 19 76 -24 5 17 77 23
April 0 27 100 0 1 25 96 -4 1 24 96 -4 4 18 82 18
May 1 26 96 -4 2 24 92 -8 4 21 84 -16 7 15 68 32
June 0 27 100 0 4 22 85 -15 1 24 96 -4 6 16 73 27
July 1 26 96 -4 2 24 92 -8 5 20 80 -20 5 17 77 23
August 0 27 100 0 0 26 100 0 3 22 88 -12 5 17 77 23
September 1 26 96 -4 3 23 88 -12 3 22 88 -12 3 19 86 14
October 1 26 96 -4 0 26 100 0 4 21 84 -16 5 17 77 23
November 2 25 93 -7 1 25 96 -4 3 22 88 -12 6 16 73 27
December 0 27 100 0 1 25 96 -4 5 20 80 -20 8 14 64 36
AVG
SD
98
3
-3
3
94
4
-6
4
86
6
-14
6
74
7
-26
7
Sample
Name
Total
number
of
PbSbBa
Overall method’s performance
FP FN TP
SENSITIVIT
Y
[%]
BIAS
[%]
January 87 0 13 87 87 -13
February 86 0 14 86 86 -14
March 87 0 13 87 87 -13
April 94 0 6 94 94 -6
May 86 0 14 86 86 -14
June 89 0 11 89 89 -11
July 87 0 13 87 87 -13
August 92 0 8 92 92 -8
Septembe
r
90 0 10 90 90
-10
October 90 0 10 90 90 -10
Novembe
r
88 0 12 88 88
-12
Decembe
r
86 0 14 86 86
-14
AVG 89 -12
SD 3 3
The overall bias for a typical samples is better than 15 %.
However for the smaller the fraction the higher bias and for the smallest fraction the bias
is -26 %.
Conclusions: Fit for purpose

Ref code: QQC-VAL-002 - ANNEX
Issue No. 001
Page: 36 of 65
6. Conclusions
Summary This method is fit for the intended use since: repeatability and reproducibility expressed as RSDr and RSDRw is
less than 10%. sensitivity of the method is better than 85% and absolute value of
bias is smaller than 15%.
Plan of internal quality
control:
Data collected during in within lab reproducibility experiment could be
utilized for creating control chart where further results for the test
sample can be regularly monitored.
Statement on fitness for
intended purpose The method fulfills
the demand
□ The method does not
fulfill
the demand
The following should be
done….

Ref code: QQC-VAL-002 - ANNEX
Issue No. 001
Page: 37 of 65
5.1.5 DNA-kit 17-loci STR PCR chemistry
SINGLE LABORATORY VALIDATION
OF
MEASUREMENT PROCEDURES (Amplification System -NGMSElect)
Sample validation-Guideline purposes only
1. Specify the measurement procedure, analyte, measurand and units
The measurement procedure Determine the ability of NGM SElect (Life Technologies) STR
procedures to generate DNA profiles from a range of sample
types.
Analyte Human Genomic DNA
The measurand 17-loci STR DNA Profile
Unit N/A
2. Specify the Scope
Matrix Crimestain and reference DNA samples
Measuring range ~125pg/ul-1ng/ul
3. Requirement on the measurement procedure
Intended use of the
results
The result of using NGM SElect chemistry is that more informative (i.e. containing more loci and therefore allele calls) DNA profiles should be generated from samples than is currently possible with SGM+ profiles.
The overall goal is to set up DNA profiling reactions using improved chemistry due to developments in
human identity kit production, evidenced by quiet baselines and additional allelic information.
Internal validation: To ensure kit performs as expected in the laboratory.
Parameters to be
validated Value requested
Known and non-
probative evidence
samples
(Concordance)
To confirm the SGM+ loci data generated using NGM SElect
chemistry is equivalent to the profile data generated for the same
samples using SGM+ chemistry.
Reproducibility and
Repeatability
Confirm that the STR profiles generated using NGM SElect
chemistry at 500 pg of 3 heterozygote DNA amplified at 30 cycles
and 1 ng amplified at 29 cycles by 2 operators and analysed on the
3130 analyser are complete and accurate using GMIDX software.

Ref code: QQC-VAL-002 - ANNEX
Issue No. 001
Page: 38 of 65
Precision of sizing
(Match Criteria)
All sized and called alleles in the samples analysed to display
a difference of less than 0.5 bp when compared to the size
of the corresponding allele in the allelic ladder, with the
largest size difference in any of the runs being 0.27 bp.
Sensitivity -
Corroborate
recommended input
DNA concentration
Complete profiles generated from 125 pg input template DNA
using both 29 and 30 cycle amplifications.
Stochastic
Determination of
allele call thresholds
on GMIDX analysis
software.
Confirm the range of template DNA amounts where allele
dropout is observed. Set the appropriate allele calling
thresholds on GMIDX analysis software.
Determination of
stutter ratios/
thresholds
Confirm the stutter ratios/thresholds down and up, for each locus
with regard to the manufacturer’s expected ratios from
DNA in solution and DNA on FTA cards.
Peak balance
analysis
Determine data for intra-locus and inter-locus peak height balances.
Average intra-locus and inter-loci balance is greater than 60%.
Mixture Analysis
To determine that NGMSElect chemistry is more sensitive at
detecting mixtures than SGM+ irrespective of the choice of
29 or 30 cycle amplification conditions.
Anticontamination
All profiles generated will be assessed for
1) the potential of drop in
2) any spurious peaks in the negative samples.
Qualifying test
studies
The qualifying test will consist of at least 50 typical crime stain
sample types to be amplified using NGM SElect.
4. Origin of the Measurement Procedure
VALIDATION
New In-House Method X Full internal validation
Modified Validated Method Partial
Official Standard Method “Simple”

Ref code: QQC-VAL-002 - ANNEX
Issue No. 001
Page: 39 of 65

Ref code: QQC-VAL-002 - ANNEX
Issue No. 001
Page: 40 of 65
5. Performance Parameters
Parameter Description
Known and non-
probative evidence
samples
(Concordance)
To confirm the SGM+ loci data generated using NGM SElect
chemistry is equivalent to the profile data generated for the same
samples using SGM+ chemistry. Demand
The SGM+ loci data generated using NGM Select are 100%
concordant with profile data generated for the same samples using
SGM+ chemistry. Experiment
50 population database samples (buccal swab samples on FTA)
amplified using NGM SElect, at 1ng at 29 cycles and analysed on
the 3130 analyser.
Evaluation
Examine the profiles generated for concordance
Results:
The SGM+ loci data generated using NGM Select are 100%
concordant with profile data generated for the same samples using
SGM+ chemistry.
Conclusions:
Fit for purpose
Parameter Description
Reproducibility and
Repeatability
Confirm that the STR profiles generated using NGM SElect
chemistry at 500 pg of 3 heterozygote DNA amplified at 30 cycles
and 1 ng amplified at 29 cycles by 2 operators and analysed on the
3130 analyser are complete and accurate using GMIDX software.
Demand
Complete and accurate (concordant) profiles generated
Experiment
500 pg of 3 heterozygote DNA samples amplified at 30 cycles and
1 ng amplified at 29 cycles by 2 operators and analysed on the 3130
analyser Evaluation
Profiles generated analysed

Ref code: QQC-VAL-002 - ANNEX
Issue No. 001
Page: 41 of 65
Results:
All profiles generated from the three heterozygotic samples were
concordant between repeats at 29 and 30 cycles and between
operators
Conclusions: Fit for purpose
Parameter Description
Precision of sizing
(Match Criteria)
Precision of sizing
Demand
All sized and called alleles in the samples analysed to display a
difference of less than 0.5 bp when compared to the size of the
corresponding allele in the allelic ladder, with the largest size
difference in any of the runs being 0.27 bp.
Experiment
Resolution of the allelic ladder calculated across one injection of
12 ladder samples injected twice and the ladders used in the
concordance, repeatability and reproducibility studies.
The size range for each allele in the samples across the repeatability
and reproducibility studies were calculated
Evaluation
Data compiled and analysed
Results:
All sized and called alleles in the samples analysed displayed a
difference of less than 0.5 bp when compared to the size of the
corresponding allele in the allelic ladder, with the largest size
difference in any of the runs being 0.27 bp.
NGM SElect is precise, that is all alleles fall within a 0.5 bp
window around the measured size for the corresponding allele in
the allelic ladder.
The 29 allelic ladders analysed all were able to resolve single base
pair size differences.
NGM SElect allelic ladder can resolve single base pair differences.
Conclusions: Fit for purpose

Ref code: QQC-VAL-002 - ANNEX
Issue No. 001
Page: 42 of 65
Parameter Description
Sensitivity -
Corroborate
recommended input
DNA concentration
Sensitivity - Determine the lowest DNA input amt per reaction that
can generate a full 17 loci STR profile using NGM SElect.
Demand
Complete profiles generated from 125 pg input template DNA
using both 29 and 30 cycle amplifications. Experiment
A 7 dilution series from 1ng to 10 pg amplified from three
heterozygote samples on four separate reactions at 500 pg at 30
cycles and 1 ng at 29 cycles and analysed on the 3130 analyser. (84
samples for each input template and cycle number)
Evaluation
Data compiled and analysed
Results:
Complete profiles were generated from 125 pg input template DNA
using both 29 and 30 cycle amplifications. Allele calls were also
generated from template amounts of less than 125 pg using both 29
and 30 cycles. 30 cycle amplifications were able to generate more
allele calls from low template amounts (50, 30 and 10 pg) than 29
cycle amplifications.
Conclusions: Fit for purpose
Parameter Description
Stochastic
Determination of
allele call thresholds
on GMIDX analysis
software.
Stochastic Determination of allele call thresholds
Demand
Confirm the range of template DNA amounts where allele dropout
is observed. Set the appropriate allele calling thresholds on
GMIDX analysis software.
Experiment
Samples generated during sensitivity studies used (i.e. dilution
series)
Evaluation
Data from the dilution series in the sensitivity study examined
based on the expected full STR profile.
Results:
Analysis of the data following injection on the 3130 analyser
indicates the following allele calling thresholds when analysing 29
cycle NGM SE amplifications:
Heterozygote calling threshold: 50 rfu
Homozygote calling threshold: 270 rfu

Ref code: QQC-VAL-002 - ANNEX
Issue No. 001
Page: 43 of 65
Conclusions: Fit for purpose

Ref code: QQC-VAL-002 - ANNEX
Issue No. 001
Page: 44 of 65
Parameter Description
Determination of
stutter ratios/
thresholds
Determination of stutter ratios/ thresholds
Demand
Confirm the stutter ratios/thresholds down and up, for each locus
with regard to the manufacturer’s expected ratio’s from DNA in
solution and DNA on FTA cards
Experiment
The 50 buccal FTA concordant samples were amplified with
NGM SElect at 1ng at 29 cycles and analysed on the 3130 analyser
with the calling threshold set at 1 rfu.
Evaluation
Data analysed
Results:
The stutter levels of the NGM SElect chemistry are in agreement
with the manufacturers expected stutter levels. The laboratory will
adopt the manufacturers recommendations for stutter levels and
apply these values to the analysis of NGMSElect profiles until such
time as enough data has been collected by the laboratory to change
the values as appropriate (i.e. longitudinal study).
Conclusions: Fit for purpose

Ref code: QQC-VAL-002 - ANNEX
Issue No. 001
Page: 45 of 65
Parameter Description
Peak balance analysis
Determine data for intra-locus and inter-locus peak height balances
Demand
Average intra-locus and inter-loci balance is greater than 60%.
Experiment
Data from samples from the concordance, repeatability,
reproducibility and sensitivity studies analysed with regard intra-
locus and inter-locus peak height balances.
Evaluation
Data analysed
Results:
Average intra-locus and inter-loci balance found to be greater than
60%. Operators should be aware that instances where intra-locus
balance values of less than 60% are observed are uncommon but
not rare occurring approx 3% of the time.
Conclusions:
Fit for purpose

Ref code: QQC-VAL-002 - ANNEX
Issue No. 001
Page: 46 of 65
Parameter Description
Mixture Analysis
Analysis of mixture samples. The highest mixture ratio that can
generate detectable alleles for the minor contributor using both
SGM+ and NGM SElect. Demand
NGMSElect chemistry is more sensitive at detecting mixtures than
SGM+ irrespective of the choice of 29 or 30 cycle amplification
conditions.
Experiment
Ratios of 1:1 to 1:10 were amplified for two of the three
heterozygote samples using both SGM+ and NGM SElect. These
were amplified at 500 pg at 30 cycles and 1 ng at 29 cycles for the
NGM SElect kit and analysed using the 3130.
Evaluation
Analyse data
Results:
NGMSElect chemistry is more sensitive at detecting mixtures than
SGM+ irrespective of the choice of 29 or 30 cycle amplification
conditions.
Conclusions: Fit for purpose

Ref code: QQC-VAL-002 - ANNEX
Issue No. 001
Page: 47 of 65
Parameter Description
Anticontamination
Assess contamination risk
Demand
All profiles generated will be assessed for
1) the potential of drop in
2) any spurious peaks in the negative samples
Experiment
All profiles generated assessed for
1) the potential of drop in
2) any spurious peaks in the negative samples
Evaluation
Data analysed
Results:
Allelic drop-in can occur at a low level with NGM SElect
chemistry. The samples observed had a low template input (100 pg
and 50 pg) and were both amplified at 30 cycles. Allelic drop in is
a reported phenomenon in the literature (Weiler et al, FSI Genetics,
2012, Jan) and care must be taken when interpreting profiles that
contain alleles generated from low template inputs.
Conclusions: Fit for purpose

Ref code: QQC-VAL-002 - ANNEX
Issue No. 001
Page: 48 of 65
Parameter Description
Qualifying test studies
The qualifying test will consist of at least 30 typical crime stain
sample types to be amplified using NGM SElect.
Demand
Good success rate (i.e. full DNA profiles obtained) and profiles
give concordant results
Experiment
Typical casework type samples were selected for profiling with
NGM SElect. These included cigarette butts, chewing gum,
dilutions of semen on swabs, blood spots on denim fabric,
Epithelial cells on swabs and minitapes, tissue samples and blood
samples submitted for paternity testing.
Reference samples and crimestains from CTS Forensic Biology
DNA mixture trials were profiled with NGMSElect. The testing
body only accepts the SGM+ loci which overlap with the
NGMSElect and therefore only the typing information for these
loci were submitted.
Samples were processed using the Qiagen EZ1XL machine
Evaluation
Data analysed
Results:
Expected profiles obtained from crimestain samples and CTS
proficiency trials
Conclusions: Fit for purpose
6. Conclusions Summary All parameters tested yielded fit for purpose results.
Determination of stutter ratios/ thresholds data to be reviewed
following longitudinal studies
Plan of internal quality
control: Extraction positive and negative controls and amplification
positive and negative controls in system
Appropriate level of anticontamination measures and
environmental monitoring put in place
Statement on fitness for
intended purpose X The method fulfils the demand □ The method does not fulfil the
demand
The following should be done….

Ref code: QQC-VAL-002 - ANNEX
Issue No. 001
Page: 49 of 65
Reference Documents
SWGDAM Validation guidelines for DNA Analysis Methods
Life technologies developmental validation data
5.1.6 human salivary alfa-amylase detection by RSIDTM
-saliva test.
IN-HOUSE VALIDATION OF
MEASUREMENT PROCEDURES
By courtesy by Crab R. and the DNA-unit of the NICC
VALIDATION PLAN
1. Specify the measurement procedure, analyte, measurand and units
The measurement
procedure
Detection of human saliva using the RSIDTM
-Saliva
lateral flow immunochromatographic strip test.
Analyte Human salivary alfa-amylase
The measurand Qualitative detection of human saliva.
Unit N/A
2. Specify the Scope
Matrix Fluids, crime scene samples
Measuring range
Intended use of the results Detection / confirmation of human origin (saliva) at crime scene
samples
3. Requirement on the measurement procedure
Parameters to be validated Value requested
Precision Repeatability Identical results
Within-lab
reproducibility
Identical results
Trueness
Specificity
Investigate the cross-reactivity
with
Saliva from animals
Other human body
fluids
Measurement range² LOD
High dose hook effect
(upper LOD)
<1 µL2
determination
2 The kit proposes 1µL as LOD, but in practice it will be lower

Ref code: QQC-VAL-002 - ANNEX
Issue No. 001
Page: 50 of 65
Ruggedness (Robustness) Cotton swabs
Forensic-like surfaces
Stability of processed
teststrips
No influence
No influence
Readability after storage
STR analysis starting
from the RSIDTM
extraction buffer.
Genetic profile stability
No influence on the genetic
profile using the extraction
buffer

Ref code: QQC-VAL-002 - ANNEX
Issue No. 001
Page: 51 of 65
4. Origin of the Measurement Procedure
VALIDATION
New In-House Method Full
Modified Validated/Standard Method
Partial
Official Standard Method “Simple”

Ref code: QQC-VAL-002 - ANNEX
Issue No. 001
Page: 52 of 65
Parameter Description
Precision
Repeatability,
Within.Lab Reproducibility,
Demand
Identical results
Experiment
Repeatability :
A dilution series of liquid saliva diluted in RSIDTM
extraction buffer,
processed by one person in triplicate.
Within Lab reproducibility : an identical dilution series as above, but by
another technician and on another.
DATA
Technician 1 Technician
2
Salivaconce
ntration
nL/µl
Run 1 Run 2 Run3 Run 4
0.000 - - - -
0.005 - - - -
0.024 - - - -
0.048 - - - -
0.200 + + + +
0.333 + + + +
0.500 + + + +
2.494 + + + +
4.975 + + + +
Results: Corresponding results
Conclusion Fit for purpose

Ref code: QQC-VAL-002 - ANNEX
Issue No. 001
Page: 53 of 65
Parameter Description
Trueness
Specificity
Demand
Investigate the cross-reactivity using the kit on saliva samples of animals.
Investigate the cross-reactivity using the kit on other human body fluids
Experiment
A. Saliva samples of a wide variety of animals was tested (saliva
collected from animals of friends and colleagues and obtained from
animals in the Antwerp Zoo)
B. Human body fluids tested:
Blood
Urine
Sperm
Mother milk
Nasal secretions
The human body fluids were tested:
o separately
o in mixture with human saliva

Ref code: QQC-VAL-002 - ANNEX
Issue No. 001
Page: 54 of 65
DATA
A. all animal samples gave a negative test result except the saliva sample
of the Gorilla (Gorilla).
B. Test results on other body fluids (separately or mixed) Saliva
(µL)
Blood
(µL)
Urine
(µL)
Sperm
(µL)
Breast
Milk
(µL)
Result
10 -
10 -
10 -
10 (weak) +
10 10 10 -
5 5 +
5 50 +
5 5 +
5 50 +
5 5 +
5 50 +
Addition tests following the cross-reactivity seen on breast milk. Saliva
(µL)
Blood
(µL)
Urine
(µL)
Sperm
(µL)
Breast
Milk
(µL)
Result
1 -
5 -
10 (weak)+
20 +
50 +
10 20 +
10 20 (weak)+
10 20 +
10 20 +
10 10 10 5 -
10 10 10 50 +
10 10 10 10 20 +
Nasal secrete (which were collected with a cotton swab and not calculated
in µL)
Nasal secrete result
Swab 1 +
Swab 2 +
Results:
Cross-reactivity could be seen on the saliva of Gorilla.
Cross-reactivity of the kit was demonstrated for breast milk and nasal
secretes.
Conclusions
:
The purpose of the kit is to detect traces on the crime scene which could be
used for DNA-analysis. In this manner the cross-reactivity with Gorilla,
breast milk and nasal secretes are not interfering the final purpose of the
kit, only false positive for the validation of the kit in an analytical way.
The false-positivity of nasal secretes is in routine use an advantage, because
this samples can also be used for DNA-analysis.
Fit for purpose

Ref code: QQC-VAL-002 - ANNEX
Issue No. 001
Page: 55 of 65
Parameter Description
Measurement
range
Limit of detection
High dose hook effect (upper limit of detection)
Demand
Determine the minimal amount of saliva needed to obtain a positive test.
Determine the maximum amount of saliva still usable for this kit.
Experiment
Dilution series of human saliva in RSIDTM
saliva extraction buffer
Dilution series of human saliva in RSIDTM
saliva extraction buffer,
but saliva from another testperson, because concentration of
salivary alfa-amylase can differ between persons)
Mixtures of undiluted saliva and RSIDTM
saliva extraction buffer.
DATA
LOD
Salivaconce
ntration
nL/µl
Saliva from
testperson1
Saliva from
testperson2
0.000 - -
0.005 - -
0.024 - -
0.048 - weak +
0.200 + +
0.333 + +
0.500 + +
2.494 + +
4.975 + +
uLOD
Salivaconce
ntration
(nL/µl)
Saliva from
testperson1
Saliva from
testperson2
10 + +
24 + +
48 + +
91 + +
200 + +
333 + +
500 + +
Results:
The limit of detection of the testkit is a saliva concentration of 0.2 nL/µL
extraction buffer. Recalculation results in a corresponding value of 0.004
µL saliva addition to the teststrip.
The high dose hook effect could not be seen at high concentration (500
nL/µl). recalculation results in a corresponding value of 10 µL saliva
addition directly (without the dilution step) to the teststrip. (2500x LOD)
.
Conclusions
: Fit for purpose

Ref code: QQC-VAL-002 - ANNEX
Issue No. 001
Page: 56 of 65
Parameter Description
Ruggedness
Rugedness
Demand
What is the influence on results of the RSIDTM
saliva kit by :
1. the oral swab used as collector of the trace
2. the surface/object where the trace is collected from
3. storage of processes test strips
Experiment
1. A dilution series of liquid saliva was deposite on sterile cotton
swabs and allowed to air-dry prior to processing.
2. A range of routinely encountered forensic exhibits were laboratory
prepared (normal use like drinking, smoking, wetting and wearing)
by different testpersons (called G, M and J)
o Aluminium drinking cans
o Cigarette butts
o Envelopes
o Balaclava
A range of clothes, positively prepared in the laboratory by
depositing. Clothes were laboratory control prepared with
difference concentration of saliva and air-dryed.Those clothes were
screened with the Phadebas Forensic Press test, and possible traces
were collected
3. A collection (n=27) of RSID saliva tests was processed and stored
afterwards for one year at a dark, dry place at room temperature.
The reading of the strips was compared to the initially obtained
results.

Ref code: QQC-VAL-002 - ANNEX
Issue No. 001
Page: 57 of 65
DATA
1. The addition of diluted saliva on the cotton swab followed by air-
drying and subsequently processed by extraction using the RSIDTM
extraction buffer resulted in a higher LOD for the kit. Whereas the
LOD for liquid saliva was the deposit of the equivalent of 0.004 µL
saliva on the test strip, the equivalent of saliva to be added starting
from air-dried swabs 0.3µL.
2.
Item Test
perso
n
Result Test
person
Result Test
perso
n
Resu
lt
Aluminum soda can G + M + J +
G + M +
Cigarette butt (1x1
cm)
G +
G +
Cigarette butt (3x3
mm)
G +
G +
Envelope (1x1 cm) G + M + J +
Envelope (3x3 mm) G + M + J +
Balaclava-mouth
(3x3 mm)
G weak
+
M weak
+
J +
Balaclava-nose (3x3
mm)
G weak
+
M weak
+
J wea
k+
Different volumes of saliva were added to cotton T-shirt, a woolen jumper
and a jeans, followed by air-drying. The Phadebas Forensic Press test was
used to localize possible saliva. The localized places were extracted by
cutting out a 2x2 mm trace, which was processed.
In general can be shown that traces (by depositing of 0.5 µL saliva) could
be confirmed by the RSDTM saliva test. There is however a tendency that
the detection of possible traces differs using different types of textiles,
however this is depending on the efficiency of the Phadebas Forensic Press
test, which is outside the scope of this validation study.
3. All strips were still presenting the same result as the initial reading
after a storage of one year.
Results:
The difference between the use of liquid saliva or a cotton swab used
during sampling is resulting in a higher LOD of the test, however still with
a LOD low enough for routine use (0.3 µL).
Different types of forensic-like samples were tested and the RSIDTM
saliva
kit is able to detect saliva from samples likely to be encountered in forensic
laboratory case work.
If a rereading is necessary the storage of the strips at a dark, dry place at
room temperature is possible to obtain stable results.
Conclusions
: Fit for purpose

Ref code: QQC-VAL-002 - ANNEX
Issue No. 001
Page: 58 of 65

Ref code: QQC-VAL-002 - ANNEX
Issue No. 001
Page: 59 of 65
Parameter Description
Suitability in
the following
DNA-analysis
Investigate the suitability of the RSIDTM
kit prior to DNA-STR analysis
Demand
No influence of the RSIDTM
extraction buffer on the resulting genetic profile.
Experiment
All samples created during this validation study were investigated by DNA-STR
analysis.
Samples resulting in a positive RSIDTM saliva test result were resulting in a full genetic
profile.
Samples with values lower the LOD (a very weak or negative test resul, 0.048 nL/µl
dilution as an example) were resulting to a partial or negative genetic profile.
The study of the surfaces used for forensic analysis used two different sampling sizes of
cigarette butts, envelopes and textiles and both were resulting to full genetic profiles.
Results: If a positive signal is obtained by the RSID
TM saliva kit, a full genetic profile can be
obtained.
Conclusions
: Fit for purpose

Ref code: QQC-VAL-002 - ANNEX
Issue No. 001
Page: 60 of 65
6. Conclusions
Summary Laboratory/customer demands met
Plan of internal quality
control:
Each new serial nummer of kits will be tested using a positive
control (10 µL liquid saliva added to 200µL RSIDTM
extraction
buffer) and a negative control (only RSIDTM
extraction buffer).
Statement on fitness for
intended purpose The method fulfills
the demand
□ The method does not
fulfill
the demand
The following should be
done….
Reference Documents

Ref code: QQC-VAL-002 - ANNEX
Issue No. 001
Page: 61 of 65
5.2. Human-based examples
The two examples are provided with the aim to demonstrate Demonstration of how the
generic criteria are have been applied to two specific forensic evaluation fields: the
fingermark and fingerprint comparison and the bullet and cartridge cases comparison. The
fingerprint field is the example of a newly developed when the firearms field is an already
long established field. These examples have to be considered as two specific solutions
adapted particular situations and not as the solution to be followed step by step independently
of the situation and environment.
In order to achieve validation, both fields of expertise have followed a similar approach. The
first step consisted in a review of the scientific literature, in order to compile the existing and
established knowledge within the respective fields. A short list of references has been
extracted to support the different aspects of the method development. In house research and
development projects have been run to cover the aspects not existing in the literature and the
results have been published. The performance of the practitioners is monitored along the
ACEV examination through specific solutions in the protocol, for example to address the
questions of specimen usability, repeatability, reproducibility and context bias management.
Proficiency tests are used to test the global performance of the practitioners. Finally an
education program is developed to ensure, maintain and check the competence of the
practitioners.
5.2.1 Fingermark and fingerprint comparison
This example is derived from the new service (2012)“probabilistic fingerprint interpretation”
of the fingerprint individualization group of the Netherlands Forensic Institute.
5.2.1.1.. Method development
Dactyloscopy is on one of the oldest fields in forensic science. The description, the
classification and the selection of the features are abundantly mentioned in the literature of the
XIXth
, XXth
and XXIth
century.
Feature description
Ashbaugh, D.R., Qualitative-Quantitative Friction Ridge Analysis – An Introduction to Basic
and Advanced Ridgeology. Practical Aspects in Criminal and Forensic Investigations, ed. V.J.
Geberth. 1999, Boca Raton: CRC Press.
Feature selection and classification
Hutchins, L.A., Systems of friction ridge classification, in The Fingerprint Sourcebook, E.H.
Holder, L.O. Robinson, and J.H. Laub, Editors. 2011: Washigton D.C., USA.
United States Department of Justice and Federal Bureau of Investigation, The Science of
Fingerprints. 1984, Washington DC: U.S. Government Printing Office.
Feature availability, measurability and specimensusability
Langenburg, G.M., A Critical Analysis and Study of the ACE-V Process, in School of
Forensic Science, 2012, University of Lausanne, Switzerland, 48HrBooks, USA. p. 355.
Feature distinctiveness
The distinctiveness of the fingermark and especially of the minutiae configurations (2nd
level
of detail) is described in the literature. But research is still ongoing on how to compute a more
objective strength of evidence for the 1st, 2
nd and 3
rd levels of detail, and about the dependence
between the different levels of details.
General
Stoney, D.A., Measurement of Fingerprint Individuality, in Advances in Fingerprint
Technology, H.C. Lee and R.E. Gaensslen, Editors. 2001, CRC Press: Boca Raton. p. 327-
387.

Ref code: QQC-VAL-002 - ANNEX
Issue No. 001
Page: 62 of 65
Neumann, C., Statistics and Probabilities as a Means to Support Fingerprint Examination, in
Lee and Gaensslen’s Advances in Fingerprint Technology, R. Ramotowski, Editor. 2012,
CRC Press. p. 407 - 452.
Langenburg, G., Scientific Research Supporting The Foundations of Friction Ridge
Examinations, in The Fingerprint Sourcebook, E.H. Holder, L.O. Robinson, and J.H. Laub,
Editors. 2011, U.S. Department of Justice, NIJ: Washington D.C., USA. p. 14-3 – 14-31.
1st level details
Haraksim, R., et al. Assignment of the evidential value of a fingermark general pattern using
a Bayesian network. In:International Conference of the Biometrics Special Interest Group -
(BIOSIG). 2013. Darmstadt, Germany: Gesellschaft für Informatiek e. V. (G.I.).
de Jongh, A., et al., The frequencies of arch, loop and whorl fingerprint patterns. An
empirical study in the Dutch population. NFI Internal report / draft for publication, 2013.
2nd
level details Gutiérrez-Redomero, E., et al., Are the population differences in minutiae frequencies? A
comparative study of two Argentinian population samples and on Spanish sample. Forens.
Sci. Int., 2012. 222: p. 266-276.
3rd
level details
Anthonioz, A., et al., Level 3 Details and Their Role in Fingerprint Identification: A Survey
among Practitioners. J. Forens. Ident., 2008. 58(5): p. 562 - 589.
Feature dependence
Further research is necessary to understand the degree of dependence of the information of
each of the 3 levels of details in order to combine them in a logically correct manner.
Feature permanence
Barns, J., History, in The Fingerprint Sourcebook, E.H. Holder, L.O. Robinson, and J.H.
Laub, Editors. 2011, U.S. Department of Justice, NIJ: Washington D.C., USA. p. 1-5 – 1-22.
Feature robustness
Champod, C., et al., The Friction Ridge Identification Process, in:Fingerprints and other
Ridge Skin impressions, C. Press, Editor. 2004, CRC press: London.
5.2.1.2. Validation of the performance
Practitioner reproducibility
The reproducibility is addressed in each case, 2 examiners encode the specimens (marks and
prints) separately and then merge their results. The rules are in Quality document: “the
“description of the fingermark comparison method”.
Haraksim, R. and D. Meuwly, Fingerprint examiners: a comparison system whose
performance can be measured. NFI Internal report / draft for publication, 2013.
Practitioner repeatability Langenburg, G. and C. Champod, The GYRO System - A recommended Approach to More
Transparent Documentation. Journal of Forensic Identification, 2010. 61(4): p. 373 - 384.
Specimen usability
The criteria to determine the suitability for comparison is not made explicit yet, but it will be
added to the quality document “description of the fingermark comparison method”. For every
individual case the usability is documented in the case notes.
Ulery, B.T., et al., Understanding the sufficiency of information for latent fingerprint value
determinations. Forens. Sci. Int., 2013. 230(1-3): p. 99-106.
Proficiency test
The fingerprint individualization group takes part twice a year the CTS proficiency test and
once a year to the ENFSI-EFPWG collaborative exercise.

Ref code: QQC-VAL-002 - ANNEX
Issue No. 001
Page: 63 of 65
Context bias management
The management of the case information and the sequential unmasking are described in the
draft quality document: “Comparative dactyloscopic examination”.
5.2.1.3. Assessment of the competence of the practitioner
The competence of the practitioner is assessed during a training and assessment programme.
Passing the assessment leads to the authority to sign reports. The training programme is
composed of general courses (criminalistics, forensic statistics, law, report writing and
courtroom training) as well as area specific training on the job and other training activities
(literature reading, conference attendance).
The assessment of the competence is performed through written and oral examinations,
assessment of the practical work and the defence of casework reports in front of a moot court
constituted of professionals (judge, lawyer, counter expert). The final stage is constituted by
the defence of casework reports in front of an examination commission composed of an
external expert of the relevant area, a prosecutor and an internal criminalistics expert. Every
four years the signed-off forensic practitioners are reassessed defending a new set of reports
in front a similar examination commission.
The general competences that are relevant to all fields of expertise are described in the
“Education manual – training and assessment program for the certification forensic
practitioners”. The area specific competences relevant to the field of expertise of the
candidate are detailed in a field specific and personalized training and assessment program.
Such a program is composed of training activities composed of simulated casework using
portfolios of known cases, real casework, collaborative exercises and proficiency tests.
During the training the supervision decreases and the independency of the candidate
increases. The tutor of the candidate monitors the results of the training activities
Summary Laboratory/customer demands met
Statement on fitness for
intended purpose The method fulfills
the demand
□ The method does not
fulfill
the demand
The following should be
done….

Ref code: QQC-VAL-002 - ANNEX
Issue No. 001
Page: 64 of 65
5.2.2 Bullet and cartridge case comparison
This example is derived from the service “Comparison of spend ammunition part with or
without a firearm” developed from the 1950s with further development on the methodology
from 2008 by the firearms and ammunition group of the Netherlands Forensic Institute.
5.2.2.1. Method development
The bullet and cartridge cases comparison is one of the traditional fields of forensic
examination for which the description, the classification and the selection of the features
abundantly described in the literature.
Feature description, selection, classification
Rowe, W.F., Firearms laboratory analysis, in Encyclopedia of Forensic Sciences, J.A. Siegel,
P.J. Saukko, and G.C. Knupfer, Editors. 2000, Academic Press: London. p. 944-949.
Dutton, G., Firearms: Bullet and Cartridge Case Identification. Wiley Encyclopedia of
Forensic Science, 2009.
Rivera, G.C., Subclass Characteristics in Smith & Wesson SW40VE Sigma Pistols. AFTE
Journal, 2007. 39(3): p. 253-258.
Saribey, A. and A. Grace Hannam, Comparison of the Class and Individual Characteristics of
Turkish 7.65 mm Browning/.32 Automatic Caliber Self-Loading Pistols with Consecutive
Serial Numbers. . Journal of Forensic Sciences 2013. 58(1): p. 146-150.
Feature availability, measurability and specimens usability
Kerstholt, J.A., et al., Does suggestive information cause a confirmation bias in bullet
comparisons? Forensic Science International, 2010(198): p. 138–142.
Feature distinctiveness
The distinctiveness of the features is discussed in the literature, but more research is necessary
to compute a more objective strength of evidence for the different features present on the
bullets and cartridge cases and about the dependence between these features.
Mikko, D., J. Miller, and F. J., Reproducibility of Toolmarks on 20,000 Bullets fired through
an M240 Machine Gun Barrel. AFTE Journal, 2012. 44(3): p. 248-253.
LaPorte, D., An Empirical and Validation Study of Breechface Marks on .380 ACP Caliber
Cartridge Cases Fired from Ten Consecutively Finished Hi-Point Model C9 Pistols. AFTE
Journal, 2011. 43(4): p. 303-309.
Feature dependence
Further research is necessary to understand the degree of dependence of the different type of
information in order to combine them in a logically correct manner.
Feature permanence and robustness
Chumbley, L., et al., Clarity of Microstamped Identifiers as a Function of Primer Hardness
and Type of Firearm Action. AFTE Journal, 2012. 44(2): p. 145-155.

Ref code: QQC-VAL-002 - ANNEX
Issue No. 001
Page: 65 of 65
5.2.2.2. Validation of the performance
A large research and development activity has been developed at the NFI to validate the
performance of the practitioners. Specific solutions have been implemented in the ACEV
protocol in order to manage the context bias and to provide a second and independent opinion.
The performance of the practitioners is tested using a system of fake cases and via proficiency
tests.
Context bias management
Quality document “Context management in firearms comparison casework”
Stoel, R.D., et al., Minimizing contextual bias in forensic casework, in Forensic Science and
the Administration of Justice, SAGE Publishing, H. M. and S. K., Editors: In Press.
Second opinion
Quality document “Second opinion procedure”
Performance testing
Error rate monitoring using fake cases in which the ground truth in known: quality document
“Error protocol in firearms comparisons casework”.
Proficiency test
Pauw-Vugts, P., et al., FAID2009: Proficiency Test and Workshop AFTE Journal, 2013.
45(2): p. 115-127.
5.2.2.3 Assessment of the competence of the practitioner (see further 5.2.2.3)
Summary Laboratory/customer demands met
Statement on fitness for
intended purpose The method fulfills
the demand
□ The method does not
fulfill
the demand
The following should be
done….