guidelines - gov.uk · 2 3. desired outputs 3.1 check, complete and correct quarterly reports (i.e....
TRANSCRIPT
DISTRICT LEVEL MONITORING EVENT
ON
COMMUNITY-BASED TB CARE - DOTS
Draft: May, 2007
Prepared by
Tuberculosis Control Programme (PTP/NTP)
Association for Social Development (ASD)
Nuffield Institute for Health (NCIHD) UK
Supported by
Department for International Development (DFID)
GUIDELINES

i
CONTENTS
Contents i
1. Background 1
2. Purpose and objectives 1
3. Desired Outputs 2
4. Quarterly Reporting Meeting 2
5. District Review and Plan Meeting 4
Preparations 4
Conduct 4
Appendices
Appendices A (1 – 8) Templates for: Presentations – MO, DLS, DTC
Recording – Actions & district summary
8
Appendices B (1 – 4) Instructions to prepare: Presentations - MO, DLS, DTC
Record proceedings/decisions
16
1
GUIDELINES Intra-district DOTS Monitoring Events
(Draft: May, 2007) This document describes two district level events, inter-related but conducted separately, with a different set of participants to achieve certain agreed outputs. These events are Quarterly Reporting Meeting and District Review and Plan Meeting. The DOTS Facilitators from each of the diagnostic centers attend the quarterly reporting meeting. While the Medical Officers In-charge from the rural health centers and DOTS Focal persons from the hospitals attend the district review and plan meeting. 1. Background National TB Control Programme Pakistan has already achieved countrywide DOTS coverage in 2005. Since achieving the rapid expansion targets, the programme focus has mainly been to enhance the quality of DOTS implementation. Enhanced supervision and monitoring is key to an improved quality of implementation. The Programme already has regular quarterly monitoring meetings at district, province and national levels. At each level they carry out cohort analysis, review and plan for the next quarter. This district-level monitoring meeting is a key to the whole monitoring process. However, review of these meetings has shown that they lack structure, guidelines and tools and so do not achieve the desired outputs. The Provincial TB Control Programme Punjab and an NGO partner have developed a more structured format for the district level monitoring of TB control activities. These guidelines and tools will be evaluated and revised through piloting in selected districts of Punjab, before being used in other parts of the country. The objectives and outputs for the monitoring process (including both meetings) are outlined. Then in section 4 the details of the quarterly reporting meeting and in section 5 the details of district review and plan meeting are described. The tools for making presentations and recording/reporting of these events are given in Appendix-A, and instructions for using these tools are given in Appendix-B. 2. Purpose and Objectives
2.1 The aim is to improve the case finding and treatment outcomes in a district. The purpose is to improve technical and management support to the health facilities through district level events. These will build on facility level monitoring activities, as well as contribute to the provincial level monitoring activities. 2.2 The objectives are:
• To check and compile the quarterly case management data from each diagnostic center, and prepare district quarterly report (i.e. TB07, TB08 and TB09).
• To review the case finding and treatment outcomes at each diagnostic center
• To review the staff practices and resource gaps and other problems, and decide on what corrective action to take.
• To summarize the district situation and agreed actions, and share this plan with the Provincial TB Control Programme.
2
3. Desired Outputs
3.1 Check, complete and correct quarterly reports (i.e. TB07, TB08, TB09) from all the diagnostic centers, prepare a quarterly report for the whole district and submit to the PTP in time.
3.2 The availability of inputs and the performance of each diagnostic center is presented, according to a standard format, is reviewed and discussed by those present (peer review).
3.3 The District TB Coordinator documents the decisions to address the input and the practice gaps at each diagnostic center in the district.
3.4 The performance of the District Laboratory Supervisor (DLS) reviewed.
3.5 The District TB Coordinator summarizes the situation and the actions for each diagnostic center in the district, and sends the summary table to the PTP.
4. Quarterly Reporting Meeting 4.1 DOTS Facilitators from all the diagnostic centers attend the meeting. The District TB
Coordinator facilitates the meeting. The meeting will be held at a suitable venue at the district level (and may rotate around each diagnostic centre). The venue requirement is a room with flexible sitting arrangement for about twenty people (varies according to the number of diagnostic centers in the district). No audio-visual equipment is required.
4.2 Each DOTS Facilitator brings the relevant records from his respective facility. The
records include: TB04 (Laboratory register), TB01 (Patient card), and TB03 (TB register).
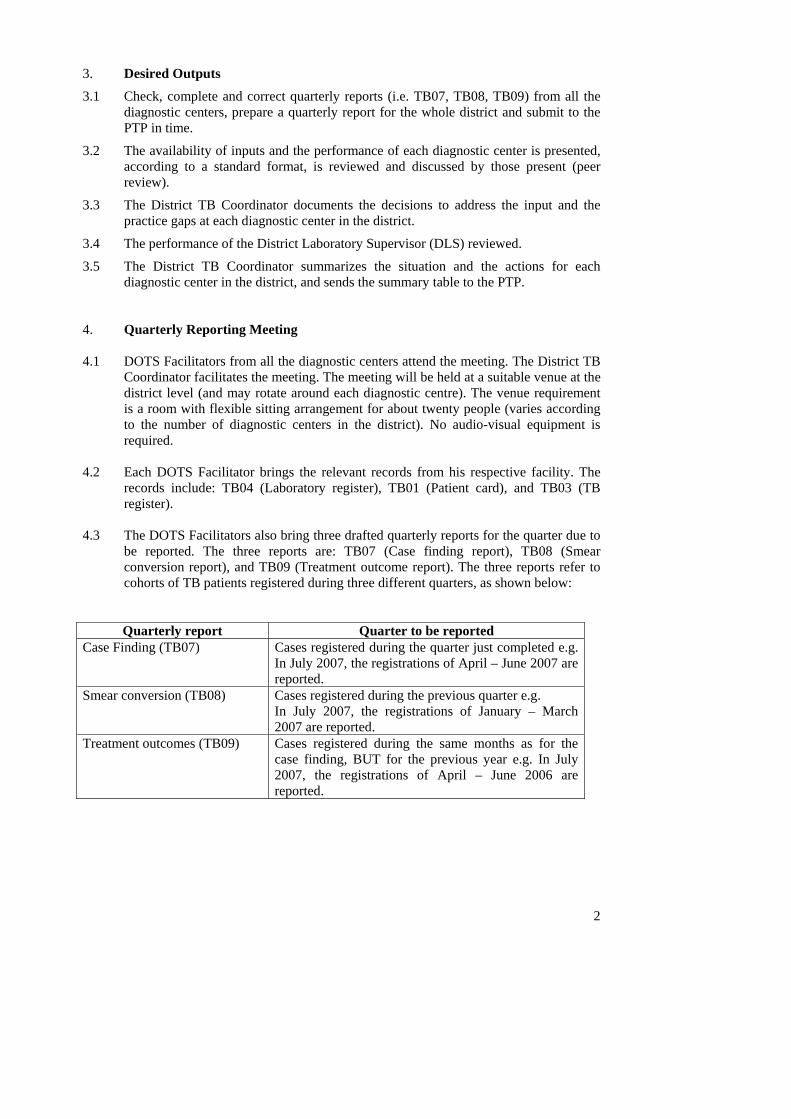
4.3 The DOTS Facilitators also bring three drafted quarterly reports for the quarter due to
be reported. The three reports are: TB07 (Case finding report), TB08 (Smear conversion report), and TB09 (Treatment outcome report). The three reports refer to cohorts of TB patients registered during three different quarters, as shown below:
Quarterly report Quarter to be reported Case Finding (TB07) Cases registered during the quarter just completed e.g.
In July 2007, the registrations of April – June 2007 are reported.
Smear conversion (TB08) Cases registered during the previous quarter e.g. In July 2007, the registrations of January – March 2007 are reported.
Treatment outcomes (TB09) Cases registered during the same months as for the case finding, BUT for the previous year e.g. In July 2007, the registrations of April – June 2006 are reported.

3
4.4 District TB Coordinator confirms that all the diagnostic centers have updated the
patient registration and the follow-up records in their respective TB registers (TB03). 4.5 District TB Coordinator reviews the three draft quarterly reports from each diagnostic
center, and tallies the entries with the relevant registers and the previous reports. Any discrepancy noted in any of the three reports is discussed and rectified.
Case finding report (TB07): is tallied mainly with the updated TB register (TB03) (but also cross checks the number of smear positive patients registered with the number of smear positive patients in the laboratory register (TB04) so as to note the number failing to start treatment).
Smear conversion report (TB08): is tallied mainly with the updated TB register (TB03), the laboratory register (TB04), and the case finding report (TB07) of the same patient cohort.
Treatment outcome report (TB09): is tallied mainly against the TB register (TB03), the laboratory register (TB04), and the case finding report (TB07) of the same patient cohort.
4.6 In cases where diagnostic center(s) are found to have not prepared the draft reports, the District TB Coordinator helps them to prepare three quarterly reports for their respective facilities.
4.7 DOTS Facilitators are supported to fill the two simplified input tables (staff and materials) for their respective facilities. The source of information about inputs at each facility may include: a) specific data provided by the facility, and b) the records of the facility monitoring exercise.
4.8 DOTS Facilitators fill in the three cohort analysis tables (case finding, smear conversion and treatment outcomes) using figures from their quarterly reports. These tables help them assess if there is progress or problems for each indicator and decide on any action required.
4.9 These filled forms are provided to the MO In-charge of the respective facility for finalizing and presenting this in the district DOTS review and planning meeting.
4.10 The District TB Coordinator prepares the district quarterly reports by compiling the data from the diagnostic center reports.

4
5. District Review and Plan Meeting
Preparations
5.1 Each district schedule the one-day meeting, in consultation with the respective provincial TB control programme. The quarterly meeting is chaired by the EDO and/or DOH, coordinated and facilitated by the District TB Coordinator, and technically supported by the provincial TB control programme.
5.2 The district health office informs in-advance the participants about the meeting venue and date. Medical Officers In-charge from the rural health centers and DOTS Focal persons from the hospitals attend the meeting. The chair, in response to any particular requirement or request, may invite a special guest to one or more of these meetings. These special invitees may include district representatives from other health programmes, district health development center staff, hospital managers etc.
5.3 The meeting always follows the quarterly reporting meeting, and is held at a suitable venue at the district level. The venue requirement is a room with sitting arrangement for about twenty people (varies according to the number of diagnostic centers in the district). Transparency projector is required for the participants to make their presentations (transparencies).
5.4 District TB Coordinator makes all the necessary programmatic and logistic preparations for the meeting. The main preparations include: hardware (projector, transparencies, and calculator), diagnostic center presentations, facility monitoring records, and other logistic arrangements e.g. seating, refreshments etc. (A sample checklist of “Things To Do” for DTC is given as Appendix-A9)
Conduct
5.5 A set of two transparencies, with five unfilled tables, is provided for each diagnostic center (see AppendixA1 and A2). In the first about half an hour, the MO In-charge or Focal Person from each diagnostic center prepares the transparency presentation. These are based on draft tables prepared earlier in the quarterly reporting meeting (Method for preparing a facility presentation is outlined in Appendix-B1).
5.6 Each diagnostic center makes a brief presentation, on prescribed format. Explanatory notes may be used to keep these presentations focused and complete.
5.7 At the completion of each facility presentation, the chair invites comments from the District TB Coordinator. The District TB Coordinator may draw knowledge from the facility monitoring record, the previous intra-district quarterly meeting record, and the data being presented by the facility. The DTC comments should cover both the “inputs” and the “cohort analysis” part of the facility presentation. These comments may also include the past situation and the recommended action from the previous intra-district meeting (Case finding and treatment outcome indicators given below - page 7 and 8 - helps analyzing the indicators).
5.8 DTC comments on “inputs” may include any gaps, issues and actions taken so far as well as the outputs at district and other levels. He also suggests further actions during the next quarter.
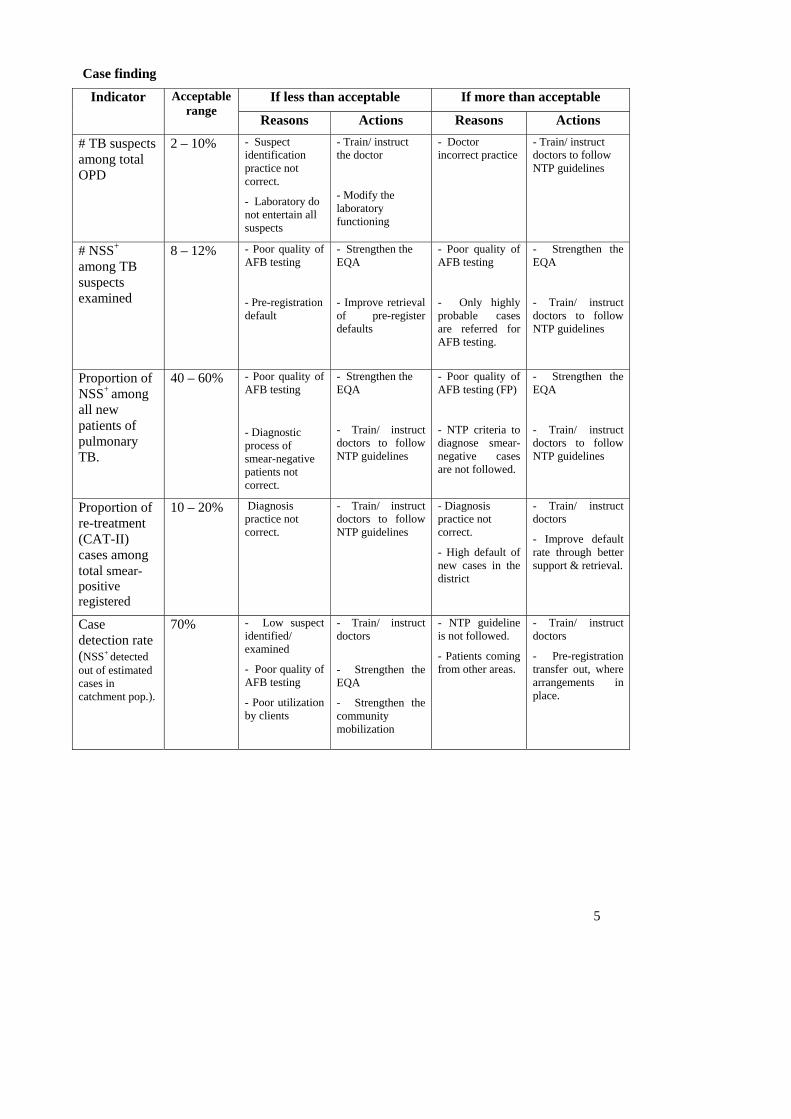
5.9 DTC comments on “cohort analysis” may cover the case finding, the smear conversion, and the treatment outcomes being reported by the facility. The following tables indicate the acceptable range, potential reasons and corrective actions for the deviation observed in a set of selected indicators.
5
Case finding
If less than acceptable If more than acceptable Indicator Acceptable range
Reasons Actions Reasons Actions
# TB suspects among total OPD
2 – 10% - Suspect identification practice not correct.
- Laboratory do not entertain all suspects
- Train/ instruct the doctor
- Modify the laboratory functioning
- Doctor incorrect practice
- Train/ instruct doctors to follow NTP guidelines
# NSS+
among TB suspects examined
8 – 12% - Poor quality of AFB testing
- Pre-registration default
- Strengthen the EQA
- Improve retrieval of pre-register defaults
- Poor quality of AFB testing
- Only highly probable cases are referred for AFB testing.
- Strengthen the EQA
- Train/ instruct doctors to follow NTP guidelines
Proportion of NSS+ among all new patients of pulmonary TB.
40 – 60%
- Poor quality of AFB testing
- Diagnostic process of smear-negative patients not correct.
- Strengthen the EQA
- Train/ instruct doctors to follow NTP guidelines
- Poor quality of AFB testing (FP)
- NTP criteria to diagnose smear- negative cases are not followed.
- Strengthen the EQA
- Train/ instruct doctors to follow NTP guidelines
Proportion of re-treatment (CAT-II) cases among total smear-positive registered
10 – 20% Diagnosis practice not correct.
- Train/ instruct doctors to follow NTP guidelines
- Diagnosis practice not correct.
- High default of new cases in the district
- Train/ instruct doctors
- Improve default rate through better support & retrieval.
Case detection rate (NSS+ detected out of estimated cases in catchment pop.).
70% - Low suspect identified/ examined
- Poor quality of AFB testing
- Poor utilization by clients
- Train/ instruct doctors
- Strengthen the EQA
- Strengthen the community mobilization
- NTP guideline is not followed.
- Patients coming from other areas.
- Train/ instruct doctors
- Pre-registration transfer out, where arrangements in place.

6
Treatment Outcomes
If less than acceptable If more than acceptable Indicator Acceptable range
Reasons Actions Reasons Actions
Proportion of new smear-positive cases found converted at completion of 2/3 months.
80 – 90% 1. Patients don’t attend (default, died, transfer)
2. Patients attend but smears not done.
3. Smears done but conversion low due to:
3a) Inadequate treatment
3b) Low patient compliance
3c) Poor quality of AFB testing
1. Improve retrieval of defaults or reduce post-registration transfer
2. Train/ instruct doctors & lab. staff
3a) Train/ instruct doctors
3b) Improve patient support arrangements.
3c) Strengthen the EQA
- High patient compliance
- Poor quality of AFB testing
- Encourage the staff.
- Strengthen the EQA
Proportion of NSS+ treated successfully
85% High
- Defaulters
- Rx. failure
- Patient deaths
Strengthen the: -
- communication/ education given
- Rx. support and defaulter retrieval
Improve patient classification, prescription and compliance.
- Reporting errors
- Review and exclude/rectify the reporting errors.
Proportion of NSS+ declared cured among successfully treated patients.
70 – 80%
- Follow-up AFB testing not being done as per guidelines.
- Train/ instruct doctors and lab. staff to follow NTP guidelines
- Reporting error
- Extra-ordinary AFB follow-up testing practices.
- Review and exclude/rectify the reporting errors.
- Acknowledge the good work.
Proportion of TB patients defaulted.
5 – 10% - Reporting error (defaulters are classified as transferred out etc.)
- Extra-ordinary case management work
- Review and exclude/rectify the reporting errors.
- Acknowledge the good work.
- Poor communication/ information given
- Poor treatment support
- Poor retrieval arrangements
- Poor perceived quality of care
- Improve provider-patient interaction
- Improve Rx. support
- Enhance retrieval arrangements
- Understand/ address the perceived quality of care issues.

7
5.10 Other participants, with the permission of the chair, may ask the presenter or the DTC to clarify or elaborate on certain specific information or issues.
5.11 The chair, in light of presentation and subsequent comments and discussion, guide the participants to an agreed action for the identified gap(s) in the input and/or the practice. The District TB Coordinator notes the main gaps and agreed actions for each diagnostic center on the separate “action note” sheet (Appendix-A4).
5.12 District Laboratory Supervisor presents the summary of his EQA related activities during the quarter. The presentation is made on a prescribed format, based on the data collected during the monthly facility visits of the DLS (Appendix-A5). For each diagnostic center, the visits made, the slides examined, the gaps identified, and the actions taken and/or required are reported. The method for preparing the DLS presentation is outlined in Appendix-B2. This presentation helps the district office to do the administrative supervision of the DLS work as well as take collective management decisions for the identified gaps in the laboratory network functioning. The District TB Coordinator notes the agreed decisions on the “action note sheet”.
5.13 District TB Coordinator presents an overall performance of TB-DOTS implementation in the district. The presentation should include: a) cohort analysis table for the district (Appendix-A2), b) trends analysis (graphical) in the last one year (Appendix-A6), c) progress on the district level actions agreed during the last quarterly meeting (Appendix-A7), and d) managerial and technical challenges currently being faced in the district and the actions required (Appendix-A8). The method for preparing the DTC presentation is outlined in Appendix-B3.
5.14 District TB Coordinator compiles the key facility data from all diagnostic centers into a single summary sheet. This sheet summarizes the key findings (on: staff; materials; case finding; smear conversion; and treatment outcomes) presented by each diagnostic center and the main actions agreed for each facility. The district shares this summary table with the Provincial TB Control Programme. The method for preparing district summary sheet is outlined in Appendix-B4.
5.15 The National Programme Officer/ Regional Coordinator assists the District TB Coordinator to prepare, conduct and document the monitoring events. Under current circumstances, they also assist the district in making payments to the participants and minor logistic arrangements for the meeting (e.g. transparencies etc.)

8
Appendix-A1
DOTS QUARTERLY REVIEW Quarter: (____________________, 2007)
Health Facility: ______________________ Presented By: _______________________
A. INPUTS Staff
DOTS Trained Staff Category
Available Functional
Medical Officer
DOTS Facilitator
Lab. Person
Materials
Item Gap Action taken Drugs Microscope Reagents Print material Weighing scale

9
Appendix-A2
B. COHORT ANALYSIS
Case finding - patients registered in quarter 4 (Oct. – Dec.) Year 2006
Registration (TB 03) Number of patients registered Suspect screening
Smear Positive
# OPD
# TB suspect New Retreatment
(CAT2)
Smear Negative
Extra- pulmonary
S+
Case detection rate
(NSS+
x 4 x 100/ pop x 0.0008)
Smear conversion - patient registered in quarter 3 (Jul. – Sep) Year 2006 At completion of 2/3 months
Conversion Default (early)
Remarks
Patient Type
#
Registered # % # %
NSS+
Treatment outcome - patient registered in quarter 4 (Oct. – Dec), Year 2005
Successful Unsuccessful Patient Type
#
Registered Cure Complete Total Died Failure Default
Transfer out
NSS+
Retreatment (CAT- 2)
NSS-

10
Appendix-A3 QUATERLY DOTS REVIEW/PLAN MEETING: DIST._______________ (Quarter ____, 2007)
DISTRICT SUMMARY – PERFORMANCE INDICATORS
REVIEW COMMENTS Case Finding Conversion
(NSS+) Treatment Outcome (NSS+)
Facility Staff Material
# OPD
# Suspect
# NSS+
# NSS-
# CAT-II
CDR NSS+
CR
EDR
TSR DR TOR
Agreed Actions
11
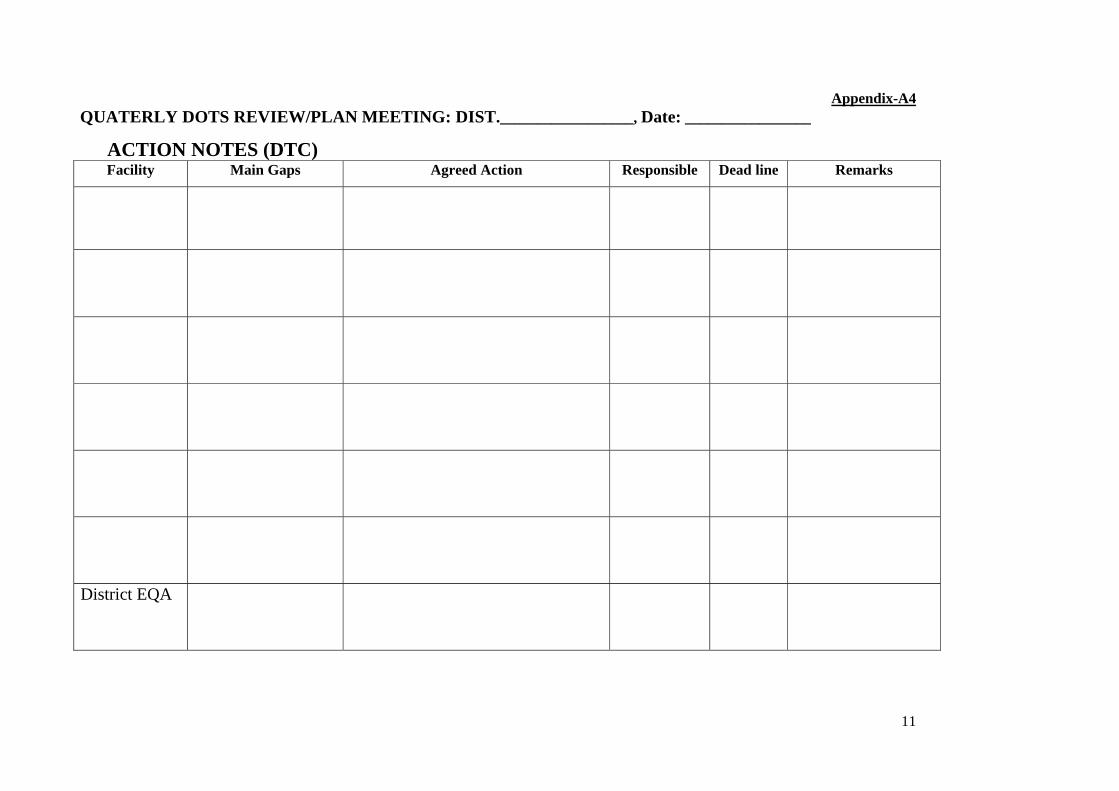
Appendix-A4 QUATERLY DOTS REVIEW/PLAN MEETING: DIST.__________________, Date: _________________
ACTION NOTES (DTC) Facility Main Gaps Agreed Action Responsible Dead line Remarks
District EQA

12
Appendix-A5
Summary AFB Quality Control in District __________, Quarter: ____________ Visit Dates Slides Reexamination Action Facility
Oct. Nov. Dec. Quality # Discordant Results
Gaps (Human & materials) Taken Required

13
Appendix – A6
District Trend Analysis (DOTS)
(An example)
District Trend Analysis (DOTS)
020406080
100
Q1 Q2 Q3 Q4(Current and previous 3 quarters)
% a
ge
Case detection rate(NSS+)Smear conversionrate (NSS+)Treatment successrate (NSS+)Default rate (NSS+)
Notes (for graph preparation)
Graph X – Axis Y – Axis Yellow line Case detection rate (All)
Blue line Case detection rate (NSS+)
Red line Early default rate (NSS+)
Green line
Quarter under reporting and the previous three quarters
Treatment success rate (NSS+)

14
Appendix-A7
PROGRESS MADE AND CHALLENGES BEING FACED Previous Decisions Progress Technical
Managerial
Current Challenges Option(s) for consideration Technical
Managerial

15
Appendix –A8
DISTRICT QUARTERLY REVIEW MEETING
CHECKLIST: TO DO A. PREPARATIONS A1. Hardware:
1.1 Projector (Available and functioning)
1.2 Transparencies and markers
1.3 Calculator
A2. Presentations
Facility presentations prepared and available
DLS presentations prepared and available
DTC presentation prepared and available
A3. Others
3.1 DTC comments on facilities discussed and drafted
B. CONDUCT OF MEETING B1. Facility Review/Plan
1.1 Facility presentation by each MO/In-charge
1.2 DTC comments on facility presentation (EDO invitation).
1.3 EDO discuss and decide (and DTC take action notes)
B2. District EQA Review
2.1 DLS make presentation (on agreed format)
2.2 DTC comments on issues? and required actions?
2.3 EDO discuss and decide (and DTC take action notes)
B3. DTC Overview of district level challenges and progress
B4. Summary District Review/Plan prepared by DTC
Formatted: Bullets andNumbering

16
Appendix-B1
HOW TO PREPARE FACILITY PRESENTATION FOR THE QUARTERLY MEETING
The official name of the facility and the presenter (i.e. doctor in-charge or DOTS Focal person from a hospital), and the quarter under reporting is recorded.
The facility presentation mainly has two sections i.e. inputs section with two tables, and cohort analysis section with three tables.
Table: Staff Only those staff members who have formally been trained on programme guidelines/ materials are considered DOTS trained. The number of three types of DOTS trained staff is recorded in the given two columns. The available means that the DOTS trained staff is still located in the facility, whereas the functional means the trained staff located in the facility is actually performing DOTS activities in the facility.
For example, a facility may have three doctors trained on DOTS; two still working on DOTS activities and the third shifted to another department (such as emergency or inpatients or evening shift), and is no more contributing to the DOTS implementation. In this case put available 3, and functional 2 in the staff table. In case of no DOTS trained staff available or functional, put “0” in the relevant cell of the table.
Table: Materials The gap in hardware (i.e. microscope and weighing scale) is written either as “not available” or “not functional”.
Not available means that the hardware is physically not available for DOTS activities in the facility. This may include the situation where the hardware does not exist in the facility stock or it exists somewhere in the facility but is not accessible for DOTS activities in the facility.
Not functional means that the hardware exists and is physically accessible for DOTS activities in the facility. But the non-functioning is because of its being out of order.
The name of specific item(s) being short in supply is written in the relevant gap cell of the table. This applies to presenting the gaps in drugs, reagents and print materials.
“None” is written in the relevant gap cell of the material table, in cases where material exists and is being used for DOTS activities.
The action taken may include: arranged through local purchase; indent prepared and submitted to the district office; received supplement or supply from the district/others; any other (to be specified).

17
Appendix-B1
Table: Case Finding Number of OPD attendance comes from the facility OPD register. In case of rural health centers and tehsil level hospitals, the total number of outpatient attendance during the quarter is recorded. However, in case of district level hospital OPD attendance only in the chest and the medical outpatient department may be considered. The figures either comes from the facility monitoring record or is brought by the facility staff for inclusion in the presentation.
Number of TB suspects comes directly from the laboratory register. All patients examined (AFB) for TB diagnosis purposes are counted.
Number of new smear positive TB cases, number of re-treatment (CAT-II), number of smear negative, and number of extra-pulmonary cases comes from the updated TB03.
S+ case detection rate is calculated with the help of formula given in the table. The catchment population figures comes from the facility records, where catchment population profile is maintained.
Table: Smear Conversion The number of registered NSS+ cases comes from the TB07 of the last quarter (or directly from TB03).
The number of NSS+ cases found converted and/or defaulted at the completion of 2/3 months of treatment comes from TB08 of the relevant quarter (or directly from updated TB03). The proportion is calculated and recorded as percent (%).
The remarks may include explanatory comments on the low uptake of follow-up examination and/or low conversion of registered smear positive TB cases.
Table: Treatment Outcomes
The number of registered NSS+, re-treatment and NSS-cases comes from the TB07 of the
relevant quarter (or directly from TB03).
The number of NSS+, re-treatment and NSS-cases found cured, treatment completed, died,
failed, defaulted and transferred out comes from the TB09 of the relevant quarter (or directly from TB03).

18
Appendix-B2
HOW TO PREPARE DISTRICTLABORATORY SUPERVISOR PRESENTATION
A sample template for the DLS presentation in the quarterly intra-district meeting is given in Appendix-A5.
The facility column is to enlist, by name, all the designated diagnostic centers in a district
Visit dates for the DLS visit to the facility during three months under reporting is recorded. A two-digit number is recorded to indicate the date of the month under reporting. For example if DLS visited a facility on 7th of November, then a two-digit figure “07” is recorded in the relevant cell of the table.
All the remaining five columns i.e. the slide reexamination (2), the gaps (1) and the action (2) are filled from the completed three or less EQA-1 Forms for the facility (expected: EQA-1 Form filled every month for each facility).
Specify the comments on the quality of the reexamined slides. If a gap is noticed in any one or more of the seven aspects of preparing and maintaining the slides, then specify the gap and action taken or required. For example, if problem is noticed in size and thickness of smears then DLS may write “gap in size and thickness” in the relevant cell of the table.
Actual figure for the number of discordant slides found is written in the relevant cell of the table.
Specify the human and material gaps identified during the quarter, and actions taken or required for the gaps. The table below gives few examples of gaps and possible actions:
Type Gap Description Actions Not available DLS reports to the DTC for further necessary action Not functional DLS reports to the DTC for further necessary action Skill-lack Onsite support: NTP laboratory manual reference, discussion,
demonstration, practice etc.
Suggest refresher: If staff level of understanding and skill is low in certain areas.
Suggest retraining: If staff level of understanding and skill is extremely low in the whole process.
Time-constraint Suggest, where possible, time management or work sharing.
Human
Commitment-lack Counsel the staff
Inform the facility in-charge and DTC for appropriate action, if required.
Not available (specify the items)
Provide stopgap supplies to avoid work interruption.
Ask health facility to prepare/submit indent to the district
Inform the DTC for further necessary action
Reagents (specify) expired or prepared poorly
Provide stopgap supplies to avoid work interruption.
Ask health facility to prepare/submit indent to the district
Inform the DTC for further necessary action
Material
Other arrangement inadequacy (specify)
Inform the DTC for further necessary action

19
Appendix-B3
HOW TO PREPARE DISTRICT TB COORDINATOR PRESENTATION Sample templates for the District TB Coordinator presentation at the quarterly intra-district meeting are given in Appendix-A2, A6, A7 and A8.
3.1 Cohort analysis for the district is extracted mainly from the TB07, TB08, and TB09 prepared for the district, on the basis of facility quarterly reports. The cohort analysis transparency used for facility is also used for the district (Appendix-A2).
3.2 Trend analysis in new smear positive (NNS+) case finding, smear conversion, treatment success, and default rates is graphically compared (bar chart) for the last four quarters. The figures come mainly from the TB07, TB08 and TB09 of the four quarters being compared. The four graphs can be prepared manually or with the help of computer, where available (Appendix-A6).
3.3 Progress on the last quarter’s decisions and current challenges The progress made on the actions agreed during the last quarterly meeting is shared and discussed (part-1 of Appendix-A7).
Technical challenges that a district may face include: low quality/yield of AFB testing; poor performance of the district EQA; very low registration of re-treatment cases; low smear conversion; high transfer out and default rates; poor reporting from the facilities etc.
Managerial challenges that a district may face include: staff availability and capacity gaps; availability and quality of anti-TB drugs; availability and quality of laboratory supplies; mobility and logistic requirements for supervision/ support; coordination with partners etc.
The actions required for the technical and managerial challenges would vary according to the “reasons” and the “circumstances”. The DTC, based on his understanding, would suggest options for the participants and the chair to discuss and decide.
20
Appendix-B4
HOW TO DOCUMENT THE SITUATION AND DECISIONS
HOW TO PREPARE ACTION NOTE SHEET During the review/plan meeting, the DTC facilitates the review, discussion and decision on each diagnostic center. The DTC records in the “Action Note” sheet: a) main gaps reported in the health facility presentation, and b) decisions of the chair (i.e. EDO/DOH), to address the gaps and improve the performance of each diagnostic center, and c) district EQA arrangement gaps and required actions, in the last row of the action note sheet. The action note sheet is also shared with the provincial TB control programme.
HOW TO PREPARE DISTRICT SUMMARY – PERFORMANCE INDICATORS At the completion of the review/plan meeting, the DTC prepares the district summary sheet, by compiling data from the facility quarterly reports, the facility presentations, and the decisions (recorded in the action note sheet). The summary sheet is prepared and a copy is shared with the provincial TB control programme.
The facility column is to enlist, by name, all the designated diagnostic centers in a district
The staff column is to report the availability and functioning of three key care providers i.e. doctors, DOTS Facilitator, and laboratory staff.
Write “all staff available and functioning” if one or more of the three types is available and functional. In case on e or more of the types is not available or not functional then give specific comments.
The material column compiles the information about microscope, weighing scale, drugs, reagents and print materials for each facility.
Write “No gap reported” if all five key input types have been available. In case one or more of the material input is not available then give specific comments. For example “No gap reported, except weighing scale”.
The number of OPD, number of suspects, number of new smear positive cases, number of new smear negative cases, number of category-II (re-treatment) cases, and case detection rate of NSS+ is taken from the case finding table of the facility presentation.
The proportion of NSS+ got converted or defaulted by the completion of the first 2/3 months of their treatment comes from the smear conversion table of the facility presentation.
The proportion of NSS+ got successfully treated (i.e. cured and completed), defaulted or transferred out comes from the treatment outcome table of the facility presentation.
The agreed action for each facility comes from the “action note” taken by the DTC, during the day proceedings.
The main gaps and the actions for the district EQA, as discussed and agreed during the DLS presentation are also recorded in the last row of the district summary sheet.