gujarat technological university pdf 2012/733 - egypt.pdfsr. no. particulars page no....
TRANSCRIPT

A GLOBAL / COUNTRY STUDY AND REPORT
ON ―ASSESSMENT AND SCOPE OF BUSINESS
OPPORTUNITY IN EGYPT‖
Submitted to:- Late.Smt. Shardaben Ghanshayambhai Patel Institute of
Management Studies, Dharmaj.
IN PARTIAL FULFILLMENT OF THE REQUIREMENT OF THE AWARD FOR THE DEGREE OF
MASTER OF BUSINESS ADMINISTRATION
In
Gujarat Technological University
UNDER THE GUIDANCE OF Mr. Divyang Joshi Dr. Deepak H. Tekwani Mr. Pratik Bhavsar Mrs. Shweta Patel Mr. Sarfaraz Pathan Ms. Zarna Patel Ms. Darshita Mirani Ms. Priyanka Patel
SUBMITTED BY Group:1
(Enrollment no:10733592001-10733592060)
BATCH: 2010-2012
MBA SEMESTER III/V TABLE OF CONTENT

Sr. No. Particulars Page No.
PART-1(SEM:III)
1 Overview of Egypt & India
2 Demographic Details
3 SWOT Analysis
4 PESTAL Analysis
5 Commerce
6 Summary of Exim Policy
PART-2 (SEM:IV)
1 Retail Sector
2 Banking Sector
3 Insurance Sector
4 Engineering Sector
5 Construction Sector
6 Power Sector
7 Shipping Sector
8 Telecom Sector
9 Aviation Sector
10 Hotel Sector

1.Country Introduction
Egypt
Egypt is located in the northeast corner of Africa and has a strategic
geographic position that connects the Mediterranean Sea with the Indian Ocean.
It is bordered by the Mediterranean Sea to the north, the Red Sea to the east,
Sudan to the south and Libya to the west. Egypt is the world‘s 38th largest
country; it covers an area of about 1,001,450 square kilometers. It is divided into
29 governorates, with governors appointed by the president.
In terms of land area, it is approximately the same size as all of Central
America, twice the size of France and four times the size of the United Kingdom.
Over 95 per cent of Egypt‘s land is desert, with the remaining land comprising the
Nile Valley and Delta. The majority of the population lives near the banks of the
Nile River, in an area of about 40 000 square kilometers, meaning that
approximately 99 per cent of the population uses only about 5.5 per cent of the
total land area.
Egypt is famous for its ancient civilization and some of the world‘s most
famous monuments, including the Giza pyramid complex and its Great Sphinx.
The southern city of Luxor contains numerous ancient artifacts, such as the
Karnak Temple and the Valley of the Kings. Egypt is widely regarded as an
important political and cultural nation of the Middle East.
The regularity and richness of the annual Nile River flood, coupled with semi-
isolation provided by deserts to the east and west, allowed for the development
of one of the world's great civilizations. A unified kingdom arose circa 3200 B.C.,
and a series of dynasties ruled in Egypt for the next three millennia. The last
native dynasty fell to the Persians in 341 B.C., who in turn were replaced by the
Greeks, Romans, and Byzantines. It was the Arabs who introduced Islam and

the Arabic language in the 7th century and who ruled for the next six centuries. A
local military caste, the Mamluks took control about 1250 and continued to
govern after the conquest of Egypt by the Ottoman Turks in 1517. Following the
completion of the Suez Canal in 1869, Egypt became an important world
transportation hub, but also fell heavily into debt. Ostensibly to protect its
investments, Britain seized control of Egypt's government in 1882, but nominal
allegiance to the Ottoman Empire continued until 1914.
Partially independent from the UK in 1922, Egypt acquired full sovereignty with
the overthrow of the British-backed monarchy in 1952. The completion of the
Aswan High Dam in 1971 and the resultant Lake Nasser have altered the time-
honored place of the Nile River in the agriculture and ecology of Egypt. A rapidly
growing population (the largest in the Arab world), limited arable land, and
dependence on the Nile all continue to overtax resources and stress society. The
government has struggled to meet the demands of Egypt's growing population
through economic reform and massive investment in communications and
physical infrastructure.

2.India
India forms a natural sub-continent with the Himalayas to the north. The
Arabian Sea and the Bay of Bengal, which are sections of the Indian Ocean, lie
to the west and east respectively. India has 28 states with constitutionally defined
powers of government.
The states vary greatly in size, population and development. Each state has a
Governor appointed by the President for five years, a legislature elected for five
years, and a Council of Ministers headed by a Chief Minister. Each state has its
own legislative, executive and judicial machinery, corresponding to that of the
Indian Union.
There are seven Union Territories including the National Capital Territory of
Delhi, administered by Lieutenant Governors or Administrators, all of whom are
appointed by the President. The Indus Valley civilization, one of the world's
oldest, flourished during the 3rd and 2nd millennia B.C. and extended into
northwestern India. Aryan tribes from the northwest infiltrated onto the Indian
subcontinent about 1500 B.C.; their merger with the earlier Dravidian inhabitants
created the classical Indian culture. The Maurya Empire of the 4th and 3rd
centuries B.C. - which reached its zenith under ASHOKA - united much of South
Asia. The Golden Age ushered in by the Gupta dynasty (4th to 6th centuries
A.D.) saw a flowering of Indian science, art, and culture. Islam spread across the
subcontinent over a period of 700 years. In the 10th and 11th centuries, Turks
and Afghans invaded India and established the Delhi Sultanate.
In the early 16th century, the Emperor BABUR established the Mughal Dynasty
which ruled India for more than three centuries. European explorers began
establishing footholds in India during the 16th century. By the 19th century, Great
Britain had become the dominant political power on the subcontinent. The British

Indian Army played a vital role in both World Wars. Nonviolent resistance to
British rule, led by Mohandas GANDHI and Jawaharlal NEHRU, eventually
brought about independence in 1947. Communal violence led to the
subcontinent's bloody partition, which resulted in the creation of two separate
states, India and Pakistan. The two countries have fought three wars since
independence, the last of which in 1971 resulted in East Pakistan becoming the
separate nation of Bangladesh. India's nuclear weapons tests in 1998 caused
Pakistan to conduct its own tests that same year. In November 2008, terrorists
allegedly originating from Pakistan conducted a series of coordinated attacks in
Mumbai, India's financial capital. Despite pressing problems such as significant
overpopulation, environmental degradation, extensive poverty, and widespread
corruption, rapid economic development is fueling India's rise on the world stage.
In January 2011, India assumed a nonpermanent seat in the UN Security Council
for the 2011-12 terms.

2.DEMOGRAPHIC DETAILS: [TABLE-1]
Factors INDIA EGYPT
Age structure
0-14 years: 31.1% (male
190,075,426/female 172,799,553) (2009
est.)
15-64 years: 63.6% (male
381,446,079/female 359,802,209) (2009
est.)
65 years & over: 5.3% (male
29,364,920/female 32,591,030) (2009
est.)
0-14 years: 31.8% no(male
13,292,961/female 12,690,711)
15-64 years: 63.5% (male
26,257,440/female 25,627,390)
65 years and over: 4.7% (male
1,636,560/female 2,208,455) (2008 est.)
0-14 years: 33% (male
13,308,407/female 12,711,900)
Population
1,210,193,422 (2011 est.) 82,079,636 (July 2011 est.)
Major Industries
Sugar Industry, textiles, Cement, paper,
iron & steel, leather, aluminum, photo &
film, glass, chemical, locomotive,
automobile, fertilizer, plastic, petro-
chemical.
food processing, textiles, chemicals,
petrochemicals, construction, light
manufacturing, iron and steel products,
aluminum, cement, military equipment.
Natural resources:
Iron ore, bauxite, and copper ore. India
is one of the major producers of iron in
the world. Iron ore is found all over India,
the major contributors being the states of
Bihar and Orissa. A quarter of all mining
is carried out in the southern part of
Orissa. Gold, silver, and diamonds make
petroleum, natural gas, iron ore,
phosphates, manganese, limestone,
gypsum, talc, asbestos, lead, rare earth
elements, zinc.

up a small part of other natural
resources available in India. The
gemstones are found in Rajasthan.
Per Capita Income:
Per capita Income: 54527Rs. Per capita GDP (PPP, FY 2009 est.):
$5,650
GDP Annual growth rate (FY 2010 est.): 8.6% Annual growth rate (FY 2010 est.):
4.7%.
Education Currently, there are 17000 plus colleges,
around 20 universities (central), 217
universities (state), and many deemed
universities as well as national
institutions. The national institutions of
international fame are the IIT's and the
IIM's. The Indian School of Business
(ISB) in Hyderabad holds a global rank
of 15 in the field of management
education.
Year’s compulsory--ages 6-15. Literacy-
-total adult 58%.
There are approx. 200,000 primary and
secondary schools with some 10 million
students, 13 major universities with
more than 500,000 students, and 67
teacher colleges.

3.SWOT Analysis of Egypt : [TABLE-2]
STRENGTHS WEAKNESSES OPPORTUNITIES THREATS
The Egyptian
population is young
and highly educated
Lack of education and
support systems to
support the
development of
competitive IT
companies
Comparative
Advantages in the
International
Marketplace.
Lack of value
ascribed to software
(for local market
development)
Already recognized
as the IT and
software center for
the Gulf region
Lack of growth in the
domestic marketplace.
Current Telecom Egypt
pricing structure
Internet access is
provided by only about
50 companies currently
and the subscriber base
only numbers about
80,000.
Piracy rates.
Limited distribution
skills in international
software marketplace
Labor costs are
lower than for many
other software
developing countries
Price and availability of
Internet technology
and services
IT penetration in
government ministries
is relatively low, in
general, with several
specific exceptions
such as Defense
Government
regulations and
support for the
industry
Technical skills and
demographics
Limited access to
senior staff needed for
development of
Market penetration of
PCs in the home and
business is still very low
Financial support for
the industry

industry (70,000 to 100,000PCs
estimated)
SWOT Analysis of Indian country: [TABLE-3]
STRENGTHS WEAKNESSES OPPORTUNITIES THREATS
Huge pool of labor
force
High growth rate of
economy
Very high percentage of
workforce involved in
agriculture which
contributes only 23% of
GDP
Scope for entry of
private firms in various
sectors for business
Global economy
recession/slowdown
Growing Import bill
High percentage of
cultivable land
Diversified nature of
the economy
Around a quarter of a
population below the
poverty line
Low level of
mechanization
Red tapes, bureaucracy
Inflow of Foreign Direct
Investment is likely to
increase in many
sectors.
Huge foreign exchange
earning prospect in IT
and ITES sector
Threat of government
intervention in some
states
Huge English
speaking population,
availability of skilled
manpower
Stable economy,
High unemployment
rate
Low productivity
Huge population
leading to scarcity of
Investment in R&D,
engineering design
Area of biotechnology
Huge population of
Indian Diaspora in
High fiscal deficit
Volatility in crude oil
prices across the
world

does not get affected
by external changes
resources
foreign countries (NRIs)
Extensive higher
education system,
third largest reservoir
of engineers
Abundance of natural
resources
Low literacy rates
Unequal distribution of
wealth
Rural-urban divide,
leading to inequality in
living standards
Area of Infrastructure
Huge domestic market:
Opportunity for MNCs
for sales. Huge natural
gas deposits found in
India, natural gas as a
fuel has tremendous
opportunities.
Population explosion,
rate of growth of
population still high
Rapid growth of IT
and BPO sector
bringing valuable
foreign exchange
Stark inequality in
prevailing socio
economic conditions.
Poor infrastructural
facilities.
Huge agricultural
resource, fishing,
plantation crops,
livestock Vast forest
area& diverse wildlife.
Agriculture
excessively
dependent on
monsoons

4.PESTLE ANALYSIS OF Egyptian & Indian country
[TABLE-4]
country Pestle Analysis
India Egypt
Political The political Situation in the country is
more or less stable.
Overall India currently has a coalition
led government and both major political
parties the UPA and BJP, whichever
comes in power.
The Egyptian Constitution provides for
a strong executive.
The standard rate of corporate income
tax is 40%.The Egyptian market is
gradually opening up, especially after
signing an agreement with
the European Free Trade
Association (EFTA) in 2006, and
a free trade treaty with the United
States.
Economical The economic factors in India are
improving continuously.
This will lead to higher buying power in
the Hands of the Indian consumers.
The international economic downturn
slowed Egypt's GDP growth to 4.5% in
2009, predominately affecting export-
oriented sectors, including
manufacturing and tourism.
Egypt made business start-up less
costly.

Socio-cultural India is the second most populous
nation in the world with an approximate
population of over 1.1billion people.
Continuous increase in the
consumption of beer in India with an
increase in the purchasing power the
Indian consumer
A Socio-economic problem is the high
unemployment rate which has been
growing over the years.The education
indicators of Egypt project a poor
image of the education system.The
healthcare system in Egypt is
underdeveloped with only around 29%
of the population.
Technological The technological knowhow and
expertise will also enter the Indian
market with an increase in competition.
European technology entering the
Indian beer market increased
production and lowering cost of
production could play a major role in
the Indian beer market.
Egypt's IT spending is expected to
increase from US$1.3bn in 2010 to
US$2.1bn by 2014
A number of policies have been
implemented to attract foreign
investment in, lower corporate taxes
and deductions for training costs.
Legal
The introduction of discrimination and
disability discrimination legislation,
an increase in the Minimum wage &
greater requirements for firms to
recycle. Legal changes can affect a
firm‘s costs & demand.
The Egyptian legal system is built on
the combination of Islamic (Shariah)
law and Napoleonic Code.
Being considered as a civil law system
is based upon a well-established
system of codified laws.
Environmental
Environmental factors include the
weather & climate changes.
Changes in temperature can impact on
many industries including farming,
tourism & insurance. The growing
desire to protect the environment is
having an impact on many industries.
According to the Law 4/1994 for
Protection of the Environment, the
Egyptian Environmental Affairs
Agency (EEAA) was structured.
Preparing the necessary plans for
Environmental protection and
Environmental development projects,
following up their implementation, and
undertaking Pilot Projects.

5.COMMERCE [TABLE-
5]
EGYPT EXPORTS IMPORTS
Grain papyrus painted pottery linen/flax glass vases lotions/perfumes (imported spices) Cotton & textile
pepper cinnamon fuels ginger iron wine nuts / figs tin
INDIA EXPORTS IMPORTS
pearls cotton sandalwood perfumed oils semi-precious
stones (imported tortoise
gold Roman coins
glassware wine medicines tin/copper silverware

shell) (imported silk from
China) nard (=ginger
root)
clothing iron & steel crude
minerals
6.Summary of EXIM policy
3.1) EXIM policy of India:
The short term objective for this revision to the EXIM policy is to halt and reverse
the declines in India trade within a volatile world market. Tactics used to achieve
this objective include: increase market access, diversify the export markets,
provide fiscal incentives, reduce procedures, and change to institutions.
EXIM Policy 2009 to 2014 Highlights
Market Access and Export Market Diversification: Incentive schemes
have been expand to cover new markets and new product categories the
incentives available have increased from 2.5% to 3% for these new
markets.
New Product Incentive Scheme:The incentives increased from 1.25%
to 2%.
Technology Upgrades: For companies in certain sectors such as
engineering and electronic products who want to upgrade their
technology, zero duty will be assessed.

Gems & Jewelry Sector: Gold Jewelry exports will be permitted to
receive Duty Drawbacks. This is where the duty collected on the export
will refunded.
Value added Manufacturing:To increase it a 15% minimum value
addition on imported inputs has now been prescribed.
Procedure Simplification: Increase from 15 to 50, the number of
sample pieces allowed to be imported by exporters at duty free rates.
3.2) Import and Export Policies of Egypt:
The new Exim Policy has only two schemes namely the advance licensing
scheme (i.e., corresponding to the quantity- based advance license) and a new
scheme known as Duty Entitlement Pass Book (DEPB) scheme, which entitles
exporters to import goods duty-free for export production. Thus, it has reduced
the multiplicity of schemes which prevailed earlier, such as Quantity Based
Advance License, Value Based Advance License (N7ABAL), Special Value
Based Advance License for electronics and other sectors and the Pass Book
scheme.
Export obligation period &validity of the advance license have been enhanced
from 12 months to 18 months. Need to submit a large number of documents with
every application have been reviewed and the minimum number of documents
prescribed.Exports and Imports shall be free, except to the extent they are
regulated by the provisions of this Policy or any other law for the time being in
force.
Import documents:Commercial invoice, quotation, Bill of Lading, Radiation
Certificate:
Egypt‘s basic import duties on items 5% -50%, but does not include luxury goods
tariffs. Luxury goods, including cigarettes, alcohol and more than 1300CC engine

cars such as the customs duty rate up to 150%. Tariffs are available to pay the
Egyptian pound.
In general, if the invoice price of imported goods consistent with its fixed price,
invoice price as the basis for levying the tariffs. Importers have to pay up the
difference on the invoice, tariff. If the invoice value of imported goods is less than
the actual value of goods, and those who conceal the balance of the value of
goods invoiced amount of goods collected 10% -100% penalties.
Free zones have been established in Alexandria, Cairo (Nasr City), Port Said,
Ismailia, Damietta, Safaga, Sohag, and Suez; these are exempt from customs
duties. Conduct business activities in the free trade zone need to Egyptian
government approval and permit.Capital goods, raw materials, intermediates,
components, consumables, spares, parts, accessories, instruments and other
goods may be imported without any restriction except to the extent such imports
are regulated by the Negative List of Imports or any other provision of this Policy
or any other law for the time being in force. Ministerial Decrees 577 and 580 of
1999 require cars to be imported in the year of production. In 2000, the decrees
were amended adding one year after the year of production to the period during
which passenger vehicles can be imported.
In 2010, the Central Bank relaxed a requirement of 100 percent foreign exchange
cover for Letters of Credit issued for the purchase of goods imported for resale,
reducing the requirement to 50 percent. Also in 2010, the Central Bank
temporarily suspended the foreign exchange cover requirement on meat, poultry,
and sugar imports in response to high levels of food price inflation.
3.3) Merchandise Export Proceeds by Degree of Processing
Earnings of exports increased by 13.2 percent, posting US$ 6.1 billion,
namely, semi-finished goods (35.0 percent), finished goods (18.0 percent) and

fuel, mineral oils and products (15.6 percent). In contrast, raw materials
decreased by 31.4 percent.
3.4) Merchandise Import Payments by Degree of Use
Import payments increased by 9.3 percent to some US$ 12.7 billion,
reflecting the rise in all groups. As such, raw materials rose by 28.9 percent, fuel,
mineral oils and products by 20.1 percent, consumer goods by 19.4 percent,
intermediate goods by 6.1 percent and investment goods by 3.2 percent.

GDP at Factor Cost by Economic Sector [TABLE-6]
Sectors 2009-10 2010-11 Growth rate %
Public private total Public private total public private Total
Total GDP 77111.0 132787.5 209898.5 80132.9 141308.0 221440.9 3.9 6.4 5.5
Agriculture, Irrigation & Fishing
4.1 33410.0 33414.1 4.3 34367.0 34371.3 4.9 2.9 2.9
Extractions 23420.0 5175.0 28595.0 22860.0 5412.0 28272.0 -2.4 4.6 -1.1
Oil 10025.0 1799.0 11824.0 10225.0 1834.0 12059.0 2.0 1.9 2.0
Natural gas 13303.0 2677.0 15980.0 12539.0 2846.0 15385.0 -5.7 6.3 -3.7
Others 92.0 699.0 791.0 96.0 732.0 828.0 4.3 4.7 4.7 Manufacturing
5224.0 26874.0 32098.0 5558.0 28563.0 3421.0 6.4 6.3 6.3

industries
Oil refining 919.0 690.0 1609.0 992.0 740.0 34121.0 7.9 7.2 7.6
Others 4305.0 26184.0 30489.0 4566.0 27823.0 32389.0 6.1 6.3 6.2
Electricity 2583.0 399.0 2982.0 2918.0 301.0 3219.0 13.0 -24.6 7.9
Water 664.0 0.0 664.0 705.0 0.0 705.0 6.2 0.0 6.2
Sewerage 167.2 0.0 167.2 177.0 0.0 177.0 5.9 0.0 5.9
Construction & building
1135.0 8587.0 9722.0 1267.0 9666.0 10933.0 11.6 12.6 12.5
Transportation & Storage
2048.0 7043.0 9091.0 2199.0 7561.0 9760.0 7.4 7.4 7.4
Communication
2520.0 4999.0 7519.0 2745.0 5678.0 8423.0 8.9 13.6 12.0
Information 155.4 296.4 451.8 165.0 319.0 484.0 6.2 7.6 7.1
Suez Canal 6479.4 0.0 6479.4 7257.0 0.0 7257.0 12.0 0.0 12.0
Wholesale & Retail trade
801.0 19601.0 20402.0 867.0 21001.0 21868.0 8.2 7.1 7.2
Finance 5251.0 2912.0 8163.0 5511.0 3051.0 8562.0 5.0 4.8 4.9
Insurance 501.0 155.0 656.0 527.0 165.0 692.0 5.2 6.5 5.5
Social Solidarity
7300.0 0.0 7300.0 7739.0 0.0 7739.0 6.0 0.0 6.0
Restaurants & Hotels
80.8 9741.3 9822.1 85.0 10923.0 11008.0 5.2 12.1 12.1
Real Estate 139.0 5265.0 4504.0 144.0 5508.0 5652.0 3.6 4.6 4.6
Real Estate Ownership
90.0 2766.0 2856.0 93.0 2894.0 2987.0 3.3 4.6 4.6
Business Services
49.0 2499.0 2548.0 51.0 2614.0 2665.0 4.1 4.6 4.6
General Government
18464.0 0.0 18464.0 19221.0 0.0 19221.0 4.1 0.0 4.1
Education, Health & other
174.1 8329.8 8503.9 183.6 8793.0 8976.6 5.5 5.6 5.6
Education 0.0 2260.0 2260.0 0.0 2373.0 2373.0 0.0 5.0 5.0
Health 166.0 2575.0 2741.0 175.0 2717.0 2892.0 5.4 5.5 5.5
Others 8.1 3494.8 3502.9 8.6 3703.0 3711.6 6.2 6.0 6.0
PART-2 Retail Sector

TABLE OF CONTENT
Sr. No Heading Page No.
1 Introduction of Retail sector and its importance in Egypt
Importance of Retail sector in Egypt
1
2 Business activities of retail India
Customs duties in Indian textiles sector
3
3 Business activities of Pantaloon retail India (PRIL) in
India
Financial Overview of PRIL
SWOT analysis of PRIL in India
7
4 Comparison of Retail Industry Egypt v/s India 11
5 Comparison of cost for starting business in Egypt and
India
13
6 Business opportunities for PRIL in EGYPT 16
7 Conclusion 19

Chapter=1
Introduction of Retail sector and its
importance in Egypt

1 | P a g e
Introduction of Retail sector and its importance in Egypt
The India and Egypt trade relations are 2500 years old. Currently India have $
4 billion trade with Egypt which mainly include oil & gas, infrastructure
technology and agricultural know how. By having knowhow from Egypt for
renewable energy sources, India is planning to increase trade from $ 4 billion
to $10 billion up to 2020.
The increasing middle class and upper middle class people create demand
for convenience based services which creates demand for organized and
modern supermarkets and hypermarkets. The growth of hypermarket and
supermarket generate 43.5% employment in 2008 and contributed 18% to
total GDP in Egypt. The following points highlight the retail sectors in Egypt..
1. Over 1 million private active enterprises in retail sector.
2. Even though Egyptian people diverted to hypermarket, the traditional
stores cover 90% of the food outlets compare to 5 to 10% of
Supermarkets.
3. Clear definition by Egyptian government for hypermarkets (means with an
area of more than 5,000 square meters), supermarkets (means more than
450 square meters), and mini markets (means more than 150 square
meters) is helping to re-shape the retail industry.
4. 550 independent supermarkets in Egypt.
5. The competition among big players like City Stars, Spinney, El-Hawary,
Metro Supermarkets, Carrefour, Alfa, Hyper One etc, beneficial for the
consumers.
6. The pressure to offer goods and services at lower price discouraged for
importing goods due to higher tariffs and lengthy customs procedures.
7. The 20 million people who live in the Greater Cairo area are served by
only 700 supermarkets and fewer than 10 hypermarkets.

2 | P a g e
Importance of Retail sector in Egypt:-
The emerging retail sector in Egypt contributes in GDP, national income and
employment generation. Currently the value of retail sector in Egypt is worth to
67.4 billion $ which is supposed to increase by USD 142 bn by 2014. The F&B
generate 50.9% of total establishments directly and 43.5% of employment in
micro enterprises5. The textiles, garments and footwear industry jointly offered
direct employment up to 8.6% of total establishments and 9.6% of employment in
the sub-sector. The retail industry work in following form
1. Supermarkets and Hypermarkets: - The major players like Ragab Sons,
Abu Zikri and El-Hawary specialized in retail sales at highly discounted
prices.
2. Department Stores and Clothing: - Cairo and Alexandria is major player in
this category.
3. Wholesale: - The public sector plays a large role in the sub-sector, making
up 25% of total establishments and 44% of total employment, the majority
in the food and beverages area. As with retail, food and beverages
activities dominate the sub-sector, making up 47% of establishments in
the private sector and 34% of employment.
4. Chains and Franchising: - The current food franchise market is valued at
an estimated more than US$ 300 million. Popular chains include Chili‘s,
TGI Fridays, Hard Rock Café, KFC, Little Caesars Pizza, McDonald‘s,
Pizza Hut and Baskin Robins.

3 | P a g e

Chapter=2
Business activities of retail India

3 | P a g e
Business activities of retail India
Over the next 5 years (2011 to 2016), healthy growth in domestic demand will
drive the country's textiles industry, given that exports demand has been slowing,
especially in the US and EU. Overall, the Indian readymade garments (RMG)
industry grew by about 10 per cent y-o-y to Rs 1,916 billion in 2011. Growth was
mainly driven by strong realizations, as volume growth decelerated. Realisations
rose as garment manufactures increased product prices to pass on the sharp rise
in key raw materials costs. (CRISIL Report published on Jan 24, 2012)
During the January-August 2011 period, India's total apparel exports to the EU
rose by 24 per cent, in dollar terms from $4 billion to $5 billion as compared to
the corresponding period last year. The increase was largely led by an increase
in realisations across categories. Eight categories - T-shirts, W/G knit dresses,

4 | P a g e
W/G woven dresses, and M/B woven shirts, W/G woven shirts, W/G knit night
dresses, Jerseys and M/B woven dresses constituted about 74 per cent of the
total exports to the EU in value terms (during the January-August 2011 period).
Customs duties in Indian textiles sector (CRISIL Report Published on Oct 21,2011)
Excise duty
Earlier, the entire cotton textile chain (yarn, fabric and garments) was under the
optional duty regime, and thus was duty-free. However, in Union Budget 2011-
12, a mandatory excise duty of 10.3 per cent has been imposed on branded
RMG and textile made-ups, as opposed to a 4 per cent optional excise duty this
segment was subject to earlier. In order to enable branded RMG players to claim
Cenvat credit, yarn and fabric manufacturers may be forced to pay a higher
excise duty of 5 per cent vis-Ã -vis an optional and concessional 4 per cent duty
that they paid earlier. In polyester chain (yarn, fabric and garments), there is
mandatory excise duty6. In Union Budget 2010-11, the government hiked the
excise duty on all synthetic fibre based products to 10.3 per cent from the 8 per
cent announced in the previous budget.
Duty Entitlement Pass Book scheme
The DEPB (Duty Entitlement Pass Book) scheme was introduced to promote
exports of various goods like textile products. It was a popular tax incentive to
exporters, wherein the customs duty paid on imported inputs going into exports
was reimbursed through duty-free scrips that could be sold freely in the market.
The scheme was initially planned to be scrapped in June 2011, so as to put in
place a comprehensive goods and services tax regime so that reimbursement of
levies on exports can be streamlined. The government has capped the drawback
rate at 5.5 per cent for most items, while increasing the list to about 4,000 export
items (from 2,800 earlier). But due to protest from industry players, the DEPB
scheme was extended till end September 2011.

5 | P a g e
Sales tax
Textile products were covered under the Additional Duties of Excise (Goods of
Special Importance) Act, 1957, under which, additional excise duty was levied on
these products in lieu of exempting them from the levy of local sales tax. The
state government was not allowed to impose any sales tax on textile articles. The
objective of this was to ensure that the excise duty (in lieu of sales tax) on textile
products is not high and is standardised across the country, as textile products
are basic necessities, and hence important to the economy. The Centre
compensated the states for the loss in revenues arising out of non-imposition of
sales tax.
Duty drawback
The duty drawback scheme has also been introduced to promote exports from
India. Under this scheme, the exporters are allowed refund of the excise and
import duties paid on raw materials so as to make the products more competitive
in the international market. The duty drawback rates are prescribed for each
product after considering the rate of excise and import duty on its raw materials.
The textiles sector is also covered under this scheme7.
Export Promotion Capital Goods Scheme
The EPCG (Export Promotion Capital Goods) Scheme facilitates imports of
capital goods with duty at a concession of 5 per cent and appropriate export
obligations. Textiles machinery is also covered under this scheme, thereby
promoting textiles exports.
Advance Licensing Scheme
The ALS (Advance Licensing Scheme) allows duty-free imports of raw materials
to be used in goods that are exported to encourage exports. This scheme is
extended to nearly 300 textiles and clothing products.
Liberalization of FDI policy
The government has also allowed FDI up to 100 per cent in the textiles sector by
allowing foreign equity participation. Thus, the government liberalised foreign

6 | P a g e
investments in the Indian textiles sector. This will help in setting up integrated
units, which are capital intensive.
Setting up modern laboratories
The Ministry of Textiles has assisted the Textiles Committee in setting up modern
textiles laboratories to ensure that textiles exported from the country meet all
international environmental standards.

7 | P a g e

Chapter=3
Business activities of Pantaloon retail
India (PRIL) in India

7 | P a g e
Business activities of Pantaloon retail India (PRIL) in India
Pantaloon is one of the biggest retailers in India with more than 450 stores
across the country. Headquartered in Mumbai, it has more than 5 million sq. ft
retail space located across the country. It's growing at an enviable pace and is
expected to reach 30 million sq. ft by the year 2010. Pantaloon Retail inspires
trust through innovative offerings, quality products and affordable prices that help
customers achieve a better quality of life every day. Pantaloon Retail continues
to be India‘s leading multi-format retailer and a leader in sustainability and
employment opportunity. Through over 15 million square feet of retail space,
PRIL serve customers in 85 cities and 60 rural locations across the country.
Around 220 million customers walk into stores each year. PRIL employ 35,000
people directly from every section of society.
Products of Pantaloons in retail Business:- The company is present across
several lines of business which have various formats (stores) Plywood, The
Dollar Store (JV). Pantaloon sales different products like Fashion, General
Merchandise Electronics Home Improvement -Furniture Books & Music Leisure &
Entertainment Telecom & IT Consumer Durables – Service - E Care, H Care,
Design & Service.
Financial Overview of PRIL3: -
Sales: - The Company‘s sales and other operating income has increased from `
6341.70 Crores to ` 8926.08 Crores, an increase of 40.75% over the previous
year. The Company has also recorded same store growth of 10.64% during the
year.
Profit before Tax: -Profit before tax of the Company for the year 2009-10 stood
at ` 301.24 Crores as compared to ` 216.23 Crores in the previous year, an
increase of 39.31% over the previous year.

8 | P a g e
Interest: -Interest & Financial charges outflow has increased from 318.22 Crores
in 2008-09 to 391.28 Crores in 2009-10 The interest & financial charges cover
during the year under review has marginally increased to 2.31 times as
compared to 2.12 times in the preceding year.
Net Profit: - Net profit of the Company for the year under review stood at 230.16
Crores as compared to 140.58 Crores in the previous year, an increase of
89.58Crores and 63.72% over the previous year.
Dividend: - The Company has proposed a dividend of ` 0.80 (40%) per equity
share.
Loans and Advances: -Loans and advances stood at ` 1027.77 Crores in 2009-
10, a decrease of ` 174.78 Crores over the previous financial year. The major
component of loans and advances represents advance lease deposits for the
stores paid to lessors and advances given to suppliers.
Capital employed: - The capital employed in the business increased by ` 598.49
Crores in 2009-10. This is reflected in the liabilities side of the balance sheet
through an increase in borrowings by ` 64.80 Crores and an increase in
shareholders‘ funds by ` 533.69 Crores. Return on capital employed has
increased from 14.73% to 16.69%.
Equity Share Capital: - During the year, Company has allotted 1, 58, 22,200
fully paid up Equity Shares of the face value of ` 2/- (Rupees Two only) each at a
premium of ` 314/- (Rupees three hundred fourteen only) under qualified
institutional placement. The resultant increase in ―Equity‖ on account of allotment
of fresh equity shares during the year is ` 499.97Crores.
Debt-equity: - Debt-equity ratio of the Company has marginally improved with
the reduction in the cost of funds borrowed for the expansion of the retail
operations of the Company. Debt-equity ratio for the year was 1.04.

9 | P a g e
Earnings per Share (EPS): - The Company‘s Basic Earnings per Share (EPS)
on standalone basis has marginally increased from ` 7.94 during previous year to
` 8.46 per share in the current year.
Cash Earnings per Share (CEPS) : - The Company‘s Cash Earnings Per Share
(CEPS) on standalone basis is ` 16.16, which was ` 18.58 in the preceding year.
Investment: - The Company‘s investment portfolio has increased marginally
from ` 954.03 Crores in 2008-09 to ` 1024.65 Crores.
SWOT Analysis of PRIL: - (PRIL Annual Audit report 2010-11)
Strength:
1. Maximum number of formats to cover most of the consumer classes.
2. Strong supply chain mechanism.
3. Higher bargaining power due to maximum number of stores, higher
customer footfalls and covering most types of formats.
4. Human Capital – attracting the most talented pool from best business
schools across India.
5. Shopping Experience is customized according to store format. Like Big
Bazaar has a Indian bazaar like appeal whereas Central which is into
lifestyle segment gives altogether different experience.
6. Unique Discounting/ Markdown - Special discounting during
Independence and Republic days which attracts more number of
customers than any other stores.
7. Private label brands like John Miller, Bare, UMM etc considered as
national brand and performing well.
8. Trained customer relationship agents to guide customers.
Weakness:
1. Shrinkage rates are higher than industry norms.
2. Store renovations of older stores not done.

10 | P a g e
3. Low employee retention levels at shop floor level due to better pay
package by competitors.
4. Floor level Customer Relations Executives not having proper product,
store etc knowledge due to lack of proper training.
5. Loyalty program of competitors is more effective due to better scheme and
merchandise.
6. Merchandise and product focus not consistent and clear.
Opportunities:
1. Geographical Expansion: Untapped market in terms of tier II and tier III
cities.
2. Untapped segments such as ethnic wear, Organic cotton wear etc.
3. Luxury segment with brands like Gucci, Tommy, Armani etc.
4. Stand alone stores of other brands like Bare, UMM etc.
5. Getting license agreement of smaller regional brands.
6. More effective online shopping for garments.
7. Custom Tailoring business untapped.
8. Suiting brand from Future group can be feasible.
Threats:
1. Economic slowdown and scanty rainfall which has major impact on Indian
Economy. Consumer spending on non-essential fashion items, garments
etc have been reduced significantly.
2. Competitive rivalry in the industry. Foreign players like Carrefour, Tesco,
and Wal-Mart lined for their Indian operations.
3. Increasing cost of raw material, power and transportation.
4. Delay in store delivery – due to increased price and economic slowdown,
the infrastructure sector in India is affected and hence the construction of
new malls have been halted or slowed down.

11 | P a g e

Chapter=4
Comparison of Retail Industry Egypt v/s
India

Comparison of Retail Industry Egypt v/s India
Details/Country Egypt India
Strength
1. Retail business increase
from 35$ billion in 2003
to 67.5 $ billion in 2011.
2. The encouraging steps of
Egyptian Government
towards real estate
development in large
shopping centers and the
introduction of modern
hyper and supermarkets.
3. The largest market in the
Arab world, with the
population of 78mn in
2009 to an estimate of
84mn by 2014.
4. For fast food the bulk of
ingredients are sourced
locally.
5. Focus shift from family
run local shops to super
market.
6. There is a well-
developed supply chain
in Egypt for the packaged
goods sector and fresh
foods.
1. 2nd at GDP contribution
after agriculture. 20%
2. Growing young
population
3. Consumer spending
increase at 11% on
average.
4. Total value of organized
retail is worth of US $
3.33 billion.
5. Population shift from
saving to consumption.
Weakness
1. Focus on high quality
standards which are not
stable.
2. High tariffs and lengthy
customs procedures.
3. The limited availability of
shelf space.
4. Currency fluctuation can
impact import cost and
1. Government has
conservative outlook for
FDI.
2. Complex Land ceiling
Act.
3. Space available at very
high cost in urban and
city area.
4. No status as Industry

profit margin.
5. Large part of the
population living in
poverty, unable to buy
products in the more
expensive supermarkets.
Opportunity
1. Growing retail demand
created demand for
greater consumer
interest in value added
services, quality
products and
international brands.
2. Large and youthful
population.
3. Emergence of a more
affluent middle class.
4. An active tourism
industry.
5. The entry of more
women to the workforce.
6. Home delivery is new
approach.
7. Internet is emerging
shopping tool.
1. Urbanization
2. Increase in middle and
upper middle class
people.
3. Nuclear family and
double earning increase
the spending.
4. Lifestyle spending
increases.
5. Increase in usage of
credit cards.
6. Home delivery is new
approach.
7. Internet is emerging
shopping tool.
Threats
1. Government policy to
protect local players.
2. Home delivery and
higher discount by local
players.
3. Supermarkets are
developed in some cities
only. No scope in far
cities.
4. Liberal FDI policy can
create cut throat
competition.
5. Fear of war and unstable
1. Unstable government
policy towards retail
Industry.
2. FDI restrictions in retail.
3. Very good services by
unorganized retail stores.
4. Lack of skilled and
trained people.
5. Increasing oil and crude
price indirectly impact on
profit margin.

oil demand.

Chapter=5
Comparison of cost for starting business
in Egypt and India

13 | P a g e
Table -1 Comparison of cost for starting business in Egypt and India
A B
SERIES TITLE UNITS 2011 2011
Business Costs IN INDIA IN EGYPT RESULT
New staff
Top Management 2 year 104,484.00 208,272.00 A
Middle Management year 51,411.50 88,214.70 A
Senior Sales year 47,329.70 92,348.40 A
Professional / Junior Management year 17,921.60 24,119.50 A
Office and industrial rents
Office rents
sq
m/year 1,131.50 600 B
Industrial rents
sq
m/year 88.16 84 B
Construction costs - air conditioned
office sq m 1,118.65 1,419.83 A
Construction costs - light industrial unit sq m 584.71 742.13 A
Transport costs
Diesel litre 0.79 0.11 B
Gasoline super litre 1.1 0.25 B
Air freight costs: import from London package 720.83 790.22 A
Air freight costs: import from New York package 689.64 709.92 A
Air freight costs: import from Tokyo package 393.42 1,030.83 A
Sea freight costs: import from
Rotterdam container 2,383.25 2,677.94 A
Sea freight costs: import from Hong
Kong container 3,545.58 6,190.88 A
Sea freight costs: import from Los
Angeles container 4,661.73 4,637.36 B
Sea freight costs: export to Rotterdam container 4,211.79 1,018.22 B
Sea freight costs: export to Hong Kong container 1,018.78 1,584.47 A
Sea freight costs: export to Los
Angeles container 3,196.79 4,007.71 A

14 | P a g e
Utilities
Electricity, industry kwh 0.13 0.11 B
Natural gas, industry
10^7
Kilocalories 66.61 63.83 B
Water, industry m3 1.04 0.05 B
Telephone connection, business line 7.26 147.91 A
Telephone monthly subscription,
business line/month 2.9 2.87 B
Fixed line 3 minute local call, peak rate 0.02 0.02
Cellular 3 minute local call, peak rate 0.02 0.05 A
Fixed line 3 minute call to USA, peak rate 0.45 1.64 A
VOIP 3 minute local call 0.28 0.56 A
ADSL connection, business 10.41 0 B
ADSL annual rental, business year 53.02 36.26 B
Corporate tax rates
Corporate tax standard rate, average % 33.99 20 B
General sales tax % 12.5 10 B
Personal Taxes (maximum standard rate) % 30 20 B
Travel Costs
Average cost of business trip day 399.24 430.83 A
Fixed return airfare London - City X 2,251.12 1,444.36 A
The economy
Market size and growth
Population m 1,166.00 83 B
Nominal GDP (US$) bn 1,345.20 187.3 B
Nominal GDP (US$ at PPP) bn 3,727.30 469.44 B
GDP per head 1,150.00 2,256.70 B
GDP per head ($ at PPP) 3,200.00 5,655.90 B
GDP (% real change pa) 8.24 4.69 A
Real GDP growth per head (% pa) 6.6 2.83 A
Macroeconomic stability

15 | P a g e
Consumer prices (% change pa; av) 10.85 11.84 A
*Source: EIU report on Egypt and India
The economy
Macroeconomic stability
Budget balance (% of GDP) -6.39 -6.64 A
Public debt (% of GDP) 54.13 83.5 A
Current-account balance m -25,922.00 -3,194.70 B
Current-account balance/GDP -1.93 -1.59 B
Exchange rate LCU:US$ (av) 48.41 5.55 A
The economy
Macroeconomic stability
Real effective exchange rate (CPI-based) 108.5 96.4 A
The economy
International trade
Goods: exports fob m 168,218.00 23,089.30 B
Goods: imports fob m
-
274,566.00
-
45,564.30 B
The economy
International trade
Services: credit m 91,107.00 21,519.80 B
Services: debit m -53,914.00 -8,277.80 B
The economy
Competitiveness
Average wages (monthly, US$) 383 231 A
Labour costs per hour 2.1 1 B
Overall unit labour costs level (index, US=100) 106.4 28.4 B
Overall productivity of labour (GDP at PPP, per
worker, US$) 8,240.20 18,590.00 B
The economy
EIU business environment rankings
EIU market opportunities rating (10=high) 7.3 5.6 A

16 | P a g e
EIU macroeconomic environment rating
(10=high) 6.7 5.4 A
EIU political environment rating (10=high) 5.2 5.7 B
EIU infrastructure rating (10=good) 4.3 6 B

Chapter=6
Business opportunities for PRIL in
EGYPT

16 | P a g e
Business opportunities for PRIL in EGYPT
1. From the table 1 it can observed that Egypt having higher rank compare to
India. Egypt score 25 favor and India score 35. But the currency
conversation will be beneficial for the entrepreneur to start business over
there. E.g. as on 16/04/2012 the 1$= 6.04095 EGP and 1 $= 50 Rs. But 1
Rs. = 0.11 EGP. So, it will be beneficial for Indian firms to start business in
Egypt.
2. Egypt‘s per-capita income has doubled over the last five years resulting in
increased consumer spending power. The per-capita spends on food and
other retail products are among the highest in the region. So, it will be
beneficial to start business in Egypt.
3. Egypt has a sophisticated infrastructure to support retail activities, from
local farms and food producers to IT and store-design firms that cater to
regional retailers. The low cost of infrastructure and available good
infrastructure reduced cost to start the business as well as reduce cost of
running the business.
4. Opportunity in Grocery business: - Modern grocery distribution is a
nominal percentage of the market, with the top five retail players holding
only 1.8% market share.
5. Low cost for business: - Wages in Egypt are among the most Competitive
in the region. The average weekly wage in the wholesale and retail sector
is USD 32.20. Wages are also quite stable, growing at 5% per year as
opposed to 10% in China and 15% in India. In addition, land, energy and
building material prices are among the lowest in the region.
6. Total labor force of 25 million, 324.3 Thousand university graduate and an
industrial training program that is aiming to turn out 500,000 workers,
along with broad language skills.
7. The Egyptian government is aiming to provide a red-tape free investor
friendly business environment to modernize Egypt‘s retail sector.

17 | P a g e
The new lifestyles and better economic conditions, the Egyptian retailing market
is moving from one that was fragmented, to one that is concentrated. There are
many opportunities in retail sector in Egypt to attracting the attention of
international retailers for potential investment. Main opportunities in retail in
Egypt,
Starting the premium store.
Health and beauty specialist.
Clothing and foot wear specialist.
Convenience store.
Risk Factors: - (EIU report)
But, there are some risk factors for starting business in retail sector in Egypt.
Pantaloon faces some risk factors for starting business in retail sectors in Egypt.
Demographics factors:
One of the most important policy conclusions, however, concerns the importance
of providing a vigorous educational campaign to enlighten mothers and
prospective mothers in both rural and urban areas on the positive effects of
breast-feeding, longer birth intervals, and fewer children on the survival of
infants.
Changes in culture:
In Arabic, the name is Misr. This name is older than the Muslim conquest, but is
attested to in the Koran. It can refer to either the whole country or the capital city.
The name itself is an icon, spoken, written, or sung.
The population of Egypt is relatively homogeneous. The overwhelming majority
(over 90 percent) are Arabic-speaking Sunni Muslims. About 6 percent are
Christians, who are indistinguishable in other respects from the Muslims. Most of
the Christians belong to the Coptic Orthodox Church, the historic church of
Egypt, but minorities within the minority are Catholic or Protestant, or derive from
the churches of the Levant (Maronite, Greek Orthodox, and Greek Catholic).

18 | P a g e
There are a few small linguistic minorities, of which the largest is the Nubians,
who speak two Nubian languages (Kenuz and Mahas) related to the Nilo-
Saharan languages of the Sudan. They represent less than 1 percent of Egypt's
population, and are concentrated around Aswan. Other linguistic minorities
include a few thousand Berber speakers in Siwa oasis, the easternmost outpost
of Berber speech, and the small population of Beja (Ababda and Bisharin) in the
eastern desert east of Aswan.
Market risk:
One advantage of developed markets is that their financial markets are seldom
switched off, and if it does happen in an emergency then it will not be for long.
You can always sell your stocks, even if not at the price you hoped.
Until recently Egypt was quite a favorite with US investors who saw the Arab
state as a friendly and reliable ally with progressive economic policies, and a
successful privatization program. The spin of the emerging markets analyst is
always positive, especially when he or she is a native of the country concerned.
Often to be negative is seen as a cardinal sin. Enter the boys from Wall Street
looking for an attractive asset class to sell on commission to their clients. Rising
stocks are easy to sell, and emerging markets are well known for their high
growth rates.
Political environment:
Understanding and managing the political risks prevalent in the countries in
which your organization operates is a key component of continued success.
Equally, exploiting business opportunities in challenging environments is easier
when you are prepared for the risks involved.

19 | P a g e

Chapter=7
Conclusion

Conclusion
Pantaloons have proper and intelligent circulation of customer traffic throughout
the entire store. Traffic-stopping, appealing displays of conveniently placed
merchandise, which will result in sales. A pantaloon has strategically placed
equipment to perform a twofold function. In Pantaloon, the salespeople lead the
customer, after the selection has been made, through a convenient, rapid,
efficient checkout procedure.
To provide adequate store protection Pantaloons has all equipment placed in
such a way that they can focus exits through one narrow point; thus,
adequate security is provided. Pantaloons carefully consider the entire
physical arrangement of the sales area including doors, windows, posts, and
other abutments.
The current Egyptian retailing landscape is providing business opportunity for
international retailers. Thus from the scenario of Egypt we can concluded that
there is better opportunities of retail store like pantaloon to start retail business
in EGYPT.
References
1. CRISIL Report published on Jan 24, 2012.

2. www.pentaloonretail.in
3. http://www.pantaloonretail.in/pdf/PRIL_Annual_Report_2010-11.pdf
4. http://www.everyculture.com/Cr-Ga/Egypt.html
5. http://en.svr.su/content/item/334/
6. http://www.scribd.com/doc/62157773/49789919-CRISIL-s-Union-Budget-Analysis-
2011-12
7. http://www.bseindia.com/downloads/ipo/201244181856KS%20Oils%20Limited%20P
D%20SE%20Final.pdf

Banking Sector

Executive summary
This report is the result of more than a month of research work with the help of secondary
data source. It attempts to distinguish the relation between the Egyptian country & Indian
country with the help of Citibank analysis.
The key findings of this report are as follows:
The majority of Egyptians, however, have not benefited from economic reform.
Government circles and a few major stakeholders from the private sector have
combined to develop Egypt‘s economic reform strategy.
Major business people filled key government posts. Constitutional amendments in
March 2007 codified the new neoliberal reform approach to the detriment of what
used to be Egypt‘s social contract. While the political leadership posits liberalization
and privatization as the ultimate keys to economic growth, it does not sufficiently
address problems such as unemployment, poverty, illiteracy, inflation, public dept.,
corruption, regional and social disparities in the distribution of wealth, and the weak
middle class.
In late 2007 and 2008, growing popular discontent with the government‘s economic
and social policies led to unprecedented waves of employee strikes and protests, in
both the public and private sectors.
Egyptian copyright law lacks provisions that address access to knowledge per se. For
example, there are no provisions related to e-learning or to students with disabilities.
The Egyptian banking industry, supported by the buoyant economic growth,
increasing demand of consumer loans and improving consumer confidence, has
shown a strong growth in the recent past. The government is also working hard to
make the industry globally competitive. As a result of government‘s privatization
program and rapid consolidation in the banking system, asset quality of banks is
improving significantly.
Other Key Findings of the study
Deposits at Egyptian banks are forecasted to grow at a CAGR of about 14% between
2008-09 and 2010-11, with household sector accounting for majority of deposits.
Bank loans to private business sector are forecasted to grow at a CAGR of about 9.5
during 2008-09 to 2010-11.
Manufacturing sector will remain the major recipient of bank loans in local as well as
foreign currencies during 2007-08 to 2010-11.
Net interest income is projected to grow at a CAGR of over 12% during 2008-2012.

1.1 Introduction about Indian banking sector
1.2 Introduction About Egyptian Banking sector
1.3 Duty Structure
1.4 Overview about CITIBANK
1.5 Structure, operation & functions about
CITIBANK
1.6 Comparative position of banking industry
1.7 Present position & trade of business

17
1.1 Indian banking sector:
The last decade has seen many positive developments in the Indian banking sector.
The policy makers, which comprise the Reserve Bank of India (RBI), Ministry of Finance
and related government and financial sector regulatory entities, have made several notable
efforts to improve regulation in the sector. The sector now compares favorably with banking
sectors in the region on metrics like growth, profitability and non-performing assets (NPAs).
A few banks have established an outstanding track record of innovation, growth and
value creation. However, improved regulations, innovation, growth and value creation in the
sector remain limited to a small part of it. The cost of banking intermediation in India is
higher and bank penetration is far lower than in other markets. India‘s banking industry must
strengthen itself significantly if it has to support the modern and vibrant economy which
India aspires to be.
GOOD PERFORMANCE, QUESTIONABLE HEALTH:
Indian banks have compared favorably on growth, asset quality and profitability with
other regional banks over the last few years. The banking index has grown at a compounded
annual rate of over 51 per cent since April 2001 as compared to a 27 per cent growth in the
market index for the same period.
Policy makers have made some notable changes in policy and regulation to help
strengthen the sector. These changes include strengthening prudential norms, enhancing the
payments system and integrating regulations between commercial and cooperative banks.
However, the cost of intermediation remains high and bank penetration is limited to
only a few customer segments and geographies. While bank lending has been a significant
driver of GDP growth and employment, periodic instances of the ―failure‖ of some weak
banks have often threatened the stability of the system.
Structural weaknesses such as a fragmented industry structure, restrictions on capital
availability and deployment, lack of institutional support infrastructure, restrictive labor laws,
weak corporate governance and ineffective regulations beyond Scheduled Commercial Banks
(SCBs), unless addressed, could seriously weaken the health of the sector.
Further, the inability of bank managements (with some notable exceptions) to
improve capital allocation, increase the productivity of their service platforms and improve
the performance ethic in their organizations could seriously affect future performance.

18
OPPORTUNITIES & CHALLENGES IN INDIAN BANKING SECTOR:
The bar for what it means to be a successful player in the sector has been raised. Four
challenges must be addressed before success can be achieved.
First, the market is seeing discontinuous growth driven by new products and services
that include opportunities in credit cards, consumer finance and wealth management on the
retail side, and in fee-based income and investment banking on the wholesale banking side.
These require new skills in sales & marketing, credit and operations.
Second, banks will no longer enjoy windfall treasury gains that the decade-long
secular decline in interest rates provided. This will expose the weaker banks.
Third, with increased interest in India, competition from foreign banks will only
intensify.
Fourth, given the demographic shifts resulting from changes in age profile and
household income, consumers will increasingly demand enhanced institutional capabilities
and service levels from banks.

19
Change is the only constant feature in this dynamic world and banking is not an
exception. The changes staring in the face of bankers relates to the fundamental way of banking-
which is going through rapid transformation in the world of today. Adjust, adapt and change
should be the key mantra. The major challenge faced by banks today is the ever rising customer
expectation as well as risk management and maintaining growth rate. Following are the results of
the biggest challenge faced by the banking industry as declared by our respondents (on a mode
scale of 1 to 7 with 1 being the biggest challenge):
GLOBAL EXPANSION OF INDIAN BANKING:
The idea of creating bigger banks to take on competition sounds attractive but one must
realize even the biggest among Indian banks are small by global standards. The lack of global
scale for Indian banks came into sharp focus during the recent financial crisis which saw several
international banks reneging on their funding commitments to Indian companies, but local banks
could not step into the breach because of balance sheet limitations.
In this light, 93.75% of all respondents to our survey are considering expanding their
operations in the future. We further asked participants on the methods that they consider suitable
to meet their expansion needs. We divide them into organic means of growth that comes out of
an increase in the bank‘s own business activity, and inorganic means that includes mergers or
takeovers.

20
Figure: 5 Organic V/S Inorganic Means
We see from the above graph that amongst organic means of expansion, branch
expansion finds favor with banks while strategic alliances is the most popular inorganic
method for banks considering scaling up their operations. On the other hand, new ventures
and buyout portfolios are the least popular methods for bank expansion.

21
1.2 The Banking Sector in Egypt
Banking Reform and Liberalization
The banking sector plays a crucial role in the development process of Egypt. The
banking sector consists of commercial banks, which are local banks and non-local banks. It
also includes specialized banks and financial institutions operating in the fields of investment
and credit for industry, agriculture, housing and rural development.
Extending this sector and its reform would lead to higher rates of economic growth.
This mechanism is achieved mainly through the role of the banking sector in mobilizing
more savings and channeling them to better investment allocation. This, in turn, would lead
to higher productivity and more capital accumulation. To achieve these results, an efficient
banking system, prudential controls and a friendly, non-distorted macroeconomic framework
are required.
The Banking industry in Egypt is amongst the oldest and largest in the region.
Banking reform started as part of the open door policies in the mid-seventies when foreign
banks were allowed to operate in Egypt.
Later in the nineties, as part of Egypt‘s economic and financial reform program, the
banking sector was completely liberalized, while banking supervision was further
strengthened in accordance to international standards. The Government of Egypt has been
currently undertaking a comprehensive reform strategy for the financial sector as a whole and
the banking system in specific.
The goal of banking reform was creating an efficient banking sector which offers
better quality services .The financial reform measures taken in the early 1990s emphasized
reform of the monetary and fiscal policies, not the revamping of financial institutions.
Egypt is currently moving steadily towards becoming the biggest financial center in
the region. Owing to the flourishing privatization program and the prospering domestic bond
market, banks have encountered new investment fields which helped them diversify their
portfolios and lower their financial risks.
Meanwhile, most banks expanded on providing nontraditional services such as
brokerage, investment consultations, asset valuation and sales, and mutual fund operations
which also helped improving capital market services.
Banking reform was primarily based on promoting transparency and use of adequate
accounting and supervision standards. According to the Law, banks are required to publish
their financial statements on quarterly basis in compliance with the Accounting Standards
(IAS).

22
In June 1998, major amendments to the Banking Law which permitted private
ownership in public banks were ratified by the Parliament. Individual banks invited
international financial houses for internal valuations and ratings. Later in mid-1999, the
Central Bank of Egypt and the General Assembly of the two real estate banks approved the
first bank mergering in Egypt by merging the "Credit Foncier Egyptian" and the "Arab Land
Bank" into one financial entity.
With a view to strengthening the Central bank role and independence, the Ministry of
Economy in cooperation with CBE drafted a new Central Bank Law which aims towards
institutionalizing the Central Bank independence and defining its role in determining the
monetary policy.
Government efforts to reform monetary and fiscal policies have gained momentum in
2001 when the cabinet agreed to priorities the modification of laws governing the
performance of the banking sector.
In addition, drafts of two key banking laws -- the Central Bank and National
Investment Bank laws -- were endorsed.
The first of these was an amendment to the law governing the performance of the
Central Bank of Egypt (CBE). Under the amendment, the CBE would have full independence
in drawing up monetary policies and greater supervisory powers over the banking system in
Egypt.
The second bill aimed to alter the role of the state- owned National Investment Bank
(NIB) in boosting development and fighting recession. The cabinet‘s decision to amend the
CBE law has been widely hailed as a progressive step in Egypt‘s economic history.
The year 2007 witnessed the operation of the first credit information company by the
participation of more than 32 banks.
Besides, the first release of stocks presented by the Egyptian Pound succeeded, as the
coverage volume reached 250% in the world money markets which reflects their confidence
in the Egyptian economy.

23
This is a list of commercial banks in Egypt
1. Egyptian Arab Land Bank
2. National Bank of Egypt
3. Principal Bank for Development and Agricultural Credit
4. Commercial International Bank
5. Barclays Bank Egypt
6. Industrial Development & Workers Bank of Egypt
7. Society Arab International de Banque
8. National Society General Bank
9. Federal Arab Bank For Investment and Development
10. Housing and Development Bank
11. National Bank For Development
12. Union National Bank Egypt (UNB-E)
13. Arab African International Bank
14. HSBC Bank Egypt
15. Export Development Bank of Egypt
16. United Bank -Egypt
17. National Bank of Abu Dhabi
18. Citibank
19. Mashreq Bank
20. National Bank of Greece
The main types of bank account in Egypt: Egyptian banks offer a wide
range of banking services and facilities, including direct debits, standing orders, cheque
clearance and processing of credit card repayments. The main types of accounts include:
Current accounts – typically pay low interest rates on account balances, unless your
account has a substantial balance; they are mainly used for everyday banking needs.
Many current accounts are provided with an automatic teller machine (ATM) card,
and some current accounts offer cheque facilities. You may also be offered credit and
charge cards, but spending restrictions usually apply based on your account type and
balance. Most current accounts offer customers easy access to funds held in the
account, and many offer accounts in a selection of major foreign currencies.
Savings accounts – designed for short to mid-term savings, and may provide limited
access to your money, in return for a higher rate of interest than a current account.
Deposit accounts – specifically for longer-term savings, and are typically opened for
a set period of time (e.g. one or two years) with a fixed rate of interest. Deposit
accounts may offer a higher rate of interest, but account holders may have limited or
no access to funds until the account matures.
In addition to these accounts, banks such as Banque Misr offer Islamic banking services that
function within the rules of Islamic Shariah.

24
1.3 Duty structure of Egyptian country:
Applicable duties and taxes:
Customs duties: Customs duties range between 5 percent and 70 percent, but rates on luxury
items including cigarettes, alcohol, and automobile may exceed 150 percent
Ad-valorem duties: most items are taxed on an ad-valorem basis. The tariff rate in effect on
the date of assessment is applied to the C.I.F. value of the goods.
Generally, the invoice price is used as the basis for duty assessment if it coincides with the
fixed selling price. The fixed price is based on the commercial invoice accompanying a
product the first time it is imported. If the invoice price is lower than the fixed price, customs
value is the fixed price and the importers may be subject to penalties for under-voicing.
Preferential duties: Egypt is a member of the League of the Arab States and its major
institutions, including the Arab Economic Unity Council. Member States concluded an
agreement aiming at establishing The Arab Common Market. They agreed to remove
customs duties on agricultural products, animals and natural resources in trade among
themselves
Customs surcharges and indirect taxes: Imported items are assessed a surcharge to cover
inspection, listing, classification, and re-examination of goods. The applicable rates are 3
percent for goods dutiable at 30 percent or less than 6 percent for goods dutiable at more than
30 percent. The Government had decided to eliminate this surcharge by July1995
Sale taxes: Sales taxes are levied at rates ranging from 5 percent to 25 percent. Excise duty is
collected on the imports of alcoholic beverages, benzene, coffee, cotton yarn, and several
other products. There is an additional excise duty on brandy, cognac, gin, and whiskey.
Tax law
The Egyptian tax system includes direct taxes, such as corporate profits tax and
income tax on personal income, as well as indirect taxes, such as sales tax and customs
duties. A new income tax law has recently been enacted.
The principal taxes are summarized below:
Corporate Profits Tax – in general this tax is levied on the profits of corporations at
a rate of 20% per annum.

25
Salary Tax – salary tax is levied at a rate of 10% on the first LE 20,000 of income,
15% for further income up to LE 40,000 and thereafter at 20%, subject to personal
allowances. Salary tax must be withheld at source by the employer.
Income Tax – direct income tax at the rates mentioned above for salary tax, at a
maximum of 20% is applicable to, in particular, the remuneration of directors of joint
stock companies and the managers of limited liability companies, interest and foreign
dividends. Egyptian income tax at a rate of 20% is also applicable to the income of
non-resident corporations which are the recipients of technical know-how fees,
royalties and interest. Taxable income from moveable capital must be withheld by the
payer.
Sales Tax - sales tax at rates of between 5% and 25% (although most commonly
10%) is applicable on certain goods and services.
Customs Duties – goods imported into Egypt are subject to customs duties. The rates
are usually between 1% and 55%.
Stamp Duty – stamp duties are levied on most types of documents used or executed
in Egypt.
Social Insurance – Egyptian employees are subject to the social insurance system
which requires contributions by the employer and the employee on the basis of the
salary of the employee. At the time of writing, the maximum aggregate social
insurance contribution is LE
Egypt has a system of withholding by the payer on account of the payee‘s tax liability which
applies to, in particular, payments on account of professional services, rent, commission and
supply contracts. Withholding tax on payments made locally range 0.5% to 5% depending on
the type of payment. For payments made to overseas persons, other than by a free zone
company, a deduction on account of tax is made at the rate of 20%.

26
1.4 Overview about the Citibank Citibank of India
1.1) History:
Established 109 years ago in Kolkata, Citibank has a long history in India. Currently
it is the largest foreign direct investor in financial services in India with a total capital
commitment of approximately US$ 4 Billion in its onshore banking and financial
services business and its principal and alternate investment programs. It operates 42
full-service Citibank branches in 30 cities and over 700 ATMs across the country.
Citibank is an employer of choice to about 7,500 people.
1.2) Products & Services:
Citi offers consumers and institutions a broad range of financial products and
services, including consumer banking and credit, corporate and investment banking,
securities brokerage, and wealth management.
Citi's franchise in India includes businesses such as equity brokerage, equities
distribution, private banking (Citi Private Bank) and alternate investments and private
equity (CVCI).
1.3) Overview:
With operations in over 100 countries and more than 200 million customer accounts,
Citi is one of the most admired global financial services companies in the world. The
group provides consumers, corporations, governments and institutions with a wide
range of financial products and services, including consumer banking and credit,
corporate and investment banking, securities brokerage and wealth management.
In operation for over 106 years and supported by its global network, Citi is, today,
recognized as a premier local financial institution. With more than 23,000 employees
and capital invested of more than US$ 2.9 billion (Rs. 11,600 crore) Citi is the single
largest foreign direct investor in the financial services industry in the country. This
outstanding brand has a customer base of over 1500 large corporate and
multinationals, over 2500 small and medium enterprises, over 40,000 assets based
financing clients and over 7 million retail customers.

27
1.4) Brand Value:
The breadth of Citigroup‘s services and the depth of its experience are truly huge.
While its corporate businesses leverage the Citi identity, the consumer businesses
worldwide leverage the Citibank brand identity. At the very heart of the company‘s
identity is the name ‗Citi‘.
It represents everything the pre-eminent global financial services company stands for:
clear, intelligent, engaging, human, friendly and innovative.
Across the globe, the overarching brand values of Citi are focused on preserving its
reputation as the most respected global financial services company in the world. It
does this by always putting clients first, by allowing people the best opportunity to
realize their potential, by providing superior and measurable performance and giving
back to the communities where it operates.
1.5) Salient Features:
1. Multi Deposits
2. Investment Service
3. Free Insurance Coverage
4. Dial a Draft delivery
5. Cheque & Cash pickup & delivery.
6. Nationalized local banking
7. International Debit card
8. Faster Clearing
9. Citi Direct
10. Citi Phone
11. 24 hrs. ATM centers
12. Your Very Own Relationship Manager
1. Multi Deposits
It’s a unique feature attached to Citi Bank saving A/Cs. Unlike other Fixed Deposits,
Citi Bank offer FDs in multiples of 1000s, so that whenever any client wants to withdraw any
amount, he can take it in the multiple of 1000s without disturbing Fixed Deposits
2. Investment Services
This is an additional feature attached with Citi Bank services on which they can boast
off. They provide an opportunity to make money work, with the help of Investment
Advisors. They provide these services together with their international partners. This way
client can have someone to take care of his investment & that’s without any charges too.

28
3. Free Insurance Coverage
With a Citi Bank Saving Account, client can get two types of Insurance absolutely free-
1. Household Insurance worth 1 lac
2. Accident Insurance worth 1 lac
4. Dial A Draft
Whenever a client is in need of a draft, he just has to call up on phone and can
receive a draft free of any other charges. In case, he want it to reach some other
beneficiary, he just has to let them know through their website and its going to get
delivered within 24 hours
5. Cheque & Cash pick up & delivering
A client just has to use Citi Phone to have Cheque & Cash pick up & delivering and
Citibank will do the same to save client’s previous time. The cash that client could receive
or deposit should be between25, 000 to 250,000 and there are no charges levied either.
6. Nationalized Local Banking
With 26 Citibank centers across the country, one can deposit their cheques and cash
anywhere and it will be treated as local to make it convenient to deal with Citibank
7. International Debit Card
With each Saving A/C, one can get his ‘International debit Card’, which saves them
from troubling of having currency of the country, they are visiting. They can use it in any
country and can get that country’s currency without any hassles.
8. Faster Clearing
With Citibank, cheques take the minimum processing time. For local clearing, it
takes 2 days, for metros it takes 4 days and any state capital 7-14 days. For US dollar
cheques, it takes around 11 days.
9. Citi phone &Citi direct

29
The services of Citibank are available 7 days a week, 24 hrs. a day with the help of
Citi phone service & Internet. One can browse their a/c, demand cheque book, deposit slip,
and ask for stop payment on cheque & cheque/cash pick-up or delivery.

30
10. 24-Hour ATM Centers
One can get ready cash round the clock!
Withdraw up to Rs. 75,000
Enquire into a/c
Get statement copy through fax or mail
Stop payment on cheques, etc.
11. Relationship Manager
Whenever one has any transactional need, they ask for Citi phone & citi direct
service and if one has any query, a Relationship Manager is specially assigned to them to
help them out. He will guide to maximize returns and on how to make most of the Citibank
services.
12. Citi Alert
With Citi Alert Citibank can keep track of their client’s money, without them being
worrying about it. Client could trust Citibank for having reminders, alerts and confirmations.
They take care of client’s a/c and let them inform about their balance, o/d status, and credit
& debit details etc. Citibank also reminds their client of the due date of their utility bills.

31
1.5 Structure, Operation, & function of Citibank:
Citi’s Mission Statement and Principles
They work tirelessly to serve individuals, communities, institutions and nations. With
200 years of experience meeting the world‘s toughest challenges and seizing its greatest
opportunities, they strive to create the best outcomes for their clients and customers with
financial solutions that are simple, creative and responsible. An institution connecting over
1,000 cities, 160 countries and millions of people, they are our global bank; they are Citi.
The four key principles— the values that guide us as they perform this mission—
Are:
1. Common Purpose: One team, with one goal: serving their clients and stakeholders.
2. Responsible Finance: Conduct that is transparent, prudent and dependable.
3. Ingenuity: Enhancing their clients‘ lives through innovation that harnesses the breadth
and depth of their information, global network and world-class products.
4. Leadership: Talented people with the best training who thrive in a diverse meritocracy
that demands excellence, initiative and courage.
Operation of Citibank:
Business in different countries:
Citibank grew their footprint significantly, opening 45 new branches during the year.
Its network now totals more than 700 retail branches across the region, compared
with fewer than 100 in 2000.
In Australia, China, Hong Kong and Thailand, it launched the next generation of
Internet banking service, which provides a vastly superior customer experience,
global view of accounts, improved security, customized alerts and financial advice.
It launched Powered by Citi, a region-wide campaign with leading retailers and
corporate clients across Asia that promotes specific value propositions based on credit
card spending.
It continued to expand their equity presence with the launch of local brokerages in
Indonesia and Malaysia and the establishment of a research team in the Philippines
Citibank Investment Services offers exclusive facilities and services:
Certified Investment Counsellors: These experts help the clients in planning the
investments that suit their needs. They identify suitable investments after carefully

32
identifying their investment profile and a comprehensive analysis of their investment
capacity and the risk appetite
Regular Updates: Clients receive daily updates on their investments alongwith
regular market updates.
Convenience: Clients can subscribe or redeem, set-up a Regular Investment Scheme,
view their portfolios on Citibank Online, transact over Citi Phone and receive Citi
Alerts on their transactions, all in real time.
Easy liquidity: Redemption proceeds are credited into the accounts directly within 48
working hours. All dividends are also transferred directly into their account so that
they never have to visit the bank.
Quality Research: Each fund and the respective markets are continuously monitored
to provide the investors with regular market insights. The Citi choice analysis a
shortlist of consistently better performing funds.
Variety of Investment Options: The customers can choose from a variety of options
including T-bill, Relief Bonds, Corporate Bonds, mutual funds and structured deals.
How Citibank is organized?
For financial reporting and internal operational purposes, Citigroup is largely
organized into five groups: Citigroup Global Consumer Group, the Global Corporate and
Investment Banking Group, Citigroup Global Investment Management, Citigroup
International, and Smith Barney.
For the purposes of quarterly and year-end earnings reports, Citigroup International
results are divided between the Global Consumer Group and Citigroup's Global Corporate
and Investment Banking Group, depending on the nature of the business activities.
Below are brief descriptions of many of the most significant business activities found
within each group.
i. Citigroup Global Consumer Group
The Citigroup Global Consumer Group businesses comprise the financial service sector‘s
most diverse consumer product offerings — banking services, credit cards, loans and
insurance. Our businesses also offer industry-leading advanced technology, a strong
worldwide presence and a powerful global franchise in Citibank.
Citibanking
Banking, lending and investment services to individual consumers and small businesses,
with up to $10 million in annual sales.
Cards
Credit and charge cards such as MasterCard®, VISA®, and private label.
Citi Capital
They provide truck, construction, material handling, healthcare and office equipment
finance, as well as franchise and municipal finance.

33
CitiFinancial
Consumer finance and community-based lending services across North America,
Europe, and Japan.
Primerica Financial Services
More than 100,000 full- and part-time representatives who help people plan their
financial futures and resolve challenges along the way.
ii. Global Corporate and Investment Banking Group
The Global Corporate and Investment Banking Group has emerged as the premier
organization for meeting all the financial services needs of corporations, governments,
and institutional and individual investors around the globe.
Global Equities
Citibank provides world-class global equity capabilities for corporate, institutional and
retail investors through our dominant equity sales and trading platform, industry-leading
Global Equity Research capabilities, top-tier institutional distribution capabilities and
the second-largest retail brokerage network in the U.S.
Global Fixed Income
Citibank is a global leader in Fixed Income underwriting, structuring, sales and trading
across all asset classes, including corporate, government and agency bonds, asset-backed
and mortgage-backed securities, syndicated loans, structured and futures products.
Global Fixed Income also encompasses Foreign Exchange and Futures.
The Citi gives access to accounts and services provided by Citibank and its affiliates.
Brokerage services and securities transactions are through Citicorp Investment Services,
member NASD logo is a service mark of Citicorp.
Achievements of Citibank
Cards- World‘s largest provider of credit cards -First Quarter '04 Net Income of $980
million
Consumer Finance -World‘s consumer finance leader -First Quarter '04 Net Income of $567
million
Retail Banking -Citibank: highest-rated, leading global brand -First Quarter '04 Net Income
of $1.122 billion
Capital Markets & Banking -#1 underwriter of Combined Debt and Equity and Equity-
related transactions -First Quarter '04 Net Income of $1.477 billion

34
Global Transaction Services -Leading provider of transaction products; $6.6 trillion in
assets under custody -First Quarter '04 Net Income of $234 million
Life Insurance & Annuities -One of the fastest growing life insurers in the U.S with
expanding international presence -First Quarter '04 Net Income of $287 million
Private Bank -Offers widest range of services to more than 25,000 of the world‘s most
successful and influential families -First Quarter '04 Net Income of $159 million
Private Client Services -A leader in managed accounts with $1.087 trillion in total client
assets -First Quarter '04 Net Income of $251 million
Structure of Citibank:

35
1.6 Comparative study of last 5 years: Financial Performance during last five years:
Table-2 Financial performance of CITIBANK Particulars 2010 2009 2008 2007 2006
Net interest revenue 54,652 48,914 53,749 45,389 37,928
Non-interest revenue 31,949 31,371 (2,150) 31,911 48,399
Revenues, net of interest expense 86,601 80,285 51,599 77,300 86,327
Operating expenses 47,375 47,822 69,240 58,737 50,301
Provisions for credit losses and for benefits
and claims 26,042 40,262 34,714 17,917 7,537
Income (loss) from continuing
operations before income taxes
$ 13,184 $ (7,799) $ (52,355) $ 646 $ 28,489
Income taxes (benefits) 2,233 (6,733) (20,326) (2,546) 7,749
Income (loss) from continuing
operations
$ 10,951 $ (1,066) $ (32,029) $ 3,192 $ 20,740
Income (loss) from discontinued
operations, net of taxes
(68) (445) 4,002 708 1,087
Net income (loss) before attribution of
non -controlling interests
$ 10,883
$ (1,511)
$ (28,027)
$ 3,900
$ 21,827
Net income (loss) attributable to non -
controlling interests
281 95 (343) 283 289
Citigroup’s net income
(loss)
$ 10,602
$ (1,606)
$ (27,684)
$ 3,617
$ 21,538
Less:
Preferred dividends–Basic
$ 9
$ 2,988
$ 1,695
$ 36
$ 64
Impact of the conversion price reset related
to the $12.5 billion
convertible preferred stock private
issuance—Basic
- 1,285 - - -
Preferred stock Series H discount
accretion—Basic
- 123 37 - -
Impact of the public and private preferred
stock exchange offer
-
3242
-
-
-
Dividends and undistributed earnings
allocated to participating securities,
applicable to Basic EPS
90 2 221 261 512
Income (loss) allocated to unrestricted
common shareholders for basic EPS
$ 10,503
$ (9,246)
$ (29,637)
$ 3,320
$ 20,962
Less: Convertible preferred stock
dividends
-
(540)
(877)
-
-
Add: Incremental dividends and
undistributed earnings allocated to
participating securities,
applicable to Diluted EPS
2
-
-
-
2
Income (loss) allocated to unrestricted
common shareholders for diluted EPS
$ 10,505
$ (8,706)
$ (28,760)
$ 3,320
$ 20,964

36
Earnings per share
Basic
Income (loss) from continuing operations
0.37
(0.76)
(6.39)
0.53
4.07
Net income (loss) 0.36 (0.80) (5.63) 0.68 4.29
Diluted (4)
Income (loss) from continuing operations
$ 0.35
$ (0.76)
$ (6.39)
$ 0.53
$ 4.05
Net income (loss) 0.35 (0.80) (5.63) 0.67 4.27
Dividends declared per common share 0.00 0.01 1.12 2.16 1.96
At December 31
Total assets ($)
1,913,902
1,856,64
6
1,938,470
2,187,4
80
1,884,16
7
Total deposits 844,968 835,903 774,185 826,23
0
712,041
Long-term debt 381,183 364,019 359,593 427,11
2
288,494
Mandatorily redeemable securities of
subsidiary trusts (included in long-term
debt)
18,131
19,345
24,060
23,756
8,972
Common stockholders‘ equity 163,156 152,388 70,966 113,44
7
118,632
Total stockholders‘ equity 163,468 152,700 141,630 113,44
7
119,632
Direct staff (in thousands) 260 265 323 375 327
Marketing strategies:
Their core strategy of being the world‘s global bank for consumers and institutions. Their
client-centric focus and emphasis on Responsible Finance are well-suited to the newly
enacted and still-coming regulatory changes. They are a leader in most of their products
across their institutional and consumer businesses. Citi also has a long history of
innovation — including pioneering widespread use of the ATM.
Their ―globality,‖ brand and product breadth make them unique in the industry and
provide them the opportunity to attract the best talent from all over the world.
In Regional Consumer Banking, they are pursuing a strategy of appealing to affluent
consumers in the top 150 international cities. Nearly half of their 2010 consumer banking
revenues was generated in emerging markets, where margins are higher and growth
prospects brighter. They will continue to invest in more and better branches in their
priority urban markets, even as they create ―perceptual scale‖ through innovative
distribution channels and products and digital banking platforms that make their service
both more effective and more ubiquitous.
Production of products & Its Distribution:

37
Citi‘s global presence, long history, iconic brand, and breadth and depth of relationships
and products offer employees — actual and potential — an unequaled chance to hone
their skills, learn new markets and work in a variety of businesses.
They are in the process of making carefully planned, long-term investments to support
these priorities — and to attract new customers, provide exceptional service, extend client
relationships, and create new and innovative products and services. These investments
include adding new branches, ATMs and personal bankers in their priority cities around
the India.
They are upgrading their technology platforms in both their consumer and institutional
businesses to improve the customer experience and create new efficiencies. They are
hiring corporate, investment and private bankers to help their clients seize new
opportunities. In their GTS business, they are expanding into more markets and creating
new products.
They are investing in their people across the board by implementing more training and
development programs. And they are increasing their marketing efforts in being at global
level as well.

38
1.7 Data Analysis:
1.7.1 SWOT Analysis of Citibank:
Strengths
1. Global investment Network
2. Financial Industry‘s largest
Proprietary Network
3. Innovation Products like Target
Balancing & Notional Pooling
4. Emphasis / Compete on customer
service rather than price
5. Large customer base
6. State-of-the-art technology /
infrastructure
7. Use of Artificial Intelligence
8. Strong Brand
9. Paperless transactions
10. Operational efficiency & Cost
savings
11. Value added services
12. Banking system consolidation
Weaknesses
1. Too big to fall Syndrome
2. Discretionary price discrimination
based on client volume & value
3. Operating expenses growth >
revenue growth
4. Leadership crisis
5. E-business expertise
Opportunities
1. Customer as partners: Back-office
operations
2. e-Enabled corporate & middle
markets
3. Multi-currency payment management
& payment aggregation
Threats
1. Changing global environment
2. Dealing interest margins
3. Brokerage & life insurance
unacceptability
4. Tighter regulations e.g. Basel-II &

39
4. Information flowing with the
payment
5. B2B e-payment
6. Parallel convergence
7. Sarbanes Oxley corporate compliance
8. Emerging markets
9. ERP integration
10. Mergers & Acquisition
now currently Basel-III
5. Credit crunch due to subprime
mortgage crisis
6. Dealing switching costs
7. Technology companies
8. Conservative SME‘s
9. Price war during slowdown

40
1.7.2 Ratio Analysis
Table-3 Ratio Analysis of last 3 years
Particulars 2010 2009 2008
Citigroup‘s net income (loss) to average
assets
0.53% (0.08)% (1.28)%
Return on common stockholders‘ equity (1)
6.8 (9.4) (28.8)
Return on total stockholders‘ equity (2)
6.8 (1.1) (20.9)
Total average equity to average assets 7.8 7.64 6.12
Dividends payout ratio (3)
NM NM NM
Tier 1 Common (4)
10.75% 9.60% 2.30%
Tier 1 Capital 12.91 11.67 11.92
Total Capital 16.59 15.25 15.70
Leverage(5)
6.60 6.87 6.08
Interpretations:
1. Based on Citigroup‘s net income less preferred stock dividends as a percentage of
average common stockholders‘ equity.
2. Based on Citigroup‘s net income as a percentage of average total Citigroup
stockholders‘ equity
3. Dividends declared per common share as a percentage of net income per diluted
share.
4. As defined by the banking regulators, the Tier 1 Common ratio represents Tier 1
Capital less qualifying perpetual preferred stock, qualifying non-controlling interests
in subsidiaries and qualifying mandatorily redeemable securities of subsidiary trusts
divided by risk-weighted assets.
5. The Leverage ratio represents Tier 1 Capital divided by adjusted average total assets.

41
1.8 Present position & trade of business during
last 3 to 5 years Egypt and India in an ambitious plan are looking forward to an exponential increase in
bilateral trade volume, from the current $3 billion to $10 billion. For the uninitiated, India
and Egypt share a 2500-year old diplomatic relationship
In the recent past, trade relationship between both the nations have been blooming and
blossoming. In 2004-05, trade between the two countries totaled $684.7 million. In 2006-07,
it grew to around $1.96 billion. A year later it grew more than 50 % to $3.38 billion.
India‘s is seemingly interested in tapping Egypt‘s expertise in number of areas; however, the
country‘s principal focus is on infrastructure development and desert agricultural methods.
Egypt exports to India primarily include oil and gas. Both countries however seem inclined
towards renewable energy sources.
India at present produces 8% of its energy from renewable sources and hopefully, in the
future it‘s aspiring to achieve 20%. Egypt too shares the same vision as India. Going
forward, the two countries might work together in the energy domain
Egypt is India's largest trade partner in North Africa, accounting for 40 per cent of India's
trade in the region. In terms of value, India's trade turnover with Egypt has grown nearly
nine-fold in 2006-07 as compared to 2000-01. India imports a diversified product basket
from Egypt comprising of oil, inorganic chemicals and fertilizers (crude).

42

1.1 Policies & Norms of Egypt country for
Banking Industry
1.2 Policies & Norms of Indian country for
Banking Industry
1.3 Present Trade barriers for import/ export

40
1.1 Policies & Norms of Egypt country for Banking Industry
Banking Legislation:
The CBE, Banking sector, and currency are governed by Law No. 88/2003, regulating
the banking system in Egypt.
Foreign Ownership of Banks:
Egyptians and non-Egyptians have the right to acquire shares in banks; however, such
should be without prejudice to the provisions of the above Law. However, individual or
entity‘s ownership of over 10% of the bank‘s issued capital or any other percentage resulting
in the actual control of the bank is not permitted without the approval of the CBE.
Bank Secrecy Law:
The above Law governs the obligation of banks not to disclose information relating to
their customersʹ accounts, deposits, safe deposit boxes and transactions, in the absence of
either the written permission of the customer, his legal representative, a delegated agent, or a
decision rendered by a competent judicial or arbitration tribunal
.
The Central Bank of Egypt (CBE) Law:
The aforementioned Law (No. 88/2003) regulates the activities of the Central Bank of
Egypt. The law addresses the independence of the Central Bank of Egypt (CBE) and its
supervisory authorities regarding inter-banks activities. According to the law, the CBEʹs
paid in capital is LE 1 billion and the bank is a public legal entity reporting to the President
of Egypt. The law identifies the CBEʹs responsibilities in several areas including
supervision of payment systems, management of international reserves and management of
external debt.

41
1.2 Policies & Norms of Indian country for Banking
Industry Banking –
A] Private sector
FDI cap/Equity: 74% (FDI+FII)
Entry Route: Automatic
Other Condition:
Subject to guidelines for setting up branches/ Subsidiaries of foreign banks
issued by RBI.
B] For Non Banking Financial Corporation’s (NBFC)
Sectors:
I. Merchant banking
II. Underwriting
III. Portfolio Management Services
IV. Investment Advisory Services
V. Financial Consultancy
VI. Stock Broking
VII. Asset Management
VIII. Venture Capital
IX. Custodial Services
X. Factoring
XI. Credit Reference Agencies
XII. Credit Rating Agencies
XIII. Leasing & Finance
XIV. Housing Finance
FDI cap/Equity: 100%
Entry Route: Automatic
Other Condition:
Subject to: a. minimum capitalization norms for fund based NBFCs - US$ 0.5 million
to be brought upfront for FDI up to 51%; US$ 5 million to be brought upfront for FDI above
51% and up to 75%; and US$ 50 million out of which US$ 7.5 million to be brought up front
and the balance in 24 months for FDI beyond 75% and up to 100%.

42
1.3 Present Trade barriers for import/ export
SERVICES BARRIERS
o General Agreement on Trade in Services (GATS) Commitments
Egypt has restrictions for most services sectors in which it has made General
Agreement on Trade in Services (GATS) commitments. These restrictions place a 49 percent
limit on foreign equity in construction and transport services. Egypt restricts companies from
employing non-nationals for more than 10 percent of their workforce. Limitations on foreign
management also apply to computer-related services (60 percent of top-level management
must be Egyptian after three years from the start-up date of the venture). A prohibition on the
acquisition of land by foreigners for commercial purposes was amended in 2002 to allow
such acquisition under certain circumstances.
o Insurance
Foreign firms may own up to 100 percent of Egyptian private insurance firms.
Investors acquiring more than a 10 percent stake in an insurance company require approval
from the Egyptian Insurance Supervisory Authority (EISA). A 2008 amendment to the
insurance law made EISA more autonomous and strengthened its role from administrative
regulator to a risk-based and market-sensitive regulator. The amendment also allows foreign
property insurance brokers to do business in Egypt for the first time. In an attempt to create a
self-regulatory body, the amendment creates a ―Union of Insurance Companies‖ which all
companies must join.
o Banking
No foreign bank seeking to establish a new bank in Egypt has been able to obtain a
license in the past 20 years, and in November 2009, the Central Bank Governor reaffirmed
that no new banks would be given licenses.
Since banking reform began in 2004, the government has divested itself from many
joint venture banks, and privatized the fully government-owned Bank of Alexandria in 2006.
However, efforts to restructure the remaining three state-owned banks have been mixed, and
the Central Bank rejected privatization for the three banks in 2009 on the grounds that market
conditions were not right.
o Courier and Express Delivery Services
Private courier and express delivery service suppliers seeking to operate in Egypt
must receive special authorization from the Egyptian National Postal Organization (ENPO).
In addition, although express delivery services constitute a separate for-profit, premium
delivery market, private express operators are required to pay ENPO a "postal agency fee" of
10 percent of annual revenue from shipments under 20 kilos. In 2009, the government of
Egypt proposed a new contract for private courier and express delivery companies, which
would grant ENPO even more extensive regulatory oversight over the private express
delivery sector by increasing considerably the fees paid to ENPO and requiring private
express delivery companies to receive prior ENPO authorization for their prices and other

43
polices. Given that ENPO is not an independent regulator, there are strong concerns that this
new proposed contract will negatively impact competition in the express delivery sector.
o Other Services Barriers
Egypt maintains several other barriers to the provision of certain services by U.S. and
other foreign firms. Foreign motion pictures are subject to a screen quota, and distributors
may import only five prints of any foreign film. According to the Egyptian labor law,
foreigners cannot be employed as export and import customs clearance officers, or as tourist
guides.
o Investment Barriers
Under the 1986 United States-Egypt Bilateral Investment Treaty (BIT), Egypt is
committed to maintaining an open investment regime. The BIT requires Egypt to accord
national and Most-Favored Nation (MFN) treatment (with certain exceptions) to U.S.
investors, to allow investors to make financial transfers freely and promptly, and to adhere to
international standards for expropriation and compensation. The BIT also provides for
binding international arbitration of certain disputes.
Based on a review of Egypt‘s investment policies, the OECD has invited Egypt to
adhere to the OECD Declaration on International Investment and Multinational Enterprises.
Egypt signed the Declaration in 2007, becoming the first Arab and first African country to
join. During this process, Egypt agreed to review the restrictions on investors identified in the
OECD‘s 2007 Investment Policy Review of Egypt, such as certain limits in the tourism
sector as well as the discriminatory treatment of foreign investors in courier services.

44

1.1 Potential for import / export in India /
Gujarat Market
1.2 BUSINESS OPPORTUNITIES IN FUTURE

41
1.1 Potential for import / export in India / Gujarat
Market
India and Egypt signed a Memorandum of Understanding in trade, science & technology,
culture and information technology
India and Egypt reviewed the entire range of their bilateral relations at the sixth session of the
Egypt-India Joint Commission Meeting in Cairo today and signed four documents on stepping
up cooperation in various areas.
External Affairs Minister S M Krishna said at a joint media interaction with Egyptian Foreign
Minister Mohamed Kamel Amr, with whom he co-chaired the meeting, that their discussions
were "very useful and productive".
The four documents signed by the two sides included a memorandum of understanding (MoU)
in the field of Environment Protection, Cultural Exchange Programme for the years 2012-15,
Work Plan for Agricultural Cooperation between Indian Council of Agricultural Research and
Agricultural Research Centre of Egypt for the year 2012-13 and an MoU between the Egyptian
Organization for Standardization and the Bureau of Indian Standards.
Description for potentials:
From the above given potential trade in nearer years that is in year 2012-13 & 2013-14 it
shows that India-Egypt relations are over five millennium years old. In this modern time, these
relations will soundly found on shared ideology & common beliefs.
India has always viewed Egypt as a stabilizing factor in the region & in the world.
Egypt has consistently played a vital role in the Non-Aligned Movement & championed the
cause of the developing world. This bilateral relation constitutes a factor of peace & stability in
international relations.
For the future this agreement which is mention in the above three points that shows export-
import opportunities in to oil, inorganic chemicals and fertilizers (crude), natural gas, banking
transactions, etc.

42
1.2 Business opportunities in future: 1.2.1 Market profile
Figure-8 Real GDP Growth
Interpretation:
The Egyptian economy achieved real growth of 7.2% during FY 2007/08, close to its
level in 2006/07, but up from the 4.1% achieved just half a decade ago in 2003/04. Real GDP
per capita income also increased by 5.2% in 2007/08, compared to just 1.2% half a decade ago.
Signs of increased productivity in the Egyptian economy are also noted. Unemployment
continued declining to less than 8.4% in last quarter of 2007/08 from 8.9% in 2006/07, and
down from 11.1% in 2003/04. As identified by a recent IMF mission to Cairo, such growth is
“broad based and robust”, with investments leading this economic wave starting FY 2005/06.
The economy is also gaining momentum and diversity.

43
1.2.2 Investment Opportunities in Egypt Infrastructure projects
Green fields projects
Investment in Governorates
Private Investment
During the period from July to March of FY 2008/09, private investments amounted to
LE 100 billion compared to LE 95 billion during the corresponding period of the previous
fiscal year. However, private investments decreased to reach 13% of GDP during the period
from July to March of FY 2008/09, compared to 14.4% during the same period of FY 2007/08.
Foreign Direct Investment
Net FDI increased from USD 509.4 million in FY 2000/01 to USD 13.2 billion in
2007/08, falling to USD 8.1 billion in 2008/09, USD 6.8 billion in 2009/10 and USD 1.6
billion in Q1 of FY 2010/11.
Egypt ranked first among North African countries and second in the African
Continent as an attractor of FDI, according to the World Investment Report 2010 by the United
Nations Conference on Trade and Development (UNCTAD).
FDI distribution by sector: Petroleum accounted for 53.1 percent of net foreign direct
investment (USD 3,589.4 million) in FY 2009/10, compared to 66 percent (USD 5,356.6
million) in FY 2008/09.
Net FDI in non-petroleum sectors amounted to USD 3,168.8 million in FY 2009/10 as opposed
to USD 2,756.8 million in the previous fiscal year.
Conclusion from investment opportunities:
The Central Bank is not issuing new banking licenses for foreign or domestic banks.
New applications are subject to an economic needs test. As such, even though the banking
sector is completely open to foreign investment, entry is currently only possible through the
acquisition of an existing entity. Several international and regional banks have gained access to
the market through the acquisition of existing banks. There is a lot of potential in the market
where less than 15% of the population have bank accounts. Mortgage finance, SME lending
and retail banking is growth opportunities in the Egyptian market.

44
Key reason to invest in Egypt:
Low-cost labour force: 20% of UK costs
Diversified sources of income: fees from the Suez Canal, tourism, private
transfers, and remittances, gas and oil/hydrocarbon exports
Foreign-exchange reserves at a high level roughly at $33 billion
Strategic location: gateway to Africa and the Middle East
Access to one of the largest markets in the MENA region
Low-cost energy
Financial stability and strong banking sector
Introduction of structural reforms to:
1. Streamline bureaucratic procedures
2. Tackle obstacles to higher growth
3. Promote the privatization programme
4. Improve the business climate
5. Introduce multiple investment incentives targeting the upgrading of the
business environment and modernization of the economy
New natural gas reserves in the Mediterranean to develop the hydrocarbon sector
Consumer Market:
Egypt has one of the most important and promising consumer markets in the
region
Attracting large international companies such as Wal-Mart
Sector had a total of 40% growth rate over the past three years
Egyptian consumer market is the first in Africa and second in the Arab region

45
Findings:
From the given PESTLE & SWOT Analysis, Citibank Financial Analysis, some economic
factors indicators we can make certain findings as per the followings:
The Egyptian market is gradually opening up, especially after signing an agreement
with the European Free Trade Association (EFTA) in 2006, and a free trade treaty with
the United States. Now a day during last 3 to 4 years
Egypt make four major contracts with Indian market for oil, gas, petroleum.
Egypt exports to India primarily include oil and gas. Both countries however seem
inclined towards renewable energy sources.
India imports a diversified product basket from Egypt comprising of oil, inorganic
chemicals and fertilizers (crude).
Advantage of Business Climate as specially for any kind of banking industry
IT penetration in government ministries is relatively low, in general, with several specific
exceptions such as Defense
Labor costs are lower than for many other software developing countries
For Personal Banking:
If investors are an existing Citibank Personal Loan customer with a clear repayment of
6 months or more, they can help their investors top-up their Citibank Personal Loan
Looking to this indication we can easily seem that there is wide range opportunity is
available for personal banking for securing the future.
Financial Services:
Home Loan:
Wide range opportunities are available for Banks along with Citibank in terms of
providing home loan & education loan.
Citibank Home Loans have maximum repayment tenure of up to 25 years. The actual
tenure of your loan is subject to the bank's discretion.

46
Based on the valuation of the property, investors can avail a Home Loan of up to 80%
of their property value.

47
Education loan:
Citibank Education Loan gets an education without any financial worries. Education is
one of life's most important investments that should never be hampered with a financial
dilemma.
Citibank take the financial burden out of the equation so that they can focus their
attention on what matters most - education. These types of services are mostly lack of
under the Egyptian Country so, for them it is right opportunity for implementing this
type of services.
Foreign Exchange:
Since 2008, the Egyptian Stock Exchange (EGX) has been among the best-performing
in the world, closing up more than 100% in both 2008 and 2009. More than 429
companies covering some 22 sectors are listed on the EGX, a combination of depth
and breadth that helped the bourse record double-digit gains in 2010. in 2011, Egypt
ranked third with a gain of 51% for the year
Within the coming year, the EGX is expected to relocate to Smart Village along with
other financial institutions and major national and regional investment banks and
private equity firms, creating the nation‘s first Financial Zone.
Investment banking, private equity and brokerage services have also roared to new life
in Egypt, with several of the country‘s leading institutions now established as the
dominant regional players or well on their way to becoming so.
Central Bank of Egypt ended the Egyptian Pound‘s peg to the USD and introduced a
new exchange rate regime in January 2003. This allowed the Egyptian Pound to float
outside its former official trading band of +/- 3% around an average official rate of
EGP 4.51 / 1 USD. An inter-bank FX market was introduced in January 2005.
Accordingly, the Central Bank buys and sells FX daily at the average exchange rate set
by banks in the previous trading day. The spread between the Central Bank‘s buying
and selling rates is about 0.5%. Offshore banks can place Egyptian deposits with local
banks.
Over the years 2010 and 2011, the foreign-exchange spot market interbank average
daily volumes are around USD 200-300 mn, up from USD 65 mn. Buying and selling
of Egyptian Pounds from and to local banks (forwards and outrights) is permitted for
current account transactions.

48
Retail Banking:
In the retail-banking sector, Small and Medium Enterprises (SMEs) also appear
currently under-banked.
They would offer great potential if banks started working with the entire supply chain
of their blue chip corporate.
SMEs are the backbone of the Egyptian economy: they contribute almost 80 percent of
GDP (Jordan 50 percent and Lebanon 99 percent) in different sectors, in particular
wholesale and retail trade, vehicle maintenance, and manufacturing.
This significant growth potential can be captured through two main channels:
on the one side, by increasing the penetration of existing banking products, especially
among the growing middle class outside of the main urban areas;
On the other, by introducing new banking products that are more customised to the
needs of the local consumer. The growth in population and personal wealth, especially
among middle class, which amounts to around 5 million people, is fuelling the
increasing demand for credit cards and auto loans.
Retail and SMEs expected to become main drivers of future growth:
The SME segment could also turn out to be an attractive alternative for banks to
channel part of their sizable liquidity, thanks to the expected acceleration in SME
creation, and to international aid granted to Egyptian banks in order to support SME
financing.
Egyptian banks enjoy a solid funding structure thanks to their access to a large base of
customer deposits. Over-reliance on deposits is particularly striking for public sector
commercial banks. Therefore, the system‘s overall funding mix is undiversified, with
retail deposits accounting for more than 2/3 of total deposits.
Factoring
Factoring in Egypt is currently almost non-existent. Enterprises finance their accounts
receivables through banks or from their own sources, increasing their financing
requirements.
Like other nonbank financial institutions, factoring companies do not have access to
potential clients‘ creditworthiness information, and are impeded by the inefficient legal
mechanism for collection of receivables.
The government has recently undertaken numerous reforms to foster the factoring
industry, including amending the Executive Regulations of the Investment Law, setting
the main rules and regulations governing factoring activities; licensing requirements;
registration requirements and procedures; and establishing surveillance that includes

49
financial adequacy, credit risk protection, disclosure, accounts receivable bookkeeping,
and collection services.
The amendments also facilitate the entry of factoring corporations.
Conclusion & suggestions:
There is wide range opportunities seem in this report by analyzing last 3 to 5 years
trade business opportunities
They need to open up in banking sector and give more licenses to foreign banks.
Egypt‘s stock exchanges have very few companies are listed must have to encourage
private players to list on their exchange.
Preparing and implementing a comprehensive program for the financial and managerial
restructuring of specialized state-owned banks (The Principal Bank for Development
and Agricultural Credit, Egyptian Arab Land Bank, and Industrial Development and
Workers Bank of Egypt). This step is expected to positively affect the performance of
banks by the end of the second stage of the banking reform plan (2009-2011).
Citibank is a well-established brand and it also enjoys a high brand recall among the
various foreign banks operating in the country at present.
The fact that Citibank is the Top Foreign Bank in the country also goes down very well
with the clients. Most of them are highly satisfied with the services provided to them.
The growth of the private sector banks in the last few years is a cause of concern as
they offer tough competition.
The growth of the Financial Sector in the last couple of year’s augers very well for the
bank as it has ample growth opportunities which have to be carefully and skillfully
tapped.
The Egyptian constitution having strong executives.
The information and communication technology of Egypt is emerging rapidly since
past few years. So it can be beneficial to our country.

50
References 1. Citibank Annual Report and Accounts 2009
2. DATA ON GDP AND ECONOMIC INFORMATION
3. http://www.gfmag.com/gdp-data-country-reports/280-egypt-gdp-country-
report.html
4. Get a FREE subscription to Global Finance magazine
http://www.gfmag.com/subscribe.html
5. http://www.expatforum.com/banking/banking-in-egypt.html
6. http://www.sis.gov.eg/En/Story.aspx?sid=840
7. List of languages by number of native speakers in India ( article)
8. Economist Intelligence Unit, 2010
9. Ministry of Economic Development
10. http://www.un.org.pk/unido/trta-interventions.html
11. TreadingEconomics.com; world bank
12. DGCIS Annual Export
13. Reserve Bank of India (2004), Report on Currency and Finance 2009-10 & 2010-
11.

51
Insurance Sector

52
Sr. No. Particulars Page
no.
1. Introduction of the Insurance Sector and
its role in the economy of specified
country.
Structure, Functions and Business
Activities of Indian Insurance sector &
LIC
2. Comparative Position of Suez Canal
with India and Gujarat
Present Position and Trend of Business
4 with India / Gujarat during last 3 to 5
years
3. Policies and Norms of Egypt regarding
Insurance Sector
Policies and Norms of India for
Insurance Sector
Present Trade barriers by Egypt for
Insurance sector
4. Potential for India / Gujarat Market
Business Opportunities in future
Conclusions and Suggestions

53
1.1 Introduction of Global Insurance sector
The insurance industry plays a vital role in supporting the Egyptian economy and growing
national investments. It provides financial protection for individuals and projects against
different risks. Further, it is a main channel for collecting and using national savings in
financing national investments and development plans, making available new job
opportunities and alleviating the impacts of inflation. Optional private pension funds
provide complementary pension for subscribers. Within this framework, the insurance
industry needs to invest its resources in medium- and long-term fields that go well with the
nature of its obligations, thus creating demand for medium- and long-term finance.
The Egyptian insurance market is subject to supervision and regulation per Law No. 10 of
1981 and its amendments, the last of which was Law No. 118 of 2008. In 2010, insurance
premiums were L.E8.8 billion Subscriptions to private insurance funds were L.E 3.3 billion.
Total investments of insurance companies and private insurance funds totaled L.E 58.2
billion. Effective July 1st, 2009, the EFSA has, in accordance with law No. 10 of 2009
regarding organization of regulation of markets and non-banking financial instruments,
replaced the Egyptian Insurance Supervisory Authority (EJSA) in terms of enforcement of
provisions of the law on supervision and regulation of insurance promulgated by Law No.
10 of 1981.
Development of the insurance market in Egypt
The insurance industry started in the second half of the 19th Century through acting
as agents for British and French companies
In 1900, the National Insurance Company was established as the first Egyptian
company ; in 1933, Al-Sharq Company was formed; and in 1934, Misr for General
Insurance
Foreign insurance companies began to set base in the market by establishing

54
branches and agencies which totaled more than 130.
In the wake of the nationalization movement under Law No. 23 of 1957, insurance
companies working in Egypt were nationalized. From that time until 1961, there were
14 Egyptian companies for insurance and re-insurance.
Based on insurance decrees of the year 1961 and merger decrees of the year 1964,
the number of insurance companies in Egypt became four companies fully owned by
the State: three companies for direct insurance and one for re-insurance.
As a result of the dramatic change in the Egyptian economic policy after the 1973
war, Law No. 43 of 1975 was issued. It caused a huge shift in the insurance industry
in Egypt by allowing inflow of foreign capital to establish insurance companies in the
free zones.
By the end of the Seventies of the Twentieth Century, private sector participation
began in the insurance market. The Suez Canal Company for Insurance was
established in 1979, Al-Mohandes, 1980, and Delta for Insurance, 1981. With the
continuation of the economic development process, private insurance companies
working in the market in the Nineties were nine: four of them were public sector,
three, private sector, and two, in the free zones.
In the mid of the Nineties, and in accordance with requirements of economic reform
policies and market liberalization, Law No. 10 of 1981 was amended to allow 49% of
foreign participation, which increased the number of insurance companies to twelve:
4 public sector, 6 private and two free zone. Then, it was amended per Law No. 156
of 1998 to allow 100% foreign participation. The number of companies working in
Egypt became seventeen: 4 public sector companies and 13 foreign capital
companies.
Finally, Law No.118/2008 that enforced Insurance Companies that merge between
both insurance activities , life and non-life insurance; to detach them within 2 years
from the date of issuing the law and this period can be extended but according to the
EFSA`s approval, was issued , consequently, the No. of Public Enterprise
Companies happened to be 2 , one for life insurance and the other is for non- life

55
insurance, meanwhile the no. of the other insurance companies registered in the
EFSA turned to be 28 , so that the total no of companies is to be 30 companies (
some are with Egyptian Capital, some are with Foreign and some with Common
Capital ).
1.2 Introduction of Indian Insurance sector
Background-insurance sector
(1) Brief history of insurance sector
With the establishment of the Oriental Life Insurance Company in Kolkata, the business of
Indian life insurance started in the year 1818.
(2)Important milestones in the Indian life insurance business
1912: The Indian Life Assurance Companies Act came into force for regulating the
life insurance business.
1928: The Indian Insurance Companies Act was enacted for enabling the
government to collect statistical information on both life and non-life insurance
businesses.
1938: The earlier legislation consolidated the Insurance Act with the aim of
safeguarding the interests of the insuring public.
The insurance sector in India has completed all the facets of competition –from being an
open competitive market to being nationalized and then getting back to the form of a
liberalized market once again. The history of the insurance sector in India reveals that it
has witnessed complete dynamism for the past two centuries approximately.

56
1956: 245 Indian and foreign insurers and provident societies were taken over by
the central government and they got nationalized. LIC was formed by an Act of Parliament,
viz. LIC Act, 1956. It started off with a capital of ` 5 crore and that too from the Government
of India.
The history of general insurance business in India can be traced back to Triton Insurance
Company Ltd. (the first general insurance company) which was formed in the year 1850 in
Kolkata by the British.
(3)Important milestones in the Indian general insurance business
1907: The Indian Mercantile Insurance Ltd. was set up which was the first company
of its type to transact all general insurance business.
1957: General Insurance Council, an arm of the Insurance Association of India,
framed a code of conduct for guaranteeing fair conduct and sound business
patterns.
1968: The Insurance Act improved for regulating investments and set minimal
solvency levels and the Tariff Advisory Committee was set up.
1972: The General Insurance Business (Nationalization) Act, 1972 nationalized the
general insurance business in India. It was with effect from 1st January 1973.
107 insurers integrated and grouped into four companies viz. the National Insurance
Company Ltd., the New India Assurance Company Ltd., the Oriental Insurance Company
Ltd. and the United India Insurance Company Ltd. GIC was incorporated as a company.
Insurance companies in India
IRDA has till now provided registration to 12 private life insurance companies and 9

57
general insurance companies. If the existing public sector insurance companies are
considered then there are presently 13 insurance companies in the life side and 13
companies functioning in general insurance business. General Insurance Corporation has
been sanctioned as the "Indian reinsurer" for underwriting only reinsurance business.
List of Insurance companies in India
(1) LIFE INSURERS
Public sector:
Life Insurance Corporation of India
Private sector:
Allianz Bajaj Life Insurance Company Limited
Birla Sun-Life Insurance Company Limited
HDFC Standard Life Insurance Co. Limited
ICICI Prudential Life Insurance Co. Limited
ING Vysya Life Insurance Company Limited
Max New York Life Insurance Co. Limited
MetLife Insurance Company Limited
Om Kotak Mahindra Life Insurance Co. Ltd.
SBI Life Insurance Company Limited
TATA AIG Life Insurance Company Limited
AMP Sanmar Assurance Company Limited
Dabur CGU Life Insurance Co. Pvt. Limited

58
(2) GENERAL INSURER:
Public sector
National Insurance Company Limited
New India Assurance Company Limited
Oriental Insurance Company Limited
United India Insurance Company Limited
Private sector
Bajaj Allianz General Insurance Co. Limited
ICICI Lombard General Insurance Co. Ltd.
IFFCO-Tokio General Insurance Co. Ltd.
Reliance General Insurance Co. Limited
Royal Sundaram Alliance Insurance Co. Ltd.
TATA AIG General Insurance Co. Limited
Cholamandalam General Insurance Co. Ltd.
Export Credit Guarantee Corporation
HDFC Chubb General Insurance Co. Ltd.
REINSURER:
General Insurance Corporation of India

59
About LIC
LIC is a dairy farmer owned, farm Improvement Company providing a diverse range of
products and services to the dairy, beef and deer industries both in New Zealand and
around the world.
Their origins, which date back to the early 1900s, lie in animal performance management
tailored to an innovative and wide range of products and services that deliver profit to a
wide range of livestock farmers.
LIC‘s head office is at new stead in the Waikato with regional bases around New Zealand,
branches in Australia and Ireland plus agencies in South America, United States, Asia and
South Africa.
Their revenue is in excess of $110 million per annum and the company has consistently
delivered net surpluses that exceed our strategic objectives. The majority of these
surpluses are paid to our dairy farmer shareholders as dividends, making LIC shares one
of the highest yield shares
Part of lic in Insurance Sector
Total insurance funds increased from ` 1, 35,791 crore in 2007-08 to ` 1, 44,009 crore in
2008-09 showing a growth of 6.05% at current prices. Life insurance funds increased to ` 1,
39,764 crore in 2008-09 growing by 6.24% from ` 1, 31,549 crore in 2007-08. The share of
life insurance funds to gross financial savings rose from 18.12% in 2007-08 to 18.71% in
2008-09. However, as percentage of GDP at factor cost, life insurance funds declined to
2.67% in 2008-09 from 2.90% in 2007-08. Total life insurance first year premium including

60
Group Business grew by 25.47% to ` 1, 09,290.37 crore in 2009-10. While total first year
premium of LIC grew by 33.87%, all the private players together grew by a modest 12.43%.
In individual business, while the first year premium grew by 17.73%, the growth in policies
was a modest 4.51%. On the other hand the growth in group premium was 55.81%. LIC‘s
market share in 2009-10 increased to 64.86% in First Year Premium as compared to
60.79% in 2008-09 while its share in policies improved to 73.02% from 70.52%.
Marketing activities:
Statement of individual new business procured during 2009-10 channels wise
channel Number of policies(in
lakhs)
First premium income (rs. Crore)
conventional 340.09
39,227.49
banking & alternate
channels
7.54 1,132.92
chief life insurance advisor 20.91 2563.88
micro insurance 19.21 36.15
total individual first premium 388.39 42960.44
Direct marketing
In the financial year 2009-10 Corporation took a new initiative of Direct Marketing. This
vertical was started with an objective of "CREATING NEW systems for business

61
generation, sales process monitoring and business processing with a view to reach out to
untapped markets and provide improved buying experience to customers".
In a short span of 8 months, the channel has expanded and has presence at 21 centers
with 542 professionally trained Direct Sales Executives (DSEs) to provide financial advice
to prospective customers. During the year 2009-10, main focus of the channel was setting
up systems and processes. A state of art Lead Management System has been established
to provide easy access to prospective customers to reach out to LIC to buy a policy. Such
leads captured through our website www.licindia.in are passed on to well train DSEs on
real time basis who can contact the customer instantly. This channel procured a New
Business of ` 25.55 crore under 8887 policies giving average FP per policy as ` 28,759.
Hr information
Staff Strength
The total number of officers/employees working for the Corporation as on 31.03.2010
was1,15,966 as compared to 1,14,916 at the end of the previous financial year.
Agency Strength
The total number of agents on our role is 14, 02,807 as at 31.03.2010 as against 13,
44,856 as on 31.03.2009. The number of active agents is 13, 40,067 as at 31.03.2010 as
compared to 12, 75,611 as on 31.03.2009.
Recruitment
During the year, the Corporation recruited 17 Engineers, 24 Actuarially Qualified
Professionals, 47 Chartered Accountants and 307 Officers in the cadre of Assistant
Administrative Officer. 110 Senior Marketing Executives have been selected on contractual
basis for marketing assignments in the P&GS, M-B & AC, CLIA and Direct Marketing
Channels.
Business plans for 2010-11

62
During the financial year of 2010-11, the Corporation has planned for sustained growth in
New Business.
The new business annual budget is as under:
Total policies (in crore) 4.66 (46.60 million)
Single premium (` in crore) 32,000.00 (3, 20,000.00 million)
Non-single premium (` in crore) 22,000.00 (2, 20,000.00 million)
Total new business premium (in crore) 54, 00,000.00(540.00 billion)

63
2.1 Comparative Position of Egypt’s Insurance Sector
The Egyptian Financial Supervisory Authority is a public Authority, having a legal
status, established in accordance to law 10 of the year 2009.
The Authority shall be responsible for supervising and regulating non-banking
financial markets and instruments, including the Capital Market, the Exchange, and
all activities related to Insurance Services, Mortgage Finance, Financial Leasing,
Factoring and Securitization. EFSA's role is to regulate the market and ensure its
stability and competitiveness to attract more local and foreign investments ―The
mandate of the Authority also includes limiting inconsistency risks and addressing
problems arising from applying different supervisory rules".
The Egyptian Financial Supervisory Authority shall replace the Egyptian Insurance
Supervisory Authority, the Capital Market Authority, and the Mortgage Finance
Authority in application of the provisions of the supervision and regulation of
Insurance law no. 10 of 1981, the Capital Market law no. 95 of 1992, the Depository
and Central registry law no. 93 of 2000, the Mortgage Finance law no. 148 of 2001,
as well as other related laws and decrees that are part of the mandates of the above
authorities.
The Authority shall be considered the concerned administrative body entitled to apply
the Financial Leasing provisions promulgated by law no. 95 of 1995.
Insurance Companies in Egypt
Public Sector Companies (providing all Insurance):-
MISR Insurance Company
Al Chark Insurance Company
National Insurance Company

64
Private Insurance Companies (Providing all Insurances):-
Suez Canal Insurance Company
Mohandes Insurance Company
Delta Insurance Company
Private Sector Companies (Providing property and Liability insurance):-
AIG Egypt Insurance Company
Arab Misr Insurance Group
Allianz Insurance Company
ACE CIIC Insurance Company
Royal & Sun Alliance Insurance Company
Egyptian Saudi Insurance Home
BUPA Egypt Insurance Company
Private Sector Companies (Providing Life Insurance):-
Pharaonic American Life Insurance Company
Commercial International Life Insurance Company
Allianz Life Insurance Company
ACE Life Insurance Company
NSGB life Insurance Company
Co-operative Insurance Societies:-
Co-operative Insurance Society Egypt
Re-Insurance Companies:-
Egyptian Reinsurance Company

65
Insurance Sector Reform
Egypt is a member of regional and international insurance associations and
organizations, such as:
• General Arab Insurance Federation (GAIF)
• Federation of Afro-Asian Insurers (FAIR )
• International Association of Insurance Supervisors (IAIS)
• Association of Insurance Supervisors in Developing Countries (AISDC)
• African Insurance Organization (AIO)
• International Organization for Pension Supervisors (IOPS)
• D8
• COMESA
The following are snapshots of some of these federations
1. Membership to IAIS
The Authority has been a member of the IAIS since 2005. The Association was
established in 1994 as an international organization with a membership of 190
supervisory and regulatory entities in 140 states worldwide. Insurance premiums
of member states are estimated to be 97% of total premiums worldwide.
The IAIS aims at the following:

66
Cooperation among members to ensure the highest regulatory and
organizational levels for the insurance industry at the domestic and international
level to maintain the efficiency, integrity, fairness and stability of insurance
market with the purpose of protecting policy holders.
Consolidating efforts for institutionalization of efficient levels of regulation through
exchange of information and expertise to enhance regulatory approaches in
markets worldwide
Ensuring integrity and stability of international financial markets
Egypt’s contribution to the activities of IAIS
The EFSA contributes to several activities through the membership of Dr. Adel
Moneer, the Deputy Chairman in the executive committee. He also works as a
deputy chairman of the market ethics committee.
Some EFSA staff members are members in the following committees:
• Solvency committee
• Re-insurance committee
• Micro-insurance committee
2. Arab Forum of Insurance Regulatory Commissions chaired by Egypt
This forum was founded in Amman, Jordan, on 7/ 9/ 2007. The founding states,
as well as those that joined later, realized the importance of boosting the role of
such authorities in regulation of the Arab insurance markets and development of
the insurance industry there. For that purpose, an institutional Arab framework
should aim at ensuring harmony among regulatory and supervisory frameworks
in the Arab markets, pumping up the level of exchange of information and
supervisory expertise, and providing technical assistance in that field, taking into

67
consideration the quick-paced developments the Arab insurance industry is
witnessing and the several challenges globalization and economic openness
have created.

68
6. Committee for capital adequacy and preparation of financial reports
In pursuit of achieving harmony among member states regarding regulatory
frameworks related to solvency, members agreed to form a committee for capital
adequacy and preparation of financial reports to be chaired by Egypt and have
Jordan, Saudi Arabia, Oman and Lebanon as members. The purpose is to
develop a standard form to calculate capital adequacy, and solvency margin for
Arab insurance markets based mainly on Solvency II standard. The committee
was also mandated to develop a model for preparation of corporate financial
reports based on the IFRS, and to take samples from the insurance markets in
the member states with the purpose of studying and submitting findings to the
meeting of the next forum session to approve a specific model, while taking into
consideration the different conditions in the international and Arab markets.
7. Membership of the D8 (eight country group)
Egypt has been a participant in the D8 since its establishment in 1997. The D8 is
an economic bloc composed of 8 countries including Egypt, Indonesia, Malaysia,
Pakistan, Nigeria, Iran, Turkey and Bangladesh. It was formed in anticipation of
the challenges of globalization and open markets and expected competition
involved.
Egypt is playing a leading role inside the D8 through chairmanship of the
committee of infrastructure of insurance, which aims at enhancing the
infrastructure of insurance markets in these countries in general and solidarity
insurance in particular.
8. COMESA
In 1981, the COMESA agreement started as a preferential trade zone with the
purpose of establishing a free trade zone among the member states to develop

69
into a customs union, then a common market. In December 1994, the agreement
took its current form. Egypt joined the COMESA in 1998.
Egypt joined the agreement for liberalization of services trade among COMESA
member states (i.e. States of Eastern and Southern of Africa). It participates in
the project for evaluation of service sectors in member states.
The legal framework of the Insurance consists of many elements that give the
Authority the opportunity to play its role in an effective way to protect investors
and regulate the market. In addition to this, it grants the continuous development
in the supervisory framework of the Authority. These elements are as follows:
Law no. 10 of 1981for Insurance Supervision and Control in Egypt , its Executive
Regulations , amended by the Law No 118 for 2008 and Law 54 for 1975
Promulgating the Private Insurance Funds and its executive regulations and law
no 72of the year 2007 promulgating the law on compulsory insurance against the
civil liability arising from high speed transportation motor vehicle and its executive
regulations.
The legal framework consists of several legislatives related to the Insurance
market, that includes :
Company Law No 159 for 1981 and its executive regulations .
Anti -money laundering Law .
Taxes Law .
The unified building law .
The elevators law.
2.2 Present position & Trend of business of Suez
Canal with India
At present Suez Canal doesn‘t have significantly any Business with India or LIC
but yet it has scope to have future business and trade relationships.

70
The followings are the details of the company.
Suez Canal Insurance
Company profile :
Suez Canal insurance company (S.A.E) has been established on 10.10.1979
according to the law no. 159/1981 and supervision law no. 10/1981 and ties
implementing rule.
The company , according to its establishment and the given license from the
Egyptian insurance authority, is assigned to practice all insurance and
reinsurance activities in fire/ marine /Miscellaneous Motors / Engineering and
healthcare in addition to personnel insurance and funds through its headquarter
located at Giza and 29 branches.
Founded Suez Canal Insurance Company (SAE) at 10.10.1979 in accordance
with the provisions of Law No. 159 of 1981 and the law of supervision and control
of no. 1o o f 1981.
Since the beginning of the establishment of the Suez Canal Company for
insurance in the Egyptian market and it is investigating an ideal model and the
overall experience in providing excellent insurance services for projects of
national and private sector projects and investment and other support and ensure
the safety of the national economy to achieve the highest degrees of
success and excellence.

71
Foundation Date & Membership:
* Foundation date 1979.
* Member of the Afro Asian insurance and reinsurance federation.
* Member of the Egyptian insurance federation.
* Member of the African insurance Organization.
Marketing data:
The most important Products
Life insurance
Marine
Engineering
Auto insurance
Fire insurance
Contractor liability insurance
Health care insurance
Miscellaneous accident insurance
Insurance on the hulls of ships
Quality policy:
Our motto is the simplest of issuance; the quickest of settling claims is the
success of your life, business. It is targeted in itself to fulfill your goals and
accomplish your business; you should be fully free to do so. To do so, wave all
your responsibilities to us in order to insure your foundations and employees
against all prospected a potential risk.
We provide all insurance coverage such as: Life, engineering, marine, in addition
to health care for your family or employees.
You can have full access and contacts to us through our 29 branches spread all
over the country. Be sure that you will find trust and mind relief

72
Finance data:
Property and liability insurance
Value of the
Egyptian pound
Statement June 30, 2011 June 30th, 2010
average
Assets
Cash on hand and at banks 27610645 41959521
Investments
Fixed deposits with banks 427853349 341341692
Treasury bills and government securities
deductible 40761600
Securities held for trading 26283790 26329464
Securities available for sale 26645553 25319552
Loans 1650550 1260530
Securities held to maturity 176810166 175760936
Real estate investments 7964198 4961760
Total investment 707969206 574973934
Receivables insurance operations 73928084 681841111
Insurance companies and reinsurance 28396817 30860180
Receivables and other debit balances 26518653 28053556
Fixed assets 30811266 31880552
Total assets 895234671 783144034
Liabilities and shareholders' equity

73
The rights of policyholders
Technical provisions for insurance people
and the formation of the money
Technical Provisions for property and liability
insurance 279175301 223273536
Total equity holders 201077795 176129900
Insurance companies and reinsurance 1331065272 121120907
Accounts payable and other payables 119054498 93303478
Other provisions 32607297 33836597
Total shareholders' equity E
Total commitments
25319552
647664418
Shareholders' equity
Paid-up capital 85000000 85000000
Reserves 28493576 24780213
Profit-phase 1456292 1148545
Net profit for the year 17304640 24550858
Total shareholders' equity including profit for
the year 132254508 135479616
Total liabilities and shareholders' equity
895234671
783144034

74
3.1 Policies & Norms of Egypt for Insurance sector
INSURANCE LAW IN EGYPT
OVERVIEW:
The insurance market is regulated and supervised by Law No. 10 of 1981 and its
amendments (Law No. 156 of 1998 and Law No. 91 of 1995). Since 1996, tariffs
on insurance have been almost entirely eliminated, thereby reducing insurance
premiums significantly.
According to this law the private sector is permitted to own up to 100 per cent of
the shares of an Egyptian insurance company that is fully owned by the
government. This provision applies to both local and foreign private investors.
The Egyptian Insurance Supervisory Authority (EISA) is an independent authority
(affiliated with the Ministry of Investment) charged with supervising and
controlling insurance activities. EISA‘s main duties are to protect the rights of
policyholders, beneficiaries and third parties and to maintain law and order in the
market.
MAIN PROVISIONS:
The Prime Minister's approval is required to own 10 per cent or more of an
insurance company's shares.
Financial point :
Authorized capital : 100.000.000 pound
Paid up capital : 40.000.000 pound
Share Holders Equity : 51.274.161 pound
Technical Reserves : 142.045.476 pound
Total investments : 260.487.551 pound

75
Risk insurance may be transacted outside Egypt or executed by foreign-
owned insurance companies. Foreign companies or companies wishing to
pursue insurance transactions outside Egypt, however, must first obtain EISA
approval.
Managing directors of state-owned companies may be non-Egyptians.
Any company wishing to enter the market and obtain a new license must
have a minimum capital of EGP 30 million; however, if the company is to deal
in life insurance, the minimum requirement is EGP 60 million. A company's
contribution to increasing total retention in the market by introducing new
covers or developing existing covers will also be taken into account when the
company applies for a new license.
All insurance companies are required to publish regular financial statements
approved by accredited financial auditors
3.2 Policies and Norms of India for Insurance
IRDA RULES FOR INSURANCE
Regulations for the life insurance-reinsurance
In exercise of the powers conferred by section 114A of the Insurance Act, 1938,
read with sections 14 and 26 of the Insurance Regulatory and Development
Authority Act, 1999, the Authority, in consultation with the Insurance Advisory
Committee hereby makes the following regulations, namely--
1. Short title and commencement
(1) These regulations may be called the Insurance Regulatory and Development
Authority (Life Insurance - Reinsurance) Regulations, 2000.
(2) They shall come into force on the date of their notification in the Official
Gazette.

76
2. Definitions
In these regulations, unless the context otherwise requires--
(a)`Act' means the Insurance Act, 1938 (4 of 1938);
(b) `Authority' means the Insurance Regulatory and Development Authority
established under sub-section (1) of section 3 of the Insurance Regulatory and
Development Authority Act, 1999 (41 of 1999);
(c) `retention' means the amount of risk which an insurer assumes for his own
account;
(d) words and expressions used and not defined in these regulations, but defined
in the Insurance Act, 1938 (4 of 1938) or Insurance Regulatory and Development
Authority Act, 1999 (41 of 1999), shall have the meanings respectively assigned
to them in those Acts as the case may be.
3. Procedure to be followed for reinsurance arrangements
(1) Every life insurer shall draw up a programme of reinsurance in respect of lives
covered by him.
(2) The profile of such a programme, duly certified by the Appointed Actuary,
which shall include the name(s) of the reinsurer(s) with whom the insurer
proposes to place business, shall be filed with the Authority, at least forty-five
days before the commencement of each financial year, by the insurer:
PROVIDED that the Authority may, if it considers necessary, elicit from the
insurer any additional information, from time to time, and the insurer shall furnish
the same to the Authority forthwith.
(3) The Authority shall scrutinise such a programme of reinsurance as referred to
in sub-regulation (2), and may suggest changes, if it considers necessary, and
the insurer shall incorporate such changes forthwith in his programme.
(4) Every insurer shall retain the maximum premium earned in India
commensurate with his financial strength and volume of business.

77
(5) The reinsurer, chosen by the insurer, shall enjoy a credit rating of a minimum
of BBB of Standard and Poor or equivalent rating of any international rating
agency :
PROVIDED that placement of business by the insurer with any other reinsurer
shall be with the prior approval of the Authority:
PROVIDED FURTHER that no programme of reinsurance shall be on original
premium basis unless the Authority approves such programme:
PROVIDED FURTHER that no life insurer shall have reinsurance treaty
arrangement with its promoter company or its associate/group company, except
on terms which are commercially competitive in the market and with the prior
approval of the Authority, which shall be final and binding.
(6) Every insurer shall submit to the Authority statistics relating to its reinsurance
transactions in such forms as it may specify, together with its annual accounts.
4. Inward reinsurance business
(1) Every insurer who wants to write inward reinsurance business shall adopt a
well-defined underwriting policy for underwriting inward reinsurance business.
(2) An insurer shall ensure that decisions on acceptance of reinsurance business
are made by persons with adequate knowledge and experience, preferably in
consultation with the insurer's appointed actuary.
(3) An insurer shall file with the Authority, at least forty-five days before the
commencement of each financial year, a note on its underwriting policy indicating
the classes of business, geographical scope, underwriting limits and profit
objective.
(4) An insurer shall also file any changes to the note referred to in sub-regulation
(3) as and when a change in underwriting policy is made.
3. Regulation of Investments
(1) Life Business: In terms of Explanation in section 27A of the Act, the
Authority has determined that assets relating to Pension business, Annuity

78
business and Linked Life Insurance business shall not form part of the Controlled
Fund for the purpose of that section.
Without prejudice to section 27 or section 27A of the Act, every insurer carrying
on the business of life insurance shall invest and at all times keep invested his
controlled fund (other than funds relating to pension and general annuity
business and unit linked life insurance business) in the following manner:
Sl.
No. Type of Investment Percentage
(i) Government Securities 25%
(ii) Government Securities or other approved securities [including
(i) above]
Not less than
50%
(iii) Approved Investments as specified in Schedule I
(a) Infrastructure and Social Sector
Explanation : For the purpose of this requirement Infrastructure
and Social Sector shall have the meaning as given in regulation
2(h) of Insurance Regulatory and Development Authority
(Registration of Indian Insurance Companies) Regulations
2000 and as defined in the Insurance Regulatory and
Development Authority (Obligations of Insurers to Rural and
Social Sector) Regulations 2000 respectively.
(b) Others to be governed by exposure norms as specified in
regulation 5. Investment in "other than approved Investments"
can in no case exceed 15% of the fund.
Not less than
15%
Not
exceeding
35%
3.3 Present Trade barriers for Insurance sector in
Egypt

79
Import Bans and Barriers
Passenger vehicles may only be imported within one year after the year of
production. Egyptian regulations allow investors to import a vehicle for private
use without restriction in the year of manufacture, provided that approval is
obtained from the Chairman of the General Authority for Investments and Free
Zones (GOIEC).
The Egyptian Ministry of Health prohibits the import of natural products, vitamins,
and food supplements in their finished form. These items may be marketed in
Egypt only through local manufacture under license, or by sending ingredients
and premixes to a local pharmaceutical firm to be prepared and packed in
accordance with Ministry of Health specifications. Only local factories are allowed
to produce food supplements, and to import raw materials used in the
manufacturing process.
The Nutrition Institute and the Drug Planning and Policy Center of the Ministry of
Health register and approve all nutritional supplements and dietary foods. It takes
from four months to one year for approval.
Importers must apply for a license for dietary products. The validity period of the
license varies from 1year to 5 years depending on the product. After the
expiration date of the license, the importer must submit a new request for license
renewal. License renewal costs about $500. However, if a similar local dietary
product is available in the market, registration for an imported product will not be
approved.
The Ministry of Health must approve the importation of new, used and
refurbished medical equipment and supplies to Egypt in advance; without the
approval such imports are banned. This requirement does not differentiate
between the most complex computer-based imaging equipment and the most
basic of supplies. The MOH approval process entails a number of demanding

80
steps. The importer must submit a form requesting the Ministry of Health‘s
approval to import medical equipment. The importer is also required to provide a
safety certificate issued by official health authorities in the country of origin, as
well as a certificate of approval from the Food and Drug Administration or the
European Bureau of Standards.
The importer must also present an original certificate from the manufacturer
indicating the production year of the equipment and certify that the equipment is
new. All medical equipment must be tested in the country of origin and proven
safe before it will be approved for importation into Egypt. The importer must
prove it has a service center to provide after-sales support for the imported
medical equipment, including spare parts and technical maintenance.
Egypt continues to block imports of U.S. poultry and poultry products based on
concerns that U.S. industry does not meet Egyptian halal requirements, despite
U.S. efforts to address these concerns and U.S. industry‘s success in exporting
to other Islamic markets. A decree in July 2006 lifted the overall banon poultry
imports for six months, and that decree was extended to allow imports through
the end of March 2007. The government also lowered the duty on whole birds
from 32 percent to 20 percent in February 2007. However, the government still
bans the import of poultry parts, such as leg quarters, and requires that Ministry
of Agriculture officials be present to observe proper halal slaughter, even though
The poultry industry in the United States contracts with the Islamic Council of the
United States to perform that service.
Services barriers in insurance
State-owned insurance firms dominate the Egyptian market. Foreign firms may
own up to 100 percent of Egyptian private insurance firms, although the market
remains closed to foreign intermediaries. There are currently at least six foreign

81
insurance companies operating in the market. There are eleven private sector
insurance companies, three of which are joint ventures with U.S. firms. The state-
owned Egyptian Reinsurance Company (Egypt Re) is the only registered
company in the reinsurance market. Direct insurers were required by law to make
compulsory cessions to Egypt Re, although this requirement has been
progressively reduced since 1999 and replaced by voluntary sessions. Since
Egypt is a member of the African Union, direct insurers are also required to cede
5 percent of their reinsurance business to Africa.
The Egyptian market remains small and underdeveloped due to many factors
including excessive premium taxes. The market remains dominated by the four
state-owned insurance companies that controlled over 75 percent of the non-life
insurance market and 56.2 percent of the life insurance market in 2004. In 2005,
the Ministry of Investment commissioned an international consortium to
restructure its four state-owned insurance companies, opening the way for their
privatization. The ministry has selected a consortium of the Paris-based BNP-
Paribas, Egypt's Commercial International Bank (CIB) and the New York-based
insurance consulting firm Milliman and Ernst & Young to oversee the process.
The "privatization team" continues to work on a privatization plan for one or more
of the state-owned insurance companies. The consortium submitted a final
Diagnostic and Valuation report for the four companies in December 2006. The
report of Restructuring and Possible Execution of Privatization Scenarios is
expected to be finalized by March 2007. Senior insurance officials are predicting
the first privatization to take place by mid-2007 and the growing inclination
among the policy makers is tore structure and privatizes all four.
4.1 & 4.2 Potential for LIC to have Joint Venture with
Suez Canal in Egypt

82
Trade summary
The Export of goods and services in 2010 in Egypt was $44609100000. U.S.
goods exports in 2009 were $5.26billion, up 19.7 percent from the previous year.
Corresponding U.S. imports from Egypt were $2.4 billion, up 14.5 percent. Egypt
is currently the 37thlargest export market for U.S. goods. The stock of U.S.
foreign direct investment (FDI) in Egypt in 2005 was $4.8 billion, up from $4.1
billion in 2004. U.S. FDI in Egypt is concentrated largely in the mining sector.
Import policies
Over the past decade, the Government of Egypt (GOE) has gradually liberalized
its trade regime and economic policies in general. The reform process had been
somewhat halting until the appointment of Prime Minister Ahmed Nazif and a
new ministerial economic team in 2004. Under the leadership of Prime Minister
Nazif, the GOE has adopted a wide range of significant reform measures,
although much remains to be done. To maintain its reform momentum, the GOE
should continue its efforts to reduce red tape, reduce corruption, reform the
cumbersome bureaucracy, and eliminate unreasonable and non science based
health and safety standards.
4.3 Conclusions & Suggestions
After analyzing the Insurance sectors of India & Egypt we can reach on following
conclusions & suggestions:
1. India‘s Insurance sector is one of the world‘s fastest growing sectors as far as
growths are concerned. Whereas Egypt‘s same sector is bit under developed &
having vast scope for development & business with India.

83
2. Looking to the very few trade barriers by both the economies for the Insurance
sector it can be concluded that there is an ample scope for Indian companies to
have joint ventures with Egyptian companies to enter their market.
3. Hence LIC of India should look for the joint venture with the Egyptian company
Suez Canal to enter in to Egyptian market or conversely in India.
References
http://afirc.org.mytempweb.com/default_en.aspx

84
Engineering Sector
Table of Content Sr.No Particulars Page.No
1 Overview of Engineering sector in Egypt
2 Overview of Engineering sector in India
3 Opportunity of Engineering sector in Egypt
Company Information
BHEL
ENPPI
L&T
ELECON
Conclusion
Suggestion
Opportunity of Indian Engineering Sector to start a business in Egypt.
References
Overview of Engineering sector in Egypt
“The government has special attention for engineering machinery and
equipment, labor-intensive consumer electronics and automotive
components.’’
Sector Background: Engineering sector companies represents 21% of total
industrial companies. The engineering sector is considered to be one of the
biggest industrial sectors that includes 9 different sub-sectors which are:
Automotive, Home Appliances, Feeding Industries, Machineries and Equipments,
Medical Devices, Electronics, Cables and Lighting, Metal Furniture, Households
and Metal Forming1. h

85
In 2010 IMC has executed several Sector projects that had direct impact
on increasing; Exports, Investment, and New Employment Opportunities.
Technically assisted 50 companies to increase their Exports and Sales by
20%.
Waste elimination and cost reduction by 10% and implementation of new
systems for waste disposal.
Applying Total Productive Maintenance "TPM" through appropriate
operational programmers.
Design Development through effective programmes.
Financial and inventory control systems.
2010 data (till the end of August 2010)
Total number of Engineering Companies registered in IMC has reached
1300 companies, with total employment of more than 120 thousand
workers.
Total exports value has reached LE 7.8 billion.
Total investments of registered companies has reached approximately LE
28 billion
Sector projects
Export marketing plan for home appliances.
Development plan for quality systems and competiveness of the electronic
sector (Computers &LCD)
Vertical integration plan focusing on substituting imported parts with local
ones.
Export Development Plan for automotive suppliers sector and compliance
with international regulations.
Study for the existing production capacity for machines & equipments.
Study the opportunity of investing abandon silicon resources in Egypt to
position Egypt as a hub for silicon ingots and wafers.

86
Development and deepen study for ship & Yacht sector in Alexandria and
Suez.
Main Services to Engineering Companies 2010:
Being one of the largest sectors of the Egyptian Industry, the
Engineering sector was most affected with the current Global Financial Crisis,
thus IMC increased its support to the sector, services:
Lean Manufacturing to reduce cost thus result in an increase of
productivity and efficiency of operations2.
Energy saving and utilization of power and resource consumption.
Implementing quality management systems, and granting quality
international certifications.
The primary aim of the Council is to support the engineering exporters to
increase their exports and comply with the government's export strategy for the
Engineering sector in Egypt to meet the target that has been set by the
government. A new mechanism is going to be applied starting July 2010 for
exporters to receive export incentives from the Export Development Fund (EDF).
Export incentives will be calculated based on the Value Added and not on
export value as a total (old mechanism). Therefore, we would like all our
members to start calculating their value added to be able to continue to receive
their incentives3.

87
Most of the local engineering products are assembled with a very small
real manufacturing percentage and components are imported from Asia
for price competitiveness.
Egypt imports most of its needs of industrial equipment; conveyor belts,
automatic control units up to complete production lines and turnkey
factories.
Although in Egypt British companies generally enjoy a good reputation for
quality but price and credit terms are a deciding factor for obtaining
contracts. Back-up servicing facilities for machinery and the supply of
spare parts are also important.
Study of Engineering Industries India
Overview of engineering sector in INDIA
The Engineering sector is the largest in the overall industrial sectors in India.
It is a diverse industry with a number of segments, and can be broadly
categorised into two segments, namely, heavy engineering and light
engineering4. The engineering sector is relatively less fragmented at the top, as
the competencies required are high, while it is highly fragmented at the lower
end (e.g. unbranded transformers for the retail segment) and is dominated by
smaller players.
The engineering industry in India manufactures a wide range of products,
with heavy engineering goods accounting for bulk of the production. Most
of the leading players are engaged in the production of heavy
engineering goods and mainly produces high-value products using high-
end technology. Requirement of high level of capital investment poses as
a major entry barrier. Consequently, the small and unorganised firms
have a small market presence5.

88
The light engineering goods segment, on the other hand, uses medium to
low-end technology. Entry barrier is low on account of the comparatively
lower requirement of capital and technology. This segment is
characterised by the dominance of small and unorganised players which
manufacture low-value added products. However, there are few medium
and large scale firms which manufacture high-value added products. This
segment is also characterised by small capacities and high level of
competition among the players6.
Classification of the Engineering Sector in India7 [TABLE-7]
Source: http://www.dnb.co.in/Engineering/overview.asp
Major Segments
The major end-user industries for heavy engineering goods are power,
infrastructure, steel, cement, petrochemicals, oil & gas, refineries, fertilisers,
mining, railways, automobiles, textiles, etc. Light engineering goods are
essentially used as inputs by the heavy engineering industry.

89
Key Growth Drivers of Indian Engineering Sector
The engineering sector in India has been growing on the back of growth in
the user industries and several new projects being undertaken in various core
industries such as railways, power, infrastructure, etc. Capacity creation in
sectors such as infrastructure, oil & gas, power, mining, automobiles, auto
components, steel, refinery, consumer durables, etc, is driving growth of the
engineering industry8.
Growth of the key user-industries
Government‘s thrust on the power and construction industries
India being preferred by global companies as an outsourcing destination
as it enjoys lower labour cost and better designing capabilities.
Drivers
The key drivers of growth in this industry are given below:
1) Increased investment in infrastructure:
India is in the midst of a massive overhaul in infrastructure, with large
investments required to maintain its targeted GDP growth of 9% and above. The
strong investment and consumption demand has driven the industrial growth to
more than 10 % over last three years. The key driver of the impending growth of
the sector is the expected surge in infrastructure spending to USD 23 billion by
FY2009 from USD11billion currently. The growth should largely be driven by
power, accounting for 41% of the total investment, followed by roads, oil & gas,
and smaller sectors like ports and airports. There will drive growth in the
engineering sector.
2) Emergence of India as a manufacturing hub:

90
India is being preferred by global manufacturing companies as an outsourcing
destination due to its lower labour cost and better engineering and designing
capabilities. Exports of engineering goods and services from India have reached
about USD 20 billion in the year 2005-06 and registered a robust growth of about
25%.
3) New capacity additions:
There has been a tremendous growth in demand from domestic as well as
overseas markets and the economy is experiencing high capacity utilization
across sectors. This has triggered capacity additions across industries. This is
captured in the USD 35 billion of capacity expansion that was under
implementation as of January 20079. With approximately 50% of the capital
expenditure going into plant and machinery; it augurs well for the engineering
industry.
CHAPTER- 7
OPPORTUNITIES OF ENGINEERING SECTOR IN EGYPT
India has a well-diversified engineering goods sector that produces products
such as automobiles and auto components, capital goods / machinery and
equipment, light engineering goods.
The Index of Industrial Production (IIP) computed by the Central Statistical
Organization, Government of India shows positive growth for sectors such as
light engineering goods, metal products, machinery and transport equipments.
Increasing manufacturing activity in Indian economy, coupled with growing thrust
on development of infrastructure are prime reasons for the impressive growth
rate of this sector.
So, following companies of India have opportunities to expand their business in
Egypt through exports, turnkey contracts, merger & acquisition etc10.

91
1) BHEL
We are an integrated power plant equipment manufacturer and one of the
largest engineering and manufacturing companies in India in terms of
turnover. We were established in 1964, ushering in the indigenous Heavy
Electrical Equipment industry in India - a dream that has been more than realized
with a well-recognized track record of performance. The company has been
earning profits continuously since 1971-72 and paying dividends since 1976-77.
We are engaged in the design, engineering, manufacture, construction,
testing, commissioning and servicing of a wide range of products and services for
the core sectors of the economy, viz. Power, Transmission, Industry,
Transportation, Renewable Energy, Oil & Gas and Defence. We have 15
manufacturing divisions, two repair units, four regional offices, eight
service centres and 15 regional centres and currently operate at more than
150 project sites across India and abroad11. We place strong emphasis on
innovation and creative development of new technologies. Our research and
development (R&D) efforts are aimed not only at improving the performance and
efficiency of our existing products, but also at using state-of-the-art technologies
and processes to develop new products. This enables us to have a strong
customer orientation, to be sensitive to their needs and respond quickly to the
changes in the market.
The high level of quality & reliability of our products is due to adherence to
international standards by acquiring and adapting some of the best technologies
from leading companies in the world including General Electric Company, Alstom
SA, Siemens AG and Mitsubishi Heavy Industries Ltd., together with
technologies developed in our own R&D centres. Most of our manufacturing units
and other entities have been accredited to Quality Management Systems (ISO

92
9001:2008), Environmental Management Systems (ISO 14001:2004) and
Occupational Health & Safety Management Systems (OHSAS 18001:2007)
BHEL have a share of 62% in India's total installed generating capacity
contributing 72% (approx.) to the total power generated from utility sets
(excluding non-conventional capacity) as of March 31, 2011. The company have
been exporting power and industry segment products and services for
approximately 40 years. They have exported products and services to more than
70 countries. BHEL had cumulatively installed capacity of over 8,500 MW outside
of India in 21 countries, including Malaysia, Iraq, the UAE, Egypt and New
Zealand. Our physical exports range from turnkey projects to after sales services.
BHEL work with a vision of becoming a world-class engineering
enterprise, committed to enhancing stakeholder value.
The greatest strength is BHEL highly skilled and committed workforce of
46,748 employees. Every employee is given an equal opportunity to develop
himself and grow in his career. Continuous training and retraining, career
planning, a positive work culture and participative style of management - all these
have engendered development of a committed and motivated workforce setting
new benchmarks in terms of productivity, quality and responsiveness12.
BHEL has opportunities to expand their business with following company
of Egypt.
ENPPI
Engineering for the Petroleum & Process Industries (Enppi) was
established on January 15th, 1978 and is currently working under Egyptian
Investment Law 8 for 1997, with a capital of 220 million US Dollars. The
Egyptian General Petroleum Corporation (EGPC) is the principal shareholder
owning 97% of the total shares of Enppi.

93
Enppi provides full-integrated engineering, procurement, construction
supervision and project management services for the petroleum, petrochemicals,
power and other related industries14. Enppi is recognized as an international
engineering, EPC main contractor and management contractor, with a proven
record of accomplishments for onshore and offshore projects. To date, more
than 850 projects with over 25 million man-hours of professional services were
completed for oil and gas, refining, petrochemical and general industry projects.
The company organization is structured to provide the expertise required
for the efficient coordination of all phases of work starting from project
development studies to completed turnkey facilities.
The company applies state of the art technology and know-how based on
worldwide sources including operating companies, international engineering firms
and technology licensors. Enppi copes with international Codes and Standards
such as ASME, ANSI, API, ASTM, and IEC etc.
Turnover in the last four years ranged from 0.5 to 0.8 billion US$ with
Current backlog of 3.0 billion US$ in 2010.
Enppi has been approved for compliance to International Quality
Management Systems Standard (ISO 9001), Environmental Management
System Standard (ISO 14001) and Occupational Health & Safety Management
Systems specification (OHSAS 18001) by Lloyd's Register Quality Assurance
(LRQA-UK), in order to ensure international standard performance and maintain
its status in the international engineering community13.
http://www.aspetindia.com/img/annualreports/6.pdf
During the past 10 years, Enppi invested 200 Million US dollars at recent
Egyptian oil and gas companies in a continuous endeavor to pursue its role
toward national income growth.

94
Role
Enppi provides its specialized services in all possible contractual roles.
Typical contractual roles are:
Design and build contractor:
Main Contractor: Enppi assumes full project responsibility for engineering,
procurement, construction and project management, performing all tasks
from initial plannng studies to commissioning of turnkey facilities.
Joint Venture Partner: Enppi can enter into joint venture associations with
national and/or international firms to design and build projects on a
turnkey basis.
Professional services contractor:
Engineering Contractor: Enppi performs any combination of the following
activities: studies, basic and detailed engineering and procurement
services.
Project Management Contractor: Enppi performs Project Management,
including construction management and supervision, on behalf of the
client and manages the work of other contractors employed on the client's
project.
Subcontractor: Enppi may also participate in the execution of major
contracts as a subcontractor to international EPC contractors.
Major Projects Inside Egypt:
1. Expansion of SUMED Storage Capacity (6 Tanks) – (SUMED).
2. West Harbour Expansion Project – (PHPC).
3. Assiut / Aswan Gas Pipeline and Dahshour compression station - (EGAS).
4. Rehabilitation Project – (Gupco) .
5. Maximization of C2 & C3 – (Gasco).
6. El Nubaria / El sadat & EL sadat/ Elfayoum piplines - (GASCO).
7. South Ras Bakr Crude Treatment Station Engineering Services – (GPC) .

95
8. Polystyrene Plant - Egyptian Styrenics Production Co. - (E-Styrenics).
9. New Urea/Ammonia Plants - Consultancy Services – (KIMA).
10. Hilal Platform Project – (GUPCO).
11. Amer 8 Platform Development Project & the related Offshore & Onshore
Facilities - (GPC)15.
12. Burullus, WDDM – Phase VII Main Compression Project - (Burullus).
13. North AbuQir Gas Compression Station – (Abu Qir).
14. Denise – B Subsea Gas Development – (PTB).
15. Al- Hamra Terminal New 250,000 BBLS Storage – (Mena El Hamra).
16. El shawish field development -(Alam El shawish).
17. Kalabsha Development Project – (KPC).
18. North Idku Development Project – (SUCO).
19. New Naphtha Hydrotreating unit - (ANRPC).
20. Baltim Gas Compression – (PTB).
21. Di – Methyl Ether (DME) Project – (ECHEM).
22. Furfural Extraction Unit Revamp - (APC).
23. El-Gamil Plant Production Increase Project & Comp. Interconnections –
(Petrobel).
24. New Building for Oil & Gas Skills Company - Oil & Gas Skills Company -
(O.G.S.).
25. Rosetta Process Upgrade Project - (Rashpetco).
26. Spent lube oil treatment & storage facilities - (Petro trade).
27. Sky medical center - (HASSFEPSE).
28. Project Management Services for Egyptian Polypropylene Project –
(EPP).
29. Al- Amal Field Development – (AMAPETCO).
30. Off Shore Top Side Facilities – (AMAPETCO).
31. New Land Oil Train – Belayim Field - (PTB).
32. Construction Supervision of Petrosport Club & Accommodation at Borg El-
Arab – (Petrosport).

96
33. Petrosport Club at El-Sokhna (Petrosport).
34. New Spa Building – (Petrosport).
35. Petroleum Sector Hospital In Suez – (HSSFPSE).
36. Construction Of Substation Building Project – (KPC).
37. Sports Club At El Katamia – (Petrosport).
38. Feasibility Study For New Refinery – (EGPC).
Major Projects Outside Egypt:
1. Yanbu Export Refinery Project Tank Farm Package – SP1 – (Saudi Aramco).
2. AL Khafji Field Development Phase 1 – Alkhafji Joint Operation Company -
(KJO).
3. Yanbu Gas Plant Expansion – (Saudi Aramco).
4. Safaniya Water Disposal System Upgrade – (Saudi Aramco).
5. Fractionation Capacity Increase at Jose (ACFJ), Train V - Venezuela -
(PDVSA Gas S.A).
6. Ethane Recovery Project at San Joaquin - Venezuela - (PDVSA Gas S.A.).
7. IV Train San Joaquin Jose 250 Project - Venezuela - (PDVSA Gas S.A.).
8. Umbrella agreement,EPC of pagmi projects phase 1, - (PDVSA).
9. Basic engineering for the refrigeration & storge systems - (PDVSA).
10. Conceptual & basic engineering for prital project - (PDVSA).
11. Extraction and Compression Project – (PDVSA).
12. PAGMI Project Phase I & II Gas conditioning for Domestic Market –
(PDVSA).
13. Proposed Gas Scheme Detailed Engineering – (PDVSA).
14. Upgrade of aquaba compression station - (Fajr).
15. 126 km new booster compression station - (Fajr).
16. Additional new feeding points at SAMRA III & Qatranah Stations - (Fajr).
17. Booster compression station at KP 126 – (FAJR).
18. Extension of Jordanian Gas Pipeline - (FAJR Egyptian Jordanian Co).
19. Engineering and Design Services - (TOTAL E&P/ Deir Ezzor Petroleum Co).

97
20. Sharara Mellitah Pipeline Extension – (Agip).
21. Neem Export Pipeline – (GNPOC).
RESOURCE FACILITY
HUMAN RESOURCE
Enppi staffing level is an indication of the successful exploitation of its
personnel resources. from about 150 employees in 1980, Enppi has grown
steadily each year to its present level of about 2000 employee. To maintain a
high standard of performance, the Human Resources development Division
follows up on the career development of Enppi's personnel and arranges courses
and on-job training in local and overseas companies through specialized training
organizations in order to keep abreast with the latest technological
advancement16.
Enppi‘s personnel are organized in a Matrix Organization, which allows for
line management (vertical) to perform technical quality assurance functions along
with standard daily administrative duties; while on the project level (horizontal),
the project manager assumes the full project responsibility and duties.
Specialized ―Task Forces‖ are often formed to execute large/medium size
projects.
TRAINING CENTER & FACILITIES:
The continual training and upgrading of our personnel is a vital process,
which contributes to our success. In this respect, Human Resources
Development Division (HRD) oversees and executes tailored training and
upgrading programs for our personnel, aiming at updating and maintaining their
knowledge with the latest technological advances in engineering and other
technical/managerial areas/skills16.

98
Many of the in house training courses are offered by senior Enppi staff,
reflecting their relevant project/design experience. Other local and abroad
training courses are planned and executed by the HRD.
Specialized training courses are also offered to our customers as part of
the services provided.
In this regard, our HRD provides modern training facilities equipped with
up–to-date presentation equipment, auditorium, several lecturing rooms, a
separate local area network (LAN) and dedicated administration staff.
While in Alexandria , our Center for Engineering Development (CED)
provides local training facilities serving operating companies in the region.
INFORMATION TECHNOLOGY:
With our professional team, Hardware technology, Development tools, and
Management tools, we provide all services with minimum operating cost.
Enppi provides its specialized services in all possible contractual roles, so
BHEL can give them turnkey projects of its products & services17.
2)L&T
L&T Power offers turnkey solutions for large i.e. up to 1000 MW coal-based
power plant projects based on supercritical standards and also offers the same
capability in gas-based power plants.Similarly1, the firm has the capability of
executing balance of plant packages for both subcritical and supercritical thermal
projects on an EPC basis. It also provides power plant engineering services
through L&T Sargent & Lundy, a joint venture of L&T and Sargent & Lundy,

99
USA18 L&T has formed two joint ventures with Mitsubishi Heavy Industries,
Japan to manufacture super critical boilers and steam turbine generators. In
2008-09, significant progress was made in setting up manufacturing facilities for
super critical boilers and turbines at Hazira on India's west coast. L&T has also
signed a technical collaboration with Clyde Bergemann for electrostatic
precipitators, a crucial BOP item in coal based thermal power plants.
L&T is claimed to be among the top five fabrication companies in the world. The
Heavy engineering division manufactures and supplies custom designed and
engineered critical equipment and systems to the needs of core-sector industries
and the defense sector. It is the preferred supplier of equipment for a select
range of products, globally.
1 The UEE engineering
Workforce is divided into six specialized disciplines: process, Equipment,
Piping & Layout, Instrumentation, Electrical and Civil all working on State-Of-The-
Art IT tools during different engineering phases starting from basic engineering to
detailed engineering.
Procurement is also one of the key elements that define Uhde services,
with its long standing relations to local & international vendors.
The purchasing tools & procedures of the Uhde group guarantee cost
effective & fast procurement activities19. Also UEE accomplishes the shipping of
all kinds of equipments and materials with our port and customs clearance
services that ensure smooth delivery of imported items across the border.
L&T has a shipyard capable of constructing vessels of up to 150 metres
long and displacement of 20000 tonnes at its heavy engineering complex at
Hazira. The shipyard is geared up to take up construction of niche vessels such
as specialized Heavy lift Cargo Vessels, CNG carriers, Chemical tankers,
defense & para military vessels and other role specific vessels20.
100
Construction of specialized mid size vessels is being undertaken and
capacity is being augmented by additional infrastructure such as ship lift system
and additional outfitting workshops to extend the activities to ship repairs. The
focus will be on construction of commercial vessels, warships for the navy and
the coast guard20.
2EEC
Products and services for power engineering projects:
Steam & Gas turbines products based on own design and manufacturing of
steam turbines and heat exchangers for:
• thermal power stations e.g. coal, oil and gas fuels
• cogeneration units using extraction and backpressure steam turbines
• nuclear power plants
• combined cycle power plant (steam & gas)
L&T offers all critical equipment and systems for refineries and gas cracker
plants. The range includes high pressure, high temperature reactors like
hydrocrackers, DHDT & DHDS reactors for ‗clean fuel‘ projects, and other critical
equipment22. These are manufactured in various grades of low alloy steels
(including Cr–Mo-Vanadium) of clad or overlaid construction. L&T has the
qualifications and vast experience in carrying out single-layer and double-layer
overlay of equipment using ESSC (ESW) and SAW processes. Reactor internals
are generally fabricated in-house and also assembled in reactors as per
customer requirements.
L&T is a licensee of ABB Lummus Heat Transfer NV, USA, for
helixchangers and also licensee of Exxon Mobil Research Engineering
(EMRE) for anti-vibration baffles for heat exchangers (dimpled baffle)
technology.

101
L&T offers all critical equipment and systems for oil & gas projects.
Having successfully executed orders for large tubular reactors (1500 MT),
L&T is geared and qualified to take up the challenge of manufacturing the
futuristic gas-to-liquid reactors for the oil & gas sector, in addition to
traditional products such as test and production separators (separate or
skid-mounted)21.
L&T manufactures and supplies key Coal Gasification Equipment -- coal
gasifiers and syngas coolers -- under a technical tie-up with Shell Global
Solutions, The Netherlands. These find application in power plants and a
wide variety of process plants such as ammonia, methanol and wherever
synthesis gas is required. For coal gasification projects, HED will supply
and integrate outer pressure vessel with internal Gasifier & Syngas
cooler components, carry out hydro testing, apply refractory, assist in
erection of equipment on to the structure at site and weld (in-situ) golden
seams21.
L&T offers complete condensing and feed heating systems (thermal power plant).
3 Tiba Engineering & Trading Egypt
Some sister companies working very closely together specialized in supplying
very reasonable quality/price ratio products for the industrial field in Egypt
especially in the pharmaceutical, food, chemical, petrochemical, engineering and
other industries. According to the governmental directions they had a booming
market for environmental engineering services and products, so, now they have
many projects that need supplies and services similar to the scope of services
and supply, so, they are interested in discussing cooperation possibilities with the
organization on exclusive agency basis in the Egyptian market as a first step.
L&T is an international manufacturer of a wide range of electrical and electronic
products and systems. L&T also manufactures custom-engineered switchboards
for industrial sectors like power, refineries, petrochemicals and cement.In the

102
electronic segment, L&T offers a range of meters and provides control and
automation systems for industries. Medical equipment and systems
manufactured by L&T include advanced ultrasound scanners and patient
monitoring systems, ESUs, Syringe pumps, Defibrillators, Ventilators, Anesthesia
machines.
4Eg Oil Purification & Oil Recycling Plant ... Egypt
They oil purification equipment series are extensively used in the fields of
electric power, petroleum, natural gas, mechanical manufacture, steel,
metallurgy, railway, aviation, etc. which consume lubrication oil. There principal
products haser more than 100 kinds of products in 7 series and can meet
different needs of customers.
L&T offers all critical equipment and systems for oil & gas projects.
5Elfath Company Egypt
They are importers of Japanese used forklifts, farming tractors, diesel engines,
water pumps and generators, welding transmeter. They have a good experience
of used Japanese items also. They are looking for a continuous supplier to the
Egyptian market- They have the facilities to Re-export to the neighbour African
and Arabic countries.
L&T offers balance of plant in the turbine island (other than turbine generator)
which includes equipment like :
Circular Surface Condensers
Rectangular Surface Condensers
HP Feed Water Heaters
LP Feed Water Heaters
Deaerators
The equipment are interconnected with high pressure piping, valves,
instruments, controls & auxiliary sub-system. Heavy Engineering Division also

103
manufactures turbo generator components like LP Hoods & Casing and Stator
Frames for large steam turbines & turbo generator components for hydro
turbines23.
6Master Engineering Industry Egypt
Master engineering industry head office Cairo -products; planning, fabrication,
supply, installation, commissioning and maintenance for commercial kitchen
equipment (hotels, resorts, hospitals, bakery, pastry)
7Marine Tech Egypt
They are the international group for marine services & commercial
agencies they are the agent for a Turkish cables company, also they represent
wartsila company dor generators & engines , and the American company NLB
the leader in high pressure water jet technology , & finally they have a marine
shipyard in India for shipbuilding.
L&T has a shipyard capable of constructing vessels of up to 150 metres
long and displacement of 20000 tonnes at its heavy engineering complex at
Hazira.
8International Crane Factory Egypt
The company has global manufacturing and marketing of cranes and
equipment that give you all sorts of overhead cranes : Overhead cranes, Gantry
crane (Single girder, Monorail, and double girder) & Jib crane and the
international company to manufacture cranes ICF of the few institutions that have
the precedent of the huge.
Elecon help to have continuous flow of orders and enquiries, which in turn
helps the Company t0 grow in the volatile economic situation. The Government
of India (GOI) has lot to do for development of infrastructure. Material Handling
Equipment industry is catering to the growing and rapidly changing needs of the
core industries such as Coal, Cement, Power, Port, Mining, Fertilizers and steel

104
plants. Due to various stimulus packages of GOI and global recovery, all these
sectors are back on track of growth.
With huge opportunity starting to go under way in the key industry like
steel, power & ports etc., the material handling equipment (MHE) industry stands
to gain immensely from capacity addition. Elecon has strong all around
capabilities, experience & diversified skills in MHE for most industry verticals like
power, steel, minerals & ports. Armed with engineering prowess and strong skills
coupled with diversified knowledge and ability to develop products and solution.
L&T has expanded its focus to the Middle East, South East Asia, Russia,
CIS, Mauritius, African and SAARC countries. It also has keen interest in the
markets of Indian Ocean rim countries, Africa and Latin America.Heavy
Engineering Division has contributed significantly to the growth of the Fertiliser
industry in India and abroad. The division has supplied critical Equipment for
over 50 Ammonia and Urea projects.
With the huge host of investment opportunities available, Projects include
roads, railways, sanitation and water stations, integrated development projects
along Upper Egypt-Red Sea Road, specialized economic zones in North West
Suez Gulf.
Egypt ranked first among North African countries and second in the
African Continent as an attractor of FDI, according to the World Investment
Report 2010 by the United Nations Conference on Trade and Development
(UNCTAD). So, the FDI is also a good opportunity for us.
The India-Egypt bilateral Trade Agreement has been in operation since
March 1978 and is based on the MFN clause24. India was the 4th largest trading
partner of Egypt in 2007. Machinery, Instruments, Metals & Metal Products,
Electrical Products, Automobiles & Components have been the major
engineering products being exported at present to Egypt. India‘s engineering

105
exports rose from US$10 million in 1956-57 to US$40 billion in 2008-0925. It is
the largest segment of Indian industry with approximately 30% share of total
investment,63% of all foreign collaborations take place in this sector.
Furthermore, the engineering sector in India accounts for approximately 19% of
India‘s total exports. It is the largest foreign exchange earner for India. So the
export of the goods of our engineering products is also a good opportunity & a
good idea.
INDEE is being organized at the most opportune time for India and Egypt.
Through this, exhibition of engineering products of both the countries have done.
Thus, all the above activities like FDI, export & joint venture can be done
by us with the Egypt. And there are some intermediaries company who helps in
selling our products in their country as well as in their continent.
3) ELECON
Established in 1951, Elecon Engineering Co. Ltd, India, pioneered breakthrough
innovations in the manufacture of material handling equipment, industrial Geared
Motors (Products of PBL) and reducers, mining equipment, casting processes
etc. Elecon is one of the largest manufacturers of MHE and Industrial gears in
Asia. Elecon's recent acquisition of Benzlers - Radicon Group of businesses from
David Brown Gear Systems Group adds to the expertise in manufacturing
customized gearboxes for Steel Mills, High speed Turbines, satellites for Indian
space Research Programme26.
During the span of 6 decades, Elecon has encompassed all the major core
sectors through its supplies of highly sophisticated equipment bearing ample
testimony of the symbolic mark of Elecon's unbeatable technology. Elecon has
thus with its marketing network and execution capabilities, made its presence felt
through consistent and satisfactory performance of its equipment and successful
delivery of projects in core sectors as fertilizer, cement, coal, power generation,
mining, chemical, steel, port mechanization, minerals & metals processing, etc26.

106
Elecon has expanded its skills and expertise to execute EPC contracts and has
successfully executed several EPC projects in India. Elecon has transformed into
a fully integrated EPC company in areas of its specialization26.
New Advancements
Pipe conveyors
With the ever increasing use of pipe conveyors as an acceptable form of bulk
solids transportation, especially when environmental, operating and maintenance
costs are of primary importance, has come the added advantage, of suppliers
breaking new ground in the innovation stakes26.
With our collaboration with CKIT, one of the leading engineering services
company for providing conveying solutions, we are now executing a 7.5 kms
Cross country pipe conveyor project for Manikgarh cements and a complex
downhill conveyor project for NMDC.
High Speed Rollers:
Elecon is a pioneer in developing the technology to manufacture high speed
rollers in house. Our roller shop is equipped to produce 30,000 rollers/ month in
total and 12,000 high speed rollers/month in specific26. Elecon is already
supplying High speed rollers up to belt speeds of 7.5 m/s to its clients.
Yard Management and Manless machines:
Elecon with its partners have developed the capability of automated stockyard
systems and unmanned yard equipments. We have the capability to undertake
specialized projects of stockyard management with our built-in capability to
provide Monitoring of stock pile equipment, programming of stacking and
reclaiming, monitoring Chain, particular solutions for stacker reclaimer (depth of
cut control), on line intelligent health monitoring & predictive maintenance
management system for mechanical, structural, electrical, instrument, machines
parameter sub systems27.

107
OPPORTUNITY IN EGYPT
This is helping the Company to have continuous flow of orders and enquiries,
which in turn helps the Company t0 grow in the volatile economic situation. The
Government of India (GOI) has lot to do for development of infrastructure.
Material Handling Equipment industry is catering to the growing and rapidly
changing needs of the core industries such as Coal, Cement, Power, Port,
Mining, Fertilizers and steel plants. Due to various stimulus packages of GOI and
global recovery, all these sectors are back on track of growth. However, delay in
execution and poor execution of projects hampers the development of the
economy and these sectors of any subsequent developments, information or
events.
With revival in demand, increased availability of finance through both debt and
equity route and improved business confidence, these deferred capex plans will
gain traction and materialize, which in turn will result in resumption of various
projects by our big clients.
With huge opportunity starting to go under way in the key industry like steel,
power & ports etc., the material handling equipment (MHE) industry stands to
gain immensely from capacity addition. Elecon has strong all around capabilities,
experience & diversified skills in MHE for most industry verticals like power, steel,
minerals & ports. Armed with engineering prowess and strong skills coupled with
diversified knowledge and ability to develop products and solution
CONCLUSION

108
Elecon help to have continuous flow of orders and enquiries, which in turn helps
the Company t0 grow in the volatile economic situation. The Government of India
(GOI) has lot to do for development of infrastructure. Material Handling
Equipment industry is catering to the growing and rapidly changing needs of the
core industries such as Coal, Cement, Power, Port, Mining, Fertilizers and steel
plants. Due to various stimulus packages of GOI and global recovery, all these
sectors are back on track of growth.
With huge opportunity starting to go under way in the key industry like steel,
power & ports etc., the material handling equipment (MHE) industry stands to
gain immensely from capacity addition. Elecon has strong all around capabilities,
experience & diversified skills in MHE for most industry verticals like power, steel,
minerals & ports. Armed with engineering prowess and strong skills coupled with
diversified knowledge and ability to develop products and solution.
L&T has expanded its focus to the Middle East, South East Asia, Russia, CIS,
Mauritius, African and SAARC countries. It also has keen interest in the markets
of Indian Ocean rim countries, Africa and Latin America.Heavy Engineering
Division has contributed significantly to the growth of the Fertiliser industry in
India and abroad. The division has supplied critical Equipment for over 50
Ammonia and Urea projects.
With the huge host of investment opportunities available, Projects include roads,
railways, sanitation and water stations, integrated development projects along
Upper Egypt-Red Sea Road, specialized economic zones in North West Suez
Gulf.
Egypt ranked first among North African countries and second in the African
Continent as an attractor of FDI, according to the World Investment Report 2010
by the United Nations Conference on Trade and Development (UNCTAD). So,
the FDI is also a good opportunity for us.

109
The India-Egypt bilateral Trade Agreement has been in operation since March
1978 and is based on the MFN clause. India was the 4th largest trading partner
of Egypt in 2007. Machinery, Instruments, Metals & Metal Products,
Electrical Products, Automobiles & Components have been the major
engineering products being exported at present to Egypt. India‘s engineering
exports rose from US$10 million in 1956-57 to US$40 billion in 2008-09. It is the
largest segment of Indian industry with approximately 30% share of total
investment,63% of all foreign collaborations take place in this sector.
Furthermore, the engineering sector in India accounts for approximately 19% of
India‘s total exports. It is the largest foreign exchange earner for India. So the
export of the goods of our engineering products is also a good opportunity & a
good idea.
INDEE is being organized at the most opportune time for India and Egypt.
Through this, exhibition of engineering products of both the countries have done.
hus, all the above activities like FDI, export & joint venture can be done by us
with the Egypt. And there are some intermediaries company who helps in selling
our products in their country as well as in their continent.
Enppi provides its specialized services in all possible contractual roles, so BHEL
can give them turnkey projects of its products & services.
OPPORTUNITY FOR INDIAN ENGINEERING INDUSTRY TO STRART A
BUSINESS IN EGYPT
[Table-8]
COMPANIES PRODUCTS MODE OF OPRETION
refineries and gas cracker plants
Turnkey solutions
oil & gas projects Licensing agreements
electrical and electronic products and systems
Strategic alliances

110
L&T turbine island (other than turbine generator)
Circular Surface Condensers
Rectangular Surface Condensers
HP Feed Water Heaters
LP Feed Water Heaters
Deaerators
Management contracts
ELECON Coal, Cement, Power, Port, Mining, Fertilizers and steel plants
Mergers & acquisitions
BHEL power, steel, minerals & ports
turnkey projects
Suggestion:
India is having good opportunities In the engineering sector goods like power,
mining, fertilizer, port so India can get can opportunities by various projects like
management contract & turnkey contract with Egyptian companies like ENPPI.
BHEL is one of the largest engineering and manufacturing companies in India in
terms of turnover and they also operate many project sites more than 150 in
abroad & Egypt. We suggest the BHEL Company to establish their business in
EGYPT for engineering, procurement, construction supervision and project
management services for the petroleum, petrochemicals, power.
L&T has done many turnkey project and it is successful for achieve growth by
that project in abroad country there are various company in the Egypt we can get
this opportunities by establishing the L&T service & doing the business with
various Egypt company
For expanding the business of Egypt in the engineering sector in product such as
Coal, Cement, Power, Port, Mining, Fertilizers and steel plants ELECON are
providing that opportunities to Egypt company like UEE engineering,EEC, Elfath
Company Egypt.

111
References:
1. http://www.imc-egypt.org/secengineering.asp
2. http://www.komintl.com/pub/eng/wpapers/reprints/GD_PC_Perishables.pdf
3. http://www.eeceg.org/WebPages/Common/ContentPage.aspx?sec=1&CNa
me=about_prevchairman
4. http://smallenterpriseindia.com/index.php?option=com_content&view=cate
gory&layout=blog&id=75&Itemid=59&limitstart=12
5. http://indiamanufacturingshow.com/industrial_engineering.html
6. http://epaper.timesofindia.com/index.asp
7. http://www.dnb.co.in/Engineering/overview.asp
8. http://www.cci.in/pdf/surveys_reports/indias_engineering_sector.pdf
9. http://www.ice.it/paesi/asia/india/upload/182/Engineering%20Sector.pdf
10. http://marketingteacher.com/lesson-store/lesson-international-modes-of-
entry.html
11. http://www.bhel.com/about.php
12. news.oneindia.in/2011/04/04/bhel-announces-flash-results-aid0143.html
13. http://www.aspetindia.com/img/annualreports/6.pdf/ http://www.oil-offshore-
marine.com/show_cv.php?id=94324
14. http://www.epcengineer.com/directory/company/9439/enppi
15. http://www.oas.org/dsd/Documents/1OperReportWEB.pdf
16. http://www.enppi.com/humanresources.html
17. http://www.coursehost.com/pages/index.asp
18. http://companydatabase.org/c/services-engineering-services/engineers-
nuclear/quality-services/electric-power/plant-maintenanc
19. . http://www.epa.gov/epp/tools/index.htm
20. content.yudu.com/Library/A1t3k9/SpecialReportStockAn/resources/content
/9.swf
21. http://www.larsentoubro.com/lntcorporate/LnT_Offerings/Offering.aspx?res=P_
CORP_BOFF_CEPS_BONG&sbu=67

112
22. http://www.latex-project.org/
23. http://trade.indiamart.com/details.mp?offer=2549360033
24. http://www.roperwhitney.com/
25. http://books.google.co.vi/books?id=9aKj-
8P2LCgC&pg=PA80&lpg=PA80&dq="Machinery,+Instruments,+Metals&source=bl
&ots
26. http://www.elecon.com/page.php?level1_id=33
27. http://www.mining-reporter.de/downloads/mining-reporter-online-1-2009.pdf

113
Construction Sector
TABLE OF CONTENTS
PART-II INDUSTRY/ SECTOR/ COMPANY/ PRODUCT/ SERVICE
SPECIFIC STUDY
Sr. No.
Particulars Page No.
2 2.1 Introduction of the Indian Construction industry
2.2 Introduction of the Egyptian construction industry
2.3 Tax rate in Egypt
2.4 Structure and business activities
3 3.1 Comparative study of construction Industry
4 4.1 Policies & Norms of Indian country
4.2 Policies & Norms of Egyptian country
4.3 Present Trade barriers for import/ export
5 5.1 Potential for import / export in India / Gujarat Market
5.2 Business Opportunities in future
Conclusion
Bibliography

114
2.1 INTRODUCTION OF THE INDIAN CONSTRUCTION INDUSTRY
Introduction
The indian construction industry consist of various sector within itself. One core
sector of Indian industry is now passing through a stage of boom. The details of
each segment of industry is as under.Today, India is the second fastest growing
economy in the world. The Indianconstruction industry is an integral part of the
economy and a conduit for a substantialpart of its development investment, is
poised for growth on account of industrialization,urbanization, economic
development and people's rising expectations for improvedquality of living.
Industry Segments
REAL ESTATE
• Residential (Housing & Development)
• Industrial (Industrial Parks, Factories, Plants, etc.)
• Corporate (Office, Research Centres)
• Commercial (Retail: Malls, Shops, Showrooms; Hotels; etc. )
INFRASTRUCTURE
• Roads
• Railways
• Urban infrastructure (improved housing, water supply and sanitation,
schools, universities, health and security, etc.)
• Ports
• Airports
• Power
INDIAN REAL ESTATE SECTOR
Growing at a scorching 30 per cent, it has emerged as one of the most appealing
investment areas for domestic as well as foreign investors. The second largest

115
employing sector in India (including construction and facilities management), real
estate is linked to about 250 ancillary industries like cement, brick and steel
through backward and forward linkages. Simultaneously, the rapid growth of the
Indian economy has had a effect on demand for commercial property to help
meet the needs of business, such as modern offices, warehouses, hotels and
retail shopping centres.
INFRASTRUCTURE
Power
• Power generation capacity of 122 GW; 590 bn units produced (1 unit
=1kwh),
Compound Annual Growth Rate of 4.6% over the last four years
• India has the fifth largest electricity generation capacity in the world
Roads
• An extensive road network of 3.3 m km – the second largest in the world
• The Golden Quadrilateral (GQ-5846 km of 4 lane highways) North-South
& East
West Corridors (NSEW-7300 km of 4 lane highways)
Railways
• The premier transport organisation of the country - the largest rail
network in
Asia and the world‘s second largest
• 7566 locomotives, 37,840 Coaching vehicles, 222,147 Freight wagons,
6853
Stations, 300 Yards, 2300 Goodsheds, 700 Repair shops, 1.54 m Work
force
Ports
• 12 Major Ports and 185 Minor Ports along 7,517 km long Indian coastline
• 100% FDI under the automatic route is permitted for port development
projects

116
• Public–Private partnership is seen by the Government as the key to
improve
Major and Minor ports equipment.
India's booming infrastructure sector is fuelling demand for all kinds of
construction
Before the opening up of the Indian economy, and the entry of international
majors, much of infrastructure development and construction in the real estate
sectorwise done manually. But with the infrastructure and construction sectors
undergoing dramatic changes – with 60-storeyed sky-scrapers being built in
cities like Mumbai, and thousands of kilometers of expressways and highways
being laid across the subcontinent - builders and contractors are acquiring
sophisticated equipment to execute the multi-million-dollar projects.
2.2 INTRODUCTION OF THE EGYPTIAN CONSTRUCTION
INDUSTRY
Introduction
The construction sector is a major contributor to the Egyptian economy and one
of its fastest-growing sectors. This growth, estimated at an average of 20 to 22
percent annually since the 1980s, is fueled by the ever-increasing demand for
housing and by the state's large infrastructure projects. Most of the material
required for the construction sector is produced locally. The construction industry
is expected to continue its upward trend in the coming years as a result of
continued government and private business expenditure, anticipated to reach 20
billion Egyptian pounds annually.
Egyptian Construction Market
Market Overview

117
Spending in the construction sector will increase at a CAGR of 3.9%, from
US$5 billion to US$7.3 billion during 2005-15. Increasing foreign direct
investment (FDI) coupled with various government-initiated development
programs, such as healthcare development, will boost the economic
development of the country, which will drive the growth in this sector.
Spending on residential construction will increase from US$443 million in
2005 to US$606 million in 2015 at a CAGR of 3.2%, owing to such factors
as increased disposable income, the development of new residential
regions, such as villages, and the formulation of government policies to
develop the housing finance system during 2005-15.
Spending in the nonresidential construction sector will grow at a CAGR of
4%, from US$4.6 billion in 2005 to US$6.7 billion in 2015. Government
policies to encourage private investment in business as well as
infrastructure development will encourage expenditure in this sector.
Egypt is a high-risk country as its one-year risk score is above the world
average and five-year risk score is comparable with the world average
score. High bureaucracy and corruption levels, low income, rising
unemployment, and continued security threats have increased the country
risk.
Construction Growth in Egypt

118
2.3 Tax rate in Egypt
The standard rate of corporate income tax is 40%. The rate is 32% on profits
arising from export operations and on profits of an industrial company as long as
they arise from its industrial activities. Egypt's Ministry of Trade and Industry has
announce the imposition of a 10 percent import duty on cold rolled coil, galvanized
steel and pre-painted galvanized steel, with the aim of stabilizing the local market
price following recent influx of cheap imports. Thus this decision can prove costly
for the foreign players in Egypt to Import construction related equipment in Egypt
Withholding Tax
Any business operating in Egypt must withhold against any payments-- made to

119
any contractor or supplier of goods or services-- the following basic percentages:
Contracting and supplying: 1%
Services: 3%
Commissions: 10%
Professional fees (under LE 500): 10%
Professional fees (over LE 500): 15%
Leasing of property or selling of goods for trading or manufacturing: 1% - 5% (to
be added on the payee's tax liability account.
Corporate Tax Exemptions and Deductions
Profits of companies located in the free zones.
Capital gains are applicable in some cases of asset replacement.
All tax holidays granted under Investment Law No.8/1997.
For joint stock companies listed in the stock market, a deductible allowance is made that is equal to interest income, which can be earned on a bank deposit (currently 10.5 percent).
2.4 STRUCTURE OF CONSTRUCTION SECTOR
INDIA
Real Estate
Residential (Housing & Development)
Industrial (Industrial Parks, Factories, Plants, etc.)
Corporate (Office, Research Centers)
Commercial (Retail: Malls, Shops, Showrooms; Hotels; etc. )
Infrastructure
Roads

120
Railways
Urban infrastructure (improved housing, water supply and sanitation,
schools,
Universities, health and security etc….
Ports
Airports
Power
EGYPT
Residential
Nonresidential
Infrastructure
Structures
3.1 COMPARATIVE STUDY
LARSEN AND TURBO (INDIA)
Construction
ECC – the Engineering Construction & Contracts Division of L&T is India‘s
largest construction organization. Many of the country‘s prized landmarks – its
exquisite buildings, tallest structures, largest industrial projects, longest flyovers,
highest viaducts, longest pipelines … have all been built by L&T. L&T‘s leading
edge capabilities cover every discipline of construction – civil, mechanical, and

121
electrical and instrumentation. L&T has also expanded its focus to the Middle
East, South East Asia, Russia, CIS, Mauritius, African and SAARC countries.
L&T is also developing markets for its construction services in the Indian Ocean
rim countries, Africa and Latin America. India is set to see a massive
infrastructure capex cycle over the next decade as the existing infrastructure fails
to support India‘s massive population.$500 Billion is expected to be spent in
India‘s next 5 year plan with expenditure concentrated on roads, railways ports,
water power, transportation etc. Capital Goods, Construction and Real Estate
Companies will benefit hugely from this capex cycle.
Data analysis
SUMMARY FINANCIAL INFORMATION
STATEMENT OF ASSETS AND LIABILITIES (UNCONSOLIDATED)
Rs. Lakhs
Particulars Schedule As at 31st March,
2009 2008 2007 2006 2005
A Fixed Assets 5 24,192.88 40,135.71 37,106.68 22,319.49 15,101.45
B Investments 6 702.36 3,666.78 4,571.91 1,161.12 6,234.93
Current Assets,

122
Loans and
C Advances 7
Stock-on-Hire - 16.04 108.43 756.98 2,618.08
Cash and Bank
Balances 6,975.85 2,934.78 2,985.54 3,177.90 1,683.65
Loans and Advances 499,827.05 453,968.98 258,193.94 114,366.13 65,689.67
Sundry Debtors 17,906.07 11,206.81 5,946.76 2,229.96 973.83
Other Current Assets 3,312.25 2,136.83 760.27 32.71 25.68
528,021.22 470,263.44 267,994.94 120,563.68 70,990.91
Liabilities and
D Provisions
Secured Loans 3 248,358.09 232,424.08 120,927.89 57,870.31 27,721.53
Unsecured Loans 4 196,750.27 171,877.09 133,503.99 55,184.97 44,207.01
Current Liabilities
and Provisions 8 20,173.19 35,077.86 17,470.15 9,478.96 7,002.15
465,281.55 439,379.03 271,902.03 122,534.24 78,930.69
Deferred Tax
E Asset/(Liability) (3,089.10) (2,524.10) - - -
F Net Worth 84,545.81 72,162.80 37,771.50 21,510.05 13,396.60
G Represented by
1. Share Capital 1 18,669.15 18,669.15 12,419.15 9,919.15 8,669.15
2. Share Application
Money 2,500.00 - - - -
3. Reserves and
Surplus 2 63,376.66 53,493.65 25,352.35 11,590.90 4,727.45
Net Worth 84,545.81 72,162.80 37,771.50 21,510.05 13,396.60

123
STATEMENT OF PROFITS AND LOSSES (UNCONSOLIDATED)
Rs. Lakhs
Particulars Schedule For the year ended 31st March,
2009 2008 2007 2006 2005
Income
Income from Operations 9 83,027.67 60,606.19 27,537.59 14,905.60 11,004.79
Total 83,027.67 60,606.19 27,537.59 14,905.60 11,004.79
Expenditure
Employee cost 10 3,189.02 1,865.27 847.27 520.19 355.86
Administration and other
expenses 11 8,241.55 3,612.54 2,087.22 1,077.89 1,982.34
Interest & Other Finance Charges 12 51,370.36 33,634.08 13,559.46 7,081.33 4,710.50
Depreciation and Amortisation 5,690.63 5,359.10 3,321.58 1,941.41 1,344.90
Total 68,491.56 44,470.99 19,815.53 10,620.82 8,393.60
Net Profit before taxes and

124
extra-ordinary items 14,536.11 16,135.20 7,722.06 4,284.78 2,611.19
Current Tax (including wealth
tax) 4,031.00 4,183.00 1,434.00 754.00 208.00
Deferred Tax 565.00 414.00 - - -
Fringe Benefit Tax 57.10 36.80 26.61 17.32 -
Net Profit before extra-
ordinary items 9,883.01 11,501.40 6,261.45 3,513.46 2,403.19
Extra-ordinary items - - - - -
Net Profit after extra-ordinary
items 9,883.01 11,501.40 6,261.45 3,513.46 2,403.19
ZAMIL STEEL INDUSTRIES (EGYPT)
Zamil Steel established in 1977 in Dammam, Saudi Arabia, specializes in the
design, manufacture and supply of pre-engineered steel buildings. Since its
inception, Zamil Steel has supplied more than 50,000 buildings to over 90
countries worldwide,
In addition, the company engages in the manufacture, site construction, and
heavy lift/shut-down and maintenance of pressure vessels, oil/gas separator
furnace, heat-exchangers, desalters, fired heaters, air-cooled heat-exchangers,
skid mounted module, desalination evaporators, columns, and storage-tanks.
Further, it designs, fabricates, galvanizes, and tests power transmission line
towers, radio and telecommunication towers, radar towers, roof top towers, wall
mount towers, substation structures, railway electrification structures, and other
type of lattice steel structures.
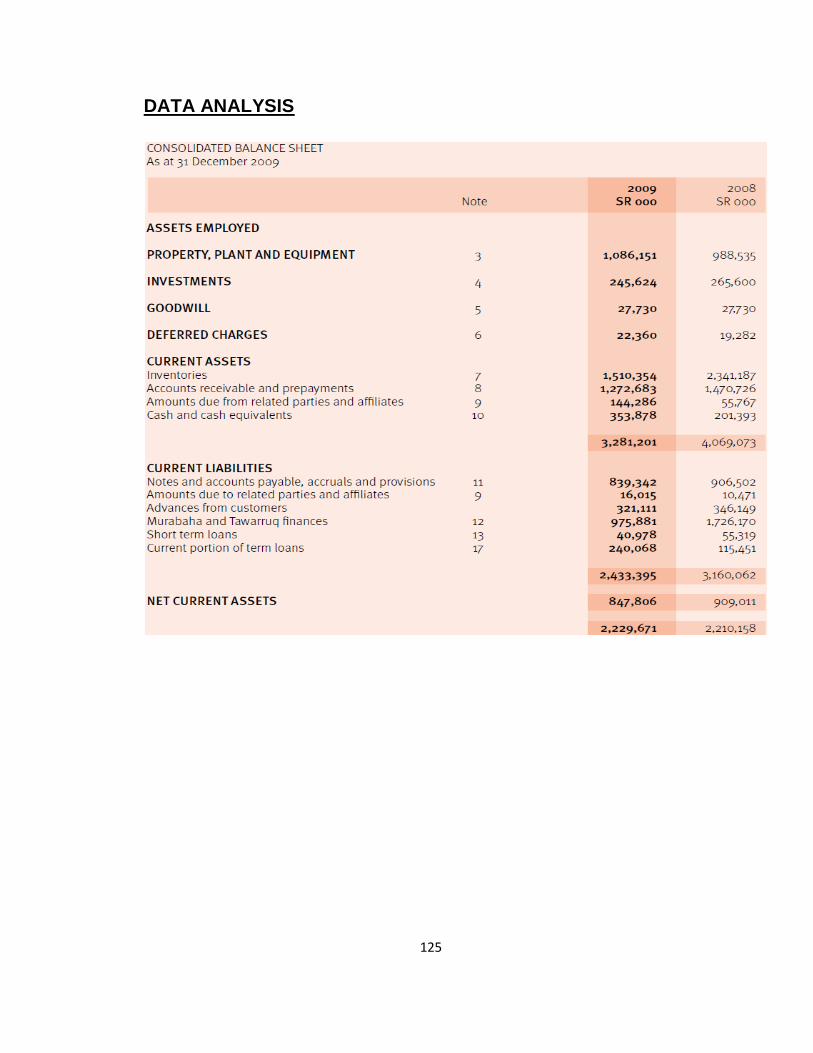
125
DATA ANALYSIS

126

127
4.1 POLICIES AND NORMS FOR CONSTRUCTION SECTOR IN
INDIA
The Planning Commission, Government of India along with the Construction
Industry has set up Construction Industry Development Council (CIDC) to
initiate activities for the development of the Indian Construction Industry.
CIDC Function are:
Standardizing contract conditions for Domestic Bidding Documents. Diploma programmer in Civil and Electrical & Mechanical Engineering -
for Army Jawans.
Vocational & job-oriented training for the secondary level students.
Setting up Arbitration & Dispute Resolution Centre for construction contracts (for details see www.ciac.in).
Issues related to financing in Construction Industry. Development & implementation of Grading of construction entities. Networking with National and International construction bodies. Establishing a Construction Equipment Bank. Insurance products for construction projects. Development of Harmonized Eligibility Criteria for Lending to
Construction Entities.
Human Resource Development
On-the-job training, minimum loss of earning.
Conveniently packaged programmed and credit system.
Uniform syllabi and standards of competence as per construction
industry requirements.
Modern ―delivery technology ―being designed by IGNOU.
Objective testing by a Board which includes practicing
professionals as well as trainers / educators.
Training and Testing logistics provided by existing institutions /
industry. They may become regional Constituent Institutions (CIs)
or their Partner Institutions (PIs) under the scheme.
Employers are persuaded to meet the testing and certification
expenses and also assures increments and/or promotion to

128
certified tradesmen. They can also use them as instructors or
demonstrators for improving the skills of other tradesmen of the
same category who work alongside.
4.2 POLICIES AND NORMS FOR CONSTRUCTION SECTOR IN
EGYPT
INVESTMENT PATTERN
There are two ways of investing in Egypt within the scope of Law No. 230:
1. Inland investment
2. Offshore investment in one of the free zones
INLAND INVESTMENT
The following tax incentives are granted to inland projects under Law No. 230:
Profits are exempt from corporate income tax or tax on commercial and industrial
profits for five years from the first fiscal year following the commencement of
production or project activities. Distributions of profit to shareholders are also
exempt from all Egyptian taxes for the same five year period. The exemption
period may be extended to ten years on the recommendation of the GAFFI and
approval of the Council of Ministers. An exemption period of ten years is
available for the following projects: reconstruction, establishment of new cities
and industrial zones outside the agricultural area and the perimeters of existing
cities, and land reclamation.
This exemption period can be extended to fifteen years at the discretion of the
Council of Ministers. A further extension of two years is accorded to projects with
a high proportion of locally manufactured plant or equipment.
After the expiration of the exemption period, distributions of profit to any

129
individual shareholder are exempt from the general income tax on amounts up to
20% of the nominal value of an individual 's original contribution to share capital.
Shares in the project are exempt from the annual proportional stamp duty for five
years following the first date on which this duty is legally due.
Foreign expatriate employees are exempt from the general income tax on their
wages, salaries, bonuses, and other remuneration paid by projects approved
under Law N0.230 This exemption does not extend however to the tax on
salaries and wages.
Imported capital assets, construction materials, and components required to
establish an approved project are subject to import duty at a low flat rate of 5% of
the cost, insurance, and freight value. Approved projects are eligible for deferred
payment of the duty or payments by instalments
Offshore investment in one of the free zones
The following tax incentives are available to free zones projects under Law N0.
230:
-No tax is levied on free zone projects or on dividends paid out of the profits of
such projects. This exemption has no time limit. Such projects are subject to a
1% annual duty on the value of goods entering or leaving the zone for the
account of the project(excluding transit goods) A project whose main activities do
not involve the entry or departure of goods from the zone is subject to a 1% fee
on the annual turnover of the project.
Expatriate employees are exempt from general income tax on their wages,
salaries, bonuses, and so forth from free zone projects.
Arab and foreign funds invested in the free zones are exempt from
inheritance tax and death duty.

130
No custom duties are levied on goods entering free zones from abroad or
other free zones, including capital equipment necessary for the free zone
activity.
Under Law No. 59, a company that locates in a new town and whose
activities are confined to that location is eligible for the following tax
incentives:
Profits are exempt from corporate income tax for ten years, starting from
the first fiscal year following the year in which production commenced.
Dividends paid to the company's shareholders are tax free in their hands
over the same period.
A ten-year exemption is granted from all property and property-related
taxes. The exemption starts when construction of the company's premises
is complete and the premises are being used for their intended purpose.
Imported machinery and equipment and construction materials that are
required to establish a factory or similar premises are subject to an import
duty of 5%
Quality Assurance Practices
Revisions of structural designs by selected independent official consulting offices
prior to issuing building permits and insurance is compulsory, to ensure
adherence with building codes. In addition, periodical inspections of construction
works are carried out thereafter. Testing concrete materials before and after
mixing is required to check appropriateness and concrete strength.
Design Practices
The Egyptian Code of Practice (ECP) for design and execution of concrete
structures was established more than 75 years ago. The ECP is updated
periodically, and the content is influenced by the ACI, Euro-Code, and British
standards. The ECP is appropriately modified to accommodate the effects of
131
local environmental conditions and to take into account Egyptian design
practices.
Construction Practices
Reinforced concrete skeleton structures of the beam and slab type with brick in-
fills (concrete, masonry) are the common building systems in Egypt. Flat slabs
are generally used in nonresidential buildings. Brick (masonry, concrete,
limestone) wall load-bearing elements are sometimes used for low-rise one or
two floor buildings. Concrete is generally placed on site mechanically in common
projects, but in recent years the use of ready mix concrete and concrete pumps
for placement has increased steadily.
4.3 EGYPT TRADE BARRIERS
49 percent limit on foreign equity in construction and transport
services
In Telecom sector larger contributions of foreign equity may be
permitted, such as when the Ministry of Communication and
Information Technology determines that such services are an
integral part of a larger business model and will benefit the country
Egypt restricts companies from employing non-nationals for more
than 10 percent of their workforce
Telecom Egypt continues to hold a de facto monopoly since
additional fixed-line licenses have not been issued by the National
Telecommunications Regulatory Authority (NTRA)
Under Egyptian competition law, a company holding 25 percent or
more market share of a given sector may be subject to investigation
if suspected of certain illegal or unfair market practices.

132
Import Policies
In recent years, the government of Egypt has gradually liberalized its trade
regime and economic policies, although the reform process has been slow
and uneven. Challenges to opening Egypt’s markets remain, including
a need to reduce corruption, reform the cumbersome bureaucracy,
implement a fully transparent regulatory regime, and eliminate sanitary
and safety standards that do not appear to be based on science.
Customs Procedures
In 2004, the Ministry of Finance committed to a comprehensive reform of
Egypt‟s customs administration and is reorganizing the Customs Authority
to meet international standards. Modern customs centers are being
established at major ports to test new procedures, such as risk
management, and new information technology systems are being
implemented to facilitate communications among ports and airports.
These systems were to become fully operational in 2009, but
implementation remains delayed.
INDIA TRADE BARRIER
Tariffs and other Charges on Imports
In order to boost the local manufacturing sector, the general rate of
central excise duty for domestic products (CENVAT) and "additional

133
duty" for imported goods was reduced to 14 percent from 16
percent for most items.
In December 2008, the GOI further reduced excise duties on most
products to 10 percent from 14 percent.
In February 2009 as part of an economic stimulus package, the
GOI again cut the excise duty on most products to 8 percent.
As the countervailing duty on imports is equivalent to the excise
tax, the total duty assessment for imported products will also be
reduced.
Despite these cuts, India‘s average applied tariff on industrial goods
remains high, mainly due to significantly high tariff peaks on
automobiles, motorcycles, and natural rubber. In November 2008,
India increased tariffs on certain steel products to 5 percent.
Notwithstanding lower applied tariffs in nonagricultural goods, India
has bound only 71.6 percent of its nonagricultural tariff lines. Also,
India‘s WTO bound tariffs on agricultural products are among the
highest in the world, ranging from 100 percent to 300 percent, with
an average bound tariff of 114.2 percent in 2007.
5.1POTENTIAL FOR IMPORT / EXPORT IN INDIA / GUJARAT
MARKET
India and Egypt signed a Memorandum of Understanding in trade, science &
technology, culture and information technology
India and Egypt reviewed the entire range of their bilateral relations at the sixth
session of the Egypt-India Joint Commission Meeting in Cairo today and signed
four documents on stepping up cooperation in various areas.

134
Agricultural Products
Automotive Products
Chemicals
Construction Equipments
Food Products
Furniture
Hotel Supplies
Household Appliances
Industrial Supplies
Laboratory Equipment and Supplies
Marble and Granite
Medical Supplies
Mining and Quarrying
Miscellaneous
Ready Made Garments
Safety Products
Ship and Marine Spare Parts
Stainless Steel
Veterinary Pharmaceuticals and Feed
5.2 CONSTRUCTION OPPORTUNITIES IN EGYPT
Key reasons to invest in Egypt
Low-cost labour force: 20% of UK costs
Diversified sources of income: fees from the Suez Canal, tourism, private
transfers, and remittances, gas and oil/hydrocarbon exports
Foreign-exchange reserves at a high level roughly at $33 billion
Strategic location: gateway to Africa and the Middle East
Access to one of the largest markets in the MENA region

135
Low-cost energy
Financial stability and strong banking sector
Other reasons
Egypt has the largest population in the Arab world (approximately 80
million, likely this number will double by the coming 25 years) and is the
fourth largest economy. Real GDP growth has averaged 7 percent for the
past 3 years. In 2008/2009, it slowed down to 4% due to impact of global
financial crisis and is expected to rise gradually again, it exceeded 5% in
2010.
Events in Egypt since January 2011, and the transition to democracy,
have had a negative impact on the economy. Economists forecast that
overall growth for FY 2011 will be around 3% rather than the 5.7% which
had been expected.
The transition government has placed a real emphasis on the need to
accelerate economic reform alongside democratic developments and
improve further the climate in Egypt for international investment.
Egypt has a strategic location in the centre of the Middle East and North
Africa (MENA) region (800 million people) and has links to the three
continents of Asia, Africa and Europe. It is the hub for the world‘s maritime
traffic with commercial ports on the Mediterranean and Red Seas.
Egypt is signatory to many regional and international Free Trade
agreements which reduce or wave completely the custom duties on
exported / imported goods.
The corporate and individuals income taxes are limited to 20%.
Construction is one of the most active sectors of the Egyptian economy.
Construction equipment is a major subsector in Egypt's substantial
construction industry, with an annual growth of 15%.

136
Construction investment is expected to increase to about US$7.3bn by
2015 (residential construction US$606 million, non-residential construction
US$6.7 billion).
There are around 31 public sector contracting firms (including 11 large
scales) and 36000 private contracting companies (including 250 large
scales).
In 2008 Egypt ranked 27th globally among steel producing countries and
3rd in the Middle East with yearly production reaching 6.2 million metric
tons.
Business opportunities
Infrastructure and service
River and land transportation
ICT sector
Housing and Urbanization and Utilities
Education
Production sector
Tourism
Petrochemicals
Agricultural sector
Industrial sector
Asset management
Development of industrial Zones
OPPORTUNITIES FOR L & T IN EGYPT
Larsen & Toubro (L&T) is India‘s largest engineering, construction and cement
conglomerate. The Engineering Construction & Contracts division of L&T is
India‘s largest construction organization, specializing in civil, mechanical,

137
electrical and instrumentation engineering. L&T has expanded its focus to the
Middle East, South East Asia, Russia, and Africa.
Some opportunities of construction for L&T in Egypt
Turnkey projects
Road & runways
Bridges, metros and ports
Hydel
Nuclear and defense
Big projects of Egypt
Biggest project for airport
Biggest project for sea port
The big project like south velly development
Investment in real estate. Infrastructure project and social housing
Government of Egypt also spending on residential construction in the long
term.
Some problems in Egypt
Poor infrastructure
low productivity
scarcity of skilled labor
So L& T has good opportunity in Egypt to establish their business because
infrastructure of Egypt is poor and also scarcity of skilled labor.
Other Opportunities

138
There are major new projects, including high-end real estate, tourist and
leisure developments, infrastructure projects, and social housing. There is
an increasing demand for housing to cope with the increasing population
The Egypt authority are now investing in projects such as: The Alexandria
Growth Pole Project, which includes the construction of low-income
residential facilities to reduce impoverished areas in the Alexandria region,
such contract can be taken over by L&T Construction India
L&T Power has a good chance in Egyptas the Egyptian government plans
to build three power plants with a cumulative capacity of 1,800 megawatts
by 2020.
The National Authority for Tunnels has planned to construct a 34-
kilometerlong metro line stretching from Imbaba to Cairo International
Airport.
Similar transport projects will lead to an increased expenditure in
infrastructure projects in the long term and pose a good opportunity for
company like L&T to go and venture in Egypt
Egypt has put an aggressive plan targeting increasing domestic electricity
production by 8.38 Gega Watts (GW) by year 2012 to close the gap
between production and demand. This will mean the need to construct
tens of new power stations
L&T Construction can opt for bidding in the Egyptian mega project called
―Development passage‖ to build new cities in the western dessert.
The Government has planned to build 1 million low cost houses over five
years for poor communities as a L&T has experince in building such
residential plots it can undertake such project and reap profits.

139
CONCLUSION
Construction accounts for around 8 per cent of the total employment in
Egypt, with about 100 different industries linked to the sector. The local
construction workforce of around 1.2 million is currently the largest in the
Middle East.
Most of the material required for the construction sector is produced
locally. Local cement production, amounting to 24 million tons annually
and meeting more than 70 percent of domestic demand, is expected to
increase over the coming decade due to heavy government investment in
the sector.
Private companies have also been allowed to compete in the production of
cement, which continues to be dominated by state-owned companies. The
construction industry is expected to continue its upward trend in the
coming years as a result of continued government and private business
expenditure, anticipated to reach 20 billion Egyptian pounds annually.
Egypt is a high-risk country as its one-year risk score is above the world
average and five-year risk score is comparable with the world average
score. Shortcomings in the legal and political system, accompanied by
terror threats and scarcity of skilled labor, have amplified the country risk
in the past few years.
Poor infrastructure, low productivity, scarcity of skilled labor, growing
unemployment, and other factors are adversely affecting the economic
activity in the country, which in turn increases the economic risk of the
country in the long term.
The operational risk of the country is high due to a bureaucratic tax
system, high level of corruption, rising security concerns, and time-
consuming legal procedures.

140
Overall, the country scenario seems risky for smooth operation of
businesses. However, the government is taking initiatives to relax
regulations for private investment to attract foreign investors and to
improve the business environment. This will lead to the growth of business
units, thereby encouraging more construction activity to match the growing
infrastructural demands of these business units.
BIBLIOGRAPHY
www.construindia.com
www.indiainfrasture.com
www.projectexport.com
www.ameinfo.com
www.cyprustrade.com
www.egyptindependent.com
Egypt.importers.com
www.egypt-import-export.com
www.globalconstruction2020.com
http://www.centroesteroveneto.com/pdf/Osservatorio%20Mercati/India/Ric
erche%20di%20Mercato/2009/Construction%20Sector.pdf
http://www.ustr.gov/sites/default/files/uploads/reports/2009/NTE/asset_upl
oad_file528_15470.pdf

141
Power Sector

142
Sr. No Particulars
1 Introduction of Power Sector
2 SWOT ANALYSIS of Indian Power Industries
3 About the Company: NTPC
4 EXISTING SCENARIO OF POWER SECTOR
5 Structure of power sector working in India
6 COMPARATIVE POSITION OF POWER SECTOR
7 POLICY OF EGYPT POWER SECTOR
8 Business opportunity in Egypt:
9 Conclusion
1 INTRODUCTION OF THE POWER SECTOR
.
POWER SECTOR HISTORY:
When India became independent in 1947, the country had a power generating
capacity of 1,362 MW. Generation and distribution of electrical power was carried
out primarily by private utility companies. Notable amongst them and still in
existence is Calcutta Electric. Power was available only in a few urban centers;
rural areas and villages did not have electricity.
After 1947, all new power generation, transmission and distribution in the rural
sector and the urban centers (which was not served by private utilities) came
under the purview of State and Central government agencies. State Electricity
Boards (SEBs) were formed in all the states.

143
National Thermal Power Corporation (NTPC), National Hydro-electric Power
Corporation (NHPC) and Power Grid Corporation Limited (PGCL) were formed
by the government to assist in meeting the increasing demand for electricity
throughout the country. The electricity sector is in the 'concurrent list', meaning
that both, State and Central governments participate in the sector's development.
The Central Electricity Authority (CEA) was established as a statutory authority to
develop a 2nd National Power Policy and also to function as a regulatory
authority. As per government guidelines, all power projects above a certain
capacity have to obtain techno-economic clearance from CEA before they can be
implemented. A new Ministry of Non-Conventional Energy Sources has also
been formed to focus on renewable energy sources to augment the generation
capacity of electrical power.
Power Sector GDP
The Power & Energy Infrastructure sector in India is poised for a major take-off.
The APDRP (Accelerated Power Development & Reforms Programme 2002 -
2012) has seen an addition of around 22,000 MW during last five years. And
during the next five years, a capacity addition of over 78,000 MW has to be setup
by 2012.
The Market Potential to sustain the GDP Growth rate of India @ 8% plus per
annum needs the power sector to grow at 1.8 - 2 times the GDP rate of
growth as espoused by economists, planners and industry experts. This would
mean a YOY capacity addition of 18,000 - 20,000 MW to achieve India to a
Developed Economy status, as an Economic Global Powerhouse. The Target
Mission: ‗POWER for All by 2012‘ would mean achieving the target of 1000 KwHr
(Units) of per capita consumption of electricity by this period.
IMPACT OF LPG POLICY 1991 ON POWER SECTOR:
Prior to 1991, the power sector was almost entirely in the public domain, with
very small contribution from the private sector. In 1991, the power sector was
144
opened up to private participation as a part of the overall economic restructuring
that started World Bank and IMF. The Government of India formulated a scheme
to ―encourage greater participation by private enterprises in electricity generation,
supply and distribution‘‘.
Some important provisions in the new policy 1991 included:
Private sector allowed to set up any kind of electricity generating plants
(excepting nuclear) of any size
Captive power plant set up by industry will be allowed to sell power to
State Electricity Boards (SEBs)
100% foreign equity permitted
Debt Equity ratio of 4:1
Guaranteed 16% return on equity in currency of subscription
100% repatriation of earnings
POWER SECTOR COMPARISION:
2.4% of the overall world energy output
The electricity sector in India supplies the world's 5th largest energy
consumer, accounting for 4.0% of global energy consumption by more
than 17% of global population.
The gross electricity production capability of Indian Power Sector is placed
at around 111 GW in 2017.
U.S. share of total world energy consumption is projected to contract from
22 % in 2005 to about 17 % in 2030.
Overall global consumption is expected to rise 50% from 2005 to 2030.
SWOT ANALYSIS OF POWER SECTOR:
Strengths:
2. SWOT ANALYSIS of Indian Power Industries

145
India has the fifth largest electricity generation capacity in the world
Transmission & Distribution network of 6.6 million circuit km.
The third largest in the world Potential for growth in this sector (demand
exceeding supply) Increasing focus on renewable sources of energy
Government presence in the sector (encouraging entry of foreign players)
& No barriers to entry
Well established and vast transmission and distribution network.
Highly qualified engineering and technical personnel.
Regulatory framework is further facilitated with enactment of Electricity
Bill, 2003.
The Electricity Bill, 2003 holds promises for the power sector and certainly
for the consumer by way of competition reliability and rationalized tariff
structure.
Emergence of strong and globally comparable central utilities (NTPC,
POWERGRID).
India has substantial non-conventional energy resource base and
technologies to meet growing power requirements by tapping this energy.
Weaknesses:
Public sector players are only into generation of power large demand-
supply gap: All India average energy shortfall of 9% and peak demand
shortfall.
The Future of Power Sector in India of 14% Lack of exposure of
entrepreneurs to handle international contracts.
Inexperience of SEBs to handle changing market environment in addition
to their weak financial condition.
Unavailability of fuel and unwillingness of fuel suppliers to enter into
bankable contracts.
Lack of necessary infrastructure to transport and store fuel, high cost risk
involved in transporting fuel.

146
Poor infrastructure has led to heavy T&D losses. Old and poor
transmission and distribution network has led to frequent power outages
and poor quality of power
Lack of proper metering and theft has led to large scale losses. Only 51%
of the power generated is billed and only 41% is realized
Opportunities:
Huge population base Opportunities in Generation Ultra Mega Power
Plants (UMPP) – 9 projects of 4000 MW each.
Coal based plants at pithead or coastal locations which are untapped.
Hydel power potential of 150,000 MW is untapped as assessed by the
Government of India.
Renovation, modernization, up-rating and life extension of old thermal and
hydro power plants.
Threats:
Competition to domestic players from foreign Pvt. Players as 100%.
FDI permitted by government in Generation, Transmission & Distribution
Not a lucrative option for investors (ROE).
Rise in price of raw materials.
Tariffs are distorted and do not cover cost.
Date of Establishment : 07-11 1975
Revenue : 12383.2 (USD in Millions)
Market Cap : 1426465.3412 (Rs. in Millions)
Corporate Address : N T P C Bhawan, Scope Complex, 7, Institutional
3. ABOUT THE NTPC COMPANY:

147
Area, LodiRoadNewDelhi-110003,Delhi
Chair person : Arup Roy Choudhury
MD : ArupRoyChoudhury
NTPC contribution:
In year 2009-10 NTPC recorded a generation of 218 BUs against target of 210
BU. Eleven (11) coal based stations of NTPC achieved a PLF of more than
90%.This is against 77.5% of the national average PLF for the year 2009-10.The
PLF of NTPC all coal stations is 90.81% for the yr. 2009-10.The gas based
power stations of NTPC Ltd. Also registered a remarkable improvement during
the year mainly due to the availability of gas from KG D-6 gas block.In the yr.
2009-10 all gas based stations of NTPC Ltd. Achieves more than 75% PLF. As
per MOU, NTPC Ltd. Committed to generate 226000 Million Units (MUs) of
electricity in the year 2010-11 from its plants.
The Compound Annual Growth Rate (CAGR) of power demand for the last five
years has been 6.80% as against power supply CAGR of 5.88%. The CAGR of
NTPC Ltd. power generation has been higher at 6.79%. Strong appetite for
electricity consumption in the country translates into robust growth outlook for
power players like NTPC Ltd.
Company Analysis
SWOT Analysis
NTPC Limited Strengths:
Strong Market Position
Diversified Business Operations
Strong Focus on Research and Development
Efficient Liquidity Position

148
NTPC Limited Weaknesses:
Slow Fuel Diversification Process
Dependence on Fossil Fuels
Substantial Debt Obligations
NTPC Limited Opportunities:
Developmental Projects
Expansion into the International Markets
Diversification into Coal Mining & Other Business
Strategic Collaborations
NTPC Limited Threats:
Intense Competition
Increasing Raw Material Costs
Legal and Political Framework
Power Theft
Financial analysis of NTPC LIMITED
In the analysis first important thing is sales there is a double growth in
sales in fy2010-11 as compare to fy2009-10. In 2010-11 increase in sales
by 8178.94 crores (16.61 %) as compare to 2009-10 which was
46377.46 crores. And in 2009-10 increase in sales by 3955.10 crores
(8.73 %) as compare to 2008-09 which was 41975.20 crores.
As a result, effect of growth in sales we can see in profit margin. There is
increase in profit margin by 374.39 crores (4.29 %) in 2010-11 as compare
to 2009-10 which was 7828.20 crores. And in 2009-10 increase in profit
margin by 526.90 crores (6.42 %) as compare to 2008-09 which was
8201.30 crores. The decrease in profit margin in 2010-11 as compare to
2009-10 because of more payment in interest expenses in the year 2010-

149
11 by 165.31 crores and this happened due to increase in secured and
unsecured loans both.
There is increase in fixed assets by 4489.75 crores (12.98 %) in 2010-11
as compare to 2009-10 which was 34575.00 crores this is also one of the
reasons that increase in profit margin.
There is increase in earnings per share of company by 0.45 rupees as
compare to last year. In year 2010-11 EPS is 11.04 and in 2009-10 EPS is
10.59.
Awards:
NTPC ranked 19th by the GPTW for 2011 amongst 25 top Best
Companies in India
NTPC ranked 6th amongst 25 top Best Employers in Country
Exemplary Leadership Award to Shri Arup Roy Choudhury for People
Excellence
NTPC wins Star TV Talent Leadership and HR Award
Two Awards for NTPC at Asia Best Employer Brand Awards
Overall 7th in ‗India‘s Best Companies to Work for 2010‘, 1st amongst the
PSUs and 1st in Manufacturing & Production Industry Segment.
Great Places to Work Award 2010
NCPEDP-Shell Helen Keller Award 2009
Vishwakarma Rashtriya Puraskar (VRP) – 2007
Best Companies to Work For – 2009
SCOPE Meritorious Award for Best Practices in Human Resource
Management
Performance
4. EXISTING SCENARIO OF POWER SECTOR
150
The capital-intensive power industry suffered tremendous losses due to the
economic recession. Industry analysts have revealed that there was a
staggering 50% decline in the number, value and capacity of new projects
between the beginning of the credit crunch in 2008 and 2009.
Going forward, it is believed the hotspots of activity will primarily be in India,
China and the UK. As well as new builds, there are also significant
opportunities for synergies across the global energy supply chain with industry
and governments keen to invest in and adopt new technologies. In order to best
capitalize on these new opportunities, major contractors and companies across
the energy supply chain have begun to work together more closely, to
streamline their operating and procurement procedures.
India has the fifth largest electricity generation capacity in the world. The total
installed capacity of India is ~150,000 MW, of which majority of generation,
transmission and distribution capabilities with either public sector companies or
with State Electricity Boards (SEBs). Only ~15% capacity is from the private
sector, though this is now beginning to increase. Market research suggests
~65% of India‘s total installed capacity is contributed by thermal power with the
Western and Southern regions each accounting for ~30%. Due to unbalanced
growth and rural-urban disparity, only ~40% of rural household have access to
electricity versus ~80% of urban households. Key players include National
Thermal Power Corporation Limited, Nuclear Power Corporation of India
Limited, North Eastern Electric Power Corporation Limited, Power Grid
Corporation of India and Tata Power.
Growth potential
The Indian power sector is experiencing a large demand-supply gap. At present,
the energy shortage in the India is ~10% but there are States where the
energy shortage is as high as 25%. To combat this, over 80,000 MW of new

151
generation capacity is planned in the next five years. A corresponding
investment is required in Transmission and Distribution networks.
The Indian Ministry of Power has set a goal, ―Mission 2012: Power for all‖ and
released a comprehensive sector development blueprint. The main objectives,
in addition to providing 100% access to power, are to provide sufficient power
to achieve targeted GDP growth rate of 8%, provide reliable and good quality
power and to enhance commercial viability.A huge capital investment of about
US$ 200 billion is required to meet Mission 2012 targets. This has welcomed
numerous global companies to establish their operations in India under the
famous PPP (public-private partnership) programs. Additional massive capital
investment is further required over the subsequent years with the country‘s
power requisite expected to touch 800,000 MW by 2031-32.
Future prospects:
Due to the influx of foreign companies, and the ramping up of operations by
domestic companies, the industry is experiencing a hiring spike. New
graduates would be advised to seek an initial position in one of the larger
companies as there will be specific training courses and more opportunities for
someone starting out. Given the breadth of the power industry, it is possible to
work with a range of different technologies and disciplines depending upon
your preferences.
All of the large power-generation companies are looking for graduates and
apprentices in a range of disciplines. Degrees in engineering (mechanical,
electrical or civil), science (physics, chemistry or mathematics) and even IT or
business studies are required. In addition, work experience is a big advantage
5. Structure of power sector working in India
Organizational Setup

152
The Central Electricity Authority (CEA) is the nodal authority for supply of
electricity data. It is a statutory organization under M/o Power.
Constituted under Electricity (Supply) Act, 1948. It was established as a
part-time body in the year 1951 and made a full-time body in the year
1975. With the objective of reforming the Power Sector, the Electricity
Act, 2003 has been enacted and the provisions of this Act have been
brought into force with effect from 10th June, 2003.
Functions
As per the Electricity Act, 2003, the Central Electricity Authority shall
perform such functions and duties as the Central Government may
prescribe or direct, in particular to –
a) advise the Central Government on the matters relating to the national
electricity policy, formulate short-term and perspective plans for
development of the electricity system and coordinate the activities of the
planning agencies for the optimal utilization of resources to sub serve
the interests of the national economy and to provide reliable and
affordable electricity to all consumers;
b) Specify the technical standards for construction of electrical plants,
electric lines and connectivity to the grid;
c) Specify the safety requirements for construction, operation and
maintenance of electrical plants and electric lines;
d) Specify the Grid Standards for operation and maintenance of
transmission lines;
e) Specify the conditions for installation of meters for transmission and
supply of electricity;
f) Promote and assist in the timely completion of schemes and projects
for improving and augmenting the electricity system;
g) Promote measures for advancing the skills of persons engaged in
electricity industry;

153
h) advise Central Government on any matter on which its advice is
sought or make recommendation to that Government on any matter if,
in the opinion of the Authority, the recommendation would help in
improving the generation, transmission, trading, distribution and
utilization of electricity;
i) collect and record the data concerning the generation, transmission,
trading, distribution and utilization of electricity and carry out studies
relating to cost, efficiency, competitiveness and such like matters;
j) Make public from time to time the information secured under this Act,
and provide for the publication of reports and investigations;
k) Promote research in matters affecting the generation, transmission,
distribution and trading of electricity;
l) Carry out, or cause to be carried out, any investigation for the purpose
of generating or transmitting or distributing electricity;
m) Advice any State Government, licensees or the generating companies
on such matters which Shall enable them to operate and maintain the
electricity system under their ownership or controlling an improved
manner and where necessary, in coordination with any other
Governent, licensee or the generating company owning or having the
control of another electricity system;
n) Advise the Appropriate Government and the Appropriate Commission
on all technical matters relating to generation, transmission and
distribution of electricity; and
o) Discharge such other functions as may be provided under this Act.
Details of the data Flows/ Items
In exercise of the powers conferred by section 177, read with section 74
and clause (i) of
section 73 of the Electricity Act, 2003, the Central Electricity Authority
published the regulations vide Extra Ordinary Gazette notification dated

154
19th April 2007, namely:- “Central Electricity Authority ( Furnishing of
Statistics, Returns and Information) Regulatios,2007”
a. Sources of Statistics, Returns and Information
All licensees, generating companies and person(s) mentioned below, but
not limited to, shall furnish to the Authority such statistics, returns or
other information relating to generation, transmission, distribution,
trading and utilization of electricity at such times.
Licensees Required
1. Transmission Licensees;
2. Distribution Licensees;
3. Trading Licensees;
4. Central Transmission Utility;
5. State Transmission Utilities;
6. Appropriate Governments who are responsible for transmitting,
distributing or trading of electricity;
7. Damodar Valley Corporation established under sub-section (1) of
section 3 of the Damodar Valley Corporation Act, 1948 (14 of
1948);
8. Any person engaged in the business of transmission or supply of
electricity under the provisions of the repealed laws or any act
specified in the Schedule;
9. Any person who intends to generate and distribute electricity in a
rural area as notified by the State Government;
10. State Electricity Boards;
11. Local authorities including Cantonment Boards;
12. Deemed licensees and entities exempted from licence.
6. COMPARATIVE POSITION OF POWER SECTOR

155
Platts Top 250 Global Energy Company Rankings : in this
ranking NTPC is on 58th rank in 2011.
o Ranked 348th in Global ranking among ‗Global 2000‘ list of
companies compiled by Forbes in 2011.
NTPC Limited engages in the generation and sale of bulk power to state power
utilities in India. The company generates power from coal, gas, liquid fuel, and
hydel sources. It also undertakes consultancy and turnkey project contracts that
comprise engineering, project management, construction management, and
operation and maintenance of power plants. In addition, the company engages
in the oil and gas exploration, and coal mining activities. It has an installed
capacity of 38,854 megawatt. The company was founded in 1975 and is based in
New Delhi, India.
Company Information:
State or country India
Geographical Location Asia/Pacific Rim
Assets $30,228 mil
Revenues $12,638 mil
Profits $2,059 mil
Return on invested
capital (ROIC)
8%
Company data as of 6/01/2011 provided by S&P Capital IQ
1. Subsidiaries & Joint Ventures
Subsidiary Companies
NTPC Vidyut Vyapar Nigam Limited has been incorporated as a wholly
owned subsidiary of NTPC to tap the vast potential of Power Trading for
optimization of capacity utilization.
NTPC Hydro Limited has been incorporated as a wholly owned subsidiary
of NTPC for development of small and medium scale hydro power projects.

156
NTPC Electric Supply Company Limited has been incorporated as a
wholly owned subsidiary of NTPC for taking up power distribution activities.
Joint Ventures
Utility Powertech Limited - A 50:50 Joint Venture Company of NTPC and
Reliance Infrastructure Limited (formerly Reliance Energy Limited) has been
incorporated to take up assignments of construction, erection and supervision in
power sector and other sectors in India and abroad.
NTPC-Alstom Power Services Private Limited - a 50:50 Joint Venture
Company of NTPC and Alstom Power Generation AG, Germany has been
incorporated for taking up renovation and modernization assignments of power
plants both in India and abroad.
NTPC-SAIL Power Company Private Limited – a 50:50 Joint Venture
company of NTPC and SAIL owns and operates a capacity of 314 MW and 500
MW (2X250 MW) expansion project as captive power plants for SAIL‘s steel
manufacturing facilities located at Durgapur, Rourkela and Bhilai.
NTPC Tamil Nadu Energy Company Limited – a 50:50 Joint Venture
company of NTPC and Tamil Nadu Electricity Board has been incorporated to
establish and operate a 1500 MW (Phase I -1000 MW & Phase II – 500MW)
thermal power project in Tamil Nadu.
ENERGY POLICY: Egypt‘s Supreme Council of Energy (SCE), which includes
the minister of electricity and energy and petroleum, shoulders much of the
responsibility for drawing up energy policy. The SCE works with the
parliamentary Committee for industry and with the President.
The current electricity policy has a range of goals, including improving the
efficiency of power generation; reducing losses in production, transmission and
7. POLICY OF EGYPT POWER SECTOR

157
distribution of energy; boosting local manufacturing of electricity equipment;
diversifying energy sources, partly to preserve existing oil reserves; and
increasing the amount of energy generated by renewable.
Egypt‘s electricity sector is a single-buyer market, essentially a monopoly in
which the state-owned Egyptian Electricity Transmission Company (EETC) is
responsible for purchasing of power from providers (still mostly also state-
owned), as well as for the supply of electricity to distribution companies and
around 80 large scale consumers, which are direct buyer. The state is also
responsible for setting prices.
However, reforms have seen a formerly vertically integrated monopoly split into
six generating companies, nine distribution companies and one transmission
company. Seven private distribution firms have also been formed, though
together they have a less than 1% market share. CI Capital expects the EETC‘s
effective monopoly to come to an end in the near future as liberalization
continues, subsidies are lifted and a greater degree of competition is introduced.
Indeed, the government‘s drive to increase private sector and foreign investor
participation across the economy could be applied to power transmission and
distribution, which require investment. Increased competition in the power market
should also partly counteract price rises due to the phasing out of subsidies.
The national grid currently sets neither a balancing fee nor a transfer fee.
Balancing fees are charged to offset the costs of balancing supply and demand
across the grid, while transfer fees, as the term suggests, cover the costs of
transmitting electricity. Even though it currently costs considerably more to
transfer electricity to rural areas, the tariff is the same national wide. Going
forward, CI Capital expects Egypt to introduce balancing and transfer fees for
private companies – though increasing the cost of electricity for household in
rural areas seems unlikely, given the country‘s goals for rural development and
the political sensitivity of such a move.

158
Electricity sector strategy and policies
EEHC set a five years plan (2007/2008-2011/2012) to meet the expected
average annual growth of demand of 6. 8%. This entails adding a generation
capacity of 775 MW with maximizing the use of Combined Cycle to reach 4.1% of
the total installed capacity in 2011/2012. In the meantime EEHC and its affiliated
companies continuously develop, improve and modernize the services to its
customers (the number of customers increased from 4.5 million in early eighties
to 22.6 million in FY2006/2007) to speed and facilitate the processes of the
required services. EEHC gives great importance that the affiliated companies
achieve the targeted technical, operational, procedural and financial indicators
which were set with reference to international standards. In order the companies
achieve the targeted performance indicators; they set up all necessary
mechanisms and provide all technical and human resources capabilities
necessary for the continuous development of generation, transmission and
distribution techniques. In order to maximize the local contribution in different
planned electricity projects, EEHC cooperates and coordinate with all local
Egyptian firms and entities. EEHC aims to create a wider market for its services
in the Arab and African countries through the establishment of joint consulting
companies or marketing the Egyptian experience in the field of electricity -as an
example of such cooperation - the electrical interconnection projects and the
establishment of the joint consulting companies with Syria and Libya. In order to
acquire, benefit and transfer latest and diversified international experience to its
dear customers, EEHC cooperates with international companies and firms and
participate in international conferences, workshops and seminars.
Acknowledging the importance of data documentation, Egyptian Electricity
Holding Company issues this annual report to document its activities and
achievements over the Fiscal Year 2006/2007 to be as a reference to those who
are interested in the field of electrical energy.
The main strategic goals of the electricity sector are supplying electricity
according to international standards, and meeting demand in all consuming

159
sectors, with due consideration for environmental concerns.
THE SECTOR’S POLICIES:
Maximizing the utilization of hydropower resources through electrification
of suitable barrages on the Nile River and its branches.
Maximizing the use of natural gas in thermal power plants.
Promotion of new and renewable energy to increase its share in the power
generation mix.
Interconnecting the Egyptian electricity grid with neighboring countries
both east and west.
Improving efficiency of energy generation, transmission, distribution, and
use.
Adopting measures to enhance environmental protection.
Improving awareness through the use publications and media campaigns
Accelerating the use of natural gas rather than oil (also part of
environmental strategy)
Developing national energy efficiency codes and standards
Promoting private investment in energy efficiency activities
Capacity building on all levels
Adapting Energy Efficiency technologies to the local needs through
implementing demonstration projects.
Encouraging local manufacturing of EE equipment
Taking all the necessary measures to improve energy efficiency including
energy pricing, reduction of customs duties on EE equipment as well as
adopting necessary legislations.
Encouraging the bilateral and international cooperation.
Goals of the Ministry of electricity and Energy:
Optimize use of available energy sources and minimize environment
pollution
Provide electricity with minimum price and best quality

160
Expand utilization of new and renewable energy resources
Support electricity availability in towns and cities and complete electrifying
the urban areas and low population communities.
Interconnect the Egyptian Electrical network to African, west and east
neighboring countries
Boost local and domestic contribution to design, implementation and
manufacturing of electrical equipments.
Develop peaceful use of nuclear power.
Restructure electricity sector to optimize investments and improve
electrical services.
Utilize modern and sophisticated technical systems in electricity sector's
operation and activities.
Develop the expertise and skills of engineers and technicians working in
the electricity sector.
Export Egyptian expertise in design, manufacture, negotiation,
construction and operation of electrical projects.
Use soft loans as much as possible.
Work Mechanism in the Ministry of electricity and Energy
Set and Implement general policies in the fields of electricity
generation, transmission and distribution to use the most technical and
scientific proven developments and technologies.
Follow up and monitor different activities to provide electrical power for the
social and economic development to support the government's framework
and plans.
Suggest tariff of electrical power to the cabinet.
Supervise study and implementation of important electrical projects.
Set data structure and technical statistics of electric activities.
Organize and provide the technical support, consultancy and experience

161
to Arab countries in the electrical field.
Norms and Standards
The objective of this policy consists of setting norms and standards for the
provision of electric services that is safe, equitable and fair with the best quality
and lowest cost.
Resolve the problems with the current concessions through a fair and
equitable compromise for the owners and the Government using a
financial settlement that gives the GoL its rights and the concession
owners‘ incentives and encouragements to have them enter in operation
of independent production (IPP) and distribution service provision (SP).
Develop rules and laws that promote the largest penetration of ―Green
Buildings (GB)‖ and ―Energy Efficiency (EE)‖ in collaboration with
concerned institutions.
Comply and respect international norms and standards in the energy
efficiency, environmental and public safety domains.
The provision of electric service through its equipment, techniques, related
production, transmission, distribution and interconnection, will be based on
intelligent systems (SmartGrid) to position Lebanon to the highest regional and
international level in the electric arena.
LICENSING:
Egyptian Electric Utility and Consumer Protection Regulatory Agency
In Egypt there are main three areas includes Distribution, Generation, and
Transmission. Following are some condition for all of them.
General Conditions for License
The official document issued by the Agency to a corporate entity to generate,
transmit or distribute electrical energy in the Arab Republic of Egypt, upon the
approval of the Board of Directors, for a specific period of time in compliance with
the Presidential Decree.

162
Generation Company
The corporate entity licensed to generate electrical energy from its various
facilities.
Transmission Company
The corporate entity licensed to transmit electrical energy, for the loads supplied
at 33 kV and above, to distribution companies or consumers with loads of 33 kV
and above, in addition to loads of 11 KV, and 22 KV to distribution companies.
Distribution Company.
Distribution Company
The corporate entity licensed to distribute electrical energy through its own
distribution network for loads of less than 33 kV.
Consumer
The end user of electrical energy according to a concluded contract between a
generation, transmission and distribution entity and himself at transmission or
distribution voltages.
Distribution Network
A group of facilities and equipment that belongs to a licensed distribution entity
for electrical energy distribution to loads less than 33 kV. This includes overhead
lines, underground cables, feeders, transformers, control stations and metering
equipment.
Electricity Distribution License Application Requirements
1. Commercial registry certificate.
2. Tax certificate number.
3. Company organizational chart and responsibilities.
4. Technical and financial study that contains;
Capital investment and the type and the source of finance

163
Technical and financial analysis for the establishment activities
Cost of service study
Billing methodology
Engineering drawings
Maps for the area for practicing the license activities.
5. Relevant licenses from other administrative Authorities.
6. Environmental Impact Assessment of the licensed activities
7. C.Vs. of the high level management personnel
8. A complete set of attachments, as stated within the licensing general
condition.
9. All contracts with consumers or other licensees
10. Application fee receipt.
11. Any other data or documents requested by the Agency
TAXATION TYPES RATES Corporate tax rates: The standard rate of corporate tax is 20% for
manufacturing, trading and services companies, and 40.55% for companies
engaged in the exploration and production of oil and gas. The Suez Canal
Authority, the Egyptian Petroleum Authority and the Central Bank are taxed at
40%.
Resident individual income tax: Progressive rates up to 20% on income over
EGP 40,000 per year. Non-resident and resident employees who derive income
from sources other than their original place of employment are subject to tax at a
flat rate of 10%.
Non-resident individual income tax: Non-resident and resident employees who
derive their income from sources other than their original place of employment
are subject to tax at a flat rate of 10%.
Sales & service tax: The standard rate is 10%.
Withholding tax:

164
8. Business opportunity in Egypt:
Egypt had installed generating capacity of 17.06 gigawatts (GW) as of 2004, with
plans to add 4.5 GW of additional generating capacity by 2007 and 8.38 GW by
2012. Around 84 percent of Egypt's electric generating capacity is thermal
(natural gas), with the remaining 16 percent hydroelectric, mostly from the Aswan
High Dam. All oil-fired plants have been converted to run on natural gas as their
primary fuel. With electricity demand growing, Egypt is building several power
plants and is considering limited privatization of the electric power sector. Egypt's
power sector is currently comprised of seven regional state-owned power
production and distribution companies, which were held by the Egyptian
Electricity Authority (EEA). In July 2000, the EEA was converted into a holding
company, though still owned by the state. Previous privatization plans have
stalled, and the future direction of government policy in the electric utilities sector
is unclear.
Egypt has several privately-owned power plants currently under construction
which were financed under Build, Own, Operate, and Transfer (BOOT) financing
schemes. BOOT projects are used to fund large-scale public infrastructure
without affecting the country's debt profile. Private developers are allowed to
recover their costs of construction through ownership and operation of the plant
Dividends: No withholding tax is levied on dividend paid to residents or
non-residents.
Interest: Interest paid to non-residents are subject to a 20% withholding
tax, which may be reduced under a tax treaty. Interest paid under a long
term loan is not subject to withholding tax.
Royalties: Royalty payments made to nonresidents are subject to a 20%
withholding tax, unless the rate is reduced under a tax treaty.
Double taxation: Egypt has 49 tax treaties with other countries but these
agreements currently exclude New Zealand.

165
for a fixed period before handing it over to the state. The first BOOT project was
a gas-fired steam power plant with two 325-megawatt (MW) generating units,
located at Sidi Kerir on the Gulf of Suez. The plant cost $450 million, and began
commercial operation in late 2001. Electricity from the plant is priced at 2.54
cents per kilowatthour. This competitive price stems largely from the availability
of cheap natural gas -- to be supplied by Egypt's EGAS -- as a feedstock. U.S.-
based InterGen (a joint venture of Bechtel Enterprises and Shell Generating
Ltd.), along with local partners Kato Investment and First Arabian Development
and Investment, have the 20-year BOOT contract for Sidi Kerir. The second
BOOT power project award went to Electricite de France (EDF), for two gas-fired
plants to be located near the cities of Suez and Port Said. Each plant will have an
installed capacity of 650 MW, and the project cost will total around $900 million.
The price for power from the EDF plants will be 2.4 cents per kilowatt hour (Kwh),
the lowest price yet offered for a BOOT plant. The plants both began commercial
operation in 2003. The future of BOOT financing in Egypt is unclear, however,
and recent government statements indicate that no new BOOT projects are likely
in the near future.
EEHC-owned projects currently under construction include the 1,500-MW plant
planned at Nuberiya in the western Nile Delta near Alexandria. The first 750-MW
generating unit at Nuberiya is scheduled to begin operation by the end of 2005.
The 64-MW Nag Hammadi hydropower project is under construction, with
European Investment Bank financing, and is scheduled for completion in 2006.
After several years of delays, the 1,500-MW capacity expansion at the Cairo
North power complex came online in mid-2004. A contract has been awarded to
Russia's Power Machines Group for the refurbishment of the turbines at the
Aswan High Dam. The project will extend the operational life of the turbines by
about 40 years and increase generating capacity at the dam from 2,100 MW to
2,400 MW.

166
Egypt is also planning to build a part-solar power plant at Kureimat as a BOOT
project, which will have 30 MW of solar capacity out of a total planned capacity of
150 MW. The World Bank will provide a financing package from its Global
Environmental Facility which will offset the cost difference between the solar
capacity and thermal capacity. A Netherlands-funded project is building 60 MW
of wind power units in the Suez Canal area. Egypt also has a 22-MW nuclear
research reactor at Inshas in the Nile Delta, built by INVAP S.A. of Argentina,
which began operation in 1997.
Work has been completed on the interconnection of Egypt's electric transmission
grid with other countries in the region. The Five-Country interconnection of
Egypt's system with those of Jordan, Syria, and Turkey was completed by 2002.
Egypt also activated a link to Libya's electric grid in December 1999.
Conclusion
Egypt‘s electricity sector is a single-buyer market, essentially a monopoly in
which the state-owned Egyptian Electricity Transmission Company (EETC) is
responsible for purchasing of power from providers (still mostly also state-
owned), as well as for the supply of electricity to distribution companies and
around 80 large scale consumers, which are direct buyer.
However, reforms have seen a formerly vertically integrated monopoly split into
some generating companies, distribution companies and transmission company.
Seven private distribution firms have also been formed, though together they
have a less than 1% market share. CI Capital expects the EETC‘s effective
monopoly to come to an end in the near future as liberalization continues,
subsidies are lifted and a greater degree of competition is introduced. Indeed,
the government’s drive to increase private sector and foreign investor
participation across the economy could be applied to power transmission
and distribution, which require investment. Increased competition in the
power market should also partly counteract price rises due to the phasing

167
out of subsidies. Thus, due to these reasons, NTPC can establish its new
power plant in Egyptian Market.
The national grid currently sets neither a balancing fee nor a transfer fee.
Balancing fees are charged to offset the costs of balancing supply and demand
across the grid, while transfer fees, as the term suggests, cover the costs of
transmitting electricity. Even though it currently costs considerably more to
transfer electricity to rural areas, the tariff is the same national wide. Going
forward, CI Capital expects Egypt to introduce balancing and transfer fees for
private companies – though increasing the cost of electricity for household in
rural areas seems unlikely, given the country‘s goals for rural development and
the political sensitivity of such a move.
http://www.mbendi.com/indy/powr/af/eg/p0005.htm
Source: www.egyptera.org (Egyptian Electric Utility and Consumer Protection Regulatory
Agency)
BOOK: books.google.co.in/books?isbn=1907065407
www.ntpc.co.in

168
Shipping Sector

169
TABLE OF CONTENT
PART-II SHIPPING INDUSTRY SECTOR/ COMPANY/ PRODUCT/ SERVICE
SPECIFIC STUDY
SR.NO CONTENT Page.NO
4 Shipping Industry in Egypt and India
5 Policies, Services & structure of Shipping Industry in
Egypt & India
6 Trade Barrier For shipping Industry
7 Comparative Position of Egypt & India
8 Business Opportunities for Egypt with specific to
company
8.1 Essar shipping & Ports
8.2 Navigation Shipping Industry
9 Conclusions

170
INTRODUCTION OF SHIPPING INDUSTRY IN EGYPT
The world‘s shipping industry is watching the situation in Egypt especially
carefully because of the potential for the country‘s unrest to disrupt traffic on the
Suez Canal, one of the world‘s most important international waterways. Rumors
on Friday that the canal had shut sent shares in Frontline, the world‘s biggest oil
tanker operator, up 8.5 per cent. Traders were speculating that closure would
push up demand for tankers, because it would force ships to take longer routes.
Although Egypt‘s ports were all shut on Monday, the canal‘s convoy system –
where ships go through in batches and pass each other at designated passing-
points – was still operating normally. Convoys operating after 3pm were being
accompanied by military escorts.
EGYPT ECONOMY
Egypt's economy is the second largest in the Arab world (after Saudi Arabia) and
its economic sectors reflect its size. The service sector is by the far the largest
and fastest-growing economic sector and accounts for almost 51 percent of
GDP. Tourism, trade, banking, and shipping services on the Suez Canal
constitute the main sources of service sector revenue. Both tourism and the Suez
Canal were hit hard by Islamic violence in the 1990s, with tourism in particular
suffering badly after the 1997 Luxor attack, in which 58 foreigners were killed by
Islamic militants. Since gaining independence from Britain, Egypt has struggled
to rid itself of the feudal economic system left behind by the British and to create
an independent economy capable of standing on its own. By the end of the
twentieth century, Egypt had not yet achieved a vibrant economy and remained
heavily dependent on foreign aid and imported goods.

171
SHIPPING SECTOR IMPACT ON EGYPT ECONOMY
Business Monitor International's Egypt Shipping Report provides industry
professionals and strategists, corporate analysts, shipping associations,
government departments and regulatory bodies with independent forecasts and
competitive intelligence on Egypt‘s' shipping industry.
On a global level we continue to see risks for all three core shipping sectors
(container and dry and liquid bulk), with overcapacity and a drop in demand
continually threatening to push down rates and impinge on lines' profits. As
austerity measures take hold in Europe and the US continues to have high
unemployment and recover from the downturn sluggishly, shipping levels may
slow their growth considerably
HEAD LINES OF INDUSTRIAL DATA
2012 total tonnage throughput at Damietta is forecast to grow by a
subdued 1.0% to 26.12mn tones, and to average 1.6% per annum to
2016.
2012 East Port Said container throughput growth forecast at 8.1% to
reach 2.81mn twenty-foot equivalent units (TEUs), and to average 11.2%
to 2016.
2012 Egyptian trade real growth forecast at 6.1%, and to average 8.8%
over the medium term.
2009 2010 2011 2012
real GDP
growth
4.7 5.1 1.6 4
CPI inflation 16.2 11.7 13.4 12.2

172
Budget
balance %
GDP
-6.6 -8.1 -9.8 -9.4
Current
account %
GDP
-2.3 -2 -3.2 -2.9
INDIAN SHIPPING INDUSTRY
The Indian shipping Industry plays a crucial role in Indian economy. As 90% of
the Nations trade by volume is done via sea. India has been the largest merchant
shipping fleet among the developing nations. The Indian Shipping Industry
supports transportation of national and international cargoes and also provides
various other facilities such as ship building, ship repairing, lighthouse facilities,
freight forwarding, etc. Indian Shipping Industry with emergence of globalization
and liberalization is firmly ready to acquire new dimensions in terms of demand
and infrastructural development.
In order to sustain itself with the stiff competition posed by foreign companies,
the Indian industry is striving hard to bring about rapid transformation. Over the
years the way cargo traffic was handled has changed. Initially it was by the

173
protected environment by the tonnage committee who decided as to what type
and size of ships the companies should be given a chance.
Government subsidy vessels were only assured for the Cargo was assured.
Recently after a long period of decline, both tonnage and fleet size have grown,
with the addition of ships — tugs, survey vessels, towing vessels as well as pilot
vessels belonging to ports and maritime boards.
Historically Shipping industry has catered to only domestic shipping
requirements, while the private sector companies like Great Eastern Shipping
Company and Essar Shipping are increasingly getting involved in international
cross trade..
Shipping Industry is meaning not only just vessels and tonnage. Shipping
capabilities of any country are not solely measured in terms of the quantum of
tonnage under control. While in knowledge based economy, soft intangible
parameters like human capital, information technology and expertise are
becoming increasingly important for increasing innumerable opportunities. Today
India has become the source of quality seafarers to global ship owners. Indian
shipping firms normally rely on the inherent IT skills of Indians to play a pivotal
role in IT activity involved in international shipping and the country can come up
with a business center for information processing requirements of the
international ship owners..
For acquisition of such companies the Automatic approval is also available even
for the categories which are not covered under OGL i.e. barges, tugs and boats,
etc. Shipping companies have been given liberty to retain sale proceeds of their
ships abroad and utilize them for fresh acquisition Approval for foreign direct
investment up to 74% is also provided by the Time Charter of ships by Indian
Shipping Companies. 140 shipping companies were in operation in India at the
end of March 2003, with the Shipping Corporation of India being the biggest in
the country claiming a 42% share of the total Indian tonnage. The country

174
presently has 12 major ports, 184 other ports, nine shipyards and a coastline of
7517 km.
Western Coast Eastern Coast
Kandla (child of partition) Kolkata-Haldia (riverine port)
Mumbai (busiest and biggest) Paradip (exports raw iron to Japan)
Jawahar Lal Nehru (fastest growing) Vishakjapatnam (deepest port)
Marmugao (naval base also) Chennai (oldest and artifical)
Mangalore (exports Kudremukh iron-
ore)
Ennore (most modern-in private
hands)
Cochin (natural Harbour) Tuticorin (southernmost )
SIZE OF THE INDUSTRY
Indian shipping Industry has become the 14th largest fleet in the world as per
deadweight tonnage. The shipping fleet of India consists of around 515 vessels
with a girt of 7.06 million and dwt of 11.5 million ones. It has about 616 ships,
with a total capacity of 6.62 million tons Gross Registered Tonnage (GRT). Out of
which about 258 ships are engaged in overseas trade and the rest ply inland
routes.
TOTAL CONTRIBUTION TO THE ECONOMY / SALES
When compared to World Shipping Tonnage the share of Indian Shipping
Tonnage as in term of tonnage (GT) by Flag of Registration stood at 1.19% on
1.1.2006, 1.1.2007 at 1.16% and 1.18% on 1.1.2008 as per data available
GDP OF INDIA
Year March June September December

175
2008 8.50 7.80 7.50 6.10
2009 5.80 6.00 8.60 6.50
2010 8.60 8.90 8.90 8.20
GDP BY SECTOR WISE(2010)
Sector GDP Growth Rate
Manufacturing 9.8 percent
Farming 4.4 percent
Construction 8.8 percent
Mining 8 percent
Service 9.8 percent
The primary demand and supply driver in the shipping industry in fright rates,
which determine the revenue of shipping companies.
trade growth
geographical concentration of trade
threat of wars, piracy, storm and hurricanes
governments sanctions on shipment
access to and suitability of other modes of shipments
The supply drivers of the industry include:
demand for oil and dry bulk
climate conditions
government restriction on shipment
INDIAN INDUSTRIES
Classified
under RED category
Aluminums industry, Cement
industry, Construction industry, Copper
industry, Dairy industry, Diamond
industry, Fashion industry, Fertilizer industry, Film
industry, Granite industry, Health care
industry, Jewelers industry, Mining industry, Oil

176
industry, Paint industry, Paper industry, Power
industry, Printing industry, Rubber
industry, industry, Soap, Steel industry, Sugar
industry, Textile industry, Tobacco industry, Zinc
industry
Classified
under ORANGE category
Automobile industry, Cotton industry, Hotel
industry, Jute industry, Pharmaceutical
industry, Tractor industry, Weaving industry
Classified
under GREEN category
Advertising industry, Agricultural industry, Aviation
industry, industry, Biotechnology, Biscuit
industry, Chocolate industry, Coir
industry, Cosmetic industry, Cottage
industry, Electronic industry, Food Processing
industry, Furniture industry, Garment
industry, Insurance industry, IT industry, Leather
industry, Music industry, Mutual fund
industry, Pearl industry, Plastic industry, Poultry
industry, Railway industry, Real estate
industry, Shipping industry, Solar industry
STRUCTURE OF EGYPTIAN SHIPPING INDUSTRY
There are different types of shipping companies around the world. These
shipping companies function according to their specialization. The common
services that the shipping companies perform are- warehousing, overseas
removal, shipping vehicles and containers overseas, freight forwarding and so on
STRUCTURE OF THE SHIPPING INDUSTRY

177
STRUCTURE OF INDIAN SHIPPING INDUSTRY
The 6,000 km long Indian coastline has 12 major ports and 181 minor/
intermediate ports out of which 139 are operable. Indian Ports are the gateways
to India's international trade by sea and are handling over 90% of foreign trade.
The major ports are located at Calcutta/ Haldia, Chennai, Cochin, Ennore,
Jawaharlal Nehru Port at Nhava Sheva, Kandla, Mormugao, Mumbai, New
Mangalore, Paradip, Tuticorin and Vishakhapatnam.
The 12 major Indian ports, which are managed by the Port Trust of India under
Central Government jurisdiction, handle 90 percent of the all-India port
throughput, and thus bear the brunt of sea borne trade. The 139 minor ports are
under the jurisdiction of the respective State Governments. Dry and liquid bulk
make up about 80 percent of the port traffic in volume with general cargo,
including the containerized cargo, constituting the remaining traffic.
The Indian ports sector is poised for significant growth driven by new
manufacturing and power projects and higher cargo traffic at ports. Increase in
containerized trade coupled with the Government‘s active initiatives to develop
the Indian ports sector, is expected to further boost the growth. The
STATE OWN PORTS PRIVET PORTS
100% OWN PORT ACCORDING TO
INVESTMENT AND
LAW
ARAB JOINT
VENTURE

178
commissioning of power projects based on imported coal and the setting up of
steel projects and offshore exploration and production projects are likely to drive
the Indian ports sector.
The situation of limited capacity and high demand has inevitably resulted in port
congestion. This results in overstretched berths leading to pre-berthing delays
and longer ship turnaround time. In recent years, major investments in port
construction have centered on container as well as bulk facilities. Modern
equipment exists for container and bulk handling. The equipment- mix for
handling general cargo has to be planned and provided in a manner that suits the
needs of each port.
The performance of Indian ports does not compare favorably with that of efficient
international ports. On three important parameters- capacity, productivity and
efficiency, Indian ports lack in comparison to some of the major international
ports. In international terms, labor and equipment productivity levels are still very
low due to the outdated equipment, poor training, low equipment handling levels
by labor, uneconomic labor practices, and idle time at berth, time loss at shift
change and high mining scales and low datum‘s.
THE MAIN SERVICES OF SHIPPING INDUSTRY:
Specialized vessels
The specialized vessels cells are part of the bulk carrier & tanker division,
and deals with operation and manage of liquefied petroleum gas carrier
and chemical carrier.
Shipping Agency:

179
Serving all Types of Vessels (Open Dead Weight) berthing in all Egyptian
ports and Suez Canal
Loading & unloading all sorts of cargo:
Under the decree No. 50 of the year 1998; the company handles General
Cargo and Containers on both quays of Alexandria port and Dekheila port
with a high performance and achieving dispatch with safety assurance
Warehouse & Storage:
Under the decree No.39 of the year 1999; the company is authorized to
store all types of General Cargo, Bulk Cargo, FCL containers, Transit
Containers, and LCL containers, in Dekhiela port in our owned
warehouses.
Freight Forwarding Services:
Booking all types of containers FCL and LCL and Forwarding all types of
cargo.
Customs clearance :
To prepare the document and submit to custom officer for unload the
cargo from ship.
River Transportation:
Transport different types of cargo and specialized in transporting Cement
in Bags and Clinker, Transporting with barges of capacity up to 500
tons/barge for all kinds of Cargo locally and all over Egypt

180
Inland Transportation:
Operating several extensive fleets of trucks to enable it meeting the
increasing demand of local transportation all over Egypt
Bulk carrier
Chartering
Lighter age
Offshore
Shipbuilding consultancy
Provide Container
Passenger services
Break bulk
Cargo insurance
It is highly recommended that you insure your shipment against any
potential loss or damage during shipment. Accidents do happen and extra
costs incurred in insuring your cargo is well worth the protection it
provides. Sky 2 C Freight Systems, Inc. can arrange to insure your
shipment without any cumbersome application and approval process, as
long as it contains approved merchandise and is going to an approved
destination.
FUNCTIONS OF SHIPPING INDUSTRIES
Packaging:
There are lots of shipping firms that present special packaging alternatives to its
consumers. Boxes are also supplied to the consumers so that items can be
packed accordingly. As there are a number of firms which give shipping services,
you can conveniently opt for the greatest at a decrease value charge.

181
Various destinations:
Most of the expert and reputed worldwide shipping firms provide companies to a
extensive quantity of nations in the earth. Solutions are supplied to various global
airports all close to the community by experienced shipping firms. Some of the
best shipping firms offer a list of the nations in which their solutions are supplied
which helps make it effortless for customers to pick.
Prompt delivery:
Delivery of merchandise is prompt while availing the providers of a reputed
shipping firm. The firms make sure that the cargo reaches its vacation spot
perfectly previous to the deadline.
Tracking data:
Clients can track the position of their cargo while it is in transit by means of state-
of-the-art on-line tracking programs supplied by the corporations.
Eye-catching fees:
The global shipping organizations are recognized to charge reasonable rates for
transporting cargo.
Delivery and collection:
a single of the best rewards incorporates collection of the cargo and superb
packaging methods made use of by the shipping companies. The cargo is also
delivered promptly and in very good ailment.
Mode of transport:

182
A lot of of the worldwide shipping providers offer alternatives to their valued
prospects for picking the mode of transport.
Importance of shipping industries
1) Cheap means of Transport: - water transport is the third
important means of transport. It is the cheapest means of transport. It
does not require any fixed investment in railway line and roads.
2) Importance for Foreign Trade: - India‘s coastal belt stretches
to 7516 KM(including coastal belt of Andaman Nicobar and Lakshadweep)
in length and plays a significant role in the ever expanding external trade
of the country.
3) Helps to earn foreign exchange: - Shipping has helped India
earn foreign exchange which is badly needed for any developing country
for improving its Balance position.
4) Role in Defense: - Water transport plays a significant role in
defense of the country. This offers second line of defense.
5) Independent foreign policy: - Self sufficiency in water ways
helps a nation to pursue its foreign policy independent of the international
political pressures.
6) Helpful to industries: - shipping is helpful to industries as it
serves the industries with minimum possible freight cost.
IMPORT AND EXPORT POLICIES OF EGYPT

183
The new EXIM Policy has only two schemes namely the advance licensing
scheme (i.e., corresponding to the quantity- based advance license) and a new
scheme known as Duty Entitlement Pass Book (DEPB) scheme, which entitles
exporters to import goods duty-free for export production. Thus, it has reduced
the multiplicity of schemes which prevailed earlier, such as Quantity Based
Advance License, Value Based Advance License (N7ABAL), Special Value
Based Advance License for electronics and other sectors and the Pass Book
scheme.
Export obligation period &validity of the advance license have been enhanced
from 12 months to 18 months. Need to submit a large number of documents with
every application have been reviewed and the minimum number of documents
prescribed. Exports and Imports shall be free, except to the extent they are
regulated by the provisions of this Policy or any other law for the time being in
force.
Import documents: Commercial invoice, quotation, Bill of Lading, Radiation
Certificate:
Egypt‘s basic import duties on items 5% -50%, but does not include luxury goods
tariffs. Luxury goods, including cigarettes, alcohol and more than 1300CC engine
cars such as the customs duty rate up to 150%. Tariffs are available to pay the
Egyptian pound.
In 2010, the Central Bank relaxed a requirement of 100 percent foreign exchange
cover for Letters of Credit issued for the purchase of goods imported for resale,
reducing the requirement to 50 percent. Also in 2010, the Central Bank
temporarily suspended the foreign exchange cover requirement on meat, poultry,
and sugar imports in response to high levels of food price inflation.
EGYPT'S CUSTOMS DUTIES

184
Egypt is the most populous Arab nation.
With a population of 80 million, Egypt is the most populous Arab nation and one
of the largest economies in the region. According to the U.S. Department of
Commerce, in September 2004, Egyptian President Hosny Mubarak eliminated
administrative fees on imported goods--raw materials and basic goods--and
reduced tariffs by 40 percent.
Industrial Imports
According to the Egyptian Ministry of Finance, a September 2007 amendment
issued by Presidential Decree No. 39/2007 adjusted the customs duties on
imports to Egypt. Any equipment imported by hotels or any other branch of the
tourist industry--machinery or appliances, for example--will incur a duty of 20
percent of the value or the import tax itself, "whichever is lowest."
Fish and Livestock
Most meats will cost importers a customs tax of 5 percent in Egypt. Cow
products, whether fresh or frozen, incur no tax, according to the Egyptian Ministry
of Finance. Carcasses or half-carcasses of pig, whether fresh or frozen, incur a
customs tax of 20 percent, while pig shoulders or other cuts with bone included
incur a 30 percent customs tax. Meat from sheep or goats has no customs tax
associated with it.
Produce Olives, cucumbers and mushrooms come with a 10 percent customs
duty, while peas, chickpeas and other beans get 2 percent. Vegetables such as
corn, spinach, asparagus and potatoes incur a 5 percent duty, as do nuts.
Bananas and oranges get 20 percent and other fruits such as avocado,
pineapple and guava have 10 percent customs duties.
EGYPTIAN IMPORT DUTIES

185
Egypt's free trade zones, mostly tourist areas, are exempt from customs duties.
Egyptian customs duties aim to protect the local economy. According to the
Encyclopedia of the Nations, under-invoicing is a common concern in the
country, which prompts customs officials to actually add about 10 to 30 percent
of invoice value when calculating duties and taxes. Travelers and businesses can
benefit from a number of free zones around Egypt. Many of these are located in
the country's key tourist areas.
Import Shipment Documents
Importing items to Egypt requires complete import documents. The original
commercial invoice must be included in the shipment. This document should be
issued in a minimum of three copies. It should also include all pertinent details
about each item, its price details including all freight, packing, and other charges
and discounts, its net and gross weights, its country of origin and the full name
and address of the item's manufacturer.
Free Ports and Trade
Ravelers can take advantage of free zones in Egypt, which are exempt from
customs duties. These free ports include Port Said, Cairo, Alexandria, Ismailia,
Damietta, Safaga, Sohag and Suez. The country's free trade zones are divided
into two categories. The first one is established by the central government
administration, while the other is controlled by the local state government. A
company must secure a permit from the Egyptian government if conducting
business activities in free trade zones.
IMPORT AND EXPORT POLICIES OF INDIA
The Indian export policy mainly focuses on the increase the export of India. The
main objective of policy is to provide help to Indian industry to increase their

186
trade in foreign market. The Indian policy provides some incentive and benefit to
some export potential industry to export their product in international market.
The policy also tries to attract the foreign companies to invest in Indian market.
Also give some freedom for direct investment in India.
The export insensitive provided some domestic industry like….
Agricultural products
Handloom
Handicraft
Gems and jewelry
Leather and footwear
Marine sector
Electronic and IT hardware industry
Sport goods and toy
Green product and technology
The policy also becomes helpful hand to some way like….
Market diversification
Technological up gradation
Support to status holder
The Indian export import policy gives some financial help to above sector.
TYPES OF CUSTOM DUTY
Export duties are levied occasionally to mop up excess profitability in
international prices of goods in respect of which domestic prices may be low at
the given time. But the sweep of import duties is quite wide. Import duties are
generally of the following types:-
Basic Duty: - it may be at the standard rate or, in the case of import from some

187
other countries, at the preferential rate.
Additional customs duty: - equal to central excise duty livable on like goods
produced or manufactured in India. Additional duty is commonly referred to as
Countervailing duty or C.V.D. It is payable only if the imported article is such as,
if produced in India, its process of production would amount to 'manufacture' as
per the definition in Central Excise Act, 1944.
True Countervailing duty or additional duty of customs: - is levied to offset
the disadvantage to like Indian goods due to high excise duty on their inputs. It is
levied to provide a level playing field to indigenous goods which have to bear
various internal taxes. Value base for this additional duty would be as in the case
of C.V.D, under Customs Tariff Act, 1975 minus the retail sale price provision
Anti-dumping Duty/ Safeguard Duty: - for import of specified goods with a view
to protecting domestic industry from unfair injury. It would not apply to goods
imported by a 100% EOU (Export Oriented Units) and units in FTZ (Free Trade
Zones) and SEZ (Special Economic Zones). On export of goods, anti-dumping
duty is relatable only by way of a special brand rate of drawback. Safeguard
duties do not require the finding of unfair trade practice such as dumping or
subsidy on the part of exporting countries but they must not discriminate between
imports from different countries. Safeguard action is resorted to only if it has
been established that a sudden increase in imports has caused or threatens to
cause serious injury to the domestic industry
COMPARATIVE POSITION OR TRADE BETWEEN EGYPT AND INDIA
Egypt–India relations are bilateral relations between Egypt and India. Modern
Egypt–India relations go back to the contacts between Saad
Zaghloul and Mohandas Gandhi on the common goals of their respective
movements of independence.

188
In 1955, Egypt under Gamal Abdul Nasser and India under Jawaharlal
Nehru became the founders of the Non-Aligned Movement. During the 1956 War,
Nehru stood supporting Egypt to the point of threatening to withdraw his country
from the British Commonwealth. In 1967, following the Arab-Israeli war, India
supported Egypt and the Arabs.
In 1977, New Delhi described the visit of President Anwar al-Sadat to Jerusalem
as a "brave" move and considered the peace treaty between Egypt and Israel a
primary step on the path of a just settlement of the Middle East problem. Major
Egyptian exports to India include raw cotton, raw and manufactured fertilizers, oil
and oil products, organic and non-organic chemicals, leather and iron products.
Major imports into Egypt from India are cotton yarn, sesame, coffee, herbs,
tobacco and lentils. The Egyptian Ministry of Petroleum is also currently
negotiating the establishment of a natural gas-operated fertilizer plant with
another Indian company. In 2004 the Gas Authority of India Limited, bought 15%
of Egypt Nat Gas distribution and marketing company.
Former President Mubarak of Egypt visited India in 2008. During the visit he met
Prime Minister Manmohan Singh. India supports the sovereignty
of Egyptian borders, against the Sudanese.
Historians have long known that Egypt and India traded by land and sea during
the Roman era, in part because of texts detailing the commercial exchange of
luxury goods, including fabrics, spices and wine. Among their finds at the site
near Egypt's border with Sudan:more than 16 pounds (7 kilograms) of black
peppercorns, the largest stash of the prized Indian spice ever recovered from a
Roman archaeological site.
Ships would sail between Berenike and India during the summer, when monsoon
winds were strongest, Wendrich said. From Berenike, camel caravans probably
carried the goods 240 miles (386 kilometers) west to the Nile, where they were
shipped by boat to the Mediterranean port of Alexandria, she said.

189
This Indian cotton textile was excavated from a Roman trash dump in the ancient
Egyptian town of Berenike. Local Ababda nomads dig in one of the streets in
Berenike, which holds an array of artifacts that scientists say reveals an
"impressive" sea trade between the Roman Empire and India.
ECONOMIC RELATION
India is the fourth largest trade partner of Egypt after the US, Italy and Saudi
Arabia.
OIL
In 2003, Indian giant Reliance signed a contract with the Egyptian General
Petroleum Corporation (EGPC) to import 8 shipments of raw oil in 2003.
POWER
In 2008, India's KEC International Limited, received its largest order
worth 636 crore (US$139.92 million) from Egyptian Electricity Transmission
Company. The order was funded through the European Investment Bank and the
Egyptian National Bank. The order included design, supply and construction
of power transmission towers and laying of 196 km of transmission lines in
Egypt.
INVESTMENTS
In 2011, Egyptian investment in India was at about USD 30 million. El Sewedy
group, an Egyptian company, manufactures Electric meters in India. Another
Egyptian company, Orascom Telecom, used to have 10% stake in the then
Hutchinson-Essar which has since been bought by Vodafone.
TRADE BARRIERS OF IMPORT EXPORT IN EGYPT
SERVICES BARRIERS
General Agreement on Trade in Services (GATS) Commitments

190
Egypt has restrictions for most services sectors in which it has made General
Agreement on Trade in Services (GATS) commitments. These restrictions place
a 49 percent limit on foreign equity in construction and transport services. In the
computer services sector, larger contributions of foreign equity may be permitted,
such as when the Ministry of Communication and Information Technology
determines that such services are an integral part of a larger business model and
will benefit the country.
INSURANCE
Foreign firms may own up to 100 percent of Egyptian private insurance firms.
Investors acquiring more than a 10 percent stake in an insurance company
require approval from the Egyptian Insurance Supervisory Authority (EISA). A
2008 amendment to the insurance law made EISA more autonomous and
strengthened its role from administrative regulator to a risk-based and market-
sensitive regulator.
BANKING
No foreign bank seeking to establish a new bank in Egypt has been able to
obtain a license in the past 20 years, and in November 2009, the Central Bank
Governor reaffirmed that no new banks would be given licenses.
TELECOMMUNICATIONS
Despite the passage of a February 2003 law to allow for new telecommunications
companies in accords with Egypt's WTO commitments, Telecom Egypt continues
to hold a de facto monopoly since additional fixed-line licenses have not been
issued by the National Telecommunications Regulatory Authority (NTRA). The
NTRA postponed a plan to issue a second license in mid-2008, citing a lack of
interest in the international markets for fixed-line service.
TRANSPORTATION

191
The government is liberalizing maritime and air transportation services. The
government's monopoly on maritime transport ended with the passage of Law 1
of 1998, and the private sector now conducts most maritime activities including
loading, supplying, ship repair, and, increasingly, container handling.
COURIER AND EXPRESS DELIVERY SERVICES
Private courier and express delivery service suppliers seeking to operate in
Egypt must receive special authorization from the Egyptian National Postal
Organization (ENPO). In addition, although express delivery services constitute a
separate for-profit, premium delivery market, private express operators are
required to pay ENPO a "postal agency fee" of 10 percent of annual revenue
from shipments under 20 kilos.
OTHER SERVICES BARRIERS
Egypt maintains several other barriers to the provision of certain services by U.S.
and other foreign firms. Foreign motion pictures are subject to a screen quota,
and distributors may import only five prints of any foreign film. According to the
Egyptian labor law, foreigners cannot be employed as export and import customs
clearance officers, or as tourist guides.
INVESTMENT BARRIERS
Under the 1986 United States-Egypt Bilateral Investment Treaty (BIT), Egypt is
committed to maintaining an open investment regime. The BIT requires Egypt to
accord national and Most-Favored Nation (MFN) treatment (with certain
exceptions) to U.S. investors, to allow investors to make financial transfers freely
and promptly, and to adhere to international standards for expropriation and
compensation. The BIT also provides for binding international arbitration of
certain disputes.
ELECTRONIC COMMERCE

192
Egypt's Electronic Signature Law 15 of 2004 established the Information
Technology Industry Development Agency (ITIDA) to act as the e-signature
regulatory authority and to further develop the information technology sector in
Egypt.
The Ministry of State for Administrative Development (MSAD) is implementing an
e-government initiative to increase government efficiency, reduce services
provision time, establish new service delivery models, reduce government
expenses, and encourage e-procurement. For example, the e-tender portal,
established in August 2007, allows all government tenders to be published
online.
OPPORTUNITIES IN EGYPT
Egypt‘s positive momentum in recent years has been supported by far-
reaching Government-led reforms aimed at making Egypt more trade and
business friendly, the report states. This openness has seen Egypt rise up
the rankings of, among others, the World Bank Doing Business Survey
and World Economic Forum Global Enabling Trade Report. The same
surveys highlight opportunities to drive improvement in Egypt‘s
infrastructure, which is a key focus area of ―Connecting Egypt‖.
Freight infrastructure issues contribute to Egypt‘s high logistics costs (the
factors associated with the storage, transportation and delivery of goods).
According to Frost & Sullivan estimates, Egypt‘s logistics costs are around
20 percent of GDP, compared with the average of 10-12 percent for
developed economies.
Reduce logistics costs and optimize inbound, outbound and domestic
trade flows. It could help attract FDI and make Egypt an even more
attractive manufacturing location, as well as an international hub for
shipping and logistics. In fact, it could feasibly lead to Egypt capturing one

193
or two additional percentage points of GDP growth,‖ Frost & Sullivan‘s Mr
VG Ramakrishnan said at the launch of ―Connecting Egypt‖ in Cairo.
ports
According to official estimates, Egypt‘s total port capacity in 2025 is
expected to be around 244 million tons, but forecast demand will be 274
million tons. Accelerating productivity and expansion plans to meet these
potential shortfalls is essential, according to the research.
Inland Transportation
The report states that Egypt‘s inland infrastructure is the weakest link in
the country‘s freight transportation network and perhaps has the most to
gain from concerted investment and development.
Road
Roads account for more than 80 percent of total inland freight volumes.
But road quality, a lack of modern multi-lane highways, congestion and a
fragmented trucking sector hinder the rapid and reliable movement of
freight. As Egypt‘s roads will continue to be the primary mode for freight
carriage, more public and private investment and development should be
encouraged, according to the research.
Rail
The report suggests that Egypt needs to closely examine the potential
advantages of freight transportation by rail over road in terms of reliability,
safety and profitability.
Inland waterways
The Nile River has the potential to offer low cost, efficient, environment-
friendly freight transportation, which could take pressure off the country‘s

194
congested roads. Barges also provide economies of scale as they are
able to carry many times more cargo than even the heaviest of trucks.
Another economic advantage is that river infrastructure development is far
less costly than for either road or rail.
Logistics
Egypt‘s economic growth has exposed areas requiring attention in its
logistics environment, the report states. For example, the lack of
availability of high-quality storage and handling facilities offering value-
added services has in some cases required international manufacturers to
create their own facilities, rather than outsourcing logistics functions.
For most imports, tariff is assessed on an ad valorem basis applied to the c.i.f. (cost, insurance, freight) value. Egypt: Tariffs (percent ad valorem) on Textiles, Apparel, Footwear and Travel Goods
HS Chapter/Subheading Tariff Rate Range (%)
Yarn
-silk 5003-5006 0 - 5 -wool 5105-5110 5 -cotton 5204-5207 5 -other vegetable fiber 5306-5308 5 -man-made fiber 5401-5406/5501-5511 0 - 5 ........................
Woven Fabric
-silk 5007 10 -wool 5111-5113 10 -cotton 5208-5212 10 -other vegetable fiber 5309-5311 5 - 10 -man-made fiber 5407-5408/5512-5516 5 - 10 Knit Fabric 60 10 ........................
Non Woven Fabric 5603 5
Industrial Fabric 59 5 - 20 ........................
Apparel 61-62 5 - 30 Home Furnishings including: bed, bath, kitchen linens, etc................
63 5 - 30

195
........................
Carpet Footwear Travel Goods
57 64 4202
30 10-30 20 - 30
Additional Import Taxes and Fees--All goods are subject to a sales tax of 5 - 25 percent. An
excise duty is collected on cotton yarn. Samples/Temporary Entry--In general, Egyptian customs allows for commercial samples and
temporary imports for display purposes at officially recognized exhibitions or for sales promotion activities to enter the country duty free, with the exception of goods that are cited on the list of prohibited imports. Certain conditions do apply, however. Goods must not exceed a value of LE 500 or be suitable for resale, which must be apparent from the forwarding documents. If the party concerned does not meet these conditions, a deposit may have to be paid along with a signed declaration on Customs Form 93 that the goods will be re-exported. A refund will be issued upon proof of exportation.
Import Restrictions – Egypt
Standards – Egypt
Labeling – Egypt
Intellectual Property Rights – Egypt
Tax rate The standard rate of corporate income tax is 40%. The rate is 32% on profits arising from export operations and on profits of an industrial company as long as they arise from its industrial activities. Withholding Tax Any business operating in Egypt must withhold against any payments-- made to any contractor or supplier of goods or services-- the following basic percentages: Contracting and supplying: 1% Services: 3% Commissions: 10% Professional fees (under LE 500): 10% Professional fees (over LE 500): 15% Leasing of property or selling of goods for trading or manufacturing: 1% - 5% (to be added on the payee's tax liability account.

196
Corporate Tax Exemptions and Deductions
Almost all business expenses are deductible including depreciation, interest, royalties, rent, and profit sharing payments to employees, legal expenses, pension and Egyptian state social insurance contributions.
Profits of companies located in the free zones.
Capital gains are applicable in some cases of asset replacement.
All tax holidays granted under Investment Law No.8/1997.
Joint stock companies employing more than 50 employees and maintaining proper books of accounts are granted a tax holiday for a five-year period. Also, hotels and tourist projects are granted a tax holiday for a five-year period which can be extended to ten years if the project is located in a remote area.
For joint stock companies listed in the stock market, a deductible allowance is made that is equal to interest income, which can be earned on a bank deposit (currently 10.5 percent).
ESSAR SHIPPING LIMITED'S

197
LOGISTIC BUSINESS
The company, through its subsidiary Essar Logistics Ltd (ELL), provides logistics management, transshipment and port services. The company specialises in the handling, storage, distribution and movement of cargo by sea, road and rail. The company operates as an end-to-end logistics service provider. Services include cargo, transshipment, lighterage and trucking services to steel mills and oil refineries. ELL has made investments in acquiring assets for movement of project cargo. The company also provides lighterage support services and onshore and offshore logistics services by a fleet of transshipment assets which include 10 articulated barges, two floating cranes and six tugs.
The company also operates a fleet of 5,000 trucks to provide inland transportation of steel and petroleum products. It services the entire logistics requirements of Essar.
Essar Shipping Limited is a part of the multinational conglomerate Essar Group. Essar Shipping is an integrated logistics solution provider with investments in logistics services, sea transportation and oilfield drilling services. Essar's logistics business provides end-to-end logistics services \ from ships to lighterage services, intra-plant logistics and dispatch of finished products. We own transshipment assets to provide lighterage support services, and onshore and offshore logistics services. Our integrated business model provides opportunities to cater to the complete supply chain management services to clients in oil and gas, steel, and power generation industries, and focuses on the intrinsic and captive demand for transportation services, logistics and cargo handling infrastructure. With interests in crude and dry bulk carriers, port-to-plant logistics and oilfield services, the company continues to provide end-to-end logistics solutions to its customers in a very cost-effective manner. Our contracted revenue is based on long-term contracts with domestic and international clientele, catered by a diversified mix of assets. The company, as a philosophy, follows the conservative policy of entering into long-term contracts with reputed global oil and industrial majors, thereby ensuring assured cash flows and long-term profitability of the company, as well as hedging the company against spot market volatility. Most of our vessels have committed cargo contracts well into the next decade; committed cargo contracts of USD3.8 billion are to be serviced over the next 15 years.
RATIOS
Mar ' 11 Mar ' 10 Mar ' 09 Mar ' 08 Mar ' 07
Per share ratios
Adjusted EPS (Rs) -1.22 1.54 0.80 5.69 2.84

198
Mar ' 11 Mar ' 10 Mar ' 09 Mar ' 08 Mar ' 07
Adjusted cash EPS (Rs) 0.24 3.48 3.39 8.19 4.96
Reported EPS (Rs) 0.50 1.46 1.75 5.67 3.15
Reported cash EPS (Rs) 1.97 3.40 4.34 8.17 5.27
Dividend per share - - - - -
Operating profit per share (Rs) 2.64 5.39 4.47 4.17 7.15
Book value (excl rev res) per share (Rs) 66.63 117.46 116.44 72.08 53.79
Book value (incl rev res) per share (Rs.) 66.63 117.46 116.44 72.08 56.43
Net operating income per share (Rs) 11.86 16.70 16.62 18.22 24.04
Free reserves per share (Rs) - - -0.18 - 28.57
Profitability ratios
Operating margin (%) 22.25 32.27 26.88 22.86 29.75
Gross profit margin (%) 9.95 20.65 11.29 9.12 20.92
Net profit margin (%) 3.54 7.94 9.81 22.71 12.98
Adjusted cash margin (%) 1.68 18.91 19.03 32.79 20.48
Adjusted return on net worth (%) -1.82 1.30 0.68 7.88 5.27
Reported return on net worth (%) 0.76 1.24 1.50 7.86 5.84
Return on long term funds (%) 4.31 3.07 1.96 7.49 6.74
Leverage ratios
Long term debt / Equity 0.27 0.42 0.33 0.55 0.43
Total debt/equity 0.27 0.42 0.33 0.55 0.50
Owners fund as % of total source 78.71 70.06 74.87 64.22 66.39
Fixed assets turnover ratio 10.49 0.61 0.50 0.36 0.53
Liquidity ratios
Current ratio 3.22 12.93 7.88 0.52 7.08
Current ratio (inc. st loans) 3.22 12.93 7.88 0.52 1.93
Quick ratio 3.22 12.74 7.61 0.50 6.65

199
Mar ' 11 Mar ' 10 Mar ' 09 Mar ' 08 Mar ' 07
Inventory turnover ratio - 58.32 68.95 36.91 39.90
Payout ratios
Dividend payout ratio (net profit) - - - - -
Dividend payout ratio (cash profit) - - - - -
Earning retention ratio 100.00 100.00 100.00 100.00 100.00
Cash earnings retention ratio 100.00 100.00 100.00 100.00 100.00
Coverage ratios
Adjusted cash flow time total debt 74.81 14.42 11.55 4.90 5.49
Financial charges coverage ratio 1.14 2.00 2.70 5.22 3.33
Fin. charges cov.ratio (post tax) 1.44 1.96 3.07 4.91 3.39
Component ratios
Material cost component (% earnings) - - - - -
Selling cost Component - - - - 0.75
Exports as percent of total sales - - - - -
Import comp. in raw mat. consumed - - - - -
Long term assets / total Assets 0.95 0.88 0.95 0.91 0.87
Bonus component in equity capital (%) - - - - -
EGYPTIAN NAVIGATION COMPANY
Egyptian Navigation Company contributes in transferring goods to and from foreign ports through the owned merchant fleet which is composed of 12 vessels of various types , in addition to concluding regular navigational line between Egyptian, Syrian, Lebanese ports passing through surrounding ports . The company's market capital is LE 360,7 million distributed over 10 million shares with a par value of LE 10/share. It was listed in 2005.
200
National Navigation Company was established in 1981 to implement the strategy adopted by the Egyptian government aimed at developing the Egyptian commercial fleet by giving the opportunity to companies and individuals to own commercial vessels without a maximum payload.
National Navigation Company is considered the largest shipping Egyptian company specialized in shipping dry cargo among the world‘s largest ports. It is also responsible of conducting regular liner lines for vessels owned or chartered for shipping general cargo among ports in Northern and Western Europe, the Adriatic, the Black Sea, and the Mediterranean Sea. This is in addition to regular passenger transport among ports of Suez, Safaga, Jeddah and Yanbu.
Vission & mision
The National Navigation Company aims to be recognised as the first choice supplier of the highest quality services to the shipping industry with absolute regard for the safety and the marine environment.
The long term goals and aspirations of the National Navigation Company are to prevent human injury, ill health or loss of life, to avoid damage to the environment in particular to the marine environment and to the property by pursuing a policy of zero accidents and zero spills at sea.
Strategy
In order to achieve the objectives, the Company has established its Health, Safety, Environmental & Quality Policy, which is implemented throughout the Integrated Management System (IMS).

201
CONCLUSIONS
As Essar Shipping industry is leading shipping industry in India, having
more number of ports in India and Gujarat.
There in increase of business of shipping product and service on the both
the way from last five years that we can conclude from the previous data.
The products & services related with India that also is the most important
in comparing in both the countries.
As there is wide business opportunities in India for Shipping Sector.

202
Telecom Sector

203
TELECOM SECTOR IN
INDIA AND EGYPT

204
WTO Basic Telecom Agreement
As part of the strategic direction to reform the sector and engage Egypt in the
global information society, Egypt made commitments under the WTO-BTA (Basic
Telecom Agreement) for the liberalization of the telecom sector in 2002. This
milestone of reform triggered the following developments toward deregulation.
- Instant deregulation of the markets of data, Internet, and value-added services.
- Full market liberalization was achieved by the end of 2005.
- The deregulation of the mobile services market after the expiration of the four
- Year exclusivity period granted to the mobile operators in 1998.
- A grace period for the deregulation of the international voice market was
granted till the end of 2005.
- Egypt has adopted a technology neutral approach to licensing of -
telecommunications services to allow for innovation.
- There are no limitations on foreign capital participation in telecommunication
companies.
- Licensed international investors are required to participate in the transfer of
technology and development of local industry.
GAFTA
Egypt is currently involved in negotiations for further liberalization of the telecom
sector under the GAFTA (Greater Arab Free Trade Agreement).
Information Technology Agreement (ITA)
In 2003, Egypt joined the WTO Information Technology Agreement for reducing
custom tariffs on ICT related products. Since 2005, the IT sector has been
enjoying a complete exemption from customs duties on the imports of its
production inputs, such as raw materials and spare parts, in an attempt to both
promote the sector and meet Egypt's commitments to a WTO Information
Technology agreement.
205
While the commitment of Egypt was to be implemented in 2005 through
successive annual reductions of tariffs to 0 percent, Egypt chose to facilitate the
process and remove customs on IT products as a part of the tariff reform process
in 2004. The main objectives behind this reform were to promote innovation in
ICT, increase demand on ICT products and create more job opportunities.
Cooperation with the EU
MCIT and the Delegation of the European Commission in Egypt launched the
second phase of the New Approaches to Telecommunication Policy Program,
funded by the European Commission at a budget of €4 million.
The second phase of the New Approaches to Telecommunication Policy
Program aims to provide practical advice to regulatory authorities in ten MEDA
countries in order to assist regulatory authorities with telecommunications
regulatory reform, based on the key principles of the EU regulatory framework for
telecommunications. The meeting focused on developing regional cooperation
between the regulatory authorities of the ten countries, as well as with the EU.
Telecommunication Companies of Egypt:
Etisalat Egypt:
It is a Private company. It was founded in 2006. The Head Quarters is at Cairo,
Egypt. The number of Etisalat's Internet subscribers reportedly stands at 1.02
million. Etisalat has set a goal to reach full network coverage in all of Egypt,
With 3.75G technology. 3.75G is the latest technology that encapsulates some
protocols like UMTS, HSDPA and HSUPA.
Mobinil:

206
It is a Public company. It was founded in may 1998. The Head Quarters is at
Cairo, Egypt. Mobinil was the first telecom company to receive ISO 14001
certificate in Egypt and the Middle East. As of April 2010, Mobinil has had more
than 30 million subscribers. Coverage extends to more than 99% of the Egyptian
population.
Mobinil was the first to establish roaming agreements with the US and Canada,
as well as non-GSM Operators in South America extending its services to
countries such as Argentina, Brazil, Peru, and The Philippines, to name a few.
Vodafone Egypt
It is a Private company. It was founded in 1998. The Head Quarters is at Cairo,
Egypt. Vodafone Egypt is a telecommunications provider, covering a wide array
of voice and data exchange services, as well as 3G, ADSL and broadband
Internet services. Vodafone Egypt is Egypt‘s largest mobile operator, with a
6000-strong workforce that serves more than 28.8 million customers (September
2010) all over Egypt.
Nilesat
Nilesat is an Egyptian company, It was established in 1996 with the purpose of
operating Egyptian satellites and their associated ground control station and
uplinking facilities.
Telecomax Group
Telecomax Group is an Egyptian Joint Stock Company. Telecomax Group owns
three subsidiaries today; Telecomax Consult, Telecomax Networks & Telecomax
VAS.
Xceed

207
Xceed is a global provider of multi-lingual Business Process Outsourcing
(BPO) services. Xceed was established in 2001 to serve as the IT arm of
Telecom Egypt with a client base of more than 11 million subscribers. Xceed
serves to be one of the largest contact centers in the Southern Mediterranean
Region
5.1Telecom Companies in India
BSNL
The Bharat Sanchar Nigam Limited, country‘s largest cellular service operator
was set up in the year 2000. It is a state owned telecom company with its
headquarters located in New Delhi. BSNL is also the largest land line telephone
establishment in India. As of April, 2011 87.1 million users have been
reported to be BSNL users.
MTNL
Mahanagar Telephone Nigam Limited (MTNL) was set up in the year 1985, to
run telecom operations in the major metro cities of India, Mumbai and Delhi. Its
headquarters are based in Mumbai. MTNL was the first company in India to
initiate 3G services in India, having the brand name of “MTNL 3G Jadoo
Services” which provided options as Video call, Mobile TV, Mobile Broadband
etc to the customers.
Airtel
Also known as Bharti Airtel Limited was started in July 1995, with its head office
based in New Delhi. Airtel runs its operations in as many as 19 countries across
the world and is also ranked fifth as telecom service provider globally. As of April
2011, figures show that Airtel has over 164.61 million users which make it the
biggest mobile service operator in India. Its service includes both 2G and 3G
facilities.

208
Reliance Communications
Also known as RCOM was set up in 2004, with its head office in Navi Mumbai.
Reliance Communications as of now has more than 128 million users all
across the world.
Aircel
Aircel was founded in 1999, with its head office in New Delhi. It is a joint
enterprise between Maxis Communications and the Apollo Hospitals.
Vodafone Essar
Vodafone Essar was founded in 1994 with its head office at Mumbai. Vodafone
provides services to 23 telecom circles across India
Tata Indicom
The Tata Teleservices was founded in 1996, with its headquarters in Navi
Mumbai.
Idea Cellular
Idea Cellular was started in 1995, with its head office in Mumbai. It also provides
3G services to its subscribers.
Virgin Mobile
Virgin Mobile started its services in India in 2008, March. It is a U.K. based
company.
Uninor
This Company is a joint venture between Telenor Group and Unitech Group and
was started in 2009.

209
5.2 STUDY OF DUTY STRUCTURE OF TELECOM EGYPT
IMPORT POLICIES
In recent years, the government of Egypt has gradually liberalized its trade
regime and economic policies, although the reform process has been somewhat
halting. Under the leadership of Prime Minister Ahmed Nazif and a ministerial
economic team in place since 2004, the government has adopted a wide range
of reform measures.
However, a number of challenges to opening Egypt‘s markets remain, including a
need to reduce corruption, reform the cumbersome bureaucracy, and eliminate
non-science based health and safety standards.
Telecommunications
Telecom Egypt continues to hold a de facto monopoly. Despite Egypt‘s WTO
commitments to issue additional licenses, the National Telecommunications
Regulatory Authority (NTRA) postponed a plan to issue a second license in mid-
2008, citing a lack of interest by potential applications.
However, in October 2009, the NTRA began accepting local and international
bids for licenses to offer "triple play" services of data, voice, and video to
consumers, for which there is greater interest on the part of foreign
telecommunications operators.
The licenses for "triple-play" services are slated to be issued in 2010.
There is more competition in the mobile phone sector in Egypt with three private
companies – Etisalat, Mobinil, and Vodafone – serving the market

210
5.3 SPECIFIC COMPANY OF TELECOM SECTOR IN EGYPT
Telecom Egypt
Specific Company of Telecom sector in Egypt- Telecom Egypt
Years of Telecommunications of Telecom Egypt.
1854 witnessed the birth of Egypt's telecommunications industry. The first
telegraph line connecting Cairo and Alexandria was inaugurated early in
1854, forming the company that was later to become Telecom Egypt.
In 1918, the Egyptian Government nationalized the Eastern Telephone
Company for 755,000 L.E. and created the Telephone & Telegraph Authority,
a forerunner of Telecom Egypt.
In 1978, with a capacity of 120 channels, the first earth station linking Egypt
by satellite to the rest of the world was opened in Maadi.
Telecom Egypt launched its first mobile services in November 1996.
Telecom Egypt was transformed into a joint stock company in 1998, the
Egyptian Government maintaining 100% ownership of the 171,121,490
shares in issue.
In December 2003, Telecom Egypt acquired an 8.6% ownership stake in
Vodafone Egypt.
Telecom Egypt obtained an additional ownership stake of 16.9% in Vodafone
Egypt in January 2005, bringing total ownership to 25.5%.
In February 2005, Telecom Egypt issued the largest corporate bond in Egypt
to date, raising EGP 2 billion.
On November 14th 2005, the Egyptian Government announced the launch of
an initial public offering of its Telecom Egypt shares and GDRs to retail
investors in Egypt and institutional investors internationally. The Offer

211
represented 20% of Telecom Egypt's outstanding share capital and raised
over $US 890 million. At the time of the Offer, it was the largest international
equity offering to come out of the Middle East and North Africa region.
On December 14th 2005, Telecom Egypt shares and GDRs commenced
trading on the Cairo and Alexandria and London Stock Exchanges.
On February 22nd 2006, Telecom Egypt‘s joint venture launched commercial
services in Algeria under the brand name ―Lacom‖.
On October 2nd 2006, Telecom Egypt announced the outcome of its Public
Tender Offer to acquire an additional stake of up to 24.4% of Vodafone Egypt.
Telecom Egypt's shareholding stake in Vodafone Egypt reached 48.97% .
On November 8th 2006, Vodafone Group and Telecom Egypt announced
that they entered into a new strategic partnership to increase cooperation
between both parties and to jointly develop a range of products and services
for the Egyptian market. Telecom Egypt‘s shareholding stake in Vodafone
Egypt reached 44.66% after tendering 4.31% of Vodafone Egypt to Vodafone.
A couple of months later, Telecom Egypt bought around 320,000 shares of
Vodafone Egypt bringing up its shareholding stake from 44.66% to 44.79% in
Vodafone Egypt.
In November 2006, Telecom Egypt‘s internet subsidiary TE Data launched
the first IP-TV based entertainment service in Egypt
In September 2008, Telecom Egypt bought around 370,000 shares of
Vodafone Egypt bringing up its shareholding stake from 44.79% to 44.95% in
Vodafone Egypt.
In September 2009, Telecom Egypt & Vodafone Egypt signed a 3-year
agreement for the provision of wholesale telecommunications services. The
deal comprises two distinct elements: Utilizing TE international gateway
services to transit all VFE customers incoming and outgoing international
traffic plus relying on TE extensive domestic network for all VFE infrastructure

212
leasing needs.
In January 2010, Telecom Egypt acquired the remaining 4.95% of TE Data‘s
Stake, to have full ownership of its broadband subsidiary.
In December 2010, Telecom Egypt made several changes to its
organizational structure which support TE‘s strategic objectives. Three new
Senior Vice President (SVP) positions have been created, which report
directly to TE‘s CEO and Managing Director Tarek Tantawy, and three Vice
Presidents (VP) have been promoted to the newly created positions.
About Telecom Egypt
Telecom Egypt (TE), Egypt‘s incumbent telecommunications operator, started its
operations in 1854 withthe first telegraph line in Egypt. Then it was corporatized
in 1998 to replace the former Arab Republic ofEgypt National Telecommunication
Organization (ARENTO). The Company is the largest provider offixed-line
services in the Middle East and Africa with 11.23 million subscribers as at the
end of December2007.
TE provides retail telecommunication services including access, local, long
distance and internationalvoice, Internet and data, and other services. The
company also provides wholesale services includingbandwidth capacity leasing
to ISPs, and national and international interconnection services. TelecomEgypt‘s
services also include the provision of narrowband and broadband internet access
throughitssubsidiary TE Data. TE Data has active operations in Egypt and
Jordan.TE currently participates in the mobile segment in Egypt by providing
mobile interconnectivity through itscurrent, increased 44.79% holding in
Vodafone Egypt, one of the three existing Egyptian mobileoperators.

213
TE‘s shares and GDRs (Ticker: ETEL.CA; TEEG.LN) are traded on the Cairo and
Alexandria StockExchanges and the London Stock Exchange.
The Largest Communication Network in Egypt and the Middle East
Telecom Egypt truly sits at the heart of Egypt‘s telecommunications market for
more than 150 years, it is continuing to serve the Egyptian market with
subscriber numbers in Egypt growing to be over 11.4 million. This is one of the
largest numbers of fixed line subscribers in the Arab world, Middle East & Africa.
Telecom Egypt is the main sponsor for telecommunications and information
technology industry in Egypt and as such feels a deep sense of responsibility for
the advancement of technology-related fields.
The main purpose of the company includes establishing communication network,
providing communication services, and operating and maintaining the network,
equipment and machinery necessary to provide the services.
Telecom Egypt has been corporatized since 1998 and has become a private
company fully owned by the state. In December 2005, 20% of TE shares were
sold by the Egyptian government represented by the Ministry of Communications
& Information Technology to retail and institutional investors across Egypt, The
Middle East & internationally. The offering which was the biggest international
offering out of the Middle East & North Africa to date, expanded TE shareholder
base to include over 250,000 investors across Egypt, the region, Europe & the
US.
There are three pillars to Telecom Egypt‘s future strategy: optimizing its sate-of-
the-art network, servicing the growing demand for broadband internet and data
services and leveraging its expertise overseas
Telecom Egypt employees protest for wages
Employees of Telecom Egypt Company have staged a protest seeking better
wages, a revision in the pay structure of the staff and the

214
The protest at Telecom Egypt began at 9AM today when thousands of workers
demonstrated in front of the Ramses branch of the company, stating their
demands, which include raises by 10 per cent and sacking the company's
managing director, Tarek Tantawi, threatining an open sit-in if their demands are
not met.
The demonstration later spread to other branches including those in Zamalek
and Heliopolis.
Workers rejected negotiating with Tantawi and insisted on directing their
complaints to Minister of Communications and Information Technology Tarek
Kamel directly.
The headquarters of Telecom Egypt in the Smart Village also witnessed some
strikes yesterday.

215
6.2 Telecom Subscribers
A new report issued by the Egyptian Ministry of Telecommunications said that
Telecom Egypt have lost 700,000 subscribers through the end of April 2011. The
company‘s total number of subscribers reached 8.94 million people, with a
monthly decrease of 7.41 percent, according to the report.
In March 2010, the number of subscribers was recorded to be 9.6 million.
Experts say mobile companies are to blame for the decrease in interest in fixed
line services.
Telecom Egypt, formerly the National Body for Telecommunications, became a
joint stock company in 1998, only two years after the first GSM mobile phone
service was introduced in the country. It is also hoping to enter the mobile phone
market and is expected to pitch for Egypt‘s 4th mobile license later this year or
next year.
CAIRO: The number of mobile subscribers in Egypt reached 70.66 million in
December 2010, up from 55.232 million in December 2009, according to figures
released by the Information and Decision Support Center.
This is an increase of about 27.7 percent or 15.308 million users over the past
year. Egypt has a population of more than 80 million people. He added that
compared to the growth rate that was seen from 2007-2009, such as the 34
percent growth that was seen in 2009, the past year actually saw a decline.
Mobinil's stake increases to 45 % of Egypt’s mobile subscribers
Arab Finance: Egyptian Company for Mobile Services (Mobinil) - (EMOB)
maintained its market precedence as it increased its stake to 45 % of total

216
subscribers till the end of last July, compared to Vodafone Egypt‘s 38.9 % and
Etisalat Egypt‘s 16.1 %.
Mobinil‘s subscribers reached 34.9 million by end of July, compared to 33.8
million subscribers in the previous month, Almal newspaper reported.
Vodafone‘s subscribers retreated to 30.25 million, compared to 30.35 million
subscribers in the same comparable period; while Etisalat‘s subscribers
increased to 12.5 million compared to 12.24 million.
It is worth noting that, Mobinil acquired 1.6 million mobile subscribers from total
mobile market increase during July which amount to 1.33 million. In terms of the
competition, the current year should see Mobinil and Vodafone continue to
contend for the number one spot and trade back and forth, but in terms of
revenue share, Vodafone is expected to remain on top.
Egypt-Convergence, Broadband and Internet Markets Report
Due to the successful implementation of a free Internet strategy in 2002, Egypt
now has the largest Internet market in Africa with more than five million users in
early 2006. However, Internet penetration is still relatively low and the vast
majority of users are located in urban areas. The sector is highly competitive with
around 300 Internet and data service providers. A broadband initiative launched
by the government in 2003 will increase the number of broadband connections
ten-fold within three years and has brought 24Mb/s ADSL2+ access to residential
households.
Egypt-Mobile Market, Overview and Statistics Report
Egypt‘s mobile market has consistently grown at around 30% per year but
accelerated to 67% in 2005 in anticipation of the country‘s third mobile licence
which was awarded in July 2006, including a concession for both 2G and Third
Generation (3G) mobile services. The record price that was paid for the licence

217
indicates the potential that is seen in the Egyptian mobile market, at less than
20% market penetration which is about equally shared between two GSM
operators. Both existing networks have launched a range of mobile data and
information services. This report outlines the major developments in the market,
with relevant statistics and profiles of the country mobile operators.
Egypt’s MCIT: Egypt Has 23.51 Million Internet Users, 71.46 Million Mobile
Subscribers & 3972 ICT Companies
Egypt‘s Ministry of communications and information technology (MCIT) has
released ICT indicators in brief for February of 2011. The report says that there
are 71.46 million Mobile subscribers in January growing at 1.13 % from previous
month with annual growth at 27.95% while Mobile penetration rate is at 91.32 %.
As for the Internet the report says that there are 23.51 millions internet users in
January growing at 2.12% from previous month and growing 39.61% annually.
Internet penetration rate in January was 30.05% from the population growing at

218
8.14% annually. While the Proportion of households using the internet from home
was 32.76% growing at 7.25% annually.
Another interesting point from the report is that the number of Internet Mobile
subscribers is a growing trend: as in January 11.32% of Mobile subscribers use
Internet via mobile handsets that is around 8.09 million mobile internet users,
ADSL subscribers are 1429.40 thousand.
As for the number of ICT companies ( Information and communications
technology companies) the number is 3972 companies in January growing
around 1% over the previous month and 13.49% over the previous year, these
companies employed 205.28 thousand people and have issues capital of
44870.5 Million Egyptian Pounds.
6.3 Indian telecom sector
6.4 SWOT ANALYSIS OF MAHANAGAR TELEPHONE NIGAM LIMITED
Strengths
Weaknesses
1. MTNL is one of the NAVRATNA companies.
2. The company enjoys large consumer base in NEW DELHI.
3. Being a Govt. company , it enjoys a strong reliability among users.
4. High on cash.
1. Poor marketing 2. Slow on implementation 3. It does not provide good
network. 4. Bureaucratic organizational
structure
Opportunities
Threats
1. There is a strong growth in telecom industry.
1. Private players in telecom industry.
2. Competitors regularly come up with new attractive call rates, tariff

219
2. It can provide value added services i.e., e-banking, e- reservation etc.
3. It can cover others metros ( Banglore and Kolkata) of India.
vouchers and value added services.
3. Competitors continuously improving their distribution channel.
SWOT ANALYSIS OF RELIANCE COMMUNICATION
Strength Weakness
• Low Entry Cost
• Commission Structure
• Fast Activation Process
• Network
• Connectivity
• Data GPRS
Branding Image
• Distribution problem
• Limited product portfolio- Only Mobile
• Lack of Competitive Strength
• Limited Budget
Opportunity Threat
Preference of GSM over CDMA
• New Specialist Application
• Rural Telephony
• New Market, Vertical, Horizontal
• Competitors` Vulnerabilities
• Political destabilization.
• New Entrants
• IT Development
• Market Demand
• Seasonality, Weather Effects

220

221
ETISALAT – INDIA (Reliance Communications tie-up)
In 2009 Etisalat has announced that its Indian unit, erstwhile Swan Telecom (owned by
Dynamix Balwas Realty and Reliance Communications), headquartered in Mumbai, is
renamed to Etisalat DB Telecom India Pvt. Ltd. The business unit has been awarded
Unified Services Access License in 15 circles – Andhra Pradesh, Delhi, Gujarat,
Haryana, Karnataka, Kerala, Maharashtra, Mumbai, Punjab, Rajasthan, Tamil Nadu
(including Chennai), Uttar Pradesh (East), Uttar Pradesh (West), Madhya Pradesh and
Bihar. In April 2010 Etisalat began signal testing in Chennai [IND 922], Delhi & NCR
[IND 913], Maharashtra & Goa [IND 919], Mumbai [IND 916] and Gujarat[IND 914]. In
May 2010, Etisalat was in talks to buy 25% stake in Reliance Communications but the
deal was not finalised.

222
OPPORTUNITY FOR RELIANCE COMMUNICATION
There is a great scope for reliance communication and Etisalat to come again together
and have a joint venture in Egypt as well as in India. In future the deal may get finalized.
Steps must be taken to encourage this joint venture.
SWOT ANALYSIS FOR AIRTEL
STRENGTH WEAKNESS
― Very focused on telecom. ― Leadership in fast growing
cellular segment.
― Pan-India footprint. ― The only Indian operator, other
than VSNL, that has an international submarine cable.
― Price Competition from BSNL and MTNL
― Untapped Rural market
OPPORTUNITIES THREATS
― The fast-expanding IPLCmarket. ― Latest technology and low-cost
advantage.
― Huge market.
― Competition from other cellular and mobile operators.
― Saturation point in Basic telephony service
SWOT ANALYSIS OF TATA TELESERVICES LIMITED
Strength Weakness
― Flexible plans
― Good ― High brand visibility ― Celebrity brand ambassadors ― Ability to attract customers with
various plans
― Good command in the internet market
― Price competition from BSNL and MTNL
― Untapped Rural Market

223
Opportunity Threats
― Fast expanding cellular market ― Latest and low cost technology ― Untapped rural market ― Value added services
― Competitors low price offering ― Saturation point in Basic
telephony service
― Mobile Number Portability
SWOT ANALYSIS OF BSNL
STRENTHS WEAKNESSES
Pan-India reach
Experienced telecom service
provider
Total telecom service provider
Huge Resources (financial &
technical pool)
Huge customer base
Most trusted telecom brand
Transparency in billing
Easy deployment of new
services
Copper in last mile can be
used for easy broadband
deployment
Huge Optical Fibre network
and associated bandwidth
Non-optimization of network capabilities
Poor marketing strategy
Bureaucratic organizational set up
Inflexibility in mindset (DOT period
legacies)
Limited number of value added services
Poor franchisee network
Legacy of poor service image
Huge and aged manpower
Procedural delays
Lack of strategic alliances
Problems associated with incumbency
like outdated technologies, unproductive
rural assets, social obligations, political
interference,
Poor IT penetration within organization
Poor knowledge Management
OPPORTUNITIES THREATS

224
Tremendous market growing
at 20 lac customers per month
Untapped broadband services
Untouched international
market
Can capitalize on public sector
image to grab government‘s
ICT initiatives
ITEB service markets
Diversification of business to
turn-key projects
Leveraging the brand image to
source funds
Almost un-invaded VSAT
market
Fuller utilization of slack
resources
Broaden market expected from
convergence of broadcasting,
telecom and entertainment
industry
Competition from private operators
Keeping pace with fast technological
changes
Market maturity in basic telephone
segment
Manpower churning
Multinational eyeing Indian telecom
market
Private operators demand for sharing
last mile
Decreasing per line revenues due to
competitive pricing
Private operators demand to do away
with ADC can seriously effect revenues
Populist policies of government like
―OneIndia‖ rates

225
CONCLUSION
Tata Communications' partnership agreement with TE Data will link customers in Egypt
with the rest of the world via our rapidly growing network.
The seamless integration of Tata Communications' high performance MPLS network
with TE Data's extensive network coverage in Egypt will provide superior connectivity to
India and to the world.
Africa and the Middle East are markets that are undergoing significant growth,and plan
on continuing to expand the relationship as part of a growing cooperation between Tata
Communications and TE Data.
Tata Communications also offers extended reach to over 150 countries through its VNO
Services division.
Etisalat was in talks to buy 25% stake in Reliance Communications but the deal was not
finalised.
In 2010, following the $39 billion 2G spectrum scam, Etisalat DB, the Indian subsidiary
of the company, was stopped from buying a stake in a Chennai-based company due to
objections raised by the Ministry of Home Affairs (MHA).
It raised objections about Etisalat's presence in Pakistan and it's connection with
Pakistan's intelligence agency ISI Etisalat owns a 26% stake in Pakistan
Telecommunications and has a subscriber base of 3 million in Afghanistan.
The MHA has also expressed concerns about the telecom surveillance software Etisalat
had used in a Blackberry service it had introduced in the UAE and recommended that
the company should not be allowed to offer Blackberry services in India.

226
The vice chairman, Shahid Balwa should not be involved in the operations of the
company in any capacity, because of his connections with underworld don Dawood
Ibrahim.
Due to Lack of goverment support RCOM could not expand it‘s business in Egypt.
Airtel is one of the biggest player in Indian telecom sector and its focus on it is very
strong.
Airtel is a leader in fast growing cellular market.
The only Indian operator, other than VSNL, that has an international submarine cable.
Its has also latest and low cost technology with it, which is very helpful in telecom sector
as the competition is very high in Indian telecom sector.
It has a very huge market. Which creates big opportunity, if the company want to go in
other country and like to give the same facility like India.
The Indian cellular market is expanding very fast. By using the new strategies Airtel
expands its scope into India by providing some unique facilities. i.e.: Airtel, recently
launch a service called ―Airtel Money‖, from which the customers can easily transfer the
money through mobile. Airtel is the 1st company which provides these services into
Indian market.
The competition level is very high in Indian telecom sector. Due to the competition the
company should aware about the consequences if it is going to launch new services in
to the market.
Mtnl is one of the large consumer base company in new delhi. The main problem of
company is that, it have bureaucractic organizational structure and poor marketing ,slow
in implementation and not good network. So MTNL is fail in telecom sector.

227
Also have more competion of the private players in telecom industry , they are always
come up with new attractive rates. Tarriff vouchers and new schemes. Competitors are
always continuously improving new distribution channel. so it is not sustain in the
telecom industry.
Egypt has made strides in its liberalisation plan, progressing largely according to
schedule. To date the NTRA is showing signs of a well-functioning regulator. While it is
fairly independent, it ultimately is governed by the MCIT minister, who also governs
Telecom Egypt. This lack of independence from the sector could potentially place it in a
conflict of interest.
Telecom Egypt faces a challenge in maintaining and expanding its profit level after
liberalisation. As a result, the liberalisation process is being carefully engineered to
allow it to keep its advantageous edge over competition.
While Egypt‘s liberalisation process is running relatively smoothly, its publication and
public participation processes leave a lot to be desired. There is, in effect, a
dichotomous approach towards liberalisation in Egypt: liberalisation of services and
technical applications, but limitations on the ―liberalization‖ of expression and on the
inclusion of public involvement in the decision- and policy-making processes in the
sector.

228
Reference:
http://bikyamasr.com/39163/telecom-egypt-reports-massive-user-losses/
http://www.internetworldstats.com/af/eg.htm
http://arabcrunch.com/2011/04/egypts-mcit-egypt-has-23-51-million-internet-users-71-
46-million-mobile-subscribers-3972-ict-companies.htm
http://www.itida.gov.eg/En/InvestinginEgypt/WhyEgypt/OnEnvironment/Pages/default.as
px

229
Aviation Sector
INDEX
PARTICULAR PAGE
NO
CHAPTER-1 2
1.1 EGYPTIAN AVIATION INDUSTRY 3
1.2 THE ROLE OF AVIATION SECTOR IN THE EGYPT ECONOMY 4
1.3 FUNCTION AND STATUS OF AVIATION IN INDIA 4
CHAPTER-2 6
2.1 BUSINEES ACTIVITIES OF JET AIRWAYS 7
2.2 Financial details of Jet Airways:- 8
CHAPTER-3 10
3.1 POLICIES AND NORMS FOR AVIATION SECTOR IN EGYPT 11
CHAPTER-4 15
4.1 PRESENT TRADE BARRIERS OF EGYPT FOR IMPORT/ EXPORT 16

230
CHAPTER-5 18
5.1 OPPORTUNITIES FOR JET AIRWAYS 19
5.2 OPERATION AND FINANCIAL HIGHLIGHTS OF JET AIRWAYS:- 20
5.3 BUSINESS MODEL OF AIRPORTS 22
5.4 COMPARISION OF COST OF STARTING BUSINESS IN EGYPT AND INDIA
23
CONCLUSION FROM INVESTMENT OPPORTUNITIES 27
KEY REASON TO INVEST IN EGYPT 28
REFERENCES 29
ANNEXTURE 30

231
CHAPTER-1

232
1.1 EGYPTIAN AVIATION INDUSTRY
Tourism is one of Egypt's most important economic industries which contribute
significance 12% in GDP. The expansion of tourism facilitates the growth of aviation
industry in Egypt. In 2010 there were 86 airports in Egypt. National Aviation is one of
the first Egyptian aviation service companies. The popular Egyptian aviations are Egypt
Air and Smart Aviation Company. The main income of the country comes from fees for
the usage of air navigation facilities and air navigation services. Such fees include
enroot charges and over flight charges that are based on tariffs regulated by the
Egyptian Civil Aviation Authority (ECAA).
Egypt Air Cargo becomes the market leader in Egypt. It has about 50% market share of
Egyptian Cargo market and its terminals handle about 65% of the total Cargo market in
Egypt.
Egypt's aviation sector has been expected to grow strongly for a long time, not only due
to it being a major touristic destination, but also due to its strategic location which, along
with the needed infrastructure, can make it one of the world's busiest air travel hubs.
Table-1 Carrier Departure worldwide
Country
Air transport, registered carrier departures worldwide
2007 2008 2009
India 569033 592292 601977
Egypt 51440 57510 56414

233
(Source: International Civil Aviation Organization, Civil Aviation Statistics of the World
and ICAO staff estimates)
The above table reveals the growth in airline business in India and Egypt.
1.2 THE ROLE OF AVIATION SECTOR IN THE EGYPT ECONOMY
Tourism has gradually become the pillar of the Egyptian economy. Now main income of
the country comes from fees for the usage of air navigation facilities and air navigation
services. The Increase in Travel & Tourism Industry contributes in GDP by 12 per cent
in 2011, adding US$1.6 billion to Travel & Tourism GDP. It generates 223,000 more
jobs in the Travel & Tourism industry in 2011 than would be generated in a non-
liberalized aviation environment. The overall GDP increased by 1.8% in 2011. The
favorable government policy attracts tourists from different countries. It pushed the
tourists‘ arrival from 11 million to 13.4 million in 2011.
1.3 FUNCTION AND STATUS OF AVIATION IN INDIA
(Source: CRISIL Research Report)
During 2003-04 to 2007-08, the domestic civil aviation industry underwent dramatic
changes, including the introduction of the domestic open skies policy, which led to
several new players entering the market. The arrival of low-cost carriers such as Air
Deccan, followed by SpiceJet, IndiGo and GoAir intensified competition for market
share that led to a drastic fall in ticket prices. Foreign direct investments caps in certain
sectors of the industry were raised and some private carriers were permitted to operate
overseas. Similarly, foreign carriers also got greater access to Indian airways, with the

234
opening up of international routes for non-metro airports. Besides these, the
government also began the modernisation of the Delhi and Mumbai airports and
announced the upgradation of 35 non-metro airports. Due to the above developments,
overall passenger traffic grew at a CAGR of 25 per cent in this period.
Total investments of Rs 656 billion in XIIth five year plan: -
According to initial estimates of the XIIth Five-Year Plan (2012-13 to 2016-17), the
Planning Commission is expecting investments of Rs 656.6 billion (at 2006-07 prices)
on airport development. But the expected investments during 2011-12 to 2015-16 to be
significantly lower at Rs 135-145 billion. The reason for lower investment can be the
key metro airports have either been already completed or are nearing completion. Also,
upcoming airport development opportunities are relatively smaller in scale. This coupled
with rising interest rates and funding constraints are expected to result in slower capital
expenditure plans, as most projects largely depend on debt funding. Investments during
2011-12 to 2015-16 are likely to be driven by the completion of the Mumbai and
Bengaluru airports, development of greenfield airports at, Navi Mumbai, Goa, Pune,
Kannur, Nagpur among others. The modernisation being carried out at 35 AAI
controlled airports is also expected to attract investments over the next 5 years.
Expected investments in airport infrastructure (2011-12 to 2015-16)

235
Source: Planning Commission, CRISIL Research
CHAPTER-2

236
2.1 BUSINEES ACTIVITIES OF JET AIRWAYS
Jet Airways India, with over 400 daily flights to 64 worldwide destinations, is the third
largest airline in India. This is the first airline in India that introduced low-cost airlines for
the frequent business travelers and people seeking rather economic air journey in India.
Jet Airways India, with its two low-cost airlines, namely JetLite and Jet Airways Konnect
offers low-cost air travels. The company, founded by Mr. Naresh Goyal, was
incorporated as an air taxi operator in 1992 and started its commercial operations in
India in 1993, is today a large conglomerate of all types of air buses, aircrafts and
everything that facilitates air journey worth it. The company has its own lounges in all
metros and international ports for its card holder members and premier passengers.
(www.jetairways.com)
Jet Airways currently operates a fleet of 97 aircraft, which includes 10 Boeing 777-300
ER aircraft, 12 Airbus A330-200 aircraft, 55 next generation Boeing 737-700/800/900
aircraft and 20 modern ATR 72-500 turboprop aircraft. With an average fleet age of 4.95
years, the airline has one of the youngest aircraft fleets in the world. Flights to 71
destinations span the length and breadth of India and beyond, including New York (both
JFK and Newark), Toronto, Brussels, London (Heathrow), Milan, Johannesburg, Hong
Kong, Singapore, Kuala Lumpur, Colombo, Bangkok, Kathmandu, Dhaka, Kuwait,
Bahrain, Muscat, Doha, Abu Dhabi, Dubai, Jeddah, Sharjah, Riyadh and Dammam.
The Jet Airways group maintains leadership position with 26.9% market share
Sep'10 Sep'09 % growth
Domestic Operations Rev Passengers
761322 555186 37.1

237
International Operations Rev Passengers
361928 265413 36.4
Jetlite Rev Passengers 308266 288876 6.7
The list of competitors: -
Airline Competitiveness Notes
Air India Direct Competitors 199 shared routes (48%), 63 shared destinations (15%)
Kingfisher Airlines Direct Competitors 197 shared routes (48%)
IndiGo Air Direct Competitors 137 shared routes (33%)
SpiceJet Very High 125 shared routes (30%)
Jet Lite High 71 shared routes (17%)
Air India Express Medium 37 shared routes (9%)
Go Air Medium 37 shared routes (9%)
2.2 Financial details of Jet Airways:-
1. In respect of its fixed assets: The Company has maintained proper records
showing full particulars, including quantitative details and situation of fixed
assets.
2. In respect of its inventories: The inventory has been physically verified during the
year by the management except inventory lying with third parties. In our opinion,
the frequency of verification is reasonable.
3. In respect of the loans, secured or unsecured, granted or taken by the Company
to / from companies, firms or other parties covered in the Register maintained
under Section 301 of the Companies Act, 1956: The Company has given interest
free loan to its wholly owned subsidiary company.
4. Increase in total net current asset from 64.44 crore to 394.92 crore is good for
the company.
5. The operating income is continuously increasing and reaches upto 12,782.52 in
the year 2011 it shows the financial strength of the company.

238
6. The tax charge is increase as compare to the last four years.
7. The company Reported net profit up to 9.69 in the year 2011 as compare to
losses in the previous years.
Profitability Ratio:- The gross margin is the increased 12.45% this indicates that the rate
in increase in cost of goods. Net profit margin this ratio improvement to 0.07 % in 2011.
The return on long term funds improvement to 14.31% in 2011.
Leverage Ratio:- The equity ratio indicates that only 16.11% of the total assets in 2011
is supplied by ordinary stockholder and this has shown a slight decrease from 16.8% in
2010. A highly equity ratio reflects a strong financial structure of the company. In 2011
this ratio is 0.72; they indicate a better efficiency in fixed assets utilization.
Liquidity Ratio:- In year 2010, 2011, and 2009 company is still able to support its short-
term debt to its current assets. The quick ratio are quickly converted assets into cash
here, the ratio is decrease. In 2010, 7370.16 it also tends there was little chance of the
firm holding damage or obsolete.

239

240
CHAPTER-3

241
3.1 POLICIES AND NORMS FOR AVIATION SECTOR IN EGYPT (According to Egypt aviation authority-subpart B)
1. Certification Requirements
a) Certificate required: The EMA grant a certificate authorizing the provision of
meteorological services varying from a single meteorological service to a range
of meteorological services supported by a network of meteorological offices
b) Site requirements: The EMA satisfies site requirements which shall establish
procedures to ensure that:
(1) Each of the meteorological offices and facilities listed in their exposition is
i. Sited and configured in accordance with security measures
designed to prevent unlawful or accidental interference;
ii. Provided with suitable power supplies and means to ensure
appropriate continuity of service.
(2) Each of the remote weather sensing facilities listed in their exposition is
installed and maintained in a technically appropriate position to ensure that
the facility provides an accurate representation of the local meteorological
conditions.
2. Basic weather reporting
Every person who provides a basic weather report shall be:
a) Utilize equipment that is suitable for the observations being made;
b) Employ a system for checking that equipment; and
c) Be trained to provide accurate basic weather reports.
3. Application for certificate
a) Each applicant for the grant of a meteorological service certificate shall:

242
1. Complete the meteorological services certification form issued by the EMA which
requires the following information:
i. Address for service in Egypt;
ii. The specific meteorological service to be provided;
iii. The aerodrome location or airspace designation at or within which the
Service will be provided; and
iv. Such other particulars relating to the applicant and the intended service as
may be required by the EMA as indicated on the form; and
(b) Submit:
1. The exposition required by this Part. And
2. Payment of appropriate application official fees;
(c) Each applicant shall include with the application; a schedule of proposed hours of
service for the first 12 months of operation and a summary of safety factors shall be
considered before seeking certification.
4. Issue of certificate
An applicant is entitled to a meteorological service certificate if the EMA is satisfied that:
a) The applicant meets the requirements of this Part.
b) The applicant, and the applicant‘s senior person or persons required by ECAR
are fit and proper persons;
c) The granting of the certificate is not contrary to the interests of aviation safety.
5. Privileges of certificate holder
a. A meteorological service certificate specifies the types of facilities that the
certificate holder is authorized to operate.

243
b. The holder of a meteorological service certificate may provide the
meteorological services listed on the holder‘s certificate provided that each
meteorological service, and the meteorological information supplied for
each meteorological service, and the location and airspace covered by
each meteorological service is listed in the certificate holder‘s exposition.
6. Duration of certificate
a. A meteorological service certificate may be granted or renewed for a
period of up to 2 years.
b. A meteorological service certificate remains in force until it expires or is
suspended or revoked
c. The holder of a meteorological service certificate that expires or is revoked
shall forthwith surrender the certificate to the EMA
d. The holder of a meteorological service certificate that is suspended, shall
forthwith produce the certificate to the EMA for appropriate endorsement.
7. Renewal of certificate
(a) An application for the renewal of a meteorological service certificate shall
be made on form and in a manner acceptable to EMA.
(b) The application shall be submitted to EMA before the application renewal
date specified on the certificate or, if no such date is specified, not less
than 30 days before the certificate expires.
8. Withdrawal of service
(a) Each holder of an ATS Certificate who wishes to permanently withdraw
meteorological services shall give the EMA at least 90 days notice of the
proposal and included in that notice a summary of factors considered in
arriving at this decision; and

244
(b) This outgoing provider of meteorological services certificate shall not
hinder the preparations and execution of transitional arrangements.
9. Impose a penalty, suspension or revocation penalties: - EMA may impose a
penalty (according to the Civil aviation Law N.28 item No.

245
CHAPTER-4

246
4.1 PRESENT TRADE BARRIERS OF EGYPT FOR IMPORT/ EXPORT
1. GENERAL AGREEMENT ON TRADE IN SERVICES (GATS) COMMITMENTS
Egypt has restrictions for most services sectors in which it has made General
Agreement on Trade in Services (GATS) commitments. These restrictions place a 49
percent limit on foreign equity in construction and transport services. Egypt restricts
companies from employing non-nationals for more than 10 percent of their workforce.
Limitations on foreign management also apply to computer-related services (60
percent of top-level management must be Egyptian after three years from the start-up
date of the venture). A prohibition on the acquisition of land by foreigners for
commercial purposes was amended in 2002 to allow such acquisition under certain
circumstances.
2. INSURANCE
Foreign firms may own up to 100 percent of Egyptian private insurance firms.
Investors acquiring more than a 10 percent stake in an insurance company require
approval from the Egyptian Insurance Supervisory Authority (EISA). A 2008
amendment to the insurance law made EISA more autonomous and strengthened its
role from administrative regulator to a risk-based and market-sensitive regulator.
3. BANKING
No foreign bank seeking to establish a new bank in Egypt has been able to obtain a
license in the past 20 years, and in November 2009, the Central Bank Governor
reaffirmed that no new banks would be given licenses. Since banking reform began in
2004, the government has divested itself from many joint venture banks, and
privatized the fully government-owned Bank of Alexandria in 2006.

247
4. COURIER AND EXPRESS DELIVERY SERVICES
Private courier and express delivery service suppliers seeking to operate in Egypt
must receive special authorization from the Egyptian National Postal Organization
(ENPO). In addition, although express delivery services constitute a separate for-
profit, premium delivery market, private express operators are required to pay ENPO a
"postal agency fee" of 10 percent of annual revenue from shipments under 20 kilos. In
2009, the government of Egypt proposed a new contract for private courier and
express delivery companies, which would grant ENPO even more extensive regulatory
oversight over the private express delivery sector by increasing considerably the fees
paid to ENPO and requiring private express delivery companies to receive prior ENPO
authorization for their prices and other polices.
5. OTHER SERVICES BARRIERS
Egypt maintains several other barriers to the provision of certain services by U.S. and
other foreign firms. Foreign motion pictures are subject to a screen quota, and
distributors may import only five prints of any foreign film. According to the Egyptian
labor law, foreigners cannot be employed as export and import customs clearance
officers, or as tourist guides.
6. INVESTMENT BARRIERS
Under the 1986 United States-Egypt Bilateral Investment Treaty (BIT), Egypt is
committed to maintaining an open investment regime. The BIT also provides for
binding international arbitration of certain disputes.
Based on a review of Egypt‘s investment policies, the OECD has invited Egypt to
adhere to the OECD Declaration on International Investment and Multinational
Enterprises. Egypt signed the Declaration in 2007, becoming the first Arab and first
African country to join. During this process, Egypt agreed to review the restrictions on

248
investors identified in the OECD‘s 2007 Investment Policy Review of Egypt, such as
certain limits in the tourism sector as well as the discriminatory treatment of foreign
investors in courier services.
CHAPTER-5

249
5.1 OPPORTUNITIES FOR JET AIRWAYS
Market Profile of Egypt:-
The Egyptian economy achieved real growth of 7.2% during FY 2007/08, close to its
level in 2006/07, but up from the 4.1% achieved just half a decade ago in 2003/04. Real GDP
per capita income also increased by 5.2% in 2007/08, compared to just 1.2% half a decade
ago. Signs of increased productivity in the Egyptian economy are also noted. Unemployment
continued declining to less than 8.4% in last quarter of 2007/08 from 8.9% in 2006/07, and
down from 11.1% in 2003/04. As identified by a recent IMF mission to Cairo, such growth is
―broad based and robust‖, with investments leading this economic wave starting FY 2005/06.
The economy is also gaining momentum and diversity.

250
5.2 OPERATION AND FINANCIAL HIGHLIGHTS OF JET AIRWAYS:-

251

252
5.3 BUSINESS MODEL OF AIRPORTS:- Source: CRISIL Research

253

254
5.4 COMPARISION OF COST OF STARTING BUSINESS IN EGYPT AND
INDIA:-
For comparison the overall cost were collected from the EIU report. Both
countries are rated according to its superiority over the other countries. Following codes
are assigned to companies to make it simpler and to avoid repetition.
INDIA - A EGYPT- B UNITS IN US $
A B
SERIES TITLE UNITS 2011 2011
Business Costs IN INDIA IN EGYPT RESULT
New staff
Top Management 2 year 104,484.00 208,272.00 A
Middle Management year 51,411.50 88,214.70 A
Senior Sales year 47,329.70 92,348.40 A
Professional / Junior Management year 17,921.60 24,119.50 A
Office and industrial rents
Office rents sq m/year 1,131.50 600 B
Industrial rents sq m/year 88.16 84 B
Construction costs - air conditioned office sq m 1,118.65 1,419.83 A
Construction costs - light industrial unit sq m 584.71 742.13 A
Transport costs
Diesel litre 0.79 0.11 B
Gasoline super litre 1.1 0.25 B
Air freight costs: import from London package 720.83 790.22 A
Air freight costs: import from New York package 689.64 709.92 A
Air freight costs: import from Tokyo package 393.42 1,030.83 A
Sea freight costs: import from Rotterdam container 2,383.25 2,677.94 A
Sea freight costs: import from Hong Kong container 3,545.58 6,190.88 A
Sea freight costs: import from Los Angeles container 4,661.73 4,637.36 B
Sea freight costs: export to Rotterdam container 4,211.79 1,018.22 B
Sea freight costs: export to Hong Kong container 1,018.78 1,584.47 A
Sea freight costs: export to Los Angeles container 3,196.79 4,007.71 A

255
Utilities
Electricity, industry kwh 0.13 0.11 B
Natural gas, industry 10^7
Kilocalories 66.61 63.83 B
Water, industry m3 1.04 0.05 B
Telephone connection, business line 7.26 147.91 A
Telephone monthly subscription, business line/month 2.9 2.87 B
Fixed line 3 minute local call, peak rate 0.02 0.02
Cellular 3 minute local call, peak rate 0.02 0.05 A
Fixed line 3 minute call to USA, peak rate 0.45 1.64 A
VOIP 3 minute local call 0.28 0.56 A
ADSL connection, business 10.41 0 B
ADSL annual rental, business year 53.02 36.26 B
Corporate tax rates
Corporate tax standard rate, average % 33.99 20 B
General sales tax % 12.5 10 B
Personal Taxes (maximum standard rate) % 30 20 B
Travel Costs
Average cost of business trip day 399.24 430.83 A
Fixed return airfare London - City X 2,251.12 1,444.36 A
The economy
Market size and growth
Population m 1,166.00 83 B
Nominal GDP (US$) bn 1,345.20 187.3 B
Nominal GDP (US$ at PPP) bn 3,727.30 469.44 B
GDP per head 1,150.00 2,256.70 B
GDP per head ($ at PPP) 3,200.00 5,655.90 B
GDP (% real change pa) 8.24 4.69 A
Real GDP growth per head (% pa) 6.6 2.83 A
Macroeconomic stability
Consumer prices (% change pa; av) 10.85 11.84 A

256
The economy `
Macroeconomic stability
Budget balance (% of GDP) -6.39 -6.64 A
Public debt (% of GDP) 54.13 83.5 A
Current-account balance m -25,922.00 -3,194.70 B
Current-account balance/GDP -1.93 -1.59 B
Exchange rate LCU:US$ (av) 48.41 5.55 A
The economy
Macroeconomic stability
Real effective exchange rate (CPI-based) 108.5 96.4 A
The economy
International trade
Goods: exports fob m 168,218.00 23,089.30 B
Goods: imports fob m -274,566.00 -45,564.30 B
The economy
International trade
Services: credit m 91,107.00 21,519.80 B
Services: debit m -53,914.00 -8,277.80 B
The economy
Competitiveness
Average wages (monthly, US$) 383 231 A
Labour costs per hour 2.1 1 B
Overall unit labour costs level (index, US=100) 106.4 28.4 B
Overall productivity of labour (GDP at PPP, per worker, US$) 8,240.20 18,590.00 B
The economy
EIU business environment rankings
EIU market opportunities rating (10=high) 7.3 5.6 B
EIU macroeconomic environment rating (10=high) 6.7 5.4 B
EIU political environment rating (10=high) 5.2 5.7 B

257
EIU infrastructure rating (10=good) 4.3 6 B
From the table analysis it can be interpreted that, it will be beneficial to start business in
Egypt compare to India. Again the whole evaluation is in terms of US $. As on
16/04/2012 the 1$= 6.04095 EGP and 1 $= 50 Rs. But 1 Rs. = 0.11 EGP. So, it will be
beneficial for Indian firms to start business in Egypt.

258
CONCLUSION FROM INVESTMENT OPPORTUNITIES
a. Here we conclude that in today‘s scenario for jet airways it is good opportunity to
start the business in Egypt because overall cost of the aviation sector is less than
the Indian aviation sector. In addition to that Egypt is famous for their tourism so,
Jet Airways can easily start their business and can generate revenues in Egypt.
b. The other reasons to start the business in Egypt are as following
c. There is wide range opportunities seem in this report by analyzing last 3 to 5 years
trade business opportunities.
d. The growth of the private sector airlines in the last few years is a cause of concern
as they offer tough competition.
e. The Egyptian constitution having strong executives.
f. The information and communication technology of Egypt is emerging rapidly since
past few years. So it can be beneficial to our country.
g. As per the comparison of overall cost of the aviation sector is less than the Indian
aviation sector.
h. The Egyptian market is gradually opening up, especially after signing an
agreement with the European Free Trade Association (EFTA) in 2006, and a free
trade treaty with the United States.

259

260
KEY REASON TO INVEST IN EGYPT
1. Low-cost labour force: 20% of UK costs.
2. Transportation cost is low compare to India.
3. Diversified sources of income: fees from the Suez Canal, tourism, private transfers,
and remittances, gas and oil/hydrocarbon exports.
4. Foreign-exchange reserves at a high level roughly at $33 billion.
5. Strategic location: gateway to Africa and the Middle East.
6. Access to one of the largest markets in the MENA region.
7. Low-cost energy.
8. Financial stability and strong banking sector.
9. Introduction of structural reforms to:
i. Streamline bureaucratic procedures.
ii. Tackle obstacles to higher growth.
iii. Promote the privatization programme.
iv. Improve the business climate.
v. Introduce multiple investment incentives targeting the upgrading of the business
environment and modernization of the economy.
10. New natural gas reserves in the Mediterranean to develop the hydrocarbon sector.
11. Egypt has one of the most important and promising consumer markets in the
region.
12. Sector had a total of 40% growth rate over the past three years.
13. Egyptian consumer market is the first in Africa and second in the Arab region.

261
REFERENCES
1. Data on GDP and economic information
2. www.ecaa.com
3. http://www.gfmag.com/gdp-data-country-reports/280-egypt-gdp-country-
report.html
4. List of languages by number of native speakers in India ( article)
5. Economist Intelligence Unit, 2012
6. Ministry of Economic Development
7. DGCIS Annual Export
8. CRISIL Research Paper
9. http://www.un.org.pk/unido/trta-interventions.html
10. www.jetairways.com
11. Jet Airways Annual Report And Accounts 2011
12. www.businesstandard.com
13. www.economictimes.com
14. www.rbi.org.in
15. www.nic.co.in

262
Annexure
Balance sheet of jet airways (Rs. crore)
Mar ' 11 Mar ' 10 Mar ' 09 Mar ' 08 Mar ' 07
Sources of funds Owner's fund
Equity share capital 86.33 86.33 86.33 86.33 86.33
Share application money
- - - - -
Preference share capital - - - - -
Reserves & surplus 750.37 740.68 1,208.32 1,765.42 2,018.48
Loan funds Secured loans 4,510.45 3,973.68 4,775.92 1,612.75 742.46
Unsecured loans 8,969.94 9,923.30 11,547.61 10,402.29 5,313.84
Total 14,317.09 14,723.99 17,618.18 13,866.79 8,161.11
Uses of funds Fixed assets
Gross block 17,940.46 17,932.75 18,763.74 16,591.09 5,713.83
Less : revaluation reserve
1,767.64 1,814.97 1,862.30 2,699.90 132.44
Less : accumulated depreciation
4,324.65 3,502.83 2,501.80 2,506.92 2,416.34
Net block 11,848.17 12,614.95 14,399.64 11,384.27 3,165.05
Capital work-in-progress 348.91 299.6 583.17 1,223.28 3,994.52
Investments 1,725.09 1,745.00 1,745.00 1,475.35 68.93
Net current assets Current assets, loans & advances
5,953.30 3,782.20 4,350.70 4,145.67 3,402.32
Less : current liabilities & provisions
5,558.38 3,717.76 3,460.33 4,361.78 2,469.71
Total net current assets 394.92 64.44 890.37 -216.11 932.61
Miscellaneous expenses not written
- - - - -
Total 14,317.09 14,723.99 17,618.18 13,866.79 8,161.11
Notes:

263
Book value of unquoted investments
1,725.09 1,645.00 1,645.00 1,465.00 -
Market value of quoted investments
- 100.01 100.02 10.35 69.01
Contingent liabilities 13,928.42 14,656.19 16,325.90 14,284.97 6,624.43
Number of equity shares outstanding (Lacs)
863.34 863.34 863.34 863.34 863.34
Profit loss account of jet airways (Rs. Crore)
Mar ' 11 Mar ' 10 Mar ' 09 Mar ' 08 Mar ' 07
Income
Operating income 12,782.52 10,438.57 11,571.15 8,811.10 7,057.78
Expenses
Material consumed - - - - -
Manufacturing expenses 6,742.55 5,265.69 7,446.48 5,129.92 3,667.20
Personnel expenses 1,342.19 1,226.55 1,410.50 1,205.18 938.55
Selling expenses 1,261.72 984.91 1,098.17 982.86 800.85
Adminstrative expenses 933.15 853.94 1,017.54 739.24 616.12
Expenses capitalised - - - - -
Cost of sales 10,279.61 8,331.09 10,972.69 8,057.20 6,022.72
Operating profit 2,502.91 2,107.48 598.46 753.9 1,035.06
Other recurring income 173.4 152.04 112.27 115.23 90.36
Adjusted PBDIT 2,676.31 2,259.52 710.73 869.13 1,125.42
Financial expenses 1,872.72 1,824.74 1,450.86 1,056.03 909.7
Depreciation 910.62 961.96 899.81 777.8 414.1
Other write offs - - - - -
Adjusted PBT -107.03 -527.18 -1,639.94 -964.7 -198.38
Tax charges 230.49 78.97 22.21 -160.73 23.42
Adjusted PAT -337.52 -606.15 -1,662.15 -803.97 -221.8
Non recurring items 77.17 97.78 331.48 522.01 225.25
Other non cash adjustments 270.04 40.73 928.33 28.9 24.49
Reported net profit 9.69 -467.64 -402.34 -253.06 27.94
Earnigs before appropriation -719.39 -729.08 -261.44 208.91 525.37

264
Equity dividend - - - - 51.8
Preference dividend - - - - -
Dividend tax - - - - 8.8
Retained earnings -719.39 -729.08 -261.44 208.91 464.77
Ratio of Jet Airways
Mar ' 11 Mar ' 10 Mar ' 09 Mar ' 08 Mar '07
Per share ratios
Adjusted EPS (Rs) -39.09 -70.21 -192.53 -93.12 -25.69
Adjusted cash EPS (Rs) 66.38 41.21 -88.3 -3.03 22.27
Reported EPS (Rs) 1.12 -54.17 -46.6 -29.31 3.24
Reported cash EPS (Rs) 106.6 57.26 57.62 60.78 51.2
Dividend per share - - - - 6
Operating profit per share (Rs) 289.91 244.11 69.32 87.32 119.89
Book value (excl rev res) per share (Rs)
96.91 95.79 149.96 214.49 243.8
Book value (incl rev res) per share (Rs.)
301.66 306.02 365.67 527.21 259.14
Net operating income per share (Rs)
1,480.59 1,209.09 1,340.28 1,020.58 817.5
Free reserves per share (Rs) 80.48 79.35 133.52 198.05 227.36
Profitability ratios
Operating margin (%) 19.58 20.18 5.17 8.55 14.66
Gross profit margin (%) 12.45 10.97 -2.6 -0.27 8.79
Net profit margin (%) 0.07 -4.41 -3.44 -2.83 0.39
Adjusted cash margin (%) 4.42 3.35 -6.52 -0.29 2.69
Adjusted return on net worth (%)
-40.33 -73.29 -128.38 -43.41 -10.53
Reported return on net worth (%)
1.15 -56.54 -31.07 -13.66 1.32
Return on long term funds (%) 14.31 12.12 -1.41 0.74 9.53
Leverage ratios
Long term debt / Equity 14.22 11.94 9.33 5.63 2.75

265
Total debt/equity 16.11 16.8 12.61 6.49 2.88
Owners fund as % of total source
5.84 5.61 7.34 13.35 25.79
Fixed assets turnover ratio 0.72 0.59 0.62 0.53 1.28

266
Hotel Industry

267
Executive summery
This report is the result of more than a month of research work
with the help of secondary data source. It attempts to distinguish the relation
between the Egyptian country & Indian country.
There is a big difference between India and Egypt per capital income. In 2010
India par capital income is 54527 and Egypt is 5650. From this interpretation of
the par capital income we can say that Indian people stander of living is better
than the people of Egypt.
By the interpretation of the growth rate of the year 2010 we can see in the chart
that the growth rate of Egypt is greater than India. As there is less population
in Egypt and highly dependability on tourism industry
As par the past year the sales is decline in the current year. The reasons
behind it are only the rise of the tourism sector in other country and the effect of
global recession.
From total revenue of the last two financial year of oberoi hotel it is clear that
the number of tourist are in Egypt is rise. In the year 09-10 the revenue is
9072.73 and in the year 10-11 it is 11429.49.

268
Economic Overview of the Country
Overview of Industries Trade and Commerce
Export & import
EGYPT(Alexandria) Exports Imports
o grain
o papyrus
o painted pottery
o linen/flax
o glass vases
o lotions/perfumes
o (imported spices)
o pepper
o cinnamon
o frankincense
o ginger
o iron
o wine
o nuts / figs
o tin
INDIA(Braganza) Exports Imports

269
o pearls
o cotton
o sandalwood
o perfumed oils
o semi-precious
stones
o (imported tortoise
shell)
o (imported silk from
China)
o nard (=ginger root)
o gold Roman coins
o glassware
o wine
o medicines
o tin/copper
o silverware
o clothing
TRADE STRUCTURE
Main exported products:
Spinning and weaving products;
Agricultural goods (cotton, rice, potatoes, citrus, medicinal herbs, spices)
Metallurgical products;
Chemicals;
Pharmaceuticals, paper products, cosmetics…
Food industries (molasses, refined sugar, canned vegetables and fruit,
cigarettes and tobacco).
Main imported products:
Iron and steel;
Petroleum and its products;
Organic and inorganic chemical substances;

270
Wood and cork and articles thereof;
Resins and artificial plastics;
Paper and articles thereof.
Trading partners:
Main suppliers Main customers
Germany Italy
United Kingdom Holland
France Germany
Italy United Kingdom
United States of America United States of America
Japan Libya
Egypt export-import data
Sector Imports % change over 2008-09
Exports % change over 2008-09
2009-10 (US Dollar thousand)
2008-09 (US Dollar thousand)
2009-10 (US Dollar thousand)
2008-09 (US Dollar thousand)
Agriculture:
Spices
1,10,045.75 76,538.65 43.778% 5,56,050 5,30,025.5
4.910%
Edible oil
48,450.00 45,443.32 06.616% 89,300 85402.98 4.56%
Dairy products
515,574
Manufacturing:
Mining 261,600 7,593,942
Engineering
Chemicals 55,672

271
Services:
Tourism 2,538,100 10,755,300
Software 229,346
Projects, Articles
145,349
Information services
134,300 78,700 70.648% 170,700 218,800 -21.98%
Banking:
Licenses 284500 321,600 -11.536% 122,000 138,000 -11.59%
Business 1,859,500 2,842,600 -34.585% 1,786,600
1,788,700
-0.117%
Insurance 1,354,500 1,583,800 -14.478% 75,300 216,300 -0.652%
Total products
712209.10 663,818.34 07.289% 663,818.
34 759,464.44
-12.594%
(1) Summary of Exim policy
Exim policy of India
A developing country such as India needs to import technology and capital
goods. To offset these imports, the government of India provides export
promotion schemes. The Indian government also uses import quotas; import
licensing and import duties to help balance the import-export trade in India.
The EXIM Policy of India has been updated several times in recent years.
The most recent version covers the period from 2009 to 2014. The short term
objective for this revision to the EXIM policy is to halt and reverse the declines in
India trade within a volatile world market. Tactics used to achieve this objective
include: increase market access, diversify the export markets, provide fiscal
incentives, reduce procedures, and change to institutions.

272
EXIM Policy 2009 to 2014 Highlights:
Some key highlights of this EXIM policy 2009 to 2014 revisions are:
Market Access and Export Market Diversification Incentive schemes have been
expand to cover new markets and new product categories. New markets, sixteen
from Latin America and ten from Asia-Oceania have been added as part of the
Focus Market Scheme. The incentives available have increased from 2.5% to
3% for these new markets.
New Product Incentive Scheme
This covers a wide variety of products ranging from engineering, plastics, textiles,
Green technology, Jute & Siscal, technical textiles, project goods, vegetable
textiles and some electronics. The incentives increased from 1.25% to 2%.
Technology Upgrades
For companies in certain sectors such as engineering and electronic products
who want to upgrade their technology, zero duty will be assessed.
Gems & Jewelry Sector
Gold Jewelry exports will be permitted to receive Duty Drawbacks. This is where
the duty collected on the export will refunded.
Value added Manufacturing
to increase Value added Manufacturing exports, a 15% minimum value addition
on imported inputs has now been prescribed.
Procedure Simplification
Increase from 15 to 50, the number of sample pieces allowed to be imported by
exporters at duty free rates.
Given the recent downward turn in the global economy, India's exports have
also been shrinking. It is hope that some of the latest EXIM policy promotion
schemes will help to accelerated India's import-export industry again.

273
Objectives:
To accelerate the economy from low level of economic activities to high level of
economic activities by making it a globally oriented vibrant economy and to
derive maximum benefits from expanding global market opportunities.
To stimulate sustained economic growth by providing access to essential raw
materials, intermediates, components,' consumables and capital goods required
for augmenting production.
To enhance the techno local strength and efficiency of Indian agriculture, industry
and services, thereby, improving their competitiveness.
To generate new employment.
Opportunities and encourage the attainment of internationally accepted
standards of quality.
To provide quality consumer products at reasonable prices.
Exim policy of Egypt
In 2004, government cut tariffs sharply and simplified the customs regime to
stimulate trade and economic development. The government removed GATT-
inconsistent services fees and import surcharges, dismantled tariff
inconsistencies, including sharp escalation and reverse progression on tariff
rates, and rationalized national sub-headings above the six-digit level of the
Harmonized System (HS). As a result of the reforms since 2004, Egypt's number

274
of ad valorem tariff rates was reduced from 27 to 5 and the average weighted
tariff rate has fallen from 14.6 percent to 5.5 percent.
In 2005, new import and export regulations were issued, which reduced the
number of imported goods subject to inspection by the General Organization for
Export and Import Control (GOEIC) and permitted importers to provide their own
certificates of health and safety conformity from any internationally accredited
laboratory inside or outside of Egypt. The new regulations also transferred
responsibility for issuing and reviewing certificates of origin from GOEIC to the
Egyptian Customs Authority.
In February 2009, a presidential decree amended the customs tariff schedule for
250 items, lowering import duties on many items and removing entirely duties on
some raw materials and capital and intermediate goods such as inputs for
spinning and weaving products.
Despite the government's sweeping customs and tariff reform and easing of
import restrictions, significant problems remain. Egypt adopted the WTO customs
valuation system in 2001. Though government officials report that Egypt has
almost fully implemented the system, importers face a confusing mix of new
invoice-based and old reference price-based valuations depending on the type of
imports. Acknowledging these problems, the Ministry of Finance (MOF) has
committed to a comprehensive reform of Egypt's customs administration and is
working in concert with USAID, which funded a comprehensive six-year program
to support reform efforts. A new customs law was drafted and sent to the Minister
of Finance and was scheduled to be sent to the People‘s Assembly in early 2010.
However, as of January 2011, the law has not yet been submitted to the Egyptian
Parliament.
Many U.S. agricultural products also face burdensome import licensing and
inspection requirements. Although a ban on whole poultry was lifted in 1997,

275
imported poultry parts are still prohibited, ostensibly over concerns that they may
not meet halal (religious) standards, despite certification by U.S. Islamic Centers.
Health food products such as low-calorie foods, diet pills, and vitamins also face
informal barriers to trade. These products must obtain a special registration from
the National Nutrition Institute of the Ministry of Health, which can take months to
process. Products with domestic substitutes have experienced substantial
delays, some as many as six months to one year. On a positive note for investors
in the textile industry, Egypt recently approved the importation of U.S. upland
cotton, which is highly valued by spinners and weavers around the world.
Shelf-life standards also act as an indirect trade barrier. Egypt sets the shelf life
of many imported products using non-science-based standards that do not
recognize quality, safety, and technological differences between producers. By
government decree, imports (mainly food products) must have 50 percent or
more of their shelf life remaining. The government is reviewing Egypt's shelf life
standards to make them more science-based and WTO-consistent.
The import inspection process remains confusing, despite the designation of the
GOEIC as the coordinator for all import inspections. The Ministries of Health and
Agriculture maintain their own inspection units and procedures. Imported
refrigerated containers of foodstuffs typically take 25 days to clear customs.
While two-month delays were common in the past, overall customs clearance
times are improving, and import inspections now typically take three to four
weeks.
Ministerial Decree 619 of 1998 required a certification of origin for imports and
stipulated that consumer goods (durable and non-durable) be shipped directly
from the country of origin. The decree was amended in late 1999 to ease
requirements for the certificate of origin and allow shipment of imported
consumer goods from the main branches of the producing company and its
distribution centers. Company invoices noting the country of origin and bearing

276
the endorsement of an Egyptian overseas commercial office can now be used as
certificates of origin. Ministerial Decrees 577 and 580 of 1999 require cars to be
imported in the year of production. In 2000, the decrees were amended adding
one year after the year of production to the period during which passenger
vehicles can be imported.
The duty drawback system requires full custom duties to be paid on semi-
finished imports. There is a one-year time limit for re-exporting these imports as
part of a final product in order to claim a full rebate of the duties and taxes paid.
Export Promotion Law 155 of 2002 sought to improve the duty drawback and
temporary admission systems for exporters by establishing a central unit under
the joint supervision of the Ministries of Finance and Trade and. The Ministries of
Finance and Trade and Industry jointly inaugurated the first upgraded temporary-
admissions unit at the Port of Alexandria in 2002. With assistance from USAID,
the Ministries opened three more units in Suez, Port Said, and Damietta.
Export Promotion Law 155 also established an "Export Development Fund," to
promote Egyptian exports and increase their presence in foreign markets. The
Fund supports a number of sectors, mainly textiles, ready-made garments, and
food industries, with an export rebate of up to 10% of the total added value of the
exported goods. The Fund also subsidizes some shipping costs and start-up
costs of export-oriented businesses. In 2010, the GOE revised its export subsidy
scheme to pay higher rebates to exporters who use larger percentages of local
raw materials in their goods, and also temporarily increased by 50% the export
subsidies paid to the ready-made garment and textile sectors. The Fund‘s annual
subsidy budget currently stands at LE 4.6 billion. Aside from the subsidies
provided by the Export Development Fund, the government of Egypt rarely
provides additional agricultural export subsidies and does not impose export
performance requirements.

277
The Ministry of Trade and Industry imposed tight limits on rice exports in March
2008, citing the need to ensure domestic supply. These limits on rice exports
remain in effect. In October 2010, a ban on cement exports that Egypt had
imposed in April 2009 expired.
In 2010, the Central Bank relaxed a requirement of 100 percent foreign exchange
cover for Letters of Credit issued for the purchase of goods imported for resale,
reducing the requirement to 50 percent. Also in 2010, the Central Bank also
temporarily suspended the foreign exchange cover requirement on meat, poultry,
and sugar imports in response to high levels of food price inflation.
Present Trade Relations and Business Volume of different
products with India
Egypt and India in an ambitious plan are looking forward to an exponential
increase in bilateral trade volume, from the current $3 billion to $10 billion. For
the uninitiated, India and Egypt share a 2500-year old diplomatic relationship. In
light of this development, President Hosni Mubarak, flew down to India last year,
to further economic relations. This year, Indian Prime Minister Mr Manmohan
Singh met the Egyptian President at Sharm El-Sheikh during the summit for Non-
Aligned Movement.
In the recent past, trade relationship between both the nations have been
blooming and blossoming. In 2004-05, trade between the two countries totaled
$684.7 million. In 2006-07, it grew to around $1.96 billion. A year later it grew
more than 50 % to $3.38 billion. Both India and Egypt have been surprisingly
enjoying robust growth, despite developed nations wilting under the pressure of
global economic slowdown.

278
India‘s is seemingly interested in tapping Egypt‘s expertise in number of areas;
however, the country‘s principal focus is on infrastructure development and
desert agricultural methods Egypt exports to India primarily include oil and gas.
Both countries however seem inclined towards renewable energy
sources. India at present produces 8% of its energy from renewable sources and
hopefully, in the future it‘s aspiring to achieve 20%. Egypt too shares the same
vision as India. Going forward, the two countries might work together in the
energy domain. Both countries are even looking forward to work together
on Egypt‘s nuclear aspirations.
The two countries have also come up with number of programs to expand
cultural relations. Alexandria University has associated with seven universities
in India in an Endeavour to give students international exposure.
The Maulana Azad Center for Indian Culture, incorporated 30 years ago, has
played a significant role in continual cultural exchange. Egypt and India are
aiming to increase bilateral trade volume to $10 billion in the next few years from
a little over $3 billion currently, according to Ambassador R. Swaminathan. It's an
ambitious plan, but India's ambassador to Egypt Swaminathan thinks there's
reason to be optimistic. With Indian Independence Day fast approaching,
Swaminathan sat down with reporters Sunday to discuss a wide range of topics,
including bilateral trade relations.
The discussion comes at a time in which the two countries have made concerted
efforts to strengthen what Swaninathan called a 2,500-year-old diplomatic
relationship. On the diplomatic side, President Hosni Mubarak traveled last year
to India and discussed relations with Indian Prime Minister Man Mohan Singh.
Singh flew to Sharm El-Sheikh last month for the summit of the Non-Aligned
Movement. Both leaders met privately again there. On the economic side, the
two countries have seen a blossoming trade relationship over the past couple of
years.

279
In the 2004-2005 fiscal year, overall bilateral trade between the countries totaled
$684.7 million. By the 2006-2007 fiscal year, that number had grown to $1.96
billion. Only a year later, the trade relationship grew by more than 50 percent to
$3.38 billion. There has historically been a significant trade imbalance between
the two countries, with Egypt exporting almost twice as much as it imported in
2007-2008. Now they're focusing on more than tripling trade volume.
Both Egypt and India have enjoyed robust GDP growth in recent years. More
importantly, unlike many of the developed countries, which wilted under the
pressure of the global economic crisis and have been recording negative GDP
growth since, both Egypt and India have continued to record positive, albeit
reduced, growth. Swaminathan said he sees those figures as mutual economic
stability, and he stressed that the two countries should lean on each other
further. "We should be able to increase the Indian investment into Egypt by $2
billion dollars in the next one to two years, he said. Swaminathan said that India
hopes to tap into Egypt's expertise in a number of areas, but noted infrastructure
development and desert agricultural methods as two areas where India is
particularly interest in engaging Egypt. Much of what Egypt exports to India is in
the form of oil and gas. But both countries have committed to moving towards
renewable energy sources.
India currently produces 8 percent of its energy from renewable sources and
hopes to boost that number to 20 percent by 2020. Egypt shares a similar
domestic goal. Swaminathan stressed the need for the two countries to work
together on energy matters going forward. He said he also saw further
cooperation between the two countries based on Egypt's nuclear aspirations.
Swaminathan said that the creation of the Joint Commission established over 20
years ago has been key to continuing the strong bilateral relations between the
two countries. Egypt's Foreign Minister Aboul Gheit oversees the commission on
the Egyptian side and many of the topics on the agenda each time the group
meets are concerned with economic and trade ties.

280
The two countries have also launched a number of programs to promote cultural
exchange. Alexandria University has linked up with seven universities in India to
give students in each country a chance at international study. The Maulana Azad
Center for Indian Culture, established almost 30 years ago, has continued to play
an important role in continued cultural exchange.
No numbers have yet been released on bilateral trade for the 2008-2009 fiscal
year, and it's unclear how they'll look in light of the economic crisis. But it's clear
that the long-term outlook for this trade relationship is for heavy growth.
PESTEL ANALYSIS
Political Environment:
1) Political structure
The Egyptian Constitution provides for a strong executive. Authority is
vested in an elected president who can appoint one or more vice presidents, a
prime minister, and a cabinet. The president's term runs for 6 years. Egypt's
legislative body, the People's Assembly, has 454 members--444 popularly
elected and 10 appointed by the president. The constitution reserves 50% of the
assembly seats for "workers and peasants." The assembly sits for a 5-year term
but can be dissolved earlier by the President. There also is a 264-member Shure
(consultative) Council, in which 88 members are appointed and 174 elected for 6-
year terms. Below the national level, authority is exercised by and through
governors and mayors appointed by the central government and by popularly
elected local councils.
In March 2007, Mubarak introduced several constitutional amendments
that would increase presidential powers and, more significantly, ban any political

281
parties based on religion, race or ethnicity. The amendments were put to a
popular referendum and, despite low voter turnout and boycotts by opposition
groups, passed with 75.9% approval.
2) Main political parties
The multi-party system was restored in 1976 by the then president
Sedate. However, in practice it is the ruling National Democratic Party (NDP)
which completely dominates the political arena. The Muslim brothers, a
brotherhood created in 1928 by Hassan El Banna is the main opposition party of
the country. They were banned but in spite of it, they were able to win 88 seats in
the People's Assembly in the 2005 elections. The other opposition parties like
Wafd, El-Ghad or the Nasserian Party are minority parties and were nearly wiped
out in the 2005 elections.
3) Foreign trade
The Egyptian market is gradually opening up, especially after signing an
agreement with the European Free Trade Association (EFTA) in 2006, and a free
trade treaty with the United States. Its three primary export partners are the
European Union, which represents more than a third of the trade, United States
and Syria. Its three primary import partners are the European Union, the United
States and China. Egypt mainly exports mineral fuels and oil, cotton, iron and
steel. It imports mainly consumer electronic goods and capital goods, nuclear
reactors and nuclear-powered boilers, cereals, food products and chemical
products. Import volume has doubled and is twice the export volume, a fact
which contributed to the deterioration of the country's trade balance.
4) Tax Rate
The standard rate of corporate income tax is 40%. The rate is 32% on
profits arising from export operations and on profits of an industrial company as
long as they arise from its industrial activities.

282
a) Withholding Tax
Any business operating in Egypt must withhold against any payments-- made to
any contractor or supplier of goods or services-- the following basic percentages:
Contracting and supplying: 1%
Services: 3%
Commissions: 10%
Professional fees (under LE 500): 10%
Professional fees (over LE 500): 15%
Leasing of property or selling of goods for trading or manufacturing: 1% - 5% (to
be added on the payee's tax liability account.
b) Corporate Tax Exemptions and Deductions
Almost all business expenses are deductible including depreciation, interest,
royalties, rent, and profit sharing payments to employees, legal expenses,
pension and Egyptian state social insurance contributions.
Economic Environment:
Occupying the northeast corner of the African continent, Egypt is bisected
by the highly fertile Nile valley, where most economic activity takes place. Egypt's
economy was highly centralized during the rule of former President Gamal Abdel
NASSER but has opened up considerably under former President Anwar EL-
SADAT and current President Mohamed Hosni MUBARAK. Cairo from 2004 to
2008 aggressively pursued economic reforms to attract foreign investment and
facilitate GDP growth, but is postponing further economic reforms because of
global economic turmoil. With the installation of the 2004 Egyptian parliament,
the Government of Egypt began a new reform movement, following a stalled
economic reform program begun in 1991, but moribund since the mid-1990s.

283
In the past year, the cabinet economic team has simplified and reduced
tariffs and taxes, improved the transparency of the national budget, revived
stalled privatizations of public enterprises and implemented economic legislation
designed to foster private sector-driven economic growth and improve Egypt's
competitiveness.
The international economic downturn slowed Egypt's GDP growth to 4.5%
in 2009, predominately affecting export-oriented sectors, including manufacturing
and tourism. Unemployment is rising. In 2009 the government implemented a
$2.7 billion stimulus package favoring infrastructure projects and export
subsidies, and is considering up to $3.3 billion in additional stimulus spending in
2010 to mitigate the slowdown in economic growth.
In September 2009 - Egypt was ranked among the world‘s 10 most active
reformers for the fourth time. The country moved up to 106 from 116 among 183
economies worldwide in the overall ease of doing business ranking. According to
the recently released report by IFC and the World Bank ―Doing Business 2010:
Reforming through Difficult Times‖, Egypt made business start-up less costly,
expedited the construction permit process, expanded the information available
from the private credit bureau, and created commercial courts to speed up
contract dispute settlements.
Socio cultural Environment:
Egypt‘s total population stood at 80.3 million. Out of this approximately
90% are Muslims while the remaining are Christians. Most of the population
inhabits the area near the Nile River and almost half of Egypt‘s population is
urban, living in the densely populated cities such as Cairo and Alexandria.

284
One of Egypt‘s biggest socio-economic problems is the high
unemployment rate which has been growing over the years. The unemployment
rate, which has averaged more than 10% over a decade, increased to over 12%
in 2005–06. With the population growing at 1.8% per annum, the economic
growth of 4.4% is not enough to curb the unemployment rate. While the average
growth in employed population during the last five-year period stood at 2.3%, the
rise in unemployed population has been much higher during the same period
averaging around 8%. The high rates of unemployment and population growth
coupled with meager wages in most of the public sector companies contribute to
the poverty levels, with close to 20% of Egypt‘s population below the poverty line.
A big challenge for Egypt in the near future will be to create jobs, as the
population within the 20–45 age-group constitutes around 65% of the total
population.
The education indicators of Egypt project a poor image of the education
system. Only about 58% of the population is literate and there is a big difference
in the literacy rates for males and females. Male literacy rate is around 68%,
while female literacy rate is just about 47%, indicative of gender disparity. The
National Council for Women, a nodal government agency that works for the
welfare of women in Egypt, aims to completely eradicate illiteracy among
females.
The healthcare system in Egypt is underdeveloped with only around 29%
of the population covered by governmental health insurance. Egypt‘s public
healthcare system is under-funded, with the government committing only around
$1 billion in 2005–06 for upgrading the healthcare sector, which represents a
meager 2.7% of the total state budget. The ministry of health is the largest
institutional financier providing free healthcare services in Egypt but its reach is
limited. Almost 65% of the Egyptian people pay for their own insurance through
private and other health insurance organizations. The total spending on
healthcare in Egypt is only about 4% of its GDP.

285
Technological Environment:
Egypt's IT spending is expected to increase from US$1.3bn in 2010 to
US$2.1bn by 2014 and the Egyptian IT market growth is forecasted to remain
below pre-economic crisis levels in 2010, but economic recovery, tenders
delayed from 2009 and higher incomes boosted by pay raises for civil servants
and other groups should help to keep sales on an upwards trajectory.
A number of policies have been implemented to attract foreign investment
in IT outsourcing, including local employment subsidies, lower corporate taxes
and deductions for training costs. The Egyptian minister of state for
administrative development has said that 200 government services will soon be
available online through a new e-government portal. The portal will offer 70
services in both English and Arabic. According to the Ministry for Administrative
Development, more than 20 government agencies currently offer services and
licenses online.
Egypt's computer hardware sales are projected at US$821mn in 2010 and
are forecast to reach around US$1.3bn in 2014. Egypt's IT market will stay
hardware dominated, with spending on PCs sustained by initiatives like the
'Computer for Every Student' and 'PC for Every Home' programs. Hardware
accounted for an estimated 62% of Egypt's IT spending last year. Households
account for 20-25% of unit sales, with almost 1-1.5mn households said to
possess a computer at present.
Overall spending on software remains rather low, which reflects the
relative immaturity of Egypt's IT market. One market driver has been a significant
fall in software piracy, with the illegal software usage rate, as measured by the
Business Software Association, falling a further 1% to 59% in 2008. While large
corporations have long understood the business case for deploying technology,
small and medium-sized enterprises is increasingly beginning to see such

286
investments as important if they are to avoid being overtaken by more tech-
competent competitors.
In 2008, Egypt continued liberalization of the telecoms market, with the
award of a second national fixed license. This development, which followed the
award of 3G licenses to three mobile telecoms service providers in 2007, is likely
to drive new opportunities for IT vendors. The Egyptian IT services market is
dominated by demand from government, finance and telecoms sectors, which
account for more than 25% of Egypt‘s total spending.

287
OBEROI HOTEL
o Introduction
The foundations of the Oberoi Group in 1934 when Rai Bahadur Mohan Singh
Oberoi, Mr.Oberoi ably assisted by his two sons, Mr. Tilak Raj Singh Oberoi and
Mr. Prithvi Raj Singh Oberoi continued the expansion of their group with
properties both in India and abroad.
o Business Hotels:
o TheObroi,Gurgaon
o The Oberoi, New
Delhi
o The Oberoi,
Mumbai
o The Oberoi,
Bangalore
o The Oberoi Grand,
Kolkata
o Leisure Hotels:
o The Oberoi
Amarvilas
o The Oberoi
Rajvilas
o The Oberoi
Udaivilas
o The Oberoi
Vanyavilas
o Wildflower Hall,
Shimla
o The Oberoi Cecil,
Shimla
o Mena House
Oberoi, Cairo
o The Oberoi Sahl
Hasheesh
o The Oberoi, Bali
o The Oberoi,
Lombok
o The Oberoi,
Mauritius
o The Oberoi
Madina
o Cruises:
o The Oberoi Motor
Vessel Vrinda
o The Oberoi Philae
Nile Cruiser
o The Oberoi Zahra
Luxury Nile
Cruiser

1
IN EGYPT:
o The Oberoi Zahra Luxury Nile Cruiser
o The Oberoi Philae Nile Cruiser
o The Oberoi Sahl Hasheesh
o Mena House Oberoi, Cairo
SERVICES PROVIDED TO CUSTOMER IN OBEROI
o Give Customers what they don‘t expect
SERVICE QUALITY
o Service quality has been interpreted to include five dimensions: RATTER
o Reliability: Dependability and Correctness
o Assurance: Knowledge & courtesy of employees
o Tangibles: Appearance & physical facilities, equipment and personnel
o Empathy: Providing personnel understanding and customer support.
o Responsiveness: Providing prompt service
o Responsiveness: Providing prompt service.
o To promote consistent superior performance, it is important to assign Quality
standards to each step of customer service cycle. Quality standards Provide
direction and motivation for employees.
ROOM SERVICE GUEST SERVICE CYCLE
o Quality Dimensions Quality Service Standards
o Reliability: Phone answered within 5 rings, 24 hrs a day
o Assurance: Phone operator as through Knowledge of
o Menu and prices.
o Tangibles: Full description of items and presentation
o Specific delivery tine stated.
o Empathy: Customer name used. Prescribed guest
o Treatment procedure carried out with sincerely.

2
o Order taken in courteous manner
Room Service Customer Service Cycle
1. Guest calls room service.
2. Places order.
3. Answers door; talks with server; signs bill.
4. Consumes food and beverage.
5. Sets tray outside door for pickup.
6. Reviews room service charges at check-out.
Hotel Perspective
1.2. Switchboard staff trained for order taking.
3. Staff trained on the job in service techniques; uniforms required.
4. Kitchen staff instructed on consistent preparation of all menu items.
5. Housekeeping coordinated with room service staff for timely pickup or Trays.
6. Charges posted on guest‘s hotel bill.
Special Offers
Oberoi Hotels & Resorts provides some special offers to their customers like
Exotic Vacations, City Plus, Oberoi Family Vacations, Extraordinary Weekends
Offer, Exotic Honeymoons, Business Travel Plus, etc.
INCOME FROM TOURIST IN EGYPT
o Omayma el-Husseini, spokeswoman of the Egyptian Tourism Ministry, said in a
telephone interview.
o Egypt forecast 16 million tourists for 2011. A million tourists fled the country,
abandoning the hotels and restaurants in Cairo, Luxor, Aswan and the Red Sea
resorts of Hurghada and Sharmel Sheik.
o Egypt received 14.5 million tourists in 2010, making tourism the second
largest revenue source, after expatriate remittances, according to government
figures.

3
o Egypt‘s Tourism provides jobs to 2 million Egyptians, represents 11% of the
nation's economic output. In 2009, it brought in $10.8 billion, according to
Egyptian Tourism Ministry figures.
o In 2010, 15 million tourists traveled to Egypt, 362,000 of them from the U.S.,
according to the Egyptian Tourist Authority.
Hotel & restaurant industry in India
Over the last decade and half the mad rush to India for business opportunities
has intensified and elevated room rates and occupancy levels in India. Even
budget hotels are charging USD 250 per day. The successful growth story of
'Hotel Industry in India' seconds only to China in Asia Pacific.
'Hotels in India' have supply of 110,000 rooms. According to the tourism ministry,
4.4 million tourists visited India last year and at current trend, demand will soar to
10 million in 2010 - to accommodate 350 million domestic travelers. 'Hotels in
India' has a shortage of 150,000 rooms fueling hotel room rates across India.
With tremendous pull of opportunity, India is a destination for hotel chains looking
for growth. The World Travel and Tourism Council, India, data says, India ranks
18th in business travel and will be among the top 5 in this decade. Sources

4
estimate, demand is going to exceed supply by at least 100% over the next 2
years. Five-star hotels in metro cities allot same room, more than once a day to
different guests, receiving almost 24-hour rates from both guests against 6-8
hours usage. With demand-supply disparity, 'Hotel India' room rates are most
likely to rise 25% annually and occupancy to rise by 80%, over the next two
years. 'Hotel Industry in India' is eroding its competitiveness as a cost effective
destination. However, the rating on the 'Indian Hotels' is bullish .
'India Hotel Industry' is adding about 60,000 quality rooms, currently in different
stages of planning and development and should be ready by 2012. MNC Hotel
Industry giants are flocking India and forging Joint Ventures to earn their share of
pie in the race. Government has approved 300 hotel projects, nearly half of which
are in the luxury range. Sources said, the manpower requirements of the hotel
industry will increase from 7 mn in 2001 to 15 mn by 2010.
With the USD 23 billion software services sector pushing the Indian economy
skywards, more and more IT professionals are flocking to Indian metro cities.
'Hotel Industry in India' is set to grow at 15% a year. This figure will skyrocket in
2010, when Delhi hosts the Commonwealth Games. Already, more than 50
international budget hotel chains are moving into India to stake their turf.
Therefore, with opportunities galore the future 'Scenario of Indian Hotel Industry'
looks rosy.
The incredible and exotic land of India has no dearth of luxury hotels. To spend
some time amidst opulence and luxury, travelers can choose from the large
number of hotels. Travelers wishing to spend some time amidst comfort without
worrying much about the money can put up a stay at these luxury hotels.

5
o Structure, Functions and Business Activities of selected Industry / Sector /
Company
TRADE STRUCTURE
Main exported products:
Spinning and weaving products;
Agricultural goods (cotton, rice, potatoes, citrus, medicinal herbs, spices)
Metallurgical products;
Chemicals;
Pharmaceuticals, paper products, cosmetics…
Food industries (molasses, refined sugar, canned vegetables and fruit, cigarettes
and tobacco).
Main imported products:
Iron and steel;
Petroleum and its products;
Organic and inorganic chemical substances;
Wood and cork and articles thereof;
Resins and artificial plastics;
Paper and articles thereof.
Trading partners:
Main
suppliers
Main
customers
Germany Italy
United
Kingdom
Holland

6
France Germany
Italy United
Kingdom
United States
of America
United States
of America
Japan Libya
FUNCTIONING ACTIVITY
Front Office Department
The front office is the command post for processing reservations, registering
guests, settling guest accounts (cashiering), and checking out guests. Front desk
agents also handle the distribution of guestroom keys and mail, messages or
other information for guests. The most visible part of the front office area is of
course the front desk. The front desk can be a counter or, in some luxury hotels,
an actual desk where a guest can sit down and register.
Housekeeping Department
The housekeeping department is another important department in hospitality
world. Housekeeping is responsible for cleaning the hotel‘s guestrooms and
public areas. This department has the largest staff, consisting of an assistant
housekeeper, room inspectors, room attendants, a house person crew, linen
room attendants and personnel in charge of employee uniforms. They may also
have their own laundry and valet service. Hotels with laundry and valet
equipment may use it only for hotel linens and uniforms and send guest clothing
to an outside service where it can be handled with specialized equipment.
Food Production Department

7
Food production deals with the preparations of food items. It basically engaged in
preparing those dish, which are ordered by the guest and afterwards is catered
by the F&B department. Cuisine like Indian, Continental, Thai, Italian, Konkani
(Coastal Sea Food), South Indian, Chinese, Mexican, etc. Different Chefs are
appointed for the specialty cuisine.
COST CENTER FUNCTION
Marketing & Selling Department
Sales and marketing has become one of the most vital functions of the hotel
business and an integral part of modern hotel management. It includes
packaging for selling, sales promotion, advertising and public relations. The
marketing division is charged with the responsibility of keeping the rooms in the
hotel occupied at the right price and with the right mix of guests.
Engineering and Maintenance Department
The energy crisis throughout the world has given a great importance to the
engineering department of a hotel. This department provides on the day-to-day
basis the utility services, electricity, hot water, steams, air-conditioning and other
services and is responsible for repair and maintenance of the equipment,
furniture and fixtures in the hotel. The engineering department has an important
role in satisfying the guest- demand and helping to maintain the profit level of the
hotel. The cleaning, up-keep, repair, replacement, installation and maintenance
of property and its furnishing, machinery and equipment are the joint
responsibilities of Engineering/Maintenance and the Housekeeping Department.
Finance, Accounting and Control Department
A hotel‘s accounting department is responsible for keeping track of the many
business transactions that occur in the hotel. The accounting department does
more than simply keep the books-financial management is perhaps a more
appropriate description of what the accounting department does. Whereas the

8
control department is concern with cost control guidelines by way of reducing in
investment, reduction in operating cost, control of food service costs, control of
beverage costs, labor cost control, etc.
Safety and Security Department
The security of guests, employees, personal property and the hotel itself is an
overriding concern for today‘s hoteliers. In the past, most security precautions
concentrated on the prevention of theft from guests and the hotel. However,
today such violent crimes as murder and rape have become a problem for some
hotels. Unfortunately, crime rates in most major‘s cities are rising. Hence today
security department also concentrate on these additional criminal activities too.
Administration Department
Top organizational members usually supervise the Administration Department in
a hotel. This department is responsible for all the work connected with
administration, personnel, manpower, employee‘s welfare, medical, health and
security.
Security
Keeping the sign board of only staff won’t reduce the risk of crime. If there
is no proper security such as cc TV, security officer etc for staffs and
guests then it may lead to the reputation of company into risk. Therefore,
the function of security department is to ensure the safety and security of
the guests and the staffs.
Structure of the hotel Industry of Egypt (By Jimmy Dunn)
The Minister of Tourism has issued a ministerial decree adopting new regulations
for the classification of hotels in Egypt. These regulations were set by a

9
committee consisting of tourism experts under the direction of Mr. Fathi Nour,
Chairman of the Egyptian Hotel Association and Consultant to the Minister of
Tourism, with the participation of private sector hotel experts and Mr. Ahmed
Nahas, Chairman of the Egyptian Tourism Federation, an international hotel
expert.
It is well known that the former classification system dates back to 1982 and that
this system has encountered, during the past years, many criticisms that made it
incompatible with the development of the hotel industry in Egypt. The new
system are more closely conform to international standards, though, Fathi Nour
stresses that the committee has taken into consideration the recommendations of
the International Hotels and Restaurants Association, IH&RA which provides that
each country should develop a classification system appropriate to its own
circumstances and that an existing global classification standard for all hotels
cannot be established.
The new classification system has introduced, for the first time in the Middle East
and Africa, a system of assessment in two phases. The first deals with the
infrastructure, equipment, appliances and tools available within the hotel. The
second specifically addresses the quality of service, which is carried out through
an evaluation system using "Mystery Shoppers", an internationally recognized
practice where reviewers make undeclared visits to hotels. This system will be
administered by international companies under the supervision of the Egyptian
Hotel Association and the Ministry of Tourism.
Older hotels that are currently classified may not be affected in the near term.
They will retain their old rankings, but new hotels will be subject to these new
regulations. Their star classification will include the letters NN (new norms).
However, older hotels may request a re-evaluation according to the new
specifications. Tour Egypt believes that many of the older hotels will, for
marketing purposes, choose to be re-evaluated.

10
The classification includes, for the first time, new types of hotel service, such as
Elite Hotels, which are also called Boutique or Design Hotel. These are normally
small hotels with less than 50 rooms, designed to give a unique experience to
their guests.
The new regulations will also apply to Floating Hotels, better known perhaps to
tourists as Nile Cruisers. Their classification in particular, at times, has been
problematic and inconsistent.
The benefits of this new system will not only aid tourists in their selection of
accommodations, but the hotel industry in Egypt as well. It will eliminate the
phenomenon of lowering prices as the only means of competition. For example,
in the old system, many hotels with exceptional properties (and considerable
investment in those properties) had to compete with sometimes far more inferior
properties that had the same star rating. The only way that the superior hotels
could often compete is through pricing, which had the affect of eliminating profits
and thus over time, the superiority of those hotels. The new system will also lead
to an equitable market distribution between different grades of hotels.
Another target of the Ministry of Tourism is increasing the level of service
provided by hotel employees, and this new system is expected to vastly improve
those levels, as well as promote the training of hotel employees.
Perhaps one of the most important aspects of this system is that it conforms to
international standards for hotels. It is also a very objective system, leaving little
room for subjective evaluation that might be influenced by the mood of an
inspector.
The Egyptian Hotel Association has announced the new specifications of the new
system as follows:

11
The old hotel classification system that dates back to 1982 ranked hotels into five
categories (one through five stars). Hotels were also divided into five kinds,
consisting of: Cities, Villages and Off-Shore Leave Hotels, Resorts Hotels,
Floating Hotels and Camps. Under the new system, the one through five star
systems will remain, but the star ranking will be followed by the NN, indicating
that the hotel has been ranked under the new system. However, the kinds of
hotels have been increased to six, and now include: Cities and Resorts Hotels,
Floating Hotels, Boutique Hotels (small and distinctive), Environmental and
Ecological Hotels. Note that the new system ends the distinction between City
and Resort Hotels.
Evaluation rules:
The two part evaluation includes:
Environmental assessment and equipment (consisting of the infrastructure, that
is, the hotel itself, including components such as restaurants, bars, swimming
pools, etc. and the hotel equipment).
Evaluation of the level of service (undeclared visits or Mystery Shopper), within 6
months from the date of initial operations.
70% of the marks are for the infrastructure and equipment and 30% are for the
level of service. The hotel must receive 80% (as a minimum) of the total marks
allocated to the category star rating.
Though the system is somewhat complex, covering almost every aspect of hotel
operations, some additional explanation might help.
For infrastructure and equipment, the evaluation examines specific items, such
as the building itself, the rooms, the restaurants and the reception area (among
others). Within each of these main items, secondary items are also examined.
(though we have not been provided with specifics on secondary items, we would

12
suspect, for example, that in a restaurant secondary items might include seating,
kitchen equipment, etc). Points are then awarded for each item and secondary
item. For City Hotels, 41 items are assessed and given up to 164 points and 137
secondary points. Each of these primary and secondary items will be awarded a
maximum of 6 points, though the lack of secondary items could lead an item to
register negative points.
The level of service will be assessed through undeclared visits by a Mystery
Shopper employed by international specialized companies under the auspices of
the Egyptian Hotel Association and the Ministry of Tourism.
The level of service will evaluate the reservation service (containing 30 items),
service outside the hotel and car parks (7 items), reception (22 items), rooms (59
items), room service (23 items), restaurants (54 items), public areas (30
items) and departure or check-out (31 items).
The Egyptian Hotel Association is involved in the evaluation committees for both
the structure and equipment, and for the level of service. Evaluations must be
approved by the Minister of Tourism, the Head of the Hotel Control, and the
Chairman of the Egyptian Hotel Association.

13
Comparative Position of selected Industry / Sector / Specific Company /
Product with India and Gujarat
GUJRAT in INDIA
Amitabh Bachchan‘s hugely publicized ads for Gujarat have been beneficial to
the state in many ways, from which Gir seems to be benefiting the most. Gir has
witnessed a huge increase in number of travelers in recent months.
According to the figures between June 2009 to May 2010 Gir National Park and
Gir interpretation center of Devaliya both were visited by 5166 foreign tourists
and 200800 Indian tourists; which is a total of 205966 tourists. From which the
Gir interpretation center had 213 foreign and 134005 domestic tourists while the
Gir sanctuary had 4953 foreign and 66795 domestic tourists.
But in year 2011 the number has increased by 98,861 tourists. According to
forest department officials in Sasan Gir; 239 foreign tourists and 1, 70,350
domestic tourists, totally 1, 70,589 tourists have visited Gir interpretation centre
and 6061 foreign tourists and 1, 28,177 domestic tourists, totally 1, 34,238
tourists had visited Gir sanctuary between June 2010 and May 2011.
Last year Gir Interpretation center made an income of Rs 1, 20, 46,155; whereas
Gir sanctuary made Rs 87, 20,000. In total the forest department made an
income of Rs 216, 66,840. While this year with 98,861 more tourists, Gir
sanctuary has made Rs 1, 66, 49,950; whereas Gir Sanctuary made Rs 1, 56,
91,726. In total the forest department made an income of Rs 3, 23, 41,676 which
is Rs 1, 06, 74,836 more than previous year.
Apart from that the hotels and other hospitality resources near the National Park
are benefiting from the increase in the number of tourists. Take an example of
local car operators. While one Gipsy car driver was getting 70-80 tourist trips of
Gir sanctuary in 2009-10, in year 2010-11 the same driver got 120-150 trips.

14
But the real hospitality the tourists will never forget is the one offered by the small
farm owners in the villages nearby, the tourists feasted on delicious Kathiyawadi
food like Bajra No Rotlo, Kadhi, Khichdi and Olo.
In spite of claim of various sources, the tourism in Gujarat has not picked up to
the desired level. The main problem is that tourism so far was not given the
required importance .It is only under Mr Modi that efforts to promote tourism have
been made in Gujarat. This is one of the rare fields where Gujarat lags behind in
comparison with Kerala, Rajasthan, and HP etc. Hiring the services of Big B will
help to promote tourism in the state, but at the same time it has to be ensured
that the required infrastructure and other facilities are available and maintained
for prolonged use. I will also like to highlight that the prohibition policy of Gujarat
should not be a hindrances in promoting tourism in the state. I have come across
several people who have travelled all over India / world without consuming a drop
of alcohol. What we need in Gujarat is a tourism culture which exists in states like
Goa, Kerala etc for which the Tourism Dept. has to create the required
awareness.
Gujarat is 10th popular domestic tourism state in India, but foreign tourists
are just minute
Gujarat government‘s magazine ‗Gujarat has cover story in its latest issue that
shows Chief Minister Narendra Modi dressed in traditional holding an
embroidered umbrella. While the photo is OK, the caption says: ‗Gujarat is top
destination in terms of tourist‘s preference‘, which is completely wrong and
untrue claim.
Following are the important highlights of data for 2009. According to this data,
Gujarat is at tenth place so far as domestic tourist traffic figures. In view of
percentage, Gujarat‘s share is very low.
(a) Domestic Tourist Visits to Sates/ UTs

15
During 2009, the number of domestic tourist visits in India to the States/ UTs was
650 million as compared to 563 million in 2008 and 527 millions in 2007.
During 2009, the number of domestic tourist visits in India to States/UTs
registered an increase of 15.5% over 2008 as compared to increase of 6.9% in
2008 over 2007.
The top ten States in terms of number of domestic tourist visits (in millions)
during 2009 were Andhra Pradesh (157.5), Uttar Pradesh (134.8), Tamil Nadu
(115.8), Karnataka (32.7), Rajasthan (25.6), Maharashtra (23.7), Madhya
Pradesh (23.1), Uttarakhand (21.9), West Bengal (20.5) and Gujarat (15.9).
The contribution of top 10 States was about 88% to the total number of domestic
tourist visits during 2009. The percentage shares of top 5 States were Andhra
Pradesh (24.2%), Uttar Pradesh (20.7%), Tamil Nadu (17.8%), Karnataka (5.0%)
and Rajasthan (3.9%).
Seeing the trend of domestic travel, we can sum up that religious travel is
on the top. Business travel can add up to some extent too. Why Andhra Pradesh
is no. 1 in domestic travel? Well the answer is perhaps Tirupati mandir. And
Hyderabad of course adds to it in terms of business arrival. At second number is
Uttar Pradesh which has Taj Mahal, number of Hindu religious places, Ganga,
and of course Kumbh mela. Gujarat‘s entry into top ten is thanks to Somnath,
Dwarika, Palitana and Nageshwar Jyotirlinga. But staying behind West Bengal,
Madhya Pradesh and Tamilnadu in top ten is shameful for Gujarat looking at its
potential.
Now let‘s come to foreign tourists arrival figures. Gujarat is nowhere in top
ten. This means Gujarat has much to do in this area.
(b) Foreign Tourist visits to States/ UTs
During 2009, the number of foreign tourist visits (FTVs) to the States/ UTs was
13.7 million as compared to 14.1 million in 2008 and 13.3 million in 2007.

16
During 2009, the number of FTVs to States/UTs registered a decline of 2.8%
over 2008 as compared to an increase of 6.4% in 2008 over 2007. This decline in
FTVs is similar to the trend of the decline of 3.3% in the foreign tourist arrivals
(FTAs) during 2009.
The top ten States in terms of number of FTVs (in millions) during 2009 were
Tamil Nadu (2.37), Maharashtra (2.0), Delhi (1.96), Uttar Pradesh (1.53), West
Bengal (1.18), Rajasthan (1.07), Andhra Pradesh (0.80), Kerala (0.55), Bihar
(0.42) and Himachal Pradesh (0.40).
The contribution of top 10 States was about 90% to the total number of FTVs in
the country during 2009. The percentage shares of top 5 States were Tamil Nadu
(17.3%), Maharashtra (14.6%), Delhi (14.3%), Uttar Pradesh (11.25) and West
Bengal (8.6%).
Data show that domestic tourism registered an impressive growth of 15.5% in
2009 in spite of economic recession and other adverse factors for tourism. On
the contrary, FTAs and FTVs registered a decline of 3.3% and 2.8% respectively
during the same period. This brings out the importance of domestic tourism in the
overall tourism development in the country.
Bottom of the story is that: We don‘t need unnecessary and untrue
boasting about tourist preference on the cover page of government‘s official
magazine with Chief Minister‘s photo. Lots of work has to be done in
infrastructure sector so far as tourism in Gujarat is concerned. While past
Congress governments created infrastructure, but couldn‘t maintain it. The BJP
government has taken ‗closure and privatization‘ route. Present government
doesn‘t believe in running the show on own, but wants private players to come up
and invest in tourism sector. Some partners are coming in, but it‘s just not
enough, actually it‘s far from enough. When it comes to Tourism sector, Gujarat
govt. is just beating the drums and it is fine, but the drum is hollow from inside.

17
GROWTH OF TOURIST IN INDIA
Tourism and hospitality being the largest service sector in the country,
contributes around 6.23 per cent to the national GDP and 8.78 per cent of the
total employment in the country. The country welcomes around 6 million
international visitors every year and nearly 562 million domestic tourists.
The Union Ministry of Tourism compiles a monthly estimate on the foreign
tourist arrivals (FTAs) and foreign exchange earnings (FEE) based on the total
number of foreign visitors in the country. The important trends in the sector for
June 2011 based on the report by the Ministry of Tourism are as follows:
The total number of tourists visiting the country during June 2011 were 0.39
million as compared to 0.37 million during June 2010 and 0.352 million in June
2009.
A growth of 7.2 per cent has been registered during June 2011 as compared to
4.9 per cent growth in June 2010. Also, the 7.2 per cent growth rate in June 2011
was higher than the observed growth rate of 7.0 per cent in May 2011.
FTAs during the period January-June 2011 were 2.91 million with a growth of
10.9 per cent as compared to the FTAs of 2.63 million with a growth of 8.9 per
cent during January-June 2010 over the corresponding period of 2009.
FEE during the month of June 2011 were US$ 1,213 million as compared to FEE
of US$ 1,020 million during the month of June 2010 and US$ 796 million in June
2009.
The growth rate in FEE in June 2011 over June 2010 was 18.9 per cent as
compared to the growth of 28.1 per cent in June 2010 over June 2009. FEE from
tourism during January-June 2011 were US$ 7,811 million with a growth of 14.2
per cent, as compared to US$ 6,842 million, with a growth of 36.6 per cent during
January-June 2010, over the corresponding period of 2009.
Revenue of tourism in Egypt

18
The number of incoming tourists to Egypt during the year 2008/2009 reached
about 12,3 million tourists (compared to 7,5 million tourists during the year
2003/2004) spending about 123,4 million tourist nights, slight decrease sue to the
global crisis .
The tourism revenues reached increased rate at about 69% during the period
2004/2005 till 2007/2008 since the revenues rose from 6.4 billion US dollar up to
10.8 billion US dollar. These revenues were affected by the financial crisis as
they decreased to 10.6 billion in 2008/2009.
In 1999, 90% of Egypt‗s tourism investment was concentrated in coastal resorts
or southern Sinai, with a large concentration on dive tourism and beach holidays
around the Red Sea Gulf of Aqaba (Shackley 1999). As a result, tourism revenue
in Egypt increased by 53% from 1988 to 1992 (Alavi and Yasin 2000). This is one
of the world‗s fastest-growing resort areas, resulting in environmental concern for
the coral reefs and the desert hinterland (Shackley 1999).
So the development of tourism sector has provoked a great progress of
investment rate. It rose about 38.7% between 2006/2007 and 2007/2008. The
private sector contributed to about 84% of these investments.
European countries are the main source of incoming tourism for Egypt since they
constitute about 74.2% of the total number of tourists followed by the Middle East
countries at 13.6% .

19
Present Position and Trend of Business (import / export) with India /
Gujarat during last 3 to 5 years
Sector Imports % change over 2008-09
Exports % change over 2008-09
2009-10 (US Dollar thousand)
2008-09 (US Dollar thousand)
2009-10 (US
Dollar thousand)
2008-09 (US Dollar thousand)
Agriculture:
Spices
1,10,045.75 76,538.65 43.778% 5,56,050 5,30,025.5 4.910%
Edible oil
48,450.00 45,443.32 06.616% 89,300 85402.98 4.56%
Dairy products
515,574
Manufacturing:
Mining 261,600 7,593,942
Engineering
Chemicals 55,672
Services:
Tourism 2,538,100 10,755,300
Software 229,346
Projects, Articles
145,349
Information services
134,300 78,700 70.648% 170,700 218,800 -21.98%
Banking:
Licenses 284500 321,600 -11.536% 122,000 138,000 -11.59%
Business 1,859,500 2,842,600 -34.585% 1,786,600 1,788,700 -0.117%
Insurance 1,354,500 1,583,800 -14.478% 75,300 216,300 -0.652%
Total products
712209.10 663,818.34 07.289% 663,818.34 759,464.44 -12.594%

20
Import & Export Information for India
International trade has increasingly played an important role in the local
economy. Being an island nation, many goods are imported for consumption in
the local market. It has been estimated that up to 60% of all goods consumed are
in fact imports. The main trading partner is the United States, following by the
European Union, Mexico and Venezuela. The recent Lome agreement especially
has strengthened economic and trading ties with The European Union. ~ See
commentary regarding favorable duties schedule granted for exports bound for
the European Union.
On the other hand, the Dominican Republic has been a key exporter or producer
of cocoa, coffee, Ferro-nickel, gold, silver, and sugar and textile goods. The
tremendous growth of duty free manufacturing has contributed to an upward
spike in exportation of clothing, footwear and other finished products.
While goods coming into or leaving the duty free zones are exempt from many
types of duties or tariffs, imported goods bound for the local market face the
following schedule:
Import Tax from 5% up to 35%, depending on the product or item considered
(finished goods tend to have a higher tariff schedule than raw materials or
construction materials)
Consumption or Excise Tax from 5% to 80% on goods considered to be luxury
items, based upon value or prior purchase price.
Some items which are considered to be favorable to the health and well-being of
either individual citizens or certain industries are afforded special treatment.
Examples would include medicines, certain agricultural items, herbicides and
pesticides‘ and some raw materials. See Presidential decree number 339-90
and 366-91 for additional information on the included items.

21
The Dominican government certainly wishes to encourage the development of
exports and any industry that may create additional new employment in the
country. For more information on the Free Zones, readers are encouraged to
review our separate section on this topic.
THE hotel industry has welcomed the mini Exim policy announcement permitting
duty-free imports by the hospitality industry as it would bring down the difference
in the rates of food and beverages being charged by five-star and other category
of hotels.
According to the policy notification issued by the DGFT, heritage hotels, one and
two-star hotels and standalone restaurants have been extended the benefits of
duty-free imports admissible to the tourism sector. However, the entire benefits
will have to be passed on to the customer.
Reacting to the announcement, Mr Lalit Suri, President, Hotel Association of
India, felt that the food and beverage intake in the categories covered in the
policy is likely to go up. "The discrimination between the rates charged by the
five-star hotels and other categories would decrease and it would encourage
foreigners to use these hotels," he said.
The Secretary-General of the Federation of Hotels and Restaurants Associations
of India, Mr Shyam Suri, said that the measures announced were very good but
felt that the statutory requirement of passing on the price benefits to customers
was not a fair one. "We are not happy with the clause that hotels must pass on
the concessions to the customer as we are already passing on the benefits to
them. This kind of clause has not been fixed for any other industry," he said.
The Exim policy clearly states that hotels, heritage hotels and standalone
restaurants approved by the Department of Tourism and other service providers
registered with it would be entitled for duty-free imports equivalent to five per cent
of the average foreign exchange earned by them in the preceding three licensing

22
years. For one and two-star hotels and standalone restaurants, the foreign
exchange earned through international credit cards only shall be taken into
account for entitlement under the scheme.
The duty-free entitlement shall be used for import of any capital goods, including
spares, office equipment and professional equipment, office furniture and
consumables. However, agriculture, dairy products, motor cars, sports utility
vehicles and all-purpose vehicles would not be allowed to be imported under the
entitlement.

23
Policies and Norms of egypt for hotel and restaurant for import / export
including licensing / permission, taxation etc
DUTY STRUCTURE
Impact of duties on hotel and restaurant products
Service tax rate has been kept at 10%. Hotel accommodation in excess of
declared tariff of Rs 1,000 per day, service provided by A/C restaurants that have
license to serve liquor, some category of hospitals, diagnostic tests, consultant
doctors are the new services which have been brought under the service tax net.
The effective burden will be 3% of the bill in case of hotels and A/C restaurants.
Service tax on air travel has been increased by Rs 50 for domestic travel and Rs
250 for international travel in economy class. Service tax will be 10% flat on air
travel in higher classes.
The widened service tax on A/C restaurants means every meal out will be
costlier as most restaurants serve liquor and are family gathering places.
Services that will become dearer due to the budget proposals include treatment
in air-conditioned private hospitals, meals at restaurants serving liquor, and
hotels charging more than Rs 1,000 per room per day.
Ready-to-eat food items, such as tomato ketchups, soups, 'mudis' (puffed rice),
instant coffee and tea mixes, flavored milk, and supari may also become dearer
as they will now attract higher excise duty. Ice cream may become dearer as the
budget brings the category under the excise duty net with a concessional levy of
1%. Britannia may increase the prices of its products due to hike in excise duty.

24
Post budget, children might have to shell out more money to buy candies such as
'Alpenliebe', 'Buttercup', and 'Big Babol' as candy makers may phase out 50
paisa category with those of 1 Rs/ 2 Rs due to the hike in excise duty on
confectioneries. An increase is imminent in the number of Rs one brands and the
50paise candies could get eliminated just as the 25 paisa candies did in the past.
The increase in the excise duty of sugar confectionery could lead to MRP price
hikes or reduction in the size of the confectionery.
CUSTOMS TAXATION:
Applicable duties and taxes:
Customs duties: Customs duties range between 5 percent and 70 percent, but
rates on luxury items including cigarettes, alcohol, and automobile may exceed
150 percent.
Ad-valorem duties: most items are taxed on an ad-valorem basis. The tariff rate
in effect on the date of assessment is applied to the C.I.F. value of the goods.
Preferential duties: Egypt is a member of the League of the Arab States and its
major institutions, including the Arab Economic Unity Council. Member States
concluded an agreement aiming at establishing The Arab Common Market. They
agreed to remove customs duties on agricultural products, animals and natural
resources in trade among themselves.
Customs surcharges and indirect taxes: Imported items are assessed a
surcharge to cover inspection, listing, classification, and re-examination of goods.
The applicable rates are 3 percent for goods dutiable at 30 percent or less than 6
percent for goods dutiable at more than 30 percent. The Government had
decided to eliminate this surcharge by July1995.
Sale taxes: Sales taxes are levied at rates ranging from 5 percent to 25 percent.
Excise duty is collected on the imports of alcoholic beverages, benzene, coffee,

25
cotton yarn, and several other products. There is an additional excise duty on
brandy, cognac, gin, and whiskey.
As the year ended on a positive note with tourists returning to India, the Ministry
of Tourism has pitched for greater incentives for the industry to fuel further
growth. .
The ministry has sought inclusion of hotels as infrastructure under section 80- IA
of the Income Tax Act to boost new hotel projects being set up by companies.
Hotel industry sources feel if this incentive is given to the hotel industry, all new
hotel projects will be able to avail the benefit of 100 per cent deduction with
respect to profits and gains for a period of 10 years. This may bridge the shortfall
of hotel accommodation in the next five years as investments may come into the
sector and help lower room tariffs. Officials said if this section, which was
applicable till 2005- 06, is revived it will lure investments into the hotel and
tourism sector.
Federation of Hotels and Restaurant Association of India
(i) Direct taxes
Section 80IA: Infrastructure status for the hotel industry
In the list of infrastructure projects, hotels may be included just like airports,
seaports, and railways, etc.
In fact under Section 10 (23) g of the Income Tax Act, hotels were added to the
infrastructure list so that the interest received by financial institutions and banks
for loans extended to hotels were tax exempted. However, the section itself was
discontinued with effective from April 1, 2007.

26
All new hotel projects will be able to avail the benefit of deductions of 100 per
cent with respect to profits and gains for a period of 10 years. This will lead to
many new hotel projects being set up, with companies re-investing their profits in
the hotel sector.
Further, it will help in channeling huge investment about Rs 50,000 crore (Rs 500
billion) in the tourism sector in next 3-4 years and quickly bridge the shortfall of
hotel accommodation.
Section 80-IC
As per Section 80-IC of the Income Tax Act, any undertaking commencing any
operation specified in the Schedule XIV and having undertaken substantial
expansion during the period from January 7, 2003, to April 1, 2012, to promote
eco tourism in the special category states (like Sikkim, Assam, Tripura,
Meghalaya, Mizoram, Nagaland, Manipur, Arunachal Pradesh, Uttaranchal and
Himachal Pradesh are exempt from income tax for five years, for promoting eco
tourism in the country.
But the income tax authorities have denied deductions to hoteliers on the ground
that the activity of a hotel does not constitute an operation as specified in
Schedule XIV of the Income Tax Act and they have also directed the hoteliers to
explain the eco tourism activity in their project.
The hotel sector seeks a liberal view to include hotels as an eligible activity of
eco tourism in Schedule XIV, to enable them to claim the above benefit.
Deduction to be made in computing total income under Sec 80
While calculating the total income of an individual deduction of LTC paid to an
employee be admissible, as in the case of other deductions via PF, Mutual
Funds, LIC, etc. This will promote domestic tourism all over India and increase
revenues for the government.
Section 80-ID

27
In the Income Tax Act 2007-08, Section 80 ID was introduced to give
encouragement to 1, 2, 3 and 4 star hotels and convention centers of a minimum
seating capacity of 3,000 persons being set up in the National Capital Region of
Delhi, Gurgaon, Faridabad, etc, for the Commonwealth Games in 2010.
A tax holiday for five years was granted to these hotels that would open before
March 31, 2010.
The areas covered under this section were further expanded in the Budget
proposal 2008 to several other locations. Presently, the benefit is extended to
new hotels set up in the specified region and the benefits are not allowed to
substantial expansions of hotels and resorts in these regions.
Substantial expansions of room capacity in excess of 30 per cent of the existing
capacity should also be treated eligible for the tax holiday benefits. The coverage
of the benefits granted under this section should be extended to all categories of
hotels throughout the country, and those which open in the next 10 years.
Section 32
Hotel buildings are considered as plants for the hotel industry as they are utilized
for 24 hours. The industry is required to make heavy investments in renovation,
up gradation and upkeep of the hotel buildings at all times to keep it in pristine
condition.
Section 32 of the IT Act should be amended to restore the depreciation rate to 20
per cent.
(ii) Indirect taxes
Service tax
Hotels and other tourism related service providers who earn foreign exchange
have been included as the 13th sector in the Service Export Promotion Council
set up by the ministry of commerce, government of India.

28
As such, they may be granted exemption to the extent of foreign exchange
earned for the following services provided by the hotels, i.e. banquet rentals,
rent-a-cab, dry cleaning services, health club or fitness centre services, beauty
parlour services, internet cafe services, club/association service, business
support services, business auxiliary services, management consultant services,
renting of immovable property, etc.
Custom duty
The customs duty structure should be rationalized for hotels and restaurants in
tune with the international practices, to enable the Indian service sector to
compete with their international counterparts.
This is specially so for import duty payable by small sized hotels and restaurants
who do not earn substantial foreign exchange and therefore, are not eligible for
any of the Export Promotion Capital Goods schemes.
Excise duty
Seeks excise duty exemption on supply of food preparations (as part of their food
and beverage services) by hotels or restaurants to their by guest (staying in the
relevant hotel).
Also, hotels and restaurants with turnover less than Rs 1.50 crore (Rs 15 million)
should be exemption from paying central excise duty on the products produced
and consumed within the premises.
Luxury tax

29
Luxury tax varies widely across services and states. Also, in the most of sales it
is charged on the published tariff by not considering the commissions paid to
agents and discount offered to walk-in clients.
So the industry seeks exemption of luxury tax on the room tariff less than Rs
2,500 and to charge a uniform rate of 4 per cent on the actual tariff where room
rent is Rs 2,500 or more per day.
VAT/Sales tax and other taxes
Vat/Sales tax on food & beverage are different for each state and it should be
uniform over the country. It will help in many hotel projects coming up all over the
country which leads to lowering hotel tariffs and generating employment.
DATA ANALYSIS
Interpretation:
There is a big difference between India and Egypt per capital income. In 2010
India par capital income is 54527 and Egypt is 5650. From this interpretation of

30
the par capital income we can say that Indian people stander of living is better
than the people of Egypt.
Interpretation:
By the interpretation of the growth rate of the year 2010 we can see in the chart
that the growth rate of Egypt is greater than India. As there is less population in
Egypt and highly dependability on tourism industry.

31
Interpretation
As par the past year the sales is decline in the current year. The reasons behind
it are only the rise of the tourism sector in other country and the effect of global
recession.

32
Interpretation:
Here from 10 year data the first four year are having EPS in minus. And next of it
six years are having positive EPS.
Interpretation:
From total revenue of the last two financial year of oberoi hotel it is clear that the
number of tourist are in Egypt is rise. In the year 09-10 the revenue is 9072.73
and in the year 10-11 it is 11429.49

33
Business Opportunities in future
Hotel industry thriving in Egypt
Egypt is currently witnessing an unparalleled boom in tourism in the past four
years; tourism revenue has increased by 40 percent.
In order to further increase national income from tourism, the country has
directed part of the foreign investment capital to construct new hotels to
accommodate the growing number of tourists.
When asked to describe the current market situation, Simon F. Cooper,
president and chief operating officer of the Ritz-Carlton Hotel Company,
commented that, "With the growth in tourism, the increasing strength of the
Egyptian economy, the sustained development of the infrastructure required, and
the investment support from within the Egyptian tourism and hospitality sector,
we see expansion within Egypt to be an important future strategy."
It appears not only leading hotel operators are looking to branch into this
emerging market. Cooper's sentiments were echoed by HGBD Arabia's Waleed
Mohammed Abdel Saleem In a recent survey, the Design Division manager
gave his opinion on the Egyptian tourism market saying, "Egypt is a healthy and
profitable market, and there are lots of areas that need resorts and hotels."
Experts have indicated that there needs to be a level of sophistication in
designing and constructing hotels to fit the demands of the increasing tourism
boom.
As was outlined, this region holds a great potential for future construction
projects in the tourism industry, and there is no doubt that the demand is there. In
order for hotel owners to learn more about the direction of the market, it is
paramount to network with and understand the unique challenges in the design
and construction industry for Egyptian hotels.

34
What are the opportunities so that one can establish a new hotel?
Russia, Germany, UK, and Italy are the important destinations from where a
large number of visitors come to Egypt. In future, the UK is expected to outpace
Germany, acquiring second rank after Russia in terms of tourist arrivals.
Increasing disposable income will open up several opportunities for both
outbound as well as domestic tourism in Egypt. It is expected that per head
disposable income in the country will go up at a CAGR of 5.36% during 2008-
2012.
Egypt is targeting to lure around 14 Million tourists by 2011 end. To achieve this
target, the country needs to build 240,000 hotel rooms by 2011 that requires an
annual investment of over US$ 1 Billion. This represents a huge opportunity for
infrastructure developers, particularly hotel groups.
Per head expenditure by inbound tourists in Egypt is projected to increase by
about 53% in 2012 from 2007.
THE AREA OR SERVICES FROM WHERE EGYPT HOTELS COLLECT
MONEY
1. Some special foods.
Koshary
Molokhiyya
Pigeons
desserts
Umm ali ( is national dish of Egypt)
Bouzat haleeb
2. Accommodate for meetings and conferences.
Audio Visual Equipments
Stationary
Live Conferencing
Logistic Support

35
3. Rooms & suites
All rooms come with the best features
Luxury Pavilion
Luxury Villa with Private Garden
Luxury Villa with Private Pool
Royal Villa with Private Pool
4. Special offers
EXOTIC HONEYMOON
UNFORGETTABLE EXPERIENCE 5. Some of the other basic facilities on offer:
Baby sitting facilities
Beauty salon
Boutique
Business Centre
Car Parking (free)
Concierge services
Computer data points
Dry cleaning
Foreign Exchange
Laundry
Limousine/ Car rental services
Luggage store room
Medical service (on call)
Meeting rooms
Pressing
Safety deposit boxes
Secretarial services
In Room safe
Private swimming pools

36
Wireless internet access
Board games
Gymnasium
Library of DVDS and books
Massage / Steam bath
Flood lit tennis courts
Water sports
Findings
In 2010 India par capital income is Rs 54527 and Egypt is $5650. From this
interpretation of the par capital income we can say that Indian people stander
of living is better than the people of Egypt.
By the interpretation of the growth rate of the year 2010 we can see in the chart
that the growth rate of Egypt is greater than India. As there is less population
in Egypt and highly dependability on tourism industry
From total revenue of the last two financial year of oberoi hotel it is clear that
the number of tourist are in Egypt is rise. In the year 09-10 the revenue is
9072.73 and in the year 10-11 it is 11429.49.
In 2004, government cut tariffs sharply and simplified the customs regime to
stimulate trade and economic development.
Egypt adopted the WTO customs valuation system in 2001.
Industry is the second-largest economic sector in Egypt, and accounted for 32
percent of GDP in 1999. Some 13 percent of the total labor force is employed in
industrial activity.
Egypt and India in an ambitious plan are looking forward to an exponential
increase in bilateral trade volume, from the current $3 billion to $10 billion.

37
A year later it grew more than 50 % to $3.38 billion. Both India and Egypt have
been surprisingly enjoying robust growth, despite developed nations wilting under
the pressure of global economic slowdown.
Egypt forecast 16 million tourists for 2011. A million tourists fled the country,
abandoning the hotels and restaurants in Cairo, Luxor, Aswan and the Red Sea
resorts of Hurghada and Sharmel Sheik.
Egypt received 14.5 million tourists in 2010, making tourism the second
largest revenue source, after expatriate remittances, according to government
figures.
Egypt‘s Tourism provides jobs to 2 million Egyptians.
That the interest received by financial institutions for loans extended to hotels
were tax exempted.
All new hotel projects will be able to avail the benefit of deductions of 100 per
cent with respect to profits and gains for a period of 10 years.
Investment about Rs 50,000 crore in the tourism sector in next 3-4 years and
quickly bridge the shortfall of hotel accommodation.
The country needs to build 240,000 hotel rooms by 2011 that requires an annual
investment of over US$ 1 Billion.
From total revenue of the last two financial year of oberoi hotel it is clear that the
number of tourist are in Egypt is rise. In the year 09-10 the revenue is 9072.73
and in the year 10-11 it is 11429.49.
A huge opportunity for infrastructure developers, particularly hotel groups.

38
Conclusion and Suggestion
From the study of the Egypt hotel industry its economic condition and tourism
sector we get a clear idea that for the investor who have desire to invest in the
Egypt hotel industry then this is a golden chance for them and for their business
development.
Egypt is most famous place for ancient things like pyramids, mummification,
Pharaohs, polytheistic religion, Hieroglyphics etc. and so it is most favorite to
foreign Tourist.
In Egypt the ratio of foreign Tourist is continuously increase and so the income
from foreign Tourist is also rise and by that income the Egyptian economy is
become more stronger then earlier.
Here for making stronger Egyptian economy hotel industry is playing very
important role and so this industry is also provided more GOVT support then
other industries.
As Egypt is developing in tourist sector and hotel industry in past it was not as
hard hit by the recession as developed nations affected by the recession.
Thus, from the whole study of the hotel industries situation and position
and important of it we can conclude that for those who are wanted to

39
invest in hotel industries in Egypt then today they have available a golden
opportunity for it and developing their business.