gulf coast energy outlook 2017 df - louisiana state … resources and louisiana’s manufacturing...
TRANSCRIPT

Spring 2017
Sponsored by:
Center for Energy Studies Economics & Policy Research Group
Gulf Coast Energy Outlook

1 | Introduction
The inaugural Gulf Coast Energy Outlook seeks to provide a broad overview of the current status and trends guiding energy markets with an emphasis on the Gulf Coast Region. The research initiative is a collaborative effort of Louisiana State University’s Center for Energy Studies and E.J. Ourso College of Business and focuses on the energy sector of the Gulf Coast Region’s economy. Specific discussions will include overviews of upstream oil and gas production and downstream refining and petrochemicals. The research concludes with the contribution of the energy sector on the broader Gulf Coast economy as well as forecasts of future employment in relevant energy sectors. Unless stated otherwise, Gulf Coast hereafter specifically refers to the states of Texas, Louisiana, Mississippi, Alabama, and Florida. Special attention will be paid to Texas, Louisiana, and the Federal Offshore in the Gulf of Mexico oil and gas production.
While this document will show a number of graphs and figures, additional information can be found in a detailed slide presentation that is also publicly available, which provides more in depth information not covered in this document.1 The goal of this document is to provide the reader with a general understanding of the research vision and methodology employed to achieve specific research objectives associated with this vision.
2 | Oil and Gas Prices and Production
2.1 Historical TrendsOver the past two decades, the landscape for oil and gas development has been fundamentally shifted due to technological advancements made right here in the Gulf Coast Region of the United States. As the combining of horizontal drilling and sequential hydraulic fracturing has become economical in “tight” shale oil plays, the historic trend of declining oil and gas production has reversed itself and created historical increases in production that has fundamentally changed the trajectory of both the energy industry, and the economy more generally, both here in the U.S. and across the world. As shown in Figure 1, crude oil and natural gas have experienced historical increases in production due to this technological advancement.
1 Please refer to the LSU Center for Energy Studies website, ces.lsu.edu, for this and other research conducted.
Figure 1: U.S. Crude Oil and Natural Gas Production
1Louisiana State University

While technological advancement has fundamentally transformed this industry, drilling activity, and therefore production, still responds to changes in price. Figure 2 illustrates the response of U.S. rigs to the West Texas Intermediate (WTI) spot price over the most recent oil price cycle. From early 2009 until mid-2015, crude oil rig counts increased from a low of less than 200 rigs to more than 1,600 rigs at the peak. This eight-fold increase was associated with a time period of technological advancements in horizontal drilling and hydraulic fracturing, but increasing prices over this time period were also crucial in facilitating these continued technological improvements. In late 2014, though, a global market with historical increases in supply and relatively soft demand growth experienced a significant decrease in oil prices. From February to July of 2014, crude oil prices were trading at over $100 per barrel. But by early 2016, prices had bottomed
Figure 2: U.S. Crude Oil Prices and Rig Count
Figure 3: Monthly U.S. Horizontal Drilling Rig Activity (per Major Basin)
2 Gulf Coast Energy Outlook 2017

out at less than $30 per barrel. This price drop induced a reduction in active rigs, and by mid-2016 rig counts had dropped from the high of more than 1,600 to less than 350; a decline of more than 75 percent.
Just as these technological advancements allowed for the extraction of oil and gas from “shale” geological formations, much of the response to price swings has also occurred in these shale plays. Figure 3 illustrates the horizontal rig activity in four major shale plays; Bakken, Eagle Ford, Marcellus, and Permian. From January of 2007 to 2015, horizontal rig activity increased by 400 percent, but fell over half during the ensuing price collapse.2 The current rebound is being driven primarily by production in the Permian basin, located in western Texas.
During this past decade, not only did the U.S. experience historical increases in oil and gas production, but it was one of the only countries in the world experiencing large increases in production. This is because these horizontal drilling and hydraulic fracturing techniques used to extract resources from shale geological formations were discovered and perfected here in the Gulf Coast region of the U.S. Thus, Figure 4 illustrates that the U.S. has also experienced an increased share of world crude production. In fact, over the last 10 years, global crude oil production has increased at an average annual rate of 1.2 percent, while the U.S. share has increased from seven percent to over eleven percent.
2.2 Outlook
The challenging first step of any research initiative in the oil and gas sector is forecasting prices. Not surprisingly, commodity prices are the primary driver of short-term fluctuations in oil and gas production. And over the past decade, the underlying relationships between prices, drilling activities, and production have been fundamentally altered due to the advent of shale. Therefore, instead of attempting to provide a single price forecast, we instead present a summary of publically available price forecasts published by the U.S. government, banks, and other institutions.
Figures 5 and 6 contain the respective forecasts for the price of oil and natural gas for 2017 and 2018. Most crude oil price projections for 2017 are around $55 per barrel, ranging from a low estimate of $51 to a high estimate of $59. At the time of writing this report in mid-2017, actual prices in 2017 have ranged from $47 to $53. Oil prices are expected to increase in 2018 with price projections ranging from $55 to $75. Natural gas price projections for 2017 range from a low of $3.00 per million cubic feet (MCF) to a high of $3.55. From the beginning of 2017 until the time of this writing, Henry Hub prices have ranged from about $2.50 per MCF of a high of $3.50, currently resting slightly above $3.00. Prices are projected to remain relatively flat through 2018, with the highest projected 2018 price at $3.73.
2 In 2007, the United States Energy Information Administration began tracking shale rigs and production as part of its “Drilling Productivity Reports.”
Figure 4: Monthly Global and U.S. Crude Oil Production
3Louisiana State University

While prices are projected to stay relatively steady throughout 2017 and 2018, the breakeven price for drilling in key shale plays has decreased substantially over the past several years as companies continue to improve drilling techniques in shale geological formations. This is illustrated in Figure 7, which shows the wellhead break-even prices for key shale plays. In 2016, the breakeven price for oil ranged from $29 per barrel in Bakken to $39 per barrel in the Permian Midland basin. Thus, prices ranging from $50 to $60, as illustrated in Figure 5, are sufficient to continue production in many of these shale basins.
Oil and gas production forecasts are based on DrillingInfo’s Prodcast software that produces basin specific oil and gas production projections based on estimated breakeven prices and estimated future observed market prices. Thus, this
Figure 5: Crude Oil Price Outlook
Figure 6: Natural Gas Price Outlook
4 Gulf Coast Energy Outlook 2017

model is well suited for this application that focuses on potential production in a specific geographic region relative to total U.S. production. Figures 8 and 9 show forecasts for crude oil and natural gas production, respectively. Total U.S. crude production is projected to increase over 10 million barrels per day (MMBbls/d) by 2020, with much of this increased concentrated in the Gulf Coast region. Thus, the Gulf Coast region is expected to increase in its relative contribution to U.S. crude oil production over the next decade. U.S. natural gas production continues to be resilient and shows continued strong growth through 2020 and beyond. The Gulf Coast region makes a significant contribution to the 80 billion cubic feet per day (Bcf/d) U.S. market, but the Marcellus accounts for the largest relative share.
Figure 8: Forecast for Crude Oil Production
Figure 7: Wellhead Breakeven Prices for Key Shale Plays
5Louisiana State University

3 | Industry Outlook
The oil and gas produced in the Gulf Coast region serves as feedstock to a large refining and chemical manufacturing sector. These sectors serve as another crucial economic driver, particularly to the Louisiana and Texas economies. This section focuses on the general outlook for these industries. In recent years, the most important aspect has been construction boom in the sector, driven to a large extent by new natural gas production. We begin with this development.
3.1 Gulf Coast Chemical IndustryAs discussed in the prior section, the U.S. has experienced historic increases in both oil and natural gas production made possible due to extraction technologies in shale geological formations. Figure 10 shows the historical time series of Henry Hub spot natural gas prices while highlighting three distinct periods within the market. First, during the period from 1997 until 2000, the market experienced prices that averaged $2.89 per MCF, and volatility was relatively low. Then, after 2000 the market experienced both an increase in average prices, up to more than $6 per MCF, but also significant volatility as new shale production came online. Then, starting around 2008, prices responded to the growing supply from shale, leading to a significant drop in prices by almost half. During the post 2008 time period, prices have remained relatively low, averaging about $3.50 per MCF, but also volatility has remained subdued, with a standard deviation in weekly prices of less than $1 per MCF. New extraction technology has produced lower and more stable prices of natural gas, the key input into the Gulf Coast’s chemical manufacturing sector. Because this production serves as a feedstock in the chemical manufacturing sector, low and stable prices have created a renaissance in industrial development in the Gulf Coast region.
Natural gas is a feedstock in the production of upgraded commodities such as ammonia, methanol, and ethylene. Thus, these industries located in the Gulf Coast region now have access to consistent supplies of inexpensive natural gas, and this supply is expected to continue for decades. This presents a unique opportunity for significant expansion. The LSU Center for Energy Studies has tracked Gulf Coast industrial expansions over the past several years, and these announced capital expenditures are presented in Figure 11.3 There are a total of $240 billion dollars of either already completed or announced capital expenditures heavily concentrated in Texas and Louisiana. Figure 12 hones in specifically to Louisiana capital expenditures, broken down into three primary categories: LNG export, Methanol/Ammonia, and Cracker/Polymer. The continued low natural gas price outlook has facilitated over $142 billion in announced capital expenditures, with $46 billion already completed and $96 billion remaining.
3 Source: David E. Dismukes (2013). Unconventional Resources and Louisiana’s Manufacturing Development Renaissance. Baton Rouge, LA: Louisiana State University, Center for Energy Studies and author’s updates.
Figure 9: Forecast for Natural Gas Production
6 Gulf Coast Energy Outlook 2017

Turning back to the Gulf Coast Region as a whole, Figure 13 illustrates the breakdown of capital expenditures by category. As can be seen, LNG exports account for almost 60 percent of these expenditures, followed by Cracker/Polymer at 22 percent and Methanol/Ammonia at 11 percent. The concentration in LNG export facilities illustrates further the market’s projection that U.S. natural gas production is expected to continue for decades into the foreseeable future. In fact, if all of the LNG export applications currently filed with the U.S. Department of Energy were to come online, U.S. liquefaction capacity would exceed 50 Bcf per day by 2025, with most of this capacity coming online by 2020. Of this 50 Bcf, 45 Bcf (or about 90 percent) of these LNG liquefaction announcements are located in the Gulf Coast region. Thus, there is significant opportunity for the U.S. to export natural gas to markets all around the globe, which can support domestic production.
Figure 10: Natural Gas Pricing Trends and Volatility
Figure 11: Gulf of Mexico Region — Energy Manufacturing Capital Expenditures (by State)
7Louisiana State University

3.2 Gulf Coast RefiningAs mentioned above, in the late 2000s, after years of declining U.S. crude oil production, the combination of horizontal drilling and hydraulic fracturing techniques enabled companies to produce oil and gas from geological formations that had been, heretofore, uneconomic. This technological innovation sparked a renaissance in the U.S. crude oil production, which began rising quickly. By the end of 2014, U.S. production had reached levels not seen since the 1970s. But as not
Figure 12: Louisiana Energy Manufacturing Total Capital Expenditures by Sector
Figure 13: Gulf of Mexico Region — Total Proposed Capital Expenditures by Sector
8 Gulf Coast Energy Outlook 2017

mentioned above, as U.S. crude oil production rose, price differentials between domestic and international crudes grew to unprecedented levels. At its peak, the most widely cited U.S. crude benchmark, West Texas Intermediate (WTI), was trading at more than a $25 discount to the international benchmark, Brent. This was unheard-of: WTI had consistently traded at a slight premium to Brent for decades. The large differential created both significant opportunities and challenges to the Gulf Coast refining industries.4
This price differential created significant opportunities and challenges for the Gulf Coast refining industry. First, and most obviously, increased domestic production spurred refineries to begin purchasing discounted domestically produced crude oil coming from U.S. shale plays across the country. But there was a catch. Over the decades preceding the advent of shale, as U.S. production continued to decline, Gulf Coast refineries reacted by importing heavier crudes from around the world. In order to be able to process these heavier crudes, gradual modifications were made to refineries. This process reversed itself when light crude began to come into the market.5 The API gravity of crude feedstock to refineries had been declining for decades (i.e. crudes were getting heavier) until shale oil flooded the market and caused a reversal of this trend. Thus, the feedstock has gradually been getting lighter since.
This change in the gravity of feedstock was due to the ratio of heavy sour crude being imported to meet refinery demand relative to light sweet domestic crude. Because U.S. crudes are lighter than foreign crudes on average, historically the amount of crude imports and API gravity of feedstock have moved in tandem. As crude imports increased over the past several decades to meet refinery demand, the crude feedstock became heavier and heavier. Thus, the advent of shale crude in the U.S. also caused a reversal of the decades-old trend of increasing crude imports.
As shown in Figure 14, Gulf Coast petroleum products imports have remained flat over the past decade, but once shale crude began coming online in significant quantities starting in 2008 and 2009, exports of petroleum products began increasing significantly, and this trend has persisted until the present day. More specifically, the Gulf Coast region became a net exporter of petroleum products at the end of 2008, and since then net exports have increased at an average annual rate of 40 percent.
Figure 15 provides a breakdown of petroleum imports and exports for the entire U.S. by category including distillate, motor gasoline and other. Similar to the Gulf Coast region, but with a lag, the U.S. has also become a net exporter of petroleum products, with the largest growth in export of distillates. In 2011, the U.S. became a net exporter, and next exports have increased by 360 percent since then. 4 Tangential to the focus of this report, there was significant debate over the degree to which the refining industry’s inability to consume the “light” crude coming out of U.S. fields alongside a crude oil export ban was
creating this price differential. For more details on this, see Upton (2015), Crude Oil Exports and the Louisiana Economy: A discussion of U.S. policy of restricting crude oil exports and its implications for Louisiana, LSU Center for Energy Studies White Paper and Agerton, Upton (2017), Decomposing Crude Price Differentials: Domestic Shipping Constraints or the Crude Oil Export Ban? USAEE Working Paper No. 17-307.
5 See Technical Options for Processing Additional Light Tight Oil Volumes within the United States. Technical Report, U.S. Energy Information Administration (2015) for a discussion of refinery alternations needed to process these domestic light crudes.
Figure 14: Gulf Coast Petroleum Net Exports
9Louisiana State University

4 | Employment Forecasts and Broader Economic Implications
Given the proportion of U.S. energy production coming from the Gulf Coast region and the enormous recent capital investments in refineries and chemical manufacturing, one would anticipate a significant role for these sectors in the local economy. Tables 1 and 2 present two measures of the size of the energy sector for each state, the region and the nation.
Consider first measures of the size of the energy sector based on employment in Table 1. Column 1 of Table 1 presents the percentage of employment in oil and gas exploration and support. Column 2 contains similar information for refining and chemical manufacturing. For the region as a whole, oil and gas employment directly accounts for 1.3 percent of employment. Refining and chemical manufacturing contribute another 0.7 percent of employment in the Gulf Coast Region. While these figures may seem relatively small in percentage terms, this translates into over 308,000 jobs in oil and gas and over 253,000 jobs in refineries and chemical manufacturing.
Two features of these sectors make them even more important than implied by the number of direct jobs in the industry. First, the employees earn very high wages relative to employees in most other sectors in the Gulf South. Second, these are very capital-intensive sectors. Building and maintaining a refinery or chemical plant requires considerable capital investments. With over $45 billion of capital expenditures in recent years in these sectors, numerous jobs in construction and elsewhere can be tracked back to these sectors. Economic impact multipliers provide a method of estimating this impact. The size of the multipliers varies by geographic area and industry, but one can conservatively estimate that one job in these sectors supports at least four total jobs through the entire economy.6 This implies that when indirect jobs supported by the industries are included, oil and gas, refineries and chemical manufacturing supported 8 percent of all jobs in the Gulf South region or 2.2 million workers in 2015.
6 See Scott, Loren (2014), “The Energy Sector: Still a Giant Economic Engine for the Louisiana Economy — An Update,” for further discussion of multipliers. Scott notes an overall job multiplier of 4.4 across similar sectors (his study also includes pipelines) ranging from 3.6 for oil and gas extraction to 9.0 for refineries.
Figure 15: U.S. Petroleum Product Imports and Exports
10 Gulf Coast Energy Outlook 2017

Table1: Size of Energy Sectors Measured by Employment
Percent of State Total Employment Percent of Industry Employment in US
Region
Upstream Oil and Gas Extraction and
Services
(1)
Refining and Chemical Manufacturing
(2)
Upstream Oil and Gas Extraction and
Services
(3)
Refining and Chemical Manufacturing
(4)
Alabama 0.1% 0.7% 0.2% 1.4%
Florida 0.0% 0.3% 0.1% 2.3%
Louisiana 2.3% 1.9% 7.9% 4.0%
Mississippi 0.4% 0.8% 0.8% 0.9%
Texas 2.2% 0.9% 46.7% 11.1%
Gulf Total 1.3% 0.7% 55.7% 19.8%
US Total 0.4% 0.7% 100.0% 100.0%
Source: U.S. Bureau of Labor Statistics, 2015 annual Quarterly Census of Employment and Wages data.
In terms of relative importance within the state, energy sectors are most important in Texas and Louisiana. With large population and little energy production, Florida has by far the least exposure to the energy sector of any Gulf Coast state. While energy plays a larger role in the Louisiana economy, the energy sectors in Texas are larger, matching the size of the state. In 2015, Louisiana employed roughly 44,000 workers in oil and gas compared to almost 260,000 in Texas. For refining and chemical manufacturing, Louisiana had 37,000 workers compared to just over 100,000 in Texas.
Table 1 also presents the relative share of U.S. employment within these sectors located in each respective state. As seen in Columns 3 and 4, the Gulf Coast region accounts for more than 55 percent of all upstream oil and gas jobs in the country, while accounting for about 20 percent of downstream refining and petrochemical jobs. Unsurprisingly, Texas is the most important contributor to both of these U.S. sectors, accounting for over 46 percent of U.S. upstream jobs and more than 11 percent of refining and petrochemical jobs alone. Louisiana accounts for about 8 percent of upstream oil and gas jobs nationwide and 4 percent of refining and petrochemical jobs.
Table 2 provides a corollary to Table 1, but using Gross Domestic Product (GDP), or output, as a measure of the size of each sector. Given the capital-intensive nature of both these sectors, it comes as no surprise that the relative contribution to GDP exceeds the share of employment for both sectors. For the region, upstream oil and gas accounts for more than 8 percent of GDP (while only accounting for 1.3 percent of employment), while refining and chemical manufacturing make up just over 5 percent of GDP in the region (while only accounting for less than 1 percent of employment). Comparing the Gulf Coast region’s GDP in these sectors relative to the nation, the Gulf Coast region accounts for 62 percent of the nation’s upstream output and 29 percent of refining and petrochemical output. Thus, the energy industry in the Gulf Coast region is both important to the region itself, but also, these industries make up a significant share of the U.S. industry for each sector. Tables 1 and 2 therefore underscore the economic importance of these industries to the Gulf Coast region, specifically, and to the U.S., more generally.
11Louisiana State University

Table 2: Size of Energy Sectors Measured by GDP
Percent of State Total GDP Percent of US Industry GDP
Region
Upstream Oil and Gas Extraction and
Services
(1)
Refining and Chemical Manufacturing
(2)
Upstream Oil and Gas Extraction and
Services
(3)
Refining and Chemical Manufacturing
(4)
Alabama 0.5% 3.1% 0.2% 1.1%
Florida 0.0% 0.9% 0.0% 1.4%
Louisiana 7.7% 16.7% 4.6% 7.7%
Mississippi 1.5% 3.5% 0.4% 0.7%
Texas 14.3% 6.0% 56.7% 18.4%
Gulf Total 8.4% 5.1% 61.9% 29.4%
US Total 2.4% 3.0% 100.0% 100.0%
Source: U.S. Bureau of Economic Analysis.
State specific forecasting models were created for four separate three-digit industrial sectors. Using North American Industrial Classification System (NAICS) industry codes, we focused on:
> 211- Oil and Gas Exploration
> 213-Support Activities for Oil and Gas
> 324-Petroleum and Coal Products Manufacturing (Refineries)
> 325-Chemical Manufacturing
In addition to standard time series modeling trend and autoressive terms, we considered models with U.S. GDP and production forecasts discussed earlier in the document as both lags and leads. For example, the preferred model for Louisiana Oil and Gas exploration (NAICS 211) contained lagged oil price, production one period ahead, and an autoregressive term. The model was consistent with theory, predicting for example that a one dollar increase in prices would increase Louisiana oil and gas employment by 27 jobs in the month of the price increase and 340 jobs over time if the price increase were permanent. A similar approach was taken with regard to all industries though the variables in the preferred model and timing of impacts varied by sector and state.
Generally, forecasts indicated the same pattern for all states in both oil and gas sectors — a recovery by 2020 but not reaching 2015 peaks of employment. The forecasts were driven in part by predictions of modest increases in both production and prices over time. All figures illustrating up-stream oil and gas include NAICS sectors 211 and 213.7
Figure 16 and 17 show upstream oil and gas employment forecasts for Louisiana and Texas, respectively. From 2001 to 2015, Louisiana experienced significant volatility in upstream employment. From 2001 to around 2005, Louisiana’s upstream oil and gas sector was losing significant jobs; from peak to trough, the industry lost more than 9,000 jobs. But, this trend was reversed in 2005 when the production began in the Haynesville shale. By the peak in October of 2008, though, the industry had gained 12,000 jobs since the trough. But then again, with the price drop in natural gas around this time period, the industry again began to lose jobs. By January of 2016, before the most recent oil price downturn, the Louisiana upstream oil and gas sectors provided more than 50,000 jobs. But since the peak, the sector has lost over 17,000 jobs — a 34 percent decline in oil and gas employment. Thus, the industry continues to experience its historic
7 Separate results for each state can be found at ces.lsu.edu, and are not reported here for brevity.
12 Gulf Coast Energy Outlook 2017

“boom and bust” cylce, driven by commodity price changes. Our models predict a recovery with roughly half of the jobs lost in the recent downturn returning by 2020.
As illustrated in Figure 17, in contrast to Louisiana, which experienced ups and downs associated with the Haynesville shale boom and bust, in Texas, the upstream sectors boomed fairly consistently from 2001 to 20158 with the number of oil and gas jobs more than doubling over this time period. But similar to Louisiana, Texas experienced significant job losses during the most recent oil price downturn, losing almost 100,000 jobs from peak to trough, or about 32 percent of the employment in these sectors. As with Louisiana, we anticipate that a recovery and stabilization of prices and production
8 With a short-lived bust during the natural gas price decline during the 2008-2009 time period.
Figure 16: Louisiana Upstream Oil and Gas Employment Forecast
Figure 17: Texas Upstream Oil and Gas Employment Forecast
Source: U.S. Bureau of Labor Statistics, 2015 annual Quarterly Census of Employment and Wages data.
Source: U.S. Bureau of Labor Statistics, 2015 annual Quarterly Census of Employment and Wages data.
13Louisiana State University
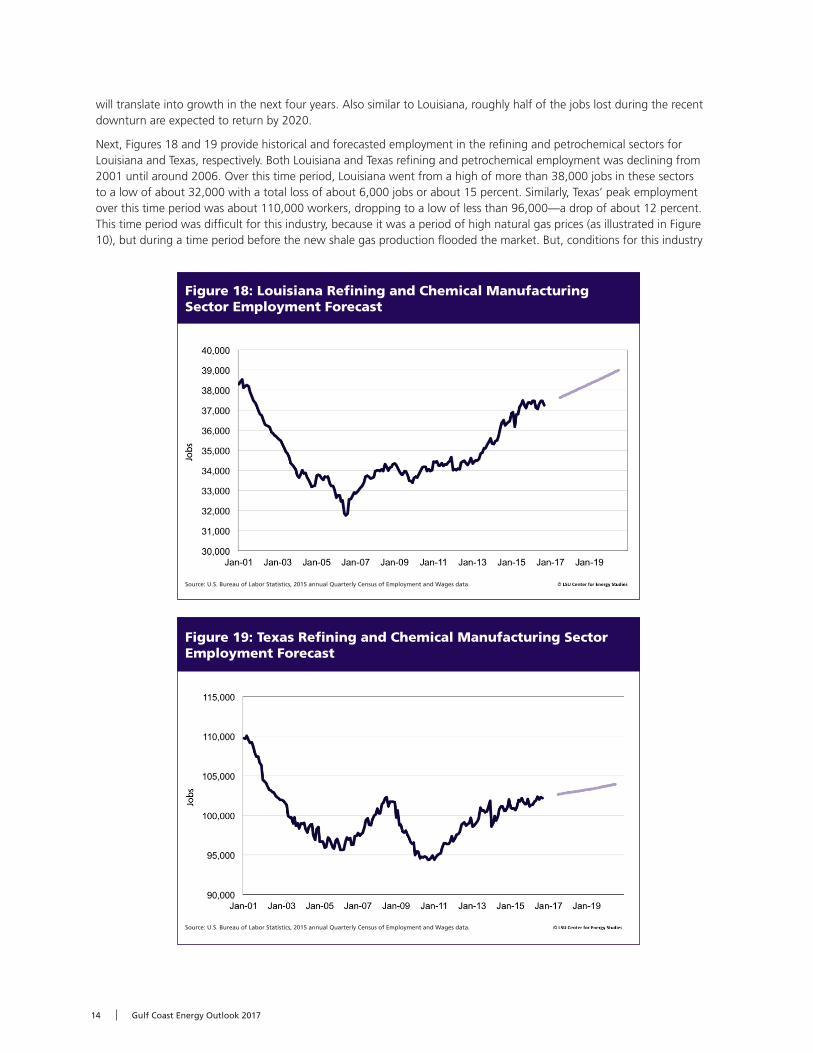
will translate into growth in the next four years. Also similar to Louisiana, roughly half of the jobs lost during the recent downturn are expected to return by 2020.
Next, Figures 18 and 19 provide historical and forecasted employment in the refining and petrochemical sectors for Louisiana and Texas, respectively. Both Louisiana and Texas refining and petrochemical employment was declining from 2001 until around 2006. Over this time period, Louisiana went from a high of more than 38,000 jobs in these sectors to a low of about 32,000 with a total loss of about 6,000 jobs or about 15 percent. Similarly, Texas’ peak employment over this time period was about 110,000 workers, dropping to a low of less than 96,000—a drop of about 12 percent. This time period was difficult for this industry, because it was a period of high natural gas prices (as illustrated in Figure 10), but during a time period before the new shale gas production flooded the market. But, conditions for this industry
Figure 18: Louisiana Refining and Chemical Manufacturing Sector Employment Forecast
Figure 19: Texas Refining and Chemical Manufacturing Sector Employment Forecast
Source: U.S. Bureau of Labor Statistics, 2015 annual Quarterly Census of Employment and Wages data.
Source: U.S. Bureau of Labor Statistics, 2015 annual Quarterly Census of Employment and Wages data.
14 Gulf Coast Energy Outlook 2017

quickly changed in both Louisiana and Texas as shale gas hit the market. Louisiana, in particular, experienced a decade of consistent employment growth in this sector, and the sector is expected to employ more workers than before the initial drop of the early 2000s by 2020. Texas’ refining and petrochemical sector, on the other hand, has experienced more ups and downs since shale gas production came online in the mid-2000s and is expected to experience modest employment growth until 2020.
5 | Conclusions
This past decade and a half has been an exciting one for the energy industry. Technological advancements in the upstream oil and gas extraction sectors have fundamentally changed the outlook of energy, not only here on the Gulf Coast, and not just here in the United States, but around the world, as the global energy outlook has changed for decades to come. But most recently, the industry has been a victim of its own success, as increased supply has contributed to swiftly falling prices, first of natural gas starting in 2008 and then for crude oil starting in 2015. These sudden price changes have had economy-wide implications.
In this inaugural Gulf Coast Energy Outlook, we present outlooks for prices, production, industrial expansions, and energy industry employment. Oil prices are expected to stay in the range of $50 to $65 until the end of 2018, with the high estimates for 2018 at $75 per barrel. Natural gas prices are expected to continue in the range of $3.00 to $3.50 per MMBtu, with a high estimate in 2018 of $3.73. While prices are expected to stay relatively flat, price volatility is also expected to stay low. Both oil and gas production are expected to increase over the next decade, both here in the Gulf Coast region, as well as throughout the U.S. This growth is expected to be driven by continued improvements in extraction techniques in shale geological formations.
Energy manufacturing sectors are expected to remain strong in coming years due to the abundant supply of affordable natural gas. In Louisiana alone, over $46 billion of capital expansions have already been completed since 2011, with another $96 billion in remaining announced projects. While all of these projects will likely not come to fruition, this represents a significant opportunity for the energy manufacturing sector in coming years. The refining sector, specifically, is also expected to remain strong as U.S. crude production continues to remain resilient, despite low prices, and net exports of petroleum products continue to increase.
Employment in both the upstream oil and gas extraction sectors and downstream refining and petrochemical sectors is expected to increase steadily in coming years. Of course, this will be a function of prices. If natural gas prices continue to remain affordable and volatility remains subdued, this will provide the atmosphere necessary for continued petrochemical expansions. Moderate and stable oil and gas prices will also provide an opportunity for the upstream extraction sectors to continue drilling, while improving efficiency in the still historically young shale formations. A price shock, though, can have differing effects on these distinct, but interrelated, industries.
Crude oil and natural gas markets continue to be resilient, as prices are anticipated to remain affordable and less volatile. Natural gas supply growth is expected to be increasingly driven by “associated” natural gas — a byproduct of increasing production coming from higher hydrocarbon-based production (Permian, Eagle Ford, and Bakken). Crude production developments will continue to have implications for natural gas markets. Economic growth is likely the only near-term factor that will burn-off excessive commodity storage levels and will likely continue to keep crude oil and natural gas prices range-bound with likely low price volatility. Continued positive investment/development activity in refining, processing/manufacturing, and energy exports are expected.
lsu.edu/ces/publications/2017/GCEO2017.pdflsu.edu/ces/publications/2017/GCEOW2017Addendum.pdf
15Louisiana State University

We wish to recognize the faculty and staff assistance from the LSU Center for Energy studies and the E.J. Ourso College of Business, especially Marybeth Pinnsonneault and Stephen Radcliffe for their editorial and graphic design expertise and Martin Braun for analysis support.
The Center for Energy StudiesThe Center for Energy Studies conducts, encourages, and facilitates research and analysis to address energy-related problems or issues affecting Louisiana’s economy, environment, and citizenry. The Center’s goal is to provide a balanced, objective, and timely treatment of issues with potentially important consequences for Louisiana.
The Center for Energy Studies was created by the Louisiana Legislature in 1982 as the embodiment of recommendations made by an independent group of experts and at the urging of Louisiana business and public interest groups, as well as the University.
ces.lsu.edu
The Energy ProgramThe Energy Program at the LSU E. J. Ourso College of Business is designed to provide the skills and knowledge needed by the next generation of energy professionals. Not only do students take classes that are specific to the energy sector, but they are also provided a wide range of learning opportunities, including site visits, access to speakers in the industry, case competitions, energy conferences and expos, and industry-related internships.
business.lsu.edu/energy
16 Gulf Coast Energy Outlook 2017

Gulf Coast Energy Outlook
Christopher K. Coombs — LSU Economics & Policy Research Group
David E. Dismukes — LSU Center for Energy Studies
Dek Terrell — LSU Economics & Policy Research Group
Gregory B. Upton, Jr.* — LSU Center for Energy Studies
*Corresponding author