gulf energy development public company limited q2’21
TRANSCRIPT
Gulf Energy Development Public Company Limited
Q2’21 Earnings PresentationInvestor RelationsAugust 2021

Index
Q2’21 Financial Performance
Business Updates
Appendix
3
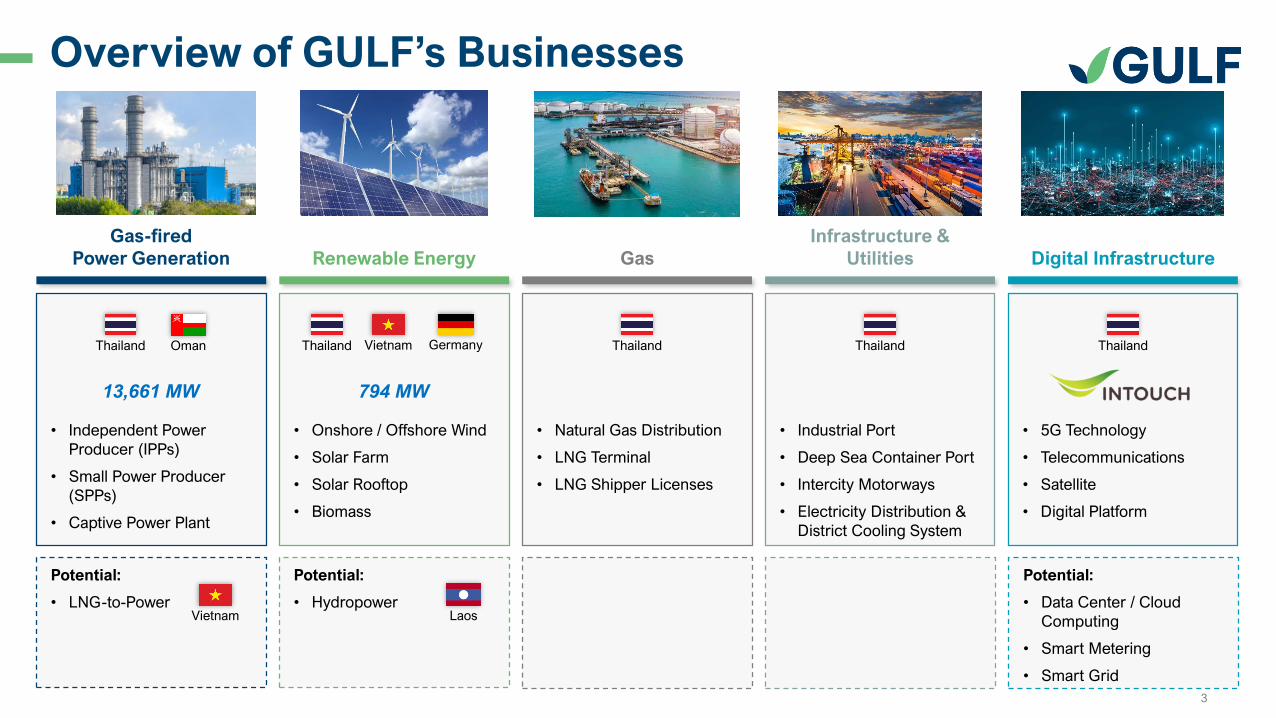
Overview of GULF’s Businesses
13,661 MW
Gas-fired
Power Generation Renewable Energy Gas
Infrastructure &
Utilities Digital Infrastructure
794 MW
Thailand Oman GermanyThailand Vietnam Thailand Thailand Thailand
• Independent Power
Producer (IPPs)
• Small Power Producer
(SPPs)
• Captive Power Plant
• Onshore / Offshore Wind
• Solar Farm
• Solar Rooftop
• Biomass
• Natural Gas Distribution
• LNG Terminal
• LNG Shipper Licenses
• Industrial Port
• Deep Sea Container Port
• Intercity Motorways
• Electricity Distribution &
District Cooling System
• 5G Technology
• Telecommunications
• Satellite
• Digital Platform
Potential:
• LNG-to-Power
Potential:
• Hydropower
Potential:
• Data Center / Cloud
Computing
• Smart Metering
• Smart Grid
LaosVietnam

4
Capacity Growth & Target under Committed PPAs
Year 2030 (Target)
Renewables
capacity*
growth from:
Hydropower projects
Power Generation
<70%
Renewables>30%
*gross installed capacity
2,999 3,463 4,088
5,052 6,120
7,425 7,802 7,802 8,012
2020 Aug-21 2021 2022 2023 2024 2025 2026 2027
GJP GMP IPD GCGSolar Rooftop Vietnam Renewables Borkum OmanHKP Burapa
6,504 7,166 8,017
9,379 10,990
13,085 13,855 13,855 14,455
2020 Aug-21 2021 2022 2023 2024 2025 2026 2027
GJP GMP IPD GCG
Solar Rooftop Vietnam Renewables Borkum Oman
HKP Burapa
Gross Installed Capacity (MW):
Equity Installed Capacity (MW):
57%
34%
9%
Aug 2021
7,166MW
IPP
SPP
Renewables
78% 17%
5%
Year 2027
14,455MW
IPP SPP
Renewables
Equity Capacity by power plant type
77%16%
7%
8,012MW
IPP SPP
Renewables
Year 2027
53%
37%
11%
3,463MW
IPP
Renewables
SPP
Aug 2021
Gross Capacity by power plant type
Renewables in Thailand, Vietnam, Europe, US &
Asia, etc.
5
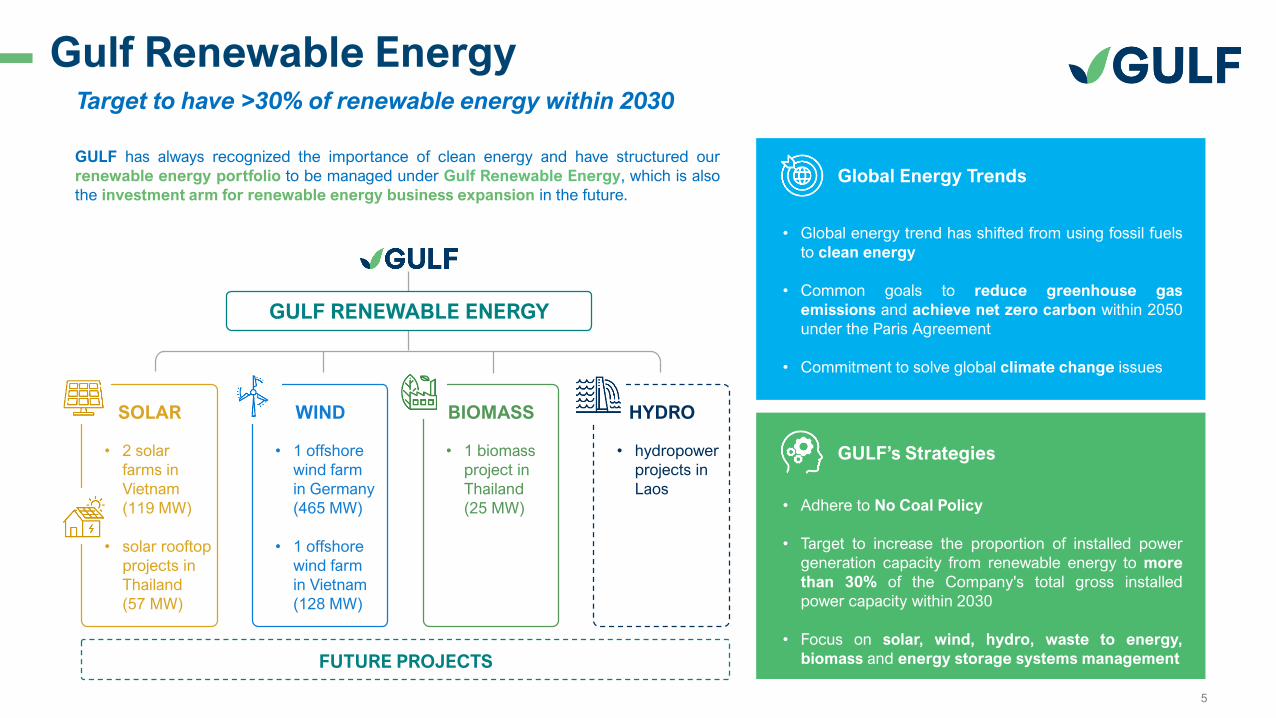
Gulf Renewable EnergyTarget to have >30% of renewable energy within 2030
GULF has always recognized the importance of clean energy and have structured our
renewable energy portfolio to be managed under Gulf Renewable Energy, which is also
the investment arm for renewable energy business expansion in the future.
• Adhere to No Coal Policy
• Target to increase the proportion of installed power
generation capacity from renewable energy to more
than 30% of the Company's total gross installed
power capacity within 2030
• Focus on solar, wind, hydro, waste to energy,
biomass and energy storage systems management
GULF’s Strategies
• Global energy trend has shifted from using fossil fuels
to clean energy
• Common goals to reduce greenhouse gas
emissions and achieve net zero carbon within 2050
under the Paris Agreement
• Commitment to solve global climate change issues
Global Energy Trends
HYDRO
GULF RENEWABLE ENERGY
FUTURE PROJECTS
SOLAR
• 2 solar
farms in
Vietnam
(119 MW)
• solar rooftop
projects in
Thailand
(57 MW)
WIND
• 1 offshore
wind farm
in Germany
(465 MW)
• 1 offshore
wind farm
in Vietnam
(128 MW)
BIOMASS
• 1 biomass
project in
Thailand
(25 MW)
• hydropower
projects in
Laos
6
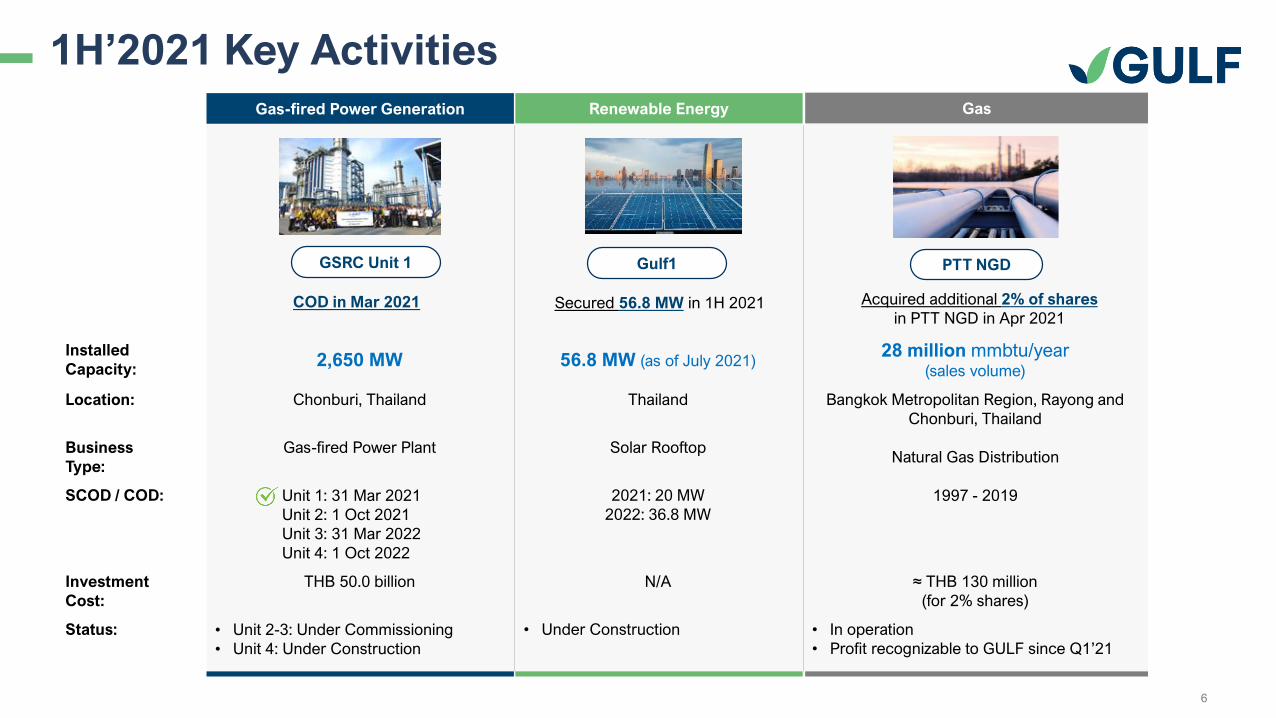
1H’2021 Key Activities
GSRC Unit 1 PTT NGDGulf1
Installed
Capacity:2,650 MW 56.8 MW (as of July 2021)
28 million mmbtu/year(sales volume)
Location: Chonburi, Thailand Thailand Bangkok Metropolitan Region, Rayong and
Chonburi, Thailand
Business
Type:
Gas-fired Power Plant Solar RooftopNatural Gas Distribution
SCOD / COD: Unit 1: 31 Mar 2021
Unit 2: 1 Oct 2021
Unit 3: 31 Mar 2022
Unit 4: 1 Oct 2022
2021: 20 MW
2022: 36.8 MW
1997 - 2019
Investment
Cost:
THB 50.0 billion N/A ≈ THB 130 million
(for 2% shares)
Status: • Unit 2-3: Under Commissioning
• Unit 4: Under Construction
• Under Construction • In operation
• Profit recognizable to GULF since Q1’21
Gas-fired Power Generation Renewable Energy Gas
Secured 56.8 MW in 1H 2021COD in Mar 2021 Acquired additional 2% of shares
in PTT NGD in Apr 2021
7
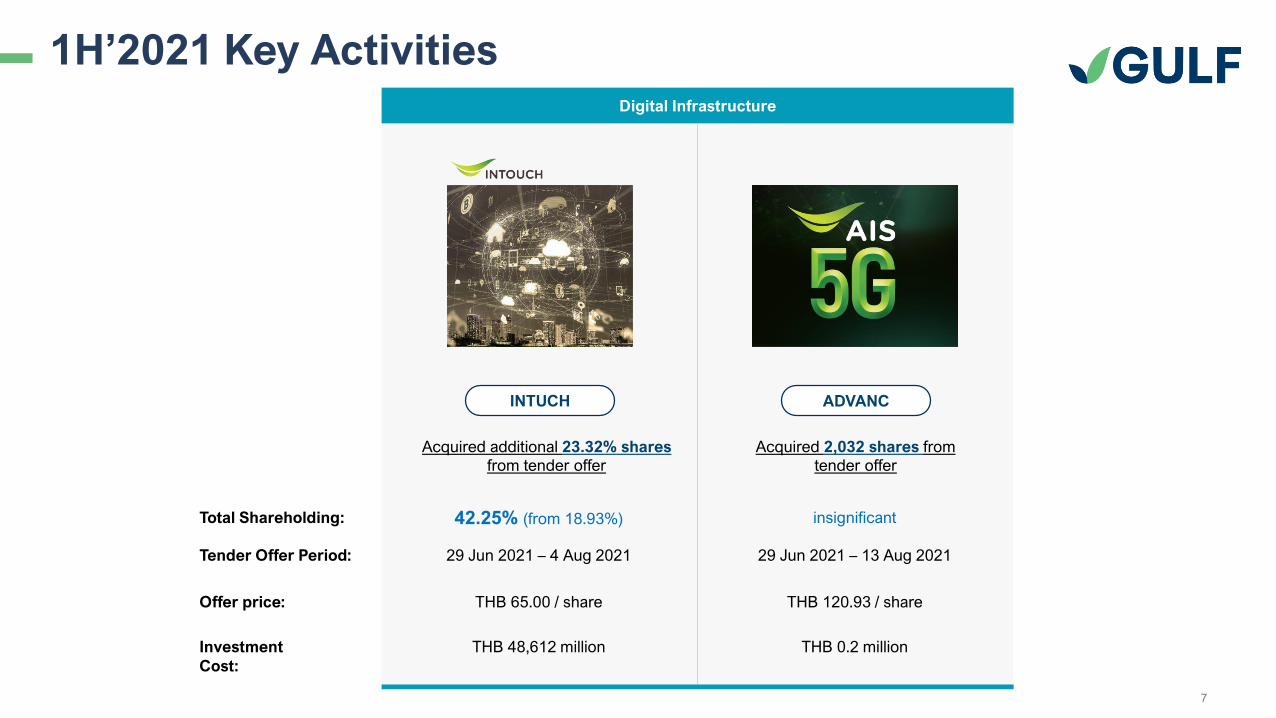
1H’2021 Key ActivitiesDigital Infrastructure
Acquired additional 23.32% shares from tender offer
Total Shareholding: 42.25% (from 18.93%) insignificant
Tender Offer Period: 29 Jun 2021 – 4 Aug 2021 29 Jun 2021 – 13 Aug 2021
Offer price: THB 65.00 / share THB 120.93 / share
Investment
Cost:
THB 48,612 million THB 0.2 million
INTUCH ADVANC
Acquired 2,032 shares from tender offer

8
Investment in INTUCH
• Diversify our business from energy
and logistics infrastructure into digital
infrastructure
• Strengthen long-term earnings growth
of GULF
• Provide GULF with stable dividend
stream in the long run
• Potential synergy benefits especially
when the liberalization of power
industry takes place
➢ Peer to peer trading
➢ Smart grid
➢ Smart metering
➢ Data center / Cloud computing
Shareholding Structure Investment Rationale
Wireless
Telecommunication
Business
Venture Capital
40.45% 41.13%
Satellite
1) Mobile Business
2) Fixed-Broadband Business
3) Digital Service Business
• A leading Asian satellite
operator and provider of
integrated satellite
communications
• Currently operates a fleet of
4 high performance satellites
covering Asia, Oceania, and
Africa
42.25%
9
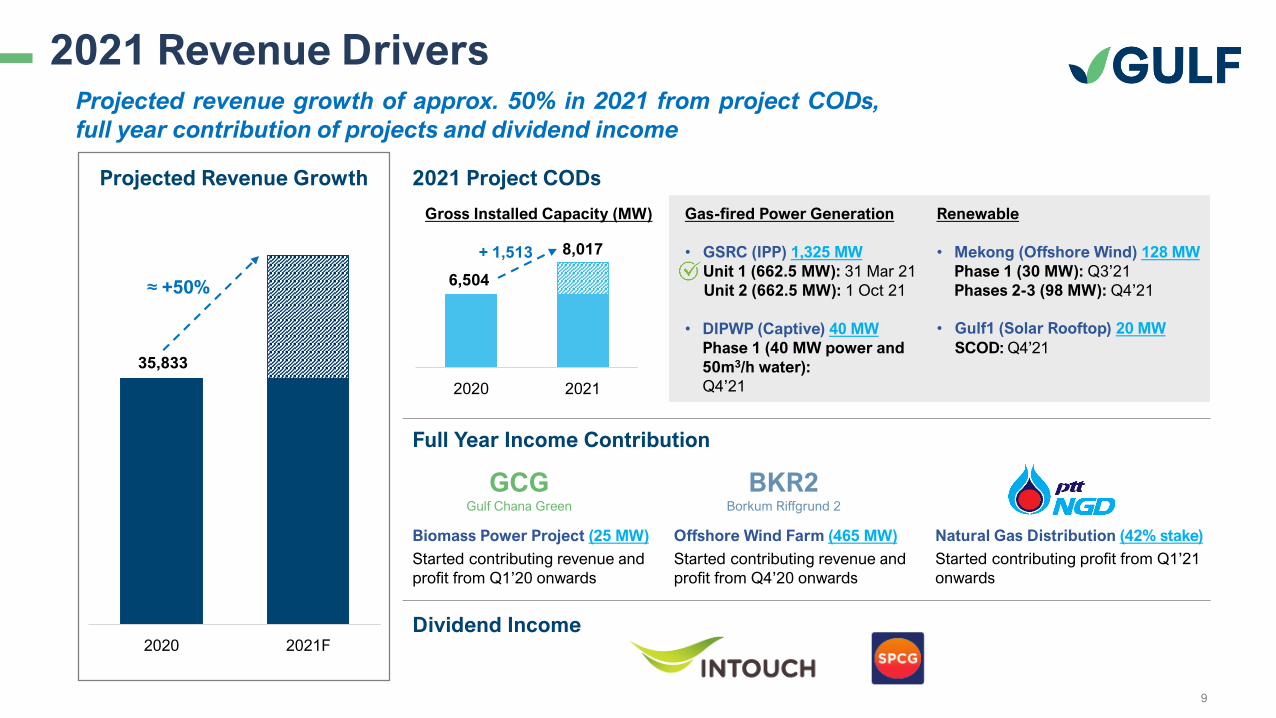
2021 Revenue Drivers
35,833
2020 2021F
Projected Revenue Growth
Projected revenue growth of approx. 50% in 2021 from project CODs,
full year contribution of projects and dividend income
≈ +50%
2021 Project CODs
6,504
8,017
2020 2021
+ 1,513
Gross Installed Capacity (MW)
Full Year Income Contribution
Natural Gas Distribution (42% stake)
Started contributing profit from Q1’21
onwards
Offshore Wind Farm (465 MW)
Started contributing revenue and
profit from Q4’20 onwards
BKR2Borkum Riffgrund 2
Biomass Power Project (25 MW)
Started contributing revenue and
profit from Q1’20 onwards
GCGGulf Chana Green
Dividend Income
Renewable
• Mekong (Offshore Wind) 128 MW
Phase 1 (30 MW): Q3’21
Phases 2-3 (98 MW): Q4’21
• Gulf1 (Solar Rooftop) 20 MW
SCOD: Q4’21
Gas-fired Power Generation
• GSRC (IPP) 1,325 MW
Unit 1 (662.5 MW): 31 Mar 21
Unit 2 (662.5 MW): 1 Oct 21
• DIPWP (Captive) 40 MW
Phase 1 (40 MW power and
50m3/h water):
Q4’21
10
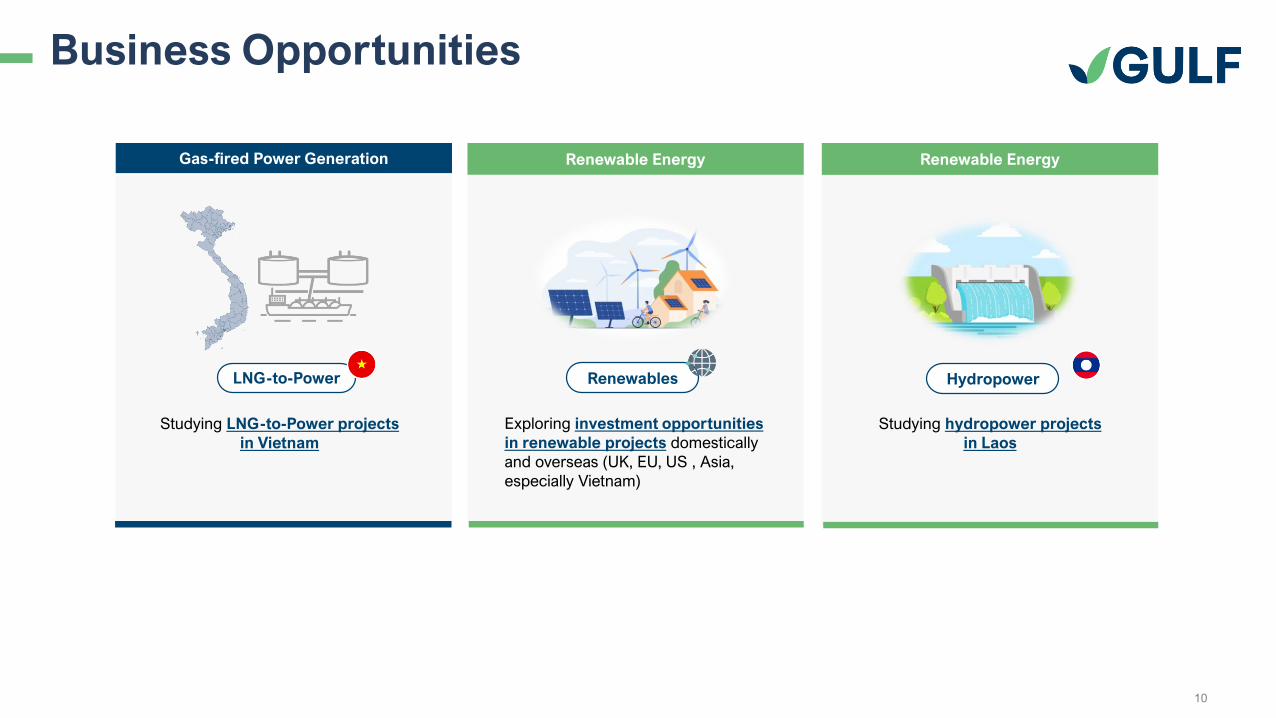
Business Opportunities
Renewable Energy
Exploring investment opportunities
in renewable projects domestically
and overseas (UK, EU, US , Asia,
especially Vietnam)
Renewables
Studying hydropower projects
in Laos
Hydropower
Gas-fired Power Generation
Studying LNG-to-Power projects
in Vietnam
LNG-to-Power
Renewable Energy
11
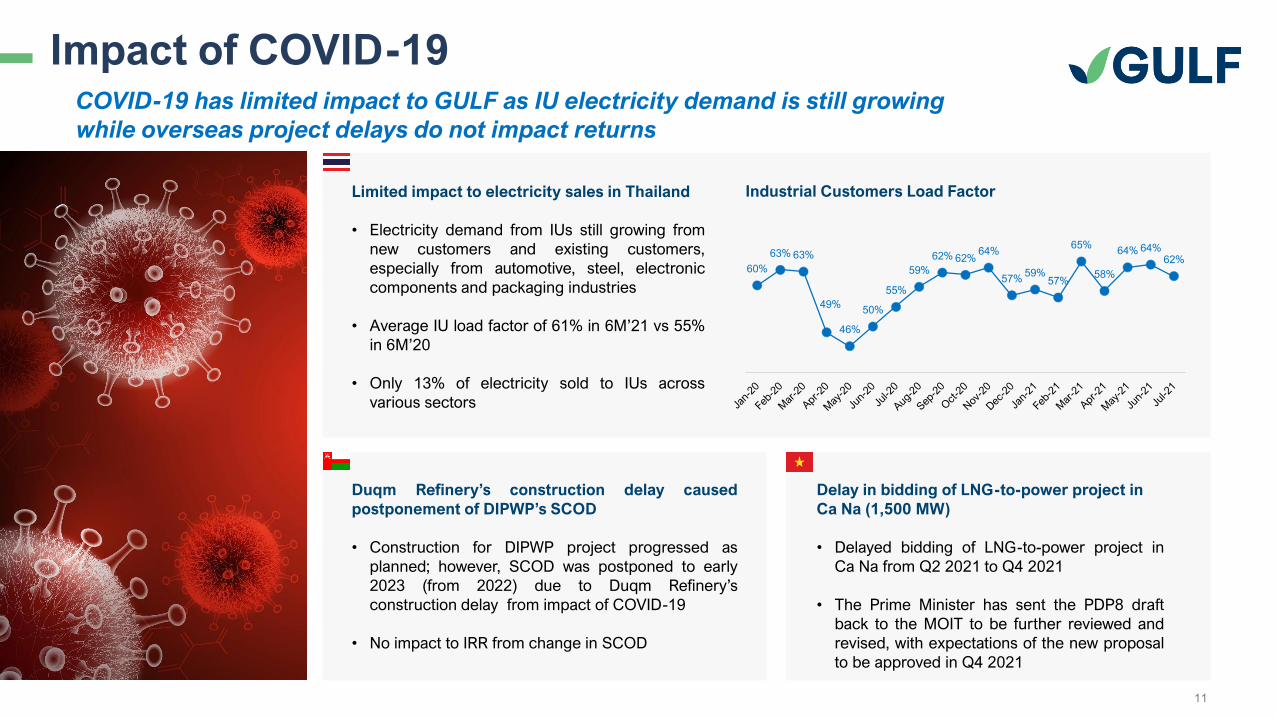
Impact of COVID-19COVID-19 has limited impact to GULF as IU electricity demand is still growing
while overseas project delays do not impact returns
60%
63% 63%
49%
46%
50%
55%
59%
62% 62%64%
57%59%
57%
65%
58%
64% 64%62%
Industrial Customers Load FactorLimited impact to electricity sales in Thailand
• Electricity demand from IUs still growing from
new customers and existing customers,
especially from automotive, steel, electronic
components and packaging industries
• Average IU load factor of 61% in 6M’21 vs 55%
in 6M’20
• Only 13% of electricity sold to IUs across
various sectors
Duqm Refinery’s construction delay caused
postponement of DIPWP’s SCOD
• Construction for DIPWP project progressed as
planned; however, SCOD was postponed to early
2023 (from 2022) due to Duqm Refinery’s
construction delay from impact of COVID-19
• No impact to IRR from change in SCOD
Delay in bidding of LNG-to-power project in
Ca Na (1,500 MW)
• Delayed bidding of LNG-to-power project in
Ca Na from Q2 2021 to Q4 2021
• The Prime Minister has sent the PDP8 draft
back to the MOIT to be further reviewed and
revised, with expectations of the new proposal
to be approved in Q4 2021
Index
Q2’21 Financial Performance
Business Updates
Appendix
13
7,6838,877
10,712
37044
46
90
110
114
1,254
259
515
111696
88
9,1399,990
11,845
Q2'20 Q1'21 Q2'21
Total revenueOther incomeShare of profit from associates and JVsRevenue from management feeRevenue from service concession arrangementRevenue from lease under power purchase agreementRevenue from sales
Unit: THB million
+18.6% QoQ
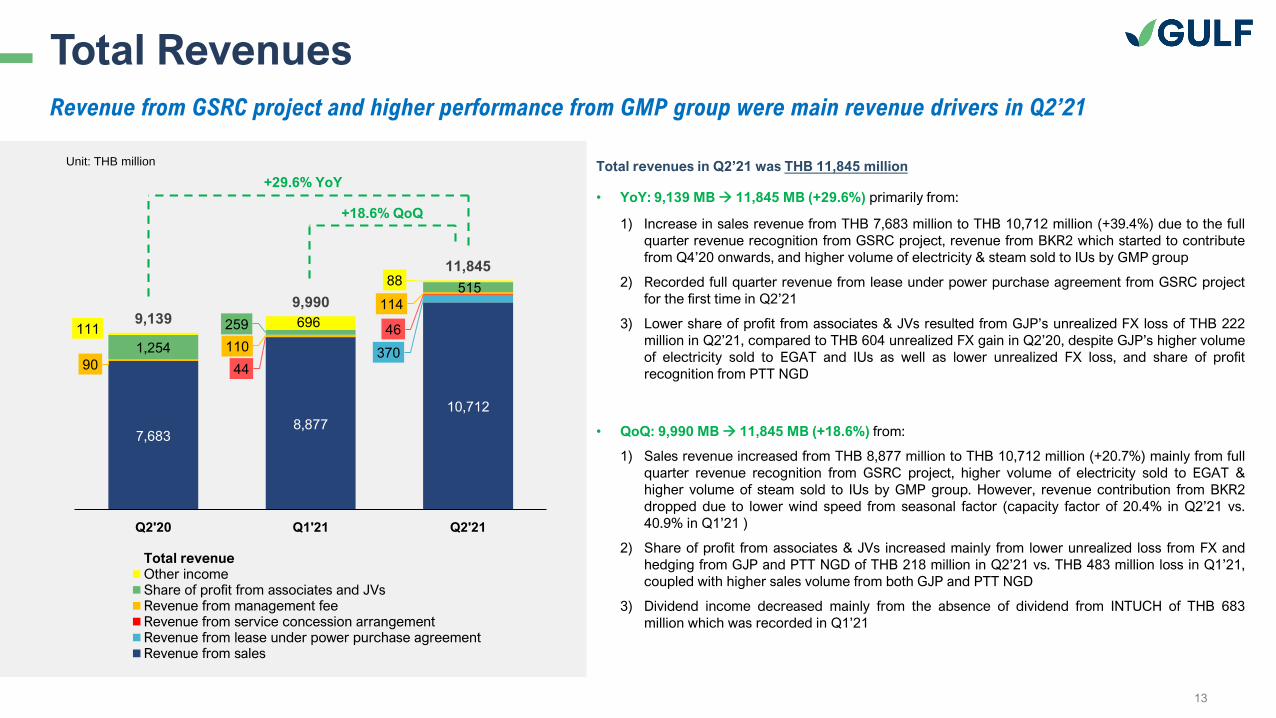
Total Revenues
+29.6% YoY
Revenue from GSRC project and higher performance from GMP group were main revenue drivers in Q2’21
Total revenues in Q2’21 was THB 11,845 million
• YoY: 9,139 MB → 11,845 MB (+29.6%) primarily from:
1) Increase in sales revenue from THB 7,683 million to THB 10,712 million (+39.4%) due to the full
quarter revenue recognition from GSRC project, revenue from BKR2 which started to contribute
from Q4’20 onwards, and higher volume of electricity & steam sold to IUs by GMP group
2) Recorded full quarter revenue from lease under power purchase agreement from GSRC project
for the first time in Q2’21
3) Lower share of profit from associates & JVs resulted from GJP’s unrealized FX loss of THB 222
million in Q2’21, compared to THB 604 unrealized FX gain in Q2’20, despite GJP’s higher volume
of electricity sold to EGAT and IUs as well as lower unrealized FX loss, and share of profit
recognition from PTT NGD
• QoQ: 9,990 MB → 11,845 MB (+18.6%) from:
1) Sales revenue increased from THB 8,877 million to THB 10,712 million (+20.7%) mainly from full
quarter revenue recognition from GSRC project, higher volume of electricity sold to EGAT &
higher volume of steam sold to IUs by GMP group. However, revenue contribution from BKR2
dropped due to lower wind speed from seasonal factor (capacity factor of 20.4% in Q2’21 vs.
40.9% in Q1’21 )
2) Share of profit from associates & JVs increased mainly from lower unrealized loss from FX and
hedging from GJP and PTT NGD of THB 218 million in Q2’21 vs. THB 483 million loss in Q1’21,
coupled with higher sales volume from both GJP and PTT NGD
3) Dividend income decreased mainly from the absence of dividend from INTUCH of THB 683
million which was recorded in Q1’21
14
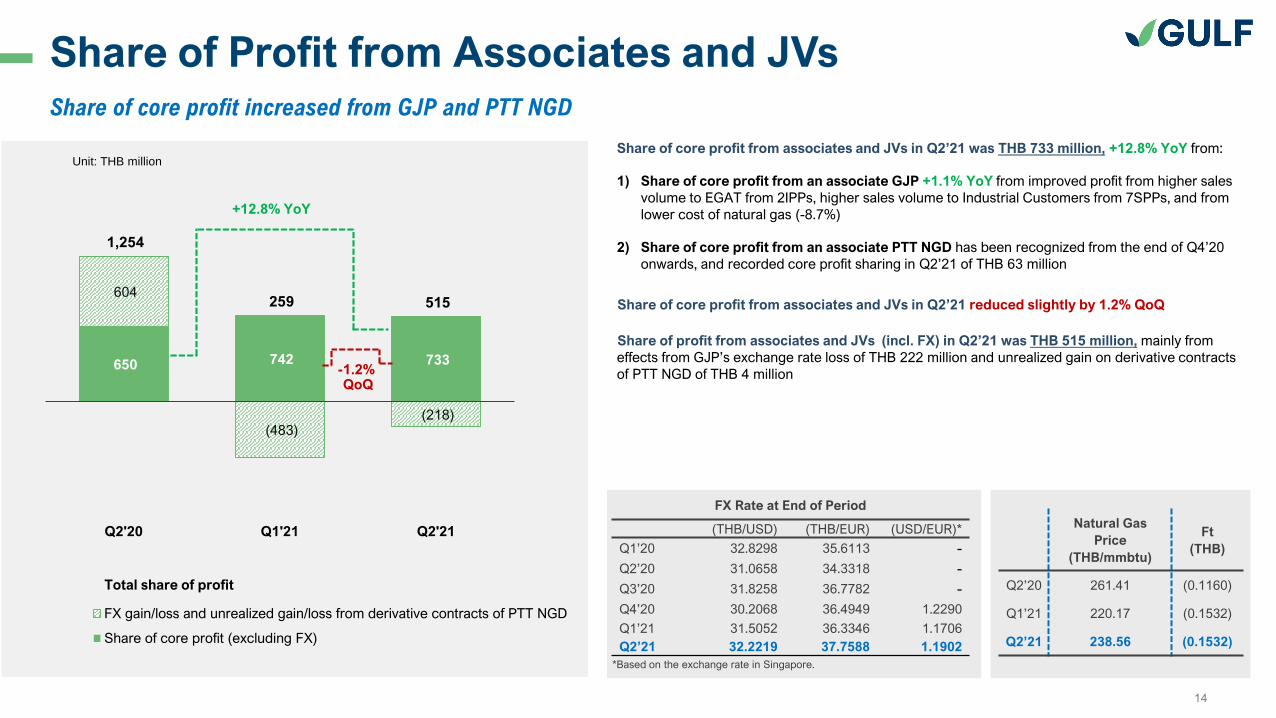
Share of Profit from Associates and JVsShare of core profit increased from GJP and PTT NGD
650 742 733
604
(483)(218)
1,254
259 515
Q2'20 Q1'21 Q2'21
FX gain/loss and unrealized gain/loss from derivative contracts of PTT NGD
Share of core profit (excluding FX)
+12.8% YoY
Total share of profit
Unit: THB millionShare of core profit from associates and JVs in Q2’21 was THB 733 million, +12.8% YoY from:
1) Share of core profit from an associate GJP +1.1% YoY from improved profit from higher sales
volume to EGAT from 2IPPs, higher sales volume to Industrial Customers from 7SPPs, and from
lower cost of natural gas (-8.7%)
2) Share of core profit from an associate PTT NGD has been recognized from the end of Q4’20
onwards, and recorded core profit sharing in Q2’21 of THB 63 million
Share of core profit from associates and JVs in Q2’21 reduced slightly by 1.2% QoQ
Share of profit from associates and JVs (incl. FX) in Q2’21 was THB 515 million, mainly from
effects from GJP’s exchange rate loss of THB 222 million and unrealized gain on derivative contracts
of PTT NGD of THB 4 million
FX Rate at End of Period
(THB/USD) (THB/EUR) (USD/EUR)*
Q1’20 32.8298 35.6113 -
Q2’20 31.0658 34.3318 -
Q3’20 31.8258 36.7782 -
Q4’20 30.2068 36.4949 1.2290
Q1’21 31.5052 36.3346 1.1706
Q2’21 32.2219 37.7588 1.1902
Natural Gas
Price
(THB/mmbtu)
Ft
(THB)
Q2’20 261.41 (0.1160)
Q1’21 220.17 (0.1532)
Q2’21 238.56 (0.1532)
*Based on the exchange rate in Singapore.
-1.2% QoQ
15
Unit: THB million
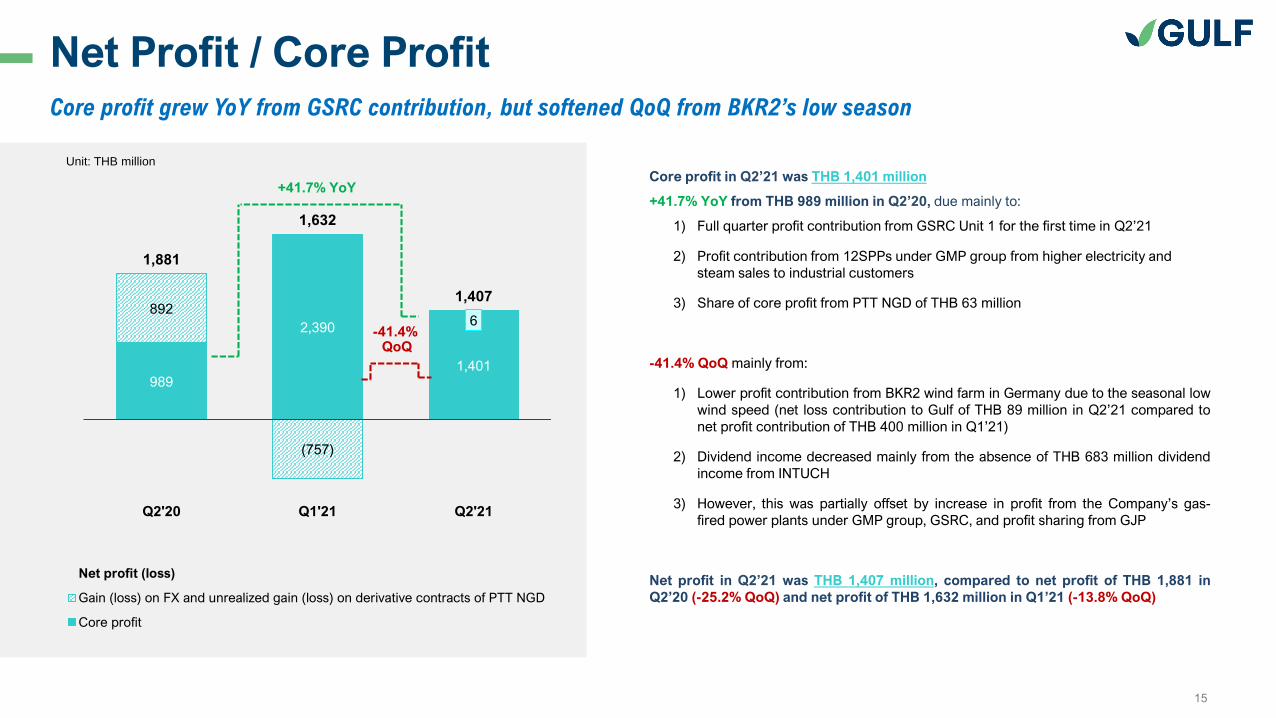
Net Profit / Core ProfitCore profit grew YoY from GSRC contribution, but softened QoQ from BKR2’s low season
Core profit in Q2’21 was THB 1,401 million
+41.7% YoY from THB 989 million in Q2’20, due mainly to:
1) Full quarter profit contribution from GSRC Unit 1 for the first time in Q2’21
2) Profit contribution from 12SPPs under GMP group from higher electricity and
steam sales to industrial customers
3) Share of core profit from PTT NGD of THB 63 million
-41.4% QoQ mainly from:
1) Lower profit contribution from BKR2 wind farm in Germany due to the seasonal low
wind speed (net loss contribution to Gulf of THB 89 million in Q2’21 compared to
net profit contribution of THB 400 million in Q1’21)
2) Dividend income decreased mainly from the absence of THB 683 million dividend
income from INTUCH
3) However, this was partially offset by increase in profit from the Company’s gas-
fired power plants under GMP group, GSRC, and profit sharing from GJP
Net profit in Q2’21 was THB 1,407 million, compared to net profit of THB 1,881 in
Q2’20 (-25.2% QoQ) and net profit of THB 1,632 million in Q1’21 (-13.8% QoQ)
989
2,390
1,401
892
(757)
6
1,881
1,632
1,407
Q2'20 Q1'21 Q2'21
Net profit (loss)
Gain (loss) on FX and unrealized gain (loss) on derivative contracts of PTT NGD
Core profit
+41.7% YoY
-41.4% QoQ
16
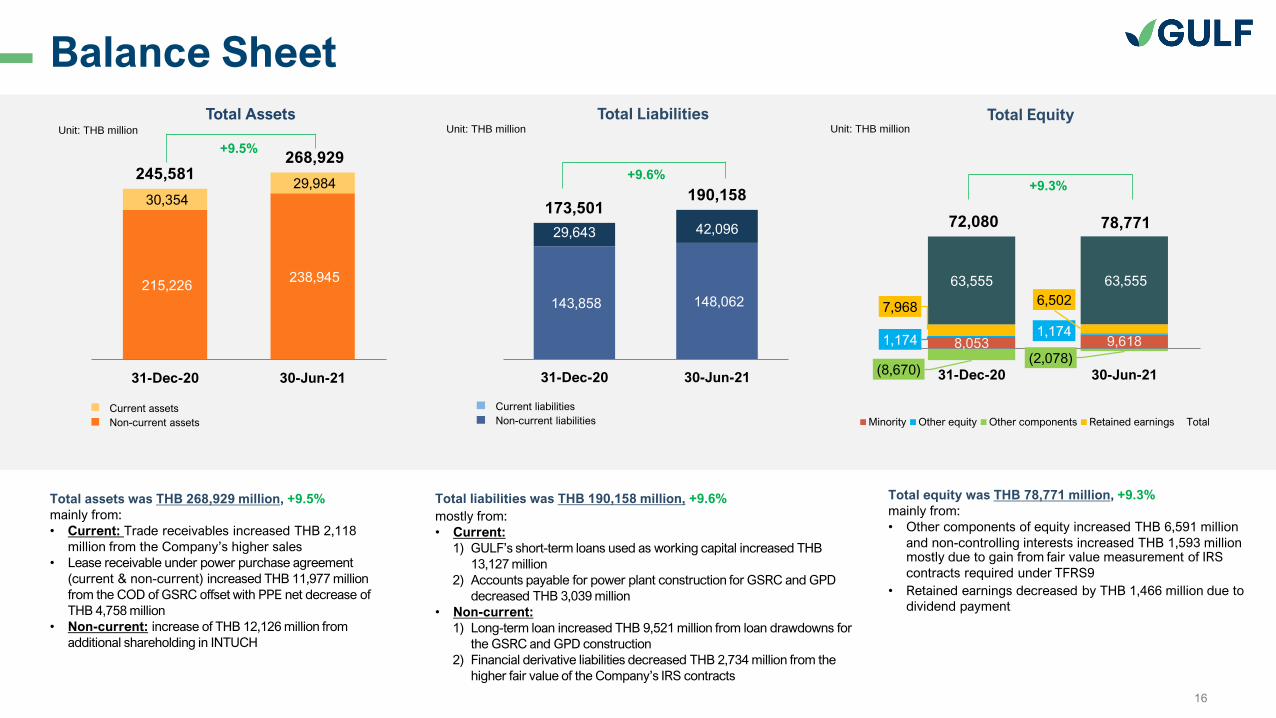
143,858 148,062
29,643 42,096
173,501190,158
31-Dec-20 30-Jun-21
Current liabilities
Non-current liabilities
+9.6%
Total Liabilities
Balance Sheet
Current assets
Non-current assets
215,226 238,945
30,354 29,984
245,581268,929
31-Dec-20 30-Jun-21
+9.5%
Total Assets
8,053 9,6181,1741,174
(8,670)(2,078)
7,9686,502
63,555 63,555
72,080 78,771
31-Dec-20 30-Jun-21
Minority Other equity Other components Retained earnings Total
Total EquityUnit: THB million
Total assets was THB 268,929 million, +9.5%
mainly from:
• Current: Trade receivables increased THB 2,118
million from the Company’s higher sales
• Lease receivable under power purchase agreement
(current & non-current) increased THB 11,977 million
from the COD of GSRC offset with PPE net decrease of
THB 4,758 million
• Non-current: increase of THB 12,126 million from
additional shareholding in INTUCH
Total liabilities was THB 190,158 million, +9.6%
mostly from:
• Current:
1) GULF’s short-term loans used as working capital increased THB
13,127 million
2) Accounts payable for power plant construction for GSRC and GPD
decreased THB 3,039 million
• Non-current:
1) Long-term loan increased THB 9,521 million from loan drawdowns for
the GSRC and GPD construction
2) Financial derivative liabilities decreased THB 2,734 million from the
higher fair value of the Company’s IRS contracts
Total equity was THB 78,771 million, +9.3%
mainly from:
• Other components of equity increased THB 6,591 million
and non-controlling interests increased THB 1,593 million mostly due to gain from fair value measurement of IRS
contracts required under TFRS9
• Retained earnings decreased by THB 1,466 million due to
dividend payment
+9.3%
Unit: THB million Unit: THB million

17
D/E Ratios
3.88
2.38 2.41
2.21
2.412.62
1.59 1.64 1.671.79
1.86
1.351.47
1.60 1.75
30-Jun-20 30-Sep-20 31-Dec-20 31-Mar-21 30-Jun-21
D/E Ratios
Note:
* Net interest-bearing debt to equity = (Total interest-bearing debt incl. lease liabilities - cash and
cash equivalent - deposits at financial institutions used as collateral) / (equity - other components of
equity)
D/E
Net IBD/E
Net IBD/E (incl. lease liabilities) to equity ratio (for benchmarking against bond covenant)*
Leverage ratios of 1.75x, still well below bond covenant (3.50x)
22,998
173,501
140,864
72,08080,750
20,262
190,158
161,316
78,771 80,849
31-Dec-20 30-Jun-21
Cash, cash
equivalents and
deposits used as
collateral
Shareholders’
equity
Shareholders' equity (excl.
other components of
equity)
Total liabilities Interest-
bearing debt
Unit: THB million
Capital increase
18
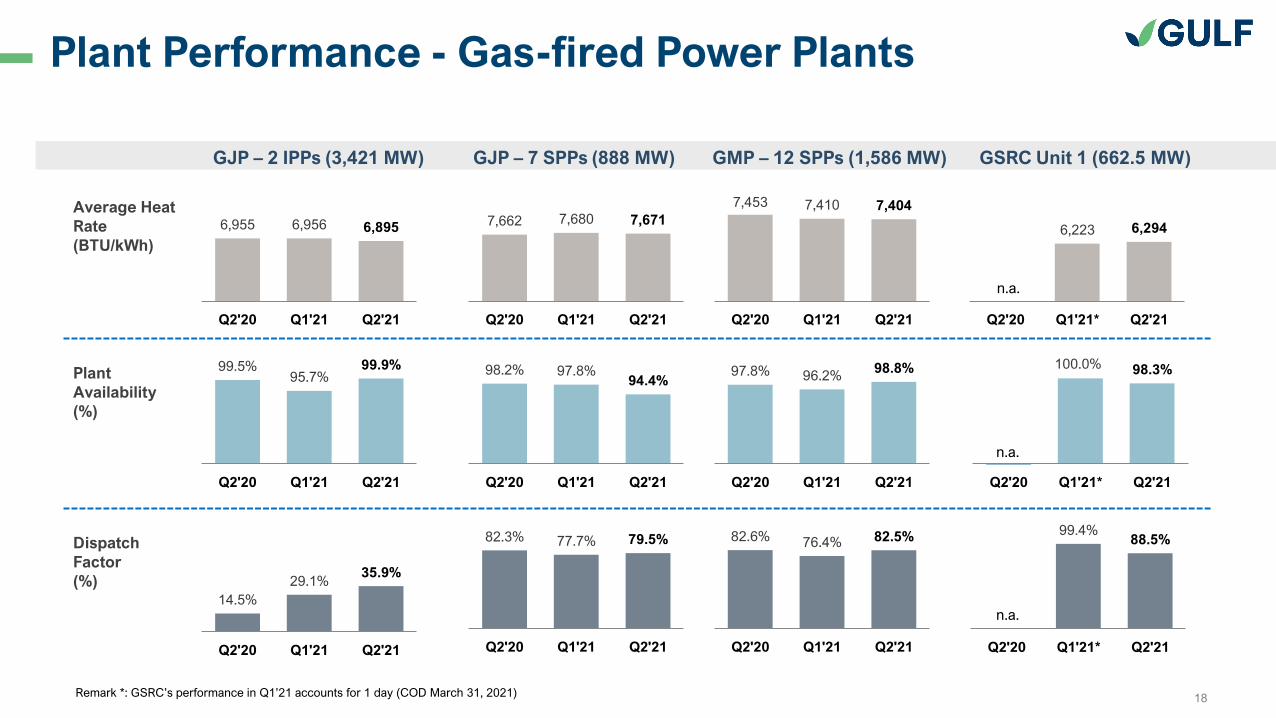
Plant Performance - Gas-fired Power Plants
GJP – 2 IPPs (3,421 MW) GJP – 7 SPPs (888 MW) GMP – 12 SPPs (1,586 MW) GSRC Unit 1 (662.5 MW)
Average Heat
Rate
(BTU/kWh)
Plant
Availability
(%)
Dispatch
Factor
(%)
6,955 6,956 6,895
Q2'20 Q1'21 Q2'21
99.5%95.7%
99.9%
Q2'20 Q1'21 Q2'21
14.5%
29.1%35.9%
Q2'20 Q1'21 Q2'21
7,662 7,680 7,671
Q2'20 Q1'21 Q2'21
98.2% 97.8%94.4%
Q2'20 Q1'21 Q2'21
82.3% 77.7% 79.5%
Q2'20 Q1'21 Q2'21
7,453 7,410 7,404
Q2'20 Q1'21 Q2'21
97.8% 96.2%98.8%
Q2'20 Q1'21 Q2'21
82.6% 76.4% 82.5%
Q2'20 Q1'21 Q2'21
6,223 6,294
Q2'20 Q1'21* Q2'21
n.a.
100.0% 98.3%
Q2'20 Q1'21* Q2'21
n.a.
99.4%88.5%
Q2'20 Q1'21* Q2'21
n.a.
Remark *: GSRC’s performance in Q1’21 accounts for 1 day (COD March 31, 2021)
19
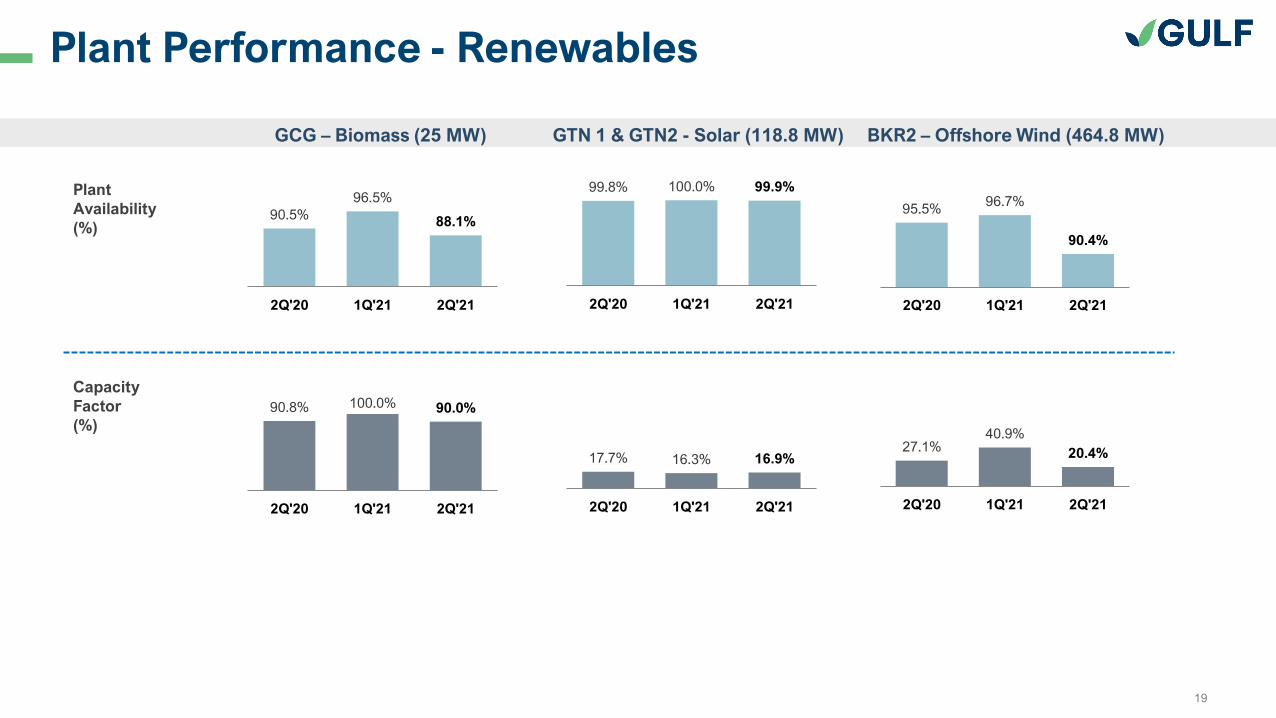
Plant Performance - Renewables
GCG – Biomass (25 MW) GTN 1 & GTN2 - Solar (118.8 MW) BKR2 – Offshore Wind (464.8 MW)
Plant
Availability
(%)
Capacity
Factor
(%)
90.5%
96.5%
88.1%
2Q'20 1Q'21 2Q'21
90.8% 100.0% 90.0%
2Q'20 1Q'21 2Q'21
99.8% 100.0% 99.9%
2Q'20 1Q'21 2Q'21
17.7% 16.3% 16.9%
2Q'20 1Q'21 2Q'21
95.5%96.7%
90.4%
2Q'20 1Q'21 2Q'21
27.1%40.9%
20.4%
2Q'20 1Q'21 2Q'21
20
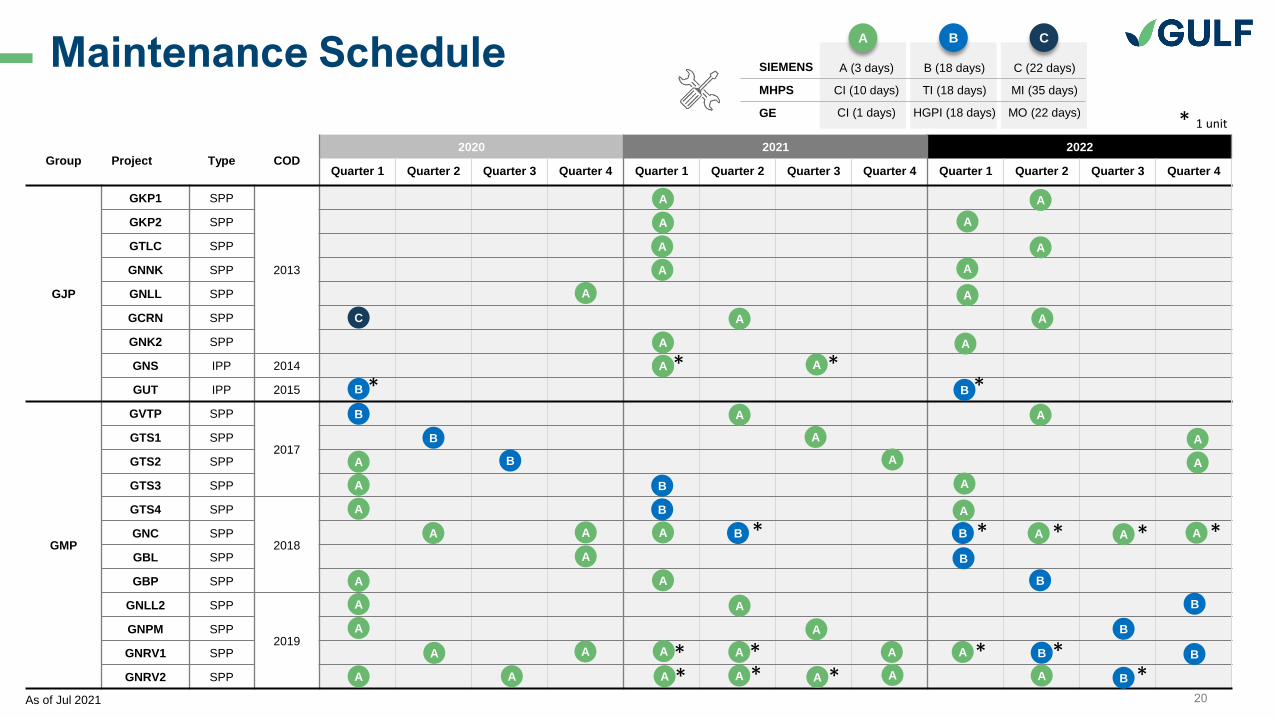
Maintenance Schedule
Group Project Type COD2020 2021 2022
Quarter 1 Quarter 2 Quarter 3 Quarter 4 Quarter 1 Quarter 2 Quarter 3 Quarter 4 Quarter 1 Quarter 2 Quarter 3 Quarter 4
GJP
GKP1 SPP
2013
GKP2 SPP
GTLC SPP
GNNK SPP
GNLL SPP
GCRN SPP
GNK2 SPP
GNS IPP 2014
GUT IPP 2015
GMP
GVTP SPP
2017GTS1 SPP
GTS2 SPP
GTS3 SPP
GTS4 SPP
2018GNC SPP
GBL SPP
GBP SPP
GNLL2 SPP
2019GNPM SPP
GNRV1 SPP
GNRV2 SPP
B
As of Jul 2021
C
A
B
A
A
A B C
A (3 days)
CI (10 days)
CI (1 days)
SIEMENS
MHPS
GE
B (18 days)
TI (18 days)
HGPI (18 days)
C (22 days)
MI (35 days)
MO (22 days)
A
A
B
B
A
A
A
A
A
A
A
A
A
A
A
A
A
A
A
B
A
A
A
B
B
A
A
A
A
A A
A A A
AA
A
A
A
A
A
A
A
A
A
A
A
B
B
B
B
B B A
B
BA
A B
A
A
A
* ** * *
*
* 1 unit
*A* *
*
* * A * * A *
**

21
Debt Outstanding
Note:
* Based on % profit sharing received from GSRC & GPD
** Gulf SRC has a short-term loan outstanding at THB 800 million
• All of the power projects in Thailand have long term loans of 20 - 23 years (vs. PPA term of 25 years).
• To mitigate interest rate fluctuation, the company entered into interest rate swaps to swap interest rate from floating rate into fixed rate for 18 - 20 years.
Total loan
outstanding: (THB equivalent)
THB 17,500 mn in debentures and
THB 23,827 mn in short-term loans
THB 62,937 mn THB 46,716 mn THB 32,157 mn THB 14,646 mn THB 2,530 mn THB 1,740 mn THB 23,744 mn
73%
27%
100%
40% 70% 100%75%*
56%
44%
USD 869 mn
THB 35,156 mn
USD 395 mn
THB 33,983 mn
60%
40%
USD 401 mn
THB 19,232 mn
100%
THB 1,740 mn
87%
13%
THB 12,705 mn
75%*
GULF JP GULF MP GULF SRC** GULF PD GULF Chana Green
100%
GTN1&2
90%
USD 79 mn
USD 60 mn
50%
EUR 623 mn
BKR2
Total Loan
outstanding
(THB equivalent)
(As of 30 June 2021)

Index
Q2’21 Financial Performance
Business Updates
Appendix
23
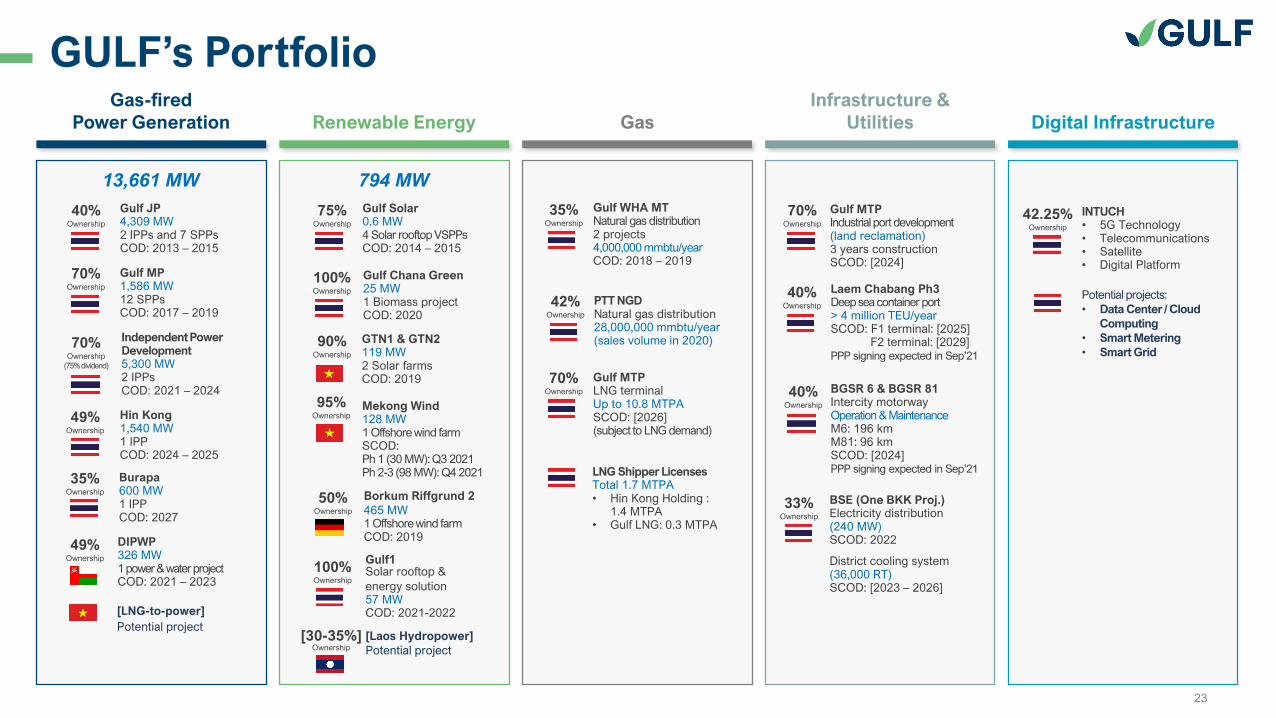
GULF’s Portfolio
13,661 MW
Gas-fired
Power Generation Renewable Energy Gas
Infrastructure &
Utilities Digital Infrastructure
794 MW
75%Ownership
Gulf Solar 0.6 MW4 Solar rooftop VSPPsCOD: 2014 – 2015
100%Ownership
Gulf Chana Green 25 MW1 Biomass projectCOD: 2020
95%Ownership
Mekong Wind 128 MW1 Offshore wind farmSCOD: Ph 1 (30 MW): Q3 2021Ph 2-3 (98 MW): Q4 2021
90%Ownership
GTN1 & GTN2 119 MW2 Solar farmsCOD: 2019
50%Ownership
Borkum Riffgrund 2
465 MW1 Offshore wind farmCOD: 2019
100%Ownership
Gulf1Solar rooftop &
energy solution57 MWCOD: 2021-2022
49%Ownership
DIPWP326 MW1 power & water projectCOD: 2021 – 2023
40%Ownership
Gulf JP 4,309 MW2 IPPs and 7 SPPsCOD: 2013 – 2015
70%Ownership
Gulf MP 1,586 MW12 SPPsCOD: 2017 – 2019
70%Ownership
(75% dividend)
Independent Power Development 5,300 MW2 IPPsCOD: 2021 – 2024
49%Ownership
Hin Kong 1,540 MW1 IPPCOD: 2024 – 2025
35%Ownership
Burapa600 MW1 IPPCOD: 2027
[LNG-to-power]
Potential project[Laos Hydropower]
Potential project[30-35%]
Ownership
35%Ownership
Gulf WHA MTNatural gas distribution2 projects4,000,000 mmbtu/yearCOD: 2018 – 2019
70%Ownership
Gulf MTPLNG terminalUp to 10.8 MTPASCOD: [2026](subject to LNG demand)
LNG Shipper LicensesTotal 1.7 MTPA• Hin Kong Holding :
1.4 MTPA• Gulf LNG: 0.3 MTPA
PTT NGD Natural gas distribution28,000,000 mmbtu/year(sales volume in 2020)
42%Ownership
70%Ownership
Gulf MTPIndustrial port development(land reclamation)3 years constructionSCOD: [2024]
40%Ownership
Laem Chabang Ph3Deep sea container port> 4 million TEU/yearSCOD: F1 terminal: [2025]
F2 terminal: [2029]PPP signing expected in Sep’21
40%Ownership
BGSR 6 & BGSR 81Intercity motorwayOperation & MaintenanceM6: 196 km M81: 96 kmSCOD: [2024]PPP signing expected in Sep’21
33%Ownership
BSE (One BKK Proj.)Electricity distribution(240 MW)SCOD: 2022
District cooling system(36,000 RT)SCOD: [2023 – 2026]
INTUCH• 5G Technology• Telecommunications• Satellite• Digital Platform
42.25%Ownership
Potential projects:
• Data Center / Cloud
Computing
• Smart Metering
• Smart Grid
24
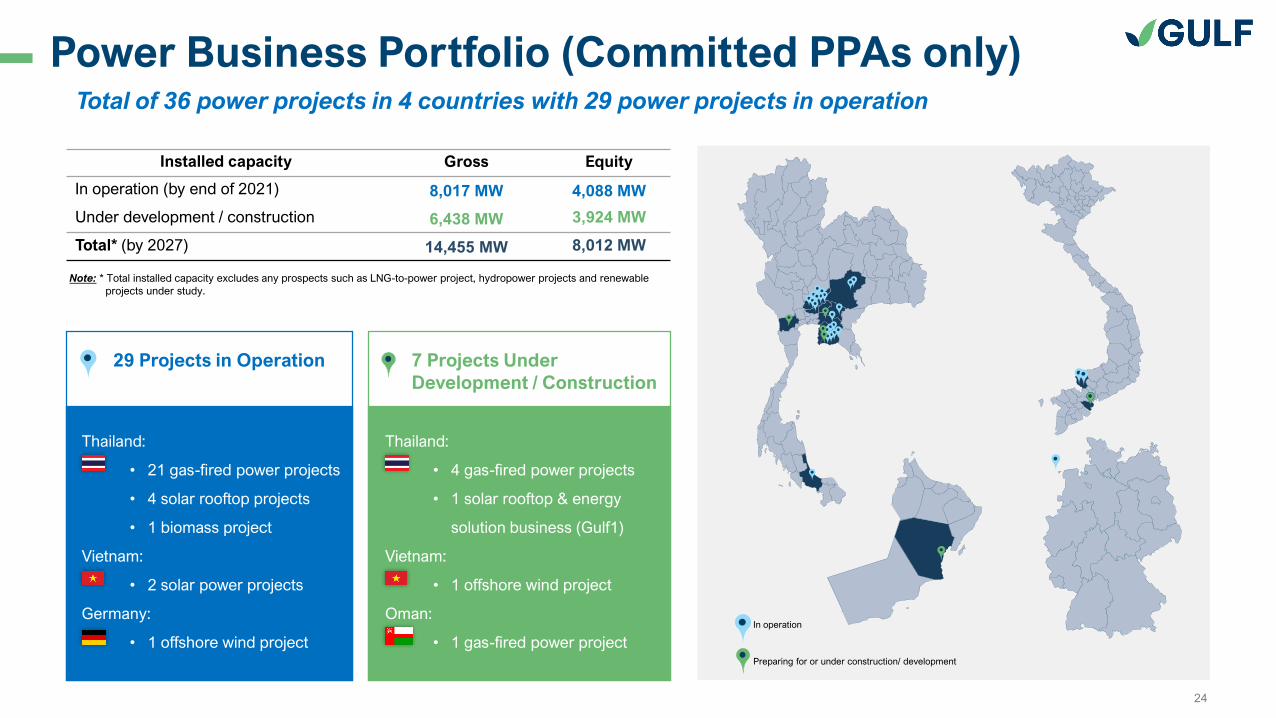
Power Business Portfolio (Committed PPAs only)Total of 36 power projects in 4 countries with 29 power projects in operation
Thailand:
• 4 gas-fired power projects
• 1 solar rooftop & energy
solution business (Gulf1)
Vietnam:
• 1 offshore wind project
Oman:
• 1 gas-fired power project
7 Projects Under
Development / Construction
29 Projects in Operation
Thailand:
• 21 gas-fired power projects
• 4 solar rooftop projects
• 1 biomass project
Vietnam:
• 2 solar power projects
Germany:
• 1 offshore wind project
Installed capacity Gross Equity
In operation (by end of 2021) 8,017 MW 4,088 MW
Under development / construction 6,438 MW 3,924 MW
Total* (by 2027) 14,455 MW 8,012 MW
Note: * Total installed capacity excludes any prospects such as LNG-to-power project, hydropower projects and renewable
projects under study.
Preparing for or under construction/ development
In operation

25
Gas-fired Power Generation - IPP and SPP Structure
6 IPPs (10,861 MW)
• GNS (1,668 MW)
• GUT (1,752 MW)
• GSRC (2,650 MW)
• GPD (2,650 MW)
• HKP (1,540 MW)
• BPP (600 MW)
Electricity Sales to EGAT and Industrial Customers
IPPs and SPPs comprise >90% of GULF’s power business,
generating stable cashflows from EGAT’s PPA structure
IPPs:
✓ 100% sold to EGAT with 25-year PPAs
✓ No minimum take
✓ Receive Availability Payment (AP) regardless of electricity dispatch
✓ AP covers debt service, equity return and fixed O&M
✓ Fuel cost and FX pass-through
SPPs:
✓ 80-85% sold to EGAT with 80% minimum offtake
✓ 15-20% sold to industrial users (IUs) with 50-70% minimum take
✓ 25-year PPAs with EGAT and 15-year Long Term Agreements with IUs
✓ Fuel cost and FX pass-through (EGAT)
✓ Diversified customers across different sectors from 186 IUs
Automotive,
46%
Construction
Material, 8%
Packaging, 9%
Electronics, 8%
Food &
Beverage, 6%
Petchem &
Chemicals, 6%
Textiles, 5%
Others, 13%
87%
13%
6M’21
Industrial Users
GULF’s IPPs & SPPs
19 SPPs (2,474 MW)
• 12 SPPs (1,586 MW)
• 7 SPPs (888 MW)

26
GULF’s Project Details – GJP Group (2 IPPs & 7 SPPs)
Name TypeLocation
(Province)
Equity Interest
(%)
Installed
Power
Capacity (MW)
Steam
(T/H)
Chilled
Water (RT)
Equity Power
Capacity (MW)
Equity
Steam
(T/H)
Equity Chilled
Water (RT)COD
GJP Group (Associate) : In Operation
GNS IPP Saraburi 40.00% 1,668.2 - - 667.3 - -Unit 1: Jun 1, 2014
Unit 2: Dec 1, 2014
GUT IPP Ayutthaya 40.00% 1,752.4 - - 701.0 - -Unit 1: Jun 1, 2015
Unit 2: Dec 1, 2015
GKP1 SPP Saraburi 40.00% 124.3 22.0 - 49.7 8.8 - Jan 5, 2013
GKP2 SPP Saraburi 40.00% 124.3 22.0 - 49.7 8.8 - Feb 1, 2013
GTLC SPP Saraburi 40.00% 125.8 15.0 - 50.3 6.0 - Mar 1, 2013
GNNK SPP Chachoengsao 40.00% 130.0 - 3,200.0 52.0 - 1,280.0 Apr 1, 2013
GNLL SPP Rayong 30.00% 125.3 8.0 4,600.0 37.6 2.4 1,380.0 May 1, 2013
GCRN SPP Pathumthani 40.00% 125.9 15.0 - 50.4 6.0 - Jul 1, 2013
GNK2 SPP Saraburi 40.00% 132.4 10.0 - 53.0 4.0 - Oct 1, 2013
Total GJP 4,308.7 92.0 7,800.0 1,710.9 36.0 2,660.0
Gas-Fired Power Generation Business in Thailand

27
GULF’s Project Details – GMP Group (12 SPPs)
Name TypeLocation
(Province)
Equity Interest
(%)
Installed Power
Capacity (MW)
Steam
(T/H)
Equity Power
Capacity (MW)
Equity Steam
(T/H)COD
GMP Group (Subsidiary) : In Operation
GVTP SPP Rayong 52.49% 140.9 20.0 73.9 10.5 May 16, 2017
GTS1 SPP Rayong 52.49% 138.3 30.0 72.6 15.7 Jul 8, 2017
GTS2 SPP Rayong 52.49% 138.3 30.0 72.6 15.7 Sep 1, 2017
GTS3 SPP Rayong 52.49% 130.2 25.0 68.3 13.1 Nov 1, 2017
GTS4 SPP Rayong 52.49% 130.2 25.0 68.3 13.1 Jan 1, 2018
GNC SPP Prachinburi 70.00% 126.5 20.0 88.5 14.0 Mar 1, 2018
GBL SPP Ayutthaya 52.50% 129.5 10.0 68.0 5.3 Sep 1, 2018
GBP SPP Ayutthaya 52.50% 129.5 10.0 68.0 5.3 Nov 1, 2018
GNLL2 SPP Rayong 52.49% 129.5 10.0 68.0 5.2 Jan 1, 2019
GNPM SPP Saraburi 70.00% 138.3 25.0 96.8 17.5 Mar 1, 2019
GNRV1 SPP Nakorn Ratchasima 70.00% 127.5 10.0 89.2 7.0 May 1, 2019
GNRV2 SPP Nakorn Ratchasima 70.00% 127.5 10.0 89.2 7.0 Jul 1, 2019
Total GMP 1,585.9 225.0 923.4 129.5
Gas-Fired Power Generation Business in Thailand
28
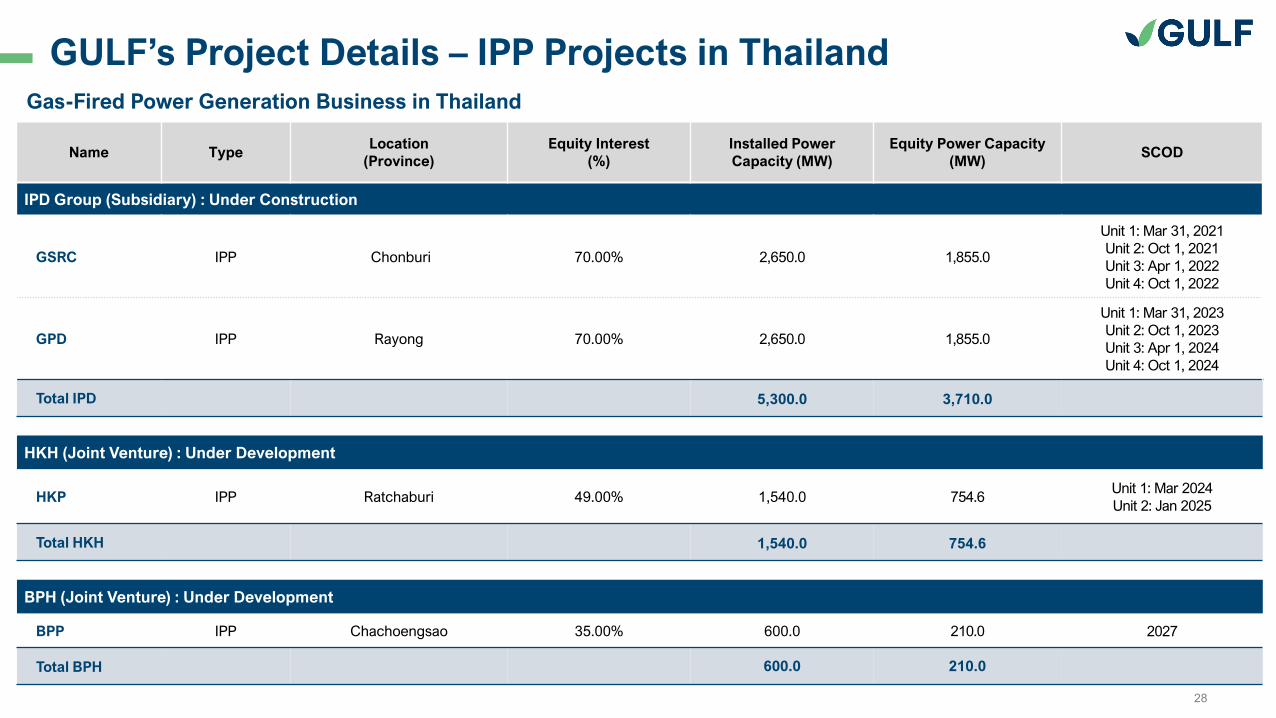
GULF’s Project Details – IPP Projects in Thailand
Name TypeLocation
(Province)
Equity Interest
(%)
Installed Power
Capacity (MW)
Equity Power Capacity
(MW)SCOD
IPD Group (Subsidiary) : Under Construction
GSRC IPP Chonburi 70.00% 2,650.0 1,855.0
Unit 1: Mar 31, 2021
Unit 2: Oct 1, 2021
Unit 3: Apr 1, 2022
Unit 4: Oct 1, 2022
GPD IPP Rayong 70.00% 2,650.0 1,855.0
Unit 1: Mar 31, 2023
Unit 2: Oct 1, 2023
Unit 3: Apr 1, 2024
Unit 4: Oct 1, 2024
Total IPD 5,300.0 3,710.0
HKH (Joint Venture) : Under Development
HKP IPP Ratchaburi 49.00% 1,540.0 754.6Unit 1: Mar 2024
Unit 2: Jan 2025
Total HKH 1,540.0 754.6
BPH (Joint Venture) : Under Development
BPP IPP Chachoengsao 35.00% 600.0 210.0 2027
Total BPH 600.0 210.0
Gas-Fired Power Generation Business in Thailand
29
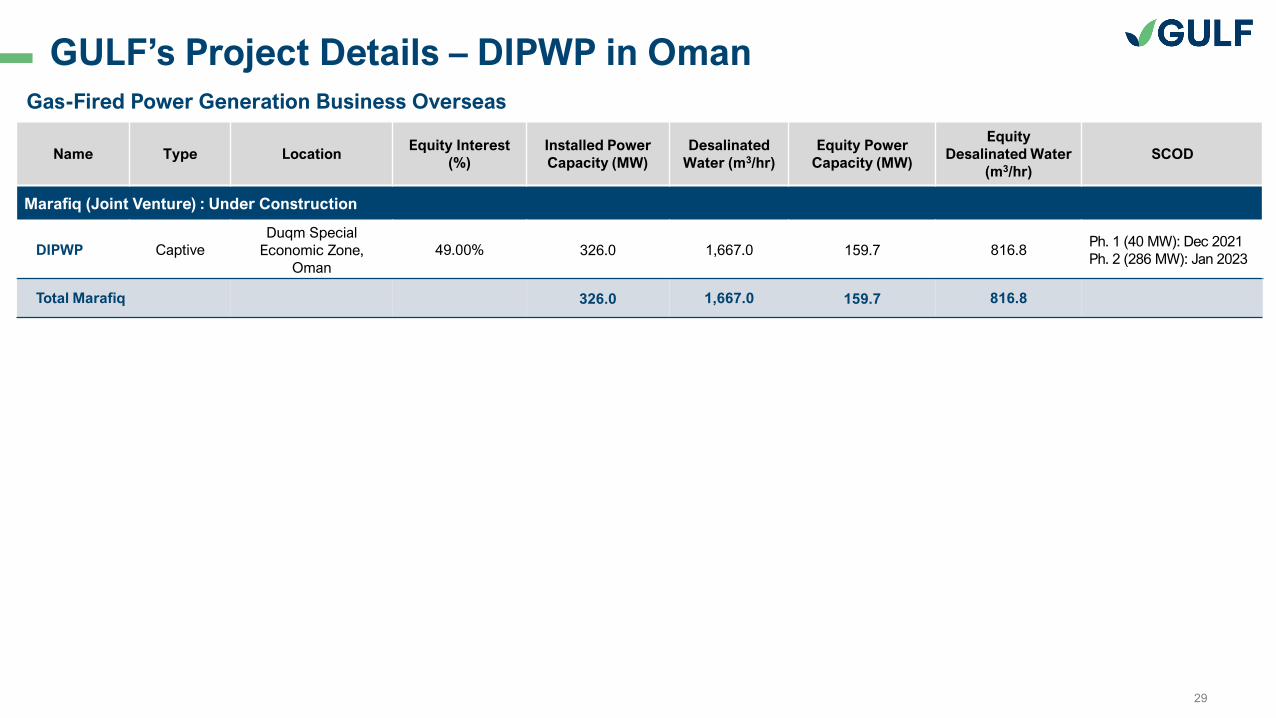
GULF’s Project Details – DIPWP in Oman
Name Type LocationEquity Interest
(%)
Installed Power
Capacity (MW)
Desalinated
Water (m3/hr)
Equity Power
Capacity (MW)
Equity
Desalinated Water
(m3/hr)
SCOD
Marafiq (Joint Venture) : Under Construction
DIPWP Captive
Duqm Special
Economic Zone,
Oman
49.00% 326.0 1,667.0 159.7 816.8Ph. 1 (40 MW): Dec 2021
Ph. 2 (286 MW): Jan 2023
Total Marafiq 326.0 1,667.0 159.7 816.8
Gas-Fired Power Generation Business Overseas

30
GULF’s Project Details – Renewable Projects in Thailand
Name TypeLocation
(Province)
Equity Interest
(%)
Installed Power
Capacity (MW)
Equity Power Capacity
(MW)COD / SCOD
In Operation
Gulf Solar BV Solar Rooftop (VSPP) Chonburi 74.99% 0.13 0.10 Jun 23, 2014
Gulf Solar TS1 Solar Rooftop (VSPP) Rayong 74.99% 0.13 0.09 Aug 27, 2014
Gulf Solar KKS Solar Rooftop (VSPP) Chonburi 74.99% 0.25 0.19 Dec 26, 2014
Gulf Solar TS2 Solar Rooftop (VSPP) Rayong 74.99% 0.09 0.07 Jan 8, 2015
GCG Biomass (SPP) Songkhla 100.00% 25.0 25.0 Mar 1, 2020
Total in Operation 25.60 25.45
Under Construction
Gulf1Solar Rooftop &
Energy Solution- 99.99% 56.8 56.8
20 MW: Q4 2021
36.8 MW: 2022
Total Under Construction 56.8 56.8
Renewable Energy Projects in Thailand under GULF RENEWABLE ENERGY

31
GULF’s Project Details – Renewable Projects Overseas
Name Type LocationEquity Interest
(%)
Installed Power
Capacity (MW)
Equity Power Capacity
(MW)COD / SCOD
In Operation
GTN1 Solar Farm Tay Ninh, Vietnam 90.00% 68.8 61.9 Mar 6, 2019
GTN2 Solar Farm Tay Ninh, Vietnam 90.00% 50.0 45.0 Apr 19, 2019
BKR2 Offshore Wind Farm North Sea, Germany 50.00% 464.8 232.4 Apr 2019
Total in Operation 583.6 339.3
Under Construction
Mekong Wind
Farm (Ph. 1-3)Offshore Wind Farm Ben Tre, Vietnam 95.00% 128.0 121.6
Ph. 1 (30 MW): Q3 2021
Ph. 2 (98 MW): Q4 2021
Total Under Construction 128.0 121.6
Renewable Energy Projects Overseas under GULF RENEWABLE ENERGY
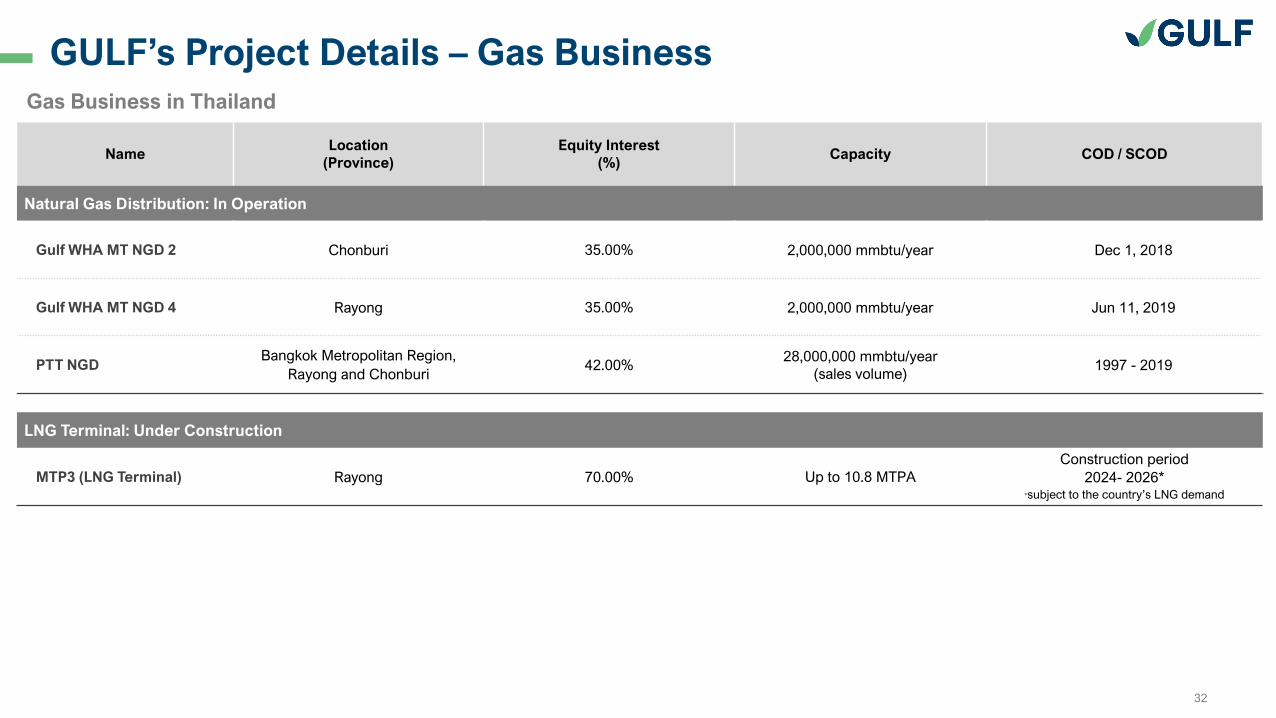
32
GULF’s Project Details – Gas Business
NameLocation
(Province)
Equity Interest
(%)Capacity COD / SCOD
Natural Gas Distribution: In Operation
Gulf WHA MT NGD 2 Chonburi 35.00% 2,000,000 mmbtu/year Dec 1, 2018
Gulf WHA MT NGD 4 Rayong 35.00% 2,000,000 mmbtu/year Jun 11, 2019
PTT NGDBangkok Metropolitan Region,
Rayong and Chonburi42.00%
28,000,000 mmbtu/year
(sales volume)1997 - 2019
LNG Terminal: Under Construction
MTP3 (LNG Terminal) Rayong 70.00% Up to 10.8 MTPA
Construction period
2024- 2026**subject to the country’s LNG demand
Gas Business in Thailand
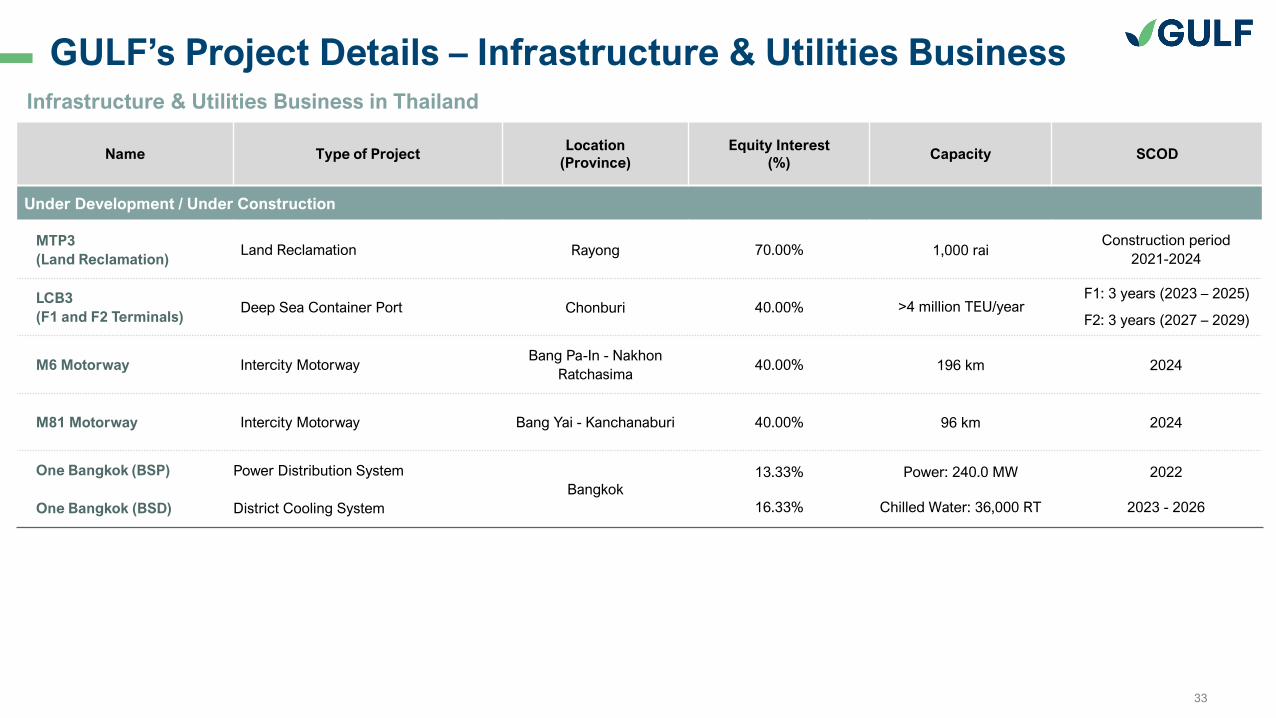
33
GULF’s Project Details – Infrastructure & Utilities Business
Name Type of ProjectLocation
(Province)
Equity Interest
(%)Capacity SCOD
Under Development / Under Construction
MTP3
(Land Reclamation)Land Reclamation Rayong 70.00% 1,000 rai
Construction period
2021-2024
LCB3
(F1 and F2 Terminals)Deep Sea Container Port Chonburi 40.00% >4 million TEU/year
F1: 3 years (2023 – 2025)
F2: 3 years (2027 – 2029)
M6 Motorway Intercity MotorwayBang Pa-In - Nakhon
Ratchasima40.00% 196 km 2024
M81 Motorway Intercity Motorway Bang Yai - Kanchanaburi 40.00% 96 km 2024
One Bangkok (BSP)
One Bangkok (BSD)
Power Distribution System
District Cooling System
Bangkok
13.33%
16.33%
Power: 240.0 MW
Chilled Water: 36,000 RT
2022
2023 - 2026
Infrastructure & Utilities Business in Thailand
34
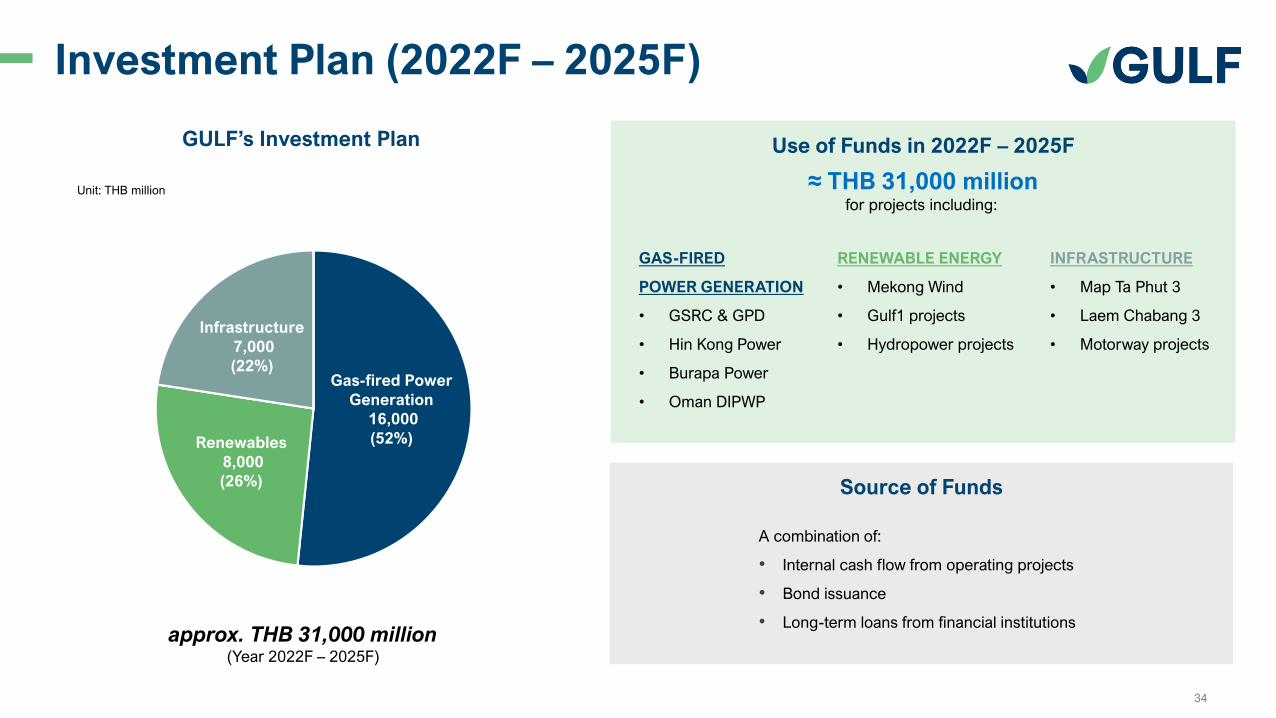
Investment Plan (2022F – 2025F)
Unit: THB million
Gas-fired Power
Generation
16,000
(52%)Renewables
8,000
(26%)
Infrastructure
7,000
(22%)
GULF’s Investment Plan
approx. THB 31,000 million(Year 2022F – 2025F)
A combination of:
• Internal cash flow from operating projects
• Bond issuance
• Long-term loans from financial institutions
Use of Funds in 2022F – 2025F
GAS-FIRED
POWER GENERATION
• GSRC & GPD
• Hin Kong Power
• Burapa Power
• Oman DIPWP
RENEWABLE ENERGY
• Mekong Wind
• Gulf1 projects
• Hydropower projects
≈ THB 31,000 millionfor projects including:
INFRASTRUCTURE
• Map Ta Phut 3
• Laem Chabang 3
• Motorway projects
Source of Funds

This document is for information and reference only and does not constitute or form part of and should not be construed as, an offer to sell
or issue or subscription of, or the solicitation of an offer to buy or acquire any securities of Gulf Energy Development Public Company
Limited (the “Company”) in any jurisdiction or an inducement to enter into investment activity.
The information contained in this document has not been independently verified. No representation, warranty or undertaking, express or
implied, is made as to, and no reliance should be placed on, the fairness, reliability, accuracy, completeness or correctness of the
information or the opinions contained herein. This document should not be regarded by recipients as a substitute for the exercise of their
own judgment. The information contained in this document should be considered in the context of the circumstances prevailing at the time
and has not been, and will not be, updated to reflect developments which may occur after the date of the document. None of the Company
or any of its affiliates, directors, officers, employees, agents, advisors or representatives shall have any liability whatsoever (in negligence or
otherwise) for any damages or loss howsoever arising from any use of this document or its contents or otherwise arising in connection with
the document.
This document contains "forward-looking statements", which include all statements other than statements of historical facts, including,
without limitation, any statements preceded by, followed by or that include the words "targets", "believes", "expects", "aims", "intends",
"will", "may", "anticipates", "would", "could" or similar expressions or the negative thereof. Such forward-looking statements involve known
and unknown risks, uncertainties and other important factors beyond the control of the Company that could cause the actual results,
performance or achievements of the Company to be materially different from future results, performance or achievements expressed or
implied by such forward-looking statements. You are cautioned not to rely on such forward-looking statements. Neither the Company nor
any of its respective affiliates, agents, employees, advisors or representatives intends or has any duty or obligation to supplement, amend,
update or revise any of the forward-looking statements contained in this document.
This document contains data sourced from and the views of independent third parties. In such data being replicated in this document, the
Company does not make any representation, whether express or implied, as to the accuracy of such data. The replication of any views in
this document should be not treated as an indication that the Company agrees with or concurs with such views.
Disclaimer

IR ContactGulf Energy Development Public Company Limited
Investor Relations Department
87 M.Thai Tower 11th Floor, All Seasons Place, Wireless Road,
Lumpini, Pathumwan, Bangkok 10330, Thailand
Tel: +66(0) 2080 4488
Fax: +66(0) 2080 4455
Email: [email protected]
Website: www.gulf.co.th